Page 1
WBA Research
2191 Defense Highway • Suite 401 • Crofton, MD 21114 • (410)-721-0500 • www.WBAresearch.com
0
2017 Paratransit Customer Satisfaction Study
Access-A-Ride
Final Report
Prepared for:
Prepared by:
Date: February 2018
Page 2
WBA Research
2191 Defense Highway • Suite 401 • Crofton, MD 21114 • (410)-721-0500 • www.WBAresearch.com
1
Table of Contents
Page #
Headlines ............................................................................................................................................................................. 3
Background & Objectives .................................................................................................................................................... 6
Methodology ........................................................................................................................................................................ 7
Key Findings ........................................................................................................................................................................ 9
Supporting Tables.............................................................................................................................................................. 15
Summary Tables................................................................................................................................................................ 25
Overall Satisfaction with Access-A-Ride ...................................................................................................................... 26
Aspects in Need of Improvement ................................................................................................................................. 28
Perceptions of Access-A-Ride as a Good Value .......................................................................................................... 29
Overall Satisfaction with Last Access-A-Ride Trip ........................................................................................................ 30
Satisfaction with Specific Aspects of Access-A-Ride .................................................................................................... 32
Frequency of On-Time Pickup ...................................................................................................................................... 36
Perceptions of Changes in Overall Service .................................................................................................................. 39
Perceptions of Changes in Access-A-Ride Reservation Service .................................................................................. 41
Reasons for Changes in Access-A-Ride Reservation Service ..................................................................................... 42
Overview of Performance of Key Elements of Last Trip ............................................................................................... 43
Ever Called to Ask a Question or Report a Problem .................................................................................................... 44
Level of Satisfaction with Results of Last Call .............................................................................................................. 45
Expected Future Use of Access-A-Ride ....................................................................................................................... 46
Interest in Access-A-Ride MetroCard Trips .................................................................................................................. 47
Approval/Usage of Specific Vehicles ............................................................................................................................ 48
Concerns with Accessible Taxi Providing Access-A-Ride Trip ..................................................................................... 49
Recertification and Assessment Centers ...................................................................................................................... 50
Access to Mobile Phone When Using Access-A-Ride .................................................................................................. 51
Page 3
WBA Research
2191 Defense Highway • Suite 401 • Crofton, MD 21114 • (410)-721-0500 • www.WBAresearch.com
2
Table of Contents (continued)
Page #
Accessibility to Other Transportation During Weather Emergency ............................................................................... 52
Calling Access-A-Ride and Selecting Option 8 ............................................................................................................ 53
Calling Access-A-Ride and Selecting Option 7 ............................................................................................................ 54
Rider Profile ....................................................................................................................................................................... 55
Appendix
History Tables
Methodology Charts
Questionnaire
Page 4
WBA Research
2191 Defense Highway • Suite 401 • Crofton, MD 21114 • (410)-721-0500 • www.WBAresearch.com
3
Headlines
• In 2017, overall satisfaction with Access-A-Ride increased from 2016, with roughly three in four frequent and occasional customers (74%) saying they are very or somewhat satisfied with the service overall (up from 65% in 2016).
This follows a decreasing trend in overall satisfaction, since matching an all time high of 80% in 2012.
Ratings in 2017 increased from 2016 findings among residents of three of the five boroughs – Bronx (73%, up from 62%), Queens (76%, up from 67%), and Brooklyn (75%, up from 63%). – page 59
• In 2017, the number of Access-A-Ride trips completed was 6,170,876, a decrease of 4% from the prior year. – page 16
• More than three in ten frequent and occasional customers mentioned that the overall Access-A-Ride service has improved in the past year (36%, up from 29% in 2016), while about four in ten mentioned that the service stayed about the same (39%, consistent with 2016).
• The proportion who say Access-A-Ride service has gotten worse is now at 19%, down from 29% in 2016. – page 19
• Nine in ten frequent and occasional customers (91%) said Access-A-Ride is a good value for the money, up from 89% in 2016, discontinuing the downward trend that began in 2013. – page 62
• A key strength for Access-A-Ride is the reservation service, with attributes relating to the reservations process receiving highratings overall.
Frequent users were asked to rate several aspects of the reservation process in general, and many of these attributes continue to see high ratings similar to past results. Specifically:
➢ The courtesy of the reservations staff (92%);
➢ How long it takes for them to confirm the reservation (92%);
➢ Being able to get through to make a reservation (91%);
➢ The competence of the reservations staff (90%);
➢ The ability to get a ride for the day or time requested (87%, up from 83% in 2016); and
➢ How far in advance they need to call to make a reservation (84%). – page 20
Page 5
WBA Research
2191 Defense Highway • Suite 401 • Crofton, MD 21114 • (410)-721-0500 • www.WBAresearch.com
4
Headlines (continued)
• On-time performance drives overall satisfaction, an area where Access-A-Ride has shown improvement.
Frequent users were asked to rate several aspects regarding pick ups and trip experience. Several of these attributes saw significant increases from 2016. Specifically:
➢ Being picked up no later than 30 minutes after the scheduled pick-up time (69%, up from 60%);
➢ The drivers driving carefully and safely (92%, up from 88%);
➢ The drivers knowing how to get where they are going (83%, up from 78%); and
➢ Length of trips (75%, up from 66%). – page 20
• When asked to provide which area of service is most in need of improvement, more than one in four (27%) suggested on-time performance, more than any other aspect of service. – page 26
• Among frequent and occasional users, one-half (50%) noted that Access-A-Ride usually picks them up on time. This is the first time since 2013 that at least one-half of users have reported usually being picked up on time.
In contrast, four in ten frequent and occasional customers (39%) said that Access-A-Ride sometimes picks them up on time, down from 44% in 2016.
• Satisfied customers are more likely to give positive ratings for how often they are picked up on time. Specifically, about six in ten frequent and occasional customers who are satisfied (59%, up from 48% in 2016) said that Access-A-Ride usually picks them up on time, compared to one in four dissatisfied frequent and occasional customers (25%).
Furthermore, less than one in twenty satisfied frequent and occasional customers (4%) said Access-A-Ride rarely or never picks them up within the standard for on time pick-up, compared to nearly two in ten dissatisfied frequent and occasional users (17%). – page 34
Page 6
WBA Research
2191 Defense Highway • Suite 401 • Crofton, MD 21114 • (410)-721-0500 • www.WBAresearch.com
5
Results of New Questions
New questions added in 2017 focused on mobile phone availability and customers’ experiences when calling Access-A-Ride to give a
commendation or make a complaint.
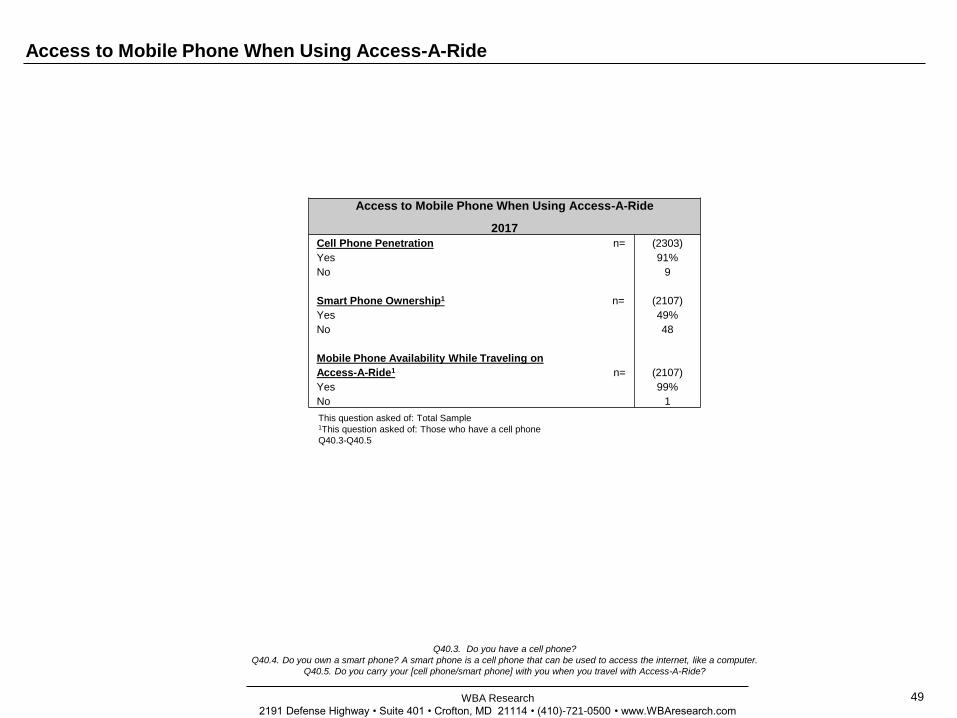
• More than nine in ten Access-A-Ride customers (91%) own a cell phone, with nearly half of those (49%) using a smart phone.
Nearly all customers who have a mobile phone (99%) carry it with them when traveling with Access-A-Ride. – page 49
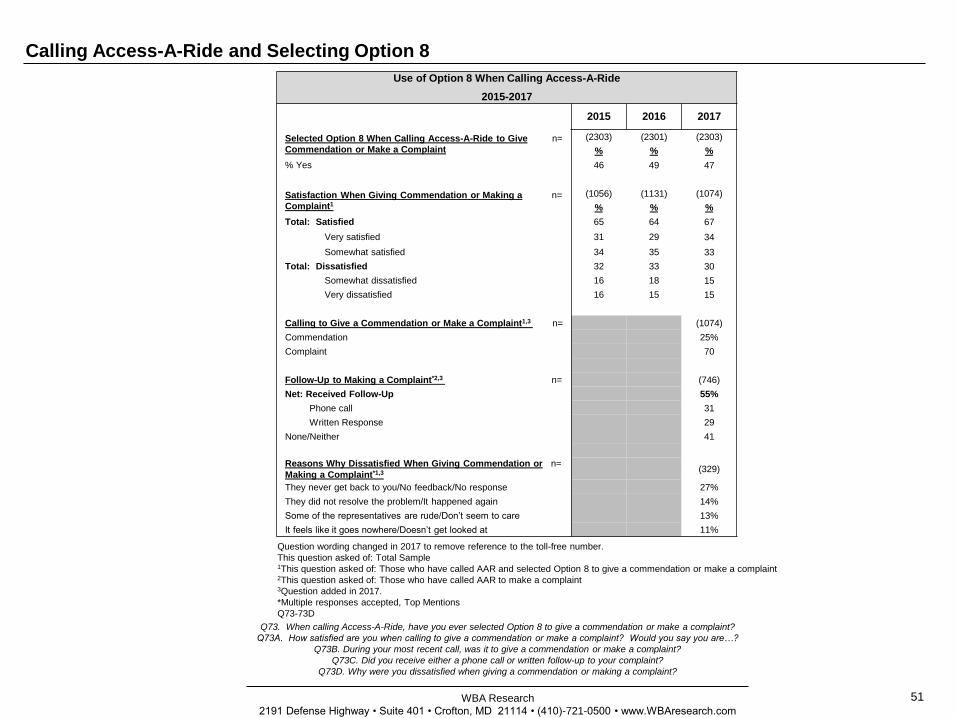
• Of customers who call Access-A-Ride to give a commendation or make a complaint, seven in ten (70%) do so to make a
complaint, while one in four (25%) call to give a commendation.
About four in ten customers who call to make a complaint (41%) do not receive a phone call or written follow-up response.
Those who are dissatisfied with the experience of calling Access-A-Ride to give a commendation or make a complaint
most often noted their dissatisfaction is due to not receiving feedback or a response (27%), the problem not being resolved
(14%), rude representatives (13%), and/or the commendation or complaint is not reviewed (11%). – page 51
• About four in ten (39%) said they would be interested in receiving a MetroCard by calling Access-A-Ride and selecting option “1”
to request one. – page 45
Headlines (continued)
Page 7
WBA Research
2191 Defense Highway • Suite 401 • Crofton, MD 21114 • (410)-721-0500 • www.WBAresearch.com
6
Background & Objectives
In 1990, the Federal Americans with Disabilities Act (ADA) established standards for public services and buildings to include
transportation systems such as Metropolitan Transportation Authority (MTA)’s New York City Transit (NYC Transit). Therefore, NYC
Transit developed Access-A-Ride (AAR) Paratransit services to provide service to ADA eligible citizens in the five boroughs, and up to
three-quarter miles in adjacent Nassau and Westchester counties, who are unable to ride the bus or subway system provided. AAR
provides shared ride, door-to-door service with limited assistance getting on and off the vehicle. The fare for this ride is the same fare
that would be incurred for a standard public transportation ride. If more assistance is required, the individual may ride with a personal
care attendant who rides free of charge.
Since 1996, New York City Transit has engaged a research consultant to conduct quantitative research to obtain customer ratings of
the service and determine ways in which AAR could be improved. These yearly surveys allow the Paratransit program to track
customer opinions and identify problem areas. This study was last conducted in 2016.
What follows are the results from the 2017 wave of this research.
Page 8
WBA Research
2191 Defense Highway • Suite 401 • Crofton, MD 21114 • (410)-721-0500 • www.WBAresearch.com
7
Methodology
In order to meet the research objectives, telephone interviews were conducted among registered riders of Access-A-Ride. Interviews
were conducted between October 23, 2017 and December 3, 2017 by professional WBA interviewers from WBA’s telephone facilities
located in Crofton, Maryland and by WBA’s MBE/WBE partners, Medina Marketing Services and Survey Service, Inc.
In order to qualify for the study, respondents had to currently live in one of the five boroughs of New York City. If respondents were
unable to participate in the survey due to a physical or other condition, their personal caregiver or care attendant (when available) was
interviewed.
Interviews were conducted among three types of user segments: Frequent Users, Occasional Users and Infrequent Users. These
groups are defined by the frequency of AAR ride requests made between July and September 2017. – page 70
Among those contacted, nine in ten (89%) qualified for the study. Interviews averaged about 25 minutes in length.
Using sampling techniques, we can estimate the responses of an entire population without having to interview everyone in the target
group. There are mathematical means to measure how close our random-sample estimate comes to the 'true' value of the population.
For the 2,303 interviews conducted for the Customer Satisfaction survey, we can expect the values from our sample to be within 2
percentage points of the true population value, 95 percent of the time. That means, if we get a value of 50 percent from our sample, we
can be 95 percent sure that the population value is somewhere between 48 and 52 percent. This measure of the difference of the
sample value from the true value, called the 'margin of error‘, will vary with the size of the sample and the results received. A chart
detailing the margin of error is in the appendix, on page 69.
July – September 2017
AAR User Segment # of Interviews Frequency of Ride Requests % of Registrants % of Requests
Frequent Users 1378 25+ requests July-September 5% 76%
Occasional Users 625 7-24 requests July-September 12% 18%
Infrequent Users 300 1-6 requests July-September 24% 6%
Total 2303
Page 9
WBA Research
2191 Defense Highway • Suite 401 • Crofton, MD 21114 • (410)-721-0500 • www.WBAresearch.com
8
Methodology (continued)
When reading the charts in this report, note that some charts may not equal 100% due to rounding. Within the charts and graphs of the
supporting tables comparing each year’s data, arrows and boldface numbers are used to show where statistical differences exist at the
95% confidence level. Up arrows (h) indicate when there was a statistical increase in 2017 versus 2016, while down arrows (i) show a
statistical decrease. When comparing boroughs and years, bold/italicized numbers indicate where a piece of data is statistically higher
for one borough compared to another, with a footnote at the bottom of the chart detailing the statistical difference.
It is important to note that there was not a customer satisfaction survey conducted in 2002, 2009, or 2010.
The following are demographic characteristics of the 2017 AAR Customer Satisfaction respondents, which are consistent with previous
years:
• Average age is 66 years old;
• 88% are not employed; and
• 80% use a support device when they travel. – pages 55-56
Charts are also included in the Appendix showing the user segments surveyed by borough and the weights that were applied to this
year’s data.
Page 10
WBA Research
2191 Defense Highway • Suite 401 • Crofton, MD 21114 • (410)-721-0500 • www.WBAresearch.com
9
Key Findings
Overall Satisfaction
After three consecutive years of decline, overall satisfaction with Access-A-Ride is again increasing, with 74% of customers being
very or somewhat satisfied with the service in 2017 (up from 65% in 2016 and 67% in 2015).
• This increase in satisfaction can also be seen among residents in three of the five boroughs – Bronx (74%, up from 63%),
Manhattan (69%, from 67%), Queens (75%, up from 67%), Brooklyn (74%, up from 63%), and Staten Island (70%, from 72%). –
page 19
Nine in ten customers (91%) noted that Access-A-Ride is a good value for the money. This is consistent with 2016 findings and
represents a very high proportion of customers recognizing the value of the program. – page 18
Perception of Past Year Service
Overall in 2017, more than three in ten frequent and occasional users (36%) indicated that service has improved over the past year,
an increase from 29% in 2016.
• 2017 saw notable increases among residents of the Bronx (36%, up from 25%), Manhattan (35%, up from 26%) and Brooklyn
(37%, up from 29%) when compared to 2016 figures.
The proportion of customers indicating that service has gotten worse in the past year has decreased from 2016 findings, with about
two in ten frequent and occasional users (19%, down from 29%) responding as such.
• Similar to the shift in “improved” ratings, the proportion of participants saying service has gotten worse saw a notable decrease
in 2017 compared to 2016 among residents of the Bronx (18%, down from 34%), Manhattan (18%, down from 30%), Queens
(18%, down from 27%), and Brooklyn (20%, down from 29%). – page 61
Page 11
WBA Research
2191 Defense Highway • Suite 401 • Crofton, MD 21114 • (410)-721-0500 • www.WBAresearch.com
10
Key Findings (continued)
Service Attributes
Among frequent users, satisfaction with many reservation service attributes continue to perform well in 2017, with roughly nine in ten
being satisfied with all of the following:
• The courtesy of the reservations staff (92%);
• How long it takes for them to confirm the reservation (92%);
• Being able to get through to make a reservation (91%);
• The competence of the reservations staff (90%); and
• The ability to get a ride for the day or time you request it (87%, up from 83 in 2016%).
Being picked up no later than 30 minutes after the scheduled pick-up time continues to be an area in need of improvement, though
satisfaction is up from 2016. Among frequent users, nearly seven in ten (69%, up from 60%) are satisfied on this measure.
For service attributes related to the trip experience, frequent riders continued to provide high satisfaction ratings for attributes related
to the driver, with more than eight in ten being very or somewhat satisfied with each of the following in 2017:
• The drivers driving carefully and safely (92%, up from 88% in 2016);
• The courtesy of the drivers (89%);
• The drivers knowing how to get where they are going (83%, up from 78% in 2016).
The length of the trips continues to receive the lowest ratings of all service attributes related to trip experience; however, three in four
(75%) are now satisfied with the length of their trips, in general, ending the downward trend from 2014. – page 20
Page 12
WBA Research
2191 Defense Highway • Suite 401 • Crofton, MD 21114 • (410)-721-0500 • www.WBAresearch.com
11
Key Findings (continued)
Access-A-Ride MetroCard
As the implementation and integration of the Access-A-Ride MetroCard program continues, questions related to the program that were added in the 2013 fielding of this study continued to be asked.
• Overall, more than six in ten Access-A-Ride customers (61%) are aware of the Access-A-Ride MetroCard Program, up from 52% in 2016.
Of those who are aware of the program, more than six in ten (65%) have received their Access-A-Ride MetroCard, down from 74% in 2016.
• Among those who have not received their Access-A-Ride MetroCard, almost four in ten (39%) said they would be interested in receiving a MetroCard by calling Access-A-Ride and selecting option “1” to request one. – page 45
On-Time Performance
A key area in need of improvement is on-time performance. In fact, customers most often mentioned on-time performance as the one
aspect of Access-A-Ride that is most in need of improvement (27%). – page 26
Similarly, one-half of frequent and occasional users (50%) said that Access-A-Ride usually picks them up within the standard for on-
time pickup, up from 39% in 2016.
• Similarly, two in five frequent and occasional customers (39%) noted that Access-A-Ride sometimes picks them up within the
standard for on-time pick up, down from 44% in 2016. About one in twelve customers (8%) said that Access-A-Ride picks rarely
or never picks them up on time, down from 15% in 2016.
• On-time pickup appears to be strongly associated with overall satisfaction, as only one in four dissatisfied frequent and
occasional users (25%) said that they are usually picked up within the standard for on-time pickup, while about six in ten
satisfied frequent and occasional users (59%) say they are usually picked up on-time, up from 48% in 2016. Furthermore, two in
ten dissatisfied users (17%) noted that Access-A-Ride rarely or never picks them up on time, while less than one in twenty (4%)
satisfied customers said the same. – page 34
Page 13
WBA Research
2191 Defense Highway • Suite 401 • Crofton, MD 21114 • (410)-721-0500 • www.WBAresearch.com
12
Key Findings (continued)
Option 7 and Option 8 When Calling Access-A-Ride
• Regarding Option 8, which gives customers the ability to give a commendation or make a complaint, nearly one-half of
customers (47%) have used this feature when calling Access-A-Ride.
Among these customers, about two in three (67%) are very or somewhat satisfied with the process. However, 70% of
those who have called, did so to make a complaint. – page 51
• Regarding Option 7, which gives customers the ability to check the status of a trip or cancel a trip, almost one-half of
customers (48%) have used this feature when calling Access-A-Ride. Among those who have used Option 7:
➢ 82% are satisfied with the feature when getting the status of a trip;
➢ 77% are satisfied with the feature when cancelling trips; and
➢ 74% are satisfied when reviewing upcoming trips.
Customers who have used Option 7 were asked what comments or concerns, if any, they have regarding the feature.
Many customers had positive comments, most commonly that they are very satisfied, like it, and have had no problems
(16%).
➢ However, a very small minority of customers had negative comments, including that they don’t like talking to a
machine or prefer a live person (5%), and/or that it sometimes doesn’t record the ID or birthdate correctly (5%). –
page 52
Page 14
WBA Research
2191 Defense Highway • Suite 401 • Crofton, MD 21114 • (410)-721-0500 • www.WBAresearch.com
13
Supporting Tables
When reading the charts in this section, note that some totals may not equal 100% due to rounding.
Within the charts and graphs of the supporting tables comparing each year’s data, boldface numbers
and arrows denote statistical differences at the 95% confidence level. Up arrows (h) indicate a
statistical increase in 2017 versus 2016, while down arrows (i) show a statistical decrease. Some
tables compare both results across boroughs in 2017 as well as data across years. For those tables
with both borough and annual comparisons, bold/italicized numbers indicate where a piece of data is
statistically higher for one borough compared to another, with a footnote at the bottom of the chart
detailing the statistical difference.
Page 15
WBA Research
2191 Defense Highway • Suite 401 • Crofton, MD 21114 • (410)-721-0500 • www.WBAresearch.com
14
Supporting Tables
Q4. Now please tell me how satisfied you are with Access-A-Ride, overall. Would you say you are…?
Overall Satisfaction with Access-A-Ride
Among Frequent/Occasional Users
2015-2017
Year
2015 2016 2017
n = (2003) (2001) (2003)
% % %
Total: Satisfied 66 65 74h
Very satisfied 25 22 29h
Somewhat satisfied 42 43 45
Total: Dissatisfied 30 32 23i
Somewhat dissatisfied 21 20 17i
Very dissatisfied 9 12 7i
Overall Satisfaction with Access-A-Ride
Among Infrequent Users
2015-2017
Year
2015 2016 2017
n = (300) (300) (300)
% % %
Total: Satisfied 75 67 71
Very satisfied 35 31 33
Somewhat satisfied 40 37 38
Total: Dissatisfied 22 29 27
Somewhat dissatisfied 14 21 18
Very dissatisfied 9 8 9
This question asked of: Infrequent Users
Q4
Overall Satisfaction with Access-A-Ride
Among All Users
2015-2017
Year
2015 2016 2017
n = (2303) (2301) (2303)
% % %
Total: Satisfied 67 65 74h
Very satisfied 26 23 30h
Somewhat satisfied 42 42 44
Total: Dissatisfied 29 32 24i
Somewhat dissatisfied 20 21 17i
Very dissatisfied 9 12 7i
This question asked of: Total Sample
Q4
This question asked of: Frequent/Occasional Users
Q4
Page 16
WBA Research
2191 Defense Highway • Suite 401 • Crofton, MD 21114 • (410)-721-0500 • www.WBAresearch.com
15
Supporting Tables (continued)
Q4. Now please tell me how satisfied you are with Access-A-Ride, overall. Would you say you are…?
This question asked of: Frequent/Occasional Users
• Bronx Very dissatisfied is significantly higher than Queens Very dissatisfied.
Q4
Overall Satisfaction with Access-A-Ride Service
By Borough of Residence
Among Frequent/Occasional Users
2017Borough
Bronx Manhattan Queens Brooklyn
Staten
Island
n= (425) (434) (428) (416) (300)
% % % % %
Total: Satisfied 73 71 76 75 72
Very satisfied 30 25 29 30 30
Somewhat satisfied 43 46 47 45 41
Total: Dissatisfied 26 26 21 22 26
Somewhat dissatisfied 16 20 15 16 19
Very dissatisfied 9 7 6 6 7
Page 17
WBA Research
2191 Defense Highway • Suite 401 • Crofton, MD 21114 • (410)-721-0500 • www.WBAresearch.com
16
Supporting Tables (continued)
Overall Satisfaction
Trip Requests and Trips Completed
2015-2017
Year Change
from
’16-’172015 2016 2017
Trip Requests7,812,524 7,837,614 7,837,126 <1%
Trips Completed6,360,165 6,395,430 6,170,876 -4%
Overall Satisfaction 67% 65% 74% +7 points
This question asked of: Total Sample
Page 18
WBA Research
2191 Defense Highway • Suite 401 • Crofton, MD 21114 • (410)-721-0500 • www.WBAresearch.com
17
Supporting Tables (continued)
This question asked of: Total Sample
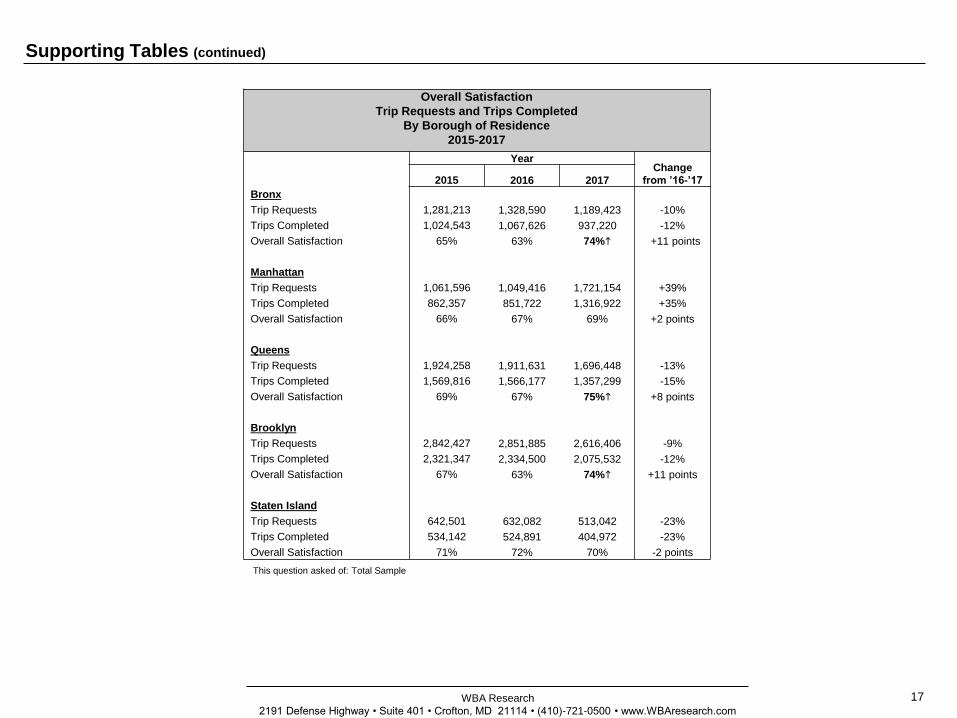
Overall Satisfaction
Trip Requests and Trips Completed
By Borough of Residence
2015-2017
YearChange
from ’16-’17 2015 2016 2017
Bronx
Trip Requests 1,281,213 1,328,590 1,189,423 -10%
Trips Completed 1,024,543 1,067,626 937,220 -12%
Overall Satisfaction 65% 63% 74%h +11 points
Manhattan
Trip Requests 1,061,596 1,049,416 1,721,154 +39%
Trips Completed 862,357 851,722 1,316,922 +35%
Overall Satisfaction 66% 67% 69% +2 points
Queens
Trip Requests 1,924,258 1,911,631 1,696,448 -13%
Trips Completed 1,569,816 1,566,177 1,357,299 -15%
Overall Satisfaction 69% 67% 75%h +8 points
Brooklyn
Trip Requests 2,842,427 2,851,885 2,616,406 -9%
Trips Completed 2,321,347 2,334,500 2,075,532 -12%
Overall Satisfaction 67% 63% 74%h +11 points
Staten Island
Trip Requests 642,501 632,082 513,042 -23%
Trips Completed 534,142 524,891 404,972 -23%
Overall Satisfaction 71% 72% 70% -2 points
Page 19
WBA Research
2191 Defense Highway • Suite 401 • Crofton, MD 21114 • (410)-721-0500 • www.WBAresearch.com
18
Supporting Tables (continued)
This question asked of: Total Sample
Q7
Q7. Considering the fare and the service provided by Access-A-Ride, would you say it is…?
Access-A-Ride is a “Good Value for the Money”
2015-2017
Year
2015 2016 2017
n= (2303) (2301) (2303)
% % %
% Yes 89 89 91
Page 20
WBA Research
2191 Defense Highway • Suite 401 • Crofton, MD 21114 • (410)-721-0500 • www.WBAresearch.com
19
Supporting Tables (continued)
This question asked of: Frequent/Occasional Users
Q3
Q3. Would you say that during the past year, overall, Access-A-Ride service has…?
This question asked of: Infrequent Users
Q3
This question asked of: Total Sample
Q3
Overall Access-A-Ride Service
Among Frequent/Occasional Users
2015-2017
Year
2015 2016 2017
n= (2003) (2001) (2003)
% % %
Improved 31 29 36h
Stayed the same 37 39 39
Gotten worse 27 29 19i
Overall Access-A-Ride Service
Among Infrequent Users
2015-2017
Year
2015 2016 2017
n= (300) (300) (300)
% % %
Improved 24 27 31
Stayed the same 46 44 42
Gotten worse 15 19 15
Overall Access-A-Ride Service
Among All Users
2015-2017
Year
2015 2016 2017
n= (2303) (2301) (2303)
% % %
Improved 30 28 36h
Stayed the same 38 39 39
Gotten worse 25 28 19i
Page 21
WBA Research
2191 Defense Highway • Suite 401 • Crofton, MD 21114 • (410)-721-0500 • www.WBAresearch.com
20
Supporting Tables (continued)
This question asked of: Frequent Users
Q42a-e, 43a, 44a-f
Q42-44. Now thinking about your experience with Access-A-Ride in the past 3-4 months, I’d like you to tell me how satisfied you are with
some specific aspects of Access-A-Ride service. For each aspect I mention, please tell me whether you are “very satisfied,”
“somewhat satisfied,” “somewhat dissatisfied” or “very dissatisfied.”
Satisfaction with Specific Aspects of Access-A-Ride Service
% Very or Somewhat Satisfied
Among Frequent Users
2015-2017Year
2015 2016 2017
Making Trip Reservations n= (1378) (1375) (1378)
% % %
The courtesy of the reservations staff 94 90 92
How long it takes for them to confirm the reservation 91 92 92
Being able to get through to make a reservation 93 93 91
The competence of the reservations staff 92 89 90
The ability to get a ride for the day or time you
request it87 83 87↑
How far in advance you need to call to make reservations 85 84 84
Pickups n= (1378) (1375) (1378)
% % %
Being picked up no later than 30 minutes after the
scheduled pick-up time60 60 69↑
Trip Experience n= (1378) (1375) (1378)
% % %
The drivers driving carefully and safely 89 88 92↑
Courtesy of the drivers 88 88 89
The drivers knowing how to get where they are going 80 78 83↑
Length of the trips 69 66 75↑
Page 22
WBA Research
2191 Defense Highway • Suite 401 • Crofton, MD 21114 • (410)-721-0500 • www.WBAresearch.com
65%h
29%h
55%
22%
57%
25%
20%i
45%
27%
43%
24%
42%
7%
17%i
8%
20%
8%
21%
6%i
7%i
8%
12%
8%
9%
Last trip-2017
Overall-2017
Last trip-2016
Overall-2016
Last trip-2015
Overall-2015
Very satisfied Somewhat satisfied Somewhat dissatsfied Very dissatsfied Don't know/Refused
81%
21
Supporting Tables (continued)
This question asked of:
Frequent/Occasional Users
(n=2003)
•2017 Overall Very
dissatisfied is significantly
lower than 2016.
•2017 Overall Dissatisfied is
significantly lower than
2016.
•2017 Overall Very satisfied
is significantly higher than
2016.
•2017 Overall Net: Satisfied
is significantly higher than
2016.
•2017 Last Trip Very
dissatisfied is significantly
higher than 2016.
•2017 Last Trip Somewhat
satisfied is significantly
higher than 2016
•2017 Last Trip Very
satisfied is significantly
higher than 2016.
•2017 Last Trip Don’t know/
Refused is significantly
higher than 2016.
Q4, 38
Satisfaction Overall vs. Last Trip
Among Frequent/Occasional Users
2015-2017
This question asked of: Frequent/Occasional Users
Q4, 38
Q4. Now please tell me how satisfied you are with Access-A-Ride, overall. Would you say you are…?
Q38. Overall, how satisfied were you with the trip we just discussed? Would you say you were…?
Net:
Satisfied
66%
83%
65% 2%
Satisfaction Overall vs. Last Trip
Very/Somewhat Satisfied
Among Frequent/Occasional Users
2015-2017
Year
2015 2016 2017
n = (2003) (2001) (2003)
% % %
Access-A-Ride Overall 66 65 74h
Last Access-A-Ride Trip 81 83 85
Difference Trip Overall 15 points 18 points 11 points
3%
3%
1%
3%
2%h
74%h
85%
Page 23
WBA Research
2191 Defense Highway • Suite 401 • Crofton, MD 21114 • (410)-721-0500 • www.WBAresearch.com
22
Supporting Tables (continued)
This question asked of: Frequent/Occasional Users.
Q50B
Q50B. In the next year or so would you expect to use Access-A-Ride, including vans, taxi rides and (broker car/voucher) service…?
Expected Future Usage of Access-A-Ride
Among Frequent/Occasional Users
2015-2017Frequent Occasional
2015 2016 2017 2015 2016 2017
n= (1378) (1375) (1378) (625) (626) (625)
% % % % % %
More often 16 15 21h 17 19 24h
Less often 1 2 2 2 3 1
About the same 47 46 45 39 39 37
Not sure/Don’t know/Refused 36 37 32i 42 40 37
Page 24
WBA Research
2191 Defense Highway • Suite 401 • Crofton, MD 21114 • (410)-721-0500 • www.WBAresearch.com
23
Summary Tables
When reading the charts in this section, note that some charts may not equal 100% due to rounding.
Page 25
WBA Research
2191 Defense Highway • Suite 401 • Crofton, MD 21114 • (410)-721-0500 • www.WBAresearch.com
24
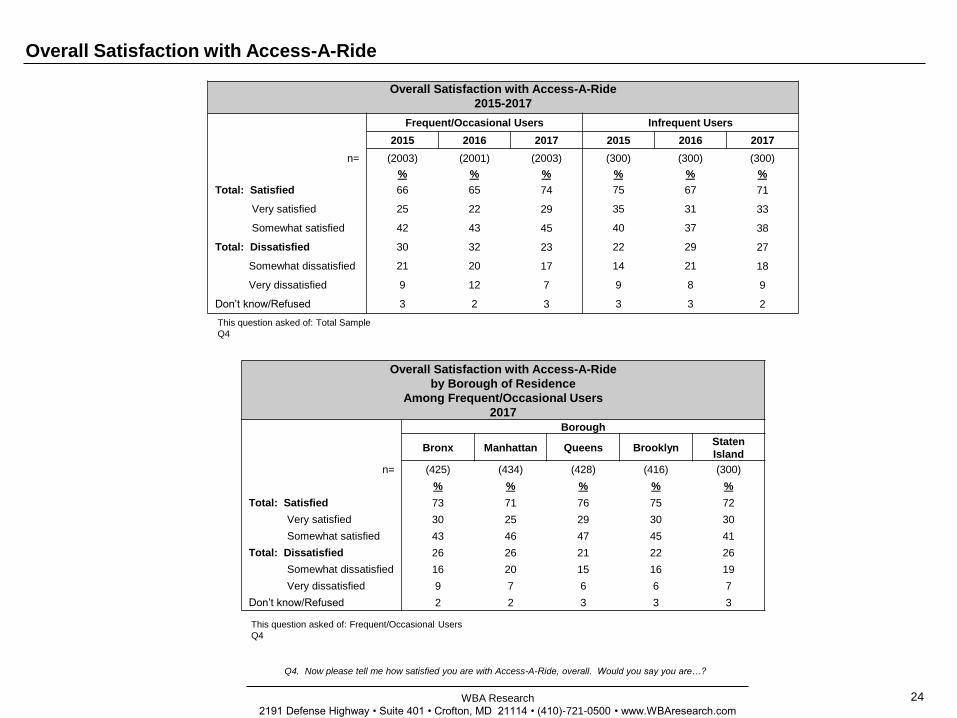
Overall Satisfaction with Access-A-Ride
This question asked of: Total Sample
Q4
This question asked of: Frequent/Occasional Users
Q4
Q4. Now please tell me how satisfied you are with Access-A-Ride, overall. Would you say you are…?
Overall Satisfaction with Access-A-Ride
2015-2017
Frequent/Occasional Users Infrequent Users
2015 2016 2017 2015 2016 2017
n= (2003) (2001) (2003) (300) (300) (300)
% % % % % %
Total: Satisfied 66 65 74 75 67 71
Very satisfied 25 22 29 35 31 33
Somewhat satisfied 42 43 45 40 37 38
Total: Dissatisfied 30 32 23 22 29 27
Somewhat dissatisfied 21 20 17 14 21 18
Very dissatisfied 9 12 7 9 8 9
Don’t know/Refused 3 2 3 3 3 2
Overall Satisfaction with Access-A-Ride
by Borough of Residence
Among Frequent/Occasional Users
2017
Borough
Bronx Manhattan Queens BrooklynStaten
Island
n= (425) (434) (428) (416) (300)
% % % % %
Total: Satisfied 73 71 76 75 72
Very satisfied 30 25 29 30 30
Somewhat satisfied 43 46 47 45 41
Total: Dissatisfied 26 26 21 22 26
Somewhat dissatisfied 16 20 15 16 19
Very dissatisfied 9 7 6 6 7
Don’t know/Refused 2 2 3 3 3
Page 26
WBA Research
2191 Defense Highway • Suite 401 • Crofton, MD 21114 • (410)-721-0500 • www.WBAresearch.com
25
Overall Satisfaction with Access-A-Ride (continued)
This question asked of: Frequent/Occasional Users (n sizes for 2017)
Q4
This question asked of: Frequent/Occasional Users (n sizes for 2017)
Q4
Q4. Now please tell me how satisfied you are with Access-A-Ride, overall. Would you say you are…?
Change in Overall Satisfaction With Access-A-Ride
By Borough of Residence
“Very or Somewhat Satisfied”
Among Frequent/Occasional Users
2015-2017Very/Somewhat Satisfied Very Satisfied
2015 2016 2017 2015 2016 2017
% % % % % %
Total (n=2003) 66 65 74 25 22 29
Bronx (n=425) 63 62 73 23 19 30
Manhattan (n=434) 66 67 71 26 20 25
Queens (n=428) 68 67 76 24 25 29
Brooklyn (n=416) 66 63 75 24 20 30
Staten Island (n=300) 71 71 72 30 30 30
Difference:
Highest – Lowest Borough (% Pts) +8 points +9 points +5 points +7 points +11 points +5 points
Change in Overall Satisfaction With Access-A-Ride
By Borough of Residence
“Very or Somewhat Dissatisfied”
Among Frequent/Occasional Users
2015-2017Very/Somewhat Dissatisfied Very Dissatisfied
2015 2016 2017 2015 2016 2017
% % % % % %
Total (n=2003) 30 32 23 9 12 7
Bronx (n=425) 33 36 26 8 11 9
Manhattan (n=434) 31 30 26 10 12 7
Queens (n=428) 29 30 21 8 12 6
Brooklyn (n=416) 31 34 22 11 13 6
Staten Island (n=300) 25 27 26 6 8 7
Difference:
Highest – Lowest Borough (% Pts) +8 points +9 points +5 points +5 points +5 points +3 points
Page 27
WBA Research
2191 Defense Highway • Suite 401 • Crofton, MD 21114 • (410)-721-0500 • www.WBAresearch.com
26
Aspects in Need of Improvement
This question asked of: Total Sample
Top Mentions
Q6
Q6. What one aspect of Access-A-Ride service would you say is most in need of improvement? Is it the…?
Aspects of Access-A-Ride Most In Need of Improvement
By Borough of Residence
Borough – 2017
Total Bronx Manhattan Queens BrooklynStaten
Island
n= (2303) (492) (497) (493) (481) (340)
% % % % % %
On-time performance/wait time 27 28 35 23 28 26
Broker Car/Voucher service 16 15 12 16 18 18
Travel time 10 9 9 11 10 14
Access-A-Ride Drivers 7 6 5 8 7 4
Access-A-Ride Vehicles 7 10 8 5 8 5
Reservationists 5 3 5 5 6 6
Page 28
WBA Research
2191 Defense Highway • Suite 401 • Crofton, MD 21114 • (410)-721-0500 • www.WBAresearch.com
27
Perceptions of Access-A-Ride as a Good Value
Q7. Considering the fare and the service provided by Access-A-Ride, would you say it is…?
Perceptions of Access-A-Ride as a “Good Value For the Money”
By Borough of Residence
and Level of Overall Satisfaction with Access-A-Ride
Among Frequent/Occasional Users
2015-2017Year
2015 2016 2017
% % %
Total (n=2003) 89 89 91
Bronx (n=425) 91 90 88
Manhattan (n=434) 90 92 87
Queens (n=428) 89 86 92
Brooklyn (n=416) 86 87 94
Staten Island (n=300) 94 93 94
By Level of Satisfaction with
Access-A-Ride
Satisfied (n=1467) 95 95 95
Dissatisfied (n=484) 76 78 82
This question asked of: Frequent/Occasional Users (n sizes for 2017)
Q7
Page 29
WBA Research
2191 Defense Highway • Suite 401 • Crofton, MD 21114 • (410)-721-0500 • www.WBAresearch.com
28
Overall Satisfaction With Last Access-A-Ride Trip
Q38. Overall, how satisfied were you with the trip we just discussed? Would you say you were…?
Overall Satisfaction With Last Access-A-Ride Trip
By Borough of Residence
Among Frequent/Occasional Users
Total Borough – 2017
2015 2016 2017 Bronx Manhattan Queens BrooklynStaten
Island
n= (2003) (2001) (2003) (425) (434) (428) (416) (300)
% % % % % % % %
Total: Satisfied 81 83 85 85 86 84 84 86
Very satisfied 57 55 65 66 63 63 66 66
Somewhat satisfied 24 27 20 19 23 21 18 20
Total: Dissatisfied 16 16 13 13 11 14 13 12
Somewhat dissatisfied 8 8 7 7 6 9 7 7
Very dissatisfied 8 8 6 7 6 5 6 5
Don’t know/Refused 3 1 2 1 3 2 3 2
This question asked of: Frequent/Occasional Users
Q38
Page 30
WBA Research
2191 Defense Highway • Suite 401 • Crofton, MD 21114 • (410)-721-0500 • www.WBAresearch.com
29
Overall Satisfaction With Last Access-A-Ride Trip (continued)
Q38. Overall, how satisfied were you with the trip we just discussed? Would you say you were…?
Change in Overall Satisfaction With Last Access-A-Ride Trip
By Borough of Residence
Among Frequent/Occasional Users
2015-2017
Very/Somewhat Satisfied Very Satisfied Very/Somewhat Dissatisfied
2015 2016 2017 2015 2016 2017 2015 2016 2017
% % % % % % % % %
Total (n=2003) 81 83 85 57 55 65 16 16 13
Bronx (n=425) 81 80 85 57 54 66 16 19 13
Manhattan (n=434) 82 80 86 59 54 63 15 18 11
Queens (n=428) 81 84 84 54 55 63 17 14 14
Brooklyn (n=416) 81 83 84 58 56 66 16 16 13
Staten Island (n=300) 83 90 86 58 63 66 15 9 12
This question asked of: Frequent/Occasional Users (n sizes for 2017)
Q38
Page 31
WBA Research
2191 Defense Highway • Suite 401 • Crofton, MD 21114 • (410)-721-0500 • www.WBAresearch.com
30
Satisfaction with Specific Aspects of Access-A-Ride
Q42-44. Now thinking about your experience with Access-A-Ride in the past 3-4 months, I’d like you to tell me how satisfied you are with
some specific aspects of Access-A-Ride service. For each aspect I mention, please tell me whether you are “very satisfied,”
“somewhat satisfied,” “somewhat dissatisfied” or “very dissatisfied.”
Satisfaction With Specific Aspects of Access-A-Ride Service
Among Frequent Users
2015-2017
Very/Somewhat Satisfied Very Satisfied Somewhat Satisfied
2015 2016 2017 2015 2016 2017 2015 2016 2017
Making Trip Reservations % % % % % % % % %
Being able to get through to make a reservation 93 93 91 64 60 63 29 34 28
How far in advance you need to call to make
reservations85 84 84 56 52 56 29 32 28
The courtesy of the reservations staff 94 90 92 74 67 72 19 23 20
The competence of the reservations staff 92 89 90 67 58 64 25 31 26
The ability to get a ride for the day or time you
request it87 83 87 52 45 53 35 38 34
How long it takes for them to confirm the reservation 91 92 92 66 61 67 25 31 25
Pickups
Being picked up no later than 30 minutes after the
scheduled pick-up time60 60 69 24 22 32 36 38 36
Trip Experience
Length of the trips 69 66 75 36 28 39 33 38 36
The drivers knowing how to get where they are going 80 78 83 45 44 51 35 35 32
Courtesy of the drivers 88 88 89 57 55 61 31 32 28
The drivers driving carefully and safely 89 88 92 61 60 67 28 28 25
This question asked of: Frequent Users (2015 n=1378; 2016 n=1375; 2017 n=1378)
Q42a-e, 43a, 44a-f
Page 32
WBA Research
2191 Defense Highway • Suite 401 • Crofton, MD 21114 • (410)-721-0500 • www.WBAresearch.com
31
Satisfaction with Specific Aspects of Access-A-Ride (continued)
Q42-44. Now thinking about your experience with Access-A-Ride in the past 3-4 months, I’d like you to tell me how satisfied you are with
some specific aspects of Access-A-Ride service. For each aspect I mention, please tell me whether you are “very satisfied,”
“somewhat satisfied,” “somewhat dissatisfied” or “very dissatisfied.”
Satisfaction With Specific Aspects of Access-A-Ride Service
Among Frequent Users
2015-2017
Very/Somewhat Dissatisfied Very Dissatisfied Somewhat Dissatisfied
2015 2016 2017 2015 2016 2017 2015 2016 2017
Making Trip Reservations % % % % % % % % %
Being able to get through to make a reservation 4 5 6 1 1 1 4 4 5
How far in advance you need to call to make
reservations11 12 11 4 3 3 7 8 8
The courtesy of the reservations staff 4 8 6 1 2 2 2 6 5
The competence of the reservations staff 5 9 7 1 2 2 4 6 5
The ability to get a ride for the day or time you
request it8 15 10 2 4 2 6 10 8
How long it takes for them to confirm the reservation 4 5 4 1 2 1 3 4 3
Pickups
Being picked up no later than 30 minutes after the
scheduled pick-up time37 38 27 17 18 12 21 20 16
Trip Experience
Length of the trips 20 25 21 7 12 8 13 14 13
The drivers knowing how to get where they are going 14 17 13 4 5 4 10 12 8
Courtesy of the drivers 7 9 8 2 2 3 6 6 6
The drivers driving carefully and safely 7 9 5 2 3 2 5 7 4
This question asked of: Frequent Users (2015 n=1378; 2016 n=1375; 2017 n=1378)
Q42a-e, 43a, 44a-f
Page 33
WBA Research
2191 Defense Highway • Suite 401 • Crofton, MD 21114 • (410)-721-0500 • www.WBAresearch.com
32
Satisfaction with Specific Aspects of Access-A-Ride (continued)
This question asked of: Frequent Users
Q42a-e, 43a, 44a-f
Q42-44. Now thinking about your experience with Access-A-Ride in the past 3-4 months, I’d like you to tell me how satisfied you are with
some specific aspects of Access-A-Ride service. For each aspect I mention, please tell me whether you are “very satisfied,”
“somewhat satisfied,” “somewhat dissatisfied” or “very dissatisfied.”
Satisfaction With Specific Aspects of Access-A-Ride Service
% Very or Somewhat Satisfied
By Borough of Residence
Among Frequent Users – 2017Borough
Bronx Manhattan Queens Brooklyn Staten Island
Making Trip Reservations n= (301) (309) (303) (291) (174)
% % % % %
Being able to get through to make a reservation 92 90 91 92 90
How far in advance you need to call to make reservations 88 80 84 84 84
The courtesy of the reservations staff 94 92 92 91 89
The competence of the reservations staff 91 89 89 90 89
The ability to get a ride for the day or time you request it 88 87 82 90 88
How long it takes for them to confirm the reservation 93 89 91 94 91
Pickups n= (301) (309) (303) (291) (174)
% % % % %
Being picked up no later than 30 minutes after the
scheduled pick-up time64 64 70 70 72
Trip Experience n= (301) (309) (303) (291) (174)
% % % % %
Length of the trips 77 74 70 77 76
The drivers knowing how to get where they are going 86 85 81 84 80
Courtesy of the drivers 89 90 90 86 93
The drivers driving carefully and safely 92 91 90 95 93
Page 34
WBA Research
2191 Defense Highway • Suite 401 • Crofton, MD 21114 • (410)-721-0500 • www.WBAresearch.com
This question asked of: Frequent Users
Q42a-e, 43a, 44a-f
33
Satisfaction with Specific Aspects of Access-A-Ride (continued)
Q42-44. Now thinking about your experience with Access-A-Ride in the past 3-4 months, I’d like you to tell me how
satisfied you are with some specific aspects of Access-A-Ride service. For each aspect I mention, please tell me
whether you are “very satisfied,” “somewhat satisfied,” “somewhat dissatisfied” or “very dissatisfied.”
Satisfaction With Specific Aspects of Access-A-Ride Service
% Very or Somewhat Dissatisfied
By Borough of Residence
Among Frequent Users – 2017Borough
Bronx Manhattan Queens Brooklyn Staten Island
Making Trip Reservations n= (301) (309) (303) (291) (174)
% % % % %
Being able to get through to make a reservation 7 6 6 6 7
How far in advance you need to call to make reservations 9 16 11 10 9
The courtesy of the reservations staff 5 6 6 7 7
The competence of the reservations staff 6 7 8 8 7
The ability to get a ride for the day or time you request it 10 8 13 8 9
How long it takes for them to confirm the reservation 5 6 6 3 5
Pickups n= (301) (309) (303) (291) (174)
% % % % %
Being picked up no later than 30 minutes after the
scheduled pick-up time 34 28 26 26 24
Trip Experience n= (301) (309) (303) (291) (174)
% % % % %
Length of the trips 21 20 25 18 20
The drivers knowing how to get where they are going 12 11 13 13 15
Courtesy of the drivers 9 6 8 10 5
The drivers driving carefully and safely 7 6 7 3 5
Page 35
WBA Research
2191 Defense Highway • Suite 401 • Crofton, MD 21114 • (410)-721-0500 • www.WBAresearch.com
34
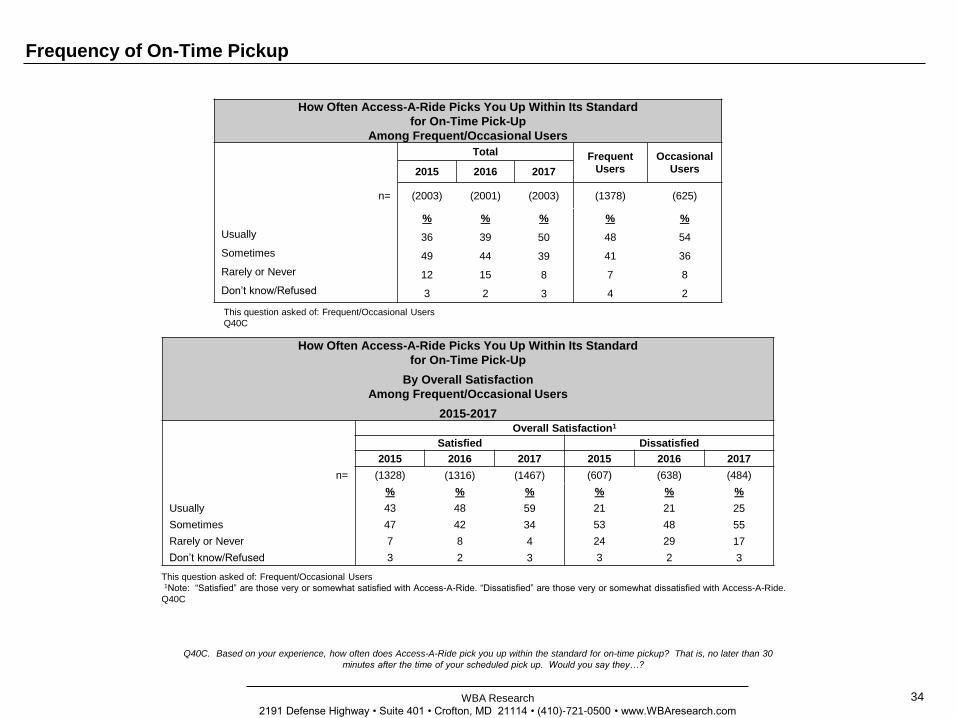
Frequency of On-Time Pickup
This question asked of: Frequent/Occasional Users1Note: “Satisfied” are those very or somewhat satisfied with Access-A-Ride. “Dissatisfied” are those very or somewhat dissatisfied with Access-A-Ride.
Q40C
Q40C. Based on your experience, how often does Access-A-Ride pick you up within the standard for on-time pickup? That is, no later than 30
minutes after the time of your scheduled pick up. Would you say they…?
How Often Access-A-Ride Picks You Up Within Its Standard
for On-Time Pick-Up
Among Frequent/Occasional Users
Total Frequent
Users
Occasional
Users2015 2016 2017
n= (2003) (2001) (2003) (1378) (625)
% % % % %
Usually 36 39 50 48 54
Sometimes 49 44 39 41 36
Rarely or Never 12 15 8 7 8
Don’t know/Refused 3 2 3 4 2
This question asked of: Frequent/Occasional Users
Q40C
How Often Access-A-Ride Picks You Up Within Its Standard
for On-Time Pick-Up
By Overall Satisfaction
Among Frequent/Occasional Users
2015-2017
Overall Satisfaction1
Satisfied Dissatisfied
2015 2016 2017 2015 2016 2017
n= (1328) (1316) (1467) (607) (638) (484)
% % % % % %
Usually 43 48 59 21 21 25
Sometimes 47 42 34 53 48 55
Rarely or Never 7 8 4 24 29 17
Don’t know/Refused 3 2 3 3 2 3
Page 36
WBA Research
2191 Defense Highway • Suite 401 • Crofton, MD 21114 • (410)-721-0500 • www.WBAresearch.com
35
Frequency of On-Time Pick-up (continued)
Q40C. Based on your experience, how often does Access-A-Ride pick you up within the standard for on-time pickup? That is, no later than 30
minutes after the time of your scheduled pick up. Would you say they…?
How Often Access-A-Ride Picks You Up Within Its Standard for On-Time Pick-Up
By Borough of Residence
Among Frequent/Occasional Users
2017
Borough
Bronx Manhattan Queens Brooklyn
Staten
Island
n= (425) (434) (428) (416) (300)
% % % % %
Usually 51 47 53 48 57
Sometimes 39 40 38 41 31
Rarely or Never 9 7 6 7 9
Don’t know/Refused 2 5 3 4 3
This question asked of: Frequent/Occasional Users
Q40C
Page 37
WBA Research
2191 Defense Highway • Suite 401 • Crofton, MD 21114 • (410)-721-0500 • www.WBAresearch.com
36
Frequency of On-Time Pick-up (continued)
This question asked of: Frequent/Occasional Users (2015 n=2003; 2016 n=2001; 2017 n=2003)
Q40C
Q40C. Based on your experience, how often does Access-A-Ride pick you up within the standard for on-time pickup? That is, no later than 30
minutes after the time of your scheduled pick up. Would you say they…?
Change in How Often Access-A-Ride Picks You Up Within Its Standard
for On-Time Pick-Up
By Frequency of Use, Overall Satisfaction and Borough
Among Frequent/Occasional Users
2015-2017Usually Sometimes
2015 2016 2017 2015 2016 2017
% % % % % %
Total 36 39 50 49 44 39
User Frequency
Frequent 34 37 48 51 46 41
Occasional 41 46 54 44 38 36
Overall Satisfaction
Satisfied 43 48 59 47 42 34
Dissatisfied 21 21 25 53 48 55
Borough of Residence
Bronx 39 36 51 43 47 39
Manhattan 39 37 47 44 46 40
Queens 38 44 53 49 40 38
Brooklyn 32 37 48 53 45 41
Staten Island 40 50 57 49 36 31
Page 38
WBA Research
2191 Defense Highway • Suite 401 • Crofton, MD 21114 • (410)-721-0500 • www.WBAresearch.com
37
Perceptions of Changes in Overall Service
Q3. Would you say that during the past year, overall, Access-A-Ride service has…?
Perceptions of Changes in Overall Access-A-Ride Service During the Past Year
By Borough of Residence
Among Frequent/Occasional Users
Total Borough - 2017
2015 2016 2017 Bronx Manhattan Queens BrooklynStaten
Island
n= (2003) (2001) (2003) (425) (434) (428) (416) (300)
% % % % % % % %
Improved 31 29 36 36 35 37 37 31
Stayed about the same 37 39 39 41 42 38 37 42
Gotten worse 27 29 19 18 18 18 20 22
Don’t know/Refused 5 4 6 4 5 7 6 6
This question asked of: Frequent/Occasional Users
Q3
Page 39
WBA Research
2191 Defense Highway • Suite 401 • Crofton, MD 21114 • (410)-721-0500 • www.WBAresearch.com
38
Perceptions of Changes in Overall Service (continued)
This question asked of: Frequent/Occasional Users
Q40F, 40J
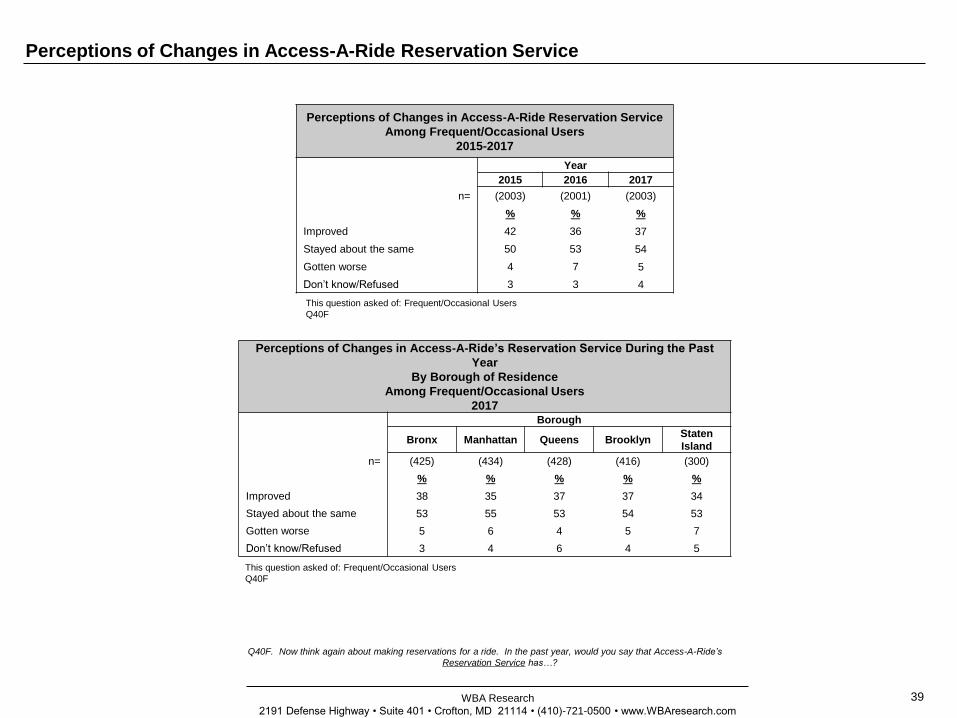
Q40F. Now think again about making reservations for a ride. In the past year, would you say that Access-A-Ride’s Reservation Service has…?
Q40J. Now think again about the rides or trips provided by Access-A-Ride. In the past year, would you say that your experience with Access-A-Ride trips has…?
Changes in Access-A-Ride Reservation Service/Trips Experience
Among Frequent/Occasional Users
2015-2017
Year
2015 2016 2017
Access-A-Ride’s Reservation Service n= (2003) (2001) (2003)
% % %
Improved 42 36 37
Stayed the same 50 53 54
Gotten worse 4 7 5
Don’t know/Refused 3 3 4
Access-A-Ride’s Trips n= (2003) (2001) (2003)
% % %
Improved 30 26 35
Stayed the same 51 54 52
Gotten worse 16 18 10
Don’t know/Refused 3 2 2
Page 40
WBA Research
2191 Defense Highway • Suite 401 • Crofton, MD 21114 • (410)-721-0500 • www.WBAresearch.com
39
Perceptions of Changes in Access-A-Ride Reservation Service
This question asked of: Frequent/Occasional Users
Q40F
This question asked of: Frequent/Occasional Users
Q40F
Q40F. Now think again about making reservations for a ride. In the past year, would you say that Access-A-Ride’s
Reservation Service has…?
Perceptions of Changes in Access-A-Ride Reservation Service
Among Frequent/Occasional Users
2015-2017
Year
2015 2016 2017
n= (2003) (2001) (2003)
% % %
Improved 42 36 37
Stayed about the same 50 53 54
Gotten worse 4 7 5
Don’t know/Refused 3 3 4
Perceptions of Changes in Access-A-Ride’s Reservation Service During the Past
Year
By Borough of Residence
Among Frequent/Occasional Users
2017Borough
Bronx Manhattan Queens BrooklynStaten
Island
n= (425) (434) (428) (416) (300)
% % % % %
Improved 38 35 37 37 34
Stayed about the same 53 55 53 54 53
Gotten worse 5 6 4 5 7
Don’t know/Refused 3 4 6 4 5
Page 41
WBA Research
2191 Defense Highway • Suite 401 • Crofton, MD 21114 • (410)-721-0500 • www.WBAresearch.com
40
Reasons for Changes in Access-A-Ride Reservation Service
This question asked of: Frequent/Occasional Users who feel the Reservation Service has changed
Multiple Responses Accepted; Select Mentions
Q40G
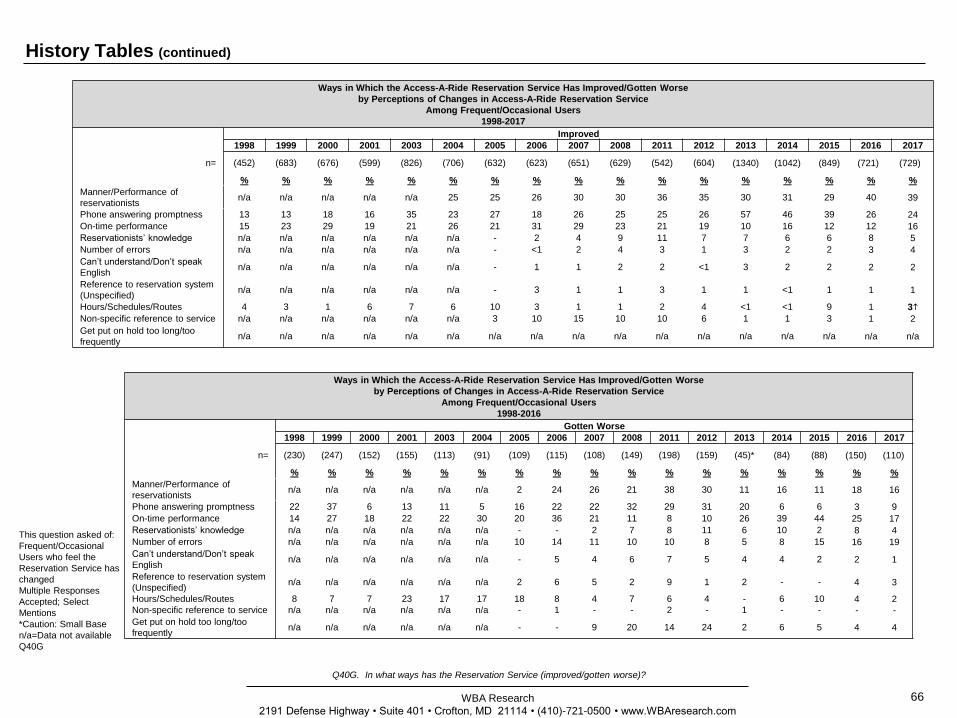
Q40G. In what ways has the Reservation Service (improved/gotten worse)?
Ways in Which the Access-A-Ride Reservation Service Has Improved/Gotten Worse
by Perceptions of Changes in Access-A-Ride Reservation Service
Among Frequent/Occasional Users
2015-2017Improved Gotten Worse
2015 2016 2017 2015 2016 2017
n= (849) (721) (729) (88) (150) (110)
% % % % % %
Manner/Performance of reservationists 29 40 39 11 18 16
Phone answering promptness 39 26 24 6 3 9
On-time performance 12 12 16 44 25 17
Availability of rides 1 8 10 4 13 9
Reservationists’ knowledge 6 8 5 2 8 4
Number of errors 2 3 4 15 16 19
Hours/Schedules/Routes 9 1 3 10 4 2
Can’t understand them/Don’t speak English 2 2 2 2 2 1
Reference to reservation system
(Unspecified)1 1 1 - 4 3
Non-specific reference to service 2 <1 1 - - -
Get put on hold too long/too frequently n/a n/a n/a 5 4 4
Page 42
WBA Research
2191 Defense Highway • Suite 401 • Crofton, MD 21114 • (410)-721-0500 • www.WBAresearch.com
41
Overview of Performance of Key Elements of Last Trip
Q21A. Were you picked up by Access-A-Ride within the standard for on-time pickup? That is, no later than 30 minutes after the time you were scheduled to be picked up.
Q23. Was the driver courteous?
Q23A. Did the driver operate the vehicle in a careful and safe manner?
Q24. Did the trip take a reasonable amount of time?
Q30A. Speaking again about your last Access-A-Ride trip, did you need the driver’s assistance after you were out of the vehicle?
Q30B. Did the driver assist you after you were getting out of the vehicle?
This question asked of: Frequent/Occasional Users1This question asked of: Frequent/Occasional Users who were picked-up2This question asked of: Frequent/Occasional Users who needed driver’s assistance
Q21A, 23, 23A, 24, 30A-B
Overview of Performance of Key Elements of the Last Trip with Access-A-Ride
Among Frequent/Occasional Users
2015-2017
Year
2015 2016 2017
On-Time Pick-up n= (2003) (2001) (2003)
Picked up no later than 30 minutes after the time you
were scheduled to be picked up76% 78% 81%
Courtesy of Driver1 n= (2003) (2001) (1998)
Driver was courteous 96% 93% 96%
Operation of Vehicle1 n= (2003) (2001) (1998)
Driver operated the vehicle in a careful and safe manner 96% 95% 97%
Trip Time1 n= (2003) (2001) (1998)
Trip took a reasonable amount of time 86% 85% 88%
Driver’s Assistance1 n= (2003) (2001) (1998)
Needed driver’s assistance after out of the vehicle 38% 37% 35%
Driver’s Offer of Assistance2 n= (759) (725) (689)
Driver offered to assist 93% 91% 91%
Page 43
WBA Research
2191 Defense Highway • Suite 401 • Crofton, MD 21114 • (410)-721-0500 • www.WBAresearch.com
42
Ever Called to Ask a Question or Report a Problem
This question asked of: Total Sample
Q57
Q57. Besides calling for reservations, or calling on the day of your trip, have you ever called Access-A-Ride to ask
a question or report a problem?
Q57F1. Which of the following units did you call?
Ever Called Access-A-Ride to Ask a Question or Report a Problem
By User Frequency, Level of Satisfaction and Borough of Residence
2015-2017
Year
2015 2016 2017
Total n= (2303) (2301) (2303)
62% 64% 59%
Frequent Users n= (1378) (1375) (1378)
70% 72% 68%
Occasional Users n= (625) (626) (625)
55% 55% 51%
Infrequent Users n= (300) (300) (300)
39% 47% 38%
Satisfied (Frequent/Occasional Users) n= (1328) (1316) (1467)
60% 61% 58%
Dissatisfied (Frequent/Occasional Users) n= (607) (638) (484)
78% 79% 80%
Bronx (Frequent/Occasional Users) n= (428) (422) (425)
69% 70% 67%
Manhattan (Frequent/Occasional Users) n= (430) (427) (434)
69% 70% 65%
Queens (Frequent/Occasional Users) n= (425) (431) (428)
65% 65% 57%
Brooklyn (Frequent/Occasional Users) n= (417) (419) (416)
64% 67% 64%
Staten Island (Frequent/Occasional Users) n= (303) (302) (300)
57% 58% 60%
Units Called When Asking a Question or Reporting a Problem
2017
Year
2017
n= (1396)
Eligibility 22%
Subscriptions 9
Some other unit 60
Don’t know/Can’t recall 19
This question asked of: Those who have called or had someone call Access-
A-Ride to ask a question or report a problem
*Multiple responses accepted
Q57F1
Page 44
WBA Research
2191 Defense Highway • Suite 401 • Crofton, MD 21114 • (410)-721-0500 • www.WBAresearch.com
43
Level of Satisfaction with Results of Last Call
This question asked of: Frequent/Occasional Users who called to ask a question or
report a problem1Note: “Satisfied” are those very or somewhat satisfied with Access-A-Ride.
“Dissatisfied” those very or somewhat dissatisfied with Access-A-Ride.
Q57F
This question asked of: Frequent/Occasional Users who called to ask a question or report a problem
Q57F
Q57F. How satisfied were you with the results? Would you say you were…?
Whether Satisfied With the Results of Last Call to Access-A-Ride
By Borough of Residence
Among Frequent/Occasional Users
Total Borough - 2017
2015 2016 2017 Bronx Manhattan Queens BrooklynStaten
Island
n= (1322) (1333) (1272) (288) (288) (246) (273) (177)
% % % % % % % %
Satisfied 51 49 61 60 58 63 62 62
Dissatisfied 42 46 33 36 32 33 32 34
Don’t know/Refused 7 5 6 4 9 4 6 5
Whether Satisfied With the Results of Last Call to
Access-A-Ride
By Overall Satisfaction
Among Frequent/Occasional Users
2017Overall Satisfaction1
Satisfied Dissatisfied
n= (853) (392)
% %
Satisfied 69 44
Dissatisfied 26 51
Don’t know/Refused 6 5
Page 45
WBA Research
2191 Defense Highway • Suite 401 • Crofton, MD 21114 • (410)-721-0500 • www.WBAresearch.com
44
Expected Future Use of Access-A-Ride
This question asked of: Total Sample1This question asked of: Those who expect to use AAR less often in the next year
*Multiple Responses Accepted, Top Mentions
**Caution: Small Base
Q50B-50C
Q50B. In the next year or so would you expect to use Access-A-Ride, including vans, taxi rides and (broker car/voucher) service…?
Q50C. Why do you expect to use Access-A-Ride less often in the next year or so?
Expected Usage of Access-A-Ride in Upcoming Year
2015-2017
2015 2016 2017Frequent
Users
Occasional
Users
Infrequent
Users
Expected Use in Upcoming Year n= (2303) (2301) (2303) (1378) (625) (300)
% % % % % %
More often 17 16 22 21 24 21
Less often 2 2 2 2 1 2
About the same 43 43 41 45 37 30
Not sure 37 37 34 31 36 45
Refused 2 2 1 1 1 1
Why Expect to Use AAR Less Often n=
in the Next Year1*
(45)** (61) (42)** (25)** (9)** (8)**
% % % % % %
Total: Less need 41 49 60 55 83 51
Healthier/Better physical shape 14 18 17 18 30 -
Fewer doctor’s appointments 17 12 10 12 15 -
Working less/Retired - 7 15 25 - -
Don’t go out as much 2 5 9 - 22 24
No need (not specific) 6 4 5 - 8 19
Moving - 6 3 - 8 8
They are unreliable 5 6 17 25 - 9
Medical limitations (i.e., less able to go out) 24 14 16 17 - 33
Service (Other) 3 17 9 10 8 8
People/Personnel/Poor treatment - - 9 15 - -
Other 11 5 - - - -
Page 46
WBA Research
2191 Defense Highway • Suite 401 • Crofton, MD 21114 • (410)-721-0500 • www.WBAresearch.com
45
Q44.60. Are you aware of the Access-A-Ride MetroCard, which allows customers to take up to four free bus or subway rides per day?
Q44.60A. Do you have an Access-A-Ride MetroCard?
Q44.60B. Would you be interested in receiving an Access-A-Ride MetroCard, by calling Access-A-Ride and selecting option “1” to request one?
This question asked of: Total Sample1This question asked of: Those who are aware of the Access-A-Ride MetroCard2This question asked of: Those who do not have an Access-A-Ride MetroCard
*New question added in 2017.
Q44.60 - 44.60B
Interest in Access-A-Ride MetroCard Trips
Awareness and Interest in MetroCard Program
2015-20172015 2016 2017
Awareness of AAR MetroCard That Will Allow Fixed-Route
Transit Trips Free of Charge (2303) (2301) (2303)
% Aware 51% 52% 61%
Have AAR MetroCard1 (1158) (1185) (1386)
% Yes 76% 74% 65%
Interest in Receiving Access-A-Ride MetroCard2* (481)
Yes 39%
No 56
Page 47
WBA Research
2191 Defense Highway • Suite 401 • Crofton, MD 21114 • (410)-721-0500 • www.WBAresearch.com
46
Approval/Usage of Specific Vehicles
Those asked these questions altered in 2017. Trending impacted.
This question asked of: Those who are not wheelchair users living in Brooklyn, Queens,
Manhattan or the Bronx1This question asked of: Those who have received approval and taken a ride in vehicle 2This question asked of: Those who are satisfied with the vehicle provided through AAR3This question asked of: Those who are dissatisfied with the vehicle provided through AAR
*Multiple Responses Accepted; Top Mentions
**Caution: Small Base
Q44.1-44.3Q44.1. In the past 6 months, when calling Access-A-Ride to reserve a trip, have you received approval for and taken a ride in a (INSERT MODE)
with costs paid for with your usual Access-A-Ride fare or reimbursed by Access-A-Ride?
Q44.2. How satisfied were you with the (INSERT MODE) approved by Access-A-Ride…? Would you say you are “very satisfied”, “somewhat
satisfied”, “somewhat dissatisfied” or “very dissatisfied”?
Q44.3. Why do you say you are (INSERT RATING) with the (INSERT MODE)?
Approval and Usage of Yellow or Green Taxi Service
2017
2017
Received Approval and Taken a Ride in Vehicles n= (1726)
Yellow or green taxi 43%
Satisfaction with Yellow or Green Taxi1 n= (774)
%
Total: Satisfied 85
Very satisfied 64
Somewhat satisfied 21
Total: Dissatisfied 12
Somewhat dissatisfied 5
Very dissatisfied 6
Satisfaction with Aspects of Yellow or Green Taxi2* n= (654)
%
On-time performance/Don’t have to wait/Arrive early 40
Drivers are courteous/friendly/helpful 17
Good service/Like the service (not specific) 10
Personnel/Employees are good/helpful/courteous/professional
(not specific)8
Dissatisfaction with Aspects of or Green Yellow Taxi3* n= (97)
%
Have trouble getting in and out of vehicles/vehicles are too small 19
(Some) Drivers not courteous/kind/helpful 13
Hard/Takes too long to get reimbursed 13
(Sometimes) Don’t show up/cancel trips 12
Not on time/Poor on-time performance (not specific) 8
(Some) Drivers don’t wait/don’t stop to pick me up/pass me by 8
Those asked these questions altered in 2017. Trending impacted.
This question asked of: Wheelchair users living in Brooklyn, Queens, Manhattan or the Bronx1This question asked of: Those who are have received approval and taken a ride in vehicle
Q44.1-44.2
Approval and Usage of Yellow or Green Accessible Taxi Service
2017
2017
Received Approval and Taken a Ride in Vehicles n= (237)
%
Yellow or green accessible taxi 27
Satisfaction with Yellow or Green Accessible Taxi1* n= (67)
%
Total: Satisfied 78
Very satisfied 46
Somewhat satisfied 32
Total: Dissatisfied 16
Somewhat dissatisfied 11
Very dissatisfied 6
Page 48
WBA Research
2191 Defense Highway • Suite 401 • Crofton, MD 21114 • (410)-721-0500 • www.WBAresearch.com
Concerns with Accessible Taxi Providing Access-a-Ride Trip
47
Concerns with Accessible Yellow Taxi Providing Access-A-Ride Trip
2016-2017
Year
2016 2017
Have Concerns with Yellow or Green Accessible Taxi
Providing Access-A-Ride Trip, Instead of an Access-
A-Ride Vehicle (2301) (2303)
Yes 22% 25%
No 53 60
Have not been in vehicle yet/Don’t know/Refused 25 15
Concerns with Using Yellow or Green Accessible
Taxi Dispatched Through Access-A-Ride¹* (495) (573)
Vehicles are difficult to get in and out of 20% 21%
I required a lift/have a wheelchair/rollator/scooter 19 18
Vehicles are uncomfortable/too small 16 15
Late pick-ups/Unreliability/No shows 7 12
Costs more money/Sometimes I don’t have money/have
to wait for reimbursement17 10
Feel safer/Prefer Access-A-Ride 8 10
Question wording changed in 2017 to include green accessible taxis.
This question asked of: Total sample1This question asked of: Those who have concerns with using a yellow or green accessible taxi
*Multiple Responses Accepted; Top Mentions
Q44.63, Q44.64
Q44.63 Do you have any concerns with a yellow or green accessible taxi providing your Access-A-Ride trip, instead of an Access-A-Ride van or sedan?
Q44.64 What concerns do you have with using a yellow or green accessible taxi dispatched through Access-A-Ride?
Page 49
WBA Research
2191 Defense Highway • Suite 401 • Crofton, MD 21114 • (410)-721-0500 • www.WBAresearch.com
This question asked of: Total
Sample1This question asked of: Those
who have applied for or been
recertified in 20172This question asked of: Those
who spoke to a phone
representative prior to
assessment3This question asked of: Those
who went to an assessment
center and had a personal
interview4This question asked of: Those
who arrived at the assessment
center at or before scheduled
appointment time
Q67A, 67, 67.1-67.6
48
Recertification and Assessment Centers
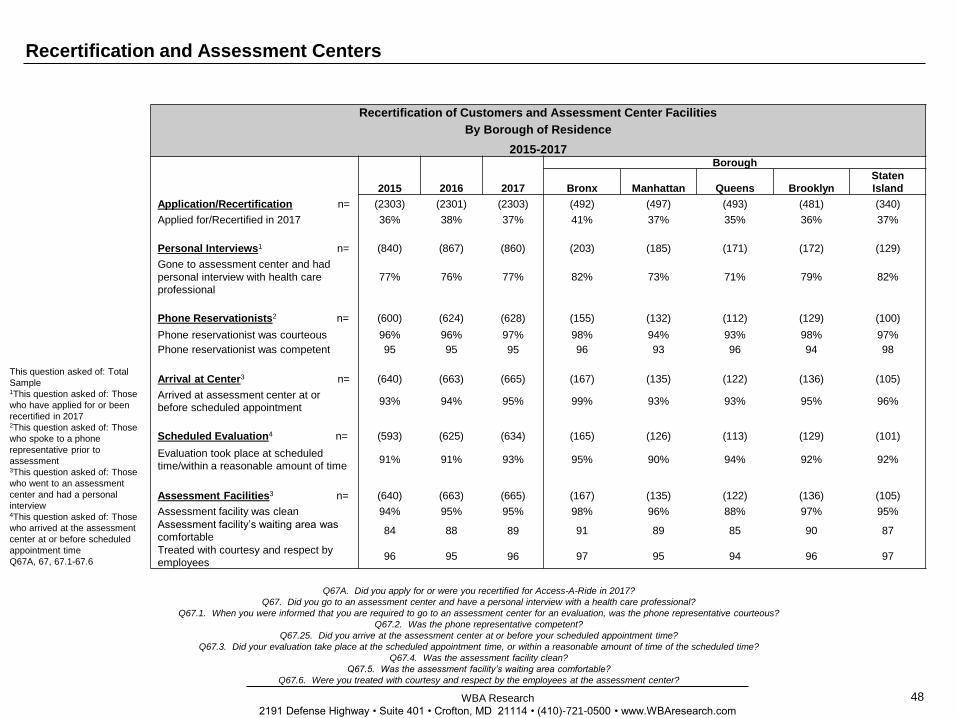
Q67A. Did you apply for or were you recertified for Access-A-Ride in 2017?
Q67. Did you go to an assessment center and have a personal interview with a health care professional?
Q67.1. When you were informed that you are required to go to an assessment center for an evaluation, was the phone representative courteous?
Q67.2. Was the phone representative competent?
Q67.25. Did you arrive at the assessment center at or before your scheduled appointment time?
Q67.3. Did your evaluation take place at the scheduled appointment time, or within a reasonable amount of time of the scheduled time?
Q67.4. Was the assessment facility clean?
Q67.5. Was the assessment facility’s waiting area comfortable?
Q67.6. Were you treated with courtesy and respect by the employees at the assessment center?
Recertification of Customers and Assessment Center Facilities
By Borough of Residence
2015-2017
2015 2016 2017
Borough
Bronx Manhattan Queens Brooklyn
Staten
Island
Application/Recertification n= (2303) (2301) (2303) (492) (497) (493) (481) (340)
Applied for/Recertified in 2017 36% 38% 37% 41% 37% 35% 36% 37%
Personal Interviews1 n= (840) (867) (860) (203) (185) (171) (172) (129)
Gone to assessment center and had
personal interview with health care
professional
77% 76% 77% 82% 73% 71% 79% 82%
Phone Reservationists2 n= (600) (624) (628) (155) (132) (112) (129) (100)
Phone reservationist was courteous 96% 96% 97% 98% 94% 93% 98% 97%
Phone reservationist was competent 95 95 95 96 93 96 94 98
Arrival at Center3 n= (640) (663) (665) (167) (135) (122) (136) (105)
Arrived at assessment center at or
before scheduled appointment93% 94% 95% 99% 93% 93% 95% 96%
Scheduled Evaluation4 n= (593) (625) (634) (165) (126) (113) (129) (101)
Evaluation took place at scheduled
time/within a reasonable amount of time91% 91% 93% 95% 90% 94% 92% 92%
Assessment Facilities3 n= (640) (663) (665) (167) (135) (122) (136) (105)
Assessment facility was clean 94% 95% 95% 98% 96% 88% 97% 95%
Assessment facility’s waiting area was
comfortable84 88 89 91 89 85 90 87
Treated with courtesy and respect by
employees96 95 96 97 95 94 96 97
Page 50
WBA Research
2191 Defense Highway • Suite 401 • Crofton, MD 21114 • (410)-721-0500 • www.WBAresearch.com
Access to Mobile Phone When Using Access-A-Ride
49
This question asked of: Total Sample1This question asked of: Those who have a cell phone
Q40.3-Q40.5
Q40.3. Do you have a cell phone?
Q40.4. Do you own a smart phone? A smart phone is a cell phone that can be used to access the internet, like a computer.
Q40.5. Do you carry your [cell phone/smart phone] with you when you travel with Access-A-Ride?
Access to Mobile Phone When Using Access-A-Ride
2017
Cell Phone Penetration n= (2303)
Yes 91%
No 9
Smart Phone Ownership1 n= (2107)
Yes 49%
No 48
Mobile Phone Availability While Traveling on
Access-A-Ride1 n= (2107)
Yes 99%
No 1
Page 51
WBA Research
2191 Defense Highway • Suite 401 • Crofton, MD 21114 • (410)-721-0500 • www.WBAresearch.com
Accessibility to Other Transportation During Weather Emergency
50
Q68. If you learned about a pending weather emergency, such as a hurricane, major snowstorm or flood, which required you to evacuate your home, do you
have relatives, friends, or others that would provide you with transportation to an evacuation center or other safe location?
This question asked of: Total Sample
Q68
Accessibility to Provided Transportation in the Event of a Weather Emergency
By Borough of Residence
2016-2017
2015 2016 2017
Borough
Bronx Manhattan Queens BrooklynStaten
Island
n= (2303) (2301) (2303) (492) (497) (493) (481) (340)
% % % % % % % %
% Yes 39 42 39 34 31 44 37 53
Page 52
WBA Research
2191 Defense Highway • Suite 401 • Crofton, MD 21114 • (410)-721-0500 • www.WBAresearch.com
Calling Access-A-Ride and Selecting Option 8
51
Q73. When calling Access-A-Ride, have you ever selected Option 8 to give a commendation or make a complaint?
Q73A. How satisfied are you when calling to give a commendation or make a complaint? Would you say you are…?
Q73B. During your most recent call, was it to give a commendation or make a complaint?
Q73C. Did you receive either a phone call or written follow-up to your complaint?
Q73D. Why were you dissatisfied when giving a commendation or making a complaint?
Question wording changed in 2017 to remove reference to the toll-free number.
This question asked of: Total Sample1This question asked of: Those who have called AAR and selected Option 8 to give a commendation or make a complaint2This question asked of: Those who have called AAR to make a complaint3Question added in 2017.
*Multiple responses accepted, Top Mentions
Q73-73D
Use of Option 8 When Calling Access-A-Ride
2015-2017
2015 2016 2017
Selected Option 8 When Calling Access-A-Ride to Give n=
Commendation or Make a Complaint
(2303)
%
(2301)
%
(2303)
%
% Yes 46 49 47
Satisfaction When Giving Commendation or Making a n=
Complaint1
(1056)
%
(1131)
%
(1074)
%
Total: Satisfied 65 64 67
Very satisfied 31 29 34
Somewhat satisfied 34 35 33
Total: Dissatisfied 32 33 30
Somewhat dissatisfied 16 18 15
Very dissatisfied 16 15 15
Calling to Give a Commendation or Make a Complaint1,3 n= (1074)
Commendation 25%
Complaint 70
Follow-Up to Making a Complaint*2,3 n= (746)
Net: Received Follow-Up 55%
Phone call 31
Written Response 29
None/Neither 41
Reasons Why Dissatisfied When Giving Commendation or n=
Making a Complaint*1,3 (329)
They never get back to you/No feedback/No response 27%
They did not resolve the problem/It happened again 14%
Some of the representatives are rude/Don’t seem to care 13%
It feels like it goes nowhere/Doesn’t get looked at 11%
Page 53
WBA Research
2191 Defense Highway • Suite 401 • Crofton, MD 21114 • (410)-721-0500 • www.WBAresearch.com
Calling Access-A-Ride and Selecting Option 7
52
Q74. When calling Access-A-Ride, have you ever selected the new Option 7 to use the automated phone system for assistance with checking the status of a
trip, or cancelling a trip?
Q74A-C. How satisfied are you with the automated phone system when using each of the following features? For each feature I mention, please tell me whether
you are “very satisfied”, “somewhat satisfied”, “somewhat dissatisfied” or “very dissatisfied,” or if this is a feature you have not used?
Q75. What comments or concerns, if any, do you have regarding the new automated phone system?
This question asked of: Total Sample1This question asked of: Those who have called AAR and selected Option 7 to use the automated
phone system for assistance
*Multiple Responses Accepted, Top Mentions
Q74, 75
This question asked of: Those who have called AAR and selected Option 7 to use the
automated phone system for assistance
Q74A-C
Use of Option 7 When Calling Access-A-Ride
2015-2017
2015 2016 2017
Selected Option 7 When Calling Access-A-Ride to Check
Trip Status or Cancel a Trip(2303) (2301) (2303)
% Yes 49% 53% 48%
Comments or Concerns Regarding Automated Phone
System1*
(1130)
%
(1217)
%
(1120)
%
Very satisfied/Like it/No problems (not specific) 19 18 16
Don’t like talking to a machine/Prefer a live person 6 5 5
(Sometimes) Doesn’t record ID or birthdate correctly - 2 5
Arrival times are not accurate 7 5 4
It’s okay/Alright 3 3 4
Satisfaction With Option 7 When Calling Access-A-Ride
2015-2017
2015 2016 2017
Satisfaction With Automated Phone System When
Getting the Status of a Trip
(1130)
%
(1217)
%
(1120)
%
Total: Satisfied 79 80 82
Very satisfied 51 50 56
Somewhat satisfied 28 30 27
Total: Dissatisfied 14 12 11
Somewhat dissatisfied 7 7 6
Very dissatisfied 6 5 5
Have not used 4 6 5
Satisfaction With Automated Phone System When
Reviewing Upcoming Trips
(1130)
%
(1217)
%
(1120)
%
Total: Satisfied 73 72 74
Very satisfied 52 50 54
Somewhat satisfied 21 23 20
Total: Dissatisfied 5 5 4
Somewhat dissatisfied 2 3 3
Very dissatisfied 3 2 2
Have not used 18 19 18
Satisfaction With Automated Phone System When
Cancelling Trips
(1130)
%
(1217)
%
(1120)
%
Total: Satisfied 76 76 77
Very satisfied 57 55 59
Somewhat satisfied 19 21 18
Total: Dissatisfied 7 8 7
Somewhat dissatisfied 4 4 3
Very dissatisfied 3 3 4
Have not used 13 13 12
Page 54
WBA Research
2191 Defense Highway • Suite 401 • Crofton, MD 21114 • (410)-721-0500 • www.WBAresearch.com
53
Rider Profile
Page 55
WBA Research
2191 Defense Highway • Suite 401 • Crofton, MD 21114 • (410)-721-0500 • www.WBAresearch.com
54
Rider Profile
This question asked of: Total Sample
S1B
S1B. Subscriber Type (RECORD FROM SAMPLE, DO NOT ASK)
Subscriber Type
Total
User Type
Frequent Occasional Infrequent
n= (2303) (1378) (625) (300)
% % % %
Conditional 52 50 53 58
Full 48 50 47 42
Page 56
WBA Research
2191 Defense Highway • Suite 401 • Crofton, MD 21114 • (410)-721-0500 • www.WBAresearch.com
55
Rider Profile (continued)
D1. The following questions are for classification purposes only, and will be kept strictly confidential. Into which of the following categories does
your age fall?
B. Gender
D4. Are you employed?
D4A. Are you employed full-time or part-time?
Demographics
Total
User Type
Total
User Type
Frequent Occasional Infrequent Frequent Occasional Infrequent
n= (2303) (1378) (625) (300) n= (2303) (1378) (625) (300)
Age % % % % Employment % % % %
Under 25 2 1 2 2 Employed 11 16 4 4
25 to 44 7 7 6 5 Not employed 88 84 95 95
45 to 64 31 34 25 25 Don’t know/Refused <1 1 <1 1
65 to 74 25 27 23 23
75 or older 35 30 43 43 n= (259) (217) (28)* (14)*
Refused 1 1 <1 1 Employment Status % % % %
Mean (in years) 66.1 65.1 67.3 68.0 Full-time 71 72 67 55
Median (in years) 68.8 67.4 71.2 71.7 Part-time 28 27 33 45
Don’t know/Refused 1 1 - -
Gender % % % %
Male 25 24 25 30
Female 75 76 75 70
This question asked of: Total Sample1This question asked of: Those who are employed
*Caution: Small Base
D1, B, D4-D4A
Page 57
WBA Research
2191 Defense Highway • Suite 401 • Crofton, MD 21114 • (410)-721-0500 • www.WBAresearch.com
56
Rider Profile (continued)
This question asked of: Total Sample1This question asked of: Those who travel with a support device
*Multiple Responses Accepted; Top Mentions
D3A-D3C
D3A. Do you normally use a support device of any kind when traveling?
D3B. What type of support device do you use?
D3C. Do you normally travel with a personal care attendant?
Support Devices and Personal Care Attendants
Total
User Type
Frequent Occasional Infrequent
Use of Support Devices n= (2303) (1378) (625) (300)
% % % %
*Total: Any 80 82 79 78
A support cane 47 48 44 46
A walker/roller walker 26 28 25 22
A manual wheel chair 7 6 9 11
A motorized wheel chair 4 4 5 3
Braces 3 3 2 1
A long cane (for the blind) 2 3 2 1
A scooter 2 1 2 1
Do not/Don’t know if/Refused if use a
support device20 18 21 22
Travel with a personal care
attendant1 n= (1855) (1127) (494) (234)
% % % %
Yes 47 44 48 57
Page 58
WBA Research
2191 Defense Highway • Suite 401 • Crofton, MD 21114 • (410)-721-0500 • www.WBAresearch.com
57
Appendix
Page 59
WBA Research
2191 Defense Highway • Suite 401 • Crofton, MD 21114 • (410)-721-0500 • www.WBAresearch.com
58
History Tables
This question asked of: Frequent/Occasional Users
Q4
This question asked of: Infrequent Users
Q4
Q4. Now please tell me how satisfied you are with Access-A-Ride, overall. Would you say you are…?
Overall Satisfaction with Access-A-Ride
Among Frequent/Occasional Users
1997-2017
Year
1997 1998 1999 2000 2001 2003 2004 2005 2006 2007 2008 2011 2012 2013 2014 2015 2016 2017
n= (1540) (1734) (1988) (2011) (2004) (2006) (2015) (2012) (2003) (2010) (2004) (2001) (2008) (2002) (2006) (2003) (2001) (2003)
% % % % % % % % % % % % % % % % % %
Total: Satisfied 74 76 73 76 80 79 77 79 79 78 76 77 80 79 73 66 65 74h
Very satisfied 36 35 30 35 40 33 34 36 33 34 33 33 36 37 30 25 22 29h
Somewhat
satisfied38 41 43 41 39 46 44 43 46 44 42 44 43 41 43 42 43 45
Total: Dissatisfied 26 24 25 23 20 21 19 19 19 19 20 21 18 18 25 30 32 23i
Somewhat
dissatisfied16 16 18 17 14 16 14 14 13 14 15 16 14 13 20 21 20 17i
Very
dissatisfied9 8 8 6 5 5 5 5 6 4 4 5 4 5 6 9 12 7i
Overall Satisfaction with Access-A-Ride
Among Infrequent Users
1997-2017
Year
1997 1998 1999 2000 2001 2003 2004 2005 2006 2007 2008 2011 2012 2013 2014 2015 2016 2017
n= (300) (300) (301) (303) (301) (301) (303) (301) (303) (302) (301) (300) (301) (301) (298) (300) (300) (300)
% % % % % % % % % % % % % % % % % %
Total: Satisfied 70 73 77 82 86 83 79 78 82 85 76 80 78 85 76 75 67 71
Very satisfied 43 39 43 40 55 42 45 40 50 44 44 39 38 46 35 35 31 33
Somewhat
satisfied27 34 34 42 31 41 34 38 32 41 32 41 40 39 41 40 37 38
Total: Dissatisfied 27 26 21 16 13 16 17 20 15 10 19 16 21 14 19 22 29 27
Somewhat
dissatisfied12 14 12 11 8 10 9 14 11 5 14 10 14 9 11 14 21 18
Very
dissatisfied15 11 9 5 5 6 7 6 4 5 5 6 6 5 9 9 8 9
Page 60
WBA Research
2191 Defense Highway • Suite 401 • Crofton, MD 21114 • (410)-721-0500 • www.WBAresearch.com
59
History Tables (continued)
This question asked of: Frequent/Occasional Users (n sizes for 2017)
Q4
Q4. Now please tell me how satisfied you are with Access-A-Ride, overall. Would you say you are…?
This question asked of: Frequent/Occasional Users (n sizes for 2017)
Q4
Change in Overall Satisfaction with Access-A-Ride
By Borough of Residence
“Very or Somewhat Satisfied”
Among Frequent/Occasional Users
1997-2017
Year
1997 1998 1999 2000 2001 2003 2004 2005 2006 2007 2008 2011 2012 2013 2014 2015 2016 2017
% % % % % % % % % % % % % % % % % %
Total (n=2003) 74 76 73 76 80 79 77 79 79 78 76 77 80 79 73 66 65 74h
Bronx (n=425) 71 74 71 76 83 77 72 74 76 77 77 79 75 84 72 63 62 73h
Manhattan (n=434) 74 71 71 69 79 80 72 66 75 77 68 71 75 77 72 66 67 71
Queens (n=428) 78 76 71 75 78 76 79 82 79 76 75 78 84 76 76 68 67 76h
Brooklyn (n=416) 72 79 77 77 78 80 77 83 79 78 75 77 82 78 72 66 63 75h
Staten Island (n=300) 76 71 74 85 88 87 86 86 87 84 85 75 77 81 72 71 71 72
Difference:
Highest – Lowest Borough
(% Pts)
+7
points
+8
points
+6
points
+16
points
+10
points
+11
points
+14
points
+20
points
+12
points
+8
points
+17
points
+8
points
+9
points
+8
points
+4
points
+8
points
+9
points
+5
points
Change in Overall Satisfaction with Access-A-Ride
By Borough of Residence
“Very Satisfied”
Among Frequent/Occasional Users
1997-2017
Year
1997 1998 1999 2000 2001 2003 2004 2005 2006 2007 2008 2011 2012 2013 2014 2015 2016 2017
% % % % % % % % % % % % % % % % % %
Total (n=2003) 36 35 30 35 40 33 34 36 33 34 33 33 36 37 30 25 22 29h
Bronx (n=425) 30 28 26 39 41 37 30 33 31 31 31 31 34 37 29 23 19 30h
Manhattan (n=434) 40 30 26 29 35 28 31 25 28 29 24 28 28 33 30 26 20 25
Queens (n=428) 42 35 29 38 41 34 35 36 30 34 36 39 40 39 29 24 25 29
Brooklyn (n=416) 32 37 32 32 39 29 32 38 33 32 32 29 38 36 31 24 20 30h
Staten Island (n=300) 40 40 39 46 51 50 47 46 46 52 45 39 40 44 31 30 30 30
Difference:
Highest – Lowest Borough
(% Pts)
+12
points
+12
points
+13
points
+17
points
+16
points
+21
points
+17
points
+21
points
+18
points
+23
points
+21
points
+11
points
+12
points
+11
points
+2
points
+7
points
+11
points
+5
points
Page 61
WBA Research
2191 Defense Highway • Suite 401 • Crofton, MD 21114 • (410)-721-0500 • www.WBAresearch.com
60
History Tables (continued)
Q4. Now please tell me how satisfied you are with Access-A-Ride, overall. Would you say you are…?
This question asked of: Frequent/Occasional Users (n sizes for 2017)
Q4
This question asked of: Frequent/Occasional Users (n sizes for 2017)
Q4
Change in Overall Satisfaction with Access-A-Ride
By Borough of Residence
“Very or Somewhat Dissatisfied”
Among Frequent/Occasional Users
1997-2017
Year
1997 1998 1999 2000 2001 2003 2004 2005 2006 2007 2008 2011 2012 2013 2014 2015 2016 2017
% % % % % % % % % % % % % % % % % %
Total (n=2003) 25 24 25 23 19 21 19 19 19 19 20 21 18 18 25 30 32 23i
Bronx (n=425) 29 26 28 23 16 22 23 23 21 19 21 20 24 15 27 33 36 26i
Manhattan (n=434) 26 28 28 30 21 19 25 30 22 21 27 26 22 20 26 31 30 26
Queens (n=428) 22 23 26 24 21 20 19 17 18 20 19 18 13 19 23 29 30 21i
Brooklyn (n=416) 27 20 22 23 22 23 19 16 20 19 19 23 16 18 26 31 34 22i
Staten Island (n=300) 24 28 26 14 12 12 9 13 11 14 13 23 19 15 26 25 27 26
Difference:
Highest – Lowest Borough
(% Pts)
+7
points
+8
points
+6
points
+16
points
+10
points
+11
points
+16
points
+17
points
+11
points
+7
points
+14
points
+8
points
+11
points
+5
points
+4
points
+8
points
+9
points
+5
points
Change in Overall Satisfaction with Access-A-Ride
By Borough of Residence
“Very Dissatisfied”
Among Frequent/Occasional Users
1997-2017
Year
1997 1998 1999 2000 2001 2003 2004 2005 2006 2007 2008 2011 2012 2013 2014 2015 2016 2017
% % % % % % % % % % % % % % % % % %
Total (n=2003) 9 8 8 6 5 5 5 5 6 4 4 5 4 5 6 9 12 7i
Bronx (n=425) 10 10 9 5 5 5 6 6 6 5 6 6 5 5 8 8 11 9
Manhattan (n=434) 9 9 7 8 6 5 6 8 7 6 6 6 5 5 8 10 12 7i
Queens (n=428) 9 9 10 7 7 4 6 4 7 6 4 4 2 5 5 8 12 6i
Brooklyn (n=416) 11 6 6 6 5 6 5 4 5 2 4 5 4 4 3 11 13 6i
Staten Island (n=300) 8 8 6 3 3 5 2 1 4 4 3 7 4 7 8 6 8 7
Difference:
Highest – Lowest Borough
(% Pts)
+4
points
+4
points
+4
points
+5
points
+4
points
+2
points
+4
points
+7
points
+3
points
+4
points
+3
points
+3
points
+3
points
+3
points
+5
points
+5
points
+5
points
+3
points
Page 62
WBA Research
2191 Defense Highway • Suite 401 • Crofton, MD 21114 • (410)-721-0500 • www.WBAresearch.com
61
History Tables (continued)
This question asked of: Frequent/Occasional Users (n sizes for 2017)
Q3
Q3. Would you say that during the past year, overall, Access-A-Ride service has…?
This question asked of: Frequent/Occasional Users (n sizes for 2017)
Q3
Perceptions of Changes in Overall Access-A-Ride Service
During the Past Year
“Improved”
By Borough of Residence
Among Frequent/Occasional Users
1997-2017
Year
1997 1998 1999 2000 2001 2003 2004 2005 2006 2007 2008 2011 2012 2013 2014 2015 2016 2017
% % % % % % % % % % % % % % % % % %
Total (n=2003) 34 26 32 31 33 39 39 34 32 36 35 35 40 52 38 31 29 36h
Bronx (n=425) 30 25 29 32 34 38 32 25 29 38 32 33 37 53 41 29 25 36h
Manhattan (n=434) 33 28 33 30 29 40 34 25 29 28 28 35 35 50 35 32 26 35h
Queens (n=428) 32 24 30 32 33 39 40 39 32 37 39 40 46 54 38 30 32 37
Brooklyn (n=416) 43 31 35 30 34 37 42 37 35 40 37 34 43 53 38 32 29 37h
Staten Island (n=300) 26 18 26 28 30 49 40 35 33 28 34 30 31 46 32 28 27 31
Perceptions of Changes in Overall Access-A-Ride Service
During the Past Year
“Gotten Worse”
By Borough of Residence
Among Frequent/Occasional Users
1997-2017
Year
1997 1998 1999 2000 2001 2003 2004 2005 2006 2007 2008 2011 2012 2013 2014 2015 2016 2017
% % % % % % % % % % % % % % % % % %
Total (n=2003) 31 24 25 20 20 15 15 17 19 14 14 18 15 14 21 27 29 19i
Bronx (n=425) 37 26 25 20 16 14 18 25 24 14 17 22 21 14 20 28 34 18i
Manhattan (n=434) 24 24 25 23 22 16 16 25 18 18 18 17 17 14 20 25 30 18i
Queens (n=428) 27 26 26 19 22 12 14 13 20 14 14 13 13 15 18 25 27 18i
Brooklyn (n=416) 30 21 25 21 20 17 13 14 17 13 12 20 12 13 23 30 29 20i
Staten Island (n=300) 38 30 27 14 17 12 11 15 14 13 11 19 17 13 25 25 22 22
Page 63
WBA Research
2191 Defense Highway • Suite 401 • Crofton, MD 21114 • (410)-721-0500 • www.WBAresearch.com
62
History Tables (continued)
This question asked of: Frequent/Occasional Users (n sizes for 2017)
Q7
Q7. Considering the fare and the service provided by Access-A-Ride, would you say it is…?
Perceptions of Access-A-Ride as a “Good Value For the Money”
By Borough of Residence
And Level of Overall Satisfaction with Access-A-Ride
Among Frequent/Occasional Users
1997-2017
Year
1997 1998 1999 2000 2001 2003 2004 2005 2006 2007 2008 2011 2012 2013 2014 2015 2016 2017
% % % % % % % % % % % % % % % % % %
Total (n=2003) 96 95 95 95 96 92 95 96 95 95 95 95 95 94 92 89 89 91h
Bronx (n=425) 94 93 96 96 96 91 94 97 93 94 96 95 95 94 93 91 90 88
Manhattan (n=434) 96 93 93 95 96 91 93 94 91 95 93 96 94 94 90 90 92 87i
Queens (n=428) 97 94 95 95 97 93 96 97 95 95 96 95 95 95 93 89 86 92h
Brooklyn (n=416) 95 95 96 95 97 91 94 97 97 96 95 95 95 93 91 86 87 94h
Staten Island (n=300) 97 98 96 99 96 96 98 96 96 96 98 95 96 94 95 94 93 94
By Level of Satisfaction with
Access-A-Ride
Satisfied (n=1467) 98 97 98 98 98 95 97 98 98 98 97 97 97 96 96 95 95 95
Dissatisfied (n=484) 89 86 89 87 88 84 85 90 84 84 88 89 87 85 82 76 78 82
Page 64
WBA Research
2191 Defense Highway • Suite 401 • Crofton, MD 21114 • (410)-721-0500 • www.WBAresearch.com
63
History Tables (continued)
Q38. Overall, how satisfied were you with the trip we just discussed? Would you say you were…?
This question asked of: Frequent/Occasional Users (n sizes for 2017)
Q38
This question asked of: Frequent/Occasional Users (n sizes for 2017)
Q38
This question asked of: Frequent/Occasional Users (n sizes for 2017)
Q38
Change in Overall Satisfaction with Last Access-A-Ride Trip
By Borough of Residence
“Very/Somewhat Satisfied”
Among Frequent/Occasional Users
1997-2017
1997 1998 1999 2000 2001 2003 2004 2005 2006 2007 2008 2011 2012 2013 2014 2015 2016 2017
% % % % % % % % % % % % % % % % % %
Total (n=2003) 84 85 86 85 85 86 86 87 85 87 85 86 89 85 86 81 83 85
Bronx (n=425) 81 84 85 85 88 88 83 83 84 86 88 87 89 88 85 81 80 85h
Manhattan (n=434) 85 85 87 80 83 88 85 83 84 85 80 86 84 80 84 82 80 86h
Queens (n=428) 86 87 84 85 84 85 85 85 83 87 86 87 89 84 88 81 84 84
Brooklyn (n=416) 83 84 86 85 86 85 87 89 85 88 84 85 90 84 87 81 83 84
Staten Island (n=300) 86 86 87 90 86 93 91 92 93 88 91 87 89 89 84 83 90 86
Change in Overall Satisfaction with Last Access-A-Ride Trip
By Borough of Residence
“Very Satisfied”
Among Frequent/Occasional Users
1997-2017
1997 1998 1999 2000 2001 2003 2004 2005 2006 2007 2008 2011 2012 2013 2014 2015 2016 2017
% % % % % % % % % % % % % % % % % %
Total (n=2003) 61 58 60 61 61 58 62 65 61 65 65 63 65 61 61 57 55 65h
Bronx (n=425) 54 56 57 65 64 64 60 61 58 65 67 65 68 66 54 57 54 66h
Manhattan (n=434) 63 57 56 59 57 59 62 61 58 61 60 61 60 60 62 59 54 63h
Queens (n=428) 68 60 63 62 58 59 61 64 60 64 68 65 66 60 65 54 55 63h
Brooklyn (n=416) 55 57 60 59 63 52 61 66 60 65 62 61 65 59 60 58 56 66h
Staten Island (n=300) 68 61 64 70 65 69 70 75 73 71 72 62 67 68 61 58 63 66
Change in Overall Satisfaction with Last Access-A-Ride Trip
By Borough of Residence
“Very/Somewhat Dissatisfied”
Among Frequent/Occasional Users
1997-2017
1997 1998 1999 2000 2001 2003 2004 2005 2006 2007 2008 2011 2012 2013 2014 2015 2016 2017
% % % % % % % % % % % % % % % % % %
Total (n=2003) 15 13 13 14 14 13 12 12 12 10 11 12 10 12 12 16 16 13i
Bronx (n=425) 17 15 15 14 12 12 16 16 13 12 11 12 10 11 13 16 19 13i
Manhattan (n=434) 14 13 12 18 16 10 13 16 13 14 15 12 13 17 15 15 18 11i
Queens (n=428) 13 12 15 14 15 15 13 13 13 9 9 10 9 14 10 17 14 14
Brooklyn (n=416) 15 14 13 13 13 14 10 9 12 9 11 14 8 11 11 16 16 13
Staten Island (n=300) 13 11 10 9 14 7 7 7 7 10 9 11 10 9 15 15 9 12
Page 65
WBA Research
2191 Defense Highway • Suite 401 • Crofton, MD 21114 • (410)-721-0500 • www.WBAresearch.com
64
History Tables (continued)
This question asked of: Frequent/Occasional Users (2001 n=2004; 2003 n=2006; 2004 n=2015; 2005 n=2012; 2006 n=2003; 2007 n=2010; 2008 n=2004; 2011 n=2001; 2012 n=2008; 2013 n=2002; 2014 n=2006; 2015
n=2003; 2016 n=2001, 2017 n=2003)
Q40C
Q40C. Based on your experience, how often does Access-A-Ride pick you up within the standard for on-time pickup? That is, no later than 30
minutes after the time of your scheduled pick up. Would you say they…?
Change in How Often Access-A-Ride Picks You Up Within the Standard for On-Time Pick-up
By Frequency of Use, Overall Satisfaction and Borough
Among Frequent/Occasional Users
1998-2017
Usually Sometimes
‘98 ‘99 ‘00 ‘01 ‘03 ‘04 ‘05 ‘06 ‘07 ‘08 ‘11 ‘12 ‘13 ‘14 ‘15 ‘16 ’17 ‘98 ‘99 ‘00 ‘01 ‘03 ‘04 ‘05 ‘06 ‘07 ‘08 ‘11 ‘12 ‘13 ‘14 ‘15 ‘16 ’17
% % % % % % % % % % % % % % % % % % % % % % % % % % % % % % % % % %
Total 63 52 57 57 57 59 56 57 52 53 53 53 53 43 36 3950
h30 37 34 34 35 33 36 33 37 36 37 35 36 43 49 44
39
i
User
Frequency
Frequent 61 49 55 54 56 56 54 55 50 51 52 51 52 41 34 3748
h32 40 37 38 37 35 37 36 39 38 38 38 36 45 51 46
41
i
Occasional 68 60 62 65 61 65 61 61 57 59 56 57 54 46 41 4654
h25 30 30 26 31 27 33 27 33 30 36 29 36 40 44 38 36
Overall
Satisfaction
Satisfied 68 59 64 65 65 67 64 64 60 61 59 59 59 51 43 4859
h27 33 30 30 31 28 31 29 33 31 33 32 33 39 47 42
34
i
Dissatisfied 47 31 34 28 30 30 29 28 25 26 31 30 28 21 21 21 25 39 50 48 49 48 54 51 50 56 54 50 48 47 54 53 4855
h
Borough of
Residence
Bronx 53 49 59 62 58 56 52 52 50 52 50 48 54 42 39 3651
h36 40 32 32 35 36 38 34 41 38 42 40 40 47 43 47
39
i
Manhattan 65 49 53 52 57 55 53 51 45 50 47 50 47 46 39 3747
h30 39 37 37 38 36 37 34 40 38 43 35 42 41 44 46 40
Queens 60 51 54 57 59 61 60 59 56 50 61 56 54 48 38 4453
h32 38 38 32 34 31 31 34 33 36 29 32 34 39 49 40 38
Brooklyn 64 52 56 54 53 57 55 54 49 53 48 53 51 38 32 3748
h30 38 37 37 37 34 39 36 40 36 40 35 35 46 53 45 41
Staten Island 79 66 72 72 72 74 67 75 69 70 61 57 58 49 40 50 57 18 24 24 25 24 21 27 21 27 25 29 35 33 38 49 36 31
Page 66
WBA Research
2191 Defense Highway • Suite 401 • Crofton, MD 21114 • (410)-721-0500 • www.WBAresearch.com
65
History Tables (continued)
This question asked of: Frequent/Occasional Users
Q40F
Q40F. Now think again about making reservations for a ride. In the past year, would you say that Access-A-Ride’s
Reservation Service has…?
Perceptions of Changes in Access-A-Ride Reservation Service
Among Frequent/Occasional Users
1998-2017
Year
1998 1999 2000 2001 2003 2004 2005 2006 2007 2008 2011 2012 2013 2014 2015 2016 2017
n= (1734) (1988) (2011) (2004) (2006) (2015) (2012) (2003) (2010) (2004) (2001) (2008) (2002) (2006) (2003) (2001) (2003)
% % % % % % % % % % % % % % % % %
Improved 27 35 34 31 41 36 33 32 33 33 28 30 68 54 42 36 37
Stayed about the same 53 47 55 59 51 55 58 57 57 57 59 60 27 39 50 53 54
Gotten worse 13 12 8 7 5 4 5 5 5 7 10 7 2 4 4 7 5i
Don’t know/Refused 7 6 4 4 3 4 5 5 5 3 3 3 3 3 3 3 4h
Page 67
WBA Research
2191 Defense Highway • Suite 401 • Crofton, MD 21114 • (410)-721-0500 • www.WBAresearch.com
66
History Tables (continued)
This question asked of:
Frequent/Occasional
Users who feel the
Reservation Service has
changed
Multiple Responses
Accepted; Select
Mentions
*Caution: Small Base
n/a=Data not available
Q40G
Q40G. In what ways has the Reservation Service (improved/gotten worse)?
Ways in Which the Access-A-Ride Reservation Service Has Improved/Gotten Worse
by Perceptions of Changes in Access-A-Ride Reservation Service
Among Frequent/Occasional Users
1998-2017
Improved
1998 1999 2000 2001 2003 2004 2005 2006 2007 2008 2011 2012 2013 2014 2015 2016 2017
n= (452) (683) (676) (599) (826) (706) (632) (623) (651) (629) (542) (604) (1340) (1042) (849) (721) (729)
% % % % % % % % % % % % % % % % %
Manner/Performance of
reservationistsn/a n/a n/a n/a n/a 25 25 26 30 30 36 35 30 31 29 40 39
Phone answering promptness 13 13 18 16 35 23 27 18 26 25 25 26 57 46 39 26 24
On-time performance 15 23 29 19 21 26 21 31 29 23 21 19 10 16 12 12 16
Reservationists’ knowledge n/a n/a n/a n/a n/a n/a - 2 4 9 11 7 7 6 6 8 5
Number of errors n/a n/a n/a n/a n/a n/a - <1 2 4 3 1 3 2 2 3 4
Can’t understand/Don’t speak
Englishn/a n/a n/a n/a n/a n/a - 1 1 2 2 <1 3 2 2 2 2
Reference to reservation system
(Unspecified)n/a n/a n/a n/a n/a n/a - 3 1 1 3 1 1 <1 1 1 1
Hours/Schedules/Routes 4 3 1 6 7 6 10 3 1 1 2 4 <1 <1 9 1 3h
Non-specific reference to service n/a n/a n/a n/a n/a n/a 3 10 15 10 10 6 1 1 3 1 2
Get put on hold too long/too
frequentlyn/a n/a n/a n/a n/a n/a n/a n/a n/a n/a n/a n/a n/a n/a n/a n/a n/a
Ways in Which the Access-A-Ride Reservation Service Has Improved/Gotten Worse
by Perceptions of Changes in Access-A-Ride Reservation Service
Among Frequent/Occasional Users
1998-2016
Gotten Worse
1998 1999 2000 2001 2003 2004 2005 2006 2007 2008 2011 2012 2013 2014 2015 2016 2017
n= (230) (247) (152) (155) (113) (91) (109) (115) (108) (149) (198) (159) (45)* (84) (88) (150) (110)
% % % % % % % % % % % % % % % % %
Manner/Performance of
reservationistsn/a n/a n/a n/a n/a n/a 2 24 26 21 38 30 11 16 11 18 16
Phone answering promptness 22 37 6 13 11 5 16 22 22 32 29 31 20 6 6 3 9
On-time performance 14 27 18 22 22 30 20 36 21 11 8 10 26 39 44 25 17
Reservationists’ knowledge n/a n/a n/a n/a n/a n/a - - 2 7 8 11 6 10 2 8 4
Number of errors n/a n/a n/a n/a n/a n/a 10 14 11 10 10 8 5 8 15 16 19
Can’t understand/Don’t speak
Englishn/a n/a n/a n/a n/a n/a - 5 4 6 7 5 4 4 2 2 1
Reference to reservation system
(Unspecified)n/a n/a n/a n/a n/a n/a 2 6 5 2 9 1 2 - - 4 3
Hours/Schedules/Routes 8 7 7 23 17 17 18 8 4 7 6 4 - 6 10 4 2
Non-specific reference to service n/a n/a n/a n/a n/a n/a - 1 - - 2 - 1 - - - -
Get put on hold too long/too
frequentlyn/a n/a n/a n/a n/a n/a - - 9 20 14 24 2 6 5 4 4
Page 68
WBA Research
2191 Defense Highway • Suite 401 • Crofton, MD 21114 • (410)-721-0500 • www.WBAresearch.com
67
History Tables (continued)
This question asked of: Frequent/Occasional Users1Starting in 2017, this question asked of: Frequent/Occasional Users who were picked-up2This question asked of: Frequent/Occasional Users who needed driver’s assistance
*Note: Changed in 2004 to “no later than 30 minutes after the time of your scheduled pick-up”
n/a=Data not available
Q21A, 23, 23A, 24, 30A-B
Q21A. Were you picked up by Access-A-Ride within the standard for on-time pickup? That is, no later than 30 minutes after the time you were
scheduled to be picked up.
Q23. Was the driver courteous?
Q23A. Did the driver operate the vehicle in a careful and safe manner?
Q24. Did the trip take a reasonable amount of time?
Q30A. Speaking again about your last Access-A-Ride trip, did you need the driver’s assistance after you were out of the vehicle?
Q30B. Did the driver assist you after you were getting out of the vehicle?
Overview of Performance of Key Elements of the Last Trip with Access-A-Ride
Among Frequent/Occasional Users
1997-2017
Year
1997 1998 1999 2000 2001 2003 2004 2005 2006 2007 2008 2011 2012 2013 2014 2015 2016 2017
On Time Pick-up n= (1540) (1734) (1988) (2011) (2004) (2006) (2015) (2012) (2003) (2010) (2004) (2001) (2008) (2002) (2006) (2003) (2001) (2003)
Picked up no later than 30 minutes after the
time you were scheduled to be picked up*82% 79% 74% 80% 82% 82% 84% 83% 81% 85% 84% 83% 85% 84% 79% 76% 78% 81%h
Courtesy of Driver1 n= (1540) (1734) (1988) (2011) (2004) (2006) (2015) (2012) (2003) (2010) (2004) (2001) (2008) (2002) (2006) (2003) (2001) (1998)
Driver was courteous 96% 96% 95% 95% 95% 96% 96% 95% 96% 95% 96% 96% 96% 96% 96% 96% 93% 96%h
Operation of Vehicle1 n= n/a (1734) (1988) (2011) (2004) (2006) (2015) (2012) (2003) (2010) (2004) (2001) (2008) (2002) (2006) (2003) (2001) (1998)
Driver operated the vehicle in a careful and safe
mannern/a 96% 96% 96% 96% 96% 97% 96% 96% 97% 97% 97% 96% 96% 97% 96% 95% 97%h
Trip Time1 n= n/a (1734) (1988) (2011) (2004) (2006) (2015) (2012) (2003) (2010) (2004) (2001) (2008) (2002) (2006) (2003) (2001) (1998)
Trip took a reasonable amount of time 86% 88% 89% 89% 90% 89% 89% 90% 91% 92% 89% 90% 91% 88% 87% 86% 85% 88%h
Driver’s Assistance1 n= (1540) (1734) (1988) (2011) (2004) (2006) (2015) (2012) (2003) (2010) (2004) (2001) (2008) (2002) (2006) (2003) (2001) (1998)
Needed driver’s assistance after out of the
vehicle43% 42% 42% 38% 27% 27% 27% 23% 22% 28% 30% 35% 34% 34% 36% 38% 37% 35%
Driver’s Offer of Assistance2 n= (679) (742) (837) (783) (597) (579) (565) (489) (459) (573) (598) (693) (680) (675) (723) (759) (725) (689)
Driver offered to assist 91% 95% 95% 89% 90% 89% 88% 88% 88% 89% 89% 90% 92% 92% 93% 93% 91% 91%
Page 69
WBA Research
2191 Defense Highway • Suite 401 • Crofton, MD 21114 • (410)-721-0500 • www.WBAresearch.com
68
History Tables (continued)
This question asked of: Total Sample
Q57
Q57. Besides calling for reservations or calling on the day of your trip, have you ever called Access-A-Ride to ask a question or
report a problem?
Ever Called Access-A-Ride To Ask a Question or Report a Problem
By User Frequency, Borough of Residence and Level of Satisfaction
1997-2017
Year
1997 1998 1999 2000 2001 2003 2004 2005 2006 2007 2008 2011 2012 2013 2014 2015 2016 2017
Total n= (1840) (2034) (2289) (2314) (2305) (2307) (2318) (2313) (2306) (2312) (2305) (2301) (2309) (2303) (2304) (2303) (2301) (2303)
43% 43% 43% 45% 40% 43% 42% 44% 42% 47% 44% 43% 51% 53% 58% 62% 64% 59%i
Frequent Users n= (1064) (1204) (1350) (1385) (1377) (1381) (1385) (1384) (1375) (1384) (1376) (1376) (1377) (1376) (1380) (1378) (1375) (1378)
53% 50% 48% 52% 46% 48% 48% 49% 50% 54% 51% 51% 60% 62% 64% 70% 72% 68%i
Occasional Users n= (476) (530) (638) (626) (627) (625) (630) (628) (628) (626) (628) (625) (631) (626) (626) (625) (626) (625)
37% 34% 37% 37% 32% 39% 33% 38% 35% 42% 36% 35% 42% 41% 52% 55% 55% 51%
Infrequent Users n= (300) (300) (301) (303) (301) (301) (303) (301) (303) (302) (301) (300) (301) (301) (298) (300) (300) (300)
23% 27% 29% 31% 30% 32% 33% 34% 24% 27% 27% 25% 30% 33% 41% 39% 47% 38%i
Satisfied (Frequent/Occasional Users) n= (1137) (1292) (1446) (1521) (1613) (1593) (1553) (1567) (1571) (1567) (1506) (1523) (1583) (1584) (1472) (1328) (1316) (1467)
42% 41% 39% 40% 37% 41% 39% 41% 41% 46% 43% 41% 50% 53% 55% 60% 61% 58%
Dissatisfied (Frequent/Occasional Users) n= (396) (427) (510) (405) (377) (401) (390) (406) (382) (373) (412) (433) (375) (354) (505) (607) (638) (484)
64% 59% 63% 68% 60% 63% 59% 63% 61% 69% 60% 63% 72% 72% 77% 78% 79% 80%
Bronx (Frequent/Occasional Users) n= (339) (364) (342) (432) (426) (426) (425) (426) (426) (423) (424) (424) (422) (425) (428) (428) (422) (425)
53% 51% 41% 48% 45% 42% 49% 49% 47% 51% 47% 47% 52% 56% 61% 69% 70% 67%
Manhattan (Frequent/Occasional Users) n= (325) (373) (406) (427) (425) (426) (430) (425) (426) (434) (428) (428) (437) (430) (425) (430) (427) (434)
48% 52% 52% 54% 46% 52% 50% 48% 51% 53% 51% 50% 60% 62% 66% 69% 70% 65%
Queens (Frequent/Occasional Users) n= (325) (375) (460) (426) (425) (426) (424) (426) (428) (424) (389) (427) (429) (419) (425) (425) (431) (428)
40% 44% 41% 48% 43% 48% 44% 46% 48% 51% 49% 43% 56% 54% 62% 65% 65% 57%i
Brooklyn (Frequent/Occasional Users) n= (325) (376) (478) (425) (426) (429) (433) (432) (423) (429) (481) (420) (421) (426) (424) (417) (419) (416)
53% 45% 50% 47% 41% 44% 40% 45% 43% 51% 45% 48% 53% 56% 58% 64% 67% 64%
Staten Island (Frequent/Occasional n= (226) (246) (302) (301) (302) (300) (303) (303) (300) (300) (282) (302) (299) (302) (304) (303) (302) (300)
Users) 42% 34% 34% 34% 31% 37% 33% 35% 35% 40% 41% 37% 51% 51% 56% 57% 58% 60%
Page 70
WBA Research
2191 Defense Highway • Suite 401 • Crofton, MD 21114 • (410)-721-0500 • www.WBAresearch.com
69
Methodology Charts
Using sampling techniques, we can estimate the responses of an entire population without having to interview everyone in the target
group. There are mathematical means to measure how close our random-sample estimate comes to the 'true' value of the population.
For the 2,303 interviews conducted for the Customer Satisfaction survey, we can expect the values from our sample to be within 2
percentage points of the true population value, 95 percent of the time. That means, if we get a value of 50 percent from our sample, we
can be 95 percent sure that the population value is somewhere between 48 and 52 percent. This measure of the difference of the
sample value from the true value, called the 'margin of error' will vary with the size of the sample and the results received.
The chart below details the margin of error by the user segments surveyed.
If the percentage found is around: 50%
40%
or
60%
30%
or
70%
20%
or
80%
10%
or
90%
1%
or
99%
Then, the standard error,
in percentage points would be:
Total Sample (n = 2303) ±2.0 ±2.0 ±1.9 ±1.6 ±1.2 ±0.4
Frequent Users (n = 1378) ±2.6 ±2.6 ±2.4 ±2.1 ±1.6 ±0.5
Occasional Users (n = 625) ±3.9 ±3.8 ±3.6 ±3.1 ±2.4 ±0.8
Infrequent Users (n = 300) ±5.7 ±5.5 ±5.2 ±4.5 ±3.4 ±1.1
For example, if a question in the study asked among the Total Sample yielded a percentage of 20%, then we can be
sure 95 out of 100 times that the true percentage would lie between 18.4% and 21.6% (20% ± 1.6 percentage points).
Page 71
WBA Research
2191 Defense Highway • Suite 401 • Crofton, MD 21114 • (410)-721-0500 • www.WBAresearch.com
70
Methodology Charts (continued)
The charts below detail the user segments surveyed, as defined by the frequency of AAR ride requests made between July and
September 2017:
This question asked of: Total Sample
July-September 2017
AAR User Segment # of Interviews Frequency of Ride Requests % of Registrants % of Requests
Frequent Users 1378 25+ requests May-July 5% 76%
Occasional Users 625 7-24 requests May-July 12% 18%
Infrequent Users 300 1-6 requests May-July 24% 6%
Total 2303
Completed Interviewsn= (2303)
Bronx 491
Frequent 301
Occasional 125
Infrequent 65
Brooklyn 490
Frequent 300
Occasional 125
Infrequent 65
Manhattan 492
Frequent 302
Occasional 125
Infrequent 65
Queens 490
Frequent 300
Occasional 125
Infrequent 65
Staten Island 340
Frequent 175
Occasional 125
Infrequent 40
Page 72
WBA Research
2191 Defense Highway • Suite 401 • Crofton, MD 21114 • (410)-721-0500 • www.WBAresearch.com
71
Methodology Charts (continued)
The survey data were weighted to better represent the actual number of active registrants in each borough (the universe). For
example, the number of completed surveys among frequent users in the Bronx for the 2017 study was 301, which represents 21.8% of
the total sample of 1,378 frequent users surveyed. However, in the real universe of 22,341 frequent users, the Bronx only represents
18.0%. Therefore, a weighting factor of less than one (in this case 0.825000) is applied to each respondent from the Bronx frequent
user segment so that in total they will now represent only 18.0% of the total. The weighting factors are determined by dividing the
target number of completes in a segment that will be representative of the actual universe (e.g., 248 actual Bronx frequent users) by
the number of surveys completed among that segment (e.g. 301 Bronx frequent user completes), which in this case gives you
0.825000.
Weights
Completes % of Completes Universe % of Uni. Target Weight
Bronx-Frequent 301 21.8% 4026 18.0% 248 0.825000
Brooklyn-Frequent 291 21.1% 8187 36.6% 505 1.735315
Manhattan-Frequent 309 22.4% 3009 13.5% 186 0.600635
Queens-Frequent 303 22.0% 5481 24.5% 338 1.115742
Staten Island-Frequent 174 12.6% 1638 7.3% 101 0.580646
Total-Frequent 1378 22341 1378
Bronx-Occasional 124 19.8% 4599 17.5% 110 0.883603
Brooklyn-Occasional 125 20.0% 9704 37.0% 231 1.849508
Manhattan-Occasional 125 20.0% 3784 14.4% 90 0.721201
Queens-Occasional 125 20.0% 6265 23.9% 149 1.194061
Staten Island-Occasional 126 20.2% 1882 7.2% 45 0.355848
Total-Occasional 625 26234 625
Bronx-Infrequent 67 22.3% 5761 16.6% 50 0.744288
Brooklyn-Infrequent 65 21.7% 12896 37.2% 112 1.717352
Manhattan-Infrequent 63 21.0% 4714 13.6% 41 0.647689
Queens-Infrequent 65 21.7% 8629 24.9% 75 1.149119
Staten Island-Infrequent 40 13.3% 2658 7.7% 23 0.575192
Total-Infrequent 300 34658 300
Page 73
WBA Research
2191 Defense Highway • Suite 401 • Crofton, MD 21114 • (410)-721-0500 • www.WBAresearch.com
72
Questionnaire
Page 74
WBA Research
2191 Defense Highway • Suite 401 • Crofton, MD 21114 • (410)-721-0500 • www.WBAresearch.com
73
Questionnaire
Page 75
WBA Research
2191 Defense Highway • Suite 401 • Crofton, MD 21114 • (410)-721-0500 • www.WBAresearch.com
74
Questionnaire
Page 76
WBA Research
2191 Defense Highway • Suite 401 • Crofton, MD 21114 • (410)-721-0500 • www.WBAresearch.com
75
Questionnaire
Page 77
WBA Research
2191 Defense Highway • Suite 401 • Crofton, MD 21114 • (410)-721-0500 • www.WBAresearch.com
76
Questionnaire
Page 78
WBA Research
2191 Defense Highway • Suite 401 • Crofton, MD 21114 • (410)-721-0500 • www.WBAresearch.com
77
Questionnaire
Page 79
WBA Research
2191 Defense Highway • Suite 401 • Crofton, MD 21114 • (410)-721-0500 • www.WBAresearch.com
78
Questionnaire
Page 80
WBA Research
2191 Defense Highway • Suite 401 • Crofton, MD 21114 • (410)-721-0500 • www.WBAresearch.com
79
Questionnaire
Page 81
WBA Research
2191 Defense Highway • Suite 401 • Crofton, MD 21114 • (410)-721-0500 • www.WBAresearch.com
80
Questionnaire
Page 82
WBA Research
2191 Defense Highway • Suite 401 • Crofton, MD 21114 • (410)-721-0500 • www.WBAresearch.com
81
Questionnaire
Page 83
WBA Research
2191 Defense Highway • Suite 401 • Crofton, MD 21114 • (410)-721-0500 • www.WBAresearch.com
82
Questionnaire