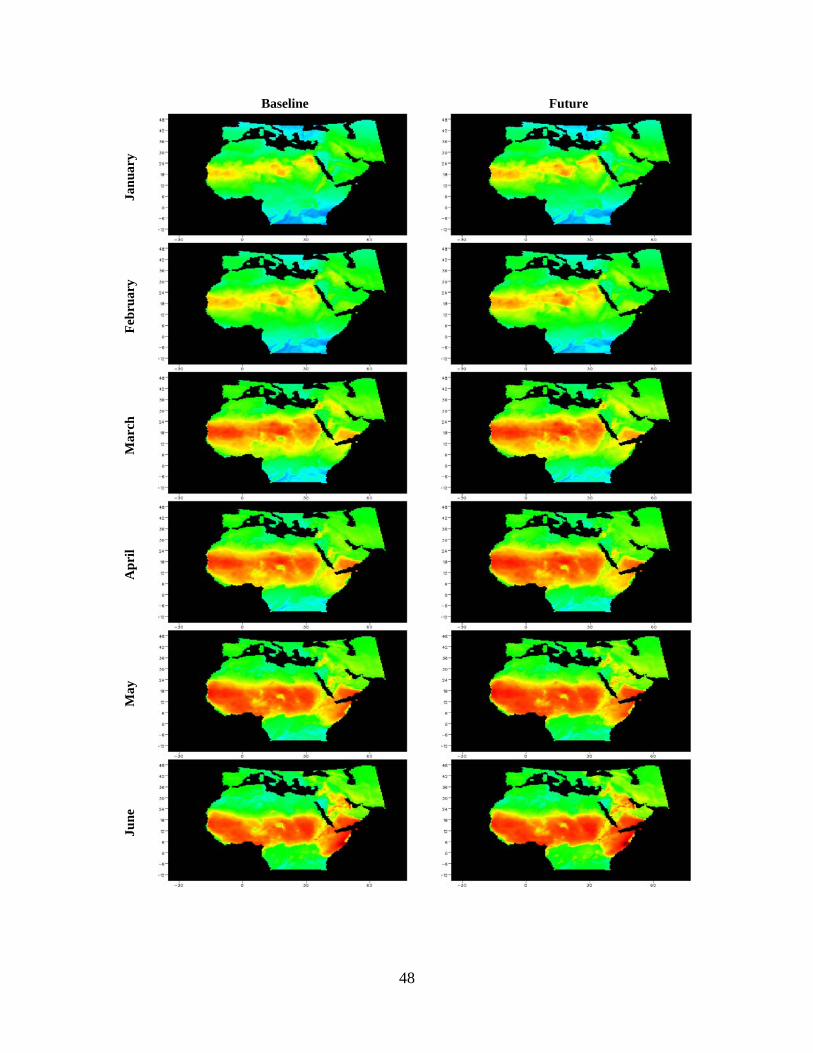
36 3.2.2. Precipitation Figure 3.6, Figure 3.7, and Figure 3.8 compare the precipitation between the baseline and future periods for Q0, Q2, and Q6 respectively. As can be seen, there is a consensus among the three scenarios on rainfall reduction over the Mediterranean shores during winter. The differences between the three scenarios are generally small.
Transcript
36
3.2.2. Precipitation
Figure 3.6, Figure 3.7, and Figure 3.8 compare the precipitation between the
baseline and future periods for Q0, Q2, and Q6 respectively. As can be seen,
there is a consensus among the three scenarios on rainfall reduction over the
Mediterranean shores during winter. The differences between the three
scenarios are generally small.
37
Baseline Future
Jan
uary
F
ebru
ary
Mar
ch
Ap
ril
May
Ju
ne
38
July
A
ugu
st
Sep
tem
ber
O
ctob
er
Nov
emb
er
Dec
emb
er
Figure 3.6 Simulated Baseline and Future Mean Monthly Precipitation for (mm/month) Q0 White areas are off-scale (> 300 mm/month)
39
Baseline Future
Jan
uary
F
ebru
ary
Mar
ch
Ap
ril
May
Ju
ne
40
July
A
ugu
st
Sep
tem
ber
O
ctob
er
Nov
emb
er
Dec
emb
er
Figure 3.7 Simulated Baseline and Future Mean Monthly Precipitation (mm/month) for Q2 White areas are off-scale (> 300 mm/month)
41
Baseline Future
Jan
uary
F
ebru
ary
Mar
ch
Ap
ril
May
Ju
ne
42
July
A
ugu
st
Sep
tem
ber
O
ctob
er
Nov
emb
er
Dec
emb
er
Figure 3.8 Simulated Baseline and Future Mean Monthly Precipitation (mm/month) for Q6 White areas are off-scale (> 300 mm/month)
43
3.2.3. Potential Evapotranspiration
Figure 3.9, Figure 3.10, and Figure 3.11 compare PET between the baseline and
future periods for Q0, Q2, and Q6 respectively. There is a consensus among the
three scenarios on PET over the Arab region especially during summer. The
differences between the three scenarios are generally small.
44
Baseline Future
Jan
uary
F
ebru
ary
Mar
ch
Ap
ril
May
Ju
ne
45
July
A
ugu
st
Sep
tem
ber
O
ctob
er
Nov
emb
er
Dec
emb
er
Figure 3.9 Simulated Baseline and Future Mean Monthly PET (mm/month) for Q0
46
Baseline Future
Jan
uary
F
ebru
ary
Mar
ch
Ap
ril
May
Ju
ne
47
July
A
ugu
st
Sep
tem
ber
O
ctob
er
Nov
emb
er
Dec
emb
er
Figure 3.10 Simulated Baseline and Future Mean Monthly PET (mm/month) for Q2
48
Baseline Future
Jan
uary
F
ebru
ary
Mar
ch
Ap
ril
May
Ju
ne
49
July
A
ugu
st
Sep
tem
ber
O
ctob
er
Nov
emb
er
Dec
emb
er
Figure 3.11 Simulated Baseline and Future Mean Monthly PET (mm/month) for Q6
50
3.2.4. Actual Evaporation
3.2.5. Runoff
51
4. Conclusions and Recommendations
This report presented an approach to develop detailed climate change scenarios
for the Arab region. The report documented the process of developing the
scenarios and presented a preliminary analysis of the changes over the Arab
region. This study represents the first application and analysis of a novel
perturbed physics ensemble approach using regional models for the Arab region.
While the development of this regional climate model represents a major step
forward, further work is required to understand the behaviour of the climate
system as represented by the regional climate ensembles. This may also provide
a deeper physical understanding of the differences between the UK Met Office
and IPCC ensembles.
The current scientific recommendation is not to rely on a single “best” model but
to ensure that a number of models are used to encompass the full range of
possible future climates and base decisions on being able to robustly
accommodate this variation. To ensure a better characterisation of the
uncertainty, it is recommended that the current work is extended to a larger
ensemble that is comparable to the IPCC ensemble (approx. 13-20 members).
This would also strengthen the validity of the results obtained to date. While
future work should definitely include the extension of this work to include
SRES emission scenarios and RCP scenarios and extension of the projections to
2100 should also be considered.
This ensemble-based probabilistic approach to regional climate modelling paves
the way for a probabilistic or risk-based approach to water resources
management. The uncertainty in climate projections should be accepted as part
of integrated water resources planning process based on a range of projections
and scenarios. Current practice is to assume these are equally likely to derive a
statistical interpretation. The advantage of this risk-based approach is that
52
climate change risks can be treated alongside other risks. This approach is
recommended, for example, by the EU for including climate change in context of
the Water Framework Directive.
Integration of these results with results from other regional climate models based
on the same or other GCMs and emission scenario combinations will allow better
characterization of uncertainty cascade. Thus, this study would complement
rather than replicate other studies using other downscaling methods including
other RCMs.
The provided scenarios also pave the way for hydrological impact analysis for the
region. Rainfall and PET data can be inputs for hydrological models either at the
basin-scale (for some of the region main basins such as the Nile, Euphrates,
etc.) or at the region scale if a distributed model of the region (such as VIC) is to
be constructed for the region. The variables presented can help also in assessing
impacts on agriculture, on water demands, and on several other sectors,
especially those related to water resources. Some of the variables (e.g. runoff
and evaporation) can be compared to hydrological model outputs and can be
used to validate and improve the RCM itself.
53
References
Allen, R.G., Pereira, L.S., Raes, D. and Smith, M., 1998. Crop evapotranspiration: Guidelines for computing crop water requirements. FAO Irrigation and Drainage Paper No. 56. Food and Agriculture Organization of the United Nations, Rome.
Buontempo, C. et al., 2010. The impact of uncertainties in climate impacts assessments: the case of the Nile basin. In: H.G. Brauch et al. (Editors), Coping with Global Environmental Change, Disasters and Security – Threats, Challenges, Vulnerabilities and Risks. Hexagon Series on Human, Environmental Security and Peace (HESP). Springer-Verlag (in press), Berlin – Heidelberg – New York.
Elshamy, M.E., Sayed, M.A.-A. and Badwy, B., 2009. Impacts of climate change on Nile flows at Dongola using statistically downscaled GCM scenarios. Nile Water Science & Engineering Magazine, 2(Special issue on Water & Climate): 1-14.
Hadley Centre, 2001. The Hadley Centre regional climate modelling system - PRECIS: Providing Regional Climates for Impacts Studies, UK Meteorological Office, Bracknell, UK.
Hough, M.N. and Jones, R.J.A., 1997. The UK Met Office rainfall and evaporation calculation system: MORECS version 2.0 – an overview. Hydrology and Earth System Sciences, 1: 227-239.
IPCC, 2000. Special Report on Emission Scenarios. Cambridge University Press, Cambridge, 570 pp.
IPCC, 2007. Climate Change 2007: The Physical Science Basis - Summary for Policy Makers: Contribution of Working Group I to the Fourth Assessment Report of the Intergovernmental Panel on Climate Change. www.ipcc.ch.
Jones, R.G., Murphy, J.M., Noguer, M. and Keen, A.B., 1997. Simulation of climate change over europe using a nested regional-climate model. II: Comparison of driving and regional model responses to a doubling of carbon dioxide. Quarterly Journal of the Royal Meteorological Society, 123(538): 265-292.
Moss, R. et al., 2008. Towards New Scenarios for Analysis of Emissions, Climate Change, Impacts, and Response Strategies. Intergovernmental Panel on Climate Change, Geneva, pp. 132.
Murphy, J.M. et al., 2009. UK Climate Projections Science Report: Climate change projections, Met Office Hadley Centre, Exeter, UK.