34
Final report The carbon impact of bottling Australian wine in the UK: PET and glass bottles Project code: RTL063-001 Research date: 2007 Date: March 2008

Final report
The carbon impact of bottling Australian wine in the UK: PET and glass bottles
Project code: RTL063-001 Research date: 2007 Date: March 2008

WRAP works in partnership to encourage and enable businesses and consumers to be more efficient in their use of materials and recycle more things more often. This helps to minimise landfill, reduce carbon emissions and improve our environment.
Written by: Best Foot Forward Ltd.
Front cover photography: Examples of Wine bottles WRAP and Best Foot Forward believe the content of this report to be correct as at the date of writing. However, factors such as prices, levels of recycled content and regulatory requirements are subject to change and users of the report should check with their suppliers to confirm the current situation. In addition, care should be taken in using any of the cost information provided as it is based upon numerous project-specific assumptions (such as scale, location, tender context, etc.). The report does not claim to be exhaustive, nor does it claim to cover all relevant products and specifications available on the market. While steps have been taken to ensure accuracy, WRAP cannot accept responsibility or be held liable to any person for any loss or damage arising out of or in connection with this information being inaccurate, incomplete or misleading. It is the responsibility of the potential user of a material or product to consult with the supplier or manufacturer and ascertain whether a particular product will satisfy their specific requirements. The listing or featuring of a particular product or company does not constitute an endorsement by WRAP and WRAP cannot guarantee the performance of individual products or materials. This material is copyrighted. It may be reproduced free of charge subject to the material being accurate and not used in misleading context. The source of the material must be identified and the copyright status acknowledged. This material must not be used to endorse or used to suggest WRAP's endorsement of a commercial product or service. For more detail, please refer to WRAP’s Terms & Conditions on its web site: www.wrap.org.uk

Executive summary This report analyses the carbon dioxide (CO2) emissions from bulk importing wine from Australia and bottling it in the UK. The study considers a comparison between using Amcor-designed PET bottles versus typical glass bottles used by UK-based bottlers. One challenge in this study was determining the conditions for comparing PET and glass. Several variables were considered and are explained in the body of this report, but the core comparison was between:
Amcor-produced PET bottle = 54g with 0% recycled content
Typical glass bottle available in UK = 496g with 81% recycled content
Lightweight glass bottle available in UK1 = 365g with 81% recycled content
One significant element which was considered was the treatment of empty containers at end-of-life scenarios included landfill disposal and recycling2. The overall results, compared to a UK-produced very light glass bottle are shown in Figures 1.2 and 1.3, and summarised below Figure 1.1 Emissions per bottle for each bottle type
Emissions per bottle (gCO2)3
Average Range Bottle Type
Without end-of-life recycling 54g PET 474 474-474
365g glass 493 450-517 496g glass 578 519-610
With end-of-life average recycling rates 54g PET 446 446-446
365g glass 453 416-472 496g glass 523 476-550
Figure 1.2 Total CO2 emissions: Bulk shipped Australian wine bottled in 496g and 365g European produced glass bottles, in 356g UK produced glass bottle, and in 54g PET bottles. The black lines depict the range of CO2 emissions attributable to glass production (see Appendix A).
379
474493
578
0
100
200
300
400
500
600
700
81% recycled content 81% recycled content 0% recycled content 92% recycled content
g CO
2/bottle
Manufacture of
496g glass bottle
Manufacture of
54g PET bottle
Road transport
Manufacture of
365g glass bottle
Manufacture of
356g glass bottle
Bulk shipment 1 The remit of this study was to compare the Amcor manufactured 54g PET bottle with the lightest bottle currently manufactured in the UK, as this would compare products manufactured in the UK. It was not part of this study’s remit to compare the PET bottle with the lightest available glass bottle, which is circa 340g and made in France (see page 11). 2 End-of-Life detailed considerations were outside the scope of the study. Landfilled has been treated as ‘loss’ of material from the system, while recycling has been treated as recovery of resources back into the system. 3 Only one source for PET was selected, as the aim of this study was to assess the Amcor manufactured 54g PET bottle only versus variations of glass wine bottle weights.
PET and glass bottles 1

Figure 1.3 Total CO2 emissions: Bulk shipped Australian wine bottled in 496g and 365g European produced glass bottles, in 356g UK produced glass bottle, and in 54g PET bottles (including CO2 savings from recycling at end-of-life)4. The black lines depict the range of CO2 emissions attributable to glass production (see Appendix A).
Manufacture of
496g glass bottle
Manufacture of
54g PET bottle
road transport
Manufacture of
365g glass bottle
Manufacture of
356g glass bottle
Bulk shipment
356
446523
453
0
100
200
300
400
500
600
81% recycled content 81% recycled content 0% recycled content 92% recycled content
g CO
2/bottle
The results show that the most significant impacts on the distribution system were the bulk shipment from Australia and the manufacture of the bottles. Once the wine arrives, the UK produced 356g glass bottle is the lightest glass option currently available for UK-bottling and distribution. The PET and lightweight glass bottles at 365g have similar overall emissions. The lightweight glass bottle is more efficient in production than the PET bottle, but importing empty glass bottles from Europe is less efficient than transporting empty PET bottles within the UK. The PET bottle also makes some savings during UK wine distribution because of its low weight, but the distances involved are short so the extent of these savings is relatively low (road transport accounts for a maximum of 9% of all emissions). Glass bottles have higher recycled content than PET, which is zero under current production systems. Also, existing systems for glass recycling are more sophisticated than for PET recycling, so additional carbon savings are obtained for glass when end-of-life impacts are considered. Two further comparisons are made in this report:
UK-produced glass bottles (typical and company specific) versus PET bottles; and
PET bottles with different recycled content.
4 CO2 savings derived from recycling PET were calculated from data provided by Amcor and differs from publicly available data. In general, ‐’1.5 tonnes of CO2 are saved per tonne of plastic recycled. Using Amcor data, approximately 2.5 tonnes of CO2 are saved per tonne of PET recycled.
PET and glass bottles 2

Contents 1.0 Introduction and scope ............................................................................................................ 4
1.1 Data quality assessment ........................................................................................................4 2.0 Bulk shipment of wine from Australia to the UK: CO2 emissions from wine imported ........... 6 3.0 PET bottles: CO2 emissions from manufacture ........................................................................ 8 4.0 Glass bottles: CO2 emissions from manufacture...................................................................... 9 5.0 PET bottles: CO2 emissions from road transport................................................................... 11 6.0 Glass bottles: CO2 emissions from road transport ................................................................ 12 7.0 Comparison of PET versus glass bottling ............................................................................... 13
7.1 End-of-life ...........................................................................................................................13 7.2 Lightweighting bottles..........................................................................................................14 7.3 Relative contributions to CO2 emissions.................................................................................15
8.0 UK produced glass bottles versus PET bottles ....................................................................... 17 8.1 PET bottles with varying recycled content .............................................................................18
9.0 Conclusion.............................................................................................................................. 20 Appendix A: Assumptions used in this study .................................................................................... 21
Bulk wine shipping ...........................................................................................................................21 Bottled wine transport ......................................................................................................................21
PET bottle weight provided by Amcor ...................................................................................21 Tertiary packaging ...........................................................................................................................23 Embodied energy of glass bottles......................................................................................................24
1st approach .......................................................................................................................25 2nd approach......................................................................................................................25 3rd approach.......................................................................................................................25 Combination of the three approaches ...................................................................................26
Embodied energy of PET bottles .......................................................................................................26 Recycling.........................................................................................................................................28
Appendix B: Total CO2 emissions ...................................................................................................... 29 Appendix C: Comparison of CO2 emissions for glass bottles including export of cullet to France.... 30 Appendix D: Comparison of other bottle weights ............................................................................. 31
PET and glass bottles 3
1.0 Introduction and scope This analysis was undertaken for Amcor PET packaging (now known as Artenius PET Packaging) as part of a project part-funded by the government’s WRAP programme. Amcor has its is headquarters in Melbourne, Australia and is a global leader in manufacturing metal, plastic and paper packaging materials. Amcor is the largest PET manufacturer in the world. At its UK division, Amcor PET Packaging produces injection moulded pre-forms and blow-moulded bottles for the beverage market. This study analyses the carbon dioxide (CO2) emissions attributable to bottling wine in Amcor-designed PET bottles versus conventional glass bottles. The wine is produced in Australia and shipped in bulk using 24,000 litre Flexitanks to the UK where the bottling occurs. Two types of bottles have been used in this analysis: average wine glass bottles weighing 496 grams and a newly developed wine PET bottle weighing 54 grams. The study includes the CO2 emissions arising from:
Transportation of empty Flexitanks to the winery in Australia;
Transportation of filled Flexitanks from the winery to an Australian port;
Transportation of filled Flexitanks by ship from Australia to the UK;
Transportation of filled Flexitanks from the UK port to the bottling plant;
Production of the different types of bottles and pallets used in transport;
Transportation of empty bottles from the manufacturer to the bottling plant;
Transportation of filled bottles from the bottling plant to a distribution centre;
Transportation of filled bottles from the distribution centre to the retail outlet; and
Transportation of filled bottles from the retail outlet to the customers’ homes.
It does not include the CO2 emissions arising from:
Cultivation of grapes and production of wine;
Production of labels or corks (stoppers) used for the bottles;
Disposal of used Flexitanks;
Filling operations;
Secondary packaging of bottles (primarily shrink wrap);
Disposal of filled bottle packaging, such as pallets or wine cases; and
Incineration of the different types of bottles at waste management or energy recovery facilities.
For a full explanation of the assumptions used in this report, please see Appendix A. 1.1 Data quality assessment The following data were provided by Amcor:
Weight and dimensions of one PET bottle;
Weight and composition of an empty load of PET bottles;
Weight and composition of a full load of PET bottles;
Distance from PET manufacturer to bottling plant;
Distance from bottling plant to distributor; and
Composition and use of secondary and tertiary packaging of empty PET bottles.
PET and glass bottles 4

The following data were provided by Fosters Group:
Transport route of wine from Australian winery to UK bottling plant;
Distance from bottling plant to distributor;
Weight of full wine cases for both PET and glass; and
Composition of a full load of both PET and glass bottles.
The following data were provided by Corby Bottlers:
Origin of glass bottles used at the bottling plant; and
Secondary use of pallets initially used to transport empty glass bottles.
The following data were provided by Quinn Glass:
Energy use for manufacture of glass bottles at their UK facility.
There were slight discrepancies in the data obtained from the different sources and certain assumptions were made (see Appendix A). Overall, the quality of the data was good.
PET and glass bottles 5

2.0 Bulk shipment of wine from Australia to the UK: CO2 emissions from wine imported
Between 42 and 50% of the CO2 emissions identified in this study arise from bulk shipping Australian wine to the UK. This accounts for 235g CO2 / bottle.
Data on the origin of the wine to be packaged in polyethylene terephthalate (PET) bottles and on the route taken by the wine shipped in bulk from Australia were provided by Fosters Group. Several online calculators were used to determine distances between the different localities (see Appendix A). It was assumed that bulk transportation of wine was consistent for glass and PET bottling. The most common container used for long-distance wine bulk transport is the Flexitank5. Flexitanks are soft, disposable plastic bags with a nozzle opening for filling and emptying operations. They are inserted into typical 20 foot rigid containers and are used for transporting non-hazardous liquids. The Flexitanks used in this study weigh 80 kg each and have a carrying capacity of 24,000 litres. When empty, twenty Flexitanks fit in a 20 foot container. The Australian wine used in this analysis originates from the Barossa Valley region of Southern Australia, more specifically from Nuriootpa. Barossa Valley is one of the best known wine regions in Australia6. Wine produced at Barossa Valley is loaded onto Flexitanks which have previously been placed in 20 foot containers (TEU). The filled Flexitanks are taken by road to the docks at the Port of Adelaide. From Adelaide they are carried by large container ships, through the Suez Canal, to the Port of Felixstowe. At Felixstowe the Flexitanks are loaded onto diesel 38 t Artic lorries and transported by road to Corby Bottlers at Corby, Northamptonshire, where they are emptied and disposed of. Figure 2.1 illustrates the route described above: Figure 2.1: Route taken by wine filled Flexitanks from Barossa Valley to Corby The wine bottles used for this study have a volume of 75 cl. Figure 2.2 breaks down this bulk transportation process and allocates CO2 emissions to each leg of the journey, and figure 2.3 shows these results on a ‘per bottle’ basis:
5 WRAP, 2007. The life cycle emissions of wine imported to the UK. Oakdene Hollins Ltd., United Kingdom. 6 http://www.barossa.com
PET and glass bottles 6

Figure 2.2: CO2 emissions: Transportation routes, distances and load weights of Australian wine imported in bulk to the UK.
Container / Route Distance (km) Vehicle Load
weight (t)
kg CO2/ load
Flexitank from Barossa Valley, Australia to Corby, UK 20,150 - - 7,586
Of which…
Twenty empty Flexitanks to the winery 71 38 t Artic 1.6 57
Filled Flexitank from winery to Adelaide 71 38 t Artic 24.08 81
TEU containers + Filled Flexitank from Adelaide to Felixstowe 19,824 Large
Container Ship
26.08 7,238
Filled Flexitank from Felixstowe to Corby 184 38 t Artic 24.08 210
Figure 2.3: CO2 emissions: Transportation routes, distances, load volumes and equivalent bottles of Australian wine imported in bulk to the UK.
Container / Route Distance (km)
Load volume (l)
Equivalent bottles
Total kg CO2
g CO2 per 75cl wine (bottle)
Flexitank from Barossa Valley, Australia to Corby, UK 20,150 ‐ ‐ 7,586 235
Of which…
Twenty empty Flexitanks to the winery 71 480,000 640,000 57 0.09
Filled Flexitank from winery to Adelaide 71 24,000 32,000 81 2.53
TEU containers + Filled Flexitank from Adelaide to Felixstowe 19,824 24,000 32,000 7,238 226.19
Filled Flexitank from Felixstowe to Corby 184 24,000 32,000 210 6.56
Although bulk freight shipments are the most carbon efficient method of transport, the distance from Australia to the UK is great and therefore the CO2 emissions attributable to this shipment are between 42 and 50% of the total CO2 emissions of each bottle (using the parameters analysed in this study).
A previous study (The life cycle emissions of wine imported to the UK) commissioned by WRAP analysing the benefits of bulk importing wine states that there is “huge potential for reducing CO2 emissions during the transportation and packaging stages in the total life cycle for wine imported into the UK”. The most significant factor for reducing emissions of wine transported from Australia is bulk shipping. On average 164g of CO2 per bottle are saved when importing Australian wine in bulk as opposed to importing pre-bottled Australian wine.
Savings from bulk shipping
PET and glass bottles 7
3.0 PET bottles: CO2 emissions from manufacture
The manufacture of a 54g virgin PET bottle releases 222g CO2.
The production of PET bottles has three main phases. First, the polymer is synthesised from crude oil usually using antimony trioxide as a catalyst and pure PET flakes are produced. Then, small and dense test-tube like pre-forms which weigh the same as the final bottle are injection moulded from the PET flakes. Finally, the bottles are formed by stretch-blow moulding of these pre-forms7. These industrial processes require energy derived from electricity or other fuels, and therefore will have CO2 emissions associated with them. When PET bottles are made from recycled PET flakes instead of virgin PET, less energy is required, as the first phase (crude oil synthesis) is avoided. The Association of Plastic Manufacturers in Europe holds data on the average fuel mix and fuel quantity used to obtain the energy required to make PET bottles within Europe. These data were used to determine the amount of CO2 emissions arising from the manufacture of a 54g PET bottle. On average, the production of a 54g PET bottle in Europe emits 222gCO2. This includes extraction and transport of raw materials as well as material and energy inputs and outputs in the form of emissions to air. This total increases to 223gCO2 per bottle when use of tertiary packaging to transport bottles from the manufacturer to the bottler is included in the calculations. The PET bottles are manufactured in the UK by Amcor and shipped to the bottling plant at Corby where they are filled. As PET is shatter proof, accidental breakage during filling is avoided. However, there is a 2% loss of bottles during filling due to under-filling (1%), as it is not practical to remove the bottle cap once it has been applied, and to scuffing (1%)8. These losses are not included in this analysis since they are equal to the losses occurring during glass bottle filling. Amcor produced PET bottles are palletized using High Density Polyethylene (HDPE) pallets which are returned to the manufacturing plant for reuse. According to Amcor, HDPE pallets have a useful lifetime of fifty cycles, that is, they can be reused up to fifty times. The CO2 emissions arising from the manufacture of the HDPE pallets used by Amcor is included in the total emissions arising from manufacturing PET bottles. Return transport of the pallets is not included in this analysis as data were incomplete for pallets used in transporting glass bottles.
7 Petcore, 2004. World Largest PET Life Cycle Assessment – One-way PET levels with refillable glass. 8 Personal Communication, Peter Roberts, Corby Bottlers. (21.08.07)
PET and glass bottles 8

4.0 Glass bottles: CO2 emissions from manufacture
The manufacture of a 496g glass bottle releases 293 gCO2. The manufacture of a 365g glass bottle releases 216 gCO2.
Traditionally, glass has been used to package wine because, being an inert material it does not alter the chemical properties of wine. The production of glass bottles includes the extraction and transport of raw materials and the melting of these materials to produce glass. Melting the raw materials requires large amounts of energy, usually provided by fossil fuels which when combusted release CO2. When glass is recycled, however, there is no need for extraction of raw materials and the overall temperature needed to melt glass cullet (broken or waste glass returned for recycling) is significantly less than that needed to melt ‘virgin’ raw materials. Glass wine bottles can be recycled indefinitely9. There is no readily available ‘standard’ glass bottle to use in this study. There are three key variables that need to be considered: weight of bottle, location of manufacture and recycled content. To treat these in turn, the authors used the following approach: 1 Bottle weight –Wine glass bottles vary in weight. The UK market weighted average wine bottle weight is 496g but recently much work has focussed on the opportunity to lightweight glass bottles and the lightest bottle available is 300g10 (see Appendix D). In this report, glass wine bottles weighing 496g (heavy) are analysed for the main comparison of the study as this is the weight of the UK average wine bottle. Additionally, 365g (light) were analysed as this is the weight of the lightest bottle used at Corby Bottlers. 2 Location of manufacture – the carbon intensity of fuel and electricity varies between countries, as does the efficiency of the manufacturing process and transport distances of materials and finished products. Best Foot Forward (BFF) were briefed to consider the ‘typical’ UK glass bottle, so Corby bottlers were contacted to determine the mix of bottles used at their facility. Corby bottlers use bottles from several European suppliers. On average about 55% of the bottles are sourced from France, 15% from Belgium, 20% from Bulgaria, and the remainder 10% from the UK. It was assumed that the British glass bottles are non-site specific, and an average carbon intensity for UK produced bottles was used. There is limited or no availability on energy used by the glass industry from different European countries, so three approaches were used to determine CO2 emissions arising from bottle manufacture in each country (see Appendix A). BFF recognise that this is not an exact country comparison, but more detailed investigation was outside the scope of this study. The manufacture of European sourced bottles was assumed to be Lyon in France, Brussels in Belgium and Sofia in Bulgaria so transport distances were calculated from these locations to the bottling plant at Corby where they are filled. There is about a 2% loss due to under-fill (1%) and to breakage (1%)11 but this loss was not included in the calculations because it is the same as the loss incurred by filling PET bottles. 3 Recycled content – the recycled content of glass also varies by region. Average green glass bottles manufactured in Europe have a weighted average recycled content of about 80.9%, ranging from 30% in Bulgaria12 to 99% in France13. The energy required to make the 496g and 365g wine glass bottles analysed here was derived using several approaches and data sources which are currently available. Consequently, different results were obtained depending on the approach taken (see Appendix A) and the range of results obtained is shown in Figure 3.1. BFF consider this approach to be most robust and transparent when conducting an analysis of this type which depends on several secondary data sources.
9 Wasteonline, 2006. Glass Recycling Information Sheet. Available from: http://www.wasteonline.org.uk/resources/InformationSheets/Glass.htm 10 WRAP, 2006. More Bulk. Less Bottle. The Wrap Wine Initiative. Banbury, United Kingdom. 11 Personal Communication, Peter Roberts, Corby Bottlers. (21.08.07) 12 Personal Communication, Peter Roberts, Corby Bottlers. (22.08.07) 13 Bilan Carbone, 2007. Guide des Facteurs d’Emissions. France.
PET and glass bottles 9

Figure 4.1 Emissions arising from glass bottle manufacture
low
low
medium
medium
high
high
0
50
100
150
200
250
300
350
496g glass 365g glass
g CO
2/bottle
The totals calculated include the use of tertiary packaging to transport the bottles from the manufacturer to the bottler but not the return journey of the pallets, as the destination of used pallets varies considerably and data were not readily available. Glass bottles are palletized using Euro-pallets made from wood. Pallets from all French sourced glass are returned as full loads to the bottle manufacturer, Belgium pallets are reused within the distribution system of Corby bottlers and Bulgarian pallets are used for exporting to Nordic markets. It was assumed that on average, wooden pallets have a useful lifetime of 10 cycles, that is, they can be reused up to ten times14. The CO2 emissions arising from the manufacture of the wooden pallets used by the different bottle manufacturers is included in the total emissions arising from manufacturing glass bottles. The attributable CO2 emissions for each bottle weight vary depending on the approach used. In this study, the medium estimate is commonly referred to but when comparing glass bottles to PET bottles the range is depicted graphically by a black line. The values represented in figure 4.1 do not include CO2 savings from any waste management activity at the end of their useful life. CO2 savings from recycling are covered in later sections of this report. There are significant CO2 savings related to recycling glass which impact upon the CO2 emissions attributable to glass production.
14 http://www.ciwmb.ca.gov/Packaging/Wood/pallet.htm
PET and glass bottles 10

5.0 PET bottles: CO2 emissions from road transport Amcor has developed a 75 cl PET bottle which protects wine from UV light and other damaging agents, in a manner similar to glass wine bottles. The benefit of the PET wine bottle is that it is lightweight compared to traditional glass bottles, thus saving fuel in transport and consequently CO2 emissions arising from burning those fuels. Figure 4.1 breaks down the route taken by the PET wine bottles analysed in this study and allocates CO2 emissions to each leg of the journey: Figure 5.1: CO2 emissions: Transportation routes, distances and load weights of PET bottles.
Container / Route Distance (km) Vehicle Load
weight (t)
kg CO2/ load
PET bottles from manufacturer to consumer 496 - - 476
Of which…
67,500 empty bottles from manufacturer to Corby 226 38 t Artic 5.33 195
21,840 filled palletized bottles from Corby to Daventry 63 38 t Artic 19.06 67
21,840 filled palletized bottles from Daventry to retail outlet 200 38 t Artic 19.06 213
6 filled bottles and case from the retail outlet to consumer 7 Average UK car
0.01 0.564
The filled bottles are packaged in cases containing six bottles each. The cases are then palletized using wood pallets. Each pallet contains 140 cases which equals 840 bottles. The pallets are loaded onto a diesel powered 38 t Artic lorry which has capacity for 26 pallets. A full load is 21,840 bottles and weighs 19,064 kg. The lorries transport the bottles to a national distribution centre at Daventry from where they are delivered to retail outlets. It was assumed that delivery to retail outlets was performed in the same way as delivery to the distribution centre (i.e. 21,840 bottles at a time). Consumers then purchase bottles at the retail centre and typically drive (with other shopping) to their home.
PET and glass bottles 11

6.0 Glass bottles: CO2 emissions from road transport
Reducing glass bottle weight from 496g to 365g saves about 17% of CO2 emissions per bottle attributable to transporting glass wine bottles within the UK.
One of the key purposes of this study was to consider the effect of transporting heavier glass bottles as opposed to lighter PET equivalents. Figures 6.1 breaks down the route taken by typically heavy UK glass wine bottles if produced in Europe15. Figure 6.2 breaks down the route taken by typically light European produced glass wine bottles. Both figures allocate CO2 emissions to each leg of the journey: Figure 6.1: CO2 emissions: Transportation routes, distances and load weights of 496g glass bottles.
Container / Route Distance (km) Vehicle Load
weight (t)
kg CO2/ load
glass bottles from manufacturer to consumer 1487 - - 1570
Of which…
37,530 empty bottles from manufacturer to Corby 1217 38 t Artic 19.45 1260
20,160 filled palletized bottles from Corby to Daventry 63 38 t Artic 26.51 74
20,160 filled palletized bottles from Daventry to retail outlet 200 38 t Artic 26.51 235
6 filled bottles and case from the retail outlet to consumer 7 Average UK car
0.01 0.863
Figure 6.2: CO2 emissions: Transportation routes, distances and load weights of 365g glass bottles.
Container / Route Distance (km) Vehicle Load
weight (t)
kg CO2/ load
glass bottles from manufacturer to consumer 1487 - - 1551
Of which…
46,800 empty bottles from manufacturer to Corby 1217 38 t Artic
18.54 1244
21,840 filled palletized bottles from Corby to Daventry 63 38 t Artic
25.86 73
21,840 filled palletized bottles from Daventry to retail outlet 200 38 t Artic
25.86 233
6 filled bottles and case from the retail outlet to consumer 7 Average UK car
0.01 0.773
Filled glass bottles are packaged in cases containing six bottles each. The cases are palletized, each pallet containing 140 cases which equals 840 bottles per pallet. The pallets are loaded onto a diesel powered 38 t Artic lorry which has capacity for 26 pallets. A full load for 496g bottles is 24 pallets which contain 20,160 bottles and weighs 26,508 kg. For 365g bottles, a full load is 26 pallets which contain 21,840 bottles and weighs 25,856 kg. The lorries transport the bottles to a national distribution centre at Daventry from where they are delivered to retail outlets. It was assumed that delivery to retail outlets was performed in the same way as delivery to the distribution centre (i.e. 20,160 or 21,840 bottles at a time, depending on individual bottle weight). Consumers then purchase the case of bottles at the retail centre and drive with the load to their home.
15“Heavy” European produced bottles used at Corby Bottlers weight 460g, whereas, the typical glass wine bottle weight in the UK is 496g.
PET and glass bottles 12

7.0 Comparison of PET versus glass bottling The previous sections of this report have outlined the CO2 emissions attributable to shipping wine in bulk from Australia to the UK, the manufacture and transport of PET bottles, and manufacture and transport of glass bottles. Combining these figures gives total emissions per bottling scenario where the average recycled content of glass bottles is 81% and the average recycled content of PET bottles is 0% (see Appendix B). Figure 7.1: CO2 emissions from bottling Australian wine in the UK excluding end-of-life considerations: 496g glass bottles and 54g PET bottles.
566
474
0
100
200
300
400
500
600
700
81% recycled content 0% recycled content
g CO
2/bo
ttle
Manufacture of 496g
glass bottle
Manufacture of 54g
PET bottle
Bulk shipment
Road transport
It can be seen from figure 7.1 that there are considerable CO2 savings from bottling wine in lighter bottles since they require less energy to transport. 7.1 End-of-life CO2 emissions attributable to both types of bottles materials are affected by the fate of the bottles once they are disposed of by the consumer. To account for CO2 savings from recycling used PET bottles, the UK municipal plastic recycling rate of 20%16 was used along with the CO2 savings arising from manufacturing new PET bottles from recycled PET flake17. The calculations to determine recycling savings from PET include transport of the bottles to the recycling plant, washing and flaking, and a plant overhead following the methodology described by Eco-profiles of the Plastic Industry18. To account for energy savings from recycling used glass bottles, the UK municipal glass container recycling rate of 50%19 was used along with the CO2 savings arising from manufacturing new glass bottles from recycled cullet. Recycling benefits for glass were derived from Enviros 2003 and include: Recycled material preparation, collection and transport to bulking site, transport from bulking site to processor and transport from processor to the glass factory. Please see Appendix A for complete details on recycling savings applied. The figure below shows the emissions per bottle including end-of-life recycling are shown overleaf:
16 Wrap, 2007. Realising the Value of Recovered Plastics. Market Situation Report-Autumn 2007. See Appendix A for full details. 17 Data on energy required to recycle PET obtained from AMCOR. 18 Boustead, I. 2005. Eco-profiles of the Plastic Industry. Methodology. 19 Extrapolation of data held by Defra (2003): UK glass recycling rates for period 1984-2004 and for 2003. See Appendix A for full details.
PET and glass bottles 13

Figure 7.2: CO2 emissions from bottling Australian wine in the UK including CO2 savings from recycling at end-of-life: 496g glass bottles and 54g PET bottles.
446
523
0
100
200
300
400
500
600
81% recycled content 0% recycled content
g CO
2/bo
ttle
Manufacture of 496g
glass bottle
Manufacture of 54g
PET bottle
Bulk shipment
Road transport
In this study, the total CO2 emissions per PET bottle would be considerably reduced with higher municipal recycling rates for plastic. Similarly, if glass container municipal recycling rates in the UK were comparable to recycling rates in other EU countries, the CO2 emissions from manufacturing glass bottles would decrease significantly. PET, as most plastics, degrades when recycled. The economic and technological feasibility of recycling PET bottles back into food-grade PET within the UK is challenging and most PET bottles are recycled into PET fibre or shipped to Asia for recycling. Nonetheless, there have been recent technological gains, along with economic incentives in the form of tax cuts that make some bottle to bottle recycling of PET viable. The economic feasibility of glass recycling is established and glass can be recycled indefinitely without losing material quality. However, the relatively low amount of green glass bottles manufactured in the UK, coupled with large imports of green glass as drinks packaging, have contributed to the existence of an excess of green glass cullet. A portion of this cullet is exported to other European countries, such as France, where the scale of green glass bottle production can easily incorporate this excess cullet.
Green Glass excess and the export of cullet
The inclusion of CO2 emissions from exporting green glass cullet to France has a minimal impact on
the overall emissions attributed to the processes analysed in this study (see Appendix C). According
to WRAP (2006. Bulk it bottle it and buy it in Britain) one way to approach the increasing excess of
green glass is to encourage green glass bottle production within the UK, thus minimizing the need to
export cullet to other countries. Importing wine in bulk and bottling it in the UK would create a
domestic market for green glass bottle production.
According to Defra in 2006-2007, about 11% of municipal waste was incinerated. Incineration is often cited as the best alternative to manage plastic wastes since some energy is recovered in Combined Heat and Power (CHP) plants. Glass is less likely to be incinerated and cullet which is not used to produce new glass is usually used as road fill material in substitution for other aggregate. Incineration was not included in the analyses because data were not available on incineration figures or energy obtained from this type of waste management. 7.2 Lightweighting bottles The UK average glass wine bottle weight is 496g, but Corby Bottlers which are the only fillers currently using PET wine bottles, typically use 460g or 365g glass bottles. Lightweighting bottles has been shown to have benefits in terms of CO2 savings from transport of loads. Consequently, reducing glass bottle weight reduces the quantity of CO2 emissions associated with wine packaging, as shown in figure 7.3 and 7.4 below, where a comparison is made between European produced lightweight 365g bottle (used by Corby Bottlers) and the two bottle types analysed throughout this report.
PET and glass bottles 14

Figure 7.3: CO2 emissions from bottling Australian wine in the UK excluding end-of-life considerations: 496g glass bottles, 365g glass bottles, and 54g PET bottles.
484 474
566
0
100
200
300
400
500
600
700
81% recycled content 81% recycled content 0% recycled content
g CO
2/bo
ttle
Manufacture of 496g
glass bottle
Manufacture of 365g glass
bottle
Manufacture of 54g
PET bottle
Bulk shipment
Road transport
Figure 7.4: CO2 emissions from bottling Australian wine in the UK including end-of-life considerations: 496g glass bottles, 365g glass bottles, and 54g PET bottles
523
446453
0
100
200
300
400
500
600
81% recycled content 81% recycled content 0% recycled content
g CO
2/bo
ttle
Manufacture of 496g
glass bottle
Manufacture of 365g glass
bottle
Manufacture of 54g
PET bottle
Bulk shipment
road transport
PET comes out marginally lower than the 365g glass bottle when using the medium estimate for glass production emissions, although the higher CO2 emissions arising for PET from manufacture offset much of the savings obtained from its low weight. In both scenarios, excluding or including end-of-life, the emissions attributed to the 54g PET bottle lie within the range of emissions attributable to the 365g glass bottle. 7.3 Relative contributions to CO2 emissions The production of the different types of bottles and bulk shipping Australian wine to the UK are the two most significant contributors to the overall CO2 emissions analysed in this study. Changing bottle material composition from a heavy and relatively low carbon intensive material (glass) to a light but relatively carbon intensive material (PET) actually has little impact on the final results as the savings from light-weighting are balanced by the higher emissions of manufacturing. As can be seen in figures 7.3 and 7.4, as bottles become progressively lighter (from 496g to 54g) the relative importance of bulk shipping as the main contributor to the total CO2 emissions increases. The major component of carbon emissions for 365g glass bottles and 54g PET bottles is the bulk shipment of wine from Australia to the UK. The second most important factor for these two bottle types is the manufacture of the bottle, whilst road transport is a relatively insignificant factor. For the 496g glass bottle, CO2 emissions arising from manufacture (49%) are slightly more significant than those arising from bulk shipment (42%).
PET and glass bottles 15
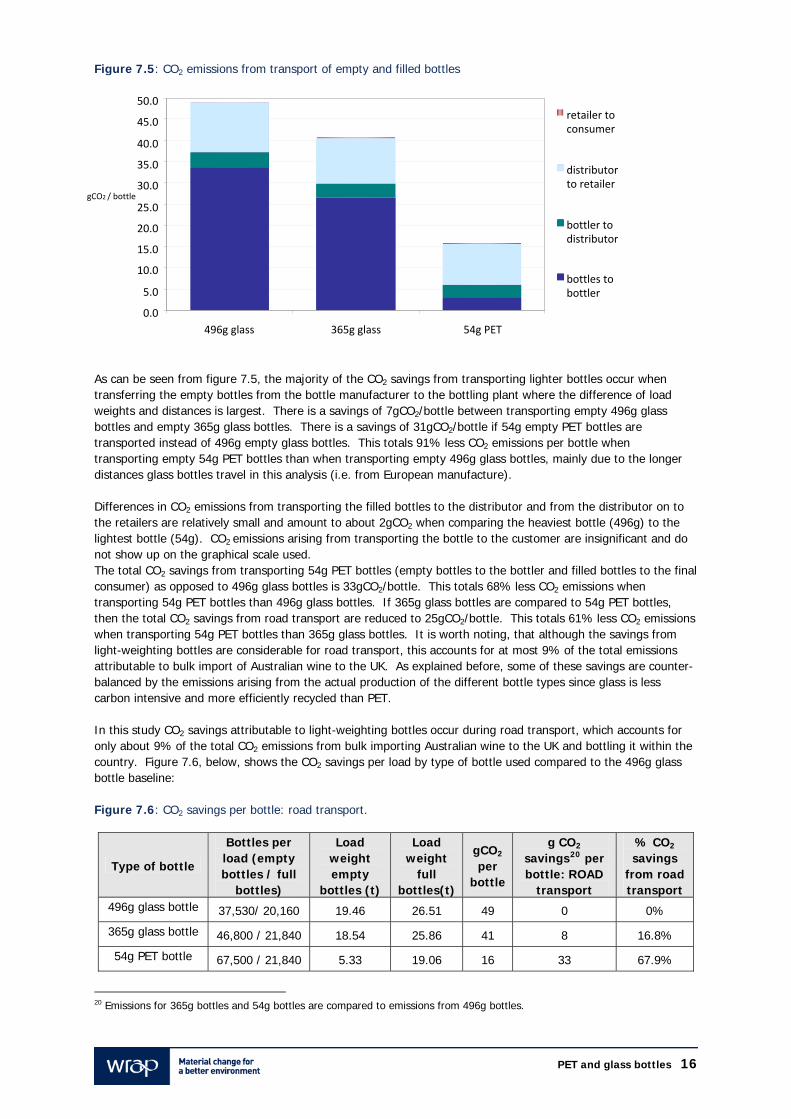
Figure 7.5: CO2 emissions from transport of empty and filled bottles
0.0
5.0
10.0
15.0
20.0
25.0
As can be seen from figure 7.5, the majority of the CO2 savings from transporting lighter bottles occur when transferring the empty bottles from the bottle manufacturer to the bottling plant where the difference of load weights and distances is largest. There is a savings of 7gCO2/bottle between transporting empty 496g glass bottles and empty 365g glass bottles. There is a savings of 31gCO2/bottle if 54g empty PET bottles are transported instead of 496g empty glass bottles. This totals 91% less CO2 emissions per bottle when transporting empty 54g PET bottles than when transporting empty 496g glass bottles, mainly due to the longer distances glass bottles travel in this analysis (i.e. from European manufacture). Differences in CO2 emissions from transporting the filled bottles to the distributor and from the distributor on to the retailers are relatively small and amount to about 2gCO2 when comparing the heaviest bottle (496g) to the lightest bottle (54g). CO2 emissions arising from transporting the bottle to the customer are insignificant and do not show up on the graphical scale used. The total CO2 savings from transporting 54g PET bottles (empty bottles to the bottler and filled bottles to the final consumer) as opposed to 496g glass bottles is 33gCO2/bottle. This totals 68% less CO2 emissions when transporting 54g PET bottles than 496g glass bottles. If 365g glass bottles are compared to 54g PET bottles, then the total CO2 savings from road transport are reduced to 25gCO2/bottle. This totals 61% less CO2 emissions when transporting 54g PET bottles than 365g glass bottles. It is worth noting, that although the savings from light-weighting bottles are considerable for road transport, this accounts for at most 9% of the total emissions attributable to bulk import of Australian wine to the UK. As explained before, some of these savings are counter-balanced by the emissions arising from the actual production of the different bottle types since glass is less carbon intensive and more efficiently recycled than PET. In this study CO2 savings attributable to light-weighting bottles occur during road transport, which accounts for only about 9% of the total CO2 emissions from bulk importing Australian wine to the UK and bottling it within the country. Figure 7.6, below, shows the CO2 savings per load by type of bottle used compared to the 496g glass bottle baseline: Figure 7.6: CO2 savings per bottle: road transport.
Type of bottle
Bottles per load (empty bottles / full
bottles)
Load weight empty
bottles (t)
Load weight
full bottles(t)
gCO2 per
bottle
g CO2 savings20 per bottle: ROAD
transport
% CO2 savings
from road transport
496g glass bottle 37,530/ 20,160 19.46 26.51 49 0 0%
365g glass bottle 46,800 / 21,840 18.54 25.86 41 8 16.8%
54g PET bottle 67,500 / 21,840 5.33 19.06 16 33 67.9%
20 Emissions for 365g bottles and 54g bottles are compared to emissions from 496g bottles.
30.0
35.0
40.0
45.0
50.0
496g glass 365g glass 54g PET
retailer to consumer
distributor to retailer
gCO2 / bottle
bottler to distributor
bottles to bottler
PET and glass bottles 16
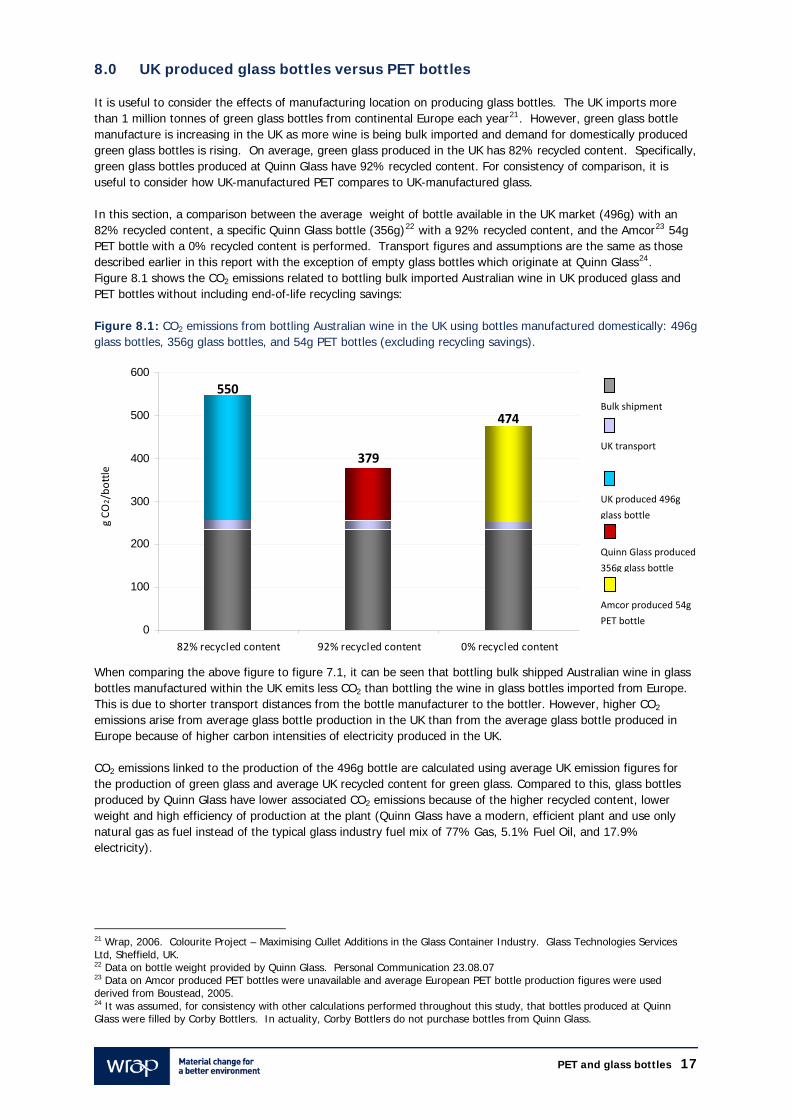
8.0 UK produced glass bottles versus PET bottles It is useful to consider the effects of manufacturing location on producing glass bottles. The UK imports more than 1 million tonnes of green glass bottles from continental Europe each year21. However, green glass bottle manufacture is increasing in the UK as more wine is being bulk imported and demand for domestically produced green glass bottles is rising. On average, green glass produced in the UK has 82% recycled content. Specifically, green glass bottles produced at Quinn Glass have 92% recycled content. For consistency of comparison, it is useful to consider how UK-manufactured PET compares to UK-manufactured glass. In this section, a comparison between the average weight of bottle available in the UK market (496g) with an 82% recycled content, a specific Quinn Glass bottle (356g)22 with a 92% recycled content, and the Amcor23 54g PET bottle with a 0% recycled content is performed. Transport figures and assumptions are the same as those described earlier in this report with the exception of empty glass bottles which originate at Quinn Glass24. Figure 8.1 shows the CO2 emissions related to bottling bulk imported Australian wine in UK produced glass and PET bottles without including end-of-life recycling savings: Figure 8.1: CO2 emissions from bottling Australian wine in the UK using bottles manufactured domestically: 496g glass bottles, 356g glass bottles, and 54g PET bottles (excluding recycling savings).
474
379
550
0
100
200
300
400
500
600
82% recycled content 92% recycled content 0% recycled content
g CO
2/bo
ttle
UK produced 496g
glass bottle
Quinn Glass produced
356g glass bottle
Amcor produced 54g
PET bottle
Bulk shipment
UK transport
When comparing the above figure to figure 7.1, it can be seen that bottling bulk shipped Australian wine in glass bottles manufactured within the UK emits less CO2 than bottling the wine in glass bottles imported from Europe. This is due to shorter transport distances from the bottle manufacturer to the bottler. However, higher CO2 emissions arise from average glass bottle production in the UK than from the average glass bottle produced in Europe because of higher carbon intensities of electricity produced in the UK. CO2 emissions linked to the production of the 496g bottle are calculated using average UK emission figures for the production of green glass and average UK recycled content for green glass. Compared to this, glass bottles produced by Quinn Glass have lower associated CO2 emissions because of the higher recycled content, lower weight and high efficiency of production at the plant (Quinn Glass have a modern, efficient plant and use only natural gas as fuel instead of the typical glass industry fuel mix of 77% Gas, 5.1% Fuel Oil, and 17.9% electricity).
21 Wrap, 2006. Colourite Project – Maximising Cullet Additions in the Glass Container Industry. Glass Technologies Services Ltd, Sheffield, UK. 22 Data on bottle weight provided by Quinn Glass. Personal Communication 23.08.07 23 Data on Amcor produced PET bottles were unavailable and average European PET bottle production figures were used derived from Boustead, 2005. 24 It was assumed, for consistency with other calculations performed throughout this study, that bottles produced at Quinn Glass were filled by Corby Bottlers. In actuality, Corby Bottlers do not purchase bottles from Quinn Glass.
PET and glass bottles 17

When end-of-life recycling is taken into account, additional CO2 savings can be allocated to each bottle type. These savings are shown below in figure 8.2: Figure 8.2 CO2 emissions from bottling Australian wine in the UK using bottles manufactured domestically: 496g glass bottles, 356g glass bottles, and 54g PET bottles (including recycling savings).
495
356
446
0
100
200
300
400
500
600
82% recycled content 92% recycled content 0% recycled content
g CO
2/bo
ttle
UK produced 496g
glass bottle
Quinn Glass produced
356g glass bottle
Amcor produced 54g
PET bottle
Bulk shipment
UK transport
8.1 PET bottles with varying recycled content No facilities exist in the UK for bottle-to-bottle recycling of PET, although there are plans for a plant to open near London in December25 and other facilities are expected to be completed before 2009. Nonetheless, trials of incorporating post-consumer recycled PET into food, beverages and beauty product packaging have been undertaken recently by WRAP26 and it was deemed feasible to include up to 50% recycled content in several types of packaging. Recycling PET involves transport and preparation of the recyclate before a food-grade flake is obtained. Data were provided on the energy requirements and fuel mix used to prepare recycled PET flakes, but data did not include energy required for transporting of recycled material to the plant. Several calculations were performed to include transportation and overhead to obtain CO2 emissions per kilogram of recycled PET (Appendix A). Figure 8.3 CO2 emissions from bottling Australian wine in the UK using PET: 0%, 50%, and 100% recycled content (excluding recycling savings).
338
406
474
0
100
200
300
400
500
0% recycled content 50% recycled content 100% recycled content
g CO
2/bottle
Manufacture of 54g
PET bottle
Bulk shipment
UK transport
25 Reilly, M. Recycled plastic to get clean bill of health. New Scientist, 09.05.2007. 26 WRAP, 2007. Using recycled content in plastic packaging: the benefits. Banbury, United Kingdom.
PET and glass bottles 18
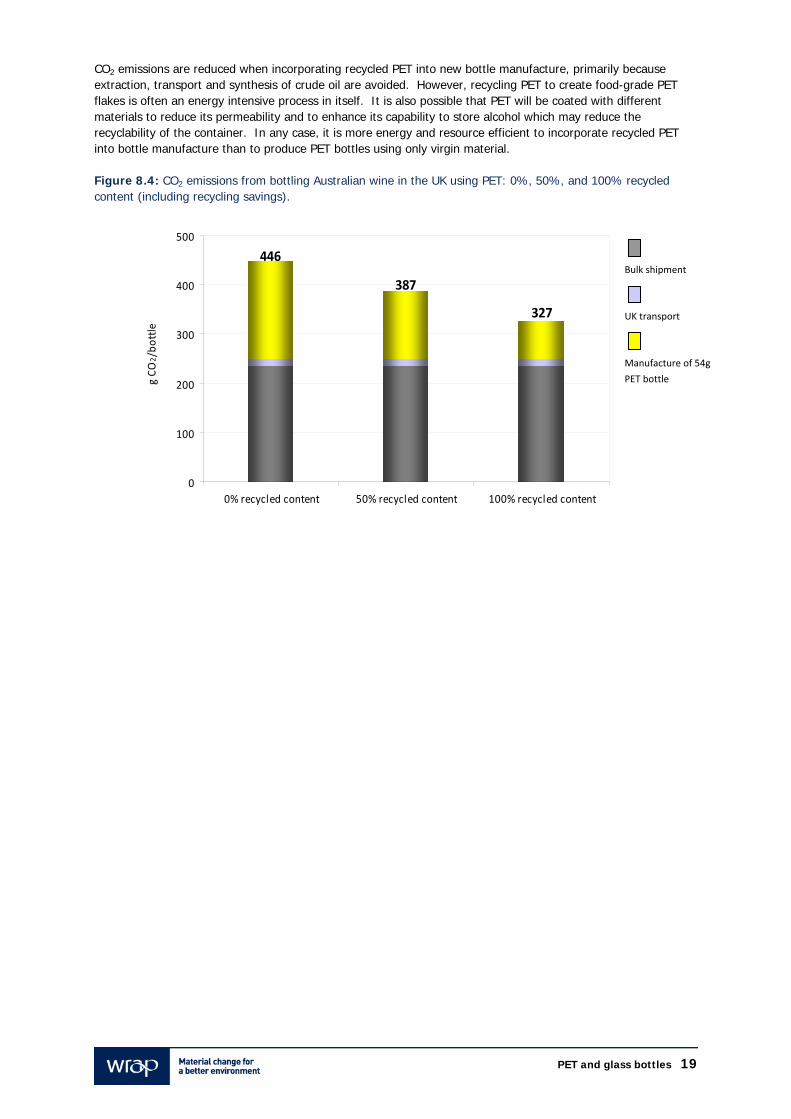
CO2 emissions are reduced when incorporating recycled PET into new bottle manufacture, primarily because extraction, transport and synthesis of crude oil are avoided. However, recycling PET to create food-grade PET flakes is often an energy intensive process in itself. It is also possible that PET will be coated with different materials to reduce its permeability and to enhance its capability to store alcohol which may reduce the recyclability of the container. In any case, it is more energy and resource efficient to incorporate recycled PET into bottle manufacture than to produce PET bottles using only virgin material. Figure 8.4: CO2 emissions from bottling Australian wine in the UK using PET: 0%, 50%, and 100% recycled content (including recycling savings).
446
387
327
0
100
200
300
400
500
0% recycled content 50% recycled content 100% recycled content
g CO
2/bo
ttle
Manufacture of 54g
PET bottle
Bulk shipment
UK transport
PET and glass bottles 19

9.0 Conclusion Lightweighting bottles is a proven method to reduce CO2 emissions arising from transport of bottle loads. For the light glass bottles (365g) and the PET bottle, the largest contributor to CO2 emissions from bulk shipped Australian wine for UK-bottling is shipping the wine from Australia. For heavy (496g) glass bottles, CO2 emissions arising from the manufacture of the bottle are slightly more significant than bulk shipping the wine. This study analyses only CO2 emissions and not other greenhouse gases such as N2O or CH4 as these were outside the scope of work provided. These other environmental impacts are more often than not covered in more in depth life cycle analyses. The inclusion of other greenhouse gases, generally known as CO2 equivalents would increase the emissions from manufacturing PET by almost 14%27. For glass, there would be an increase in the emissions arising from electricity, gas and fuel oil used in manufacture. This is estimated at about 10%28. The CO2 emissions from bottle manufacture are calculated on the basis of the weights and types of materials used, including recycled content. Life cycle studies ‘to factory gate’ have consistently shown that manufacturing glass is less carbon intensive than manufacturing PET on a per unit weight basis. However, the properties of PET are such that a wine bottle can be manufactured which is of considerably lower weight than the ‘best practice’ glass equivalent. When the total emissions from manufacturing are compared, the lower weight of the PET bottle is offset by the carbon intensity of the material to give similar overall results to the light weight glass equivalent. Perhaps contrary to expectations, European and UK road transport of empty bottles and the successive transport of filled bottles to retailers is in fact a relatively minor factor affecting the total CO2 emissions analysed in this study. However, the difference in emissions does elucidate the CO2 savings arising from lightweighting wine bottles. Using 54g PET bottles manufactured in the UK as opposed to European produced 496g glass bottles could save up to 68% of the CO2 emissions attributable to road transport. This study therefore clearly illustrates that the CO2 emissions for a lightweight glass container with a high recycled content and a PET bottle are almost equivalent. What is even more apparent is that by lightweighting and increasing recycled content, significant reductions in CO2 for both PET and glass can be achieved. As with all studies of this nature that focus on one environmental impact, they should be taken into consideration with other factors for a particular product, for example, brand equity, recyclability and other environmental factors.
27 Data derived from the Association of Plastic Manufacturers of Europe. 28 Greenhouse gas emissions from electricity depend on the country specific fuel mix used to generate the electricity. As stated above, other GHGs were outside the scope of the analysis so no detailed calculations were made for this report. Unlike the readily available figure for PET, the GHG emission increase cited (10%) for glass is an estimate only.
PET and glass bottles 20

Appendix A: Assumptions used in this study Bulk wine shipping From the WRAP report, The life cycle emissions of wine imported to the UK. GLAS01 123 (2007), the following assumptions were made on the method of transporting wine in bulk from Australia to the UK:
The density of wine is assumed to be 1 for this study; and
Wine is transported in disposable Flexitanks, which hold 24,000 litres and weigh 80 kg when empty, from the
winery in Australia to the bottler in the UK.
Additionally, the following data were used for the bulk shipment of wine from Australia to the UK:
The wine analysed in this study is produced by the Barossa Valley winery, 71.1 km north-east of Adelaide,
Australia. (Winery location provided by Fosters Group; road distance calculator: http://maps.google.com);
The empty Flexitanks are transported, 20 at a time, to the winery. Distance: 71.1 km (Route provided by
Fosters Group; road distance calculator: http://maps.google.com);
The filled Flexitanks are transported to the docks in Adelaide, Australia. Distance: 71.1km (Route provided by
Fosters Group; road distance calculator: http://maps.google.com);
Each filled Flexitank is placed in a TEU container and shipped from Adelaide, Australia to Felixstowe, UK.
Distance: 19,824 km (Route provided by Fosters Group; sea distance calculator: www.world-register.org); and
The filled Flexitanks are placed on a flatbed lorry and transported from the docks at Felixstowe, UK to the
bottling facility at Corby, UK. Distance: 184 km (Route provided by Fosters Group; road distance calculator:
www.theaa.com).
Bottled wine transport Glass bottle weight derived from:
WRAP, 2006. More Bulk. Less Bottle. The Wrap Wine Initiative. Banbury, United Kingdom.
Personal communication Fosters (25.07.07)
Personal communication Corby (21.08.07)
Personal communication Wrap (10.10.07)
PET bottle weight provided by Amcor To calculate the carbon emissions from bottled wine road transport within the UK the following data were used:
Empty UK-produced glass bottles (of both weights) are transported from Quinn Glass at Elton, Cheshire to the
bottling facility at Corby, UK. Distance: 233 km (road distance calculator: www.theaa.com);
Empty plastic bottles are transported from the PET bottle manufacturer to the bottling facility at Corby.
Distance: 226 km (distance provided by AMCOR: 142 miles);
Cases of glass and PET wine bottles are transported from Corby, UK to a distribution centre at Daventry, UK.
Distance: 62.6 km (Route provided by Amcor; road distance calculator: www.theaa.com);
Fully loaded lorries transfer palletised bottles from the distribution centre to retail outlets within the UK.
Distance: 200 km (estimated by BFF); and
Consumers purchase bottles and transport them by average UK car from retailers to house. Distance: 4.3
miles (Average length of shopping trip in 2005; data from: www.dft.gov.uk)
PET and glass bottles 21

Data were provided by Corby Bottlers on the origin and national proportion of bottles typically filled at the plant. To determine the average distance European bottles are transported to Corby bottlers in the UK, the following assumptions were made:
French bottles originate in Lyon (1074km), central France;
Belgium bottles originate in Brussels (514km), central Belgium;
Bulgarian bottles originate in Sofia (2628km), by far the largest city in Bulgaria; and
British bottles originate in Elton (233km), home of Quinn Glass.
It is worth noting that these distances are high compared to the European Commission (2000) estimate of a maximum distance travelled of 500km for most empty glass packaging. Data were received on loads of empty bottles as follows:
Full truck load of empty 496g glass bottles = (34,920 or 40140 [depending on shape] bottles per load*496g
per bottle) + (30 pallets*28 kg per pallet) ≈ 19,455 kg [depending on shape];
Full truck load of empty 365g glass bottles = (46,800 bottles per load*365g per bottle) + (52 pallets*28 kg
per pallet) = 18,538 kg;
Full truck load of empty 356g glass bottles = (46,800 bottles per load*356g per bottle) + (52 pallets*28 kg
per pallet) = 18,117 kg; and
Full truck load of empty 54g PET bottles = (67,500 bottles per load*54g per bottle) + (60 pallets*28 kg per
pallet) = 5,325 kg.
For the 496g glass bottle, data provided by Corby Bottlers on 460g glass bottles were used. It was assumed that the loading factors were the same for 496g glass bottles as for 460g glass bottles. Loading factors provided by Corby Bottlers for 460g glass bottles varied depending on the shape of the bottle, therefore, the average load weight was used, as the exact bottle shape is unknown. Calculations were performed using only the 496g glass bottle. Figure A.1 CO2 emissions from transport of empty glass bottle loads to Corby Bottlers:
average load weight (t) kgCO2 from transport of
average load gCO2 average emissions
per bottle
Origin % distance
(km) of which
channel is 496g
bottles 365g
bottles 356g
bottles 496g
bottles 365g
bottles 356g
bottles 496g
bottles 365g
bottles 356g
bottles
Fr 55 1074 41 1107 1093 1086
Bel 15 514 41 508 501 496
Bul 20 2628 41 2770 2735 2718
UK 10 233.3 41
19.5 18.5 18.1
207 204 203
34 27 26
The following data were provided by Amcor and Fosters on the quantity of pallets and the weight of wine cases transported:
For glass bottles:
Weight of 6-bottle case (with bottles) = 7.5 kg (heavy glass bottles) 7kg (light glass bottles (data provided by Fosters);
140 cases are stacked onto pallets (empty weight of pallet: 28 kg; data provided by Fosters); Maximum load per lorry is 24 pallets for heavy bottles, 26 pallets for light bottles (data provided by
Fosters); Weight of label =1.9g (data provided by Fosters); and Weight of capsule = 4.5g (data provided by Fosters).
PET and glass bottles 22

For PET bottles
Weight of 6-bottle case (with bottles) = 5 kg (data provided by Fosters); Weight of empty wine case: 175g (data provided by Amcor); Dimensions of wine case: 297x248x166 (mm) (data provided by Amcor); 140 cases are stacked onto pallets (empty weight of pallet: 25 kg; same data provided by Amcor and Fosters); Maximum load per lorry is 26 pallets. (Data provided by Fosters); and Each loaded lorry transports 25,800 kg of pallets, cases and bottles on 24 pallets. (Data provided by Amcor).
Some of these data lead to conflicting results when calculating the weight of a full load. Load weights per lorry were thus calculated using a bottom up approach: [(weight of label + weight of capsule + weight of bottle + weight of wine)*number of bottles per case + (weight of cases)]*number of cases per pallet + weight of pallet. Figure A.2 Calculations to establish the weight of each truck load of wine case:
A case of filled 496g glass bottles weighs: A case of filled 365g glass bottles weighs:
bottles, 6*496g = 2976g Bottles, 6*365g = 2190g
wine 6*75cl = 4500g wine 6*75cl = 4500g
caps 6*4.5g = 27g caps 6*4.5g = 27g
labels 6*1.9g = 11.4g labels 6*1.9g = 11.4g
case = 175g case = 175g
TOTAL = 7.6894 kg TOTAL = 6.9034 kg
Full truck load is then 24 pallets: 26,508kg (20,160 bottles)
Full truck load is then 26 pallets: 25,856kg (21,840 bottles)
A case of filled 356g glass bottles weighs: A case of filled 54g PET bottles weighs:
bottles, 6*356g = 2136g Bottles, 6*54g = 324g
wine 6*75cl = 4500g wine 6*75cl = 4500g
caps 6*4.5g = 27g caps 6*4.5g = 27g
labels 6*1.9g = 11.4g labels 6*1.9g = 11.4g
case = 175g case = 175g
TOTAL = 6.8494 kg TOTAL = 5.0374 kg
Full truck load is then 26 pallets: 25,660kg (21,840 bottles)
Full truck load is then 26 pallets: 19,064kg (21,840 bottles)
Average weight of shopping load (11kg) derived by AEA for DEFRA using NTS trip data (1999/2001) and DEFRA Food Survey to determine how much food was consumed. Food Miles Final Report (http://statistics.defra.gov.uk/esg/reports/foodmiles/annex1.pdf ). Figure A.3 % of full shopping load per type of bottle:
496 g glass bottle 365 g glass bottle 356 g glass bottle 54 g PET bottle
70% 63% 62% 46%
Tertiary packaging
Pallets for empty glass bottles are 25 kilos made of wood and reused 10 times; and
Pallets for empty PET bottles are 25 kilos made of HDPE and reused 50 times.
Figure A.4 Breakdown of pallet details:
Weight of pallets per load type bottle lifespan per trip load kgCO2/trip gCO2 per empty bottle
1500 HDPE 54g 50 30 59 0.8800
1300 Wood 356g 10 130 57 1.2222
1300 Wood 365g 10 130 57 1.2222
750 Wood 496g 10 75 33 0.8793
PET and glass bottles 23

It was assumed that each pallet, independent of its type had an additional 3kg of packaging (as total pallet weight is 28 kg for all scenarios), most probably shrink wrap, which was not accounted for here but is consistent for all bottle types. All pallets are reused but distances travelled and load weights for reused pallets were not available and were not included in this study. The CO2 emissions attributable to each pallet type were added to the total CO2 emissions attributable to each bottle type. Embodied energy of glass bottles There is no standard data source for carbon dioxide emissions arising from glass container production for the UK. In this study, the following sources and figures were used:
Enviros Consulting, 2003. Glass Recycling-Life Cycle Carbon Dioxide Emissions. (used for typical UK
production).
Figure A.5 Emissions for container glass manufacture in the UK
Emissions for container glass manufacture in the UK
Kg CO2/tonne of glass (recycled within the UK)
Kg CO2/tonne of glass (recyclate exported to France) Recycled content
843 843 0 529 533 100
This includes emissions arising from extraction, production and transport of raw materials; preparation of recycled materials; glass melting; and collection and transport of cullet for the glass industry in the UK. Also included is the CO2 emitted by the process of melting (burning) carbonates. Other data sources used or reviewed for this study are:
Hammond, G. and Jones, C., 2006. Inventory of Carbon and Energy (ICE)-Version 1.5 Beta, Bath, United
Kingdom;
HMSO, 2003. Environmental Accounts, London, United Kingdom;
Wrap, 2007. Assessment of the International Trading Markets for Recycled Container Glass and their
Environmental Implications. MSG007 (v2);
British Glass Foundation, 2002. UK Glass Manufacture: A Mass Balance Study. British Glass, Sheffield, United
Kingdom;
Bilan Carbone, 2007. Guide des Facteurs d’Emissions. Version 5.0;
Danish EPA, 1998. Life Cycle Assessment of Packaging Systems for Beer and Soft Drinks. Refillable Glass
Bottles No.400, Copenhagen, Denmark; and
Danish EPA, 1998. Life Cycle Assessment of Packaging Systems for Beer and Soft Drinks. Disposable Glass
Bottles No.401, Copenhagen, Denmark.
These sources quote a carbon intensity figure for glass production between 0.057 and 0.0742 kgCO2/MJ with an embodied energy of 13.5MJ/kg. A 37% energy savings from recycling glass from Enviros Consulting figures was assumed. The commissioners of this report asked BFF to calculate the emissions arising from the manufacture of a typical bottle used at Corby Bottlers. Data were provided by Corby Bottlers on the origin and national proportion of bottles typically filled at the plant, although these origins may vary based on market prices of glass. To determine the CO2 emissions from producing a typical European green bottle, three different approaches were taken and thus, three different results were obtained. Average recycled content of bottles produced in each country were derived from Wrap (2007).
PET and glass bottles 24
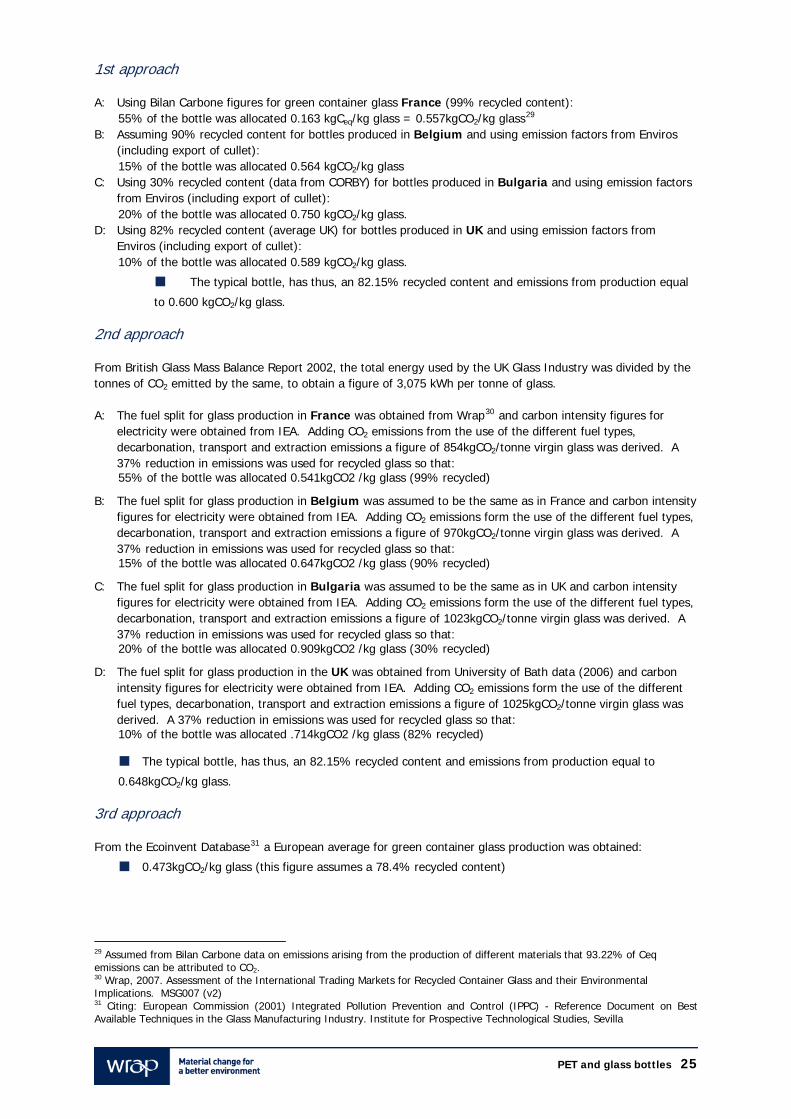
1st approach A: Using Bilan Carbone figures for green container glass France (99% recycled content):
55% of the bottle was allocated 0.163 kgCeq/kg glass = 0.557kgCO2/kg glass29
B: Assuming 90% recycled content for bottles produced in Belgium and using emission factors from Enviros (including export of cullet): 15% of the bottle was allocated 0.564 kgCO2/kg glass
C: Using 30% recycled content (data from CORBY) for bottles produced in Bulgaria and using emission factors from Enviros (including export of cullet): 20% of the bottle was allocated 0.750 kgCO2/kg glass.
D: Using 82% recycled content (average UK) for bottles produced in UK and using emission factors from Enviros (including export of cullet): 10% of the bottle was allocated 0.589 kgCO2/kg glass.
The typical bottle, has thus, an 82.15% recycled content and emissions from production equal
to 0.600 kgCO2/kg glass.
2nd approach From British Glass Mass Balance Report 2002, the total energy used by the UK Glass Industry was divided by the tonnes of CO2 emitted by the same, to obtain a figure of 3,075 kWh per tonne of glass. A: The fuel split for glass production in France was obtained from Wrap30 and carbon intensity figures for
electricity were obtained from IEA. Adding CO2 emissions from the use of the different fuel types, decarbonation, transport and extraction emissions a figure of 854kgCO2/tonne virgin glass was derived. A 37% reduction in emissions was used for recycled glass so that: 55% of the bottle was allocated 0.541kgCO2 /kg glass (99% recycled)
B: The fuel split for glass production in Belgium was assumed to be the same as in France and carbon intensity figures for electricity were obtained from IEA. Adding CO2 emissions form the use of the different fuel types, decarbonation, transport and extraction emissions a figure of 970kgCO2/tonne virgin glass was derived. A 37% reduction in emissions was used for recycled glass so that: 15% of the bottle was allocated 0.647kgCO2 /kg glass (90% recycled)
C: The fuel split for glass production in Bulgaria was assumed to be the same as in UK and carbon intensity figures for electricity were obtained from IEA. Adding CO2 emissions form the use of the different fuel types, decarbonation, transport and extraction emissions a figure of 1023kgCO2/tonne virgin glass was derived. A 37% reduction in emissions was used for recycled glass so that: 20% of the bottle was allocated 0.909kgCO2 /kg glass (30% recycled)
D: The fuel split for glass production in the UK was obtained from University of Bath data (2006) and carbon intensity figures for electricity were obtained from IEA. Adding CO2 emissions form the use of the different fuel types, decarbonation, transport and extraction emissions a figure of 1025kgCO2/tonne virgin glass was derived. A 37% reduction in emissions was used for recycled glass so that: 10% of the bottle was allocated .714kgCO2 /kg glass (82% recycled)
The typical bottle, has thus, an 82.15% recycled content and emissions from production equal to
0.648kgCO2/kg glass.
3rd approach From the Ecoinvent Database31 a European average for green container glass production was obtained:
0.473kgCO2/kg glass (this figure assumes a 78.4% recycled content)
29 Assumed from Bilan Carbone data on emissions arising from the production of different materials that 93.22% of Ceq emissions can be attributed to CO2. 30 Wrap, 2007. Assessment of the International Trading Markets for Recycled Container Glass and their Environmental Implications. MSG007 (v2) 31 Citing: European Commission (2001) Integrated Pollution Prevention and Control (IPPC) - Reference Document on Best Available Techniques in the Glass Manufacturing Industry. Institute for Prospective Technological Studies, Sevilla
PET and glass bottles 25

Combination of the three approaches Figure A.6 CO2 emissions attributable to bottle manufacture in Europe
Country of origin Recycled content of green glass kgCO2/kg glass (1st approach)
kgCO2/kg glass (2nd approach)
kgCO2/kg glass (3rd approach)
France 99% 0.557 0.541 0.473
Belgium 90% 0.564 0.647 0.473
Bulgaria 30% 0.750 0.909 0.473
UK 82% 0.589 0.714 0.473
European average 80.9%32 0.600 0.648 0.473
Using these ranges of emissions and allocating emissions to the percentage of bottles originating from each country, for two glass bottle weights:
496g which is the weighted UK market average33
365g which is the typical lightweight bottle used by the bottler at Corby
Figure A.7 The range of CO2 emissions attributable to bottle imported to the UK:
Country of origin Range kgCO2/kg
glass
Proportion of bottles
imported to UK
Range gCO2/
bottle(496g)
Range gCO2/
bottle(365g)
France 0.473-0.557 0.55
Belgium 0.473-0.647 0.15
Bulgaria 0.473-0.909 0.20
UK 0.473-0.714 0.10
235-326 173-240
European average34 0.473-0.707
The range of emissions attributable to the average European bottle used by Corby, which contains about 81% recycled material, is from 0.473 kgCO2/kg glass to 0.648 kgCO2/kg glass. This is comparable to UK manufacture of an 80% recycled content bottle, which is 0.595kgCO2/kg glass. Of all four countries were bottles originate in this study, the UK has the highest carbon intensity for electricity production. Embodied energy of PET bottles The embodied energy of 100% virgin PET bottles was derived from:
Boustead, I., 2005. Eco-profiles of the European Plastics Industry-PET bottles.
32 For 1st and 2nd approach recycled content is 82.2%. For the 3rd approach recycled content is 78.4%. Average recycled content is 80.9% 33 Average UK glass wine bottle weight is 498g as derived from AC Nielsen UK study in: Wrap, 2006. Colourite Project – Maximising Cullet Additions in the Glass Container Industry. Average UK glass wine bottle weight for 2007 is 496g as stated by Wrap; personal communication (10.10.2007). 34 Average for bottles used at Corby
PET and glass bottles 26

Additional sources of data for plastic manufacture were as follows:
Recoup, 2000. Affordable Plastic Bottle Recycling? Analysis and review of collection, sorting, reprocessing and
end-market issues and economics.
Danish EPA, 1998. Life Cycle Assessment of Packaging Systems for Beer and Soft Drinks. Refillable PET
Bottles No.404, Copenhagen, Denmark.
Danish EPA, 1998. Life Cycle Assessment of Packaging Systems for Beer and Soft Drinks. Disposable PET
Bottles No.405, Copenhagen, Denmark.
These two life cycle studies (NOT USED for the calculations performed in this study) assume a 0% recycled content for both types of bottles (Refillable and Reusable). Data provided by AMCOR gives total energy requirements for producing 1kg of recycled PET (rPET) flake. A breakdown of the energy sources used for this process was also available. Figure A.8 Calculations to determine the amount of CO2 emissions attributable to producing 1kg rPET:
Energy required kWh
source kgCO2
0.672 Electricity 0.351
0.928 gas 0.186
Total kg CO2 from energy required 0.537
To determine CO2 emissions from transporting bottles to the recycling plant a distance of 500km35 and an average load of 9.5 tonnes were assumed. To account for overhead, an addition of 33% of the total emissions arising from energy use at the rPET plant were added, following the methodology explained in Boustead. From these, a 61% energy savings from recycling PET was obtained. Energy requirements for producing bottles from rPET were considered to be the same as those for producing bottles from virgin PET and were added accordingly. The total emissions from producing 1kg of PET bottle from rPET = 1.6kgCO2/kgPETbottle Figure A.9 The following table relates CO2 emissions to recycled content of PET bottles
recycled content kgCO2/kg
4.11 0% 2.85 50% 1.60 100%
Energy recovered and CO2 emitted from incineration of UK plastic was excluded from this analysis. Figure A.10 Data derived from these sources were used to calculate the embodied energy of a 54g PET bottle with 3 different recycled contents as seen below:
Recycled Content gCO2/bottleRecycle
gCO2 /bottle gCO2/bottle
Including recycling
198 0% 222 24.0 138 50% 154 16.6 77 100% 86 9.3
35 There are currently no PET bottle‐to‐bottle recycling plants in the UK. Distance from collector to plant was provided by AMCOR based on data from a recycling facility in Beaune, France.
PET and glass bottles 27

Recycling The energy saved from recycling glass or PET has been subtracted from the energy required to make the bottles in the first place. Figure A.11 Diagram of the energy in the PET lifecycle
Bottle manufacturing energy
energy
energy
landfill
recycle Energy is derived principally from the combustion of fossil fuels and hence can be directly related to CO2 emissions. A UK municipal recycling rate of 50% for container glass in 2006 was assumed derived from data held by Defra on municipal container glass recycling rates for the period 1984-2004. A 37% recycling savings rate was applied as derived from Enviros Consulting (2003).
Average inter-annual increase of glass recycling (1984-2004) = 2.02%
UK municipal glass container recycling rate (2004) = 46%
Estimated UK container glass recycling rate for 2006 = 46% + (2*2.02%) = 50%
It was assumed that 20% of plastic bottles were recycled in the UK in 2006, derived from data found in Wrap, 2007. Realising the Value of Recovered Plastics. Market Situation Report-Autumn 2007. A 61% recycling savings rate was applied as derived from data provided by Amcor. This accounts for 1.99 tonnes of CO2 saved per tonne of recycled PET flake produced, which exceeds the savings of 1 to 1.5 tonnes of CO2 quoted in the aforementioned Wrap report.
Approximately 1.27 kgCO2/kg rPET flake are emitted, including transport
Approximately 3.27 kgCO2/kg PET flake are emitted
The CO2 savings calculated for both plastic and glass recycling include transport and preparation of the recycled material. As mentioned above, glass recycling savings are derived from Enviros Consulting (2003) and plastic recycling savings are derived from data provided by Amcor on energy required for the preparation of recycled PET flake and average transportation distances to Amcor’s PET recycling plant in Beaune, France.
PET and glass bottles 28

Appendix B: Total CO2 emissions Figure B.1 CO2 emissions from bulk shipment, bottle manufacture and domestic transport of Australian wine bottled in 496g glass bottles (produced in Europe and the UK), 365g glass bottles (produced in Europe), 356g glass bottles (produced in the UK), and 54g PET bottles (produced in the UK).
Weight of bottle (g)
Recycled Content gCO2/bottle Bulk
Transport gCO2/bottle
Domestic Transport
gCO2/bottle
Recycling savings
gCO2/bottle
Total gCO2/bottle
81% (low estimate) 235 44 476
81% (medium estimate) 294 54 524
496 (glass) from Europe
81% (high estimate) 326
49
60 549
496 (glass) from UK
82% 290
22 54 494
81% (low estimate) 174 33 417
81% (medium estimate) 217 40 453
365 (glass) from Europe
81% (high estimate) 241
41
45 472
356 (glass) from UK
92% 125
19 23 356
0% 222 27 446
50% 154 19 386 54 (PET)
100% 86
235
16
11 327 Note: These figures do not include emissions attributable to secondary packaging (pallets). Figures may not add up due to rounding.
PET and glass bottles 29
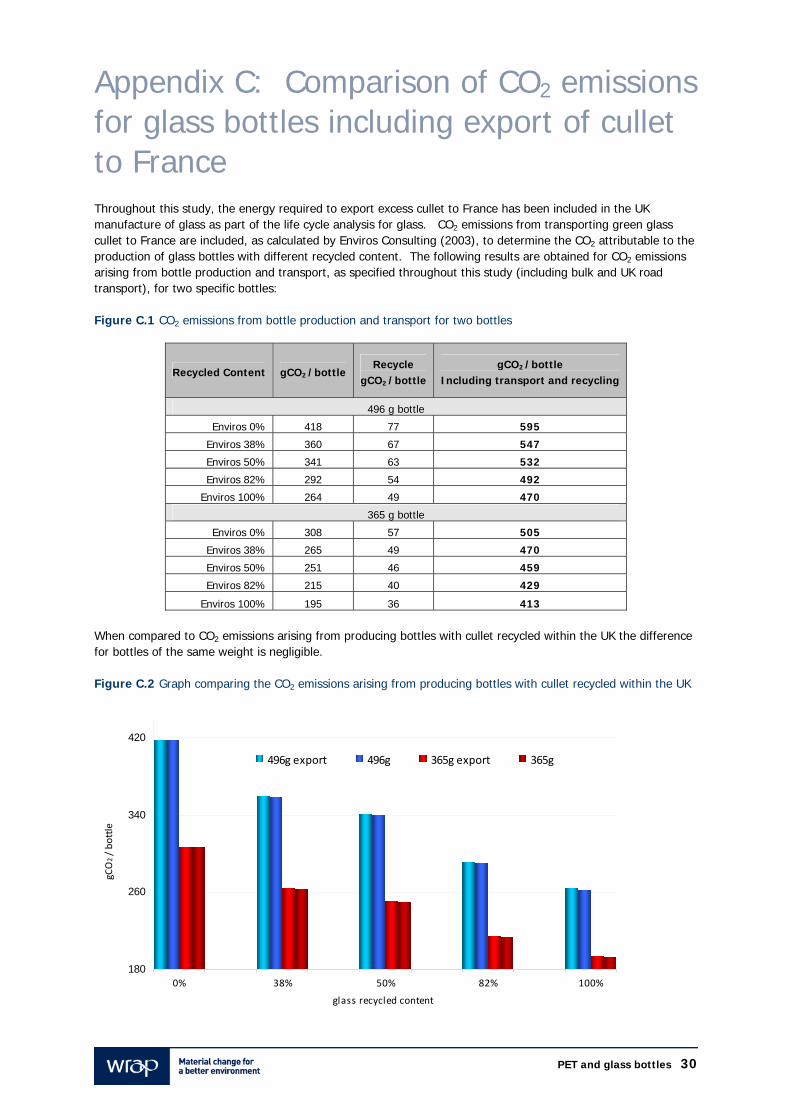
Appendix C: Comparison of CO2 emissions for glass bottles including export of cullet to France Throughout this study, the energy required to export excess cullet to France has been included in the UK manufacture of glass as part of the life cycle analysis for glass. CO2 emissions from transporting green glass cullet to France are included, as calculated by Enviros Consulting (2003), to determine the CO2 attributable to the production of glass bottles with different recycled content. The following results are obtained for CO2 emissions arising from bottle production and transport, as specified throughout this study (including bulk and UK road transport), for two specific bottles: Figure C.1 CO2 emissions from bottle production and transport for two bottles
Recycled Content gCO2 /bottle Recycle
gCO2 /bottle gCO2 /bottle
Including transport and recycling
496 g bottle
595 Enviros 0% 418 77
547 Enviros 38% 360 67
532 Enviros 50% 341 63
492 Enviros 82% 292 54
470 Enviros 100% 264 49
365 g bottle
505 Enviros 0% 308 57
470 Enviros 38% 265 49
459 Enviros 50% 251 46
429 Enviros 82% 215 40
413 Enviros 100% 195 36 When compared to CO2 emissions arising from producing bottles with cullet recycled within the UK the difference for bottles of the same weight is negligible. Figure C.2 Graph comparing the CO2 emissions arising from producing bottles with cullet recycled within the UK
180
260
340
420
0% 38% 50% 82% 100%
glass recycled content
gCO2 / bo
ttle
496g export 496g 365g export 365g
PET and glass bottles 30

Appendix D: Comparison of other bottle weights If bottle weight is increased to 500g or decreased to 300g the load weights for transport change accordingly, as do the CO2 emissions per bottle. Including bulk shipment, bottle production with subsequent export of a proportion of cullet, UK transport and recycling, the following comparison is made between different weight glass and PET. Figure D.1 Graph of the average gCO2 per bottle for each category
300
350
400
450
500
550
600
650
700
0% 38% 50% 82% 100%
glass recycled content
gCO2 / bottle
500g export 460g export 365g export 300g export PET
As can be seen from the above graph, the CO2 emissions attributable to PET (where all else remains constant, ie. transport, etc.) have a higher rate of decrease when recycled content increases than is the case for glass. Data on CO2 savings from including recycled content in manufacturing of PET were obtained from Amcor, while data used for savings obtained from using recycled glass in bottle manufacture were obtained from Enviros Consulting (2003). Using these data, the least carbon intensive scenario is for the PET bottle (54g) made from 100% recycled material. This scenario is theoretical as there are no 100% recycled content PET bottles on the market. PET bottles commonly have 0% recycled content, as most recycled PET is used for textiles. Currently in the UK, recycled content for glass bottles is about 82% and for PET is 0%. If this comparison is made, (0% recycled content PET to the 82% recycled content glass) then PET is less carbon intensive than 500g and 460g glass bottles, but more carbon intensive than the 300g and 365g glass bottles. Note that throughout this study, a recycled content of 81% was used for glass because of the eastern European origin of some of the glass. Below are the average gCO2 per bottle for each category represented graphically above. Values are derived using average UK production figures and do not include emissions arising from tertiary packaging. Figure D.2 Table of the average gCO2 per bottle for each category
Recycled content 0% 38% 50% 82% 100%
500g export 598 550 535 494 471
460g export 595 547 532 492 470
365g export 505 470 459 429 413
300g export 460 431 422 398 384
PET 446 400 386 347 327
PET and glass bottles 31

www.wrap.org.uk/retail


