Optimization of Tidal Upweller Design Final Report to the Maine Aquaculture Innovation Center Principal Investigators : John Riley School of Marine Sciences University of Maine Dana Morse Maine Sea Grant Program September 2001 MAIC Project # 99-12 Maine # 2999276
Transcript
Optimization of Tidal Upweller Design Final Report to the Maine Aquaculture Innovation Center Principal Investigators: John Riley School of Marine Sciences University of Maine Dana Morse Maine Sea Grant Program September 2001 MAIC Project # 99-12 Maine # 2999276
2
INTRODUCTION In February 1999 an ad hoc committee of representatives of Maine’s shellfish aquaculture industry, University of Maine and the Maine Sea Grant College Program met to discuss priorities for research to improve the performance of tidally powered shellfish upwellers. Information from this meeting was incorporated into a proposal submitted later in the year to the Maine Aquaculture Innovation Center. The project was funded and work began in January 2000. This report describes the engineering analysis and model testing conducted for this project, with the overall goal of optimizing the design of a tidal upweller used for nursery production of oyster and hard clam seed. BACKGROUND Tray culture of shellfish, particularly oysters, has been used for many years, with the trays either floating on the surface or fixed to wooden frames. At some point it was discovered that the shellfish grew faster if the water flow was vertical, passing through rather than over the bed within the tray. Over the past thirty years there has been a steady development in the technology of upwellers, both in the US and Europe (Spencer and Hepper, 1981). They have become common in hatcheries, with water pumped upward through the bed of shellfish with the flow either driven by a pump or by tidal currents. The main advantage of the latter type is that there is no dependence on electrical power, allowing them to be located in more remote locations. This advantage together with the presence of very strong tidal action has aroused the interest of shellfish growers in Maine. The design for a tidal upweller in Maine was proposed by Mook (1986) based on earlier work in Britain and on shore based systems, and a guide to construction was published (Mook, 1988) The capital cost and operating costs of this upweller were lower than for a land based system. Since that time the original design has been modified and used in Maine, Massachusetts and South Carolina. Several publications have been made available describing construction details and operating procedures (Hadley et al. 1999, Karney and Blake, 1999). These designs have generally evolved through an iterative process based on trial and error. Operators of systems in Maine have been concerned about the unevenness of flow through the upweller, the effect of varying tidal current velocities and other design considerations. This project was initiated to investigate the underlying hydrodynamic characteristics of tidally powered upwellers with the goal of optimizing the design in terms of efficiency and overall performance, using scale models and engineering analysis. A shellfish upweller of the Mook type (see Fig.1) consists of a flotation-supported raft approximately 20ft long by 10ft wide. Beneath the raft, a plywood tank 3ft wide and 3ft deep extends the length of the raft. One end of the tank is closed and the other is fitted with a diverging scoop or horn. The raft uses a single point mooring so that the scoop is always facing into the tidal current. Water entering the tank is forced upwards through an array of screened trays in boxes or “silos” suspended from the raft and containing shellfish seed. After the water has passed through the beds of seed it exits via a hole back
3
.
4
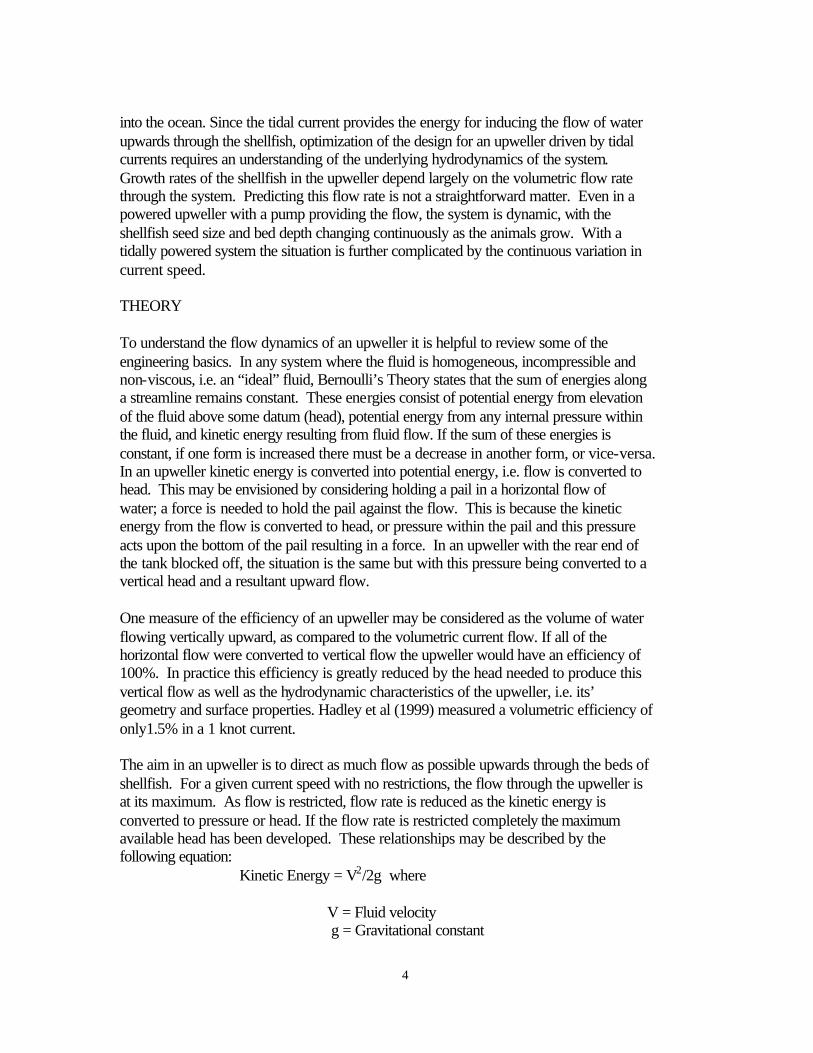
into the ocean. Since the tidal current provides the energy for inducing the flow of water upwards through the shellfish, optimization of the design for an upweller driven by tidal currents requires an understanding of the underlying hydrodynamics of the system. Growth rates of the shellfish in the upweller depend largely on the volumetric flow rate through the system. Predicting this flow rate is not a straightforward matter. Even in a powered upweller with a pump providing the flow, the system is dynamic, with the shellfish seed size and bed depth changing continuously as the animals grow. With a tidally powered system the situation is further complicated by the continuous variation in current speed. THEORY To understand the flow dynamics of an upweller it is helpful to review some of the engineering basics. In any system where the fluid is homogeneous, incompressible and non-viscous, i.e. an “ideal” fluid, Bernoulli’s Theory states that the sum of energies along a streamline remains constant. These energies consist of potential energy from elevation of the fluid above some datum (head), potential energy from any internal pressure within the fluid, and kinetic energy resulting from fluid flow. If the sum of these energies is constant, if one form is increased there must be a decrease in another form, or vice-versa. In an upweller kinetic energy is converted into potential energy, i.e. flow is converted to head. This may be envisioned by considering holding a pail in a horizontal flow of water; a force is needed to hold the pail against the flow. This is because the kinetic energy from the flow is converted to head, or pressure within the pail and this pressure acts upon the bottom of the pail resulting in a force. In an upweller with the rear end of the tank blocked off, the situation is the same but with this pressure being converted to a vertical head and a resultant upward flow. One measure of the efficiency of an upweller may be considered as the volume of water flowing vertically upward, as compared to the volumetric current flow. If all of the horizontal flow were converted to vertical flow the upweller would have an efficiency of 100%. In practice this efficiency is greatly reduced by the head needed to produce this vertical flow as well as the hydrodynamic characteristics of the upweller, i.e. its’ geometry and surface properties. Hadley et al (1999) measured a volumetric efficiency of only1.5% in a 1 knot current. The aim in an upweller is to direct as much flow as possible upwards through the beds of shellfish. For a given current speed with no restrictions, the flow through the upweller is at its maximum. As flow is restricted, flow rate is reduced as the kinetic energy is converted to pressure or head. If the flow rate is restricted completely the maximum available head has been developed. These relationships may be described by the following equation: Kinetic Energy = V2/2g where V = Fluid velocity g = Gravitational constant
5
The important point to note in this equation is that energy is proportional to the square of the velocity. The consequences of this are clearly shown if one plots the kinetic energy, expressed as power, against typical tidal current speeds, per cross-sectional area of water flow. CURRENT SPEED AVAILABLE POWER Ft/sec Knots Horsepower/ft2
1 0.77 0.0017 2 1.54 0.0142 3 2.31 0.0475 4 3.08 0.1129 5 3.85 0.2200 6 4.62 0.3804 7 5.39 0.6196 In Figure 2, these data are plotted as an example for a typical upweller tank cross-sectional area, perpendicular to the current, of 4ftx4ft, i.e. 16ft2. The effect of this exponential relationship is clearly seen; at a current speed of 2 ft/sec we can develop only 0.2 horsepower, but at 4ft/sec we have 1.8 horsepower and at 6ft/sec we have over 6 horsepower available. If all of the kinetic energy is converted to head, the following equation describes the relationship: H = V2/2g where H = Head in feet V = Fluid velocity in ft/sec g = Gravitational constant, ft/sec2
For example, with a current speed of 2ft/sec (1.5 knots): V = 2 ft/sec g = 32.2 ft/sec2 Then H = 0.062 ft (0.75 inches) In practical terms this means that at a current speed of 1.5 knots there is only 0.75 inches of head available to drive the water upwards through the bed of shellfish seed. With a current speed of 4 ft/sec (3.08 knots) the available head is approximately 3 inches. This equation may be plotted graphically to show the head/flow relationship for different
6
FIGURE 2. Horsepower available from a 16 square foot frontal area in varying current speeds
0
2
4
6
8
10
12
0 1 2 3 4 5 6 7 8
Current speed ft/sec
Ho
rsep
ow
er
7
current speeds – see Figure 3. Each of these curves may be thought of as individual “pump” curves for different horsepower pumps. The above application of Bernoulli’s theories is, as noted, for an ideal fluid, that is a non-viscous fluid. For “real”(viscous) fluids the theory holds up well until the effect of a solid boundary in the fluid flow is present. When a viscous fluid flows past a solid boundary there is no relative motion between the fluid particles immediately in contact with the solid boundary and the boundary itself. This results from the presence of shearing forces within a viscous fluid and results in frictional forces and a drag force on the solid body. Even in the flow of water, which has a very low coefficient of viscosity, the frictional effect of the fluid near a solid boundary must be considered. The existence of these shearing forces requires an energy input to maintain flow; this is generally expressed in pumping systems as the Frictional Head Loss and since it depends, among several factors, on the velocity of the fluid it can also be referred to as the Dynamic Head. Thus there are two components to Head as related to pumping systems: Static Head representing the actual vertical lift imparted to the fluid, and Dynamic Head resulting from flow over solid bodies. Both of these together comprise the Total Head. In a shellfish upweller, if the outlets from the bins are above water level there will be a static head represented by the height of the outlets above water level. The water is also being pumped through a bed of seed and the frictional head losses can be significant. In fact, since the object is to have the nutrient-containing water in contact with every shellfish seed, there are only limited ways in which these frictional losses can be reduced. In any granular material the frictional loss is a function of bed depth, the size and shape of the particles, and the velocity of flow, as well as the fluid constants, density and viscosity coefficient. It is known that the frictional losses are proportional to the square of velocity but the effects of shell size and shape and porosity of the bed cannot be predicted with any accuracy. In addition to the frictional head losses through the bed of shellfish, there will be losses as the fluid passes through the tank, screens, and the outlets from the seed bins. Flow velocity through the tank is extremely low and for practical purposes frictional losses here can be ignored. However, fine mesh screens and restricted outlets may contribute significant losses but again cannot be predicted accurately from theory. Head loss vs velocity curves for given bed depths and seed sizes must therefore be obtained experimentally. These are known as “system curves”. If we plot the tidal “pump” curve and the “system” curve on the same graph with the same scales the intersection of the two curves represents the “operating point” of the system. Figure 4 shows a schematic of this relationship. For a particular current speed and a particular bed depth and seed size we are able to drop a line from the intersection of the two curves and read off the predicted water velocity through the bed. Knowing the cross-sectional area of the tray or box allows us to convert this velocity figure into mass flow (e.g. gals/min).
8
FIGURE 3. Potential Head/Flow Velocity for Three Current Speeds
0
0.5
1
1.5
2
2.5
3
3.5
0 0.5 1 1.5 2 2.5 3 3.5 4 4.5
Flow Velocity Through Upweller (ft/sec)
Hea
d (
ins)
3 ft/sec
2 ft/sec
4 ft/sec
9
FIG 4. Typical Pump/System Curves
Velocity
Hea
d/H
ead
Lo
ss
Pump Curve
System Curve
Operating Point
10
However, it is known that this is a dynamic situation in that the frictional head loss curve changes slowly as the shellfish grow and the maximum kinetic energy available changes with current speed which varies sinusoidally with the changing tides. This situation could be represented by a series of curves for both current speed and seed characteristics but in fact these changes are continuous and regular. So far this analysis has focused on maximum current velocities but another alternative is to use mean or average current velocity during the tidal cycle where: Vav = Vmax x 2/Π This does introduce a complication; if there is any static head there would be a minimum current speed necessary to overcome this, i.e. a threshold, below which there would be no flow through the seed bed and averaging tidal flow over the entire tidal cycle would not produce accurate predictions. MATERIALS AND METHODS There were two components to the practical aspects of this study, construction and testing of model upwellers, and field measurement of frictional losses through various sizes and types of shellfish seed. Frictional Loss Testing The objective of these experiments was to develop a series of head loss/flow curves for different sizes of shellfish seed in different bed depths. The apparatus shown in Figure 5 was constructed to accomplish this. It consisted of a 4” inside diameter, 6” long clear plexiglas pipe with a 200 micron screen at the bottom, on which the seed were placed. Under the screen a distribution plenum was supplied with water. At the water inlet a manometer was attached, preceded by a gate valve for controlling flow rate. The top of the pipe was fitted with a cover, with an outlet running to waste. The apparatus was first set up at a local oyster hatchery, and connected to a seawater supply. Oyster seed was placed on the screen to a specified depth, the pipe cover was screwed down and the water slowly turned on using the valve, until the pipe was full. The manometer was then zeroed at no flow conditions. Flow was then increased gradually and a series of manometer readings taken at different flow rates. The increasing manometer readings represented the increasing frictional head loss though the bed of oyster seed. Flow rate was measured by timing collection in a measuring cylinder. Experiments were conducted with three different sizes of oyster seed, approximately 3, 7, and 15mm. Later in the year these experiments were repeated using hard clam (mercenaria mercenaria) seed of three sizes, 3, 6, and 8mm. Model Testing The problem of studying different designs and modifications of upwellers lends itself to scale model testing, and the University of Maine’s wave/tow tank provided a suitable facility for such tests. Physical modelling has been used extensively in the study of fluid flow problems for hundreds of years. Models are used to optimize the design of offshore
11
12
structures and for the design and analysis of ship hulls. The theory of fluid flow modelling is quite complex and will only briefly be discussed. The basic requirement for modelling is that there is geometric similarity between model and prototype, i.e., a consistent scale where all length ratios are the same. If we are modelling an upweller which is, for example, 25ft long, 10ft wide and 5ft deep and wish to use a scale, n of 1/5, then the model must be 5ft x 2ft x 1ft. For modelling which involves time (e.g. velocity, flow rate) we need kinematic similarity. It can be shown that this requirement is satisfied if the Froude numbers (see Appendix A) are equal; to attain this, the ratio of velocities of the model and prototype must be equal to √n. For example, if the current speed for the prototype is 2 knots, then the model current speed must be 2 x √1/5 = 0.89 knots. For tests involving length, time and force we need dynamic similarity. This requires that the Reynolds numbers (see Appendix A) be equal. This term includes the viscosity of the fluids and it can be shown that the ratio of kinematic viscosities of model and prototype be equal to n3/2. With water as the fluid in the prototype, for a scale of n = 1/5 we would need a model fluid velocity of 0.09 times that of water. No such fluid exists so any modelling involving viscous forces is “distorted”. There are procedures to deal with this distortion but for this study we have not made any predictions from model to prototype of forces resulting from resistance of the fluid as measured by viscosity. In these cases we have only compared the performance of one model with another; here the length scale is unity and the dynamic similarity requirement is met. The University of Maine wave/towing tank is 120ft long, 8ft wide and 4ft deep with a lexan underwater viewing window at the mid-point. It contains 25,000 gallons of freshwater continuously filtered and ozonated to prevent any biological growth. An aluminum carriage 8ft wide and 4ft long rides on tracks running the length of the tank and driven through a stainless steel tape drive by a 5.6kW (7.5hp) three phase motor digitally controlled by a programmable inverter. The system can provide a maximum speed through the water of 2.5 m/sec (approximately 5 knots). Maximum design drag force is 538 N (121 lbf) and is measured by strain gauge load cells between carriage and model, with the signal transmitted to the control room by a festooned instrumentation cable carried on a track on the ceiling. In the control room a wide range strain indicator and continuous chart recorder provide data acquisition. Flow velocity is measured with a Nixon Streamflo Probe (Novonic Instruments, Gloucester, England) with the signal carried in the instrumentation cable to an indicator in the control room. The system also has wavemaking capabilities but these were not used in this study. Plywood models were fabricated to a length scale of 1/5. The first model was based on the original Mook upweller from plans first published in 1988. Modifications to this design have been made since that time but it was felt important to begin here and try to understand the reasons for these modifications. A schematic diagram of the upweller is shown in Figure 1, and the model is shown in Figures 6a and 6b. The powered carriage on the wave/tow tank was used to tow the upweller through the water at speeds simulating currents of up to 5 knots. Figure 7 shows the upweller in the tank.
13
ents
14
15
16
Several weeks were spent observing the behaviour of the model without any measurements of flow rates through the individual bins as the researchers were unable to locate a flow meter small enough and with a low enough range. Flow rates through the collection trough however were measurable. Later in the project a suitable flow meter was made available. As a result of our observations several modifications were made to the original, and two further models were constructed to evaluate various suggested concepts, for example, scoops of different size and geometry were made, and the size and shape of the outlet holes from the bins was made variable. RESULTS Frictional Loss Tests The results are shown in Figures 8a and 8b. The curves show the classic response with head loss increasing exponentially with increasing flow rate. The flow rate was increased up to the point where there was “boiling” in the bed of shellfish seed or to the limit of the apparatus. This boiling can create channels through the bed, resulting in non-uniform flow. Channeling in an upweller is an undesirable situation because the seed would be subjected to high flow rates in some part of the bed, and zero flow in others. The significant point to note is that the smaller seed produce a higher frictional loss than the two larger sizes( almost twice the loss at lower flow rates). The smallest oyster seed began to “boil” at a water velocity through the bin of approximately 2 ft/min (1 cm/sec), and the same sized clam seed at 2.5 ft/min. The size difference between the larger clam seed was not as large as for the oysters and there is virtually no difference in the curves. Model Testing Stability and variation of flow rates It was immediately clear that only a fraction of the current flow was actually translated into flow through the upweller bins and out into the collection trough. It was also interesting to note that as current speed increased, the bow of the upweller dropped and the exit holes from the bins at the stern became elevated to the point where there was no flow through these bins. With less than two inches of total head available (at a 2 knot current) the flow could not overcome this static head and flow through these rear bins was reduced. Operators of some upwellers have reported greater growth in the front bins, so the importance of keeping the upweller horizontal is clear. Other researchers have not noticed this uneven growth but it is likely that in those situations current speeds were relatively low (<2 knots) and that the problem only occurs at higher current speeds such as occur in Maine. When ballasted with strategically placed bricks on the deck, the model remained relatively level at a particular current speed and flow through the bins was observed to be more uniform. This was confirmed when a suitable flow meter was obtained. However it was necessary to move the ballast for every current speed to ensure a level deck, and this is obviously not a practical solution.
17
FIGURE 8a. Frictional Losses for Three Sizes of Oyster Seed
0
0.5
1
1.5
2
2.5
3
3.5
0 0.5 1 1.5 2 2.5 3
Water Velocity Through the Bed (ft/min)
Hea
d L
oss
per
Inch
of
Bed
Dep
th (
ins)
3mm oysters7mm oysters15mm oysters
18
FIGURE 8b. Frictional Losses for Three Sizes of Hard Clam Seed
0
2
4
6
8
10
12
14
0 0.5 1 1.5 2 2.5 3 3.5 4 4.5
Water Velocity Through the Bed (ft/min)
Hea
d L
oss
per
Inch
of
Bed
Dep
th (
ins)
3mm clams6mm clams8mm clams
19
An attempt was made to reduce the diving of the front of the upweller by installing angled planes at the bow. Several different sized planes, at several angles of attack were tried with no success and it was concluded that if planes were to be successful even at these relatively low speeds they would have to be extremely large hydrofoils. Scoop Size If the cross-sectional area of the tank and the opening presented to the tidal current flow is increased, then the volume flow through the upweller will increase. However, there is no increase in velocity and therefor no increase in potential head. This is the same situation as placing two pumps in parallel. Use of a converging mouth or scoop on the front of the tank increases both flow rate and velocity so has the potential to develop greater head. However, this increase is not a proportional one and is greatly affected by the geometry of the scoop. Unless the flow contraction is well streamlined there can be a significant energy loss. Analytical prediction of these energy losses is not possible but a series of experiments by Gibson (1952) indicated that minimum energy loss occurred when the angle of the contraction was approximately 7 degrees. This presents a practical problem since a scoop designed to increase the area presented to the current flow from, say 6ft wide to 8ft wide with a 7 degree angle of contraction would need to be 16ft long. So there has to be some compromise. In addition, the energy losses are affected by the nature of the forward edge of the scoop. A well-rounded edge produces less energy loss than if it is square-edged. Since most scoops we have encountered have a convergence well above the 7 degree figure and have square edges there is a significant energy loss. The model tests with three different sized scoops gave interesting results. The three scoops, designated small, medium and large are shown in Figure 9. Actual dimensions are shown in Appendix B. The upweller was fitted with each scoop in turn and towed through the tank at various speeds. The rear of the tank was removed and the flow through the upweller measured in the center of the tank. One run was conducted with no scoop. Results are shown in Figure 10. It is interesting to note that the increase in flow at a given current speed with the increasing size of scoop is by no means linear and is actually quite small. The biggest scoop, with a large angle of contraction in fact produced less flow than the medium scoop. The project also sought to minimize mooring line and anchoring forces. As flow through the upweller increases, the hydrodynamic drag force increases exponentially. In addition there is a force on the rear wall of the tank resulting from the horizontal flow being directed vertically. Both of these forces affect the load on the mooring line and anchor. It has been suggested that flow rate could be increased and mooring forces reduced by installing curved vanes to direct the water flow upwards from the tank. However, by the Law of Conservation of Momentum as the flow makes a ninety degree turn from horizontal to vertical there will always be a horizontal force on the back wall of the tank and it will be proportional to the horizontal flow velocity. The horizontal force would not change with the installation of curved vanes and would be transferred from.
20
21
FIGURE 10. Flow Relationships for Different Scoop Sizes
0
0.5
1
1.5
2
2.5
3
3.5
0 0.5 1 1.5 2 2.5 3 3.5
Current Speed (ft/sec)
Flo
w V
elo
city
th
rou
gh
Tan
k (f
t/se
c)
small scoop
no scoop
medium scoop
large scoop
22
the vanes to the body of the upweller and then to the mooring line and anchor. Any increase in flow would derive from a reduction in frictional losses. Another suggestion for a way to reduce drag forces and mooring loads at high current speeds was to use the rear wall of the tank as a “relief valve”. One of the models was fitted with this wall hinged at the top but otherwise unrestrained. With varying sizes of weight attached to the bottom of this flap, the model spilled water progressively as current speed increased. With a weight of 5 lbs attached the model flap did not begin to open measurably until a (model) current speed of 1ft/sec was reached. With a length scale of 1/5 and volume as an indicator of weight the same result would be expected with a weight of 5 x 53 = 625 lbs. Outlet sizing The theory indicated that frictional losses through the upweller should be reduced as much as is practical. Karney and Blake (2000) reported a large increase in production capability relative to a Mook upweller with the outlet holes removed to reduce constriction but it is difficult to attribute all of this increase to this effect as there were many other modifications made. In our testing, the original model used 1in PVC pipe for bin outlets. The second model used a rectangular outlet 3in x 1.5in. The PVC pipe was removed from Model #1 giving an outlet size of 1.5 inches diameter. Tests were conducted with the two models at two different current speeds. While flow velocity slowed through the larger outlet there was almost a doubling of volume flow through the bins indicating that the outlet presents a relatively large restriction to flow. See Figure 11. . CONCLUSIONS & RECOMMENDATIONS Conclusions were drawn from the theoretical analysis, the field testing of frictional losses, and from the scale model tests. The field testing of frictional losses through different depth beds and different sizes of oyster and hard clam seed produced interesting but not unexpected results. The size of the seed affects the frictional head losses through the system and thus the flow rate. It is clear that for very small seed (less than 5mm) the initial depth of the bed should be kept relatively small, perhaps < 0.5 inch. If the bins are stocked with seed larger than this, the bed depth can be greater. High flow rates can cause channeling in the beds, and “boiling” of the seed leading to uneven growth and potential damage to the seed, particularly the smaller sizes. The fluid velocity through the bed should not exceed 2ft/min (1 cm/sec) for small oyster seed and 2.5ft/min (1.25 cm/sec) for small hard clam seed. It is interesting to note that Hadley (1999) measured maximum velocities through oyster seed of approximately 0.5 cm/sec in a 2 knot current . There is therefore no incentive to try to design for current speeds much above 4 knots for small seed. This is one reason to limit velocities through the upweller at high current velocities by providing a “safety valve” such as the hinged rear wall of the tank. In terms of construction of such a device, the plywood wall could be hinged with rubber belting and the weights cast in concrete.
23
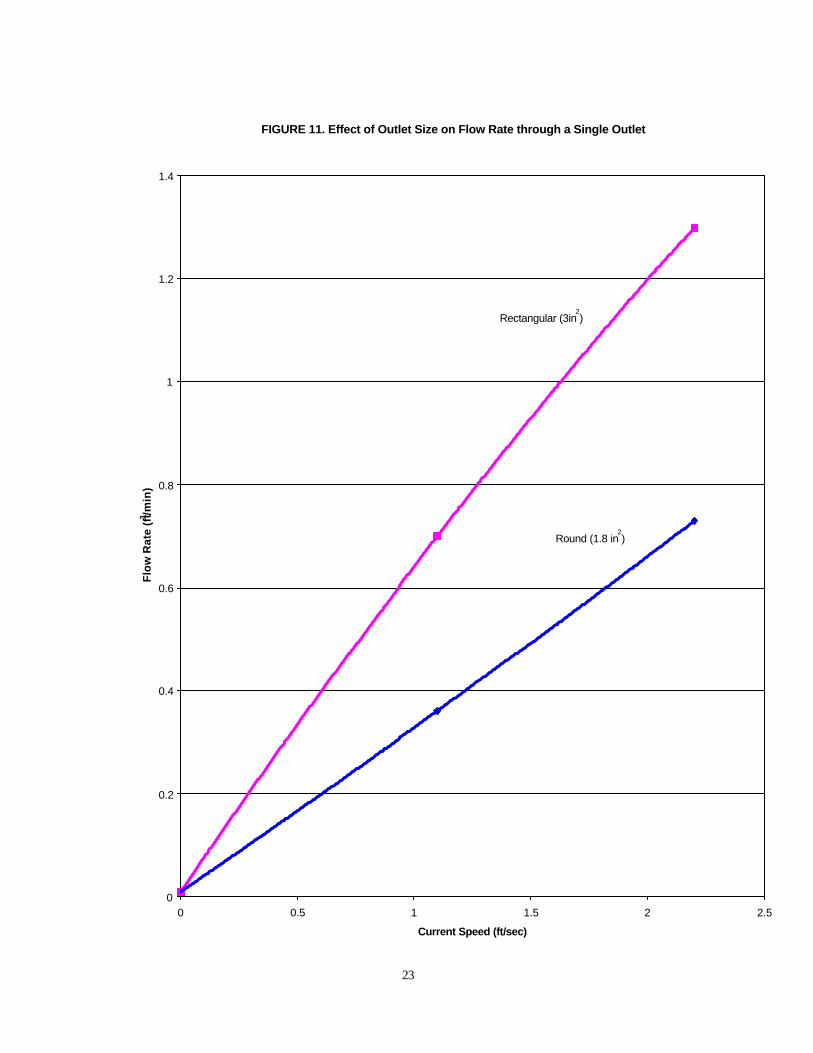
FIGURE 11. Effect of Outlet Size on Flow Rate through a Single Outlet
0
0.2
0.4
0.6
0.8
1
1.2
1.4
0 0.5 1 1.5 2 2.5
Current Speed (ft/sec)
Flo
w R
ate
(ft3 /m
in)
Round (1.8 in2)
Rectangular (3in2)
24
Maintaining the raft in a horizontal position with all bin outlet holes submerged will ensure even growth in all bins. There was no noticeable variation in flow through different bins if the raft was kept level. If the upweller has a tendency to dig in at the bow at high current speeds or if anchoring considerations are critical the hinged flap described above offers a solution. The addition of a scoop at the front of the tank will increase velocity and therefore flow rate through the upweller but bigger is not necessarily better. For example, a modest increase of 50% in the area presented to the current, with a scoop length equal to its width, results in an angle of convergence of 26 degrees, well above the 7 degree ideal. Larger scoops with very high angles of convergence result in turbulence at the mouth, with very little or even no increase in flow and also increase the drag on the upweller generating higher mooring forces. The 45 degree angle of contraction used in the original Mook design should be reduced to an angle of no more than 30 degrees. The outlets from the seed bins should be as large as is practical. If PVC pipe is used it should be at least 4” diameter. With the extremely small head developed by tidal current velocities any restriction to flow will have a significant effect. There have been reports suggesting modifying the outlets in various ways to achieve a venturi effect. Unfortunately the theory of venturis does not support this idea since the flow velocity outside the “venturi” is in fact lower than the velocity inside. The most important overall conclusion is that the original Mook design was well thought out and that there is no reason to abandon this concept. Modifications made to this design by others have been relatively minor; some were successful, others less so. Construction methods have been streamlined and alternate materials tried but there have been no statistically supported significant breakthroughs in efficiency. This current study did not produce a radical new design but does help explain why certain modifications work and others do not. ACKNOWLEDGEMENTS The authors wish to express their gratitude to Marshall Point Sea Farm and Pemaquid Oyster Company for making available shellfish seed for the frictional loss tests and for providing facilities for conducting these tests. Muscongus Bay Aquaculture allowed us to visit their upweller and provided useful information. Our thanks also to Phil Tarbox for his many hours of model making and to Ian Riley for construction of the friction loss device and assistance with the field work.
25
REFERENCES Gibson, A.H. Hydraulics and its Applications, fifth edition, Constable and Company, Ltd, London, 1952. Hadley, N.C., R.B.Baldwin, M.R.Devoe, and R. Rhodes. “Performance of a Tidally-Powered Upwelling Nursery System for Northern Quahogs(Hardclams) (Mercenaria mercenaria) in South Carolina. Journal of Shellfish Research, Vol.18, No.2, 555-560, 1999. Karney, R.C. and J. Blake. “An Improved Tidal-Powered Upwelling Shellfish Nursery System for (Martha’s) Vineyard Aquaculturists”. Final Report to NFWF/NOAA. Martha’s Vineyard Shellfish Group, Inc., 2000. Mook, W.H. “A Proposal for a Tidally Powered Bivalve Nursery”. DOC/SBIR Proposal 1986. Mook.,W.H.. “Guide to Construction of a Tidal Upweller”. Final Report to the Maine Science and Technology Board, 1988. Spencer, B.E. and B.T. Hepper. “Tide Powered Upwelling Systems for Growing Nursery Size Bivalves in the Sea”. In: Nursery Culture of Bivalve Molluscs, Edited by C.Claus, N.DePauw and E. Jaspers. European Mariculture Society Special Publication No.7, 1981
26
APPENDIX A Reynolds Number = VDρ/µ where: V = Characteristic flow velocity D = Characteristic linear dimension ρ = Density of the fluid µ = Viscosity of the fluid Froude Number = V2 /LG where: V = Characteristic flow velocity L = Characteristic linear dimension G = Gravitational constant