+ All Categories
Home > Documents > Final Risk Evaluation for 1-Bromopropane n-Propyl Bromide ...

Final Risk Evaluation for 1-Bromopropane n-Propyl Bromide ...

Date post: 18-Dec-2021
Category:
Upload: others
View: 2 times
Download: 0 times
Share this document with a friend
139
Final Risk Evaluation for 1-Bromopropane (n-Propyl Bromide) CASRN: 106-94-5 Supplemental Information on Human Health Benchmark Dose Modeling August 2020 United States Environmental Protection Agency Office of Chemical Safety and Pollution Prevention
Transcript

Final Risk Evaluation for

1-Bromopropane

(n-Propyl Bromide)

CASRN: 106-94-5

Supplemental Information on Human Health Benchmark Dose Modeling

August 2020

United States

Environmental Protection Agency Office of Chemical Safety and

Pollution Prevention

2

TABLE OF CONTENTS

TABLE OF CONTENTS ............................................................................................................. 2

LIST OF TABLES ........................................................................................................................ 4

LIST OF FIGURES ...................................................................................................................... 9

ACKNOWLEDGEMENTS ....................................................................................................... 12

1 INTRODUCTION.................................................................................................................... 13

2 BENCHMARK DOSE MODELING OF NON-CANCER EFFECTS ............................... 13

2.1 BENCHMARK DOSE MODELING OF NON-CANCER EFFECTS FOR ACUTE EXPOSURES ................................. 13 Decreased Live Litter Size ..................................................................................................................... 13 Post implantation loss ............................................................................................................................ 18

2.2 BENCHMARK DOSE MODELING OF NON-CANCER EFFECTS FOR CHRONIC EXPOSURES .............................. 27 Increased Incidence of Vacuolization of Centrilobular Hepatocytes in Males ...................................... 27 Increased Incidence of Vacuolization of Centrilobular Hepatocytes in Males ...................................... 30 Increased Incidence of Vacuolization of Centrilobular Hepatocytes in Females .................................. 33 Increased Incidence of Renal Pelvic Mineralization in Males .............................................................. 36 Increased Incidence of Renal Pelvic Mineralization in Females ........................................................... 39 Decreased Seminal Vesicle Weight ........................................................................................................ 41

Decreased Relative Seminal Vesicle Weight .................................................................................................... 42 Decreased Absolute Seminal Vesicle Weight ................................................................................................... 44

Decreased Percent Normal Sperm Morphology .................................................................................... 47 Decreased Percent Motile Sperm .......................................................................................................... 52 Decreased Left Cauda Epididymis Weight ............................................................................................ 54 Decreased Right Cauda Epididymis Weight .......................................................................................... 57 Increased Estrus Cycle Length .............................................................................................................. 60 Decreased Antral Follical Count ........................................................................................................... 62 Decreased Male and Female Fertility Index ......................................................................................... 62 Decreased Implantations Sites ............................................................................................................... 65 Decreased Pup Body Weight ................................................................................................................. 69

Decreased Body Weight in F1 Male Pups at PND 28 ....................................................................................... 69 Decreased Body Weight in F2 Female Pups at PND 14 .................................................................................... 75 Decreased Body Weight in F2 Female Pups at PND 21 .................................................................................... 78 Decreased Body Weight in F2 Male Pups at PND 14 ........................................................................................ 80 Decreased Body Weight in F2 Male Pups at PND 21 ........................................................................................ 83

Decreased Brain Weight ........................................................................................................................ 86 Decreased Brain Weight in F0 Females ............................................................................................................. 86 Decreased Brain Weight in F0 Males ................................................................................................................ 88 Decreased Brain Weight in F1 Females as Adults ............................................................................................. 91 Decreased Brain Weight in F1 Males as Adults................................................................................................. 93 Decreased Brain Weight in F2 Females at PND 21 ........................................................................................... 95 Decreased Brain Weight in F2 Males at PND 21 ............................................................................................... 98

Decreased Hang Time ......................................................................................................................... 101

3 BENCHMARK DOSE MODELING OF TUMORS .......................................................... 107

3.1 LUNG TUMORS IN FEMALE MICE.............................................................................................................. 108 Summary of Multistage Model ............................................................................................................. 111

Selected Frequentist Multistage - Multistage 1 Restricted; Extra Risk, BMR = 0.001 and 0.1, doses are in ppm

111 Selected Frequentist Multistage - Multistage 1 Restricted; Added Risk, BMR = 0.001 and 0.1, doses are in ppm

114 Summary of Frequentist Model Averaging .......................................................................................... 116 Summary of Bayesian Model Averaging .............................................................................................. 117

Bayesian Model Averaging – Extra Risk, BMR = 0.001 and 0.1, doses are in ppm ....................................... 117 Bayesian Model Averaging – Added Risk, BMR = 0.001 and 0.1, doses are in ppm ..................................... 118

Page 3 of 139

3.2 LARGE INTESTINE ADENOMAS IN FEMALE RATS ...................................................................................... 119 Summary of Multistage Model ............................................................................................................. 122

Selected Frequentist Multistage - Multistage 1 Restricted; Extra Risk, BMR = 0.001 and 0.1, doses are in ppm

122 Selected Frequentist Multistage - Multistage 1 Restricted; Added Risk, BMR = 0.001 and 0.1, doses are in ppm

125 Summary of Frequentist Model Averaging .......................................................................................... 126 Summary of Bayesian Model Averaging .............................................................................................. 127

Bayesian Model Averaging – Extra Risk, BMR = 0.001 and 0.1, doses are in ppm ....................................... 127 Bayesian Model Averaging – Added Risk, BMR = 0.001 and 0.1, doses are in ppm ..................................... 128

3.3 KERATOACANTHOMA AND SQUAMOUS CELL CARCINOMAS IN MALE RATS ............................................ 129 Summary of Multistage Model ............................................................................................................. 132

Selected Frequentist Multistage - Multistage 1 Restricted; Extra Risk, BMR = 0.001 and 0.1, doses are in ppm

132 Selected Frequentist Multistage - Multistage 1 Restricted; Added Risk, BMR = 0.001 and 0.1, doses are in ppm

134 Summary of Frequentist Model Averaging .......................................................................................... 135 Summary of Bayesian Model Averaging .............................................................................................. 136

Bayesian Model Averaging – Extra Risk, BMR = 0.001 and 0.1, doses are in ppm ....................................... 136 Bayesian Model Averaging – Added Risk, BMR = 0.001 and 0.1, doses are in ppm ..................................... 137

4 REFERENCES ....................................................................................................................... 138

Page 4 of 139

LIST OF TABLES

Table 2-1 Litter Size Data Selected for Dose-Response Modeling for 1-BP ................................... 13 Table 2-2 Summary of BMD Modeling Results for Reduced Litter Size in F0 Generation Exposed

to 1-BP by Inhalation; BMRs of 1 Standard Deviation, and 5% and 1% Relative Deviation From

Control Mean. ................................................................................................................................... 14 Table 2-3 BMD Modeling Results for Reduced Litter Size in F0 Generation Exposed to 1-BP by

Inhalation; BMRs of 1 Standard Deviation, and 5% and 1% Relative Deviation From Control

Mean. ................................................................................................................................................ 15

Table 2-4 BMD Modeling Results for Reduced Litter Size in F0 Generation Following Inhalation

Exposure of Parental Rats to 1-BP in a Two-Generation Study with Variances Fixed at Smallest,

Pooled and Highest Values. .............................................................................................................. 17 Table 2-5. Implantation sites and incidence of post implantation loss in pregnant female rats in the

F0 generation exposed to 0, 100, 250 ppm 1-BP by Inhalation WIL Research {, 2001, 2990994} .. 18

Table 2-6 Summary of BMDS modeling results for incidence of post implantation loss in female

rats exposed to 1-BP by Inhalation (WIL Research, 2001); BMR = 5% extra risk. Dose groups = 0,

100, 250 ppm. ................................................................................................................................... 21

Table 2-7 Summary of BMDS modeling results for incidence of post implantation loss in female

rats exposed to 1-BP by Inhalation (WIL Research, 2001); BMR = 1% extra risk. Dose groups = 0,

100, 250 ppm. ................................................................................................................................... 22

Table 2-8 Summary of BMDS modeling results for incidence of post implantation loss in female

rats exposed to 1-BP by Inhalation (WIL Research, 2001); BMR = 5% extra risk. Dose groups = 0,

100, 250 ppm. ................................................................................................................................... 23 Table 2-9 Summary of BMDS modeling results for incidence of post implantation loss in female

rats exposed to 1-BP by Inhalation (WIL Research, 2001); BMR = 1% extra risk. Dose groups = 0,

100, 250 ppm. ................................................................................................................................... 24 Table 2-10 Summary of BMDS modeling results for incidence of post implantation loss in female

rats exposed to 1-BP by Inhalation (WIL Research, 2001); BMR = 5% extra risk. Dose groups = 0,

100, 250, 500 ppm. ........................................................................................................................... 25

Table 2-11 Summary of BMDS modeling results for incidence of post implantation loss in female

rats exposed to 1-BP by Inhalation (WIL Research, 2001); BMR = 1% extra risk. Dose groups = 0,

100, 250, 500 ppm. ........................................................................................................................... 26

Table 2-12 Incidence of Vacuolization of Centrilobular Hepatocytes Selected for Dose-Response

Modeling for 1-BP ............................................................................................................................ 28

Table 2-13 Summary of BMD Modeling Results for Vacuolization of Centrilobular Hepatocytes in

Male F0 Rats Following Inhalation Exposure to 1-BP in a Two-Generation Study ......................... 28 Table 2-14 BMD Modeling Results for Reduced Litter Size in F0 Generation Exposed to 1-BP by

Inhalation; BMRs of 1 Standard Deviation, and 5% and 1% Relative Deviation From Control

Mean. ................................................................................................................................................ 30

Table 2-15 Incidence of Vacuolization of Centrilobular Hepatocytes Selected for Dose-Response

Modeling for 1-BP ............................................................................................................................ 31

Table 2-16 Summary of BMD Modeling Results for Vacuolization of Centrilobular Hepatocytes in

Male Rats Following Inhalation Exposure to 1-BP .......................................................................... 31 Table 2-17 BMD Modeling Results for Vacuolization of Centrilobular Hepatocytes in Male Rats

Exposed to 1-BP Via Inhalation; BMR 10% Added Risk. ............................................................... 32 Table 2-18 Incidence of Vacuolization of Centrilobular Hepatocytes Selected for Dose-Response

Modeling for 1-BP ............................................................................................................................ 34

Page 5 of 139

Table 2-19 Summary of BMD Modeling Results for Vacuolization of Centrilobular Hepatocytes in

Female F0 Rats Following Inhalation Exposure to 1-BP in a Two-Generation Study ..................... 34 Table 2-20 BMD Modeling Results for Vacuolization of Centrilobular Hepatocytes in Female Rats

Exposed to 1-BP Via Inhalation; BMR 10% Added Risk. ............................................................... 35

Table 2-21 Incidence of Renal Pelvic Mineralization Selected for Dose-Response Modeling for

1-BP .................................................................................................................................................. 37 Table 2-22 Summary of BMD Modeling Results for Renal Pelvic Mineralization in Male F0 Rats

Following Inhalation Exposure to 1-BP in a Two-Generation Study ............................................... 37 Table 2-23 BMD Modeling Results for Renal Pelvic Mineralization in Male Rats Exposed to 1-BP

Via Inhalation; BMR 10% Added Risk. ........................................................................................... 38 Table 2-24 Incidence of Renal Pelvic Mineralization Selected for Dose-Response Modeling for

1-BP .................................................................................................................................................. 39 Table 2-25 Summary of BMD Modeling Results for Renal Pelvic Mineralization in Female F0 Rats

Following Inhalation Exposure to 1-BP in a Two-Generation Study ............................................... 40 Table 2-26 BMD Modeling Results for Renal Pelvic Mineralization in Female Rats Exposed to 1-

BP Via Inhalation; BMR 10% Added Risk. ..................................................................................... 40 Table 2-27 Relative Seminal Vesicle Weight Data Selected for Dose-Response Modeling for 1-BP

........................................................................................................................................................... 42

Table 2-28 Summary of BMD Modeling Results for Relative Seminal Vesicle Weight in Rats

Exposed to 1-BP by Inhalation ......................................................................................................... 42

Table 2-29 BMD Modeling Results for Relative Seminal Vesicle Weight; BMR = 1 Standard

Deviation Change from Control Mean. ............................................................................................ 43 Table 2-30 Absolute Seminal Vesicle Weight Data Selected for Dose-Response Modeling for 1-BP

........................................................................................................................................................... 45 Table 2-31 Summary of BMD Modeling Results for Seminal Vesicle Absolute Weight in Rats

Exposed to 1-BP by Inhalation ......................................................................................................... 45

Table 2-32 BMD Modeling Results for Seminal Vesicle Absolute Weight; BMR = 1 Standard

Deviation Change from Control Mean. ............................................................................................ 46 Table 2-33 Sperm Morphology Data Selected for Dose-Response Modeling for 1-BP ................... 47

Table 2-34 Summary of BMD Modeling Results for Sperm Morphology in the F0 Generation

Exposed to 1-BP by Inhalation ......................................................................................................... 48 Table 2-35 BMD Modeling Results for Sperm Morphology in F0 Rats Exposed to 1-BP by

Inhalation; BMR = 1 Standard Deviation Change from Control Mean. ........................................... 49 Table 2-36 Sperm Motility Data Selected for Dose-Response Modeling for 1-BP ......................... 53

Table 2-37 Summary of BMD Modeling Results for Sperm Motility F0 Male Rats Following

Inhalation Exposure to 1-BP ............................................................................................................. 53 Table 2-38 Summary of BMD Modeling Results for Sperm Motility F0 Male Rats Following

Inhalation Exposure to 1-BP with the Highest Dose Dropped ......................................................... 54 Table 2-39 Left Cauda Epididymis Absolute Weight Data Selected for Dose-Response Modeling

for 1-BP ............................................................................................................................................. 55 Table 2-40 Summary of BMD Modeling Results for Left Cauda Epididymis Absolute Weight F0

Male Rats Following Inhalation Exposure to 1-BP .......................................................................... 55 Table 2-41 BMD Modeling Results for Left Cauda Epididymis Absolute Weight; BMR = 1

Standard Deviation Change from Control Mean. ............................................................................. 56 Table 2-42 Right Cauda Epididymis Absolute Weight Data Selected for Dose-Response Modeling

for 1-BP ............................................................................................................................................. 58

Page 6 of 139

Table 2-43 Summary of BMD Modeling Results for Right Cauda Epididymis Absolute Weight F0

Male Rats Following Inhalation Exposure to 1-BP .......................................................................... 58 Table 2-44 BMD Modeling Results for Right Cauda Epididymis Absolute Weight; BMR = 1

Standard Deviation Change from Control Mean .............................................................................. 59

Table 2-45 Estrus Cycle Length Data Selected for Dose-Response Modeling for 1-BP ................. 61 Table 2-46 Summary of BMD Modeling Results for Estrus Cycle Length F0 Female Rats

Following Inhalation Exposure to 1-BP ........................................................................................... 61 Table 2-47 Antral Follicle Count Data Selected for Dose-Response Modeling for 1-BP ................ 62 Table 2-48 Summary of BMD Modeling Results for Antral Follical Count in Female Rats

Following Inhalation Exposure to 1-BP ........................................................................................... 62 Table 2-49 Fertility Index Data Selected for Dose-Response Modeling for 1-BP ........................... 63 Table 2-50 Summary of BMD Modeling Results for Fertility Index of F0 Rats Following Inhalation

Exposure of Parental Rats to 1-BP in a Two-Generation Study ....................................................... 63

Table 2-51 BMD Modeling Results for Fertility Index in Rats Exposed to 1-BP Via Inhalation

BMR 10% Extra Risk ....................................................................................................................... 64

Table 2-52 Implantations Site Data Selected for Dose-Response Modeling for 1-BP ..................... 65 Table 2-53 Summary of BMD Modeling Results for Implantations Sites in F0 Rats Following

Inhalation Exposure of Parental Rats to 1-BP in a Two-Generation Study ...................................... 66

Table 2-54 BMD Modeling Results for Implantation Sites in Rats Exposed to 1-BP Via Inhalation

in ppm BMR 1 Standard Deviation .................................................................................................. 67

Table 2-55 Pup Body Weight Data in F1 Males at PND 28 for Dose-Response Modeling ............. 69 Table 2-56 Summary of BMD Modeling Results for Body Weight of F1 Male Rat Pups on PND 28

Following Inhalation Exposure of Parental Rats to 1-BP in a Two-Generation Study .................... 70

Table 2-57 BMD Modeling Results for Pup Body Weight in Rats Exposed to 1-BP Via Inhalation

BMR 5% Relative Deviation ............................................................................................................ 71

Table 2-58 BMD Modeling Results for Pup Body Weight in Rats Exposed to 1-BP Via Inhalation

BMR 5% Relative Deviation ............................................................................................................ 73

Table 2-59 Pup Body Weight Data in F2 Females at PND 14 from Selected for Dose-Response

Modeling ........................................................................................................................................... 75

Table 2-59 Summary of BMD Modeling Results for Body Weight of F2 Female Rat Pups on PND

14 Following Inhalation Exposure of Parental Rats to 1-BP in a Two-Generation Study ............... 75 Table 2-60 BMD Modeling Results for Body Weight of F2 Female Rat Pups on PND 14 Following

Inhalation Exposure of Parental Rats to 1-BP in a Two-Generation Study with Variances Fixed at

Smallest, Pooled and Highest Values. .............................................................................................. 77

Table 2-61 Pup Body Weight Data in F2 Females at PND 21 from Selected for Dose-Response

Modeling ........................................................................................................................................... 78 Table 2-62 Summary of BMD Modeling Results for Body Weight of F2 Females on PND 21

Following Inhalation Exposure of Parental Rats to 1-BP in a Two-Generation Study .................... 78 Table 2-63 BMD Modeling Results for Pup Body Weight in Rats Exposed to 1-BP Via Inhalation

BMR = 5% Relative Deviation. ........................................................................................................ 79 Table 2-64 Pup Body Weight Data in F2 Males at PND 14 from Selected for Dose-Response

Modeling ........................................................................................................................................... 80 Table 2-65 Summary of BMD Modeling Results for Body Weight of F2 Male Rat Pups on PND 14

Following Inhalation Exposure of Parental Rats to 1-BP in a Two-Generation Study .................... 81 Table 2-66 BMD Modeling Results for Pup Body Weight in Rats Exposed to 1-BP Via Inhalation

in ppm BMR = 5% Relative Deviation. ............................................................................................ 82 Table 2-67 Pup Body Weight Data in F2 Males at PND 21.............................................................. 83

Page 7 of 139

Table 2-68 Summary of BMD Modeling Results for Body Weight of F2 Male Rat Pups on PND 21

Following Inhalation Exposure of Parental Rats to 1-BP in a Two-Generation Study .................... 84 Table 2-69 BMD Modeling Results for Pup Body Weight in Rats Exposed to 1-BP Via Inhalation

in ppm BMR = 5% Relative Deviation ............................................................................................. 84

Table 2-70 Brain Weight Data in F0 Females for Dose-Response Modeling ................................... 86 Table 2-71 Summary of BMD Modeling Results for Brain Weight of F0 Females Following

Inhalation Exposure to 1-BP ............................................................................................................. 86 Table 2-72 BMD Modeling Results for Brain Weight in F0 Female Rats Exposed to 1-BP Via

Inhalation in ppm BMR = 1 Standard Deviation .............................................................................. 87

Table 2-73 Brain Weight Data in F0 Males for Dose-Response Modeling ...................................... 89 Table 2-74 Summary of BMD Modeling Results for Brain Weight of F0 Males Following

Inhalation Exposure to 1-BP ............................................................................................................. 89 Table 2-75 BMD Modeling Results for Brain Weight of F0 Male Rats Following Inhalation

Exposure to 1-BP in a Two-Generation Study with Variances Fixed at Smallest, Pooled and

Highest Values. ................................................................................................................................. 90

Table 2-76 Brain Weight Data in F1 Females as Adults from Selected for Dose-Response Modeling

........................................................................................................................................................... 91 Table 2-77 Summary of BMD Modeling Results for Brain Weight of F1 Female Rats as Adults

Following Inhalation Exposure of Parental Rats to 1-BP in a Two-Generation Study .................... 91 Table 2-78 BMD Modeling Results for Brain Weight in F1 Female Rats as Adults Exposed to 1-BP

Via Inhalation BMR = 1% Relative Deviation. ................................................................................ 92 Table 2-79 Brain Weight Data in F1 Males as Adults from Selected for Dose-Response Modeling

........................................................................................................................................................... 94

Table 2-80 Summary of BMD Modeling Results for Brain Weight of F1 Male Rats as Adults

Following Inhalation Exposure of Parental Rats to 1-BP in a Two-Generation Study .................... 94

Table 2-81 Brain Weight Data in F2 Females at PND 21 from Selected for Dose-Response

Modeling ........................................................................................................................................... 95

Table 2-82 Summary of BMD Modeling Results for Brain Weight of F2 Female Rats at PND 21

Following Inhalation Exposure of Parental Rats to 1-BP in a Two-Generation Study .................... 95

Table 2-83 BMD Modeling Results for Brain Weight in F2 Female Exposed to 1-BP Via Inhalation

BMR = 1% Relative Deviation. ........................................................................................................ 96 Table 2-84 Brain Weight Data in F2 Males at PND 21 for Dose-Response Modeling .................... 98

Table 2-85 Summary of BMD Modeling Results for Brain Weight of F2 Male Rats as Adults

Following Inhalation Exposure of Parental Rats to 1-BP in a Two-Generation Study .................... 98

Table 2-86 BMD Modeling Results for Brain Weight in Rats Exposed to 1-BP Via Inhalation in

ppm BMR = 1% Relative Deviation ................................................................................................. 99 Table 2-87 Hang Time from a Suspended Bar Data for Dose-Response Modeling for 1-BP ........ 101 Table 2-88 Summary of BMD Modeling Results for Hang Time from a Suspended Bar; BMR = 1

std. dev. change from control mean ................................................................................................ 101

Table 2-89 BMD Modeling Results for Hang Time from a Suspended Bar; BMR = 1 Standard

Deviation Change from Control Mean ........................................................................................... 102

Table 3-1 Incidence of Lung Tumors in Female Mice ................................................................... 108 Table 3-2 Summary of BMDS 3.0 modeling results for lung tumors in female mice exposed to 1-

BP by inhalation for 2 years (NTP, 2011); BMRs = 10% and 0.1% extra and added risk, doses are

in ppm ............................................................................................................................................. 109 Table 3-3 Lung Tumors in Female Mice, Selected Frequentist Multistage - Multistage 1 Restricted;

Extra Risk, BMR = 0.001 and 0.1 User Input ................................................................................. 111

Page 8 of 139

Table 3-4 Lung Tumors in Female Mice, Selected Frequentist Multistage - Multistage 1 Restricted;

Extra Risk, BMR = 0.001 and 0.1 Model Results .......................................................................... 111 Table 3-5 Lung Tumors in Female Mice, Selected Frequentist Multistage - Multistage 1 Restricted;

Added Risk, BMR = 0.001 and 0.1 User Input ............................................................................... 114

Table 3-6 Lung Tumors in Female Mice, Selected Frequentist Multistage - Multistage 1 Restricted;

Added Risk, BMR = 0.001 and 0.1 Model Results ........................................................................ 114 Table 3-7 Lung Tumors in Female Mice, Summary of Frequentist Model Averaging .................. 116 Table 3-8 Lung Tumors in Female Mice, Bayesian Model Averaging – Extra Risk, BMR = 0.001

and 0.1 User Inputs ......................................................................................................................... 117

Table 3-9 Lung Tumors in Female Mice, Bayesian Model Averaging – Extra Risk, BMR = 0.001

and 0.1 Model Results..................................................................................................................... 117 Table 3-10 Lung Tumors in Female Mice, Bayesian Model Averaging – Added Risk, BMR =

0.001 and 0.1 User Inputs ............................................................................................................... 118

Table 3-11 Lung Tumors in Female Mice, Bayesian Model Averaging – Added Risk, BMR =

0.001 and 0.1 Model Results........................................................................................................... 118

Table 3-12 Incidence of Large Intestine Adenomas in Female Rats .............................................. 119 Table 3-13 Summary of BMDS 3.0 modeling results for large intestine adenomas in female rats

exposed to 1-BP by inhalation for 2 years (NTP, 2011); BMRs = 10% and 0.1% extra and added

risk, doses are in ppm...................................................................................................................... 120 Table 3-14 Large Intestine Adenomas in Female Rats, Selected Frequentist Multistage - Multistage

1 Restricted; Extra Risk, BMR = 0.001 and 0.1 User Input ........................................................... 122 Table 3-15 Large Intestine Adenomas in Female Rats, Selected Frequentist Multistage - Multistage

1 Restricted; Extra Risk, BMR = 0.001 and 0.1 Model Results ..................................................... 122

Table 3-16 Large Intestine Adenomas in Female Rats, Selected Frequentist Multistage - Multistage

1 Restricted; Added Risk, BMR = 0.001 and 0.1 User Input ......................................................... 125

Table 3-17 Large Intestine Adenomas in Female Rats, Selected Frequentist Multistage - Multistage

1 Restricted; Added Risk, BMR = 0.001 and 0.1 Model Results ................................................... 125

Table 3-18 Large Intestine Adenomas in Female Rats, Summary of Frequentist Model Averaging

......................................................................................................................................................... 126

Table 3-19 Large Intestine Adenomas in Female Rats, Bayesian Model Averaging – Extra Risk,

BMR = 0.001 and 0.1 User Inputs .................................................................................................. 127 Table 3-20 Large Intestine Adenomas in Female Rats, Bayesian Model Averaging – Extra Risk,

BMR = 0.001 and 0.1 Model Results ............................................................................................. 127 Table 3-21 Large Intestine Adenomas in Female Rats, Bayesian Model Averaging – Added Risk,

BMR = 0.001 and 0.1 User Inputs .................................................................................................. 128 Table 3-22 Large Intestine Adenomas in Female Rats, Bayesian Model Averaging – Added Risk,

BMR = 0.001 and 0.1 Model Results ............................................................................................. 128 Table 3-23 Incidence of Keratoacanthoma and Squamous Cell Carcinomas in Male Rats ........... 129 Table 3-24 Summary of BMDS 3.0 modeling results for keratoacanthoma & squamous cell

carcinomas in male rats exposed to 1-BP by inhalation for 2 years (NTP, 2011); BMRs = 10% and

0.1% extra and added risk, doses are in ppm .................................................................................. 130

Table 3-25 Keratoacanthoma and Squamous Cell Carcinomas in Male Rats, Selected Frequentist

Multistage - Multistage 1 Restricted; Extra Risk, BMR = 0.001 and 0.1 User Input ..................... 132 Table 3-26 Keratoacanthoma and Squamous Cell Carcinomas in Male Rats, Selected Frequentist

Multistage - Multistage 1 Restricted; Extra Risk, BMR = 0.001 and 0.1 Model Results .............. 132 Table 3-27 Keratoacanthoma and Squamous Cell Carcinomas in Male Rats, Selected Frequentist

Multistage - Multistage 1 Restricted; Added Risk, BMR = 0.001 and 0.1 User Input ................... 134

Page 9 of 139

Table 3-28 Keratoacanthoma and Squamous Cell Carcinomas in Male Rats, Selected Frequentist

Multistage - Multistage 1 Restricted; Added Risk, BMR = 0.001 and 0.1 Model Results ............ 134 Table 3-29 Keratoacanthoma and Squamous Cell Carcinomas in Male Rats, Summary of

Frequentist Model Averaging ......................................................................................................... 135

Table 3-30 Keratoacanthoma and Squamous Cell Carcinomas in Male Rats, Bayesian Model

Averaging – Extra Risk, BMR = 0.001 and 0.1 User Inputs .......................................................... 136 Table 3-31 Keratoacanthoma and Squamous Cell Carcinomas in Male Rats, Bayesian Model

Averaging – Extra Risk, BMR = 0.001 and 0.1 Model Results ..................................................... 136 Table 3-32 Keratoacanthoma and Squamous Cell Carcinomas in Male Rats, Bayesian Model

Averaging – Added Risk, BMR = 0.001 and 0.1 User Inputs ........................................................ 137 Table 3-33 Keratoacanthoma and Squamous Cell Carcinomas in Male Rats, Bayesian Model

Averaging – Added Risk, BMR = 0.001 and 0.1 Model Results ................................................... 137

LIST OF FIGURES

Figure 2-1 Plot of Mean Response by Dose in ppm with Fitted Curve for Exponential (M2) Model

with Modeled Variance for Reduced Litter Size in F0 Generation Exposed to 1-BP by Inhalation;

BMR = 5% Relative Deviation from Control Mean. ........................................................................ 15 Figure 2-2. Plot of incidence rate by dose with fitted curve for NCTR model for post implantation

loss in male rats exposed to 1-BP ..................................................................................................... 21

Figure 2-3 Plot of incidence rate by dose with fitted curve for Nlogistic model for post

implantation loss in male rats exposed to 1-BP ................................................................................ 22

Figure 2-4 Plot of incidence rate by dose with fitted curve for NCTR model for post implantation

loss in male rats exposed to 1-BP ..................................................................................................... 23 Figure 2-5 Plot of incidence rate by dose with fitted curve for Nlogistic model for post

implantation loss in male rats exposed to 1-BP ................................................................................ 24 Figure 2-6 Plot of incidence rate by dose with fitted curve for Nlogistic model for post

implantation loss in male rats exposed to 1-BP ................................................................................ 25 Figure 2-7 Plot of incidence rate by dose with fitted curve for Nlogistic model for post

implantation loss in male rats exposed to 1-BP ................................................................................ 27 Figure 2-8 Plot of Mean Response by Dose with Fitted Curve for the Selected Model (LogLogistic)

for Vacuolization of Centrilobular Hepatocytes in Male Rats Exposed to 1-BP Via Inhalation in

ppm; BMR 10% Added Risk. ........................................................................................................... 29 Figure 2-9 Plot of Mean Response by Dose with Fitted Curve for the Selected Model (Multistage

3°) for Vacuolization of Centrilobular Hepatocytes in Male Rats Exposed to 1-BP Via Inhalation in

ppm; BMR 10% Added Risk. ........................................................................................................... 32 Figure 2-10 Plot of Mean Response by Dose with Fitted Curve for the Selected Model

(LogLogistic) for Vacuolization of Centrilobular Hepatocytes in Female Rats Exposed to 1-BP Via

Inhalation in ppm; BMR 10% Added Risk. ...................................................................................... 35 Figure 2-11 Plot of Mean Response by Dose with Fitted Curve for the Selected Model (Multistage

3°) for Renal Pelvic Mineralization in Male Rats Exposed to 1-BP Via Inhalation in ppm; BMR

10% Added Risk. .............................................................................................................................. 38 Figure 2-12 Plot of Mean Response by Dose with Fitted Curve for the Selected Model (Probit) for

Renal Pelvic Mineralization in Female Rats Exposed to 1-BP Via Inhalation in ppm; BMR 10%

Added Risk........................................................................................................................................ 40

Page 10 of 139

Figure 2-13 Plot of Mean Response by Dose in ppm with Fitted Curve for Exponential (M4) Model

with Constant Variance for Relative Seminal Vesicle Weight; BMR = 1 Standard Deviation

Change from Control Mean. ............................................................................................................. 43 Figure 2-14 Plot of Mean Response by Dose in ppm with Fitted Curve for Hill Model with

Constant Variance for Seminal Vesicle Absolute Weight; BMR = 1 Standard Deviation Change

from Control Mean. .......................................................................................................................... 46 Figure 2-15 Plot of Mean Response by Dose in ppm with Fitted Curve for Exponential (M2) Model

with Constant Variance for Sperm Morphology in F0 Rats Exposed to 1-BP by Inhalation; BMR =

1 Standard Deviation Change from Control Mean. .......................................................................... 48

Figure 2-16 Plot of Mean Response by Dose in ppm with Fitted Curve for Polynomial 4° Model

with Constant Variance for Left Cauda Epididymis Absolute Weight; BMR = 1 Standard Deviation

Change from Control Mean. ............................................................................................................. 56 Figure 2-17 Plot of Mean Response by Dose in ppm with Fitted Curve for Polynomial 4° Model

with Constant Variance for Right Cauda Epididymis Absolute Weight; BMR = 1 Standard

Deviation Change from Control Mean. ............................................................................................ 59

Figure 2-18 Plot of Mean Response by Dose with Fitted Curve for the Selected Model

(LogLogistic) for Fertility Index in Rats Exposed to 1-BP Via Inhalation in ppm BMR 10% Extra

Risk. .................................................................................................................................................. 64

Figure 2-19 Plot of Mean Response by Dose with Fitted Curve for the Selected Model (Linear) for

Implantation Sites in Rats Exposed to 1-BP Via Inhalation in ppm BMR 1 Standard Deviation. ... 67

Figure 2-20 Plot of Mean Response by Dose with Fitted Curve for the Selected Model

(Exponential (M2)) for Pup Body Weight in Rats Exposed to 1-BP Via Inhalation in ppm BMR 5%

Relative Deviation. ........................................................................................................................... 71

Figure 2-21 Plot of Mean Response by Dose with Fitted Curve for the Hill Model for Pup Body

Weight in Rats Exposed to 1-BP Via Inhalation in ppm BMR 5% Relative Deviation. .................. 73

Figure 2-21 Plot of Mean Response by Dose with Fitted Curve for the Selected Model

(Polynomial 2°) for Pup Body Weight in Rats Exposed to 1-BP Via Inhalation in ppm BMR = 5%

Relative Deviation. ........................................................................................................................... 79 Figure 2-22 Plot of Mean Response by Dose with Fitted Curve for the Selected Model

(Polynomial 2°) for Pup Body Weight in Rats Exposed to 1-BP Via Inhalation in ppm BMR = 5%

Relative Deviation. ........................................................................................................................... 81 Figure 2-23 Plot of Mean Response by Dose with Fitted Curve for the Selected Model (Linear) for

Pup Body Weight in Rats Exposed to 1-BP Via Inhalation in ppm BMR = 5% Relative Deviation.

........................................................................................................................................................... 84

Figure 2-24 Plot of Mean Response by Dose with Fitted Curve for the Selected Model (Linear) for

Brain Weight in F0 Female Rats Exposed to 1-BP Via Inhalation in ppm BMR = 1 Standard

Deviation. .......................................................................................................................................... 87 Figure 2-25 Plot of Mean Response by Dose with Fitted Curve for the Selected Model

(Exponential (M2)) for Brain Weight in F1 Female Rats as Adults Exposed to 1-BP Via Inhalation

in ppm BMR = 1% Relative Deviation. ............................................................................................ 92 Figure 2-26 Plot of Mean Response by Dose with Fitted Curve for the Selected Model

(Exponential (M2)) for Brain Weight in F2 Female Exposed to 1-BP Via Inhalation in ppm BMR =

1% Relative Deviation. ..................................................................................................................... 96 Figure 2-27 Plot of Mean Response by Dose with Fitted Curve for the Selected Model (Power) for

Brain Weight in Rats Exposed to 1-BP Via Inhalation in ppm BMR = 1% Relative Deviation. ..... 99

Page 11 of 139

Figure 2-28 Plot of Mean Response by Dose in ppm with Fitted Curve for Exponential (M4) Model

with Modeled Variance for Hang Time from a Suspended Bar; BMR = 1 Standard Deviation

Change from Control Mean. ........................................................................................................... 102 Figure 3-1 Plot of Results for Lung Tumors in Female Mice Frequentist Multistage Degree 1

Model with BMR of 10% Extra Risk for the BMD and 0.95 Lower Confidence Limit for the

BMDL ............................................................................................................................................. 113 Figure 3-2 Plot of Results for Large Intestine Adenomas in Female Rats Frequentist Multistage

Degree 1 Model with BMR of 10% Extra Risk for the BMD and 0.95 Lower Confidence Limit for

the BMDL ....................................................................................................................................... 124

Figure 3-3 Plot of Results for Keratoacanthoma and Squamous Cell Carcinomas in Male Rats

Frequentist Multistage Degree 1 Model with BMR of 10% Extra Risk for the BMD and 0.95

Lower Confidence Limit for the BMDL ......................................................................................... 133

Page 12 of 139

ACKNOWLEDGEMENTS

This report was developed by the United States Environmental Protection Agency (U.S. EPA),

Office of Chemical Safety and Pollution Prevention (OCSPP), Office of Pollution Prevention and

Toxics (OPPT).

Acknowledgements

The OPPT Assessment Team gratefully acknowledges participation or input from ORD in

developing this supplemental document

Page 13 of 139

1 INTRODUCTION 1

2

BMD modeling was performed using USEPA’s BMD Software package (BMDS), in a manner 3

consistent with EPA Benchmark Dose Technical Guidance. BMRs were selected for each 4

endpoint individually. The dose metric for all endpoints was the exposure concentration in ppm. 5

Results are presented for non-cancer effects from acute exposures, then chronic exposures and 6

cancer i.e. tumors. 7

8

2 Benchmark Dose Modeling of Non-Cancer Effects 9

2.1 Benchmark Dose Modeling of Non-Cancer Effects for Acute 10

Exposures 11

Decreased Live Litter Size 12

EPA modeled the decreased live litter size observed in the 2-generation reproductive and 13

developmental study by WIL Research (2001) as one endpoint relevant for calculating risks 14

associated with acute worker and consumer scenarios. A BMR of 5% was used to address the 15

relative severity of this endpoint (U.S. EPA, 2012). This endpoint choice is a combination of 16

reproductive effects where a BMR 10% relative deviation would be used and developmental 17

effects of post implantation loss which is considered a severe effect like mortality where a BMR 18

of 1% relative deviation would be used. For comparison the modeling results with a BMR of 1 19

standard deviation and 1% relative deviation are also shown. The modeling was performed in 20

BMDS version 2.6. The doses and response data used for the modeling are presented in Table 21

2-1. 22

Table 2-1 Litter Size Data Selected for Dose-Response Modeling for 1-BP 23

Dose (ppm) Number of litters Mean litter size Standard Deviation

0 23 14.4 2.21

100 25 13.3 3.72

250 22 12.3 4.47

500 11 8.3 4.1

24

The best fitting model was selected based on Akaike information criterion (AIC; lower value 25

indicates a better fit), chi-square goodness of fit p-value (higher value indicates a better fit), ratio 26

of the BMC:BMCL (lower value indicates less model uncertainty) and visual inspection. 27

Comparisons of model fits obtained are provided in Table 2-2. The best-fitting model 28

(Exponential M2), based on the criteria described above, is indicated in bold. For the best fitting 29

model a plot of the model is shown in Figure 2-1, the model version number, model form, 30

Page 14 of 139

benchmark dose calculation, parameter estimates and estimated values are shown. Although the 31

means were well-modeled the variances are not well modeled by the non-homogeneous variance 32

model (the non-homogeneous variance model was used because the BMDS test 2 p-value = 33

0.0130). To investigate the effect of the poor modeling of the variances on the BMDL, the models 34

were run using the smallest dose standard deviation (2.21), highest (4.47) and pooled (3.54) for all 35

dose levels and the results are summarized in Table 2-4. As shown in the last column of Table 2-4 36

the ratios BMDLs for the lowest to the highest variance for the two best fitting models the Linear 37

and Exponential (M2) models are 1.15 and 1.20, respectively. Overall the adjustment of the 38

variances from most-variable to least-variable for all of the models makes little difference on the 39

BMDL. This is strong evidence that the poor variance modeling for the original data is not 40

substantially impacting the BMDL estimates. It is reasonable to use the non-homogeneous 41

Exponential M2 model for the original data because it has the lowest AIC of all the model choices 42

for the original data and therefore a BMDL of 41 ppm (40.7 ppm rounded to two significant 43

figures) was selected for this endpoint. 44

45

Table 2-2 Summary of BMD Modeling Results for Reduced Litter Size in F0 Generation 46

Exposed to 1-BP by Inhalation; BMRs of 1 Standard Deviation, and 5% and 1% Relative 47

Deviation From Control Mean. 48

Modela Goodness of fit BMD

1SD

(ppm)

BMDL

1SD

(ppm)

BMD

5RD

(ppm)

BMDL

5RD

(ppm)

BMD

1RD

(ppm)

BMDL

1RD

(ppm)

Basis for model

selection p-value AIC

Exponential

(M2)

Exponential

(M3)b

0.533 291.10 256 158 61.3 40.7 12.0 7.97 The Exponential

(M2) model was

selected based on

lowest AIC from

this set of models

which have

adequate p-values,

adequate fit by

visual inspection

and the BMDLs

are < 4-fold apart

considered

sufficiently close.

Powerc

Polynomial 3°d

Polynomial 2°e

Linear

0.433 291.51 281 189 69.9 49.8 14.0 9.95

Hill 0.722 291.96 178 errorg 35.8 10.4 6.36 1.69

Exponential

(M4)

Exponential

(M5)f

0.622 292.08 181 69.4 40.4 17.8 7.48 3.23

a Modeled variance case presented (BMDS Test 2 p-value = 0.0130), selected model in bold; scaled residuals for selected

model for doses 0, 100, 250, and 500 ppm were -0.16, -0.05, 0.66, -0.76, respectively. b For the Exponential (M3) model, the estimate of d was 1 (boundary). The models in this row reduced to the Exponential (M2)

model. c For the Power model, the power parameter estimate was 1. The models in this row reduced to the Linear model. d For the Polynomial 3° model, the b3 coefficient estimates was 0 (boundary of parameters space). The models in this row

reduced to the Polynomial 2° model. For the Polynomial 3° model, the b3 and b2 coefficient estimates were 0 (boundary of

parameters space). The models in this row reduced to the Linear model. e For the Polynomial 2° model, the b2 coefficient estimate was 0 (boundary of parameters space). The models in this row

reduced to the Linear model. f For the Exponential (M5) model, the estimate of d was 1 (boundary). The models in this row reduced to the Exponential (M4)

model. g BMDL computation failed for this model.

49

Page 15 of 139

50 Figure 2-1 Plot of Mean Response by Dose in ppm with Fitted Curve for Exponential (M2) 51

Model with Modeled Variance for Reduced Litter Size in F0 Generation Exposed to 1-BP 52

by Inhalation; BMR = 5% Relative Deviation from Control Mean. 53

54

Table 2-3 BMD Modeling Results for Reduced Litter Size in F0 Generation Exposed to 1-55

BP by Inhalation; BMRs of 1 Standard Deviation, and 5% and 1% Relative Deviation 56

From Control Mean. 57

Exponential Model. (Version: 1.10; Date: 01/12/2015)

The form of the response function is: Y[dose] = a * exp(sign * b * dose)

A modeled variance is fit

Benchmark Dose Computation.

BMR = 5% Relative deviation

BMD = 61.3264

BMDL at the 95% confidence level = 40.6605

Page 16 of 139

Parameter Estimates

Variable Estimate Default Initial

Parameter Values

lnalpha 10.4606 6.08025

rho -3.14328 -1.44632

a 14.4915 10.5312

b 0.000836398 0.00102437

c n/a 0

d n/a 1

Table of Data and Estimated Values of Interest

Dose N Obs Mean Est Mean Obs Std Dev Est Std Dev Scaled Resid

0 23 14.4 14.49 2.21 2.8 -0.1569

100 25 13.3 13.33 3.72 3.19 -0.04505

250 22 12.3 11.76 4.47 3.88 0.6554

500 11 8.3 9.54 4.1 5.4 -0.7614

Likelihoods of Interest

Model Log(likelihood) # Param's AIC

A1 -143.3786 5 296.7571

A2 -137.9879 8 291.9758

A3 -140.9173 6 293.8347

R -153.5054 2 311.0108

2 -141.5475 4 291.095

Tests of Interest

Test -2*log(Likelihood

Ratio)

Test df p-value

Test 1 31.03 6 <0.0001

Test 2 10.78 3 0.01297

Test 3 5.859 2 0.05343

Test 4 1.26 2 0.5325

58

Page 17 of 139

59

Table 2-4 BMD Modeling Results for Reduced Litter Size in F0 Generation Following Inhalation Exposure of Parental Rats to 60

1-BP in a Two-Generation Study with Variances Fixed at Smallest, Pooled and Highest Values. 61

Modela Smallest Standard Deviation Pooled Standard Deviation Largest Standard Deviation Ratio

BMDLs

Smallest

to Largest

Std Dev

Goodness of fit BMD5RD

(ppm)

BMDL5RD

(ppm)

Goodness of fit BMD5RD

(ppm)

BMDL5RD

(ppm)

Goodness of fit BMD5RD

(ppm)

BMDL5RD

(ppm) p-value AIC p-value AIC p-value AIC

Linear 0.279 213.92 63.5 53.5 0.605 288.69 63.5 49.2 0.729 326.11 63.5 46.6 1.15

Exponential

(M2)

0.112 215.74 54.9 44.1 0.420 289.42 54.9 39.4 0.579 326.57 54.9 36.7 1.20

Exponential

(M4)

0.112 215.74 54.9 42.6 0.420 289.42 54.9 34.4 0.579 326.57 54.9 29.1 1.46

Polynomial 3° 0.506 213.81 96.4 58.4 0.678 289.86 96.4 51.1 0.742 327.58 96.4 47.8 1.22

Polynomial 2° 0.393 214.09 105 57.4 0.593 289.97 105 50.8 0.672 327.65 105 47.6 1.21

Power 0.303 214.43 115 56.4 0.519 290.10 115 50.5 0.609 327.74 115 47.4 1.19

Exponential

(M3)

0.239 214.75 127 56.1 0.461 290.23 127 42.6 0.559 327.82 127 38.7 1.45

Exponential

(M5)

0.239 214.75 127 56.1 N/Ab 292.23 127 42.6 0.559 327.82 127 33.0 1.70

Hill N/Ab 216.43 115 56.4 N/Ab 292.10 116 50.3 N/Ab 329.74 116 47.2 1.19

a Constant variance case presented (BMDS Test 2 p-value = 1.000, BMDS Test 3 p-value = 1.000), no model was selected as a best-fitting model. b No available degrees of freedom to calculate a goodness of fit value.

62

63

Page 18 of 139

Post implantation loss 64

EPA modeled the post implantation loss observed in the F0 generation of the 2-generation 65

reproductive and developmental study by WIL Research (2001) as one endpoint relevant for 66

calculating risks associated with acute worker and consumer scenarios. Post implantation loss was 67

significantly increased in all but the lowest dose group. A BMR of 1% was used to address the 68

relative severity of this endpoint which is considered a severe effect like mortality (U.S. EPA, 69

2012). The doses and response data used for the modeling were individual animal data and are 70

shown in Table 2-5. 71

Table 2-5. Implantation sites and incidence of post implantation loss in pregnant female 72

rats in the F0 generation exposed to 0, 100, 250 ppm 1-BP by Inhalation WIL Research 73

(2001) 74 Dose (ppm) Number of Implantation Sites Post Implantation Loss Dam Weight at Study Week 0 (g)

0 15 0 170

0 17 0 160

0 14 0 147

0 14 0 153

0 15 1 158

0 15 0 153

0 18 2 168

0 12 0 165

0 15 0 164

0 15 1 166

0 15 0 149

0 19 0 174

0 15 0 156

0 16 1 160

0 18 1 158

0 18 0 161

0 19 0 166

0 13 0 172

0 16 0 181

0 13 0 177

0 8 0 141

0 14 1 144

0 18 1 157

100 15 0 161

100 14 0 159

100 14 2 153

100 13 1 146

100 16 1 167

100 16 0 150

100 15 0 159

Page 19 of 139

Dose (ppm) Number of Implantation Sites Post Implantation Loss Dam Weight at Study Week 0 (g)

100 14 1 152

100 16 0 165

100 14 0 166

100 14 3 158

100 15 1 168

100 16 1 143

100 12 3 148

100 16 2 177

100 16 0 154

100 1 0 153

100 14 0 179

100 18 0 171

100 16 0 180

100 16 1 170

100 15 0 165

100 15 1 157

100 15 0 164

100 12 0 162

250 18 1 159

250 16 2 160

250 16 5 151

250 15 1 141

250 15 2 179

250 17 0 150

250 14 1 153

250 15 0 175

250 13 0 146

250 15 0 161

250 17 1 167

250 16 1 165

250 16 1 166

250 11 3 162

250 15 0 157

250 12 1 153

250 6 2 158

250 6 0 166

250 2 0 167

250 18 2 146

250 18 2 164

250 12 4 155

500 5 0 161

500 12 0 158

Page 20 of 139

Dose (ppm) Number of Implantation Sites Post Implantation Loss Dam Weight at Study Week 0 (g)

500 5 1 181

500 15 2 159

500 12 1 151

500 16 0 152

500 9 1 166

500 6 0 176

500 6 1 165

500 11 0 144

500 2 0 144

75

The application of nested dichotomous models to these data was possible because the incidence 76

data for post-implantation loss were available for every litter, and preferable because they can 77

account for intra-litter correlations and litter-specific covariates. A litter specific covariate that is 78

potentially related to the endpoint of concern but is not itself impacted by dose is needed for this 79

analysis. In this case, dam body weight measured at week 0 and the number of implantation sites 80

were both used as covariates and the data was modeled separately in the same format for each. In 81

this case, dam body weight measured at week 0 was selected as the preferred litter specific 82

covariate because it was not affected at any dose and is potentially related to the implantation 83

loss endpoint. 84

Incidence of implantation loss presented a clear dose trend at lower doses but leveled off at the 85

highest dose coincident with a reduction in implantation sites. The data were modeled with the 86

all doses and the highest dose dropped for the purposes of this analysis because of the 87

uncertainty associated with reduced sample size (11 litters at the high dose compared with 22 to 88

25 litters at lower doses) and improved model fit for the high dose dropped. 89

90

The nested modeling was performed using the nested logistic and NCTR models contained in 91

BMDS 2.7.0.4, as follows: 92

• nested model for extra risk of 5% and 1%, using dam weight as a litter specific covariate, 93

dropping the highest dose group (Table 2-6 and Table 2-7 and Figure 2-2 and Figure 2-3). 94

• nested model for extra risk of 5% and 1%, using number of implantation sites as a litter 95

specific covariate, dropping the highest dose group (Table 2-8 and Table 2-9 and Figure 96

2-4 and Figure 2-5). 97

• nested model for extra risk of 5% and 1%, using dam weight as a litter specific covariate, 98

including all dose groups (Table 2-10 and Table 2-11 and Figure 2-6 and Figure 2-7). 99

100

After considering the model results the BMDLs from the nested model for extra risk of 5% and 101

1%, using dam weight as a litter specific covariate, dropping the highest dose group were 102

selected to as the PODs for the post implantation loss endpoint. 103

104

Page 21 of 139

Table 2-6 Summary of BMDS modeling results for incidence of post implantation loss in 105

female rats exposed to 1-BP by Inhalation (WIL Research, 2001); BMR = 5% extra risk. 106

Dose groups = 0, 100, 250 ppm. Litter-specific covariate is dam body weight 107

Modela

Goodness of fit BMD05

(ppm) BMDL05

(ppm) Basis for Model Selection p-value AIC

Litter-specific covariate = dam weight; intra-litter correlations estimatedb The models without intra-litter correlations estimated and without use of covariates had lowest AICs, the NCTR model was selected based on lowest AIC and BMDL. Note these model results were selected to represent this endpoint for BMR = 5%.

Nlogistic (b. seedc = 1541098366) 0.468 412.675 181 112

NCTR (b. seed = 1541098374) 0.469 412.658 182 90.8

Litter-specific covariate used; intra-litter correlations assumed to be zero

Nlogistic (b. seed = 1541098367) 0.15 411.498 184 123

NCTR (b. seed = 1541098375) 0.14 411.483 185 92.3

Litter-specific covariate not used; intra-litter correlations estimated

Nlogistic (b. seed = 1541098368) 0.507 410.84 173 107

NCTR (b. seed = 1541098375) 0.513 410.84 174 86.8

Litter-specific covariate not used; intra-litter correlations assumed to be zero

Nlogistic (b. seed = 1541098368) 0.136 410.377 177 118

NCTR (b. seed = 1541098376) 0.124 410.377 177 88.7 aBecause the individual animal data were available, the BMDS nested dichotomous models were fitted, with the selected model in bold. All values are rounded to 3 significant figures except for AIC values. bThe implantation size was also used as a covariate. See Table 2-8. Cb. seed: bootstrap seed.

108

109 Figure 2-2. Plot of incidence rate by dose with fitted curve for NCTR model for post 110

implantation loss in male rats exposed to 1-BP. Litter-specific covariate is dam weight 111

0

0.02

0.04

0.06

0.08

0.1

0.12

0.14

0.16

0 50 100 150 200 250

Fra

ctio

n A

ffe

cte

d

dose

NCTR Model, with BMR of 5% Extra Risk for the BMD and 0.95 Lower Confidence Limit for the BMDL

14:52 11/01 2018

BMDL BMD

NCTR

Page 22 of 139

Table 2-7 Summary of BMDS modeling results for incidence of post implantation loss in 112

female rats exposed to 1-BP by Inhalation (WIL Research, 2001); BMR = 1% extra risk. 113

Dose groups = 0, 100, 250 ppm. Litter-specific covariate is dam body weight 114

Modela

Goodness of fit BMD01

(ppm) BMDL01

(ppm) Basis for Model Selection p-value AIC

Litter-specific covariate = dam weight; intra-litter correlations estimatedb The models without intra-litter correlations estimated and without use of covariates had lowest AICs, the Nlogistic model was selected based on lowest AIC and BMDL. Note these model results were selected to represent this endpoint for BMR = 1%

Nlogistic (b. seedc = 1541098369) 0.482 412.675 48.9 21.5

NCTR (b. seed = 1541098377) 0.489 412.658 48.5 24.3

Litter-specific covariate used; intra-litter correlations assumed to be zero

Nlogistic (b. seed = 1541098369) 0.146 411.498 47.5 23.6

NCTR (b. seed = 1541098377) 0.144 411.483 47.1 23.5

Litter-specific covariate not used; intra-litter correlations estimated

Nlogistic (b. seed = 1541098370) 0.507 410.84 45.5 20.6

NCTR (b. seed = 1541098378) 0.485 410.84 45.0 22.5

Litter-specific covariate not used; intra-litter correlations assumed to be zero

Nlogistic (b. seed = 1541098371) 0.123 410.377 46.6 22.7

NCTR (b. seed = 1541098379) 0.124 410.377 46.0 23.0 aBecause the individual animal data were available, the BMDS nested dichotomous models were fitted, with the selected model in bold. All values are rounded to 3 significant figures except for AIC values. bThe implantation size was also used as a covariate. See Table 2-9. Cb. seed: bootstrap seed.

115

116 Figure 2-3 Plot of incidence rate by dose with fitted curve for Nlogistic model for post 117

implantation loss in male rats exposed to 1-BP. Litter-specific covariate is dam body weight 118

0

0.02

0.04

0.06

0.08

0.1

0.12

0.14

0.16

0 50 100 150 200 250

Fra

ctio

n A

ffe

cte

d

dose

Nested Logistic Model, with BMR of 1% Extra Risk for the BMD and 0.95 Lower Confidence Limit for the BMDL

14:52 11/01 2018

BMDL BMD

Nested Logistic

Page 23 of 139

Table 2-8 Summary of BMDS modeling results for incidence of post implantation loss in 119

female rats exposed to 1-BP by Inhalation (WIL Research, 2001); BMR = 5% extra risk. 120

Dose groups = 0, 100, 250 ppm. Litter-specific covariate is number of implantation sites 121

Modela

Goodness of fit BMD05

(ppm) BMDL05

(ppm) Basis for Model Selection p-value AIC

Litter-specific covariate = implantation sites; intra-litter correlations estimatedb The models without intra-litter correlations estimated and without use of covariates had lowest AICs, the NCTR model was selected based on lowest AIC and BMDL. Note this litter-specific covariate number of implantation sites is not the preferred covariate because it is affected at higher doses.

Nlogistic (b. seedc = 1541548812) 0.579 412.889 160 105

NCTR (b. seed = 1541548820) 0.602 412.488 153 76.7

Litter-specific covariate used; intra-litter correlations assumed to be zero

Nlogistic (b. seed = 1541548812) 0.214 411.236 159 111

NCTR (b. seed = 1541548821) 0.242 410.586 151 75.5

Litter-specific covariate not used; intra-litter correlations estimated

Nlogistic (b. seed = 1541548813) 0.497 410.84 173 107

NCTR (b. seed = 1541548821) 0.489 410.84 174 86.8

Litter-specific covariate not used; intra-litter correlations assumed to be zero

Nlogistic (b. seed = 1541548814) 0.123 410.377 177 118

NCTR (b. seed = 1541548822) 0.108 410.377 177 88.7 aBecause the individual animal data were available, the BMDS nested dichotomous models were fitted, with the selected model in bold. All values are rounded to 3 significant figures except for AIC values. bThe implantation size was used as a covariate and yielded the same model selection results as dam weight. See Table 2-6. Cb. seed: bootstrap seed.

122

123 Figure 2-4 Plot of incidence rate by dose with fitted curve for NCTR model for post 124

implantation loss in male rats exposed to 1-BP. Litter-specific covariate is number of 125

implantation sites 126

127

0

0.02

0.04

0.06

0.08

0.1

0.12

0.14

0.16

0 50 100 150 200 250

Fra

ctio

n A

ffe

cte

d

dose

NCTR Model, with BMR of 5% Extra Risk for the BMD and 0.95 Lower Confidence Limit for the BMDL

19:00 11/06 2018

BMDL BMD

NCTR

Page 24 of 139

Table 2-9 Summary of BMDS modeling results for incidence of post implantation loss in 128

female rats exposed to 1-BP by Inhalation (WIL Research, 2001); BMR = 1% extra risk. 129

Dose groups = 0, 100, 250 ppm. Litter-specific covariate is number of implantation sites 130

Modela

Goodness of fit BMD01

(ppm) BMDL01

(ppm) Basis for Model Selection p-value AIC

Litter-specific covariate = implantation sites; intra-litter correlations estimatedb The models without intra-litter correlations estimated and without use of covariates had lowest AICs, the Nlogistic model was selected based on lowest AIC and BMDL. Note this litter-specific covariate number of implantation sites is not the preferred covariate because it is affected at higher doses.

Nlogistic (b. seedc = 1541548814) 0.574 412.889 33.5 20.2

NCTR (b. seed = 1541548823) 0.597 412.488 32.3 16.1

Litter-specific covariate used; intra-litter correlations assumed to be zero

Nlogistic (b. seed = 1541548815) 0.209 411.236 31.3 21.4

NCTR (b. seed = 1541548824) 0.237 410.586 31.7 15.8

Litter-specific covariate not used; intra-litter correlations estimated

Nlogistic (b. seed = 1541548815) 0.505 410.84 45.5 20.6

NCTR (b. seed = 1541548824) 0.506 410.84 45.0 22.5

Litter-specific covariate not used; intra-litter correlations assumed to be zero

Nlogistic (b. seed = 1541548816) 0.128 410.377 46.6 22.7

NCTR (b. seed = 1541548825) 0.117 410.377 46.0 23.0 aBecause the individual animal data were available, the BMDS nested dichotomous models were fitted, with the selected model in bold. All values are rounded to 3 significant figures except for AIC values. bThe implantation size was used as a covariate and yielded the same model selection results as dam weight. See Table 2-7. Cb. seed: bootstrap seed.

131

132 Figure 2-5 Plot of incidence rate by dose with fitted curve for Nlogistic model for post 133

implantation loss in male rats exposed to 1-BP 134

0

0.02

0.04

0.06

0.08

0.1

0.12

0.14

0.16

0 50 100 150 200 250

Fra

ctio

n A

ffe

cte

d

dose

Nested Logistic Model, with BMR of 1% Extra Risk for the BMD and 0.95 Lower Confidence Limit for the BMDL

19:00 11/06 2018

BMDL BMD

Nested Logistic

Page 25 of 139

Table 2-10 Summary of BMDS modeling results for incidence of post implantation loss in 135

female rats exposed to 1-BP by Inhalation (WIL Research, 2001); BMR = 5% extra risk. 136

Dose groups = 0, 100, 250, 500 ppm. Litter-specific covariate is dam body weight. 137

Modela

Goodness of fit BMD05

(ppm) BMDL05

(ppm) Basis for Model Selection p-value AIC

Litter-specific covariate = dam weight; intra-litter correlations estimatedb The models with intra-litter correlations estimated and without use of covariates had p-value ≥ 0.1 and lowest AICs, the Nlogistic model was selected. Note these model results were not selected to represent this endpoint because of the uncertainty associated with reduced sample size at the high dose (fewer litters and fewer implantation sites) and the better model fit for the high dose dropped.

Nlogistic (b. seedc = 1541532427) 0.422 462.473 278 146

NCTR (b. seed = 1541532435) 0.421 464.371 295 148

Litter-specific covariate used; intra-litter correlations assumed to be zero

Nlogistic (b. seed = 1541532428) 0.0903 460.235 293 179

NCTR (b. seed = 1541532436) 0.093 460.173 296 148

Litter-specific covariate not used; intra-litter correlations estimated

Nlogistic (b. seed = 1541532428) 0.496 460.864 229 135

NCTR (b. seed = 1541532437) 0.491 461.038 233 116

Litter-specific covariate not used; intra-litter correlations assumed to be zero

Nlogistic (b. seed = 1541532429) 0.0743 459.416 255 166

NCTR (b. seed = 1541532438) 0.0797 459.649 261 131

aBecause the individual animal data were available, the BMDS nested dichotomous models were fitted, with the selected model in bold. All values are rounded to 3 significant figures except for AIC values. bThe dam weight at week 0 was used as a covariate. Cb. seed: bootstrap seed.

138

139 Figure 2-6 Plot of incidence rate by dose with fitted curve for Nlogistic model for post 140

implantation loss in male rats exposed to 1-BP. Litter-specific covariate is dam body weight 141

142

0

0.02

0.04

0.06

0.08

0.1

0.12

0.14

0.16

0 100 200 300 400 500

Fra

ction A

ffecte

d

dose

Nested Logistic Model, with BMR of 5% Extra Risk for the BMD and 0.95 Lower Confidence Limit for the BMDL

14:27 11/06 2018

BMDL BMD

Nested Logistic

Page 26 of 139

Table 2-11 Summary of BMDS modeling results for incidence of post implantation loss in 143

female rats exposed to 1-BP by Inhalation (WIL Research, 2001); BMR = 1% extra risk. 144

Dose groups = 0, 100, 250, 500 ppm. Litter-specific covariate is dam body weight 145

Modela

Goodness of fit BMD01

(ppm) BMDL01

(ppm) Basis for Model Selection p-value AIC

Litter-specific covariate = dam weight; intra-litter correlations estimated The models with intra-litter correlations estimated and without use of covariates had p-value ≥ 0.1 and lowest AICs, the Nlogistic model was selected. Note these model results were not selected to represent this endpoint because of the uncertainty associated with reduced sample size at the high dose (fewer litters and fewer implantation sites) and the better model fit for the high dose dropped.

Nlogistic (b. seedc = 1541532430) 0.428 462.473 53.3 28.1

NCTR (b. seed = 1541532438) 0.398 464.371 57.9 28.9

Litter-specific covariate used; intra-litter correlations assumed to be zero

Nlogistic (b. seed = 1541532430) 0.095 460.235 56.2 34.4

NCTR (b. seed = 1541532439) 0.0967 460.173 58.0 29.0

Litter-specific covariate not used; intra-litter correlations estimated

Nlogistic (b. seed = 1541532431) 0.496 460.864 43.9 25.9

NCTR (b. seed = 1541532440) 0.487 461.038 45.6 22.8

Litter-specific covariate not used; intra-litter correlations assumed to be zero

Nlogistic (b. seed = 1541532431) 0.0723 459.416 48.9 32.0

NCTR (b. seed = 1541532441) 0.0743 459.649 51.2 25.6

aBecause the individual animal data were available, the BMDS nested dichotomous models were fitted, with the selected model in bold. All values are rounded to 3 significant figures except for AIC values. bThe dam weight at week 0 was used as a covariate. Cb. seed: bootstrap seed.

146

Page 27 of 139

147 Figure 2-7 Plot of incidence rate by dose with fitted curve for Nlogistic model for post 148

implantation loss in male rats exposed to 1-BP 149

150

2.2 Benchmark Dose Modeling of Non-Cancer Effects for Chronic 151

Exposures 152

EPA selected multiple endpoints for quantitative dose-response analysis with BMDS and 153

calculating risks associated with chronic worker scenarios including: include liver toxicity, 154

kidney toxicity, neurotoxicity, reproductive toxicity, and developmental toxicity. The modeling 155

was performed in BMDS version 2.6. The doses, response data and BMD modeling results are 156

presented below by effect. 157

Increased Incidence of Vacuolization of Centrilobular Hepatocytes in Males 158

Increased incidence of vacuolization of centrilobular hepatocytes was observed in males of the 159

F0 generation of the reproductive and developmental study by WIL Laboratories (2001). 160

Dichotomous models were used to fit dose response data. A BMR of 10% added risk was 161

choosen per EPA Benchmark Dose Technical Guidance (U.S. EPA, 2012). The doses and 162

response data used for the modeling are presented in Table 2-12. 163

164

0

0.02

0.04

0.06

0.08

0.1

0.12

0.14

0.16

0 100 200 300 400 500

Fra

ction A

ffecte

d

dose

Nested Logistic Model, with BMR of 1% Extra Risk for the BMD and 0.95 Lower Confidence Limit for the BMDL

14:27 11/06 2018

BMDL BMD

Nested Logistic

Page 28 of 139

Table 2-12 Incidence of Vacuolization of Centrilobular Hepatocytes Selected for Dose-165

Response Modeling for 1-BP 166

Dose (ppm) Number of animals Incidence

0 25 0

100 25 0

250 25 7

500 25 22

750 25 24

167

The BMD modeling results for vacuolization of centrilobular hepatocytes are summarized in 168

Table 2-13. The best fitting model was the LogLogistic based on Akaike information criterion 169

(AIC; lower values indicates a better fit), chi-square goodness of fit p-value (higher value 170

indicates a better fit) and visual inspection. For the best fitting model a plot of the model is 171

shown in Figure 2-8. The model version number, model form, benchmark dose calculation, 172

parameter estimates and estimated values are shown below in Table 2-14. 173

174

Table 2-13 Summary of BMD Modeling Results for Vacuolization of Centrilobular 175

Hepatocytes in Male F0 Rats Following Inhalation Exposure to 1-BP in a Two-Generation 176

Study 177

Modela Goodness of fit BMD10PctAdd

(ppm)

BMDL10PctAdd

(ppm)

Basis for model selection

p-value AIC

LogLogistic 0.939 60.974 188 143 LogLogistic model was selected

based on the lowest AIC from

this set of models which have

adequate p-values (excluding

Probit and Quantal-Linear),

adequate fit by visual inspection

and the BMDLs are < 1.5-fold

apart considered sufficiently

close.

LogProbit 0.907 60.980 185 142

Gamma 0.691 61.912 178 130

Multistage 2° 0.538 63.187 129 98.5

Weibull 0.360 64.026 158 110

Logistic 0.146 65.548 186 142

Probit 0.0542 66.345 177 133

Quantal-Linear 0.0025 81.794 41.1 32.2

a Selected model in bold; scaled residuals for selected model for doses 0, 100, 250, 500, and 750 ppm were

0, -0.45, 0.12, 0.15, -0.41, respectively.

178

Page 29 of 139

179 Figure 2-8 Plot of Mean Response by Dose with Fitted Curve for the Selected Model 180

(LogLogistic) for Vacuolization of Centrilobular Hepatocytes in Male Rats Exposed to 1-181

BP Via Inhalation in ppm; BMR 10% Added Risk. 182

183

0

0.2

0.4

0.6

0.8

1

0 100 200 300 400 500 600 700

Frac

tion

Affe

cted

dose

Log-Logistic Model, with BMR of 10% Added Risk for the BMD and 0.95 Lower Confidence Limit for the BMDL

17:49 12/09 2015

BMDL BMD

Log-Logistic

Page 30 of 139

Table 2-14 BMD Modeling Results for Reduced Litter Size in F0 Generation Exposed to 1-184

BP by Inhalation; BMRs of 1 Standard Deviation, and 5% and 1% Relative Deviation 185

From Control Mean. 186

Logistic Model. (Version: 2.14; Date: 2/28/2013)

The form of the probability function is: P[response] = background+(1-background)/[1+EXP(-

intercept-slope*Log(dose))]

Slope parameter is restricted as slope >= 1

Benchmark Dose Computation.

BMR = 10% Added risk

BMD = 187.639

BMDL at the 95% confidence level = 143.489

Parameter Estimates

Variable Estimate Default Initial

Parameter Values

background 0 0

intercept -2.4067E+01 -2.0600E+01

slope 4.17795 3.60147

Analysis of Deviance Table

Model Log(likelihood) # Param's Deviance Test d.f. p-value

Full model -28.2 5

Fitted model -28.49 2 0.58301 3 0.9

Reduced model -85.19 1 113.996 4 <.0001

AIC: = 60.9741 Goodness of Fit Table

Dose Est. Prob. Expected Observed Size Scaled Resid

0 0 0 0 25 0

100 0.0079 0.199 0 25 -0.45

250 0.2693 6.731 7 25 0.12

500 0.8696 21.74 22 25 0.15

750 0.9732 24.33 24 25 -0.41

Chi^2 = 0.41 d.f = 3 p-value = 0.9391

187

Increased Incidence of Vacuolization of Centrilobular Hepatocytes in Males 188

Increased incidence of vacuolization of centrilobular hepatocytes was observed in males of the 189

ClinTrials study (1997). Dichotomous models were used to fit dose response data. A BMR of 190

10% added risk was choosen per EPA Benchmark Dose Technical Guidance (U.S. EPA, 2012). 191

The doses and response data used for the modeling are presented in Table 2-15. 192

Page 31 of 139

193

Table 2-15 Incidence of Vacuolization of Centrilobular Hepatocytes Selected for Dose-194

Response Modeling for 1-BP 195

Dose (ppm) Number of animals Incidence

0 15 0

100 15 0

200 15 0

400 15 3

800 15 6

196

The BMD modeling results for vacuolization of centrilobular hepatocytes are summarized in 197

Table 2-16. The best fitting model was the LogLogistic based on Akaike information criterion 198

(AIC; lower values indicates a better fit), chi-square goodness of fit p-value (higher value 199

indicates a better fit) and visual inspection. For the best fitting model a plot of the model is 200

shown in Figure 2-9. The model version number, model form, benchmark dose calculation, 201

parameter estimates and estimated values are shown below in Table 2-17. 202

Table 2-16 Summary of BMD Modeling Results for Vacuolization of Centrilobular 203

Hepatocytes in Male Rats Following Inhalation Exposure to 1-BP 204

Modela Goodness of fit BMD10PctAdd

(ppm)

BMDL10PctAdd

(ppm)

Basis for model selection

p-value AIC

Multistage 3° 0.955 38.189 346 226 Multistage 3° model was

selected based on the lowest

AIC from this set of models

which have adequate p-value,

adequate fit by visual inspection

and the BMDLs are < 1.5-fold

apart considered sufficiently

close.

Multistage 2° 0.898 39.202 289 198

LogProbit 0.951 39.678 345 225

Gamma 0.919 39.874 349 227

LogLogistic 0.903 40.003 349 224

Weibull 0.872 40.180 351 222

Probit 0.773 40.585 370 275

Logistic 0.662 41.195 382 290

a Selected model in bold; scaled residuals for selected model for doses 0, 100, 200, 400, and 600 ppm were 0, -0.2, -0.56, 0.54, -

0.18, respectively.

205

Page 32 of 139

206 Figure 2-9 Plot of Mean Response by Dose with Fitted Curve for the Selected Model 207

(Multistage 3°) for Vacuolization of Centrilobular Hepatocytes in Male Rats Exposed to 1-208

BP Via Inhalation in ppm; BMR 10% Added Risk. 209

210

Table 2-17 BMD Modeling Results for Vacuolization of Centrilobular Hepatocytes in Male 211

Rats Exposed to 1-BP Via Inhalation; BMR 10% Added Risk. 212

Multistage Model. (Version: 3.4; Date: 05/02/2014)

The form of the probability function is: P[response] = background + (1-background)*[1-EXP(-

beta1*dose^1-beta2*dose^2...)]

Benchmark Dose Computation.

BMR = 10% Added risk

BMD = 345.704

BMDL at the 95% confidence level = 226.133

0

0.1

0.2

0.3

0.4

0.5

0.6

0.7

0 100 200 300 400 500 600

Frac

tion

Affe

cted

dose

Multistage Model, with BMR of 10% Added Risk for the BMD and 0.95 Lower Confidence Limit for the BMDL

19:16 12/09 2015

BMDBMDL

Multistage

Page 33 of 139

Parameter Estimates

Variable Estimate Default Initial

Parameter Values

Background 0 0

Beta(1) 0 0

Beta(2) 0 1.4788E-06

Beta(3) 2.5502E-09 0

Analysis of Deviance Table

Model Log(likelihood) # Param's Deviance Test d.f. p-value

Full model -17.6 5

Fitted model -18.09 1 0.986987 4 0.91

Reduced model -27.52 1 19.8363 4 0

AIC: = 38.1894

Goodness of Fit Table

Dose Est. Prob. Expected Observed Size Scaled Resid

0 0 0 0 15 0

100 0.0025 0.038 0 15 -0.2

200 0.0202 0.303 0 15 -0.56

400 0.1506 2.259 3 15 0.54

600 0.4235 6.353 6 15 -0.18

Chi^2 = 0.67 d.f = 4 p-value = 0.9552

213

Increased Incidence of Vacuolization of Centrilobular Hepatocytes in 214

Females 215

Increased incidence of vacuolization of centrilobular hepatocytes was observed in females of the 216

F0 generation of the reproductive and developmental study by WIL Laboratories (2001). 217

Dichotomous models were used to fit dose response data. A BMR of 10% added risk was 218

choosen per EPA Benchmark Dose Technical Guidance (U.S. EPA, 2012). The doses and 219

response data used for the modeling are presented in Table 2-18. 220

221

Page 34 of 139

Table 2-18 Incidence of Vacuolization of Centrilobular Hepatocytes Selected for Dose-222

Response Modeling for 1-BP 223

Dose (ppm) Number of animals Incidence

0 25 0

100 25 0

250 25 0

500 25 6

750 25 16

224

The BMD modeling results for vacuolization of centrilobular hepatocytes are summarized in 225

Table 2-19. The best fitting model was the LogProbit based on Akaike information criterion 226

(AIC; lower values indicates a better fit), chi-square goodness of fit p-value (higher value 227

indicates a better fit) and visual inspection. For the best fitting model a plot of the model is 228

shown in Figure 2-10. The model version number, model form, benchmark dose calculation, 229

parameter estimates and estimated values are shown below in . 230

Table 2-19 Summary of BMD Modeling Results for Vacuolization of Centrilobular 231

Hepatocytes in Female F0 Rats Following Inhalation Exposure to 1-BP in a Two-232

Generation Study 233

Modela Goodness of fit BMD10PctAdd

(ppm)

BMDL10PctAdd

(ppm)

Basis for model selection

p-value AIC

LogProbit 0.988 64.438 415 322 LogProbit model was selected

based on the lowest AIC from

this set of models which have

adequate p-values (excluding

Quantal-Linear), adequate fit

by visual inspection and the

BMDLs are 1.5-fold apart

considered sufficiently close.

Gamma 0.965 64.648 416 320

LogLogistic 0.945 64.843 415 320

Weibull 0.879 65.283 411 310

Probit 0.826 65.496 423 335

Logistic 0.661 66.491 431 347

Multistage 2° 0.410 68.583 279 228

Quantal-Linear 0.0134 80.285 153 109

a Selected model in bold; scaled residuals for selected model for doses 0, 100, 250, 500, and 750 ppm were 0, 0, -0.29, 0.19,

-0.11, respectively.

234

Page 35 of 139

235 Figure 2-10 Plot of Mean Response by Dose with Fitted Curve for the Selected Model 236

(LogLogistic) for Vacuolization of Centrilobular Hepatocytes in Female Rats Exposed to 1-237

BP Via Inhalation in ppm; BMR 10% Added Risk. 238

239

Table 2-20 BMD Modeling Results for Vacuolization of Centrilobular Hepatocytes in 240

Female Rats Exposed to 1-BP Via Inhalation; BMR 10% Added Risk. 241

Probit Model. (Version: 3.3; Date: 2/28/2013)

The form of the probability function is: P[response] = Background + (1-Background) *

CumNorm(Intercept+Slope*Log(Dose)),where CumNorm(.) is the cumulative normal

distribution function

Slope parameter is not restricted

Benchmark Dose Computation.

BMR = 10% Added risk

BMD = 415.388

BMDL at the 95% confidence level = 322.058

0

0.1

0.2

0.3

0.4

0.5

0.6

0.7

0.8

0 100 200 300 400 500 600 700

Frac

tion

Affe

cted

dose

LogProbit Model, with BMR of 10% Added Risk for the BMD and 0.95 Lower Confidence Limit for the BMDL

17:56 12/09 2015

BMDL BMD

LogProbit

Page 36 of 139

Parameter Estimates

Variable Estimate Default Initial

Parameter Values

background 0 0

intercept -1.8305E+01 -7.9627E+00

slope 2.82354 1.1917

Analysis of Deviance Table

Model Log(likelihood) # Param's Deviance Test d.f. p-value

Full model -30.11 5

Fitted model -30.22 2 0.213311 3 0.98

Reduced model -58.16 1 56.0935 4 <.0001

AIC: = 64.4382

Goodness of Fit Table

Dose Est. Prob. Expected Observed Size Scaled Resid

0 0 0 0 25 0

100 0 0 0 25 0

250 0.0033 0.083 0 25 -0.29

500 0.2242 5.605 6 25 0.19

750 0.6505 16.263 16 25 -0.11

Chi^2 = 0.13 d.f = 3 p-value = 0.9879

242

Increased Incidence of Renal Pelvic Mineralization in Males 243

Increased incidence of renal pelvic mineralization was observed in males of the F0 generation of 244

the reproductive and developmental study by WIL Laboratories (2001). Dichotomous models 245

were used to fit dose response data. A BMR of 10% added risk was choosen per EPA 246

Benchmark Dose Technical Guidance (U.S. EPA, 2012). The doses and response data used for 247

the modeling are presented in Table 2-21. 248

249

Page 37 of 139

Table 2-21 Incidence of Renal Pelvic Mineralization Selected for Dose-Response Modeling 250

for 1-BP 251

Dose (ppm) Number of animals Incidence

0 25 1

100 25 0

250 25 1

500 25 2

750 25 6

252

The BMD modeling results for vacuolization of renal pelvic mineralization are summarized in 253

Table 2-22. The best fitting model was the Multistage 3° based on Akaike information criterion 254

(AIC; lower values indicates a better fit), chi-square goodness of fit p-value (higher value 255

indicates a better fit) and visual inspection. For the best fitting model a plot of the model is 256

shown in Figure 2-11. The model version number, model form, benchmark dose calculation, 257

parameter estimates and estimated values are shown below in Table 2-23. 258

Table 2-22 Summary of BMD Modeling Results for Renal Pelvic Mineralization in Male F0 259

Rats Following Inhalation Exposure to 1-BP in a Two-Generation Study 260

Modela Goodness of fit BMD10PctAdd

(ppm)

BMDL10PctAdd

(ppm)

Basis for model selection

p-value AIC

Multistage 3° 0.789 63.835 571 386 Multistage 3° model was

selected based on the lowest

AIC from this set of models

which have adequate p-values,

adequate fit by visual inspection

and the BMDLs are 1.5-fold

apart considered sufficiently

close.

Multistage 2° 0.668 64.258 527 368

Logistic 0.629 64.260 545 434

Probit 0.567 64.488 526 408

Weibull 0.603 65.825 581 375

LogLogistic 0.602 65.835 579 371

Gamma 0.597 65.856 575 371

LogProbit 0.597 65.894 577 355

Quantal-Linear 0.326 66.496 507 284

a Selected model in bold; scaled residuals for selected model for doses 0, 100, 250, 500, and 750 ppm were 0.6, -0.76, 0.26,

-0.18, 0.07, respectively.

261

Page 38 of 139

262 Figure 2-11 Plot of Mean Response by Dose with Fitted Curve for the Selected Model 263

(Multistage 3°) for Renal Pelvic Mineralization in Male Rats Exposed to 1-BP Via 264

Inhalation in ppm; BMR 10% Added Risk. 265

266

Table 2-23 BMD Modeling Results for Renal Pelvic Mineralization in Male Rats Exposed 267

to 1-BP Via Inhalation; BMR 10% Added Risk. 268

Multistage Model. (Version: 3.4; Date: 05/02/2014)

The form of the probability function is: P[response] = background + (1-background)*[1-EXP(-

beta1*dose^1-beta2*dose^2...)]

Benchmark Dose Computation.

BMR = 10% Added risk

BMD = 571.342

BMDL at the 95% confidence level = 385.532

Parameter Estimates

Variable Estimate Default Initial

Parameter Values

Background 0.0222219 0.00963337

Beta(1) 0 0

Beta(2) 0 0

Beta(3) 5.7848E-10 5.8917E-10

0

0.1

0.2

0.3

0.4

0.5

0 100 200 300 400 500 600 700

Frac

tion

Affe

cted

dose

Multistage Model, with BMR of 10% Added Risk for the BMD and 0.95 Lower Confidence Limit for the BMDL

19:03 12/09 2015

BMDBMDL

Multistage

Page 39 of 139

Analysis of Deviance Table

Model Log(likelihood) # Param's Deviance Test d.f. p-value

Full model -29.14 5

Fitted model -29.92 2 1.5483 3 0.67

Reduced model -34.85 1 11.4055 4 0.02

AIC: = 63.8352

Goodness of Fit Table

Dose Est. Prob. Expected Observed Size Scaled Resid

0 0.0222 0.556 1 25 0.6

100 0.0228 0.57 0 25 -0.76

250 0.031 0.776 1 25 0.26

500 0.0904 2.261 2 25 -0.18

750 0.234 5.849 6 25 0.07

Chi^2 = 1.05 d.f = 3 p-value = 0.7887

269

Increased Incidence of Renal Pelvic Mineralization in Females 270

Increased incidence of renal pelvic mineralization was observed in females of the F0 generation 271

of the reproductive and developmental study by WIL Laboratories (2001). Dichotomous models 272

were used to fit dose response data. A BMR of 10% added risk was choosen per EPA 273

Benchmark Dose Technical Guidance (U.S. EPA, 2012). The doses and response data used for 274

the modeling are presented in Table 2-24. 275

276

Table 2-24 Incidence of Renal Pelvic Mineralization Selected for Dose-Response Modeling 277

for 1-BP 278

Dose (ppm) Number of animals Incidence

0 25 2

100 25 3

250 25 5

500 24 12

750 25 14

279

The BMD modeling results for vacuolization of renal pelvic mineralization are summarized in 280

Table 2-25. The best fitting model was the LogProbit based on Akaike information criterion 281

(AIC; lower values indicates a better fit), chi-square goodness of fit p-value (higher value 282

indicates a better fit) and visual inspection. For the best fitting model a plot of the model is 283

Page 40 of 139

shown in Figure 2-12. The model version number, model form, benchmark dose calculation, 284

parameter estimates and estimated values are shown below in Table 2-26. 285

Table 2-25 Summary of BMD Modeling Results for Renal Pelvic Mineralization in Female 286

F0 Rats Following Inhalation Exposure to 1-BP in a Two-Generation Study 287

Modela Goodness of fit BMD10PctAdd

(ppm)

BMDL10PctAdd

(ppm)

Basis for model selection

p-value AIC

Probit 0.708 130.24 212 174 Probit model was selected based

on the lowest AIC from this set

of models which have adequate

p-values, adequate fit by visual

inspection and the BMDLs are

< 3-fold apart considered

sufficiently close.

Quantal-Linear 0.703 130.32 113 79.3

Logistic 0.664 130.43 228 186

LogProbit 0.735 131.49 195 70.4

LogLogistic 0.728 131.51 187 69.9

Gamma 0.683 131.63 182 82.8

Weibull 0.662 131.70 174 82.5

Multistage 2° 0.610 131.86 164 81.6

a Selected model in bold; scaled residuals for selected model for doses 0, 100, 250, 500, and 750 ppm were -0.17, -0.15, -0.16,

0.99, -0.58, respectively.

288

289 Figure 2-12 Plot of Mean Response by Dose with Fitted Curve for the Selected Model 290

(Probit) for Renal Pelvic Mineralization in Female Rats Exposed to 1-BP Via Inhalation in 291

ppm; BMR 10% Added Risk. 292

293

Table 2-26 BMD Modeling Results for Renal Pelvic Mineralization in Female Rats Exposed 294

to 1-BP Via Inhalation; BMR 10% Added Risk. 295

Probit Model. (Version: 3.3; Date: 2/28/2013)

The form of the probability function is: P[response] = CumNorm(Intercept+Slope*Dose),

where CumNorm(.) is the cumulative normal distribution function

Slope parameter is not restricted

0

0.1

0.2

0.3

0.4

0.5

0.6

0.7

0.8

0 100 200 300 400 500 600 700

Frac

tion

Affe

cted

dose

Probit Model, with BMR of 10% Added Risk for the BMD and 0.95 Lower Confidence Limit for the BMDL

18:44 12/09 2015

BMDL BMD

Probit

Page 41 of 139

Benchmark Dose Computation.

BMR = 10% Added risk

BMD = 212.127

BMDL at the 95% confidence level = 174.256

Parameter Estimates

Variable Estimate Default Initial

Parameter Values

background n/a 0

intercept -1.3432E+00 -1.3433E+00

slope 0.00218661 0.00218429

Analysis of Deviance Table

Model Log(likelihood) # Param's Deviance Test d.f. p-value

Full model -62.44 5

Fitted model -63.12 2 1.36613 3 0.71

Reduced model -74.7 1 24.5328 4 <.0001

AIC: = 130.239

Goodness of Fit Table

Dose Est. Prob. Expected Observed Size Scaled Resid

0 0.0896 2.24 2 25 -0.17

100 0.1304 3.26 3 25 -0.15

250 0.2129 5.321 5 25 -0.16

500 0.4013 9.632 12 24 0.99

750 0.6167 15.417 14 25 -0.58

Chi^2 = 1.39 d.f = 3 p-value = 0.7082

296

Decreased Seminal Vesicle Weight 297

Decreased relative and absolute seminal vesicle weights were observed in (Ichihara et al., 2000). 298

Continuous models were used to fit dose-response data for both absolute and relative seminal 299

vesicle weights. A BMR 1 standard deviation was choosen per EPA Benchmark Dose Technical 300

Guidance (U.S. EPA, 2012). Both absolute and relative organ weights may be relevant for 301

reproductive organs like the seminal vesicle as described in EPA’s Guidelines for Reproductive 302

Page 42 of 139

Toxicity Risk Assessment (U.S. EPA, 1996). In this case by coincidence the BMDL was the 303

same (38 ppm) for both absolute and relative seminal vesicle weights and therefore this endpoint 304

is refered to as absolute/relative seminal vesicle weight in the risk evaluation and the following 305

text and tables. The doses, response data and BMD modeling results are presented for relative 306

and then absolute seminal vesicle weights below. 307

Decreased Relative Seminal Vesicle Weight 308

The doses and response data used for relative seminal vesicle weight are presented in Table 2-27. 309

Table 2-27 Relative Seminal Vesicle Weight Data Selected for Dose-Response Modeling for 310

1-BP 311

Dose (ppm) Number of animals Relative Weight (mg/g BW) Standard Deviation

0 8 4.35 0.62

200 9 3.23 0.55

400 9 3.17 0.67

800 9 2.62 0.87

312

Comparisons of model fits obtained are provided in Table 2-28. Models with homogeneous 313

variance were used because the BMDS Test 2 p-value was 0.543. The Hill model was excluded 314

because the BMD to BMDL ratio was 7.34. Of the remaining models the best fitting model 315

(Exponential (M4)) was selected based on Akaike information criterion (AIC; lower values 316

indicates a better fit), chi-square goodness of fit p-value (higher value indicates a better fit) and 317

visual inspection. The Exponential (M4) model had an acceptable BMD to BMDL ratio of 3.2 318

and is indicated in bold. For the best fitting model a plot of the model is shown in Figure 2-13. 319

The model version number, model form, benchmark dose calculation, parameter estimates and 320

estimated values are shown below in Table 2-29. 321

Table 2-28 Summary of BMD Modeling Results for Relative Seminal Vesicle Weight in 322

Rats Exposed to 1-BP by Inhalation 323

Modela Goodness of fit BMD10RD

(ppm)

BMDL10RD

(ppm)

BMD1SD

(ppm)

BMDL1SD

(ppm)

Basis for model selection

p-value AIC

Hill 0.298 13.857 57.2 6.72 101 13.7 For models with BMD to

BMDL ratios less than 5

(this excludes the Hill

model), the Exponential

(M4) model was selected

based on the lowest BMDL

because the models with

adequate goodness of fit p-

value and adequate fit by

visual inspection

(Exponetial M2 – M5) had

BMDLs > 5-fold apart and

not sufficiently close.

Exponential (M4)

Exponential (M5)b

0.221 14.274 73.1 21.4 124 38.1

Exponential (M2)

Exponential (M3)c

0.107 15.240 170 123 301 199

Powerd

Polynomial 2°e

Linearf

0.0604 16.386 213 165 376 267

Polynomial 3°g 0.0604 16.386 213 165 376 267

a Constant variance case presented (BMDS Test 2 p-value = 0.543), selected model in bold; scaled residuals for selected model

for doses 0, 200, 400, and 800 ppm were 0.15, -0.68, 0.92, -0.37, respectively.

Page 43 of 139

b For the Exponential (M5) model, the estimate of d was 1 (boundary). The models in this row reduced to the Exponential (M4)

model. c For the Exponential (M3) model, the estimate of d was 1 (boundary). The models in this row reduced to the Exponential (M2)

model. d For the Power model, the power parameter estimate was 1. The models in this row reduced to the Linear model. e For the Polynomial 2° model, the b2 coefficient estimate was 0 (boundary of parameters space). The models in this row

reduced to the Linear model. f The Linear model may appear equivalent to the Polynomial 3° model, however differences exist in digits not displayed in the

table. g The Polynomial 3° model may appear equivalent to the Power model, however differences exist in digits not displayed in the

table. This also applies to the Polynomial 2° model. This also applies to the Linear model.

324

325 Figure 2-13 Plot of Mean Response by Dose in ppm with Fitted Curve for Exponential (M4) 326

Model with Constant Variance for Relative Seminal Vesicle Weight; BMR = 1 Standard 327

Deviation Change from Control Mean. 328

329

Table 2-29 BMD Modeling Results for Relative Seminal Vesicle Weight; BMR = 1 330

Standard Deviation Change from Control Mean. 331

Exponential Model. (Version: 1.10; Date: 01/12/2015)

The form of the response function is: Y[dose] = a * [c-(c-1) * exp(-b * dose)]

A constant variance model is fit

Benchmark Dose Computation.

BMR = 1.0000 Estimated standard deviations from control

BMD = 123.644

BMDL at the 95% confidence level = 38.1407

Parameter Estimates

Variable Estimate Default Initial

Parameter Values

lnalpha -0.820732 -0.863617

2

2.5

3

3.5

4

4.5

5

0 100 200 300 400 500 600 700 800

Mea

n R

espo

nse

dose

Exponential 4 Model, with BMR of 1 Std. Dev. for the BMD and 0.95 Lower Confidence Limit for the BMDL

10:24 10/30 2015

BMDBMDL

Exponential 4

Page 44 of 139

rho n/a 0

a 4.31581 4.5675

b 0.00406673 0.00345735

c 0.611025 0.546303

d n/a 1

Table of Data and Estimated Values of Interest

Dose N Obs Mean Est Mean Obs Std Dev Est Std Dev Scaled Resid

0 8 4.35 4.32 0.62 0.66 0.1458

200 9 3.23 3.38 0.55 0.66 -0.6845

400 9 3.17 2.97 0.67 0.66 0.9177

800 9 2.62 2.7 0.87 0.66 -0.3705

Likelihoods of Interest

Model Log(likelihood) # Param's AIC

A1 -2.386703 5 14.77341

A2 -1.313327 8 18.62665

A3 -2.386703 5 14.77341

R -13.55019 2 31.10038

4 -3.137185 4 14.27437

Tests of Interest

Test -2*log(Likelihood

Ratio)

Test df p-value

Test 1 24.47 6 0.0004272

Test 2 2.147 3 0.5425

Test 3 2.147 3 0.5425

Test 6a 1.501 1 0.2205

332

Decreased Absolute Seminal Vesicle Weight 333

The doses and response data used for the modeling are presented in Table 2-30. 334

Page 45 of 139

Table 2-30 Absolute Seminal Vesicle Weight Data Selected for Dose-Response Modeling for 335

1-BP 336

Dose (ppm) Number of animals Seminal Vesicle Absolute Weight (mg) Standard Deviation

0 8 1.88 0.27

200 9 1.38 0.26

400 9 1.27 0.25

800 9 1.00 0.36

337

Comparisons of model fits obtained are provided in Table 2-31. Models with homogeneous 338

variance were used because the BMDS Test 2 p-value was 0.653. The best fitting model (Hill) 339

was selected based on Akaike information criterion (AIC; lower values indicates a better fit), 340

chi-square goodness of fit p-value (higher value indicates a better fit) and visual inspection. The 341

Hill model had an acceptable BMD to BMDL ratio of 2.5 and is indicated in bold. For the best 342

fitting model a plot of the model is shown in Figure 2-14. The model version number, model 343

form, benchmark dose calculation, parameter estimates and estimated values are shown below in 344

Table 2-32. 345

Table 2-31 Summary of BMD Modeling Results for Seminal Vesicle Absolute Weight in 346

Rats Exposed to 1-BP by Inhalation 347

Modela Goodness of fit BMD1SD

(ppm)

BMDL1SD

(ppm)

Basis for model selection

p-value AIC

Hill 0.429 -47.533 97.3 38.4 The Hill model was selected

based on the lowest AIC

because the models with

adequate goodness of fit p-value

and adequate fit by visual

inspection (including Hill and

Exponetial M2 – M5, excluding

Power, Polynomial and Linear)

had BMDLs < 4-fold apart

considered sufficiently close.

Exponential (M4)

Exponential (M5)b

0.337 -47.235 112 58.4

Exponential (M2)

Exponential (M3)c

0.159 -46.484 219 152

Powerd

Polynomial 3°e

Polynomial 2°f

Linear

0.0576 -44.450 299 222

a Constant variance case presented (BMDS Test 2 p-value = 0.653), selected model in bold; scaled residuals for selected model

for doses 0, 200, 400, and 800 ppm were 0.07, -0.43, 0.61, -0.24, respectively. b For the Exponential (M5) model, the estimate of d was 1 (boundary). The models in this row reduced to the Exponential (M4)

model. c For the Exponential (M3) model, the estimate of d was 1 (boundary). The models in this row reduced to the Exponential (M2)

model. d For the Power model, the power parameter estimate was 1. The models in this row reduced to the Linear model. e For the Polynomial 3° model, the b3 coefficient estimates was 0 (boundary of parameters space). The models in this row

reduced to the Polynomial 2° model. For the Polynomial 3° model, the b3 and b2 coefficient estimates were 0 (boundary of

parameters space). The models in this row reduced to the Linear model. f For the Polynomial 2° model, the b2 coefficient estimate was 0 (boundary of parameters space). The models in this row

reduced to the Linear model.

348

Page 46 of 139

349 Figure 2-14 Plot of Mean Response by Dose in ppm with Fitted Curve for Hill Model with 350

Constant Variance for Seminal Vesicle Absolute Weight; BMR = 1 Standard Deviation 351

Change from Control Mean. 352

353

Table 2-32 BMD Modeling Results for Seminal Vesicle Absolute Weight; BMR = 1 354

Standard Deviation Change from Control Mean. 355

Hill Model. (Version: 2.17; Date: 01/28/2013)

The form of the response function is: Y[dose] = intercept + v*dose^n/(k^n + dose^n)

A constant variance model is fit

Benchmark Dose Computation.

BMR = 1 Estimated standard deviations from the control mean

BMD = 97.2583

BMDL at the 95% confidence level = 38.4029

Parameter Estimates

Variable Estimate Default Initial Parameter Values

alpha 0.0752711 0.0834806

rho n/a 0

intercept 1.87362 1.88

v -1.2008 -0.88

n 1 1.5698

k 328.422 176

0.6

0.8

1

1.2

1.4

1.6

1.8

2

2.2

0 100 200 300 400 500 600 700 800

Mea

n R

espo

nse

dose

Hill Model, with BMR of 1 Std. Dev. for the BMD and 0.95 Lower Confidence Limit for the BMDL

14:19 11/30 2015

BMDBMDL

Hill

Page 47 of 139

Table of Data and Estimated Values of Interest

Dose N Obs Mean Est Mean Obs Std Dev Est Std Dev Scaled Resid

0 8 1.88 1.87 0.27 0.27 0.0658

200 9 1.38 1.42 0.26 0.27 -0.428

400 9 1.27 1.21 0.25 0.27 0.61

800 9 1 1.02 0.36 0.27 -0.244

Likelihoods of Interest

Model Log(likelihood) # Param's AIC

A1 28.078773 5 -46.157546

A2 28.894036 8 -41.788073

A3 28.078773 5 -46.157546

fitted 27.766532 4 -47.533065

R 13.387326 2 -22.774652

Tests of Interest

Test -2*log(Likelihood

Ratio)

Test df p-value

Test 1 31.0134 6 <0.0001

Test 2 1.63053 3 0.6525

Test 3 1.63053 3 0.6525

Test 4 0.624482 1 0.4294

356

Decreased Percent Normal Sperm Morphology 357

Decreased percent normal sperm morphology was observed in the F0 generation of the 358

reproductive and developmental study by WIL Laboratories (2001). The doses and response data 359

used for the modeling are presented in Table 2-33. 360

361

Table 2-33 Sperm Morphology Data Selected for Dose-Response Modeling for 1-BP 362

Dose (ppm) Number of animals % normal Standard Deviation

0 25 99.7 0.6

100 25 99.7 0.52

250 25 99.3 0.83

500 24 98.2 2.59

750 24 90.6 8.74

363

Page 48 of 139

Comparisons of model fits obtained are provided in Table 2-34. No model was selected due to 364

unacceptable fitting of the variances. To illustrate the unacceptable fitting the Polynomial 2° is 365

shown in a plot in Figure 2-15. The model version number, model form, benchmark dose 366

calculation, parameter estimates and estimated values are shown below in Table 2-35. 367

368

Table 2-34 Summary of BMD Modeling Results for Sperm Morphology in the F0 369

Generation Exposed to 1-BP by Inhalation 370

Modela Goodness of fit Variance model BMD1SD

(ppm)

BMDL1SD

(ppm)

Basis for model

selection p-value AIC p-value

Exponential (M2)b N/A 243.78 <0.0001 166 112 Due to

unacceptable

fitting of the

variances i.e.

variance model

p-values are all

< 0.1 and poor

visual fit no

model was

selected.

Exponential (M3) N/A 220.96 <0.0001 259 200

Exponential (M4)b N/A 243.78 <0.0001 166 112

Hill 0.490 221.75 0.0269 277 errorc

Power <0.0001 221.03 <0.0001 258 199

Polynomial 4°d

Polynomial 3°

Polynomial 2°

0.326 221.51 0.0269 268 198

Linear <0.0001 243.33 0.0269 164 111

a Modeled variance case presented (BMDS Test 2 p-value = <0.0001), selected model in bold; scaled residuals for selected

model for doses 0, 100, 250, 500, and 750 ppm were -0.52, 0.29, 0.25, 0.71, -2.26, respectively. b The Exponential (M2) and Exponential (M4) models may appear equivalent, however differences exist in digits not displayed

in the table. c BMDL computation failed for this model. d For the Polynomial 3° model, the b3 coefficient estimates was 0 (boundary of parameters space). For the Polynomial 4° model,

the b4 and b3 coefficient estimates were 0 (boundary of parameters space). The models in this row reduced to the Polynomial 2°

model.

371 Figure 2-15 Plot of Mean Response by Dose in ppm with Fitted Curve for Polynomial 2° 372

Model with Constant Variance for Sperm Morphology in F0 Rats Exposed to 1-BP by 373

Inhalation; BMR = 1 Standard Deviation Change from Control Mean. 374

375

86

88

90

92

94

96

98

100

0 100 200 300 400 500 600 700

Mea

n R

espo

nse

dose

Polynomial Model, with BMR of 1 Std. Dev. for the BMD and 0.95 Lower Confidence Limit for the BMDL

14:46 05/15 2020

BMDBMDL

Polynomial

Page 49 of 139

Table 2-35 BMD Modeling Results for Sperm Morphology in F0 Rats Exposed to 1-BP by 376

Inhalation; BMR = 1 Standard Deviation Change from Control Mean. 377

Polynomial Model. (Version: 2.20; Date: 10/22/2014)

The form of the response function is: Y[dose] = beta_0 + beta_1*dose + beta_2*dose^2 + …

A modeled variance is fit

Benchmark Dose Computation.

BMR = 1 Estimated standard deviations from the control mean

BMD = 268.494

BMDL at the 95% confidence level = 198.345

Parameter Estimates

Variable Estimate Default Initial

Parameter Values

lalpha 644.271 2.80123

rho -140.219 0

beta_0 99.7591 99.2397

beta_1 -0.000251699 0

beta_2 -0.00000698119 -0.0000287522

Table of Data and Estimated Values of Interest

Dose N Obs Mean Est Mean Obs Std Dev Est Std Dev Scaled Resid

0 25 99.7 99.8 0.6 0.57 -0.518

100 25 99.7 99.7 0.52 0.61 0.294

250 25 99.3 99.3 0.83 0.81 0.247

500 24 98.2 97.9 2.59 2.15 0.71

750 24 90.6 95.6 8.74 10.9 -2.26

Likelihoods of Interest

Model Log(likelihood) # Param's AIC

A1 -231.223656 6 474.447313

A2 -100.040336 10 220.080673

A3 -104.635935 7 223.271869

fitted -105.757098 5 221.514197

R -265.999639 2 535.999277

Page 50 of 139

Tests of Interest

Test -

2*log(Likelihood

Ratio)

Test df p-value

Test 1 331.919 8 <0.0001

Test 2 262.367 4 <0.0001

Test 3 9.1912 3 0.02685

Test 4 2.24233 2 0.3259

378

To investigate the effect of the poor modeling of the variances on the BMDL the observed 379

standard deviations were considered and the standard deviation at the highest dose is much larger 380

than at the other dose groups. The data set was investigated with the highest dose dropped. The 381

model fits with the modeled variance (BMDS test 2 p-value <0.0001) are summarized in Table 382

2-36. Several models have adequate fits i.e. Goodness of fit p-values > 0.1 excluding the Hill 383

model because a BMDL was not calculated the Polynomial and Exponential (M3) are acceptable. 384

The BMDLs of these models are sufficiently close, the model with the lowest AIC is the 385

Polynomial and the Polynomial 3° was choosen because the BMDL is lower than Polynomial 2°. 386

For the selected model Polynomial 3° a plot is shown in Figure 2-16. The model version number, 387

model form, benchmark dose calculation, parameter estimates and estimated values are shown 388

below in Table 2-36. 389

390

Table 2-36 Summary of BMD Modeling Results for Sperm Morphology in the F0 391

Generation Exposed to 1-BP by Inhalation with High Dose Dropped 392

Modela Goodness of fit BMD1SD

(ppm)

BMDL1SD

(ppm)

Basis for model

selection p-value AIC

Exponential (M3) 0.408 84.309 297 219 Models with

Goodness of fit p-

values < 0.1 were

excluded i.e.

Linear, Exponential

(M2, M4, M5) and

Power and the Hill

model failed to

calculate a BMDL.

The remaining

models had BMDLs

sufficiently close,

the lowest AICs are

the Polynomial

models and 3° was

choosen for a lower

BMDL than 2°.

Hill 0.659 83.555 257 errord

Polynomial 3° 0.618 82.324 294 223

Polynomial 2° 0.618 82.324 294 238

Power 0.0019 93.269 897 147

Exponential (M2)b 0.00461 92.383 229 147

Exponential (M4)b 0.00461 92.383 229 147

Exponential (M5) N/Ac 85.555 257 225

Linear 0.00421 92.300 228 148

Page 51 of 139

393

394 Figure 2-16 Plot of Mean Response by Dose in ppm with Fitted Curve for Polynomial 3° 395

Model with Constant Variance for Sperm Morphology in F0 Rats Exposed to 1-BP by 396

Inhalation high Dose Dropped; BMR = 1 Standard Deviation Change from Control Mean. 397

398

Table 2-37 BMD Modeling Results for Sperm Morphology in F0 Rats Exposed to 1-BP by 399

Inhalation High Dose Dropped; BMR = 1 Standard Deviation Change from Control Mean. 400

Polynomial Model. (Version: 2.20; Date: 10/22/2014)

The form of the response function is: Y[dose] = beta_0 + beta_1*dose + beta_2*dose^2 + …

A modeled variance is fit

Benchmark Dose Computation.

BMR = 1 Estimated standard deviations from the control mean

BMD = 293.888

BMDL at the 95% confidence level = 222.979

Parameter Estimates

Variable Estimate Default Initial

Parameter Values

lalpha 892.813 0.671598

rho -194.254 0

beta_0 99.7232 99.7

beta_1 0 0

97

97.5

98

98.5

99

99.5

100

0 100 200 300 400 500

Mea

n R

espo

nse

dose

Polynomial Model, with BMR of 1 Std. Dev. for the BMD and 0.95 Lower Confidence Limit for the BMDL

16:10 05/15 2020

BMDBMDL

Polynomial

a Modeled variance case presented (BMDS Test 2 p-value = <0.0001), selected model in bold; scaled residuals for selected

model for doses 0, 100, 250, and 500 ppm were -0.21, 0.34, -0.19, 0.09, respectively. b The Exponential (M2) and Exponential (M4) models may appear equivalent, however differences exist in digits not displayed

in the table. c No available degrees of freedom to calculate a goodness of fit value. d BMDL computation failed for this model.

Page 52 of 139

beta_2 -0.00000628545 -0.0000151

beta_3 -1.94851E-35 0

Table of Data and Estimated Values of Interest

Dose N Obs Mean Est Mean Obs Std Dev Est Std Dev Scaled Resid

0 25 99.7 99.7 0.6 0.54 -0.213

100 25 99.7 99.7 0.52 0.58 0.344

250 25 99.3 99.3 0.83 0.8 -0.19

500 24 98.2 98.2 2.59 2.54 0.093

Likelihoods of Interest

Model Log(likelihood) # Param's AIC

A1 -80.702586 5 171.405173

A2 -36.521207 8 89.042414

A3 -36.680048 6 85.360095

fitted -37.162171 4 82.324341

R -89.602311 2 183.204622

Tests of Interest

Test -

2*log(Likelihood

Ratio)

Test df p-value

Test 1 106.162 6 <0.0001

Test 2 88.3628 3 <0.0001

Test 3 0.317681 2 0.8531

Test 4 0.964246 2 0.6175

401

402

Decreased Percent Motile Sperm 403

A decrease in motile sperm was observed in the F0 generation in the reproductive and 404

developmental study by WIL Laboratories (2001). The doses and response data used for the 405

modeling are presented in Table 2-38. 406

407

Page 53 of 139

Table 2-38 Sperm Motility Data Selected for Dose-Response Modeling for 1-BP 408

Dose (ppm) Number of animals Mean sperm motility (% motile) Standard Deviation

0 25 86.8 11.90

100 25 88.8 7.22

250 25 83.4 10.41

500 23 71.9 9.27

750 15 53.2 19.59

409

The BMD modeling results for sperm motility with non-homogeneous variance (BMDS test 2 p-410

value = 0.0001749) are summarized in Table 2-39. Although the means are sufficiently fit for 411

some models (e.g. the Polynomial 2° model has p-value of 0.516) the variances are not well 412

modeled BMDS Test 3 p-value = 0.0426. This result suggests that due to the poor variance 413

modeling for the data it is not reasonable to use BMDS for this endpoint. Instead the NOAEL of 414

250 ppm was used. 415

416

Table 2-39 Summary of BMD Modeling Results for Sperm Motility F0 Male Rats Following 417

Inhalation Exposure to 1-BP 418

Modela Goodness of fit BMD1SD

(ppm)

BMDL1SD

(ppm)

Basis for model selection

p-value AIC

Polynomial 2° 0.516 657.83 386 346 Due to unacceptable fitting of

the variances no model was

selected. Power 0.334 659.73 399 313

Polynomial 3° 0.330 659.76 397 315

Exponential (M3) 0.324 659.80 402 317

Hill 0.139 661.73 400 323

Polynomial 4° 0.137 661.76 397 314

Exponential (M5) 0.133 661.80 402 317

Linear 0.00132 671.22 237 192

Exponential (M2)

Exponential (M4)b

2.10E-04 675.10 226 178

a Modeled variance case presented (BMDS Test 2 p-value = 1.75E-04, BMDS Test 3 p-value = 0.0426), no model was selected

as a best-fitting model. b For the Exponential (M4) model, the estimate of c was 0 (boundary). The models in this row reduced to the Exponential (M2)

model.

419

To investigate the effect of the poor modeling of the variances on the BMDL the observed 420

standard deviations were considered and the standard deviation at the highest dose is much larger 421

than at the other dose groups. The data set was investigated with the highest dose dropped. The 422

model fits with non-homogeneous variance (BMDS test 2 p-value = 0.0966) are summarized in 423

Table 2-40. Although the means are sufficiently fit for some models (e.g. the Polynomial 2° 424

model has p-value of 0.676) the variances are not well modeled BMDS Test 3 p-value = 0.0426. 425

Page 54 of 139

Table 2-40 Summary of BMD Modeling Results for Sperm Motility F0 Male Rats Following 426

Inhalation Exposure to 1-BP with the Highest Dose Dropped 427

Modela Goodness of fit BMD1SD

(ppm)

BMDL1SD

(ppm)

Basis for model selection

p-value AIC

Polynomial 3° 0.676 551.25 394 345 Due to unacceptable fitting of

the variances no model was

selected. Polynomial 2° 0.676 551.25 394 302

Hill 0.529 552.86 271 255

Exponential (M3) 0.386 553.22 391 294

Power 0.376 553.25 395 296

Exponential (M5) N/Ab 554.86 267 253

Linear 0.107 554.94 315 241

Exponential (M2)c 0.0743 555.67 310 231

Exponential (M4)d 0.0743 555.67 310 231

Polynomial 4° error error errore errore

a Modeled variance case presented (BMDS Test 2 p-value = 0.0966, BMDS Test 3 p-value = 0.0426), no model was selected as

a best-fitting model. b No available degrees of freedom to calculate a goodness of fit value. c The Exponential (M2) model may appear equivalent to the Exponential (M4) model, however differences exist in digits not

displayed in the table. d The Exponential (M4) model may appear equivalent to the Exponential (M2) model, however differences exist in digits not

displayed in the table. e BMD or BMDL computation failed for this model.

428

Decreased Left Cauda Epididymis Weight 429

A decrease in left cauda epididymis absolute weight was observed in the F0 generation in the 430

reproductive and developmental study by (WIL Research, 2001). The absolute weights are used 431

for BMD modeling of the epididymis as described in EPA’s Guidelines for Reproductive 432

Toxicity Risk Assessment (U.S. EPA, 1996). The doses and response data used for the modeling 433

are presented in Table 2-41. 434

435

Page 55 of 139

Table 2-41 Left Cauda Epididymis Absolute Weight Data Selected for Dose-Response 436

Modeling for 1-BP 437

Dose (ppm) Number of animals Left Cauda Epididymis Weight (mg) Standard Deviation

0 25 0.3252 0.03673

100 25 0.3242 0.03149

250 25 0.3050 0.03556

500 23 0.2877 0.03170

750 22 0.2401 0.03529

438

The BMD modeling results for left cauda epididymis absolute weight with homogeneous 439

variance (BMDS test 2 p-value =0.911) are summarized in Table 2-42. The best fitting model 440

(Polynomial 4°) was selected based on Akaike information criterion (AIC; lower values indicates 441

a better fit), chi-square goodness of fit p-value (higher value indicates a better fit) and visual 442

inspection. The Polynomial 4° model had an acceptable BMD to BMDL ratio of 1.4 and is 443

indicated in bold. For the best fitting model a plot of the model is shown in Figure 2-17. The 444

model version number, model form, benchmark dose calculation, parameter estimates and 445

estimated values are shown below in Table 2-43. 446

447

Table 2-42 Summary of BMD Modeling Results for Left Cauda Epididymis Absolute 448

Weight F0 Male Rats Following Inhalation Exposure to 1-BP 449

Modela Goodness of fit BMD1SD

(ppm)

BMDL1SD

(ppm)

Basis for model selection

p-value AIC

Polynomial 4° 0.622 -714.88 438 313 The Polynomial 4° model was

selected based on the lowest

AIC from this set of models

which have adequate p-values

(excluding Exponential M2 and

M4), adequate fit by visual

inspection and the BMDLs are

< 1.5-fold apart considered

sufficiently close.

Polynomial 3° 0.565 -714.69 440 316

Polynomial 2° 0.47 -714.32 437 315

Power 0.430 -714.14 444 317

Exponential (M3) 0.382 -713.91 446 320

Linear 0.133 -712.23 307 256

Hill 0.193 -712.14 444 317

Exponential (M5) 0.166 -711.91 446 320

Exponential (M2) 0.0636 -710.55 289 236

Exponential (M4) 0.0636 -710.55 289 235

a Constant variance case presented (BMDS Test 2 p-value = 0.911), selected model in bold; scaled residuals for selected model

for doses 0, 100, 250, 500, and 750 ppm were -0.21, 0.64, -0.65, 0.26, -0.04, respectively.

450

Page 56 of 139

451

Figure 2-17 Plot of Mean Response by Dose in ppm with Fitted Curve for Polynomial 4° 452

Model with Constant Variance for Left Cauda Epididymis Absolute Weight; BMR = 1 453

Standard Deviation Change from Control Mean. 454

455

Table 2-43 BMD Modeling Results for Left Cauda Epididymis Absolute Weight; BMR = 1 456

Standard Deviation Change from Control Mean. 457

Polynomial Model. (Version: 2.20; Date: 10/22/2014)

The form of the response function is: Y[dose] = beta_0 + beta_1*dose + beta_2*dose^2 + …

A constant variance model is fit

Benchmark Dose Computation.

BMR = 1 Estimated standard deviations from the control mean

BMD = 438.482

BMDL at the 95% confidence level = 313.325

Parameter Estimates

Variable Estimate Default Initial

Parameter Values

alpha 0.00113284 0.0011711

rho n/a 0

beta_0 0.326617 0.3252

beta_1 -0.0000672194 0

beta_2 0 -0.00000139519

beta_3 -6.09563E-33 0

beta_4 -1.13164E-13 -2.44944E-12

0.22

0.24

0.26

0.28

0.3

0.32

0.34

0 100 200 300 400 500 600 700

Mea

n R

espo

nse

dose

Polynomial Model, with BMR of 1 Std. Dev. for the BMD and 0.95 Lower Confidence Limit for the BMDL

12:36 11/30 2015

BMDBMDL

Polynomial

Page 57 of 139

Table of Data and Estimated Values of Interest

Dose N Obs Mean Est Mean Obs Std Dev Est Std Dev Scaled Resid

0 25 0.32 0.33 0.04 0.03 -0.21

100 25 0.32 0.32 0.03 0.03 0.641

250 25 0.3 0.31 0.04 0.03 -0.649

500 25 0.29 0.29 0.03 0.03 0.262

750 25 0.24 0.24 0.04 0.03 -0.044

Likelihoods of Interest

Model Log(likelihood) # Param's AIC

A1 361.914605 6 -711.829209

A2 362.410744 10 -704.821488

A3 361.914605 6 -711.829209

fitted 361.438986 4 -714.877972

R 322.608827 2 -641.217655

Tests of Interest

Test -2*log(Likelihood

Ratio)

Test df p-value

Test 1 79.6038 8 <0.0001

Test 2 0.992278 4 0.911

Test 3 0.992278 4 0.911

Test 4 0.951238 2 0.6215

458

Decreased Right Cauda Epididymis Weight 459

A decrease in right cauda epididymis absolute weight was observed in the F0 generation in the 460

reproductive and developmental study by (WIL Research, 2001). The absolute weights are used 461

for BMD modeling of the epididymis as described in EPA’s Guidelines for Reproductive 462

Toxicity Risk Assessment (U.S. EPA, 1996). The doses and response data used for the modeling 463

are presented in Table 2-44. 464

Page 58 of 139

Table 2-44 Right Cauda Epididymis Absolute Weight Data Selected for Dose-Response 465

Modeling for 1-BP 466

Dose (ppm) Number of animals Left Cauda Epididymis Weight (mg) Standard Deviation

0 25 0.3327 0.03631

100 25 0.3311 0.04453

250 25 0.3053 0.04188

500 23 0.2912 0.05206

750 22 0.2405 0.04804

467

The BMD modeling results for right cauda epididymis absolute weight with homogeneous 468

variance (BMDS test 2 p-value =0.455) are summarized in Table 2-45. The best fitting model 469

(Polynomial 4°) was selected based on Akaike information criterion (AIC; lower values indicates 470

a better fit), chi-square goodness of fit p-value (higher value indicates a better fit) and visual 471

inspection. The Polynomial 4° model had an acceptable BMD to BMDL ratio of 1.4 and is 472

indicated in bold. For the best fitting model a plot of the model is shown in Figure 2-18. The 473

model version number, model form, benchmark dose calculation, parameter estimates and 474

estimated values are shown below in Table 2-46. 475

Table 2-45 Summary of BMD Modeling Results for Right Cauda Epididymis Absolute 476

Weight F0 Male Rats Following Inhalation Exposure to 1-BP 477

Modela Goodness of fit BMD1SD

(ppm)

BMDL1SD

(ppm)

Basis for model selection

p-value AIC

Polynomial 4° 0.493 -646.60 485 338 The Polynomial 4° model was

selected based on the lowest

AIC from this set of models

which have adequate p-values,

adequate fit by visual inspection

and the BMDLs are < 1.5-fold

apart considered sufficiently

close.

Polynomial 3° 0.442 -646.38 480 334

Linear 0.296 -646.32 371 303

Polynomial 2° 0.376 -646.06 472 327

Power 0.340 -645.86 474 323

Exponential (M3) 0.304 -645.63 473 317

Exponential (M2) 0.196 -645.33 350 277

Exponential (M4) 0.196 -645.33 350 270

Hill 0.142 -643.85 474 323

Exponential (M5) 0.123 -643.63 473 317

a Constant variance case presented (BMDS Test 2 p-value = 0.455), selected model in bold; scaled residuals for selected model

for doses 0, 100, 250, 500, and 750 ppm were -0.09, 0.63, -0.9, 0.44, -0.08, respectively.

478

Page 59 of 139

479 Figure 2-18 Plot of Mean Response by Dose in ppm with Fitted Curve for Polynomial 4° 480

Model with Constant Variance for Right Cauda Epididymis Absolute Weight; BMR = 1 481

Standard Deviation Change from Control Mean. 482

483

Table 2-46 BMD Modeling Results for Right Cauda Epididymis Absolute Weight; BMR = 484

1 Standard Deviation Change from Control Mean 485

Polynomial Model. (Version: 2.20; Date: 10/22/2014)

The form of the response function is: Y[dose] = beta_0 + beta_1*dose + beta_2*dose^2 + …

A constant variance model is fit

Benchmark Dose Computation.

BMR = 1 Estimated standard deviations from the control mean

BMD = 484.978

BMDL at the 95% confidence level = 338.42

Parameter Estimates

Variable Estimate Default Initial

Parameter Values

alpha 0.00195609 0.00201467

rho n/a 0

beta_0 0.333498 0.3327

beta_1 -0.0000793692 0

beta_2 -2.2991E-28 -0.00000198872

beta_3 -2.18866E-31 0

beta_4 -1.03676E-13 -3.6281E-12

0.22

0.24

0.26

0.28

0.3

0.32

0.34

0.36

0 100 200 300 400 500 600 700

Mea

n R

espo

nse

dose

Polynomial Model, with BMR of 1 Std. Dev. for the BMD and 0.95 Lower Confidence Limit for the BMDL

12:13 11/30 2015

BMDBMDL

Polynomial

Page 60 of 139

Table of Data and Estimated Values of Interest

Dose N Obs Mean Est Mean Obs Std Dev Est Std Dev Scaled Resid

0 25 0.33 0.33 0.04 0.04 -0.0902

100 25 0.33 0.33 0.04 0.04 0.627

250 25 0.3 0.31 0.04 0.04 -0.899

500 25 0.29 0.29 0.05 0.04 0.437

750 25 0.24 0.24 0.05 0.04 -0.0754

Likelihoods of Interest

Model Log(likelihood) # Param's AIC

A1 328.007576 6 -644.015151

A2 329.833395 10 -639.66679

A3 328.007576 6 -644.015151

fitted 327.300407 4 -646.600813

R 299.119376 2 -594.238753

Tests of Interest

Test -2*log(Likelihood

Ratio)

Test df p-value

Test 1 61.428 8 <0.0001

Test 2 3.65164 4 0.4552

Test 3 3.65164 4 0.4552

Test 4 1.41434 2 0.493

Increased Estrus Cycle Length 486

An increase estrus cycle length was observed in the F0 generation in the reproductive and 487

developmental study by (WIL Research, 2001). The doses and response data used for the 488

modeling are presented in Table 2-47. 489

490

Page 61 of 139

Table 2-47 Estrus Cycle Length Data Selected for Dose-Response Modeling for 1-BP 491

Dose (ppm) Number of animals Estrus cycle Length (days) Standard Deviation

0 25 4.2 0.49

100 25 4.5 1.05

250 25 4.7 0.9

500 23 5.5 2.17

750 22 5.6 1.79

The BMD modeling results for estrus cycle length with non-homogeneous variance (BMDS test 492

2 p-value = <0.0001) are summarized in Table 2-48. The means are not adequately fit for any of 493

the models as shown by the goodness of fit where the model with the highest p-value is 0.0065 for 494

the Exponential M4 and M5 models (excluding the Hill model because a BMDL could not be 495

calculated). This result suggests that due to the poor model fit to the data it is not reasonable to 496

use BMDS for this endpoint. Instead the NOAEL of 250 ppm was used. 497

498

Table 2-48 Summary of BMD Modeling Results for Estrus Cycle Length F0 Female Rats 499

Following Inhalation Exposure to 1-BP 500

Modela Goodness of fit BMD1SD

(ppm)

BMDL1SD

(ppm)

Basis for model selection

p-value AIC

Hill 0.00656 160.04 145 errorb Due to inadequate fit of the

models to the data means

(shown by the goodness of fit p-

value) no model was selected.

Exponential (M4)

Exponential (M5)c

0.00650 160.05 157 79.5

Powerd

Polynomial 4°e

Polynomial 3°f

Polynomial 2°g

Linear

0.00169 163.13 300 205

Exponential (M2)

Exponential (M3)h

7.68E-04 164.81 344 244

a Modeled variance case presented (BMDS Test 2 p-value = <0.0001, BMDS Test 3 p-value = 0.506), no model was selected as

a best-fitting model. b BMD or BMDL computation failed for this model. c For the Exponential (M5) model, the estimate of d was 1 (boundary). The models in this row reduced to the Exponential (M4)

model. d For the Power model, the power parameter estimate was 1. The models in this row reduced to the Linear model. e For the Polynomial 4° model, the b4 and b3 coefficient estimates were 0 (boundary of parameters space). The models in this

row reduced to the Polynomial 2° model. For the Polynomial 4° model, the b4, b3, and b2 coefficient estimates were 0

(boundary of parameters space). The models in this row reduced to the Linear model. f For the Polynomial 3° model, the b3 coefficient estimates was 0 (boundary of parameters space). The models in this row

reduced to the Polynomial 2° model. For the Polynomial 3° model, the b3 and b2 coefficient estimates were 0 (boundary of

parameters space). The models in this row reduced to the Linear model. g For the Polynomial 2° model, the b2 coefficient estimate was 0 (boundary of parameters space). The models in this row

reduced to the Linear model. h For the Exponential (M3) model, the estimate of d was 1 (boundary). The models in this row reduced to the Exponential (M2)

model.

501

Page 62 of 139

Decreased Antral Follical Count 502

A decreased antral follicle count was observed in the study of female reproductive function by 503

(Yamada et al., 2003). The doses and response data used for the modeling are presented in Table 504

2-49. The highest dose was not included for modeling because all the rats in the highest dose 505

group (800 ppm) were seriously ill and were sacrificed during the 8th week of the 12 week study. 506

507

Table 2-49 Antral Follicle Count Data Selected for Dose-Response Modeling for 1-BP 508

Dose (ppm) Number of animals Antral Follicle Count Standard Deviation

0 8 30.1 22.4

200 9 12.6 4.82

400 9 7.44 6.52

509

The BMD modeling results for antral follical count with non-homogeneous variance (BMDS test 510

2 p-value = <0.0001) are summarized in Table 2-50. The means are not adequately fit for any of 511

the models as shown by the goodness of fit where the model with the highest p-value is 0.0404 for 512

the Exponential M2 model. This result suggests that due to the poor model fit to the data it is not 513

reasonable to use BMDS for this endpoint. Instead the LOAEL of 200 ppm was used. 514

515

Table 2-50 Summary of BMD Modeling Results for Antral Follical Count in Female Rats 516

Following Inhalation Exposure to 1-BP 517

Modela Goodness of fit BMD1SD

(ppm)

BMDL1SD

(ppm)

Basis for model selection

p-value AIC

Exponential (M4) N/Ab 148.31 189 0.651 Due to inadequate fit of the

models to the data means

(shown by the goodness of fit p-

value) no model was selected.

Exponential (M2) 0.0404 150.51 270 117

Powerc

Lineard

0.00496 154.21 410 233

Polynomial 2°e 0.00496 154.21 410 233

Exponential (M3) N/Ab 179.12 1.8E+05 754

a Modeled variance case presented (BMDS Test 2 p-value = <0.0001, BMDS Test 3 p-value = 0.0545), no model was selected

as a best-fitting model. b No available degrees of freedom to calculate a goodness of fit value. c For the Power model, the power parameter estimate was 1. The models in this row reduced to the Linear model. d The Linear model may appear equivalent to the Polynomial 2° model, however differences exist in digits not displayed in the

table. e The Polynomial 2° model may appear equivalent to the Power model, however differences exist in digits not displayed in the

table. This also applies to the Linear model.

518

Decreased Male and Female Fertility Index 519

A decrease in the male and female fertility index was observed in the F0 generation in the 520

reproductive and developmental study by WIL Laboratories (2001). The doses and response data 521

are presented in Table 2-51 as a percentage and incidence. The incidence represents the number 522

Page 63 of 139

of males that did not sire a litter which is equal to the number of nongravid females. The 523

incidence was used for modeling as a dichotomous endpoint. 524

525

Table 2-51 Fertility Index Data Selected for Dose-Response Modeling for 1-BP 526

Dose (ppm) Number of animals Fertility Index (%) Number Nongravid Females =

Males that did not Sire a Litter

0 25 92 2

100 25 100 0

250 25 88 3

500 23 52 12

750 22 0 25

527

The BMD modeling results for the fertility index are summarized in Table 2-52. The best fitting 528

models were the LogLogistic and Dichotomous-Hill based on Akaike information criterion 529

(AIC; lower values indicates a better fit), chi-square goodness of fit p-value (higher value 530

indicates a better fit) and visual inspection. Dichotomous-Hill model slope parameter was at the 531

boundary value of 18 which indicates some concern for using this model fit and so instead the 532

LogLogistic model selected. The LogLogistic and Dichotomous-Hill models had nearly the same 533

BMDLs with LogLogistic slightly lower (356 ppm) than Dichotomous-Hill (363 ppm). For the 534

best fitting model a plot of the model is shown in Figure 2-19. The model version number, model 535

form, benchmark dose calculation, parameter estimates and estimated values are shown below in 536

Table 2-53. 537

Table 2-52 Summary of BMD Modeling Results for Fertility Index of F0 Rats Following 538

Inhalation Exposure of Parental Rats to 1-BP in a Two-Generation Study 539

Modela Goodness of fit BMD10Pct

(ppm)

BMDL10Pct

(ppm)

Basis for model selection

p-value AIC

LogLogistic 0.388 75.396 448 356 The LogLogistic model was

selected based on the lowest

AIC from this set of models

which have adequate goodness

of fit p-value (excluding

Quantal-Linear, Multistage 20,

Probit and Logistic) and

adequate fit by visual inspection

and the BMDLs are < 2-fold

apart considered sufficiently

close. The Dichotomous-Hill

model had concern for the fit

based on the slope parameter at

the boundary and so instead the

LogLogistic was selected.

Dichotomous-Hill 0.388 75.396 448 363

Multistage 4° 0.355 75.682 306 219

Weibull 0.253 77.024 361 252

Gamma 0.256 77.045 361 260

LogProbit 0.223 77.357 461 352

Multistage 3° 0.161 78.153 250 202

Logistic 0.0103 80.981 238 182

Probit 0.0031 82.358 208 159

Multistage 2° 0.0152 85.979 173 143

Quantal-Linear 0 106.73 68.4 52.1

Page 64 of 139

a Selected model in bold; scaled residuals for selected model for doses 0, 100, 250, 500, and 750 ppm were 0.27, -1.34, 1.07, -

0.01, 0.14, respectively.

540

541 Figure 2-19 Plot of Mean Response by Dose with Fitted Curve for the Selected Model 542

(LogLogistic) for Fertility Index in Rats Exposed to 1-BP Via Inhalation in ppm BMR 10% 543

Extra Risk. 544

545

Table 2-53 BMD Modeling Results for Fertility Index in Rats Exposed to 1-BP Via 546

Inhalation BMR 10% Extra Risk 547

Logistic Model. (Version: 2.14; Date: 2/28/2013)

The form of the probability function is: P[response] = background+(1-background)/[1+EXP(-

intercept-slope*Log(dose))]

Slope parameter is restricted as slope >= 1

Benchmark Dose Computation.

BMR = 10% Extra risk

BMD = 448.13

BMDL at the 95% confidence level = 356.183

0

0.2

0.4

0.6

0.8

1

0 100 200 300 400 500 600 700

Frac

tion

Affe

cted

dose

Log-Logistic Model, with BMR of 10% Extra Risk for the BMD and 0.95 Lower Confidence Limit for the BMDL

17:13 12/03 2015

BMDL BMD

Log-Logistic

Page 65 of 139

Parameter Estimates

Variable Estimate Default Initial

Parameter Values

background 0.0666427 0.08

intercept -1.1209E+02 -2.1668E+01

slope 18 3.62868

Analysis of Deviance Table

Model Log(likelihood) # Param's Deviance Test d.f. p-value

Full model -33.45 5

Fitted model -35.7 2 4.4943 3 0.21

Reduced model -79.79 1 92.6846 4 <.0001

AIC: = 75.3964

Goodness of Fit Table

Dose Est. Prob. Expected Observed Size Scaled Resid

0 0.0666 1.666 2 25 0.27

100 0.0666 1.666 0 25 -1.34

250 0.0666 1.666 3 25 1.07

500 0.4809 12.022 12 25 -0.01

750 0.9992 24.98 25 25 0.14

Chi^2 = 3.02 d.f = 3 p-value = 0.3884

548

Decreased Implantations Sites 549

A decrease in the number of implantations sites was observed in the F0 generation in the 550

reproductive and developmental study by (WIL Research, 2001). The doses and response data 551

used for modeling are presented in Table 2-54. The highest dose group was not included because 552

none of the dams had implantations sites. 553

554

Table 2-54 Implantations Site Data Selected for Dose-Response Modeling for 1-BP 555

Dose (ppm) Number of animals Average Numer of Sites Standard Deviation

0 23 15.3 2.53

100 25 14.3 3.09

250 22 13.8 4.23

500 11 9.0 4.54

556

Page 66 of 139

The BMD modeling results for the number of implantations sites are summarized in Table 2-55. 557

The best fitting models were the Linear and Power based on Akaike information criterion (AIC; 558

lower values indicates a better fit), chi-square goodness of fit p-value (higher value indicates a 559

better fit) and visual inspection. Based on the parameter estimate for the Power model it reduced 560

to the Linear, so the Linear model was selected. For the best fitting model a plot of the model is 561

shown in Figure 2-20. The model version number, model form, benchmark dose calculation, 562

parameter estimates and estimated values are shown below in Table 2-56. 563

Table 2-55 Summary of BMD Modeling Results for Implantations Sites in F0 Rats 564

Following Inhalation Exposure of Parental Rats to 1-BP in a Two-Generation Study 565

Modela Goodness of fit BMD5RD

(ppm)

BMDL5RD

(ppm)

BMD1SD

(ppm)

BMDL1SD

(ppm)

Basis for model

selection p-value AIC

Linear

Powerb

0.936 284.66 80.8 56.1 282 188 Linear and Power

models were selected

based on the lowest AIC

from this set of models

which have adequate p-

values, adequate fit by

visual inspection and

the BMDLs are < 1.5-

fold apart considered

sufficiently close.

Exponential (M2) 0.901 284.74 74.1 48.1 270 166

Exponential (M4) 0.901 284.74 74.1 37.3 270 138

Polynomial 3° 0.741 286.64 85.5 56.2 295 188

Polynomial 2° 0.724 286.66 84.3 56.1 289 188

Hill 0.715 286.67 80.6 55.8 282 195

Exponential (M3) 0.669 286.71 82.3 48.2 278 167

Exponential (M5) N/Ac 288.71 82.3 48.2 278 167

a Modeled variance case presented (BMDS Test 2 p-value = 0.0493), selected model in bold; scaled residuals for selected

model for doses 0, 100, 250, and 500 ppm were -0.17, -0.23, 1, -1, respectively. b For the Power model, the power parameter estimate was 1. The models in this row reduced to the Linear model. c No available degrees of freedom to calculate a goodness of fit value.

566

Page 67 of 139

567 Figure 2-20 Plot of Mean Response by Dose with Fitted Curve for the Selected Model 568

(Linear) for Implantation Sites in Rats Exposed to 1-BP Via Inhalation in ppm BMR 1 569

Standard Deviation. 570

571

Table 2-56 BMD Modeling Results for Implantation Sites in Rats Exposed to 1-BP Via 572

Inhalation in ppm BMR 1 Standard Deviation 573

Polynomial Model. (Version: 2.20; Date: 10/22/2014)

The form of the response function is: Y[dose] = beta_0 + beta_1*dose

A modeled variance is fit

Benchmark Dose Computation.

BMR = 1 Estimated standard deviations from the control mean

BMD = 282.359

BMDL at the 95% confidence level = 188.047

6

8

10

12

14

16

0 100 200 300 400 500

Mea

n R

espo

nse

dose

Linear Model, with BMR of 1 Std. Dev. for the BMD and 0.95 Lower Confidence Limit for the BMDL

19:50 12/03 2015

BMDBMDL

Linear

Page 68 of 139

Parameter Estimates

Variable Estimate Default Initial

Parameter Values

lalpha 12.2915 2.51459

rho -3.77194 0

beta_0 15.393 15.7286

beta_1 -0.00952791 -0.01237

Table of Data and Estimated Values of Interest

Dose N Obs Mean Est Mean Obs Std Dev Est Std Dev Scaled Resid

0 23 15.3 15.4 2.53 2.69 -0.166

100 25 14.3 14.4 3.09 3.03 -0.231

250 22 13.8 13 4.23 3.69 1

500 11 9 10.6 4.54 5.41 -0.999

Likelihoods of Interest

Model Log(likelihood) # Param's AIC

A1 -140.289933 5 290.579865

A2 -136.366566 8 288.733132

A3 -138.26616 6 288.532319

fitted -138.332408 4 284.664816

R -151.740933 2 307.481866

Tests of Interest

Test -2*log(Likelihood Ratio) Test df p-value

Test 1 30.7487 6 <0.0001

Test 2 7.84673 3 0.04929

Test 3 3.79919 2 0.1496

Test 4 0.132497 2 0.9359

574

Page 69 of 139

Decreased Pup Body Weight 575

Decreased pup body weight was observed in the 2-generation reproductive and developmental 576

study by (WIL Research, 2001). Statistically significant decreases in pup body weight were noted 577

for males in the F1 generation at PND 28 and in the F2 generation in both sexes at PNDs 14 and 578

21. Continuous models were used to fit-dose response data for decreased pup body weights. A 579

BMR of 5% RD from control mean was applied in modeling pup body weight changes under the 580

assumption that it represents a minimal biologically significant response. In adults, a 10% 581

decrease in body weight in animals is generally recognized as a biologically significant response 582

associated with identifying a maximum tolerated dose; during development, however, 583

identification of a smaller (5%) decrease in body weight is consistent with the assumptions that 584

development represents a susceptible lifestage and that the developing animal is more adversely 585

affected by a decrease in body weight than the adult. In humans, reduced birth weight is 586

associated with numerous adverse health outcomes, including increased risk of infant mortality 587

as well as heart disease and type II diabetes in adults (Barker, 2007; Reyes and Mañalich, 2005). 588

The selection of a 5% BMR is additionally supported by data from (Kavlock et al., 1995) which 589

found that a BMR of 5% RD for fetal weight reduction was statistically similar to several other 590

BMR measurements as well as to statistically-dervived NOAEL values. For these reasons, a 591

BMR of 5% RD was selected for decreased pup weight. A BMR of 1 standard deviation is also 592

shown for comparison per EPA Benchmark Dose Technical Guidance (U.S. EPA, 2012). The 593

doses, response data and BMD modeling results for decreased pup body weight are presented 594

below at each time point. 595

596

Decreased Body Weight in F1 Male Pups at PND 28 597

The doses and response data from the WIL Laboratories (WIL Research, 2001) study were used 598

for the modeling and are presented in Table 2-57. 599

600

Table 2-57 Pup Body Weight Data in F1 Males at PND 28 for Dose-Response Modeling 601

Concentration (ppm)

0 100 250 500

Number of litters 23 24 21 10

Mean pup wt (g) 88.1 82.8 80.3 76.0

Standard deviation (g) 7.60 7.74 9.04 9.45

602

A comparison of the model fits obtained for pup body weight changes is provided in Table 2-58. 603

The best fitting model was selected based on Akaike information criterion (AIC; lower values 604

indicates a better fit), visual inspection and comparison with the BMD/BMDLs among the data 605

for decreased pup weights at other time points. There is a large spread in BMC/L values among 606

the models and EPA procedures allow for selecting the lowest BMDL is this case (the Hill 607

model) however the Exponential (M2) was selected because it is in line with the results from the 608

pup body weight decreases observed at the other time points in this data set and the Hill model 609

has additional uncertainty of the BMD / BMDL ratio is 4-fold and the BMDL is greater than 4-610

fold lower than the lowest dose. The best-fitting model is indicated in bold. For the best fitting 611

model a plot of the model is shown in Figure 2-21. The model version number, model form, 612

benchmark dose calculation, parameter estimates and estimated values are shown below in Table 613

Page 70 of 139

2-59. Also a plot of the Hill model is shown in Figure 2-22 and the model version number, model 614

form, benchmark dose calculation, parameter estimates and estimated values are shown below in 615

Table 2-59. 616

617

Table 2-58 Summary of BMD Modeling Results for Body Weight of F1 Male Rat Pups on 618

PND 28 Following Inhalation Exposure of Parental Rats to 1-BP in a Two-Generation 619

Study 620

Modela Goodness of fit BMD

1SD

(ppm)

BMDL

1SD

(ppm)

BMD

5RD

(ppm)

BMDL

5RD

(ppm)

Basis for model selection

p-value AIC

Exponential

(M2)

Exponential

(M3)b

0.449 411.46 334.07 228.77 174 123 The Exponential (M2) model was

selected based on the lowest AIC

from this set of models which have

adequate p-values and adequate fit

by visual inspection. The Hill model

has the lowest BMDL and the BMDL

is > 5-fold apart from other model

BMDLs not considered sufficiently

close, however the BMDL is > 4-fold

from the lowest dose and BMD /

BMDL ratio is 4-fold and the

Exponential (M2) model is in line

with the result from pup body weight

decreases observed in this study at

other time points.

Powerc

Polynomial 3°d

Polynomial 2°e

Linear

0.406 411.66 345.22 242.64 183 133

Hill 0.578 412.17 234.74 85.21 92.2 23.2

Exponential

(M4)

Exponential

(M5)f

0.512 412.29 238.92 95.80 101 36.8

a Constant variance case presented (BMDS Test 2 p-value = 0.785), selected model in bold; scaled residuals for selected model

for doses 0, 100, 250, and 500 ppm were 0.77, -0.88, -0.17, 0.44, respectively. b For the Exponential (M3) model, the estimate of d was 1 (boundary). The models in this row reduced to the Exponential (M2)

model. c For the Power model, the power parameter estimate was 1. The models in this row reduced to the Linear model. d For the Polynomial 3° model, the b3 coefficient estimates was 0 (boundary of parameters space). The models in this row

reduced to the Polynomial 2° model. For the Polynomial 3° model, the b3 and b2 coefficient estimates were 0 (boundary of

parameters space). The models in this row reduced to the Linear model. e For the Polynomial 2° model, the b2 coefficient estimate was 0 (boundary of parameters space). The models in this row

reduced to the Linear model. f For the Exponential (M5) model, the estimate of d was 1 (boundary). The models in this row reduced to the Exponential (M4)

model.

621

Page 71 of 139

622 Figure 2-21 Plot of Mean Response by Dose with Fitted Curve for the Selected Model 623

(Exponential (M2)) for Pup Body Weight in Rats Exposed to 1-BP Via Inhalation in ppm 624

BMR 5% Relative Deviation. 625

626

Table 2-59 BMD Modeling Results for Pup Body Weight in Rats Exposed to 1-BP Via 627

Inhalation BMR 5% Relative Deviation 628

Exponential Model. (Version: 1.10; Date: 01/12/2015)

The form of the response function is: Y[dose] = a * exp(sign * b * dose)

A constant variance model is fit

Benchmark Dose Computation.

BMR = 5% Relative deviation

BMD = 173.561

BMDL at the 95% confidence level = 122.612

70

75

80

85

90

0 100 200 300 400 500

Mea

n R

espo

nse

dose

Exponential 2 Model, with BMR of 0.05 Rel. Dev. for the BMD and 0.95 Lower Confidence Limit for the BMDL

16:23 10/27 2015

BMDBMDL

Exponential 2

Page 72 of 139

Parameter Estimates

Variable Estimate Default Initial

Parameter Values

lnalpha 4.19824 4.17769

rho n/a 0

a 86.7871 78.9392

b 0.000295534 0.000288601

c n/a 0

d n/a 1

Table of Data and Estimated Values of Interest

Dose N Obs Mean Est Mean Obs Std Dev Est Std Dev Scaled Resid

0 23 88.1 86.79 7.6 8.16 0.7717

100 24 82.8 84.26 7.74 8.16 -0.8765

250 21 80.3 80.61 9.04 8.16 -0.1719

500 10 76 74.87 9.45 8.16 0.4398

Likelihoods of Interest

Model Log(likelihood) # Param's AIC

A1 -201.9297 5 413.8595

A2 -201.395 8 418.7901

A3 -201.9297 5 413.8595

R -210.4356 2 424.8712

2 -202.7313 3 411.4626

Tests of Interest

Test -2*log(Likelihood

Ratio)

Test df p-value

Test 1 18.08 6 0.006033

Test 2 1.069 3 0.7845

Test 3 1.069 3 0.7845

Test 4 1.603 2 0.4486

629

Page 73 of 139

630 Figure 2-22 Plot of Mean Response by Dose with Fitted Curve for the Hill Model for Pup 631

Body Weight in Rats Exposed to 1-BP Via Inhalation in ppm BMR 5% Relative Deviation. 632

633

Table 2-60 BMD Modeling Results for Pup Body Weight in Rats Exposed to 1-BP Via 634

Inhalation BMR 5% Relative Deviation 635

Hill Model. (Version: 2.17; Date: 01/28/2013)

The form of the response function is: Y[dose] = intercept + v*dose^n/(k^n + dose^n)

A constant variance model is fit

Benchmark Dose Computation.

BMR = 5% Relative deviation

BMD = 92.1819

BMDL at the 95% confidence level = 23.1805

Parameter Estimates

Variable Estimate Default Initial

Parameter Values

alpha 65.474 68.7399

rho n/a 0

intercept 87.9661 88.1

v -17.7059 -12.1

n 1 0.881973

k 278.907 145

70

75

80

85

90

0 100 200 300 400 500

Mea

n R

espo

nse

dose

Hill Model, with BMR of 0.05 Rel. Dev. for the BMD and 0.95 Lower Confidence Limit for the BMDL

16:23 10/27 2015

BMDBMDL

Hill

Page 74 of 139

Table of Data and Estimated Values of Interest

Dose N Obs Mean Est Mean Obs Std Dev Est Std Dev Scaled Resid

0 23 88.1 88 7.6 8.09 0.0793

100 24 82.8 83.3 7.74 8.09 -0.299

250 21 80.3 79.6 9.04 8.09 0.398

500 10 76 76.6 9.45 8.09 -0.235

Likelihoods of Interest

Model Log(likelihood) # Param's AIC

A1 -201.929732 5 413.859464

A2 -201.39503 8 418.790061

A3 -201.929732 5 413.859464

fitted -202.084541 4 412.169082

R -210.435607 2 424.871213

Tests of Interest

Test -

2*log(Likelihood

Ratio)

Test df p-value

Test 1 18.0812 6 0.006033

Test 2 1.0694 3 0.7845

Test 3 1.0694 3 0.7845

Test 4 0.309618 1 0.5779

636 637

Page 75 of 139

Decreased Body Weight in F2 Female Pups at PND 14 638

The doses and response data used for the modeling are presented in Table 2-61. 639

640

Table 2-61 Pup Body Weight Data in F2 Females at PND 14 from Selected for Dose-641

Response Modeling 642

Concentration (ppm)

0 100 250 500

Number of litters 22 17 15 15

Mean pup wt (g) 27.6 26.9 27.3 23.7

Standard deviation (g) 2.29 2.11 3.87 3.70

643

The BMD modeling results for decreased pup weight in F2 females at PND 14 with non-644

homogeneous variance (BMDS test 2 p-value = 0.0218) are summarized in Table 2-62. Although 645

the variances are non-homogeneous and not well modeled for any of the non-homogeneous 646

variance models the means were well-modeled (the highest p-value is 0.904 for the linear model 647

with non-homogeneous variances). 648

649

Table 2-62 Summary of BMD Modeling Results for Body Weight of F2 Female Rat Pups on 650

PND 14 Following Inhalation Exposure of Parental Rats to 1-BP in a Two-Generation 651

Study 652

Modela Goodness of fit BMD5RD

(ppm)

BMDL5RD

(ppm) p-value AIC

Linear 0.904 221.02 228 145

Exponential (M2) 0.893 221.05 224 138

Exponential (M4) 0.893 221.05 224 104

Exponential (M3) 0.715 222.96 244 139

Power 0.708 222.96 245 146

Polynomial 3°b 0.687 222.98 245 145

Polynomial 2°c 0.687 222.98 245 145

Exponential (M5) N/Ad 224.82 228 107

Hill N/Ad 224.82 226 105

Polynomial 4° error error errore errore

a Modeled variance case presented (BMDS Test 2 p-value = 0.0218, BMDS Test 3 p-value = 0.0438), no model was selected as

a best-fitting model. b The Polynomial 3° model may appear equivalent to the Polynomial 2° model, however differences exist in digits not

displayed in the table. c The Polynomial 2° model may appear equivalent to the Polynomial 3° model, however differences exist in digits not

displayed in the table. d No available degrees of freedom to calculate a goodness of fit value. e BMD or BMDL computation failed for this model.

Page 76 of 139

To investigate the effect of the poor modeling of the variances on the BMDL, the models were 653

run using the smallest dose standard deviation (2.29), highest (3.87) and pooled (2.89) for all dose 654

levels and the modeling results are summarized in Table 2-63. 655

Page 77 of 139

Table 2-63 BMD Modeling Results for Body Weight of F2 Female Rat Pups on PND 14 Following Inhalation Exposure of 656

Parental Rats to 1-BP in a Two-Generation Study with Variances Fixed at Smallest, Pooled and Highest Values. 657

Modela Smallest Standard Deviation Pooled Standard Deviation Largest Standard Deviation Ratio

BMDLs

Smallest

to Largest

Std Dev

Goodness of fit BMD5RD

(ppm)

BMDL5RD

(ppm)

Goodness of fit BMD5RD

(ppm)

BMDL5RD

(ppm)

Goodness of fit BMD5RD

(ppm)

BMDL5RD

(ppm) p-value AIC p-value AIC p-value AIC

Polynomial 3° 0.518 186.54 360 274 0.661 218.16 360 183 0.793 258.09 360 145 1.9

Polynomial 2° 0.318 187.51 304 199 0.485 218.78 304 260 0.667 258.44 304 140 1.4

Power 0.331 188.16 465 247 0.441 219.93 465 200 0.564 259.96 460 148 1.7

Exponential

(M3)

0.331 188.16 473 249 0.441 219.93 470 202 0.564 259.96 473 143 1.7

Hill N/Ab 190.16 466 248 N/Ab 221.93 465 200 N/Ab 261.96 442 138 1.8

Exponential

(M5)

N/Ab 190.16 470 249 N/Ab 221.93 470 202 N/Ab 261.96 473 139 1.8

Linear 0.0533 191.08 193 146 0.154 221.07 193 138 0.348 259.74 193 127 1.1

Exponential

(M2)

0.0443 191.45 188 139 0.137 221.31 188 131 0.325 259.88 188 119 1.2

Exponential

(M4)

0.0443 191.45 188 131 0.137 221.31 188 115 0.325 259.88 188 90.2 1.5

a Constant variance case presented (BMDS Test 2 p-value = 1., BMDS Test 3 p-value = 1.), no model was selected as a best-fitting model. b No available degrees of freedom to calculate a goodness of fit value.

658

Page 78 of 139

A comparison across the full suite of BMD models shows the BMDL is sensitive to the 659

adjustment of the variances and for the model that fit the constant variance data best, the 660

Polynomial 3° model the ratio of BMDLs was 1.9. This result suggests that due to the poor 661

variance modeling for the original data it is not reasonable to use BMDS for this endpoint. Instead 662

the NOAEL of 250 ppm was used. 663

664

Decreased Body Weight in F2 Female Pups at PND 21 665

The doses and response data used for the modeling are presented in Table 2-64. 666

667

Table 2-64 Pup Body Weight Data in F2 Females at PND 21 from Selected for Dose-668

Response Modeling 669

Concentration (ppm)

0 100 250 500

Number of litters 22 17 15 15

Mean pup wt (g) 46.6 44.7 45.6 39.7

Standard deviation (g) 4.05 3.80 5.60 6.13

Comparisons of model fits obtained are provided in Table 2-65. The best fitting model 670

(Polynomial 2° with constant variance) was selected based on Akaike information criterion 671

(AIC; lower values indicates a better fit), chi-square goodness of fit p-value (higher value 672

indicates a better fit) and visual inspection. The best-fitting model is indicated in bold. For the 673

best fitting model a plot of the model is shown in Figure 2-23. The model version number, model 674

form, benchmark dose calculation, parameter estimates and estimated values are shown below. 675

676

Table 2-65 Summary of BMD Modeling Results for Body Weight of F2 Females on PND 21 677

Following Inhalation Exposure of Parental Rats to 1-BP in a Two-Generation Study 678

Modela Goodness of fit BMD1SD

(ppm)

BMDL1SD

(ppm)

BMD5RD

(ppm)

BMDL5RD

(ppm)

Basis for model

selection p-value AIC

Polynomial 2° 0.372 291.28 436.24 299.79 303 148 The Polynomial

2° model was

selected based on

the lowest AIC

from this set of

models which

have adequate p-

values, adequate

fit by visual

inspection and

the BMDLs are <

1.5-fold apart

considered

sufficiently close.

Linear 0.176 292.77 386.50 269.95 187 135

Power 0.216 292.83 475.29 314.36 407 155

Exponential (M3) 0.216 292.83 474.45 316.27 406 152

Polynomial 3° 0.213 292.85 449.22 313.20 336 154

Exponential (M2) 0.160 292.97 385.88 261.10 181 127

Exponential (M4) 0.160 292.97 385.88 250.91 181 105

Exponential (M5) N/Ab 294.83 474.45 316.27 406 152

Hill N/Ab 294.83 475.10 314.77 406 150

a Constant variance case presented (BMDS Test 2 p-value = 0.144), selected model in bold; scaled residuals for selected

model for doses 0, 100, 250, and 500 ppm were 0.4, -1.06, 0.8, -0.15, respectively. b No available degrees of freedom to calculate a goodness of fit value.

Page 79 of 139

679 Figure 2-23 Plot of Mean Response by Dose with Fitted Curve for the Selected Model 680

(Polynomial 2°) for Pup Body Weight in Rats Exposed to 1-BP Via Inhalation in ppm BMR 681

= 5% Relative Deviation. 682

683

Table 2-66 BMD Modeling Results for Pup Body Weight in Rats Exposed to 1-BP Via 684

Inhalation BMR = 5% Relative Deviation. 685

Polynomial Model. (Version: 2.20; Date: 10/22/2014)

The form of the response function is: Y[dose] = beta_0 + beta_1*dose + beta_2*dose^2 + …

A constant variance model is fit

Benchmark Dose Computation.

BMR = 5% Relative deviation

BMD = 302.794

BMDL at the 95% confidence level = 148.282

Parameter Estimates

Variable Estimate Default Initial

Parameter Values

alpha 22.9776 23.7017

rho n/a 0

beta_0 46.1877 45.9942

beta_1 0 0

beta_2 -0.0000251884 -0.000029911

36

38

40

42

44

46

48

0 100 200 300 400 500

Mea

n R

espo

nse

dose

Polynomial Model, with BMR of 0.05 Rel. Dev. for the BMD and 0.95 Lower Confidence Limit for the BMDL

13:20 10/29 2015

BMDBMDL

Polynomial

Page 80 of 139

Table of Data and Estimated Values of Interest

Dose N Obs Mean Est Mean Obs Std Dev Est Std Dev Scaled Resid

0 22 46.6 46.2 4.05 4.79 0.403

100 17 44.7 45.9 3.8 4.79 -1.06

250 15 45.6 44.6 5.6 4.79 0.797

500 15 39.7 39.9 6.13 4.79 -0.154

Likelihoods of Interest

Model Log(likelihood) # Param's AIC

A1 -141.651019 5 293.302038

A2 -138.944287 8 293.888574

A3 -141.651019 5 293.302038

fitted -142.640988 3 291.281976

R -150.681267 2 305.362534

Tests of Interest

Test -2*log(Likelihood

Ratio)

Test df p-value

Test 1 23.474 6 0.0006523

Test 2 5.41346 3 0.1439

Test 3 5.41346 3 0.1439

Test 4 1.97994 2 0.3716

686

Decreased Body Weight in F2 Male Pups at PND 14 687

The doses and response data used for the modeling are presented in Table 2-67. 688

Table 2-67 Pup Body Weight Data in F2 Males at PND 14 from Selected for Dose-Response 689

Modeling 690

Concentration (ppm)

0 100 250 500

Number of litters 22 17 15 16

Mean pup wt (g) 29.2 28.1 28.4 24.5

Standard deviation (g) 2.77 2.43 3.65 4.14

691

Comparisons of model fits obtained are provided in Table 2-68. The best fitting model 692

(Polynomial 2° with constant variance) was selected based on Akaike information criterion 693

Page 81 of 139

(AIC; lower values indicates a better fit), chi-square goodness of fit p-value (higher value 694

indicates a better fit) and visual inspection. The best-fitting model is indicated in bold. For the 695

best fitting model a plot of the model is shown in Figure 2-24. The model version number, model 696

form, benchmark dose calculation, parameter estimates and estimated values are shown below in 697

Table 2-69. 698

699

Table 2-68 Summary of BMD Modeling Results for Body Weight of F2 Male Rat Pups on 700

PND 14 Following Inhalation Exposure of Parental Rats to 1-BP in a Two-Generation 701

Study 702

Modela Goodness of fit BMD1SD

(ppm)

BMDL1SD

(ppm)

BMD5RD

(ppm)

BMDL5RD

(ppm)

Basis for model

selection p-value AIC

Polynomial 2° 0.509 238.45 427.44 290.47 288 136 The Polynomial

2° model was

selected based on

the lowest AIC

from this set of

models which

have adequate p-

values, adequate

fit by visual

inspection and

the BMDLs are <

1.5-fold apart

considered

sufficiently close.

Linear 0.236 239.99 367.99 261.73 168 124

Polynomial 3° 0.316 240.11 439.96 300.66 314 140

Power 0.290 240.22 457.39 297.00 358 138

Exponential (M3) 0.289 240.23 456.58 297.67 358 134

Exponential (M2) 0.209 240.23 365.77 251.63 161 115

Exponential (M4) 0.209 240.23 365.77 241.42 161 95.6

Hill N/Ab 242.22 457.31 296.92 358 138

Exponential (M5) N/Ab 242.23 456.58 297.67 358 134

a Constant variance case presented (BMDS Test 2 p-value = 0.116), selected model in bold; scaled residuals for selected

model for doses 0, 100, 250, and 500 ppm were 0.35, -0.89, 0.64, -0.12, respectively. b No available degrees of freedom to calculate a goodness of fit value.

703

704 Figure 2-24 Plot of Mean Response by Dose with Fitted Curve for the Selected Model 705

(Polynomial 2°) for Pup Body Weight in Rats Exposed to 1-BP Via Inhalation in ppm BMR 706

= 5% Relative Deviation. 707

22

23

24

25

26

27

28

29

30

31

0 100 200 300 400 500

Mea

n R

espo

nse

dose

Polynomial Model, with BMR of 0.05 Rel. Dev. for the BMD and 0.95 Lower Confidence Limit for the BMDL

14:31 10/29 2015

BMDBMDL

Polynomial

Page 82 of 139

708

Table 2-69 BMD Modeling Results for Pup Body Weight in Rats Exposed to 1-BP Via 709

Inhalation in ppm BMR = 5% Relative Deviation. 710

Polynomial Model. (Version: 2.20; Date: 10/22/2014)

The form of the response function is: Y[dose] = beta_0 + beta_1*dose + beta_2*dose^2 + …

A constant variance model is fit

Benchmark Dose Computation.

BMR = 5% Relative deviation

BMD = 287.938

BMDL at the 95% confidence level = 135.688

Parameter Estimates

Variable Estimate Default Initial

Parameter Values

alpha 10.1836 10.5942

rho n/a 0

beta_0 28.9615 28.8658

beta_1 0 0

beta_2 -0.000017466 -0.000019675

Table of Data and Estimated Values of Interest

Dose N Obs Mean Est Mean Obs Std Dev Est Std Dev Scaled Resid

0 22 29.2 29 2.77 3.19 0.35

100 17 28.1 28.8 2.43 3.19 -0.887

250 15 28.4 27.9 3.65 3.19 0.643

500 16 24.5 24.6 4.14 3.19 -0.119

Likelihoods of Interest

Model Log(likelihood) # Param's AIC

A1 -115.551371 5 241.102743

A2 -112.600048 8 241.200097

A3 -115.551371 5 241.102743

fitted -116.227119 3 238.454239

R -125.255153 2 254.510306

Page 83 of 139

Tests of Interest

Test -2*log(Likelihood

Ratio)

Test df p-value

Test 1 25.3102 6 0.0002991

Test 2 5.90265 3 0.1164

Test 3 5.90265 3 0.1164

Test 4 1.3515 2 0.5088

711

Decreased Body Weight in F2 Male Pups at PND 21 712

The doses and response data from the WIL Laboratories (2001) study was used for the modeling 713

and are presented in Table 2-70. 714

Table 2-70 Pup Body Weight Data in F2 Males at PND 21 715

Concentration (ppm)

0 100 250 500

Number of litters 22 17 15 16

Mean pup wt (g) 49.5 46.9 47.6 40.8

Standard deviation (g) 5.14 5.03 5.40 6.70

716

Comparisons of model fits obtained are provided in Table 2-71. The best fitting model (Linear 717

with homogeneous variance) was selected based on Akaike information criterion (AIC; lower 718

values indicates a better fit), chi-square goodness of fit p-value (higher value indicates a better 719

fit) and visual inspection. The best-fitting model is indicated in bold. For the best fitting model a 720

plot of the model is shown in Figure 2-25. The model version number, model form, benchmark 721

dose calculation, parameter estimates and estimated values are shown below in Table 2-72. 722

723

Page 84 of 139

Table 2-71 Summary of BMD Modeling Results for Body Weight of F2 Male Rat Pups on 724

PND 21 Following Inhalation Exposure of Parental Rats to 1-BP in a Two-Generation 725

Study 726

Modela Goodness of fit BMD1SD

(ppm)

BMDL1SD

(ppm)

BMD5RD

(ppm)

BMDL5RD

(ppm)

Basis for model

selection p-value AIC

Linear 0.218 315.14 344.43 249.00 155 116 The Linear model

was selected

based on the

lowest AIC from

this set of models

which have

adequate p-

values, adequate

fit by visual

inspection and

the BMDLs are <

1.5-fold apart

considered

sufficiently close.

Exponential (M2) 0.194 315.38 339.42 237.32 147 107

Exponential (M4) 0.194 315.38 339.42 220.01 147 84.8

Polynomial 3° 0.194 315.78 418.75 271.24 273 125

Polynomial 2° 0.153 316.14 404.48 264.17 252 122

Power 0.150 316.17 435.13 263.67 313 122

Exponential (M3) 0.148 316.19 436.20 257.18 318 115

Hill N/Ab 318.17 435.26 262.98 314 121

Exponential (M5) N/Ab 318.19 436.20 257.18 318 115

a Constant variance case presented (BMDS Test 2 p-value = 0.614), selected model in bold; scaled residuals for selected

model for doses 0, 100, 250, and 500 ppm were -0.04, -0.78, 1.44, -0.54, respectively. b No available degrees of freedom to calculate a goodness of fit value.

727

728 Figure 2-25 Plot of Mean Response by Dose with Fitted Curve for the Selected Model 729

(Linear) for Pup Body Weight in Rats Exposed to 1-BP Via Inhalation in ppm BMR = 5% 730

Relative Deviation. 731

732

Table 2-72 BMD Modeling Results for Pup Body Weight in Rats Exposed to 1-BP Via 733

Inhalation in ppm BMR = 5% Relative Deviation 734

Polynomial Model. (Version: 2.20; Date: 10/22/2014)

The form of the response function is: Y[dose] = beta_0 + beta_1*dose

A constant variance model is fit

36

38

40

42

44

46

48

50

52

0 100 200 300 400 500

Mea

n R

espo

nse

dose

Linear Model, with BMR of 0.05 Rel. Dev. for the BMD and 0.95 Lower Confidence Limit for the BMDL

15:03 10/29 2015

BMDBMDL

Linear

Page 85 of 139

Benchmark Dose Computation.

BMR = 5% Relative deviation

BMD = 154.623

BMDL at the 95% confidence level = 116.114

Parameter Estimates

Variable Estimate Default Initial

Parameter Values

alpha 30.4578 30.9275

rho n/a 0

beta_0 49.5516 49.615

beta_1 -0.0160234 -0.0160705

Table of Data and Estimated Values of Interest

Dose N Obs Mean Est Mean Obs Std Dev Est Std Dev Scaled Resid

0 22 49.5 49.6 5.14 5.52 -0.0439

100 17 46.9 47.9 5.03 5.52 -0.784

250 15 47.6 45.5 5.4 5.52 1.44

500 16 40.8 41.5 6.7 5.52 -0.536

Likelihoods of Interest

Model Log(likelihood) # Param's AIC

A1 -153.048201 5 316.096402

A2 -152.146228 8 320.292456

A3 -153.048201 5 316.096402

fitted -154.572024 3 315.144048

R -163.858303 2 331.716606

Tests of Interest

Test -2*log(Likelihood

Ratio)

Test df p-value

Test 1 23.4241 6 0.0006662

Test 2 1.80395 3 0.6141

Test 3 1.80395 3 0.6141

Test 4 3.04765 2 0.2179

735

Page 86 of 139

Decreased Brain Weight 736

Decreased brain weights were observed in the 2-generation reproductive and developmental 737

study by (WIL Research, 2001). Statistically significant decreases in brain weights were noted 738

for both sexes in the F0 generation, F1 generation as adults and in the F2 generation at PND 21. 739

Continuous models were used to fit-dose response data for decreased brain weights. For animals 740

exposed as adults (i.e. F0) a BMR of 5% was used because reduced brain weight is considered a 741

more severe endpoint than other decreased organ weights. For animals exposed during 742

development (i.e. F1 and F2 generations) BMRs of 1% and 5% were calculated. The reduced 743

brain weights were observed in the F1 generation as adults and in F2 generation at PND 21 744

suggesting this may be considered a permanent reduction starting during brain development and 745

therefore an even more severe effect and a BMR of 1% was choosen. In all cases a BMR of 1 746

standard deviation is also shown for comparison per EPA Benchmark Dose Technical Guidance 747

(U.S. EPA, 2012). The BMD and BMDLs for a BMR of 1 standard deviation and BMR of 5% 748

are generally similar. The doses, response data and BMD modeling results for decreased brain 749

weights are presented below at each time point. 750

Decreased Brain Weight in F0 Females 751

The doses and response data from the WIL Laboratories (2001) study was used for the modeling 752

and are presented in Table 2-73. 753

Table 2-73 Brain Weight Data in F0 Females for Dose-Response Modeling 754

Concentration (ppm)

0 100 250 500 750

Number of animals 25 25 25 25 25

Brain wt (g) 1.96 1.92 1.94 1.89 1.86

Standard deviation (g) 0.078 0.094 0.084 0.105 0.072

755

Comparisons of model fits obtained are provided in Table 2-74. The best fitting model (Linear 756

with homogeneous variance) was selected based on Akaike information criterion (AIC; lower 757

values indicates a better fit), chi-square goodness of fit p-value (higher value indicates a better 758

fit) and visual inspection. The best-fitting model is indicated in bold. For the best fitting model a 759

plot of the model is shown in Figure 2-26. The model version number, model form, benchmark 760

dose calculation, parameter estimates and estimated values are shown below in Table 2-75. 761

762

Table 2-74 Summary of BMD Modeling Results for Brain Weight of F0 Females Following 763

Inhalation Exposure to 1-BP 764

Modela Goodness of fit BMD1SD

(ppm)

BMDL1SD

(ppm)

BMD5RD

(ppm)

BMDL5RD

(ppm)

Basis for model

selection p-value AIC

Linear 0.444 -480.77 711 509 802 584 The Linear model

was selected based on

the lowest AIC from

this set of models

which have adequate

p-values, adequate fit

Exponential (M2) 0.441 -480.75 711 504 804 580

Exponential (M4) 0.441 -480.75 711 434 804 543

Polynomial 4°b

Polynomial 3°

0.273 -478.85 717 511 785 586

Page 87 of 139

Polynomial 2° 0.271 -478.84 718 511 792 586 by visual inspection

and the BMDLs are

< 1.2-fold apart

considered

sufficiently close.

Power 0.263 -478.77 715 509 802 584

Exponential (M3) 0.261 -478.76 716 504 804 580

Exponential (M5) 0.101 -476.76 716 504 804 580

Hill 0.100 -476.75 errorc errorc errorc errorc

a Constant variance case presented (BMDS Test 2 p-value = 0.340), selected model in bold; scaled residuals for selected model

for doses 0, 100, 250, 500, and 750 ppm were 0.41, -1.2, 1.01, -0.12, -0.1, respectively. b For the Polynomial 4° model, the b4 coefficient estimate was 0 (boundary of parameters space). The models in this row

reduced to the Polynomial 3° model. c BMD and BMDL computation failed for this model.

765

766 Figure 2-26 Plot of Mean Response by Dose with Fitted Curve for the Selected Model 767

(Linear) for Brain Weight in F0 Female Rats Exposed to 1-BP Via Inhalation in ppm BMR 768

= 1 Standard Deviation. 769

770

Table 2-75 BMD Modeling Results for Brain Weight in F0 Female Rats Exposed to 1-BP 771

Via Inhalation in ppm BMR = 1 Standard Deviation 772

Polynomial Model. (Version: 2.20; Date: 10/22/2014)

The form of the response function is: Y[dose] = beta_0 + beta_1*dose

A constant variance model is fit

Benchmark Dose Computation.

BMR = 1 Estimated standard deviations from the control mean

BMD = 711.056

BMDL at the 95% confidence level = 508.985

Parameter Estimates

Variable Estimate Default Initial

Parameter Values

1.82

1.84

1.86

1.88

1.9

1.92

1.94

1.96

1.98

2

0 100 200 300 400 500 600 700

Mea

n R

espo

nse

dose

Linear Model, with BMR of 1 Std. Dev. for the BMD and 0.95 Lower Confidence Limit for the BMDL

18:44 10/05 2015

BMDBMDL

Linear

Page 88 of 139

alpha 0.00749034 0.007637

rho n/a 0

beta_0 1.95295 1.95295

beta_1 -0.000121716 -0.000121716

Table of Data and Estimated Values of Interest

Dose N Obs Mean Est Mean Obs Std Dev Est Std Dev Scaled Resid

0 25 1.96 1.95 0.08 0.09 0.407

100 25 1.92 1.94 0.09 0.09 -1.2

250 25 1.94 1.92 0.08 0.09 1.01

500 25 1.89 1.89 0.1 0.09 -0.121

750 25 1.86 1.86 0.07 0.09 -0.096

Likelihoods of Interest

Model Log(likelihood) # Param's AIC

A1 244.723276 6 -477.446552

A2 246.984613 10 -473.969225

A3 244.723276 6 -477.446552

fitted 243.383815 3 -480.76763

R 234.782134 2 -465.564268

Tests of Interest

Test -2*log(Likelihood

Ratio)

Test df p-value

Test 1 24.405 8 0.001959

Test 2 4.52267 4 0.3399

Test 3 4.52267 4 0.3399

Test 4 2.67892 3 0.4438

773

Decreased Brain Weight in F0 Males 774

The doses and response data from the WIL Laboratories (2001) study was used for the modeling 775

and are presented in Table 2-76. 776

Page 89 of 139

Table 2-76 Brain Weight Data in F0 Males for Dose-Response Modeling 777

Concentration (ppm)

0 100 250 500 750

Number of animals 25 25 25 25 25

Brain wt (g) 2.19 2.15 2.08 2.1 2.05

Standard deviation (g) 0.091 0.114 0.087 0.177 0.091

778

The BMD modeling results for decreased brain weight in F0 males with non-homogeneous 779

variance (BMDS test 2 p-value = 0.000386) are summarized in Table 2-77. Although the 780

variances are non-homogeneous and not well modeled for any of the non-homogeneous variance 781

models the means were well-modeled (the highest p-value is 0.618 for the Exponential (M4) 782

model with non-homogeneous variances). 783

784

Table 2-77 Summary of BMD Modeling Results for Brain Weight of F0 Males Following 785

Inhalation Exposure to 1-BP 786

Modela Goodness of fit BMD1SD

(ppm)

BMDL1SD

(ppm)

BMD5RD

(ppm)

BMDL5RD

(ppm)

Basis for

model

selection p-value AIC

Exponential (M4) 0.618 -408.61 235 99.2 372 159 No model

selected

based on

poor

modeling of

the

variances

Hill 0.340 -406.66 226 97.3 354 107

Exponential (M5) 0.152 -405.52 110 84.8 115 102

Exponential (M2)

Exponential

(M3)b

0.0868 -405.00 606 401 636 453

Powerc

Polynomial 4°d

Polynomial 2°e

Linearf

0.0804 -404.83 617 413 644 463

Polynomial 3°g 0.0804 -404.83 617 413 644 463

a Modeled variance case presented (BMDS Test 2 p-value = 3.86E-04, BMDS Test 3 p-value = 5.66E-04), no model was selected as a best-fitting model. b For the Exponential (M3) model, the estimate of d was 1 (boundary). The models in this row reduced to the Exponential (M2) model. c For the Power model, the power parameter estimate was 1. The models in this row reduced to the Linear model. d For the Polynomial 4° model, the b4 and b3 coefficient estimates were 0 (boundary of parameters space). The models in this row reduced to

the Polynomial 2° model. For the Polynomial 4° model, the b4, b3, and b2 coefficient estimates were 0 (boundary of parameters space). The

models in this row reduced to the Linear model. e For the Polynomial 2° model, the b2 coefficient estimate was 0 (boundary of parameters space). The models in this row reduced to the Linear

model. f The Linear model may appear equivalent to the Polynomial 3° model, however differences exist in digits not displayed in the table. g The Polynomial 3° model may appear equivalent to the Power model, however differences exist in digits not displayed in the table. This also

applies to the Polynomial 4° model. This also applies to the Polynomial 2° model. This also applies to the Linear model.

787

To investigate the effect of the poor modeling of the variances on the BMDL, the models were 788

run using the smallest dose standard deviation (0.091), highest (0.177) and the pooled (0.0907) for 789

all dose levels using the BMR of 5% RD and the modeling results are summarized in Table 2-78. 790

Page 90 of 139

Table 2-78 BMD Modeling Results for Brain Weight of F0 Male Rats Following Inhalation Exposure to 1-BP in a Two-791

Generation Study with Variances Fixed at Smallest, Pooled and Highest Values. 792

Modela Smallest Standard Deviation Pooled Standard Deviation Largest Standard Deviation Ratio

BMDLs

Smallest

to Largest

Std Dev

Goodness of fit BMD5RD

(ppm)

BMDL5RD

(ppm)

Goodness of fit BMD5RD

(ppm)

BMDL5RD

(ppm)

Goodness of fit BMD5RD

(ppm)

BMDL5RD

(ppm) p-value AIC p-value AIC p-value AIC

Exponential

(M4)

0.0893 -477.73 375 164 0.108 -467.70 375 159 0.553 -303.82 375 78.7 2.1

Hill 0.0423 -476.44 289 106 0.0513 -466.35 289 106 0.315 -302.00 289 70.4 1.5

Exponential

(M5)

0.0398 -476.34 246 104 0.0484 -466.26 246 103 0.309 -301.97 246 82.4 1.3

Exponential

(M2)

0.0238 -475.11 669 515 0.0332 -465.43 669 510 0.503 -304.65 669 420 1.2

Exponential

(M3)

0.0238 -475.11 669 515 0.0332 -465.43 669 510 0.503 -304.65 669 420 1.2

Power 0.0223 -474.96 674 523 0.0312 -465.29 674 518 0.496 -304.62 674 430 1.2

Polynomial 4° 0.0223 -474.96 674 523 0.0312 -465.29 674 518 0.496 -304.62 674 430 1.2

Polynomial 2° 0.0223 -474.96 674 523 0.0312 -465.29 674 518 0.496 -304.62 674 430 1.2

Linear 0.0223 -474.96 674 523 0.0312 -465.29 674 518 0.496 -304.62 674 430 1.2

Polynomial 3° 0.0223 -474.96 674 523 0.0312 -465.29 674 518 0.496 -304.62 674 430 1.2

a Constant variance case presented (BMDS Test 2 p-value = 1., BMDS Test 3 p-value = 1.), no model was selected as a best-fitting model.

793

794

Page 91 of 139

A comparison across the full suite of BMD models shows the BMDL is sensitive to the adjustment 795

of the variances and for the model that fit the constant variance data best, the Exponential (M4) 796

model the ratio of BMDLs was 2.1. This result suggests that due to the poor variance modeling for 797

the original data it is not reasonable to use BMDS for this endpoint. Instead the NOAEL of 100 ppm 798

was used. 799

800

Decreased Brain Weight in F1 Females as Adults 801

The doses and response data used for the modeling are presented in Table 2-79. 802

Table 2-79 Brain Weight Data in F1 Females as Adults from Selected for Dose-Response 803

Modeling 804

Concentration (ppm)

0 100 250 500

Number of animals 25 25 25 25

Brain wt (g) 1.97 1.96 1.92 1.89

Standard deviation (g) 0.076 0.073 0.067 0.102

805

Comparisons of model fits obtained are provided in Table 2-80. The best fitting model 806

(Exponential (M2) with homogeneous variance) was selected based on Akaike information 807

criterion (AIC; lower values indicates a better fit), chi-square goodness of fit p-value (higher value 808

indicates a better fit) and visual inspection. The best-fitting model is indicated in bold. For the best 809

fitting model a plot of the model is shown in Figure 2-27. The model version number, model form, 810

benchmark dose calculation, parameter estimates and estimated values are shown below in Table 811

2-81. 812

813

Table 2-80 Summary of BMD Modeling Results for Brain Weight of F1 Female Rats as 814

Adults Following Inhalation Exposure of Parental Rats to 1-BP in a Two-Generation Study 815

Modela Goodness of fit BMD

1SD

(ppm)

BMDL

1SD

(ppm)

BMD

5RD

(ppm)

BMDL

5RD

(ppm)

BMD

1RD

(ppm)

BMDL

1RD

(ppm)

Basis for model

selection p-value AIC

Exponential

(M2)

Exponential

(M3)b

0.787 -401.21 472 327 590 416 116 81.5 The Exponential

(M2) model was

selected based on

the lowest AIC

from this set of

models which

have adequate p-

values, adequate

fit by visual

inspection and the

BMDLs are < 3-

fold apart

considered

sufficiently close.

Powerc

Polynomial 3°d

Polynomial 2°e

Linear

0.780 -401.19 473 331 589 419 118 83.8

Exponential

(M4)

0.534 -399.30 459 230 619 363 94.7 35.1

Hill N/Af -397.69 482 230 errorg errorg 138 33.1

Exponential

(M5)

N/Af -397.69 463 112 errorg 0 141 37.6

a Constant variance case presented (BMDS Test 2 p-value = 0.144), selected model in bold; scaled residuals for selected model for

doses 0, 100, 250, and 500 ppm were -0.05, 0.39, -0.53, 0.19, respectively.

Page 92 of 139

b For the Exponential (M3) model, the estimate of d was 1 (boundary). The models in this row reduced to the Exponential (M2)

model. c For the Power model, the power parameter estimate was 1. The models in this row reduced to the Linear model. d For the Polynomial 3° model, the b3 coefficient estimates was 0 (boundary of parameters space). The models in this row reduced

to the Polynomial 2° model. For the Polynomial 3° model, the b3 and b2 coefficient estimates were 0 (boundary of parameters

space). The models in this row reduced to the Linear model. e For the Polynomial 2° model, the b2 coefficient estimate was 0 (boundary of parameters space). The models in this row reduced

to the Linear model. f No available degrees of freedom to calculate a goodness of fit value. g BMD or BMDL computation failed for this model.

816

817 Figure 2-27 Plot of Mean Response by Dose with Fitted Curve for the Selected Model 818

(Exponential (M2)) for Brain Weight in F1 Female Rats as Adults Exposed to 1-BP Via 819

Inhalation in ppm BMR = 1% Relative Deviation. 820

821

Table 2-81 BMD Modeling Results for Brain Weight in F1 Female Rats as Adults Exposed to 822

1-BP Via Inhalation BMR = 1% Relative Deviation. 823

Exponential Model. (Version: 1.10; Date: 01/12/2015)

The form of the response function is: Y[dose] = a * exp(sign * b * dose)

A constant variance model is fit

Benchmark Dose Computation.

BMR = 1% Relative deviation

BMD = 115.594

BMDL at the 95% confidence level = 81.5083

1.84

1.86

1.88

1.9

1.92

1.94

1.96

1.98

2

0 100 200 300 400 500

Mea

n R

espo

nse

dose

Exponential 2 Model, with BMR of 0.01 Rel. Dev. for the BMD and 0.95 Lower Confidence Limit for the BMDL

13:46 11/06 2015

BMDBMDL

Exponential 2

Page 93 of 139

Parameter Estimates

Variable Estimate Default Initial

Parameter Values

lnalpha -5.07205 -5.07685

rho n/a 0

a 1.97082 1.89939

b 0.0000869453 0.000086769

c n/a 0

d n/a 1

Table of Data and Estimated Values of Interest

Dose N Obs Mean Est Mean Obs Std Dev Est Std Dev Scaled Resid

0 25 1.97 1.97 0.08 0.08 -0.05174

100 25 1.96 1.95 0.07 0.08 0.3941

250 25 1.92 1.93 0.07 0.08 -0.5332

500 25 1.89 1.89 0.1 0.08 0.1908

Likelihoods of Interest

Model Log(likelihood) # Param's AIC

A1 203.8426 5 -397.6852

A2 206.5452 8 -397.0903

A3 203.8426 5 -397.6852

R 196.2377 2 -388.4753

2 203.6027 3 -401.2054

Tests of Interest

Test -2*log(Likelihood

Ratio)

Test df p-value

Test 1 20.62 6 0.002151

Test 2 5.405 3 0.1444

Test 3 5.405 3 0.1444

Test 4 0.4799 2 0.7867

824

Decreased Brain Weight in F1 Males as Adults 825

The doses and response data used for the modeling are presented in Table 2-82. 826

Page 94 of 139

Table 2-82 Brain Weight Data in F1 Males as Adults from Selected for Dose-Response 827

Modeling 828

Concentration (ppm)

0 100 250 500

Number of animals 24 25 25 24

Brain wt (g) 2.21 2.11 2.12 2.01

Standard deviation (g) 0.092 0.111 0.109 0.079

829

The data were not adequately fit by any of the models, the means goodness of fit p-values were 830

less than 0.05 for all of the models. Comparisons of model fits obtained are provided in Table 2-83. 831

Since no model was selected a plot of the model, BMD and BMDL calculations and other output 832

are not presented. Instead the LOAEL of 100 ppm was used because there was no NOAEL 833

observed in the WIL Laboratories (2001) study. 834

835

Table 2-83 Summary of BMD Modeling Results for Brain Weight of F1 Male Rats as Adults 836

Following Inhalation Exposure of Parental Rats to 1-BP in a Two-Generation Study 837

Modela Goodness of fit BMD1SD

(ppm)

BMDL1SD

(ppm)

BMD5RD

(ppm)

BMDL5RD

(ppm)

BMD1RD

(ppm)

BMDL1RD

(ppm)

Basis for

model

selection p-value AIC

Exponential (M2)

Exponential (M3)b

0.0320 -346.71 282 218 308 245 60.4 47.9 None

selected

based on

poor fit

to the

mean

values

goodness

of fit p-

values <

0.05

Powerc

Polynomial 3°d

Polynomial 2°e

Linear

0.0312 -346.66 288 225 314 252 62.8 50.3

Hill 0.00968 -344.90 237 93.0 265 112 44.2 12.5

Exponential (M4)

Exponential (M5)f

0.00932 -344.84 251 124 279 144 49.4 20.7

a Constant variance case presented (BMDS Test 2 p-value = 0.310, BMDS Test 3 p-value = 0.310), no model was selected as a

best-fitting model. b For the Exponential (M3) model, the estimate of d was 1 (boundary). The models in this row reduced to the Exponential (M2)

model. c For the Power model, the power parameter estimate was 1. The models in this row reduced to the Linear model. d For the Polynomial 3° model, the b3 coefficient estimates was 0 (boundary of parameters space). The models in this row reduced

to the Polynomial 2° model. For the Polynomial 3° model, the b3 and b2 coefficient estimates were 0 (boundary of parameters

space). The models in this row reduced to the Linear model. e For the Polynomial 2° model, the b2 coefficient estimate was 0 (boundary of parameters space). The models in this row reduced

to the Linear model. f For the Exponential (M5) model, the estimate of d was 1 (boundary). The models in this row reduced to the Exponential (M4)

model.

838

Page 95 of 139

Decreased Brain Weight in F2 Females at PND 21 839

The doses and response data used for the modeling are presented in Table 2-84. 840

Table 2-84 Brain Weight Data in F2 Females at PND 21 from Selected for Dose-Response 841

Modeling 842

Concentration (ppm)

0 100 250 500

Number of animals 22 17 15 15

Brain wt (g) 1.3957 1.3903 1.3673 1.3089

Standard deviation (g) 0.06491 0.08882 0.12231 0.1004

843

Comparisons of model fits obtained are provided in Table 2-85. The best fitting model 844

(Exponential (M2) with non-homogeneous variance) was selected based on Akaike information 845

criterion (AIC; lower values indicates a better fit), chi-square goodness of fit p-value (higher value 846

indicates a better fit) and visual inspection. The best-fitting model is indicated in bold. For the best 847

fitting model a plot of the model is shown in Figure 2-28. The model version number, model form, 848

benchmark dose calculation, parameter estimates and estimated values are shown below in Table 849

2-86. 850

851

Table 2-85 Summary of BMD Modeling Results for Brain Weight of F2 Female Rats at PND 852

21 Following Inhalation Exposure of Parental Rats to 1-BP in a Two-Generation Study 853

Modela Goodness of fit BMD

1SD

(ppm)

BMDL

1SD

(ppm)

BMD

5RD

(ppm)

BMDL

5RD

(ppm)

BMD

1RD

(ppm)

BMDL

1RD

(ppm)

Basis for model

selection p-

value

AIC

Exponential (M2)

Exponential

(M3)b

0.634 -257.31 454 260 426 256 83.4 50.1 The Exponential

(M2) model was

selected based on

the lowest AIC

from this set of

models which

have adequate p-

values, adequate

fit by visual

inspection and the

BMDLs are < 4-

fold apart

considered

sufficiently close.

Power 0.621 -257.27 456 266 427 261 85.3 52.1

Polynomial 3°c

Lineard

0.566 -257.27 456 266 427 261 85.3 52.1

Polynomial 2°e 0.566 -257.27 456 266 427 261 85.3 52.1

Exponential (M4) 0.702 -256.08 643 130 1149 170 48.5 12.6

Hill N/Af -254.41 errorg errorg errorg errorg 85.7 6.27

Exponential (M5) N/Af -254.41 errorg 0 errorg 0 81.2 14.9

a Modeled variance case presented (BMDS Test 2 p-value = 0.0643), selected model in bold; scaled residuals for selected model

for doses 0, 100, 250, and 500 ppm were -0.31, 0.32, 0.34, -0.32, respectively. b For the Exponential (M3) model, the estimate of d was 1 (boundary). The models in this row reduced to the Exponential (M2)

model. c For the Polynomial 3° model, the b3 and b2 coefficient estimates were 0 (boundary of parameters space). The models in this row

reduced to the Linear model. d The Linear model may appear equivalent to the Polynomial 2° model, however differences exist in digits not displayed in the

table. e The Polynomial 2° model may appear equivalent to the Polynomial 3° model, however differences exist in digits not displayed in

the table. This also applies to the Linear model. f No available degrees of freedom to calculate a goodness of fit value.

Page 96 of 139

g BMD or BMDL computation failed for this model.

854

855 Figure 2-28 Plot of Mean Response by Dose with Fitted Curve for the Selected Model 856

(Exponential (M2)) for Brain Weight in F2 Female Exposed to 1-BP Via Inhalation in ppm 857

BMR = 1% Relative Deviation. 858

859

Table 2-86 BMD Modeling Results for Brain Weight in F2 Female Exposed to 1-BP Via 860

Inhalation BMR = 1% Relative Deviation. 861

Exponential Model. (Version: 1.10; Date: 01/12/2015)

The form of the response function is: Y[dose] = a * exp(sign * b * dose)

A modeled variance is fit

Benchmark Dose Computation.

BMR = 1% Relative deviation

BMD = 83.4282

BMDL at the 95% confidence level = 50.1098

1.25

1.3

1.35

1.4

1.45

0 100 200 300 400 500

Mea

n R

espo

nse

dose

Exponential 2 Model, with BMR of 0.01 Rel. Dev. for the BMD and 0.95 Lower Confidence Limit for the BMDL

13:15 11/06 2015

BMDBMDL

Exponential 2

Page 97 of 139

Parameter Estimates

Variable Estimate Default Initial

Parameter Values

lnalpha -0.0282712 -1.99881

rho -15.3239 -8.92906

a 1.40066 1.33604

b 0.000120467 0.000129477

c n/a 0

d n/a 1

Table of Data and Estimated Values of Interest

Dose N Obs Mean Est Mean Obs Std Dev Est Std Dev Scaled Resid

0 22 1.4 1.4 0.06 0.07 -0.3121

100 17 1.39 1.38 0.09 0.08 0.3231

250 15 1.37 1.36 0.12 0.09 0.3377

500 15 1.31 1.32 0.1 0.12 -0.3236

Likelihoods of Interest

Model Log(likelihood) # Param's AIC

A1 131.2578 5 -252.5155

A2 134.8828 8 -253.7656

A3 133.1137 6 -254.2275

R 126.819 2 -249.638

2 132.6574 4 -257.3148

Tests of Interest

Test -2*log(Likelihood

Ratio)

Test df p-value

Test 1 16.13 6 0.01309

Test 2 7.25 3 0.06434

Test 3 3.538 2 0.1705

Test 4 0.9127 2 0.6336

862

Page 98 of 139

Decreased Brain Weight in F2 Males at PND 21 863

The doses and response data from the WIL Laboratories (2001) study was used for the modeling 864

are presented in Table 2-87. 865

Table 2-87 Brain Weight Data in F2 Males at PND 21 for Dose-Response Modeling 866

Concentration (ppm)

0 100 250 500

Number of animals 22 17 15 16

Brain wt (g) 1.4728 1.4253 1.4668 1.3629

Standard deviation (g) 0.07836 0.07679 0.05971 0.09581

867

Comparisons of model fits obtained are provided in Table 2-88. The best fitting model (Power with 868

homogeneous variance) was selected based on Akaike information criterion (AIC; lower values 869

indicates a better fit), chi-square goodness of fit p-value (higher value indicates a better fit) and 870

visual inspection. The best-fitting model is indicated in bold. For the best fitting model a plot of the 871

model is shown in Figure 2-29. The model version number, model form, benchmark dose 872

calculation, parameter estimates and estimated values are shown below in Table 2-89. 873

874

Table 2-88 Summary of BMD Modeling Results for Brain Weight of F2 Male Rats as Adults 875

Following Inhalation Exposure of Parental Rats to 1-BP in a Two-Generation Study 876

Modela Goodness of fit BMD

1SD

(ppm)

BMDL

1SD

(ppm)

BMD

5RD

(ppm)

BMDL

5RD

(ppm)

BMD

1RD

(ppm)

BMDL

1RD

(ppm)

Basis for model

selection p-value AIC

Power 0.137 -279.68 495 395 493 374 451 97.6 The Power model

was selected based

adequate goodness of

fit p-value (> 0.1

which excludes all

other models) and

adequate fit by visual

inspection. Also, note

if Polynomial 3°

model p-value was

rounded up to 0.1

and included the

Power model would

be selected based on

lowest AIC for

models with BMDLs

< 1.5-fold apart

considered

sufficiently close

Polynomial

0.0961 -278.97 472 353 459 331 269 67.1

Polynomial

0.0647 -278.18 459 383 440 370 197 166

Exponential

(M3)

0.0463 -277.68 495 396 493 376 450 102

Hill 0.0463 -277.68 495 281 493 errorb 450 errorb

Linear 0.0306 -276.68 430 293 393 274 78.6 54.8

Exponential

(M2)

0.0294 -276.60 431 289 393 269 76.9 52.8

Exponential

(M4)

0.0294 -276.60 431 278 393 250 76.9 36.9

Exponential

(M5)

N/Ac -275.68 495 272 493 376 449 102

a Constant variance case presented (BMDS Test 2 p-value = 0.337), selected model in bold; scaled residuals for selected model for

doses 0, 100, 250, and 500 ppm were 0.99, -1.62, 0.52, 0, respectively. b BMD or BMDL computation failed for this model. c No available degrees of freedom to calculate a goodness of fit value.

877

Page 99 of 139

878 Figure 2-29 Plot of Mean Response by Dose with Fitted Curve for the Selected Model 879

(Power) for Brain Weight in Rats Exposed to 1-BP Via Inhalation in ppm BMR = 1% 880

Relative Deviation. 881

882

Table 2-89 BMD Modeling Results for Brain Weight in Rats Exposed to 1-BP Via Inhalation 883

in ppm BMR = 1% Relative Deviation 884

Power Model. (Version: 2.18; Date: 05/19/2014)

The form of the response function is: Y[dose] = control + slope * dose^power

A constant variance model is fit

Benchmark Dose Computation.

BMR = 1% Relative deviation

BMD = 450.983

BMDL at the 95% confidence level = 97.5507

Parameter Estimates

Variable Estimate Default Initial

Parameter Values

alpha 0.00621258 0.00622577

rho n/a 0

control 1.45618 1.3629

slope -2.44527E-50 0.0048117

power 18 -9999

1.35

1.4

1.45

1.5

0 100 200 300 400 500

Mea

n R

espo

nse

dose

Power Model, with BMR of 0.01 Rel. Dev. for the BMD and 0.95 Lower Confidence Limit for the BMDL

13:32 11/06 2015

BMDBMDL

Power

Page 100 of 139

Table of Data and Estimated Values of Interest

Dose N Obs Mean Est Mean Obs Std Dev Est Std Dev Scaled Resid

0 22 1.47 1.46 0.08 0.08 0.989

100 17 1.43 1.46 0.08 0.08 -1.62

250 15 1.47 1.46 0.06 0.08 0.522

500 16 1.36 1.36 0.1 0.08 -0.00000182

Likelihoods of Interest

Model Log(likelihood) # Param's AIC

A1 144.826466 5 -279.652932

A2 146.516124 8 -277.032248

A3 144.826466 5 -279.652932

fitted 142.841294 3 -279.682588

R 135.116612 2 -266.233223

Tests of Interest

Test -2*log(Likelihood

Ratio)

Test df p-value

Test 1 22.799 6 0.0008667

Test 2 3.37932 3 0.3368

Test 3 3.37932 3 0.3368

Test 4 3.97034 2 0.1374

885

Page 101 of 139

Decreased Hang Time 886

EPA selected decreased time hanging from a suspended bar from the (Honma et al., 2003) study as 887

a relevant endpoint for calculating risks associated with chronic worker scenarios. Since this is a 888

continuous endpoint and in the absence of a basis for selecting a BMR a default selection of 1 889

standard deviation was used in accordance with EPA Benchmark Dose Technical Guidance (U.S. 890

EPA, 2012). The doses and response data used for the modeling are presented in Table 2-90. 891

Table 2-90 Hang Time from a Suspended Bar Data for Dose-Response Modeling for 1-BP 892

Dose (ppm) Number of animals Mean traction time (sec) Standard Deviation

0 5 25.2 15.25

10 5 23.8 7.53

50 5 15.2 5.54

200 5 5.2 3.42

1000 5 4.4 3.65

893

The best fitting model was selected based on Akaike information criterion (AIC; lower value 894

indicates a better fit), chi-square goodness of fit p-value (higher value indicates a better fit), ratio of 895

the BMC:BMCL (lower value indicates less model uncertainty) and visual inspection. 896

Comparisons of model fits obtained are provided in Table 2-91. The best-fitting model 897

(Exponential M4), based on the criteria described above, is indicated in bold. For the best fitting 898

model a plot of the model is shown in Figure 2-30. The model version number, model form, 899

benchmark dose calculation, parameter estimates and estimated values are shown below in Table 900

2-92. 901

902

Table 2-91 Summary of BMD Modeling Results for Hang Time from a Suspended Bar; BMR 903

= 1 std. dev. change from control mean 904

Modela Goodness of fit BMD1SD

(ppm)

BMDL1SD

(ppm)

Basis for model selection

p-value AIC

Exponential (M4) 0.955 122.13 36.9 18.2 The Exponential (M4) model

was selected based on the lowest

AIC from this set of models

which have adequate p-values

(including Exponential M4 and

M5 and excluding Exponential

M2 and M3, Power, Polynomial

and Linear models), adequate

fit by visual inspection and

BMDLs (excluding Hill model)

are the same for Exponential

M4 and M5.

Exponential (M5) 0.766 124.12 37.7 18.2

Hill 0.467 124.57 45.0 errorb

Exponential (M2)c 0.00443 133.13 47.4 20.8

Exponential (M3)d 0.00443 133.13 47.4 20.8

Powere 2.22E-04 139.47 799 525

Polynomial 2°f

Linearg

2.22E-04 139.47 799 525

Polynomial 3° <0.0001 188.00 -9999 errorb

Polynomial 4° N/Ah 192.45 -9999 errorb

a Modeled variance case presented (BMDS Test 2 p-value = 0.00293), selected model in bold; scaled residuals for selected

model for doses 0, 10, 50, 200, and 1000 ppm were -0.34, 0.12, 0.44, -0.07, -0.17, respectively. b BMD or BMDL computation failed for this model.

Page 102 of 139

c The Exponential (M2) model may appear equivalent to the Exponential (M3) model, however differences exist in digits not

displayed in the table. d The Exponential (M3) model may appear equivalent to the Exponential (M2) model, however differences exist in digits not

displayed in the table. e The Power model may appear equivalent to the Polynomial 2° model, however differences exist in digits not displayed in the

table. This also applies to the Linear model. f For the Polynomial 2° model, the b2 coefficient estimate was 0 (boundary of parameters space). The models in this row

reduced to the Linear model. g The Linear model may appear equivalent to the Power model, however differences exist in digits not displayed in the table. h No available degrees of freedom to calculate a goodness of fit value.

905

906 Figure 2-30 Plot of Mean Response by Dose in ppm with Fitted Curve for Exponential (M4) 907

Model with Modeled Variance for Hang Time from a Suspended Bar; BMR = 1 Standard 908

Deviation Change from Control Mean. 909

910

Table 2-92 BMD Modeling Results for Hang Time from a Suspended Bar; BMR = 1 911

Standard Deviation Change from Control Mean 912

Exponential Model. (Version: 1.10; Date: 01/12/2015)

The form of the response function is: Y[dose] = a * [c-(c-1) * exp(-b * dose)]

A modeled variance is fit

Benchmark Dose Computation.

BMR = 1.0000 Estimated standard deviations from control

BMD = 36.9173

BMDL at the 95% confidence level = 18.2429

0

10

20

30

40

0 200 400 600 800 1000

Mea

n R

espo

nse

dose

Exponential 4 Model, with BMR of 1 Std. Dev. for the BMD and 0.95 Lower Confidence Limit for the BMDL

17:15 08/10 2015

BMDBMDL

Exponential 4

Page 103 of 139

Parameter Estimates

Variable Estimate Default Initial

Parameter Values

lnalpha -0.107405 0.415293

rho 1.46448 1.29675

a 26.8244 26.46

b 0.0174245 0.00510395

c 0.172048 0.15837

d n/a 1

Table of Data and Estimated Values of Interest

Dose N Obs Mean Est Mean Obs Std Dev Est Std Dev Scaled Resid

0 5 25.2 26.82 15.25 10.54 -0.3447

10 5 23.8 23.27 7.53 9.5 0.1241

50 5 15.2 13.91 5.54 6.51 0.4434

200 5 5.2 5.3 3.42 3.21 -0.0668

1000 5 4.4 4.62 3.65 2.9 -0.1656

Likelihoods of Interest

Model Log(likelihood) # Param's AIC

A1 -62.64066 6 137.2813

A2 -54.60856 10 129.2171

A3 -56.01777 7 126.0355

R -73.64274 2 151.2855

4 -56.06343 5 122.1269

Tests of Interest

Test -2*log(Likelihood

Ratio)

Test df p-value

Test 1 38.07 8 <0.0001

Test 2 16.06 4 0.002934

Test 3 2.818 3 0.4205

Test 6a 0.09133 2 0.9554

913

Decreased Hind Limb Grip Strength 914

Decreased hind limb grip strength was observed in rats after a 12 week exposure (Ichihara et al., 915

2000a). Continuous models were used to fit the dose response data. A BMR 1 standard deviation 916

Page 104 of 139

was choosen per EPA Benchmark Dose Technical Guidance (U.S. EPA, 2012). The doses and 917

response data used for the modeling are presented in Table 2-93. 918

919

Table 2-93 Hind Limb Grip Strength Data Selected for Dose-Response Modeling for 1-BP 920

Concentration (ppm) Number of animals Hind Limb Grip Strength

mean (mg)

Standard Deviation

0 8 353 69

200 9 275 67

400 9 248 69

800 9 156 74

921 Comparisons of model fits obtained are provided in Table 2-94. Models with homogeneous 922 variance were used because the BMDS Test 2 p-value was 0.992. All of the models had adequate 923 chi-square goodness of fit p-value (higher value indicates a better fit) and adequate visual fits to the 924 data. The BMDLs were sufficiently close ranging 99.8 – 214, the scaled residuals near the BMD 925 were smaller for the Exponential and Hill models. The best fitting model was selected based on the 926 Akaike information criterion (AIC; lower values indicates a better fit) and the selected model is the 927 Exponential (M2) indicated in bold in Table 2-94. For the best fitting model a plot of the model is 928 shown in Figure 2-31. The model version number, model form, benchmark dose calculation, 929 parameter estimates and values are shown below in Table 2-95. 930

931

Table 2-94 Summary of BMD Modeling Results for Hind Limb Grip Strength in Rats 932

Exposed to 1-BP by Inhalation 933

Modela Goodness of fit Scaled Residual

for Dose Nnear

BMD

BMD1SD

(ppm)

BMDL1SD

(ppm)

Basis for model

selection p-value AIC

Exponential (M2)

Exponential (M3)b

0.723 334.62 -0.546 215 147 All of the models had

adequate goodness of

fit p-values and visual

fits. The BMDLs are

sufficiently close, the

scaled residuals near

the BMD are lowest for

Exponential and Hill

models. The best fitting

model Exponential

(M2) was selected

based on lowest AIC

Exponential (M4) 0.723 334.62 -0.546 215 113

Powerc

Lineard

0.603 334.98 -0.793 286 214

Polynomial 3°e

Polynomial 2°

0.603 334.98 -0.793 286 214

Hill 0.431 336.59 -0.559 218 99.8

Exponential (M5) 0.420 336.62 -0.546 215 113

a Constant variance case presented (BMDS Test 2 p-value = 0.992), selected model in bold; scaled residuals for

selected model for doses 0, 200, 400, and 800 ppm were 0.16, -0.55, 0.54, -0.16, respectively. b For the Exponential (M3) model, the estimate of d was 1 (boundary). The models in this row reduced to the

Exponential (M2) model. c For the Power model, the power parameter estimate was 1. The models in this row reduced to the Linear model. d The Linear model (and Power model see footnote c) may appear equivalent to the Polynomial 3° and Polynomial

2° models, however differences exist in digits not displayed in the table. e For the Polynomial 3° model, the b3 coefficient estimates was 0 (boundary of parameters space) and this model

reduced to the Polynomial 2° model.

Page 105 of 139

934 Figure 2-31 Plot of Mean Response by Dose in ppm with Fitted Curve for Exponential (M2) 935

Model with Constant Variance for Hind Limb Grip Strength in Rats Exposed to 1-BP by 936

Inhalation; BMR = 1 Standard Deviation Change from Control Mean. 937

938

Table 2-95 BMD Modeling Results for Hind Limb Grip Strength in Rats Exposed to 1-BP by 939

Inhalation; BMR = 1 Standard Deviation Change from Control Mean. 940

Exponential Model. (Version: 1.10; Date: 01/12/2015)

The form of the response function is: Y[dose] = a * exp(sign * b * dose)

A constant variance model is fit

Benchmark Dose Computation.

BMR = 1.0000 Estimated standard deviations from control

BMD = 214.987

BMDL at the 95% confidence level = 146.958

Parameter Estimates

Variable Estimate Default Initial

Parameter Values

lnalpha 8.38915 8.37058

rho n/a 0

a 349.203 171.433

b 0.000979778 0.000992498

c n/a 0

d n/a 1

100

150

200

250

300

350

400

0 100 200 300 400 500 600 700 800

Mea

n R

espo

nse

dose

Exponential 2 Model, with BMR of 1 Std. Dev. for the BMD and 0.95 Lower Confidence Limit for the BMDL

13:52 07/06 2020

BMDBMDL

Exponential 2

Page 106 of 139

Table of Data and Estimated Values of Interest

Dose N Obs Mean Est Mean Obs Std Dev Est Std Dev Scaled Resid

0 8 353 349.2 69 66.33 0.1619

200 9 275 287.1 67 66.33 -0.5456

400 9 248 236 69 66.33 0.5437

800 9 156 159.5 74 66.33 -0.1568

Likelihoods of Interest

Model Log(likelihood) # Param's AIC

A1 -163.9852 5 337.9703

A2 -163.9344 8 343.8689

A3 -163.9852 5 337.9703

R -177.1245 2 358.2489

2 -164.3102 3 334.6204

Tests of Interest

Test -

2*log(Likelihood

Ratio)

Test df p-value

Test 1 26.38 6 0.0001891

Test 2 0.1015 3 0.9917

Test 3 0.1015 3 0.9917

Test 4 0.6501 2 0.7225

941

942

943

Page 107 of 139

3 Benchmark Dose Modeling of Tumors 944

EPA selected 1-BP-induced tumors observed in mice and rats in the chronic inhalation bioassay by 945

NTP (2011) for BMD modeling with EPA’s BMDS. The three tumor sites were selected for 946

modeling were alveolar/bronchiolar adenomas and carcinomas (i.e. lung tumors) in female mice, 947

adenomas of the large intestine in female rats, and keratoacanthoma and squamous cell carcinomas 948

of the skin in male rats. None of the tumor sites occurred in the same strain and sex therefore 949

combined tumor modeling was not conducted. Three approaches were applied to model individual 950

tumor sites; multistage modeling, frequentist model-averaging and Bayesian model averaging. 951

All of the models in the BMDS suite of dichotomous models were applied the gamma, logistic, log-952

logistic, multistage, probit, log-probit, quantal-linear and Weibull models. BMRs of 10% and 0.1% 953

(1 in 1,000) both added nad extra risk were modeled and the 95% lower confidence limit was 954

calculated. Models were determined to be adequate or not in a manner consistent with EPA 955

Benchmark Dose Technical Guidance (U.S. EPA, 2012). Briefly the AIC, goodness of fit p-values 956

(0.1 or greater) and a visual assessment of fit are important criteria. 957

In agreement with U.S. EPA’s long-standing approach all three tumor types from the NTP study 958

(NTP, 2011) were dose-response modeled with multistage models using the typical constrained 959

model coefficients ≥0 (EPA, 2012). Under U.S. EPA’s 2005 cancer guidelines (U.S. EPA 2005), 960

quantitative risk estimates from cancer bioassay data were calculated by modeling the data in the 961

observed range to estimate a BMCL for a BMR of 10% extra risk, which is generally near the low 962

end of the observable range for standard cancer bioassay data. Also the results for a BMR of 0.1% 963

added risk are presented for comparison. 964

965

In addition to the multistage modeling model averaging methods were applied, frequentist 966

(Wheeler and Bailer, 2007) and Bayesian (USEPA 2018 BMDS software) to assess the impact of 967

model uncertainty. A model-averaging (MA) technique (Wheeler and Bailer, 2007) was applied 968

using the multistage, log-probit and Weibull models based on the observation that those 3 models 969

performed better in bias and coverage than other combinations of models (Wheeler and Bailer, 970

2007). The model averaging applied statistics (bootstrapping technique) to weigh, based on fit, the 971

models providing acceptable fit to the experimental dataset (as evidenced by a chi-square 972

goodness-of-fit value > 0.10). Model-averaging software was restricted to avoid supralinear 973

models, which exhibit properties at the low dose that are not considered biologically plausible. The 974

resulting model-average benchmark concentrations (MA BMCs) associated with 0.1% added risk 975

and their 95% lower confidence limits (MA BMCLs) are shown the Frequentist Model-Average 976

(BMDS 2.6) row for each of the three cancer datasets. 977

978

Since the 2016 Draft Risk Assessment (U.S. EPA, 2016), the EPA has conducted additional 979

modeling, using the BMDS (Version 3.0) and more details are available in the supplemental file. 980

All dichotomous frequentist and Bayesian1 models in the BMD software (BMDS Version 3.0), 981

were fit to the incidence data for each of the three tumor types. The benchmark response (BMR) 982

levels used were 0.1% and 10% added and extra risk. The BMR used in the 2016 Draft Risk 983

Assessment (U.S. EPA, 2016) was 0.1% added risk. The BMR of 10% extra risk which is 984

generally near the low end of the observable range for standard cancer bioassay data was used. The 985

1 The Bayesian dichotomous models used in BMDS 3.0 are identical to the frequentist parametric models but incorporate prior

information (e.g., parameter distributions) that is used in the model fit (see the BMDS 3.0 User Guide for details;

https://www.epa.gov/bmds/benchmark-dose-software-bmds-version-30-user-guide-readme ).

Page 108 of 139

Bayesian models and Bayesian model averaging solve issues associated with strict frequentist 986

parameter bounds by replacing them with “soft bounds” defined by mildly informative prior 987

density for the individual parameters of the models included in the analysis. Thus, in the cases 988

where there are limited data, the shapes of the models are limited to dose-response shapes that are 989

frequently seen in practice. In addition, because parameters are restricted through their prior 990

density, the U.S. EPA BMDS 3.0 Bayesian model averaging approach allows for consideration of a 991

large suite of models across many different study designs without typical model “degeneracy” or 992

“overparameterization” concerns of previous model averaging approaches (BMDS 3.0 User 993

Guide). The resulting model-average benchmark concentrations (MA BMCs) associated with 0.1% 994

added risk (AR) and 10% extra risk (ER) and their 95% lower confidence limits (BMCLs) are 995

shown in the Bayesian Model-Average (BMDS 3.0) row for each of the three cancer datasets. 996

3.1 Lung Tumors in Female Mice 997

The doses and response data from the NTP (2011) study that were used for the modeling are 998

presented in Table 3-1. 999

Table 3-1 Incidence of Lung Tumors in Female Mice 1000

Dose (ppm) Number of animals Number of Animals

with Tumors

0 50 1

62.5 50 9

125 50 8

250 50 14

1001

Comparisons of model fits obtained from BMD modeling of the NTP (2011) study are provided in 1002

Table 3-2. A summary of all the dichotomous models and all three modeling approachs are shown 1003

for comparison with the BMDS results in Table 3-2. Detailed output of the multistage, frequestist 1004

model average and Bayesian model average results are also shown below. 1005

Page 109 of 139

Table 3-2 Summary of BMDS 3.0 modeling results for lung tumors in female mice exposed to 1-BP by inhalation for 2 years (NTP, 2011); 1006 BMRs = 10% and 0.1% extra and added risk, doses are in ppm 1007

Frequentist Model Restriction**

*

10% Extra Risk 10% Added Risk 0.1% Extra Risk 0.1% Added Risk P Value AIC

BMDS Recommendation

Notes BMD BMDL BMD BMDL BMD BMDL BMD BMDL

Dichotomous Hill Restricted 37.97524 CF 39.13867 CF 0.262433 CF 0.267937 CF 0.2913697 167.35319 Lower limit includes zero

Gamma Restricted 78.59758 54.06762 81.47433 54.97972 0.74636 0.513424 0.772227 0.521665 0.2183691 166.9715428

Log-Logistic Restricted 69.93796 46.26665 72.25183 46.99549 0.630072 0.416817 0.64879 0.422752 0.2824931 166.5219996 Lowest AIC

Log-Probit Restricted 135.5751 91.5552 142.1972 93.75467 22.21672 15.00317 22.7714 15.19065 0.0392364 170.9591691 Goodness of fit p-value < 0.1

Goodness of fit p-value < 0.05

Multistage Degree 3 Restricted 78.59758 54.05654 81.47433 54.96919 0.74636 0.513402 0.772228 0.521634 0.2183691 166.9715428 Converges to Degree 1

Multistage Degree 2 Restricted 78.59758 54.05354 81.47433 54.96921 0.74636 0.513407 0.772228 0.521634 0.2183691 166.9715428 Converges to Degree 1

Multistage Degree 1 (Quantal Linear)**

Restricted 78.59758 54.06143 81.47433 54.96919 0.74636 0.5134 0.772228 0.521634 0.2183691 166.9715428 All Multistage models converged to Degree 1

Weibull Restricted 65.43007 41.33211 66.06867 41.67007 4.083719 0.997165 4.121506 1.005019 3.896E-08 197.0272423 Goodness of fit p-value < 0.1

Goodness of fit p-value < 0.05

Dichotomous Hill Unrestricted 28.47259 CF 29.82262 CF 0.00191 CF 0.001991 CF CF 169.1046753 Lower limit includes zero

Logistic Unrestricted 136.7186 107.335 144.6373 113.6071 1.996488 1.492227 2.156856 1.643332 0.0888649 169.5064951 Goodness of fit p-value < 0.1

Log-Probit Unrestricted 29.35781 CF 30.64006 CF 0.038238 CF 0.039098 CF 0.3429581 167.1324257 Lower limit includes zero

Probit Unrestricted 129.2628 100.3938 136.6598 105.8843 1.801609 1.349556 1.937322 1.474752 0.0955787 169.2319294 Goodness of fit p-value < 0.1

Frequentist Model Average (multistage,

log-probit and

Weibull)

Restricted -- -- -- -- -- -- 0.849 0.634 0.1298 NA

Bayesian Model

BMA model

Posterior

Probabilities

Unnormalized

Log Posterior

Probabilities

Dichotomous Hill Priors 64.34544 14.5245 67.31868 15.29848 0.752301 0.006834 0.779298 0.007215 0.166806 -87.09741015 NB

Gamma Priors 98.64837 50.08382 104.1892 52.11979 1.716614 0.088742 1.80595 0.093472 0.056914 -88.17269343 NB

Logistic Priors 150.9715 111.2937 162.4684 118.824 2.063819 1.503801 2.27159 1.670964 0.195845 -86.93691547 NB

Log-Logistic Priors 73.78165 29.87163 77.34186 31.35776 0.751037 0.008745 0.783528 0.009254 0.079815 -87.8345243 NB

Log-Probit Priors 97.84488 45.04163 102.5082 46.68855 8.25872 0.636263 8.460435 0.652272 0.012133 -89.71830101 NB

Multistage Degree 3 Priors 78.73632 57.42297 81.69198 58.98483 0.839515 0.572085 0.873569 0.587588 NA -96.25255595 NB

Multistage Degree 2 Priors 74.67602 54.67322 77.5899 56.14487 0.773638 0.538379 0.804686 0.552757 0.000911 -92.30719837 NB

Multistage Degree 1 Priors 70.96872 51.75386 74.00783 53.1925 0.673917 0.491566 0.701235 0.50454 NA -87.07030802 NB

Probit Priors 136.3017 102.8982 145.3018 109.0151 1.838917 1.363377 1.995304 1.496475 0.199328 -86.91928526 NB

Quantal Linear Priors 82.46298 56.36126 86.78205 58.07897 0.783066 0.535205 0.82187 0.550684 0.240282 -86.73242779 NB

Weibull Priors 95.40995 43.42538 100.647 45.41124 1.445756 0.034791 1.520816 0.036836 0.047966 -88.3437562 NB

Page 110 of 139

Bayesian Model

Average (BMA) results

Priors 104.6183 39.4122 111.1076 41.12461 1.412281 0.080929 1.511725 0.084815 Probabilities

Sum to 1 NA NB

**Best Multistage; scaled residuals for doses 0, 62.5, 125, and 250 were -0.529882976, 1.548678296, -0.413499804, and -0.439288554, respectively. 1008 ***Restrictions and parameter priors defined in the BMDS 3.0 User Guide; CF = Computation failed; NA = Not available in BMDS 3.0; NA = Not Applicable 1009

Page 111 of 139

Summary of Multistage Model 1010

Selected Frequentist Multistage - Multistage 1 Restricted; Extra Risk, 1011

BMR = 0.001 and 0.1, doses are in ppm 1012

Table 3-3 Lung Tumors in Female Mice, Selected Frequentist Multistage - Multistage 1 1013

Restricted; Extra Risk, BMR = 0.001 and 0.1 User Input 1014

Info

Model frequentist Multistage

degree 1 v1.0

Dataset

Name

1-BP - Lung Tumors - F

Mice

User notes

NTP (2011) Lung Tumors

in Female Mice from 1-

BP

Options

Risk Type Extra Risk

BMR 0.001 and 0.1

Confidence

Level 0.95

Background Estimated

Model Data

Dependent

Variable PPM

Independent

Variable [Tumor Incidence]

Total # of

Observation 4

1015 Table 3-4 Lung Tumors in Female Mice, Selected Frequentist Multistage - Multistage 1 1016

Restricted; Extra Risk, BMR = 0.001 and 0.1 Model Results 1017

BMR 0.001

Benchmark Dose

BMD 0.746360281

BMDL 0.513400221

BMDU 1.377878074

BMR 0.1

Benchmark Dose

BMD 78.59757869

BMDL 54.06142797

BMDU 145.0923735

AIC 166.9715428

P-value 0.218369111

D.O.F. 2

Chi2 3.043136955

Model Parameters

# of Parameters 3

Variable Estimate Std Error

Background 0.033480124 0

Beta1 0.001340506 0

Beta2 0 0

Page 112 of 139

Goodness of Fit

Dose Estimated

Probability Expected Observed Size

Scaled

Residual

0 0.033480124 1.674006202 1 50 -0.529883

62.5 0.111157329 5.557866469 9 50 1.5486783

125 0.182591778 9.129588912 8 50 -0.4135

250 0.308698954 15.43494771 14 50 -0.439289

Analysis of Deviance

Model Log Likelihood # of Parameters Deviance Test d.f. P Value

Full Model -80.10278985 0 - - -

Fitted Model -81.4857714 2 2.7659631 2 0.2508296

Reduced Model -87.93397588 1 15.6623721 3 0.0013298

1018

Page 113 of 139

1019

Figure 3-1 Plot of Results for Lung Tumors in Female Mice Frequentist Multistage Degree 1 1020

Model with BMR of 10% Extra Risk for the BMD and 0.95 Lower Confidence Limit for the 1021

BMDL 1022

1023

0

0.05

0.1

0.15

0.2

0.25

0.3

0 50 100 150 200 250

RES

PO

NSE

DOSE

Frequentist Multistage Degree 1 Model with BMR of 10%

Extra Risk for the BMD and 0.95 Lower Confidence Limit

for the BMDL

Estimated Probability

Response at BMD

Linear Extrapolation

BMD

BMDL

Data

Page 114 of 139

Selected Frequentist Multistage - Multistage 1 Restricted; Added Risk, 1024

BMR = 0.001 and 0.1, doses are in ppm 1025

1026

Table 3-5 Lung Tumors in Female Mice, Selected Frequentist Multistage - Multistage 1 1027

Restricted; Added Risk, BMR = 0.001 and 0.1 User Input 1028

Info

Model frequentist Multistage

degree 1 v1.0

Dataset

Name

1-BP - Lung Tumors - F

Mice

User notes

NTP (2011) Lung Tumors

in Female Mice from 1-

BP

Options

Risk Type Added Risk

BMR 0.001 and 0.1

Confidence

Level 0.95

Background Estimated

Model Data

Dependent

Variable PPM

Independent

Variable [Tumor Incidence]

Total # of

Observation 4

1029 Table 3-6 Lung Tumors in Female Mice, Selected Frequentist Multistage - Multistage 1 1030

Restricted; Added Risk, BMR = 0.001 and 0.1 Model Results 1031

BMR 0.001

Benchmark Dose

BMD 0.772227533

BMDL 0.521640376

BMDU 1.495515393

BMR 0.1

Benchmark Dose

BMD 81.47432888

BMDL 54.97974829

BMDU 158.2503904

AIC 166.9715428

P-value 0.218369111

D.O.F. 2

Chi2 3.043136955

Model Parameters

# of Parameters 3

Variable Estimate Std Error

Background 0.033480124 0

Beta1 0.001340506 0

Beta2 0 0

Page 115 of 139

Goodness of Fit

Dose Estimated

Probability Expected Observed Size

Scaled

Residual

0 0.033480124 1.674006202 1 50 -0.529883

62.5 0.111157329 5.557866469 9 50 1.5486783

125 0.182591778 9.129588912 8 50 -0.4135

250 0.308698954 15.43494771 14 50 -0.439289

Analysis of Deviance

Model Log Likelihood # of Parameters Deviance Test d.f. P Value

Full Model -80.10278985 0 - - -

Fitted Model -81.4857714 2 2.7659631 2 0.2508296

Reduced Model -87.93397588 1 15.6623721 3 0.0013298

1032

1033

Page 116 of 139

1034

Summary of Frequentist Model Averaging 1035

1036

Table 3-7 Lung Tumors in Female Mice, Summary of Frequentist Model Averaging 1037

Model Averaging Fit Statistics Model Weight -2log(L) AIC BIC

Multistage, 3° 0.245 162.97 170.97 184.16

Weibull 0.665 162.97 168.97 178.87

Log-Probit 0.091 166.96 172.96 182.85

Average-Model Benchmark Dose Estimate:

Nominally Specified Confidence Level:0.950

Weighting Criterion: AIC

BMD Calculation: Added Risk

BMR: 0.001000

BMD: 0.849148762733

BMDL(BCa):0.400888479370

BMDL(Percentile):0.634308392327

Acceleration: 0.043517

Bootstrap Resamples: 5000

Random Seed: 102210

Average-Model Goodness of Fit Test

Test Statistic: 3.274559

Bootstrap p-value: 0.129800

Parameter Estimates

Model Parameter Estimate Standard Error

Multistage, 3° gamma 0.03348013 0.02882729

beta(1) 0.001340506 0.0003669969

beta(2) 0 N/A

beta(3) 0 N/A

Weibull gamma 0.033480 0.028840

alpha 1.0 N/A

beta 0.001341 0.000367

Log-Probit gamma 0.079419089201 0.034577

alpha -6.191081 0.272037

beta 1.0 N/A

1038

Page 117 of 139

1039

Summary of Bayesian Model Averaging 1040

Bayesian Model Averaging – Extra Risk, BMR = 0.001 and 0.1, doses 1041

are in ppm 1042

Table 3-8 Lung Tumors in Female Mice, Bayesian Model Averaging – Extra Risk, BMR = 1043

0.001 and 0.1 User Inputs 1044

Info

Model

Bayesian Model

Averaging v1.0

Dataset

Name

1-BP - Lung Tumors - F

Mice

User notes

NTP (2011) Lung Tumors

in Female Mice from 1-

BP

Model

Options

Risk Type Extra Risk

BMR 0.001 and 0.1

Confidence

Level 0.95

Background Estimated

Model Data

Dependent

Variable PPM

Independent

Variable [Incidence]

Total # of

Observation 4

1045 Table 3-9 Lung Tumors in Female Mice, Bayesian Model Averaging – Extra Risk, BMR = 1046

0.001 and 0.1 Model Results 1047

BMR 0.001

Benchmark Dose

BMD 1.412280907

BMDL 0.08092889

BMDU 6.929373369

BMR 0.1

Benchmark Dose

BMD 104.618334

BMDL 39.41220045

BMDU 220.1845944

MA - Individual Models BMR 0.001 BMR 0.1

Model Posterior

Probability BMD BMDL BMDU BMD BMDL BMDU

Dichotomous

Hill 0.166805588 0.752300664 0.00683358 11.23398263 64.34543431 14.5244971 165.5205

Gamma 0.056914248 1.716613537 0.088741617 15.75845852

98.64837676 50.0838161 206.6454

Logistic 0.195845027 2.06381944 1.503801206 3.924900666

150.9715021 111.293748 313.7542

Log-Logistic 0.07981527 0.751036569 0.008744945 12.44686637

73.78164679 29.8716258 150.8161

Log-Probit 0.012133111 8.258719929 0.636263227 106.3076332 97.84487635 45.0416319 232.3484

Multistage 0.000911231 0.773638254 0.538378954 1.237213961

74.67601448 54.976739 100.7804

Probit 0.199328433 1.838917378 1.363377436 2.949863905 136.3016963 102.89821 237.678

Quantal

Linear 0.240281547 0.783066032 0.535204832 1.367988414 82.46298134 56.3612543 144.0599

Weibull 0.047965545 1.445755828 0.034791225 21.79520577 95.40994465 43.4253775 190.5838

Page 118 of 139

Bayesian Model Averaging – Added Risk, BMR = 0.001 and 0.1, doses 1048

are in ppm 1049

Table 3-10 Lung Tumors in Female Mice, Bayesian Model Averaging – Added Risk, BMR = 1050

0.001 and 0.1 User Inputs 1051

Info

Model

Bayesian Model

Averaging v1.0

Dataset

Name

1-BP - Lung Tumors - F

Mice

User notes

NTP (2011) Lung Tumors

in Female Mice from 1-

BP

Model

Options

Risk Type Added Risk

BMR 0.001 and 0.1

Confidence

Level 0.95

Background Estimated

Model Data

Dependent

Variable PPM

Independent

Variable [Incidence]

Total # of

Observation 4

1052 Table 3-11 Lung Tumors in Female Mice, Bayesian Model Averaging – Added Risk, BMR = 1053

0.001 and 0.1 Model Results 1054

BMR 0.001

Benchmark Dose

BMD 1.511725049

BMDL 0.084814979

BMDU 7.349459454

BMR 0.1

Benchmark Dose

BMD 111.1076087

BMDL 41.12460837

BMDU 242.2282994

MA - Individual Models BMR 0.001 BMR 0.001

Model Posterior

Probability BMD BMDL BMDU BMD BMDL BMDU

Dichotomous

Hill 0.166805588 0.779298134 0.00721453 11.78462 67.3186779 15.2984811 179.9472

Gamma 0.056914248 1.805950073 0.09347239 16.61692 104.1891947 52.1197878 225.3164

Logistic 0.195845027 2.271589823 1.67096395 4.486674 162.4683738 118.824027 351.2111

Log-Logistic 0.07981527 0.783527736 0.00925409 13.02672 77.34185457 31.3577577 160.9768

Log-Probit 0.012133111 8.460435085 0.6522715 107.9432 102.5081798 46.6885529 244.554

Multistage 0.000911231 0.804685755 0.55281934 1.312665 77.5898993 56.0719296 106.9866

Probit 0.199328433 1.995303668 1.49647507 3.303659 145.3018337 109.015137 262.5193

Quantal

Linear 0.240281547 0.821870286 0.55068434 1.494455 86.78204566 58.078967 158.1819

Weibull 0.047965545 1.52081612 0.036836 22.85683 100.6470174 45.4112366 204.8545

1055

Page 119 of 139

3.2 Large Intestine Adenomas in Female Rats 1056

The doses and response data from the NTP (2011) study that were used for the modeling are 1057

presented in Table 3-12. 1058

Table 3-12 Incidence of Large Intestine Adenomas in Female Rats 1059

Dose (ppm) Number of animals Number of Animals

with Tumors

0 50 0

125 50 1

250 50 2

500 50 5

1060

Comparisons of model fits obtained from BMD modeling of the NTP (2011) study are provided in 1061

Table 3-13. A summary of all the dichotomous models and all three modeling approaches are 1062

shown for comparison with the the BMDS results in Table 3-13. Detailed output of the multistage, 1063

frequestist model average and Bayesian model average results are also shown below. 1064

Page 120 of 139

Table 3-13 Summary of BMDS 3.0 modeling results for large intestine adenomas in female rats exposed to 1-BP by inhalation for 2 years 1065 (NTP, 2011); BMRs = 10% and 0.1% extra and added risk, doses are in ppm 1066

Frequentist Model Restriction*

*

10% Extra Risk 10% Added Risk 0.1% Extra Risk 0.1% Added Risk P Value AIC BMDS Recommendation Notes

BMD BMDL BMD BMDL BMD BMDL BMD BMDL

Dichotomous Hill Restricted 507.1886 233.2808 507.1886 CF 12.49015 2.02E-05 12.49015 0.000691 0.8834656 65.12821578 BMD10 higher than max dose

Gamma Restricted 507.0328 328.131 507.0328 328.1311 12.23436 3.132948 12.23436 3.132948 0.9899304 63.12698036 BMD10 higher than max dose

Log-Logistic Restricted 507.1886 326.4527 507.1886 326.4527 12.49014 2.967884 12.49015 2.967884 0.989315 63.12821578 BMD10 higher than max dose

Log-Probit Restricted 477.1922 330.2017 478.8704 330.202 78.19758 54.11022 78.34071 54.11038 0.6315053 64.24003983

Multistage Degree 3 Restricted 500.7362 330.5708 CF CF 6.557897 3.138036 6.557897 3.138036 0.9988974 63.10882433 BMD10 higher than max dose

Multistage Degree 2 Restricted 502.9252 330.2656 CF CF 7.437661 3.136283 7.437661 3.136283 0.9958358 63.11496834 BMD10 higher than max dose

Multistage Degree 1

(Quantal Linear)* Restricted 555.3227 326.7021 555.3227 326.7336 5.273328 3.102597 5.273328 3.102597 0.9885628 61.23428391

BMD10 higher than max dose

Lowest AIC

Weibull Restricted 301.4129 228.7688 301.7364 284.8074 105.7531 45.34816 105.8608 45.36294 2.024E-14 126.9988592 Goodness of fit p-value < 0.1

Goodness of fit p-value < 0.05

Dichotomous Hill Unrestricted 507.1886 326.4527 507.1886 326.4527 12.49015 CF 12.49015 CF 0.989315 63.12821578 BMD10 higher than max dose

Logistic Unrestricted 502.6164 401.8342 504.1957 403.3183 21.75435 11.15261 21.92247 11.40486 0.7220677 64.14445439 BMD10 higher than max dose

Log-Probit Unrestricted 513.5019 319.158 513.5019 319.158 22.53697 3.05E-10 22.53697 3.05E-10 0.9787434 63.15005452 BMD10 higher than max dose

Probit Unrestricted 498.6988 387.1642 500.1934 388.3664 20.22219 10.09325 20.35123 10.29972 0.7579644 63.98223935

Frequentist Model

Average Restricted -- -- -- -- -- -- 13.5 5.005 0.824 NA

Average of: multistage, log-probit

and Weibull

Bayesian Model

BMA model

Posterior

Probabilities

Unnormalized

Log Posterior

Probability

Dichotomous Hill Priors 580.7885 363.9277 586.8591 366.3746 32.1626 1.943651 32.44390 1.970037 0.220739 -34.83201879 NB

Gamma Priors 574.6022 370.815 581.0418 373.6548 36.78534 7.612838 37.14127 7.691739 0.039040 -36.56441487 NB

Logistic Priors 748.2903 435.647 758.8572 439.4368 17.09404 9.77774 17.53697 10.10689 0.209018 -34.88658014 NB

Log-Logistic Priors 443.7372 317.9377 447.3434 320.2013 34.7643 3.044037 35.01854 3.079371 0.009846 -37.941941 NB

Log-Probit Priors 496.108 365.0003 500.2088 367.391 138.4617 37.032 139.0559 37.23307 0.019907

-37.23793011 NB

Multistage Degree 3 Priors 281.6332 214.8912 283.5637 216.3168 3.58622 2.361475 3.617773 2.380263 NA -55.95416186 NB

Multistage Degree 2 Priors 292.2843 214.7176 294.6334 216.4783 3.394427 2.261514 3.425026 2.27977 3.7871E-08 -50.41033757 NB

Multistage Degree 1 Priors 326.0742 223.1094 329.3273 224.9746 3.096391 2.118664 3.125683 2.135989 NA -43.07798951 NB

Probit Priors 560.3876 401.1173 563.8816 403.0099 16.40803 9.430684 16.60386 9.66788 0.488955 -34.03672885 NB

Quantal Linear Priors 518.8844 308.1564 525.4594 311.1072 4.92731 2.926244 4.986506 2.952824 0.003797 -38.89483963 NB

Weibull Priors 482.3999 345.5124 486.5647 347.9023 36.57184 4.415083 36.87119 4.466438 0.008698 -38.06592312 NB

Bayesian Model Average (BMA) results

Priors 601.4568 392.3594 607.1436 394.7824 23.56684 7.783059 23.84832 7.975868 Probabilities

Sum to 1 NA NB

Page 121 of 139

*Best overall and Multistage; scaled residuals for doses 0, 125, 250 and 500 were -0.000872639, -0.160645981, -0.212777056, and 0.234051055, respectively. 1067 **Restrictions and parameter priors are defined in the BMDS 3.0 User Guide; CF = Computation failed; NA = Not available in BMDS 3.0; NA = Not Applicable 1068

Page 122 of 139

Summary of Multistage Model 1069

Selected Frequentist Multistage - Multistage 1 Restricted; Extra Risk, 1070

BMR = 0.001 and 0.1, doses are in ppm 1071

Table 3-14 Large Intestine Adenomas in Female Rats, Selected Frequentist Multistage - 1072

Multistage 1 Restricted; Extra Risk, BMR = 0.001 and 0.1 User Input 1073

Info

Model

frequentist Multistage degree 1

v1.0

Dataset

Name

1-BP Large Intestine Adenomas

- F Rats

User notes

NTP (2011) Large Intestine

Adenomas in Female Rats from

1-BP

Model

Options

Risk Type Extra Risk

BMR 0.001 and 0.1

Confidence

Level 0.95

Background Estimated

Model Data

Dependent

Variable PPM

Independent Variable [Incidence]

Total # of

Observation 4

1074

Table 3-15 Large Intestine Adenomas in Female Rats, Selected Frequentist Multistage - 1075

Multistage 1 Restricted; Extra Risk, BMR = 0.001 and 0.1 Model Results 1076

BMR 0.001

Benchmark Dose

BMD 5.273328163

BMDL 3.102597277

BMDU 10.04488819

BMR 0.1

Benchmark Dose

BMD 555.3227114

BMDL 326.7020652

BMDU 1058.027014

AIC 61.23428391

P-value 0.988562772

D.O.F. 3

Chi2 0.125861864

Model Parameters

# of Parameters 3

Variable Estimate Std Error

Background 0 0

Beta1 0.000189728 0

Beta2 0 0

Page 123 of 139

Goodness of Fit

Dose Estimated

Probability Expected Observed Size

Scaled

Residual

0 1.523E-08 7.61499E-07 0 50 -0.000873

125 0.023437055 1.171852759 1 50 -0.160646

250 0.0463248 2.316240014 2 50 -0.212777

500 0.0905036 4.525179979 5 50 0.2340511

Analysis of Deviance

Model Log Likelihood # of Parameters Deviance Test d.f. P Value

Full Model -29.55331182 0 - - -

Fitted Model -29.61714195 1 0.12766026 3 0.988323

Reduced Model -33.58882955 1 8.07103545 3 0.0445662

1077

Page 124 of 139

1078

Figure 3-2 Plot of Results for Large Intestine Adenomas in Female Rats Frequentist 1079

Multistage Degree 1 Model with BMR of 10% Extra Risk for the BMD and 0.95 Lower 1080

Confidence Limit for the BMDL 1081

1082

0

0.02

0.04

0.06

0.08

0.1

0.12

0.14

0.16

0.18

0.2

0 100 200 300 400 500

RES

PO

NSE

DOSE

Frequentist Multistage Degree 1 Model with BMR of 10%

Extra Risk for the BMD and 0.95 Lower Confidence Limit

for the BMDL

BMD

BMDL

Estimated Probability

Response at BMD

Linear Extrapolation

Data

Page 125 of 139

Selected Frequentist Multistage - Multistage 1 Restricted; Added Risk, 1083

BMR = 0.001 and 0.1, doses are in ppm 1084

Table 3-16 Large Intestine Adenomas in Female Rats, Selected Frequentist Multistage - 1085

Multistage 1 Restricted; Added Risk, BMR = 0.001 and 0.1 User Input 1086

Info

Model

frequentist Multistage degree 1

v1.0

Dataset

Name

1-BP Large Intestine Adenomas

- F Rats

User notes

NTP (2011) Large Intestine

Adenomas in Female Rats from

1-BP

Model

Options

Risk Type Added Risk

BMR 0.001 and 0.1

Confidence

Level 0.95

Background Estimated

Model Data

Dependent

Variable PPM

Independent

Variable [Incidence]

Total # of

Observation 4

1087 Table 3-17 Large Intestine Adenomas in Female Rats, Selected Frequentist Multistage - 1088

Multistage 1 Restricted; Added Risk, BMR = 0.001 and 0.1 Model Results 1089

BMR 0.001

Benchmark Dose

BMD 5.273328163

BMDL 3.102597277

BMDU 11.28247793

BMR 0.1

Benchmark Dose

BMD 555.322731

BMDL 326.7335971

BMDU 1188.88287

AIC 61.23428391

P-value 0.988562772

D.O.F. 3

Chi2 0.125861864

Model Parameters

# of Parameters 3

Variable Estimate Std Error

Background 0 0

Beta1 0.000189728 0

Beta2 0 0

Page 126 of 139

Goodness of Fit

Dose Estimated

Probability Expected Observed Size

Scaled

Residual

0 1.523E-08 7.61499E-07 0 50 -0.000873

125 0.023437055 1.171852759 1 50 -0.160646

250 0.0463248 2.316240014 2 50 -0.212777

500 0.0905036 4.525179979 5 50 0.2340511

Analysis of Deviance

Model Log Likelihood # of Parameters Deviance Test d.f. P Value

Full Model -29.55331182 0 - - -

Fitted Model -29.61714195 1 0.12766026 3 0.988323

Reduced Model -33.58882955 1 8.07103545 3 0.0445662

1090

Summary of Frequentist Model Averaging 1091

1092

Table 3-18 Large Intestine Adenomas in Female Rats, Summary of Frequentist Model 1093

Averaging 1094

Model Averaging Fit Statistics Model Weight -2log(L) AIC BIC

Multistage, 3° 0.191 59.11 67.11 80.30

Weibull 0.514 59.13 65.13 75.02

Log-Probit 0.295 60.24 66.24 76.13

Average-Model Benchmark Dose Estimate:

Nominally Specified Confidence Level:0.950

Weighting Criterion: AIC

BMD Calculation: Added Risk

BMR: 0.001000

BMD: 13.472617282689

BMDL(BCa): 2.445277845095

BMDL(Percentile): 5.005030327500

Acceleration: -0.149668

Bootstrap Resamples: 5000

Random Seed: 331201 Average-Model Goodness of Fit Test

Test Statistic: 0.139777

Bootstrap p-value: 0.824400

Page 127 of 139

Parameter Estimates Model Parameter Estimate Standard Error

Multistage, 3° gamma 0.0 N/A

beta(1) 0.0001525544 0.00006655318

beta(2) 0 N/A

beta(3) 2.307482E-10 N/A

Weibull gamma 0.0 N/A

alpha 1.238098 0.739784

beta 0.000047 0.000206

Log-Probit gamma 0.006136953057 0.011787

alpha -7.449471 0.263198

beta 1.0 N/A

1095

Summary of Bayesian Model Averaging 1096

Bayesian Model Averaging – Extra Risk, BMR = 0.001 and 0.1, doses 1097

are in ppm 1098

1099

Table 3-19 Large Intestine Adenomas in Female Rats, Bayesian Model Averaging – Extra 1100

Risk, BMR = 0.001 and 0.1 User Inputs 1101

Info

Model Bayesian Model Averaging v1.0

Dataset

Name

1-BP Large Intestine Adenomas

- F Rats

User notes

NTP (2011) Large Intestine

Adenomas in Female Rats from

1-BP

Model

Options

Risk Type Extra Risk

BMR 0.001 and 0.1

Confidence

Level 0.95

Background Estimated

Model Data

Dependent

Variable PPM

Independent

Variable [Incidence]

Total # of

Observation 4

1102 Table 3-20 Large Intestine Adenomas in Female Rats, Bayesian Model Averaging – Extra 1103

Risk, BMR = 0.001 and 0.1 Model Results 1104

BMR 0.001

Benchmark Dose

BMD 23.5668422

BMDL 7.783059031

BMDU 103.7795544

BMR 0.1

Benchmark Dose

BMD 601.4567771

BMDL 392.359376

BMDU 1236.80985

Page 128 of 139

MA - Individual Models BMR 0.001 BMR 0.1

Model Posterior

Probability BMD BMDL BMDU BMD BMDL BMDU

Dichotomous

Hill 0.220739084 32.16260672 1.943651238 140.386492 580.7885528 363.927722 -9999*

Gamma 0.039039943 36.78534552 7.61283841 119.1831902 574.6021867 370.8150089 1205.82664

Logistic 0.20901793 17.09404029 9.777739644 85.90026945 748.2903004 435.6470108 -9999*

Log-Logistic 0.00984594 34.76430476 3.044036916 128.055945 443.7371492 317.9377317 710.2971673

Log-Probit 0.019906973 138.4616643 37.03200072 298.4407544 496.1079955 365.0002778 766.8138146

Multistage 3.78705E-08 3.394427244 2.261513844 5.397694651 292.2843099 215.5684978 386.8899941

Probit 0.488955424 16.40802808 9.430683218 39.76662457 560.3876114 401.1173546 -9999*

Quantal

Linear 0.003796807 4.927310627 2.926244168 9.784449823 518.8843608 308.1564009 1030.379176

Weibull 0.00869786 36.57183424 4.415083211 123.5612407 482.3999405 345.5123901 809.5982075

* these model outputs -9999 indicate a BMDU was not identified

1105

Bayesian Model Averaging – Added Risk, BMR = 0.001 and 0.1, doses 1106

are in ppm 1107

1108

Table 3-21 Large Intestine Adenomas in Female Rats, Bayesian Model Averaging – Added 1109

Risk, BMR = 0.001 and 0.1 User Inputs 1110

Info

Model Bayesian Model Averaging v1.0

Dataset

Name

1-BP Large Intestine Adenomas

- F Rats

User notes

NTP (2011) Large Intestine

Adenomas in Female Rats from

1-BP

Model

Options

Risk Type Added Risk

BMR 0.001 and 0.1

Confidence

Level 0.95

Background Estimated

Model Data

Dependent

Variable PPM

Independent Variable [Incidence]

Total # of

Observation 4

1111 Table 3-22 Large Intestine Adenomas in Female Rats, Bayesian Model Averaging – Added 1112

Risk, BMR = 0.001 and 0.1 Model Results 1113

BMR 0.001

Benchmark Dose

BMD 23.84832328

BMDL 7.975867949

BMDU 95.10070086

BMR 0.1

Benchmark Dose

BMD 607.1436084

BMDL 394.782424

BMDU 1228.752732

Page 129 of 139

MA - Individual Models BMR 0.001 BMR 0.1

Model Posterior

Probability BMD BMDL BMDU BMD BMDL BMDU

Dichotomous

Hill 0.220739084 32.44390339 1.97003712 141.4284 586.859107 366.374612 -9999*

Gamma 0.039039943 37.14127466 7.69173913 120.7405 581.0417533 373.654813 -9999*

Logistic 0.20901793 17.53697172 10.1068914 57.47345 758.8571906 439.436793 -9999*

Log-Logistic 0.00984594 35.01853719 3.07937129 128.7793 447.3433793 320.201248 721.1831

Log-Probit 0.019906973 139.0558928 37.2330733 299.1879 500.2087951 367.39105 778.8816

Multistage 3.78705E-08 3.425025847 2.27973261 5.453989 294.6333885 216.422349 405.7088

Probit 0.488955424 16.60385728 9.6678799 39.83995 563.8816357 403.009892 1407.68

Quantal

Linear 0.003796807 4.986505955 2.95282365 9.981385 525.4594088 311.107248 1052.267

Weibull 0.00869786 36.87119484 4.46643773 124.3649 486.5646958 347.902298 822.9395

* these model outputs -9999 indicate a BMDU was not identified

1114

3.3 Keratoacanthoma and Squamous Cell Carcinomas in Male Rats 1115

The doses and response data from the NTP (2011) study that were used for the modeling are 1116

presented in Table 3-23. 1117

Table 3-23 Incidence of Keratoacanthoma and Squamous Cell Carcinomas in Male Rats 1118

Dose (ppm) Number of animals Number of

Animals with

Tumors

0 50 1

125 50 4

250 50 6

500 50 8

1119

Comparisons of model fits obtained from BMD modeling of the NTP (2011) study are provided in 1120

Table 3-24. A summary of all the dichotomous models and all three modeling approaches are 1121

shown for comparison with the the BMDS results in Table 3-24. Detailed output of the multistage, 1122

frequestist model average and Bayesian model average results are also shown below. 1123

Page 130 of 139

Table 3-24 Summary of BMDS 3.0 modeling results for keratoacanthoma & squamous cell carcinomas in male rats exposed to 1124

1-BP by inhalation for 2 years (NTP, 2011); BMRs = 10% and 0.1% extra and added risk, doses are in ppm 1125

Frequentist Model Restriction

***

10% Extra Risk 10% Added Risk 0.1% Extra Risk 0.1% Added Risk P Value AIC BMDS Recommendation Notes

BMD BMDL BMD BMDL BMD BMDL BMD BMDL

Dichotomous Hill Restricted 241.9508 CF 250.0001 CF 3.236715 CF 3.290924 CF CF 126.3403356 BMD Lower limit includes zero

Gamma Restricted 303.843 185.275 312.2107 187.7474 2.885284 1.759366 2.960561 1.781668 0.8021847 122.7789055

Log-Logistic Restricted 294.0892 173.3592 302.2094 175.6876 2.649453 1.561794 2.715178 1.580743 0.8427402 122.6810603 Lowest AIC

Log-Probit Restricted 399.4465 261.7774 411.4748 265.8007 65.45737 42.89751 66.4724 43.24036 0.312975 124.8422642

Multistage Degree 3 Restricted 303.843 185.2034 312.2107 187.6895 2.885284 1.759338 2.960561 1.781575 0.8021847 122.7789055 Converges to Degree 1

Multistage Degree 2 Restricted 303.843 185.206 312.2107 187.6879 2.885284 1.759315 2.960561 1.781575 0.8021847 122.7789055 Converges to Degree 1

Multistage Degree 1** Restricted 303.843 185.2037 312.2107 187.6903 2.885284 1.759336 2.960561 1.781575 0.8021847 122.7789055 All Multistage models converged

to Multistage Degree 1

Weibull Restricted 210.3339 150.19 211.7953 150.9278 35.05038 12.46708 35.28128 12.52632 5.148E-12 173.1717353 Goodness of fit p-value < 0.1

Goodness of fit p-value < 0.05

Dichotomous Hill Unrestricted 241.9507 CF 250 CF 3.236742 CF 3.290951 CF CF 126.3403356 BMD Lower limit includes zero

Logistic Unrestricted 408.5802 301.9481 420.7805 310.1677 7.203864 4.997068 7.542471 5.311385 0.4706516 123.9898837

Log-Probit Unrestricted 258.4618 CF 267.409 CF 1.230169 CF 1.252142 CF 0.9131073 124.3521934 BMD Lower limit includes zero

Probit Unrestricted 394.6247 285.4619 406.5746 292.8437 6.509137 4.502717 6.797135 4.762942 0.5034012 123.8228047

Frequentist Model Average

Restricted -- -- -- -- -- -- 3.73 2.26 0.7077 NA Average of: multistage, log-probit

and Weibull

Bayesian Model

BMA model

Posterior

Probabilities

Unnormalized

Log Posterior

Probability

Dichotomous Hill Priors 355.5078 147.56 369.5556 152.9072 8.094685 0.153672 8.357178 0.160579 0.203424 -64.32163349 NB

Gamma Priors 389.7621 222.3436 404.6563 228.1034 15.30021 1.588847 15.82102 1.643549 0.054140 -65.64536621 NB

Logistic Priors 528.4769 325.7855 553.3675 337.3084 8.149692 5.110528 8.702688 5.475214 0.321293 -63.86457516 NB

Log-Logistic Priors 300.2942 168.0456 309.8314 172.937 8.166761 0.220277 8.399582 0.229138 0.029647 -66.24756569 NB

Log-Probit Priors 407.5987 226.62 420.3065 232.0305 82.22845 9.177505 83.54719 9.343584 0.019221 -66.6809488 NB

Multistage Degree 3 Priors 216.2644 160.9627 220.8948 163.8834 2.47565 1.663083 2.537335 1.695316 NA -79.02131211 NB

Multistage Degree 2 Priors 213.6458 156.4551 218.7139 159.4762 2.319659 1.581474 2.378462 1.612377 1.1126E-05 -74.13536451 NB

Multistage Degree 1 Priors 218.2195 153.9162 224.3367 157.1083 2.072206 1.461724 2.127236 1.490495 NA -67.77973593 NB

Probit Priors 434.7017 297.0376 450.8228 305.801 6.767236 4.568947 7.121577 4.849836 0.302901 -63.92352293 NB

Quantal Linear Priors 295.3006 185.6616 306.2603 190.0876 2.804166 1.763037 2.902711 1.802915 0.045837 -65.81184537 NB

Weibull Priors 352.5042 206.0483 364.4752 211.6823 12.68129 0.624409 13.08899 0.649286 0.023527 -66.47877309 NB

Bayesian Model

Average (BMA) results Priors 433.4563 220.5825 451.3116 227.1573 9.392749 1.425164 9.805706 1.473828

Probabilities

Sum to 1 NA NB

Page 131 of 139

**Best Multistage; scaled residuals for doses 0, 125, 250 and 500 were -0.243246539, 0.375234935, 0.313277121, and -0.37778312, respectively. 1126 ***Restrictions and parameter priors are defined in the BMDS 3.0 User Guide; CF = Computation failed; NA = Not available in BMDS 3.0; NA = Not Applicable 1127
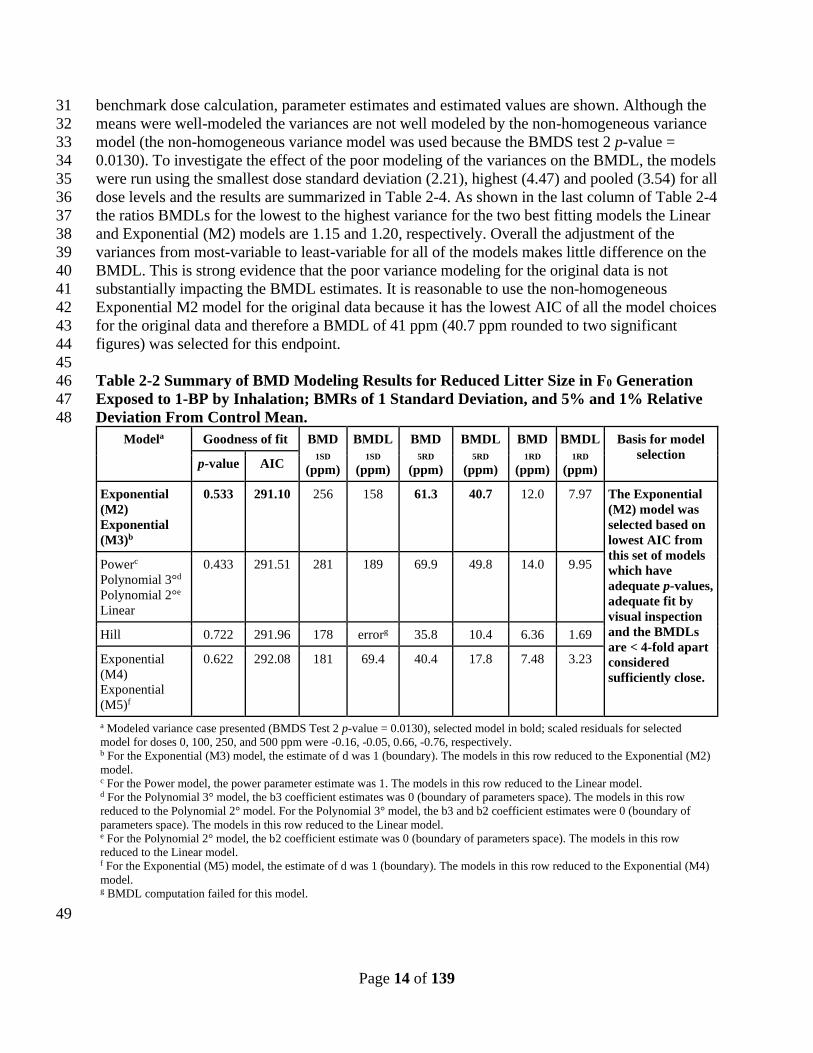
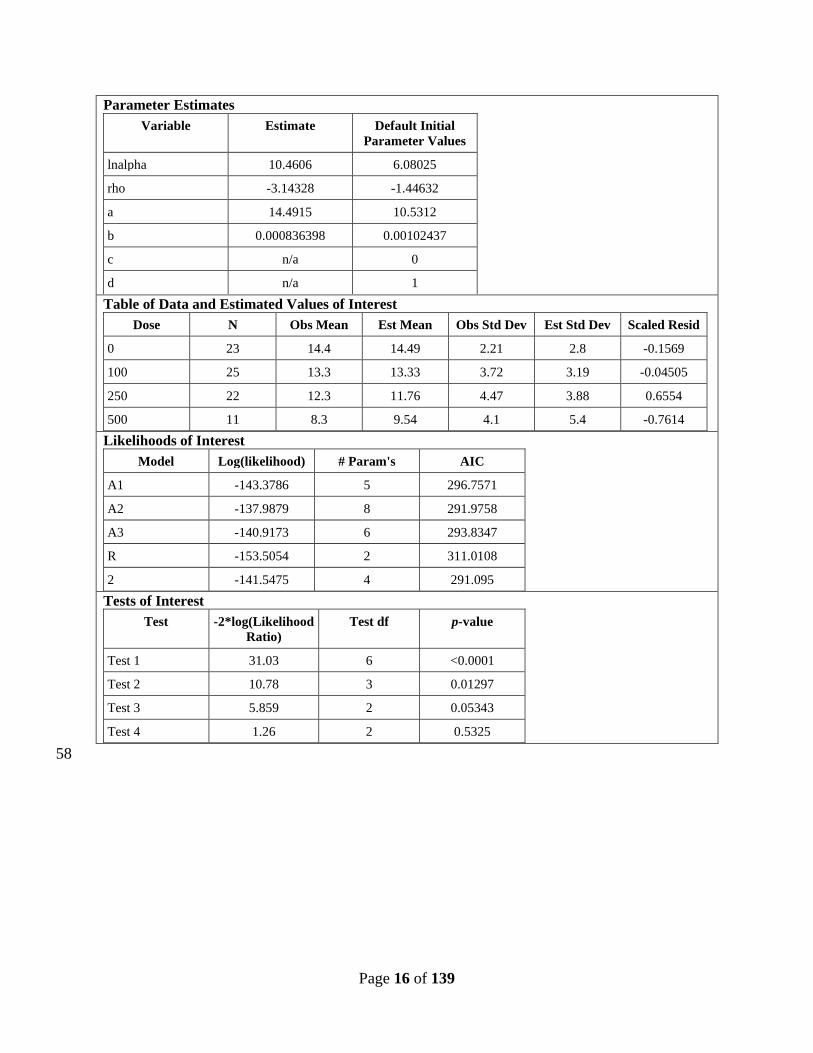
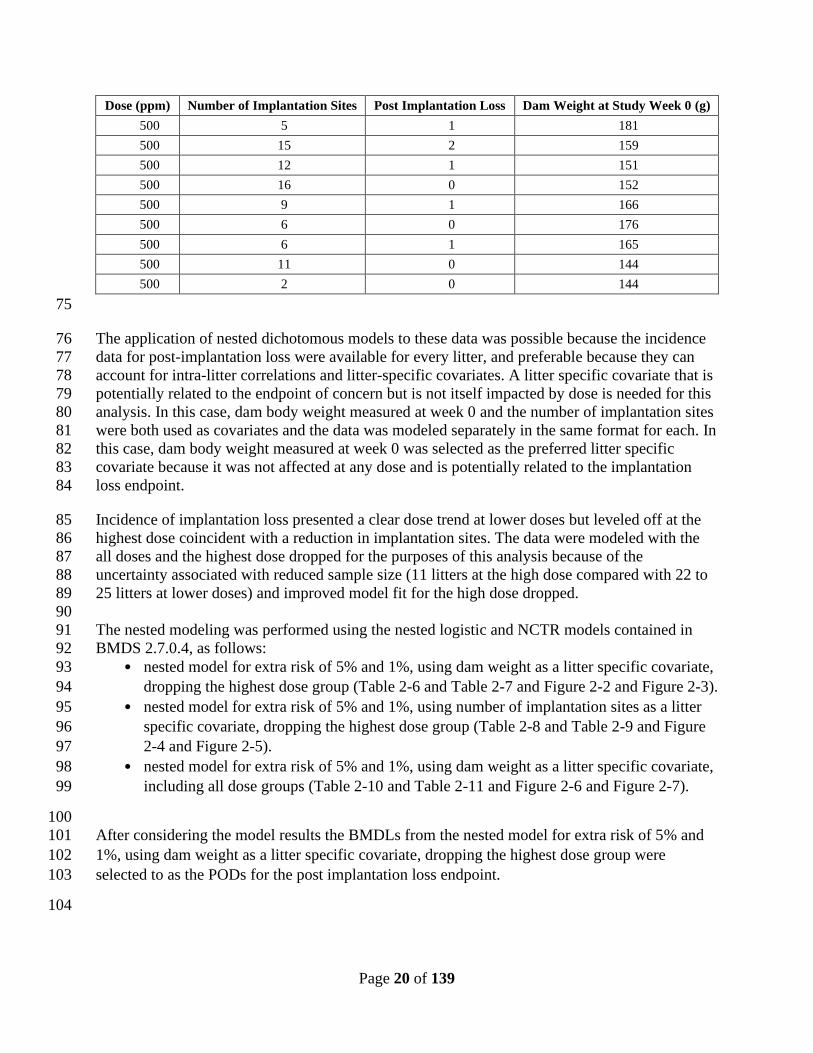
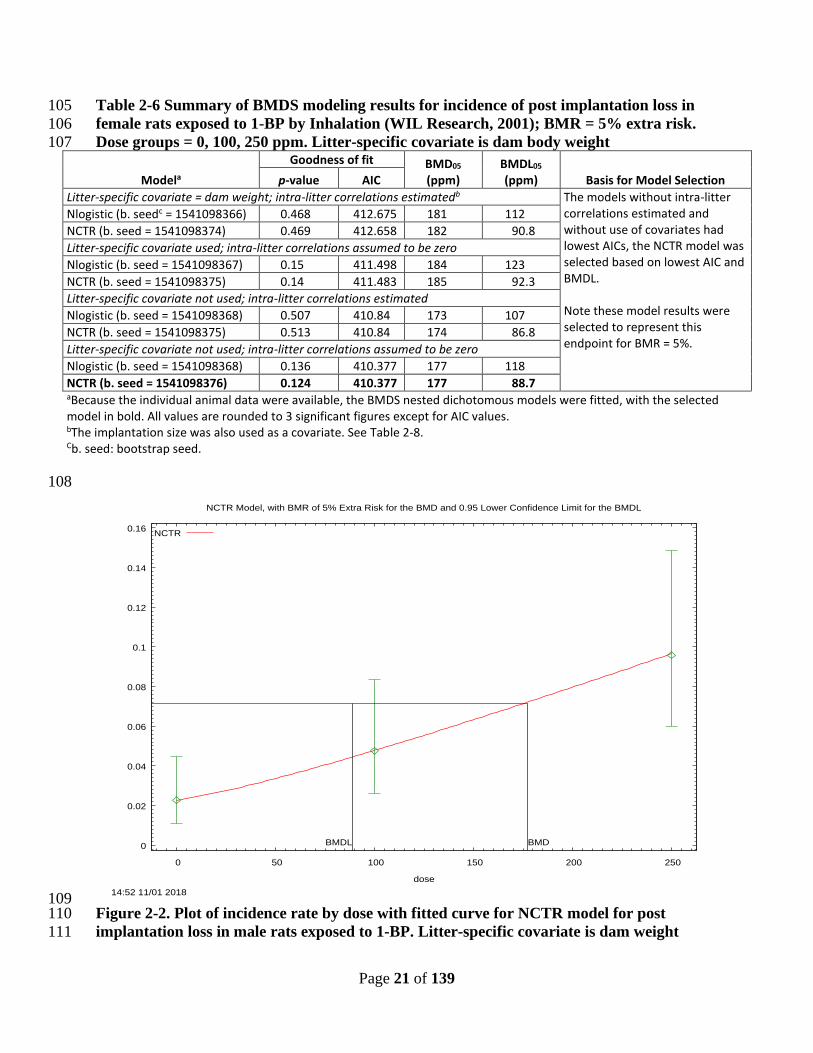
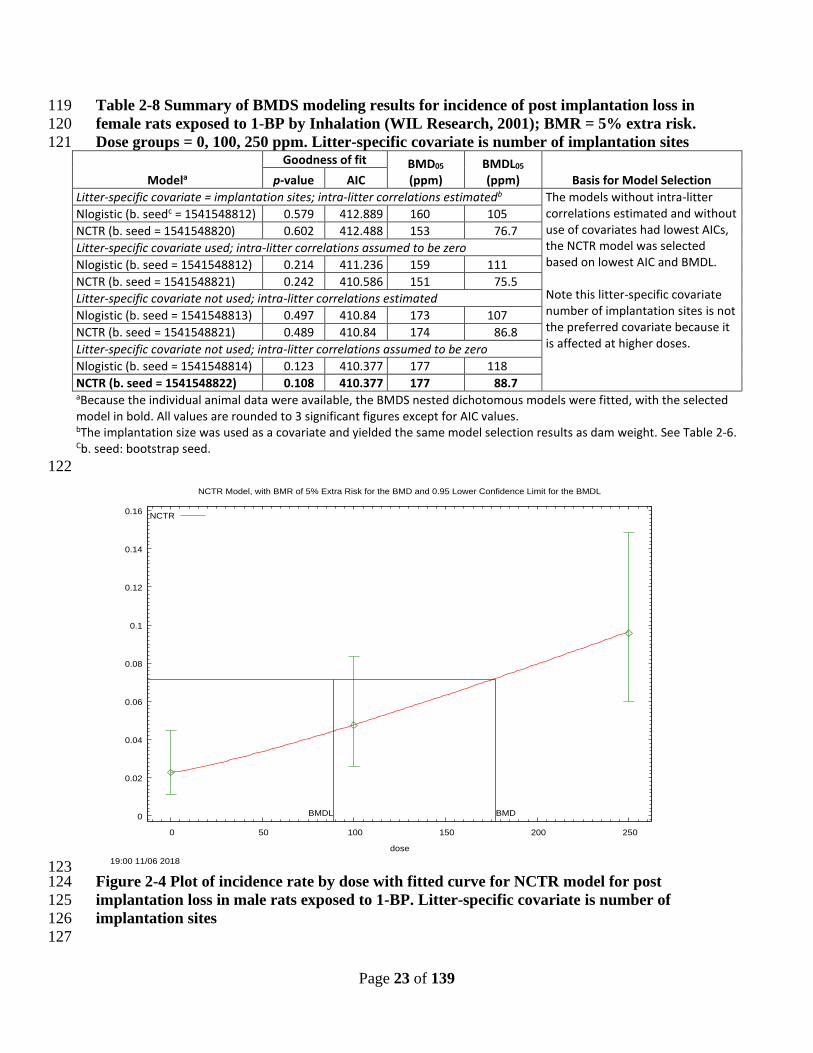
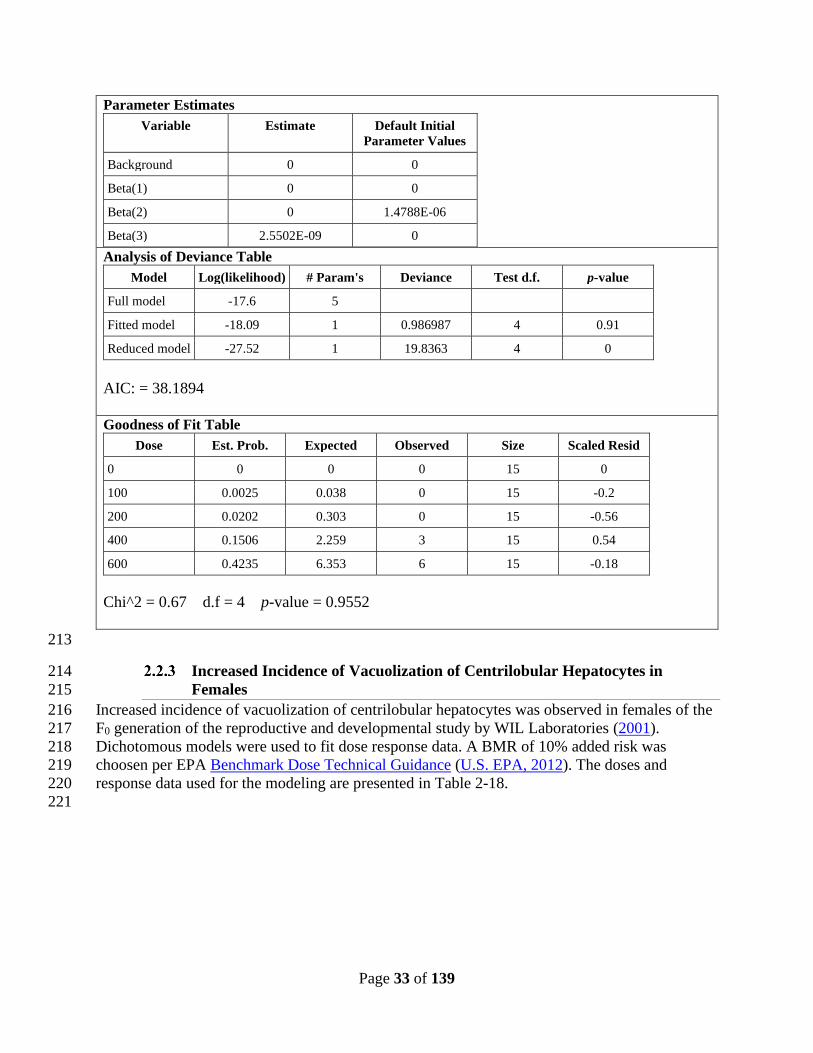
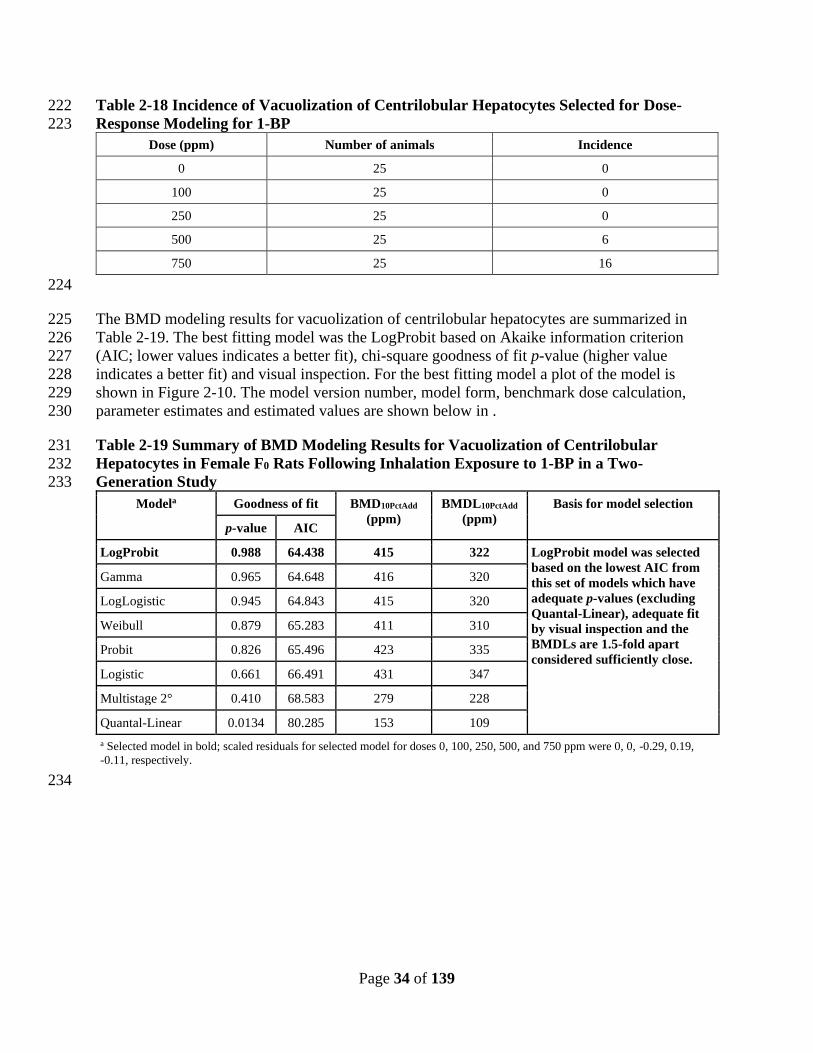
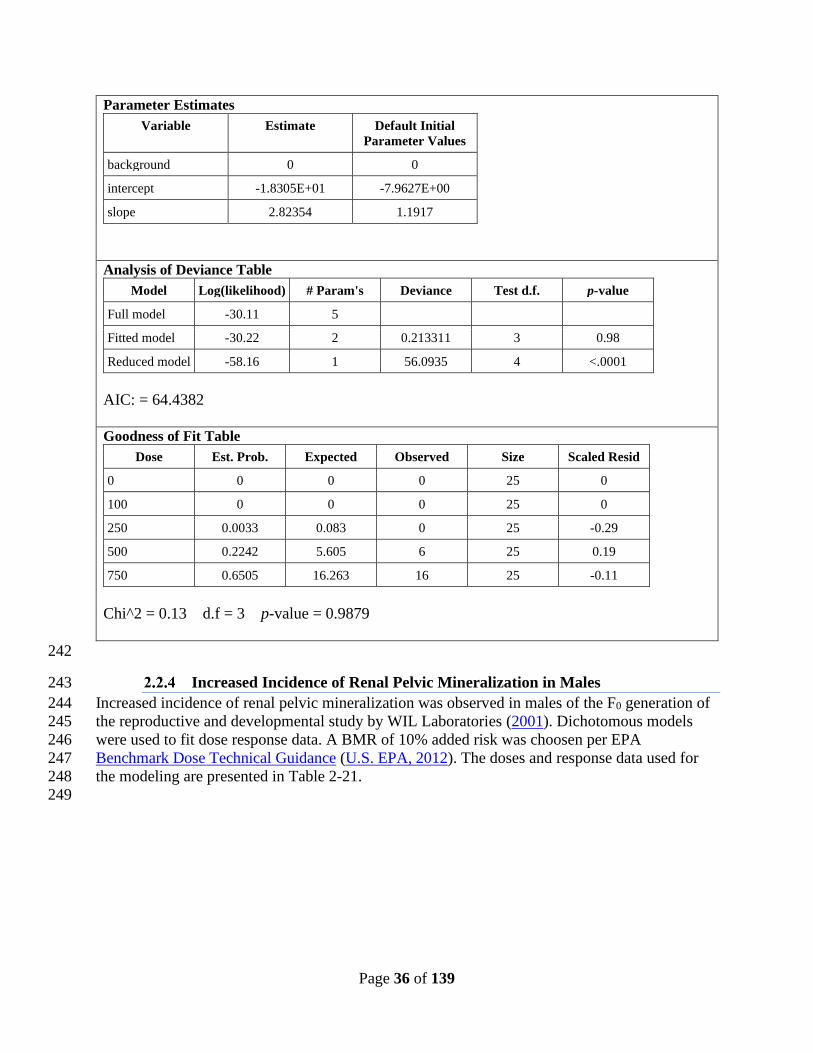
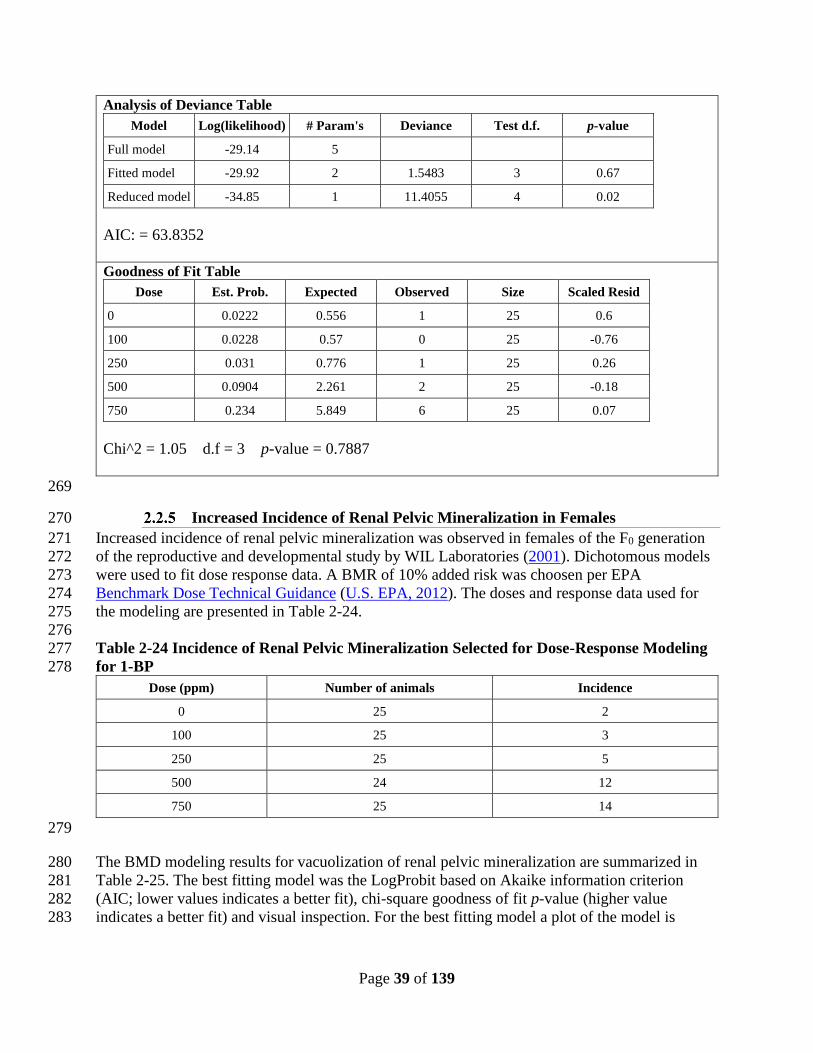
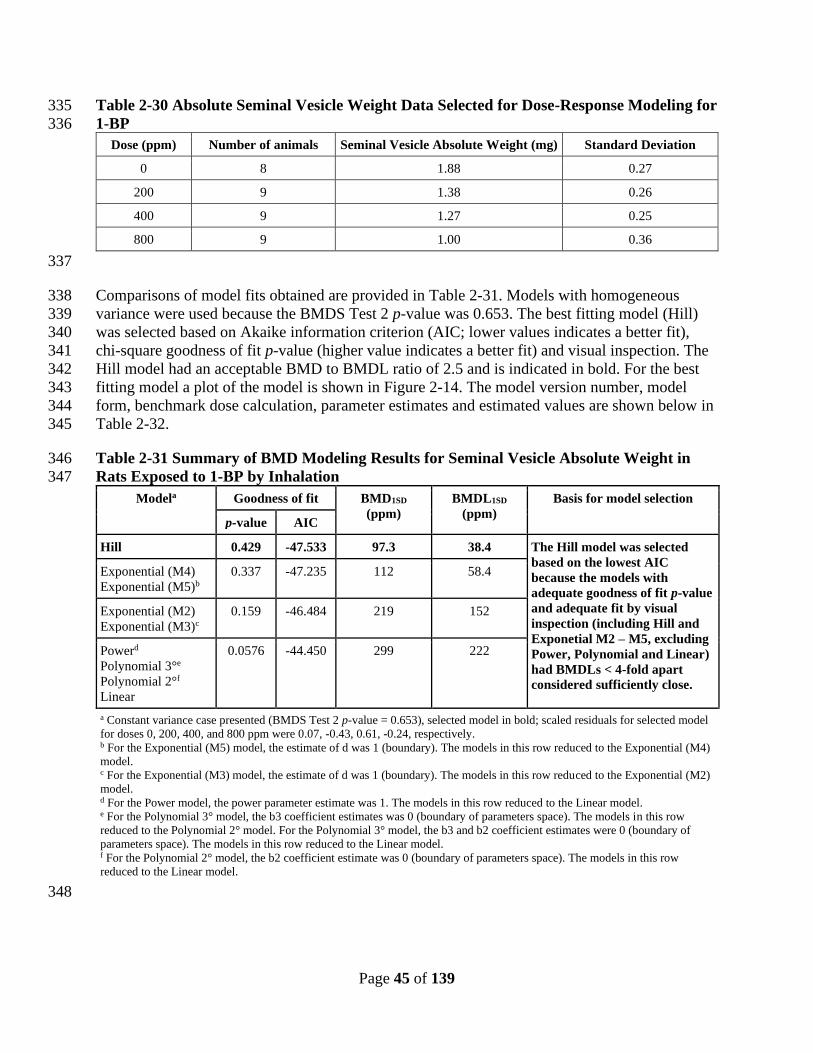
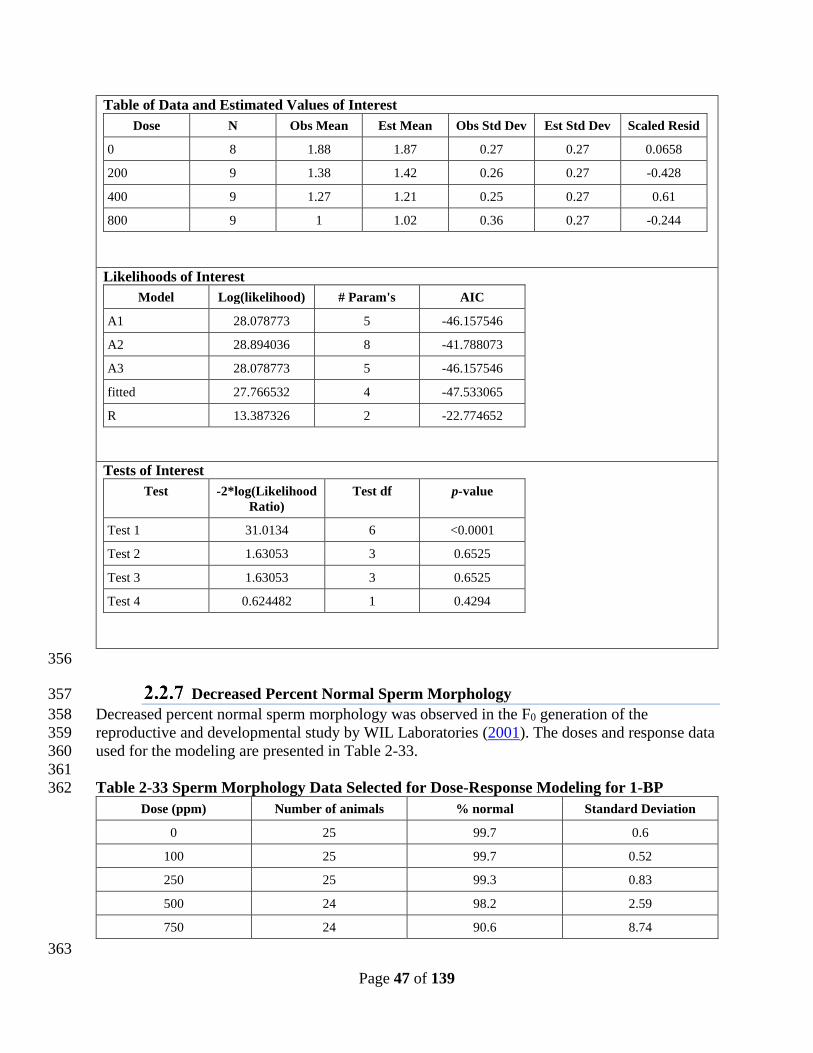
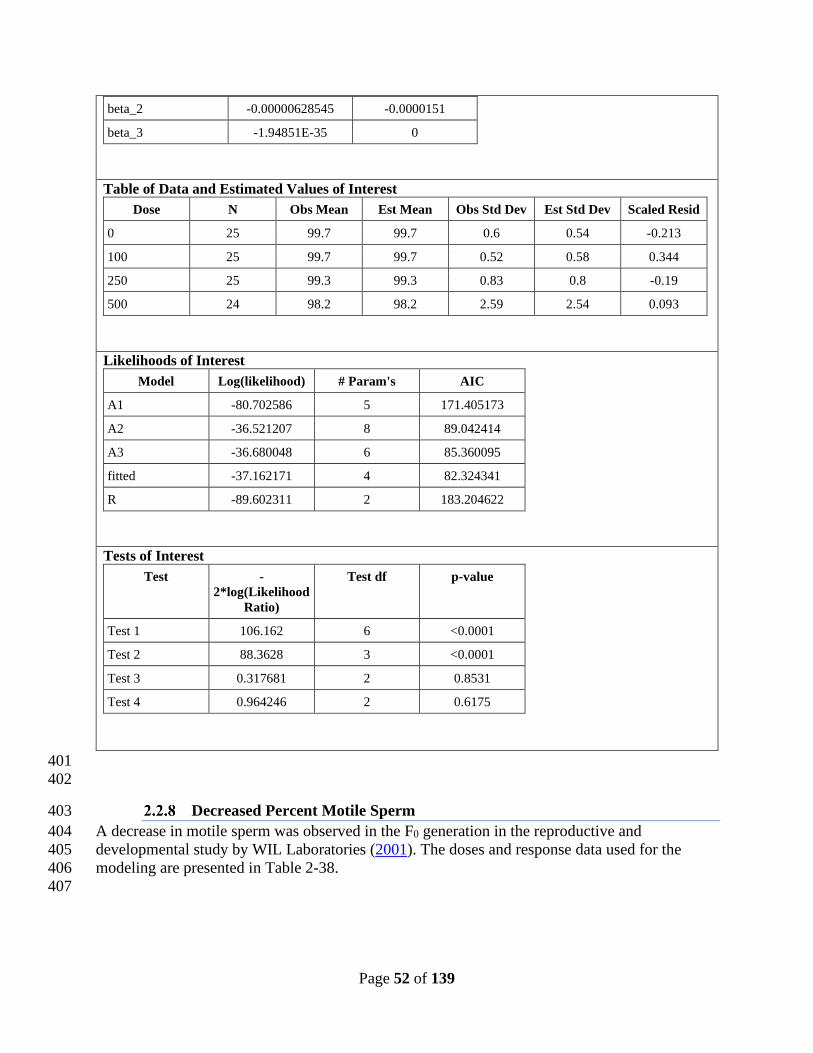
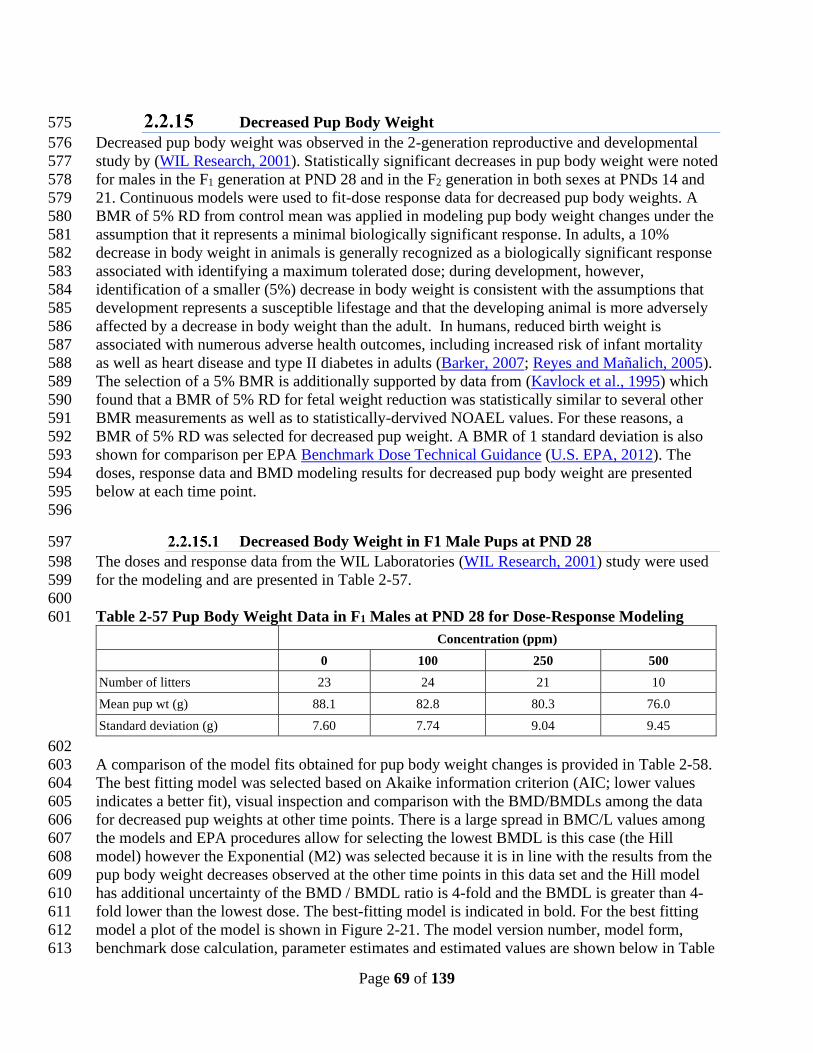
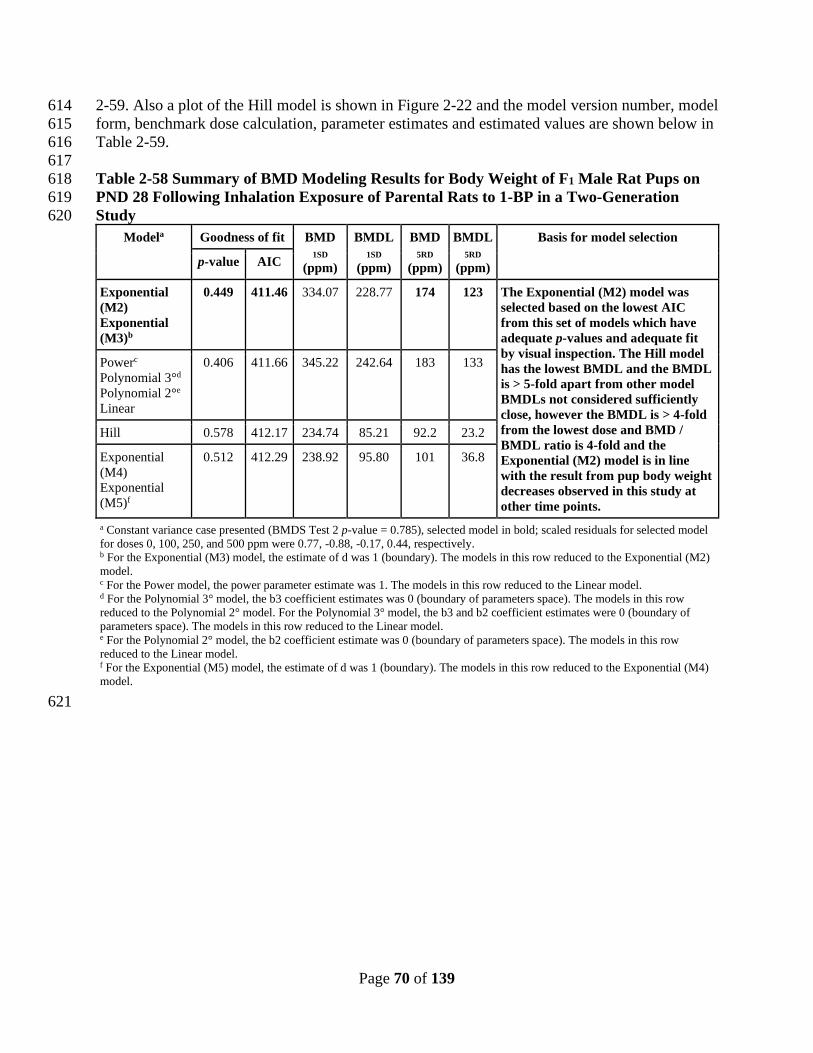
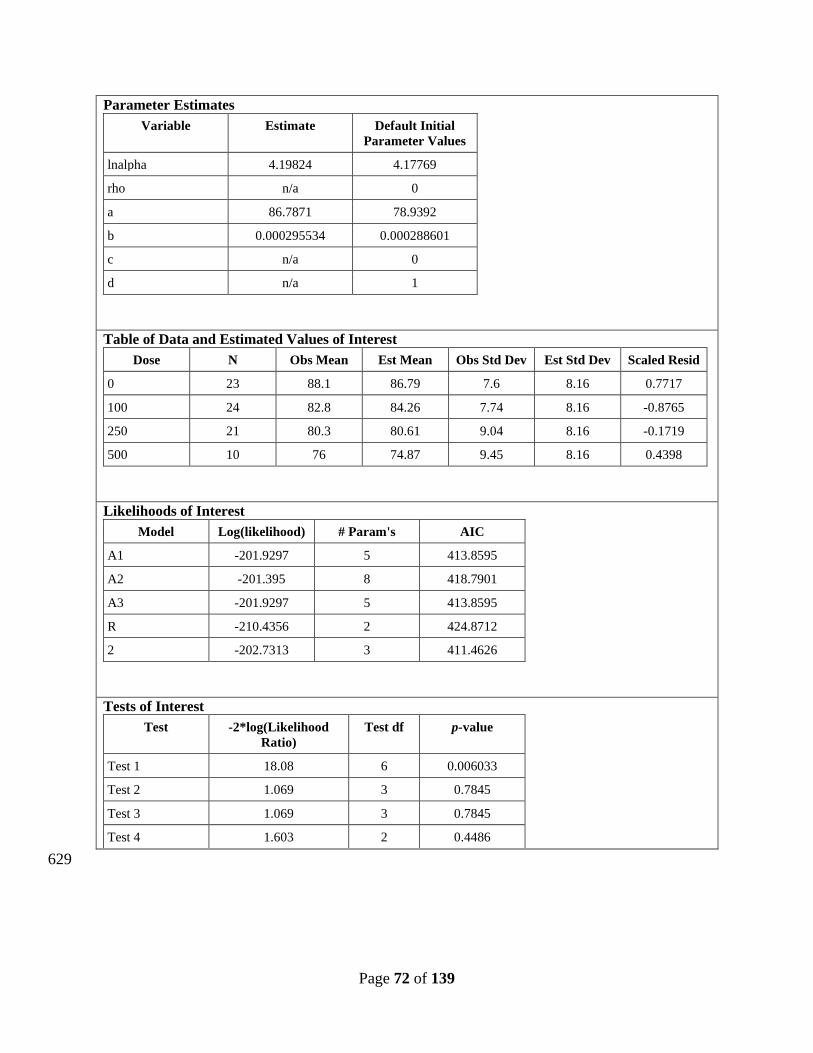
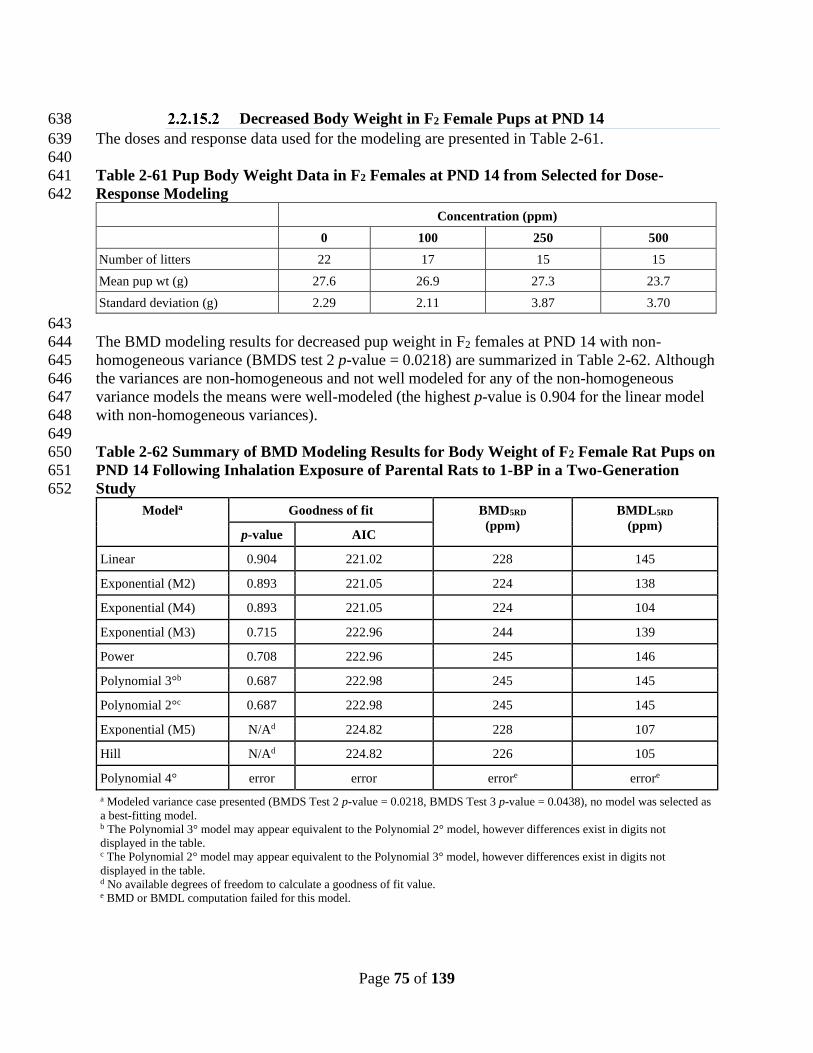
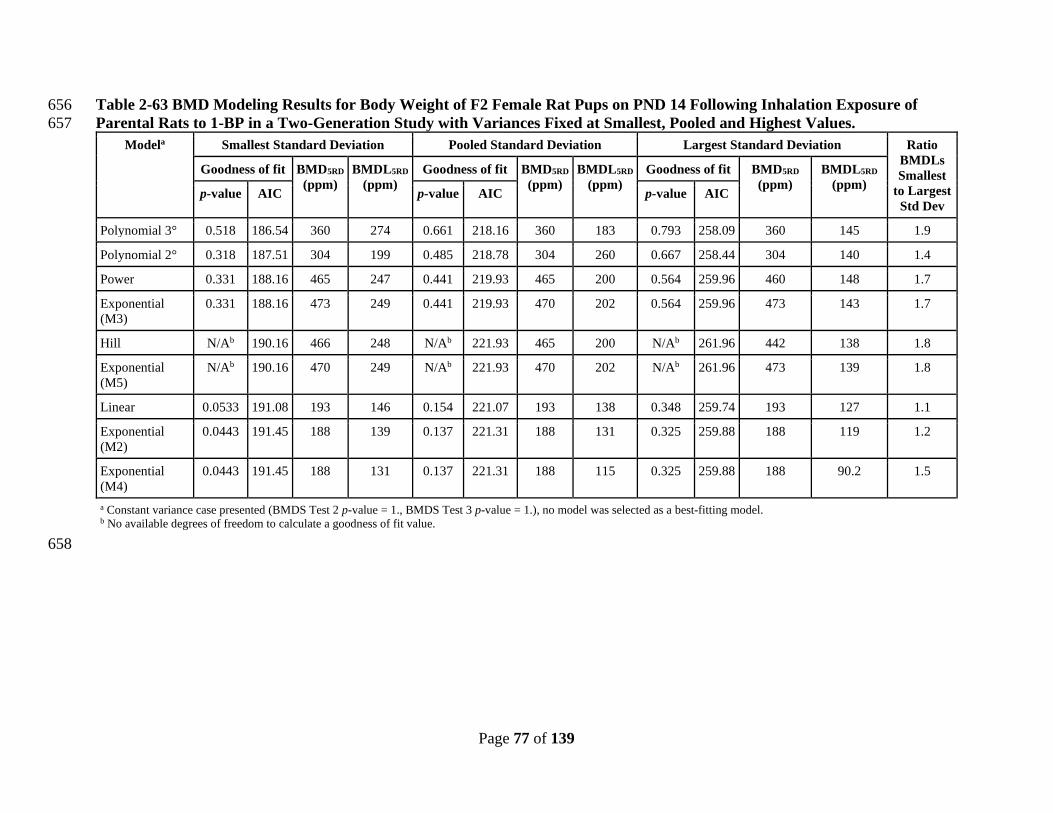
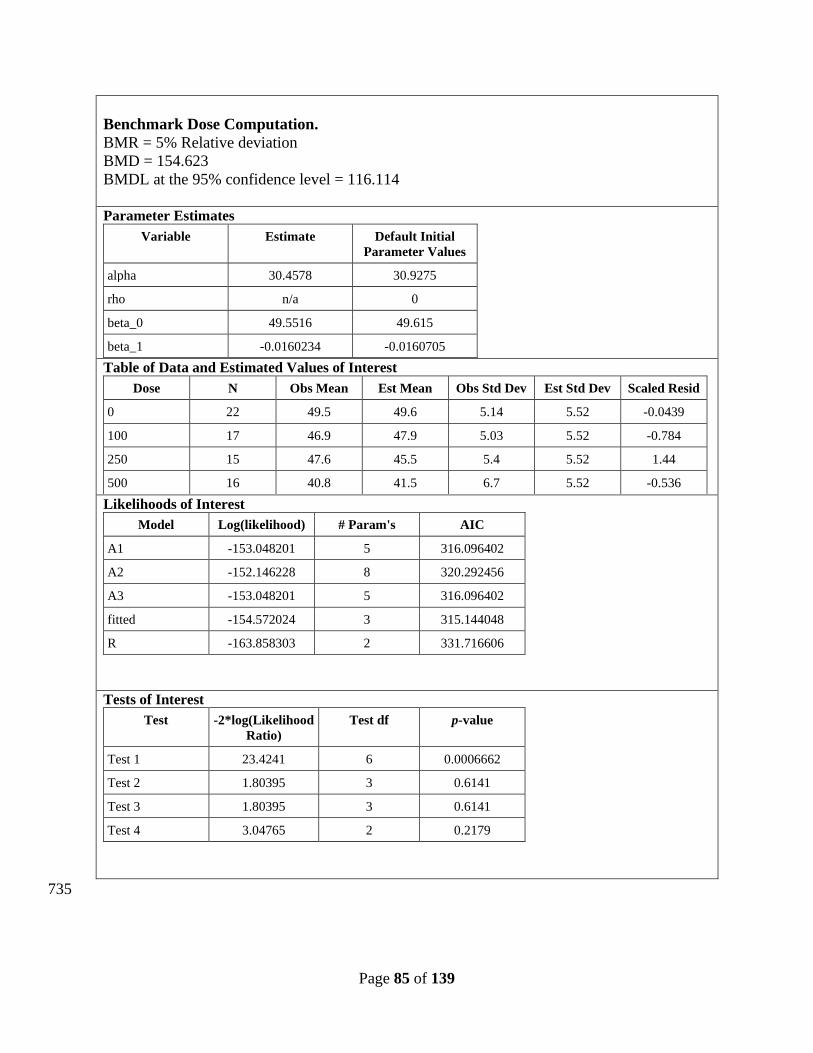
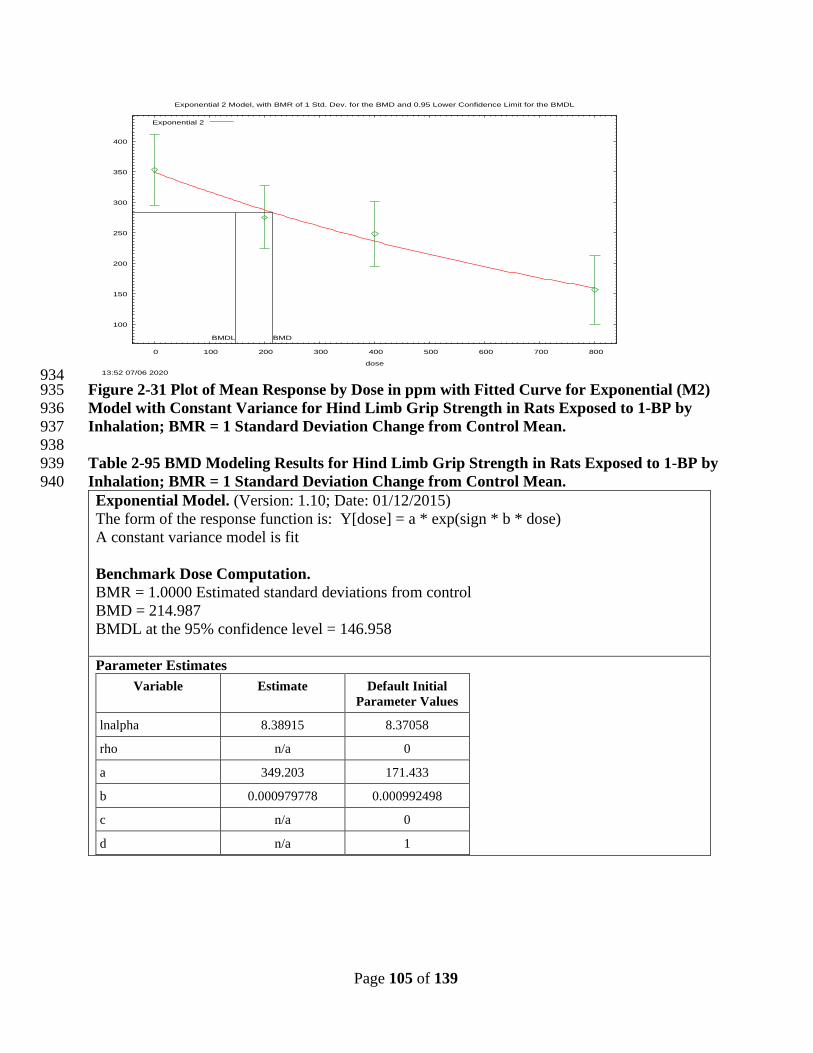
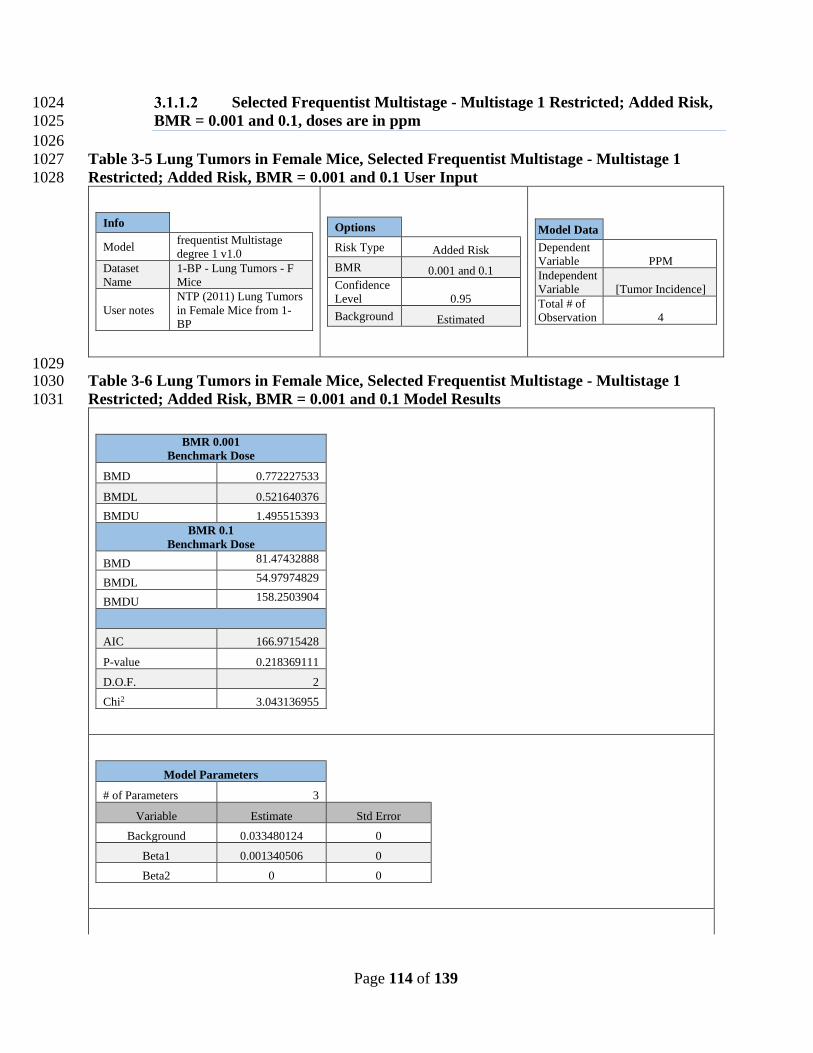
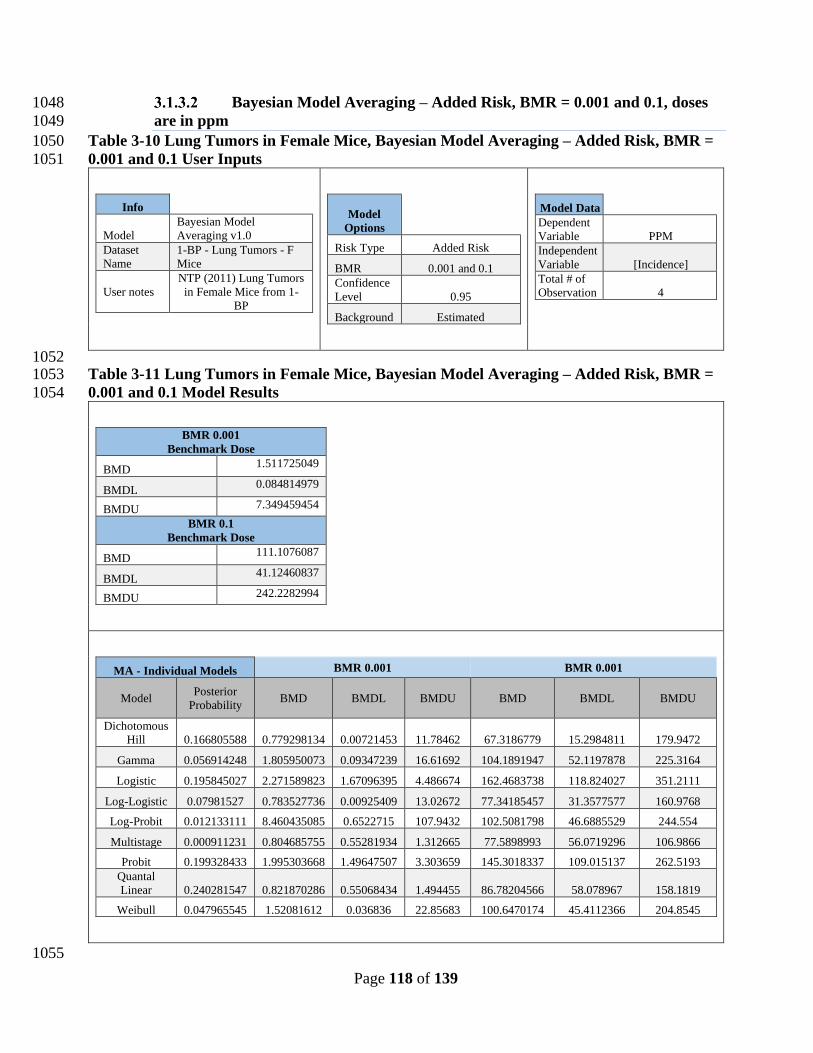
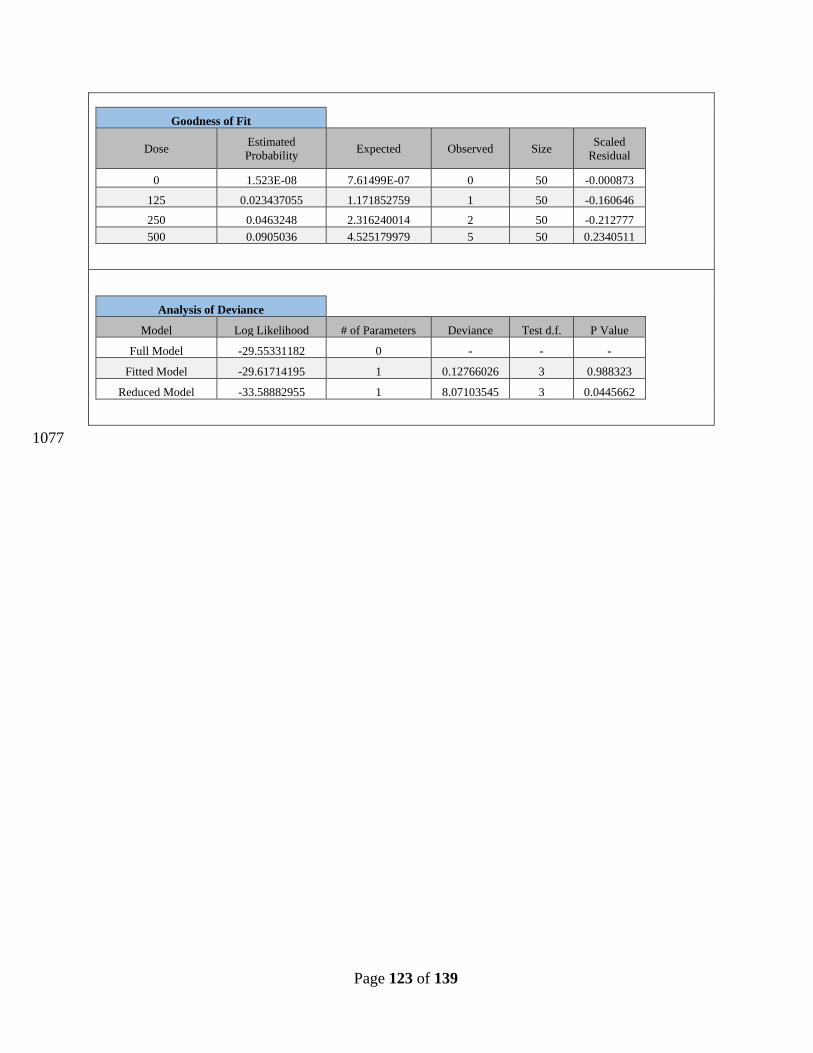
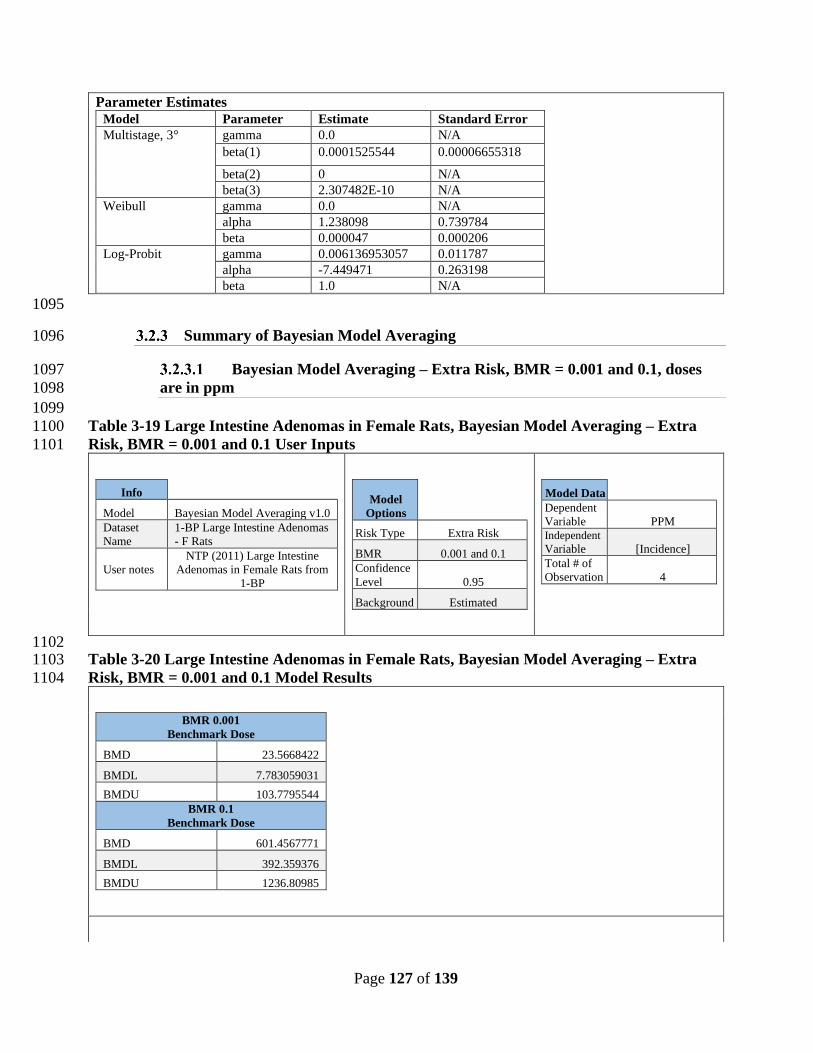
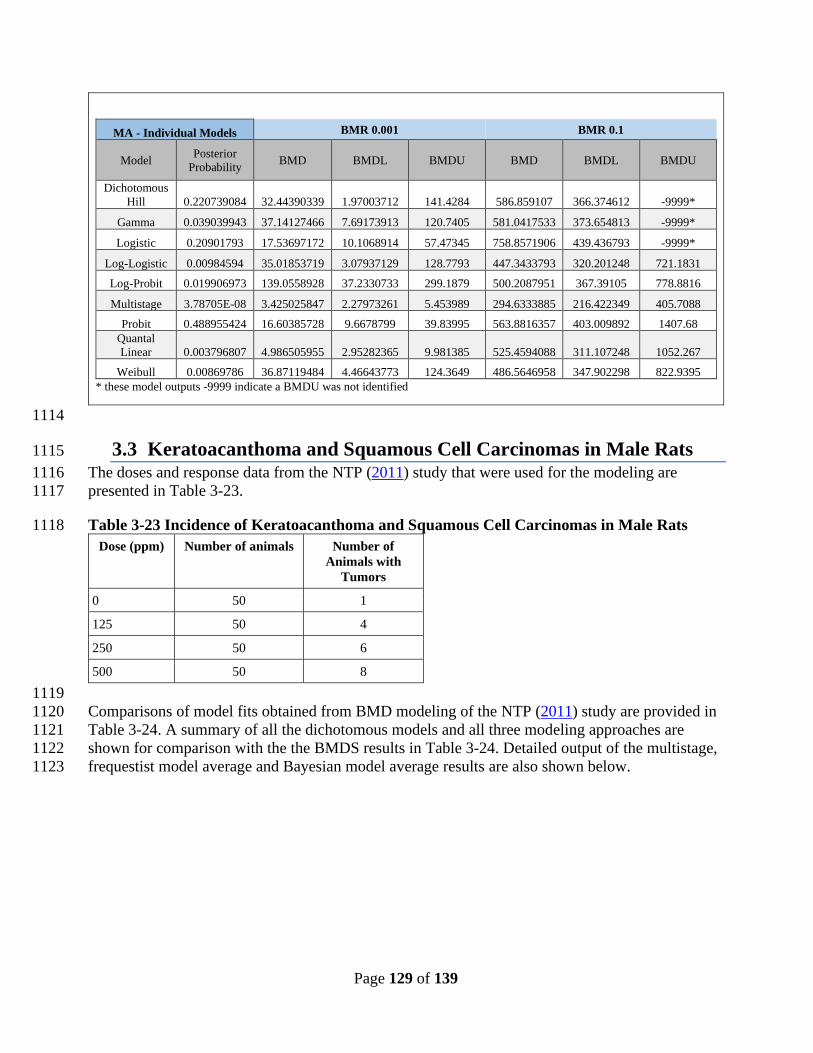
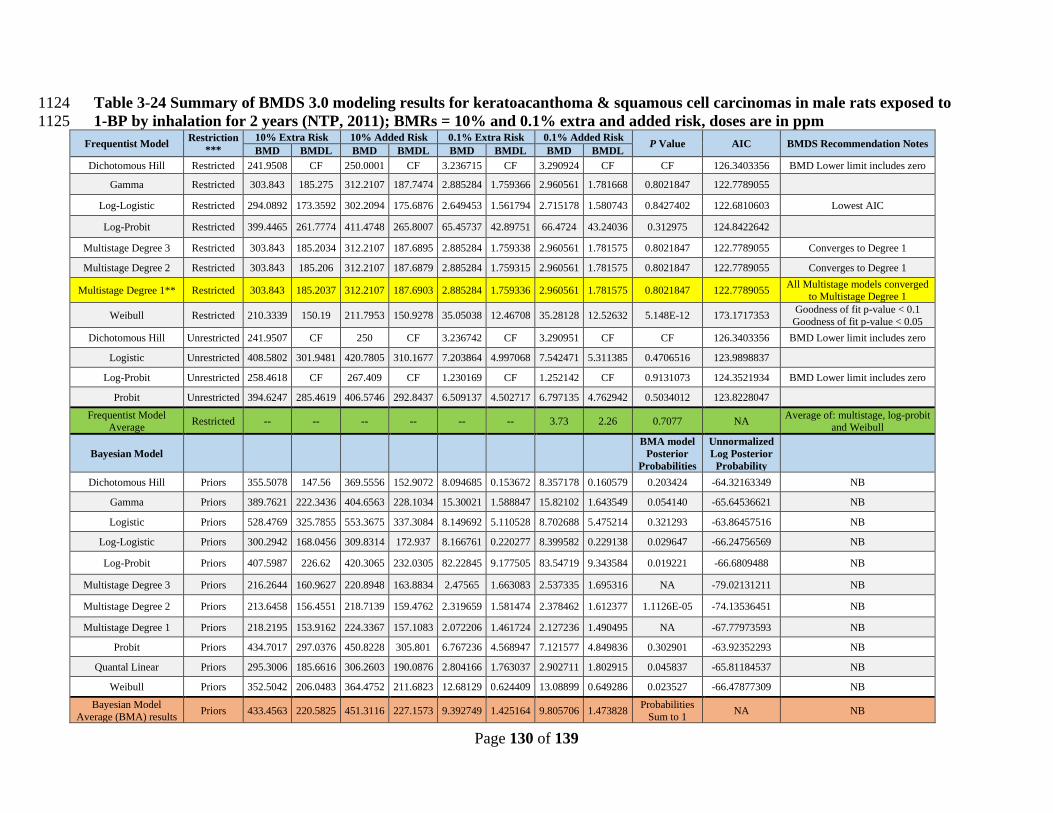
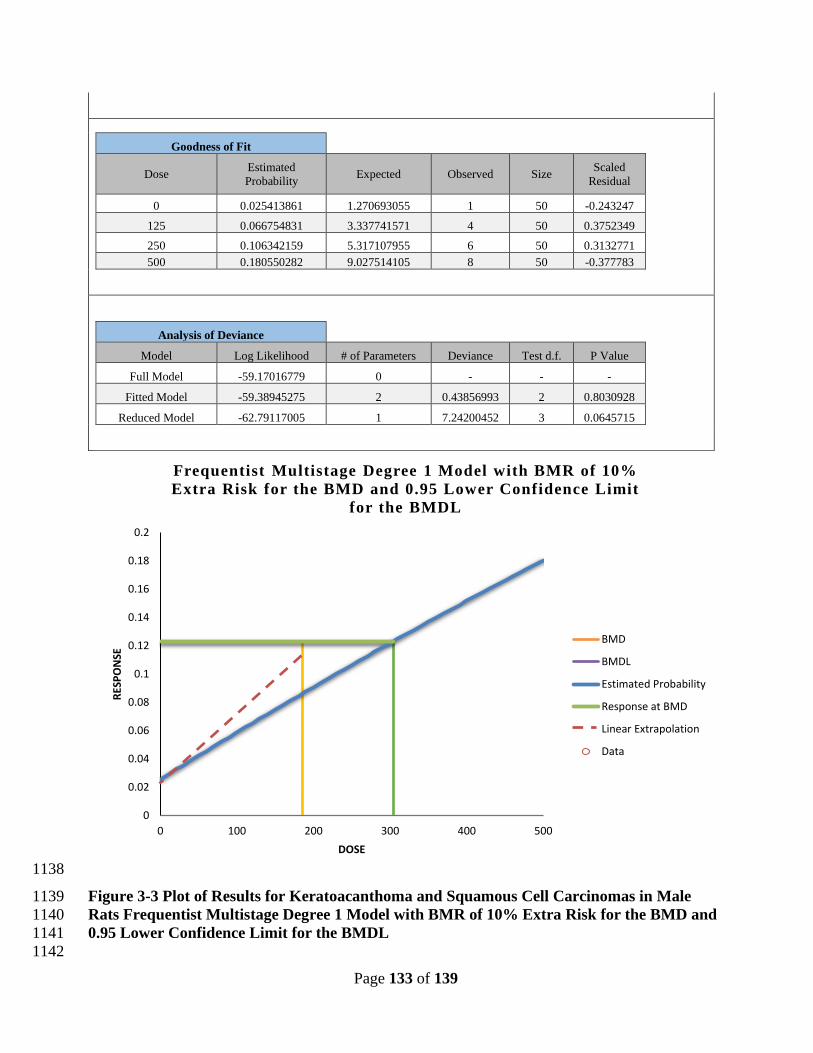
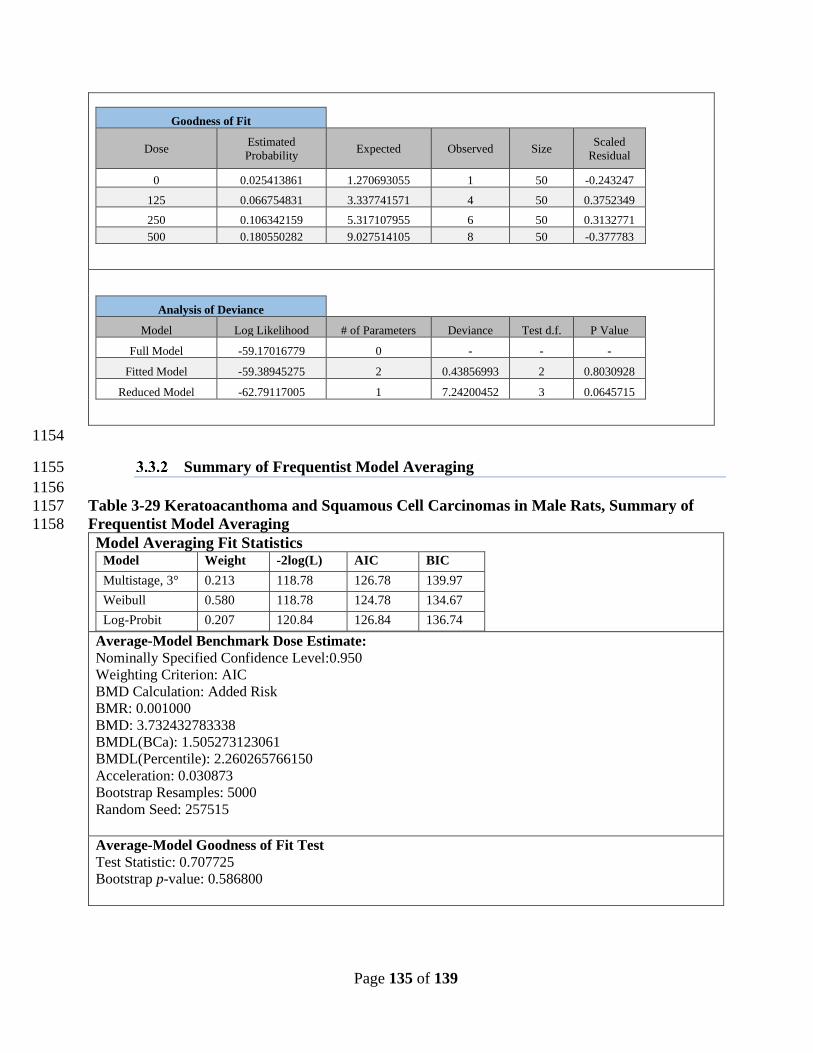
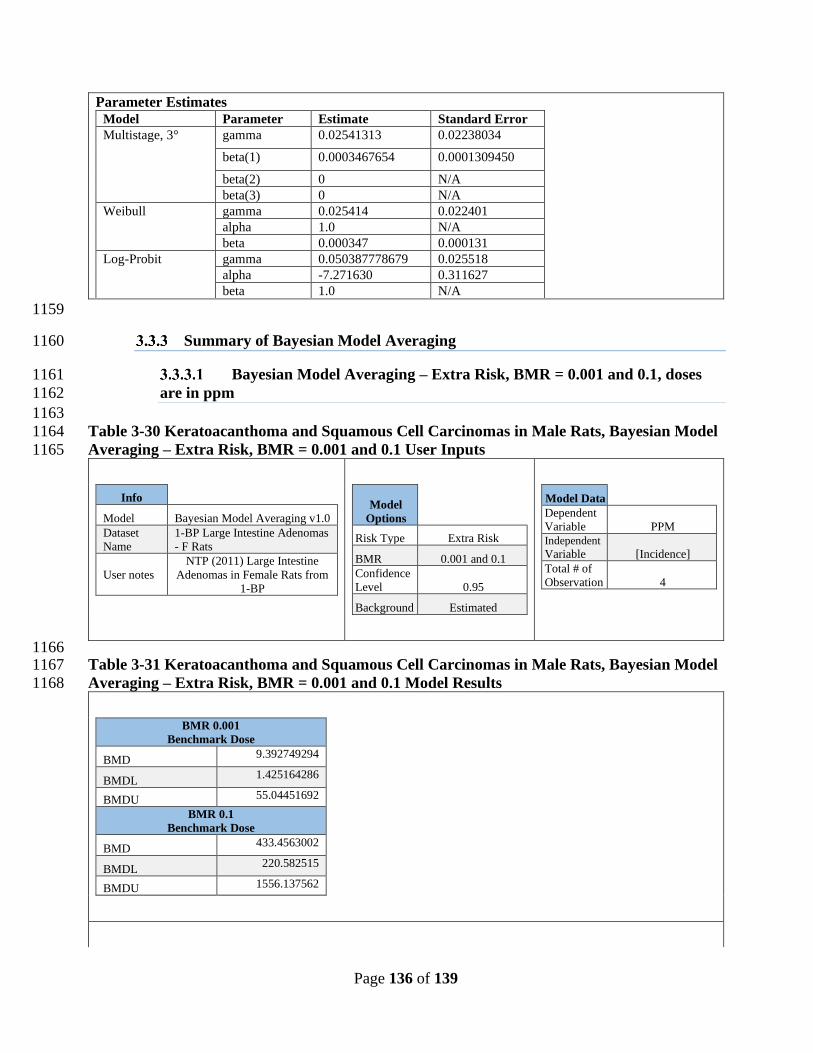
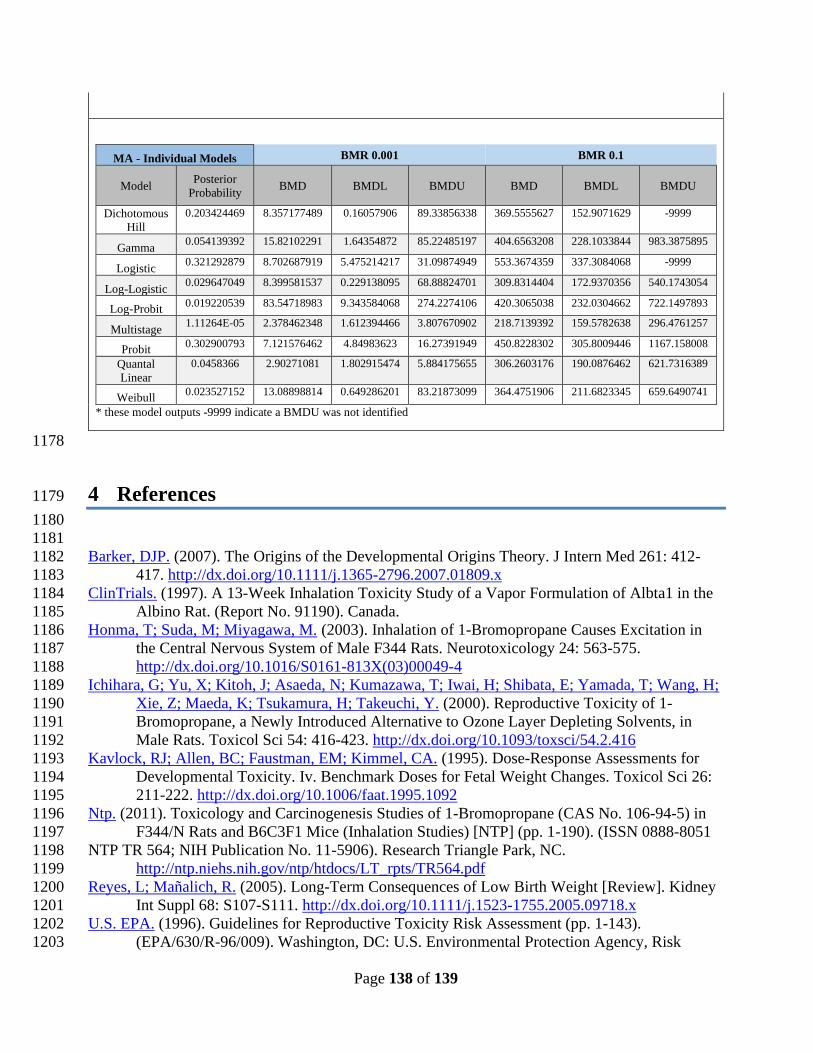
Page 132 of 139

Summary of Multistage Model 1128

Selected Frequentist Multistage - Multistage 1 Restricted; Extra Risk, 1129

BMR = 0.001 and 0.1, doses are in ppm 1130

Table 3-25 Keratoacanthoma and Squamous Cell Carcinomas in Male Rats, Selected 1131

Frequentist Multistage - Multistage 1 Restricted; Extra Risk, BMR = 0.001 and 0.1 User 1132

Input 1133

Info

Model frequentist Multistage degree 1 v1.0

Dataset

Name 1-BP K and SCC - M Rats

User notes

NTP (2011) Keratoacanthoma and

Squamous Cell Carcinomas in Male

Rats

Model

Options

Risk Type Extra Risk

BMR 0.001 and 0.1

Confidence

Level 0.95

Background Estimated

Model Data Dependent Variable PPM Independent

Variable [Incidence] Total # of

Observations 4

1134 Table 3-26 Keratoacanthoma and Squamous Cell Carcinomas in Male Rats, Selected 1135

Frequentist Multistage - Multistage 1 Restricted; Extra Risk, BMR = 0.001 and 0.1 Model 1136

Results 1137

BMR 0.001

Benchmark Dose

BMD 2.885283902

BMDL 1.759336336

BMDU 7.747724524

BMR 0.1

Benchmark Dose

BMD 303.8429907

BMDL 185.2037126

BMDU 815.6993114

AIC 122.7789055

P-value 0.802184708

D.O.F. 2

Chi2 0.440832776

Model Parameters

# of Parameters 3

Variable Estimate Std Error

Background 0.025413861 0

Beta1 0.00034676 0

Beta2 0 0

Page 133 of 139

Goodness of Fit

Dose Estimated

Probability Expected Observed Size

Scaled

Residual

0 0.025413861 1.270693055 1 50 -0.243247

125 0.066754831 3.337741571 4 50 0.3752349

250 0.106342159 5.317107955 6 50 0.3132771

500 0.180550282 9.027514105 8 50 -0.377783

Analysis of Deviance

Model Log Likelihood # of Parameters Deviance Test d.f. P Value

Full Model -59.17016779 0 - - -

Fitted Model -59.38945275 2 0.43856993 2 0.8030928

Reduced Model -62.79117005 1 7.24200452 3 0.0645715

1138

Figure 3-3 Plot of Results for Keratoacanthoma and Squamous Cell Carcinomas in Male 1139

Rats Frequentist Multistage Degree 1 Model with BMR of 10% Extra Risk for the BMD and 1140

0.95 Lower Confidence Limit for the BMDL 1141

1142

0

0.02

0.04

0.06

0.08

0.1

0.12

0.14

0.16

0.18

0.2

0 100 200 300 400 500

RES

PO

NSE

DOSE

Frequentist Multistage Degree 1 Model with BMR of 10%

Extra Risk for the BMD and 0.95 Lower Confidence Limit

for the BMDL

BMD

BMDL

Estimated Probability

Response at BMD

Linear Extrapolation

Data

Page 134 of 139

Selected Frequentist Multistage - Multistage 1 Restricted; Added Risk, 1143

BMR = 0.001 and 0.1, doses are in ppm 1144

1145

Table 3-27 Keratoacanthoma and Squamous Cell Carcinomas in Male Rats, Selected 1146

Frequentist Multistage - Multistage 1 Restricted; Added Risk, BMR = 0.001 and 0.1 User 1147

Input 1148

Info

Model frequentist Multistage degree 1 v1.0

Dataset

Name 1-BP K and SCC - M Rats

User notes

NTP (2011) Keratoacanthoma and

Squamous Cell Carcinomas in Male

Rats

Model

Options

Risk Type Added Risk

BMR 0.001 and 0.1

Confidence

Level 0.95

Background Estimated

Model Data Dependent

Variable PPM Independent Variable [Incidence] Total # of

Observations 4

1149 1150

Table 3-28 Keratoacanthoma and Squamous Cell Carcinomas in Male Rats, Selected 1151

Frequentist Multistage - Multistage 1 Restricted; Added Risk, BMR = 0.001 and 0.1 Model 1152

Results 1153

BMR 0.001

Benchmark Dose

BMD 2.960560843

BMDL 1.781575063

BMDU 8.258328982

BMR 0.1

Benchmark Dose

BMD 312.2107498

BMDL 187.7473751

BMDU 872.7938309

AIC 122.7789055

P-value 0.802184708

D.O.F. 2

Chi2 0.440832776

Model Parameters

# of Parameters 3

Variable Estimate Std Error

Background 0.025413861

0

Beta1 0.00034676 0

Beta2 0 0

Page 135 of 139

Goodness of Fit

Dose Estimated

Probability Expected Observed Size

Scaled

Residual

0 0.025413861 1.270693055 1 50 -0.243247

125 0.066754831 3.337741571 4 50 0.3752349

250 0.106342159 5.317107955 6 50 0.3132771

500 0.180550282 9.027514105 8 50 -0.377783

Analysis of Deviance

Model Log Likelihood # of Parameters Deviance Test d.f. P Value

Full Model -59.17016779 0 - - -

Fitted Model -59.38945275 2 0.43856993 2 0.8030928

Reduced Model -62.79117005 1 7.24200452 3 0.0645715

1154

Summary of Frequentist Model Averaging 1155

1156

Table 3-29 Keratoacanthoma and Squamous Cell Carcinomas in Male Rats, Summary of 1157

Frequentist Model Averaging 1158

Model Averaging Fit Statistics Model Weight -2log(L) AIC BIC

Multistage, 3° 0.213 118.78 126.78 139.97

Weibull 0.580 118.78 124.78 134.67

Log-Probit 0.207 120.84 126.84 136.74

Average-Model Benchmark Dose Estimate:

Nominally Specified Confidence Level:0.950

Weighting Criterion: AIC

BMD Calculation: Added Risk

BMR: 0.001000

BMD: 3.732432783338

BMDL(BCa): 1.505273123061

BMDL(Percentile): 2.260265766150

Acceleration: 0.030873

Bootstrap Resamples: 5000

Random Seed: 257515

Average-Model Goodness of Fit Test

Test Statistic: 0.707725

Bootstrap p-value: 0.586800

Page 136 of 139

Parameter Estimates Model Parameter Estimate Standard Error

Multistage, 3° gamma 0.02541313 0.02238034

beta(1) 0.0003467654 0.0001309450

beta(2) 0 N/A

beta(3) 0 N/A

Weibull gamma 0.025414 0.022401

alpha 1.0 N/A

beta 0.000347 0.000131

Log-Probit gamma 0.050387778679 0.025518

alpha -7.271630 0.311627

beta 1.0 N/A

1159

Summary of Bayesian Model Averaging 1160

Bayesian Model Averaging – Extra Risk, BMR = 0.001 and 0.1, doses 1161

are in ppm 1162

1163

Table 3-30 Keratoacanthoma and Squamous Cell Carcinomas in Male Rats, Bayesian Model 1164

Averaging – Extra Risk, BMR = 0.001 and 0.1 User Inputs 1165

Info

Model Bayesian Model Averaging v1.0

Dataset

Name

1-BP Large Intestine Adenomas

- F Rats

User notes

NTP (2011) Large Intestine

Adenomas in Female Rats from

1-BP

Model

Options

Risk Type Extra Risk

BMR 0.001 and 0.1

Confidence

Level 0.95

Background Estimated

Model Data

Dependent

Variable PPM

Independent Variable [Incidence]

Total # of

Observation 4

1166 Table 3-31 Keratoacanthoma and Squamous Cell Carcinomas in Male Rats, Bayesian Model 1167

Averaging – Extra Risk, BMR = 0.001 and 0.1 Model Results 1168

BMR 0.001

Benchmark Dose

BMD 9.392749294

BMDL 1.425164286

BMDU 55.04451692

BMR 0.1

Benchmark Dose

BMD 433.4563002

BMDL 220.582515

BMDU 1556.137562

Page 137 of 139

MA - Individual Models BMR 0.001 BMR 0.1

Model Posterior

Probability BMD BMDL BMDU BMD BMDL BMDU

Dichotomous

Hill

0.203424469 8.094685152 0.153671514 86.83353662 355.5077612 147.5600451 192683.5175

Gamma 0.054139392 15.30020591 1.588847255 82.10273087 389.7621334 222.343564 928.3482432

Logistic 0.321292879 8.149691857 5.11052832 31.40190989 528.4768939 325.7855475 2252.007484

Log-Logistic 0.029647049 8.166761138 0.220277332 67.28941947 300.2942502 168.0455804 513.0673647

Log-Probit 0.019220539 82.22845197 9.177505039 271.9267905 407.5987339 226.6199589 689.7653341

Multistage 1.11264E-05 2.319659106 1.581473509 3.680806607 213.6458308 156.4551443 296.4730561

Probit 0.302900793 6.767235696 4.568947013 15.09856433 434.7017109 297.0376015 1098.289967

Quantal

Linear

0.0458366 2.804165939 1.763036591 5.545045715 295.3006327 185.6615543 583.9366913

Weibull 0.023527152 12.68129051 0.624408538 81.15071058 352.504164 206.0482651 624.6541739

* these model outputs -9999 indicate a BMDU was not identified

1169

Bayesian Model Averaging – Added Risk, BMR = 0.001 and 0.1, doses 1170

are in ppm 1171

1172

Table 3-32 Keratoacanthoma and Squamous Cell Carcinomas in Male Rats, Bayesian Model 1173

Averaging – Added Risk, BMR = 0.001 and 0.1 User Inputs 1174

Info

Model Bayesian Model Averaging v1.0

Dataset

Name

1-BP Large Intestine Adenomas

- F Rats

User notes

NTP (2011) Large Intestine

Adenomas in Female Rats from

1-BP

Model

Options

Risk Type Added Risk

BMR 0.001 and 0.1

Confidence

Level 0.95

Background Estimated

Model Data

Dependent

Variable PPM

Independent Variable [Incidence]

Total # of

Observation 4

1175 Table 3-33 Keratoacanthoma and Squamous Cell Carcinomas in Male Rats, Bayesian Model 1176

Averaging – Added Risk, BMR = 0.001 and 0.1 Model Results 1177

BMR 0.001

Benchmark Dose

BMD 9.805706222

BMDL 1.47382787

BMDU 51.07468367

BMR 0.1

Benchmark Dose

BMD 451.311646

BMDL 227.1572948

BMDU 1229.189038

Page 138 of 139

MA - Individual Models BMR 0.001 BMR 0.1

Model Posterior

Probability BMD BMDL BMDU BMD BMDL BMDU

Dichotomous

Hill

0.203424469 8.357177489 0.16057906 89.33856338 369.5555627 152.9071629 -9999

Gamma 0.054139392 15.82102291 1.64354872 85.22485197 404.6563208 228.1033844 983.3875895

Logistic 0.321292879 8.702687919 5.475214217 31.09874949 553.3674359 337.3084068 -9999

Log-Logistic 0.029647049 8.399581537 0.229138095 68.88824701 309.8314404 172.9370356 540.1743054

Log-Probit 0.019220539 83.54718983 9.343584068 274.2274106 420.3065038 232.0304662 722.1497893

Multistage 1.11264E-05 2.378462348 1.612394466 3.807670902 218.7139392 159.5782638 296.4761257

Probit 0.302900793 7.121576462 4.84983623 16.27391949 450.8228302 305.8009446 1167.158008

Quantal

Linear

0.0458366 2.90271081 1.802915474 5.884175655 306.2603176 190.0876462 621.7316389

Weibull 0.023527152 13.08898814 0.649286201 83.21873099 364.4751906 211.6823345 659.6490741

* these model outputs -9999 indicate a BMDU was not identified

1178

4 References 1179

1180

1181

Barker, DJP. (2007). The Origins of the Developmental Origins Theory. J Intern Med 261: 412-1182

417. http://dx.doi.org/10.1111/j.1365-2796.2007.01809.x 1183

ClinTrials. (1997). A 13-Week Inhalation Toxicity Study of a Vapor Formulation of Albta1 in the 1184

Albino Rat. (Report No. 91190). Canada. 1185

Honma, T; Suda, M; Miyagawa, M. (2003). Inhalation of 1-Bromopropane Causes Excitation in 1186

the Central Nervous System of Male F344 Rats. Neurotoxicology 24: 563-575. 1187

http://dx.doi.org/10.1016/S0161-813X(03)00049-4 1188

Ichihara, G; Yu, X; Kitoh, J; Asaeda, N; Kumazawa, T; Iwai, H; Shibata, E; Yamada, T; Wang, H; 1189

Xie, Z; Maeda, K; Tsukamura, H; Takeuchi, Y. (2000). Reproductive Toxicity of 1-1190

Bromopropane, a Newly Introduced Alternative to Ozone Layer Depleting Solvents, in 1191

Male Rats. Toxicol Sci 54: 416-423. http://dx.doi.org/10.1093/toxsci/54.2.416 1192

Kavlock, RJ; Allen, BC; Faustman, EM; Kimmel, CA. (1995). Dose-Response Assessments for 1193

Developmental Toxicity. Iv. Benchmark Doses for Fetal Weight Changes. Toxicol Sci 26: 1194

211-222. http://dx.doi.org/10.1006/faat.1995.1092 1195

Ntp. (2011). Toxicology and Carcinogenesis Studies of 1-Bromopropane (CAS No. 106-94-5) in 1196

F344/N Rats and B6C3F1 Mice (Inhalation Studies) [NTP] (pp. 1-190). (ISSN 0888-8051 1197

NTP TR 564; NIH Publication No. 11-5906). Research Triangle Park, NC. 1198

http://ntp.niehs.nih.gov/ntp/htdocs/LT_rpts/TR564.pdf 1199

Reyes, L; Mañalich, R. (2005). Long-Term Consequences of Low Birth Weight [Review]. Kidney 1200

Int Suppl 68: S107-S111. http://dx.doi.org/10.1111/j.1523-1755.2005.09718.x 1201

U.S. EPA. (1996). Guidelines for Reproductive Toxicity Risk Assessment (pp. 1-143). 1202

(EPA/630/R-96/009). Washington, DC: U.S. Environmental Protection Agency, Risk 1203

Page 139 of 139

Assessment Forum. https://www.epa.gov/sites/production/files/2014-1204

11/documents/guidelines_repro_toxicity.pdf 1205

U.S. EPA. (2012). Benchmark Dose Technical Guidance. (EPA/100/R-12/001). Washington, DC: 1206

U.S. Environmental Protection Agency, Risk Assessment Forum. 1207

https://www.epa.gov/risk/benchmark-dose-technical-guidance 1208

U.S. EPA. (2016). TSCA Work Plan Chemical Risk Assessment: Peer Review Draft 1-1209

Bromopropane: (N-Propyl Bromide) Spray Adhesives, Dry Cleaning, and Degreasing Uses 1210

CASRN: 106-94-5 [EPA Report]. (EPA 740-R1-5001). Washington, DC. 1211

https://www.epa.gov/sites/production/files/2016-03/documents/1-1212

bp_report_and_appendices_final.pdf 1213

Wheeler, MW; Bailer, AJ. (2007). Properties of Model-Averaged Bmdls: A Study of Model 1214

Averaging in Dichotomous Response Risk Estimation. Risk Anal 27: 659-670. 1215

http://dx.doi.org/10.1111/j.1539-6924.2007.00920.x 1216

WIL Research. (2001). An Inhalation Two-Generation Reproductive Toxicity Study of 1-1217

Bromopropane in Rats. (Study No. WIL-380001). Ashland, OH. 1218

Yamada, T; Ichihara, G; Wang, H; Yu, X; Maeda, K; Tsukamura, H; Kamijima, M; Nakajima, T; 1219

Takeuchi, Y. (2003). Exposure to 1-Bromopropane Causes Ovarian Dysfunction in Rats. 1220

Toxicol Sci 71: 96-103. http://dx.doi.org/10.1093/toxsci/71.1.96 1221

1222


Recommended