i FINAL STATUS SURVEY PLAN Californium Neutron Flux Multiplier (CFX) NRC License: SNM-1513 Docket 7001703 Kodak EASTMAN KODAK COMPANY 1999 Lake Avenue Rochester, New York 14650, Revision 0 Submitted: May 2008 NE>XTEP CONSULTING GROUP 808 Lyndon Lane, Suite 201 Louisville, Kentucky 40222 502/339-9767 (Voice) 413/451-4859 (Fax)
2.3 RADIONUCLIDES OF INTEREST ...................................................................... 5
2.3.1 Contamination with Licensed Materials ........................................... 52.3.2 Induced Radioactivity due to Neutron Activation ................................ 5
2.4 RELEASE CRITERIA FOR BUILDING SURFACES & FIXED EQUIPMENT......................... 62.4.1 Release Criteria for Surface Contamination....................................... 62.4.2 Release Criteria for Activated Surfaces ........................................... 62.4.3 Action Thresholds ................................................................... 7
ATTACHMENT C........................................................................................... 29Survey Unit Listing Report .......................................................................................................... 29
ATTACHMENT D........................................................................................... 32CFX Final Status Survey Designs.................................................................................................... 32
Californium Neutron Flux MultiplierFinal Status Survey Plan
NRC License: SNM-1513Docket 7001703
1 INTRODUCTION
1.1 PURPOSE
1.1.1 The purpose of this plan is to describe the Final Status Survey (FSS) which will be used todocument the final radiological condition of Kodak's facility in Rochester, NY which usedto house their Californium Neutron Flux Multiplier (CFX) system pursuant todecommissioning the facility and releasing it unconditionally from U.S. NuclearRegulatory Commission (NRC) Special Nuclear Material License SNM-1513 issued in1975.
1.2 LICENSEE IDENTIFICATION
1.2.1 The Eastman Kodak Company (EKC), whose principal address is 343 State Street,Rochester, New York 14650, holds NRC license SNM-1513 issued in 1975 for theoperation of the CFX. The license is assigned NRC docket number 7001703. The licensewas amended in 1989 (Amendment 1), in 2002 (Amendment 2), and in 2007 (Amend-ment 3). Amendment 3 was issued to permit dismantlement of the CFX and removal ofthe fuel to Savannah River. The expiration date of the current license is September 30,2008.
1.3 BACKGROUND
1.3.1 The EKC Research Facility, Building 82, was established in 1966 to provide a dedicatedresearch and development facility for conducting R&D work utilizing the CFX toinvestigate various chemical irradiations. Work with enriched uranium fuel plates in theCFX required that EKC have a Special Nuclear Materials license.
1.3.2 EKC used special nuclear material (SNM) consisting of enriched uranium clad inaluminum alloy. The sealed source material was manufactured in the form of MaterialsTesting Research (MTR)-type fuel plates which were removed from the facility inNovember, 2007 and were returned to the Department of Energy (DOE) for finaldisposition or disposal.
1.3.3 A Californium-252 (Cf-252) source supplied additional neutrons which drove the CFXassembly to a sub-critical Keff of 0.99 and supplied a steady stream of high energy andthermal neutrons for research purposes. The Californium source was licensed by the Stateof New York under Kodak's license number 1347-0255. It was permanently removed onJuly 12, 2006 and the license inventory has been altered to reflect the change.
1.3.4 EKC no longer uses the licensed material and the facility is therefore beingdecommissioned to allow for license termination and unrestricted release. EKCdecommissioning activities include removal of the CFX2, radiological surveys, removal ofany residual contamination that may be discovered, and the release of portions of propertywhere the CFX was used. When completed, the facility will meet all applicableunrestricted release criteria.
1.3.5 Decommissioning will be performed under written policies and procedures, incorporatingappropriate methods outlined in NUREG-1 7573 as required. In accordance with NUREG-1757 criteria, EKC decommissioning activities fall under the Group 3 facility requirementssince some of the surrounding materials have been activated by neutron bombardmentduring the course of normal operations.
1.3.6 The Final Status Survey will be conducted in accordance with methods outlined inNUREG-15754 (MARSSIM).
1.4 PROJECT ORGANIZATION
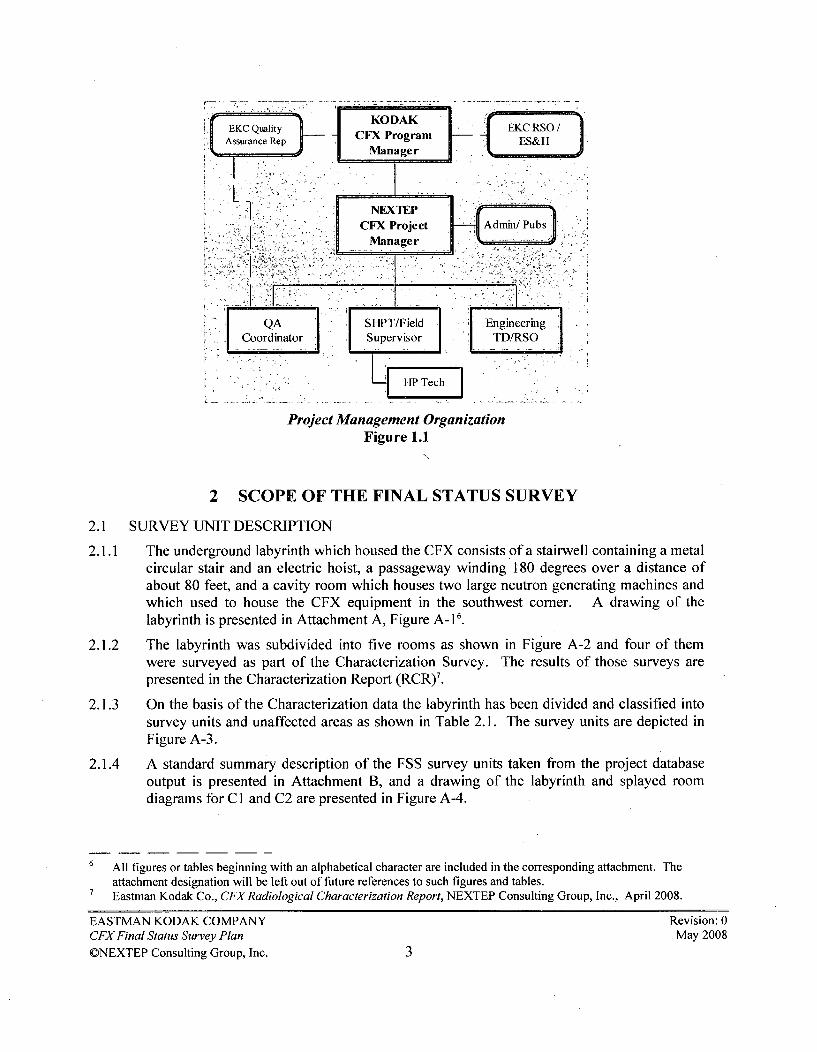
1.4.1 NEXTEP Consulting Group, Inc. (NEXTEP) has been engaged to provide technicalsupport services for the Decommissioning Project and to perform the Final Status surveysdescribed in this plan. The joint organization responsible for performing these tasks isdescribed in the Decommissioning Plan5 (DPlan) and is illustrated in Figure 1.1.
Keff is the effective neutron multiplication factor - defined as the number of neutrons in a generation divided by thenumber of neutrons in a preceding generation. Values of Kef= I indicate that a system is self sustaining, values inexcess of one indicate that a system is super-critical.
2 Performed under License Amendment 3 in November, 2007.3 In September 2003, the U.S. Nuclear Regulatory Commission (NRC) published a three-volume NUREG report,
NUREG-1757, "Consolidated NMSS Decommissioning Guidance." NUREG-1757 provides guidance on: planningand implementing license termination under the License Termination Rule (LTR) in 10 CFR Part 20, Subpart E;complying with the radiological criteria for license termination; and complying with the requirements for financialassurance and recordkeeping for decommissioning and timeliness in decommissioning of materials facilities.
4 NUREG 1575, Multi-Agency Radiatibn Survey and Site Investigation Manual. Revision1, August, 2000 with June,2001 updates.
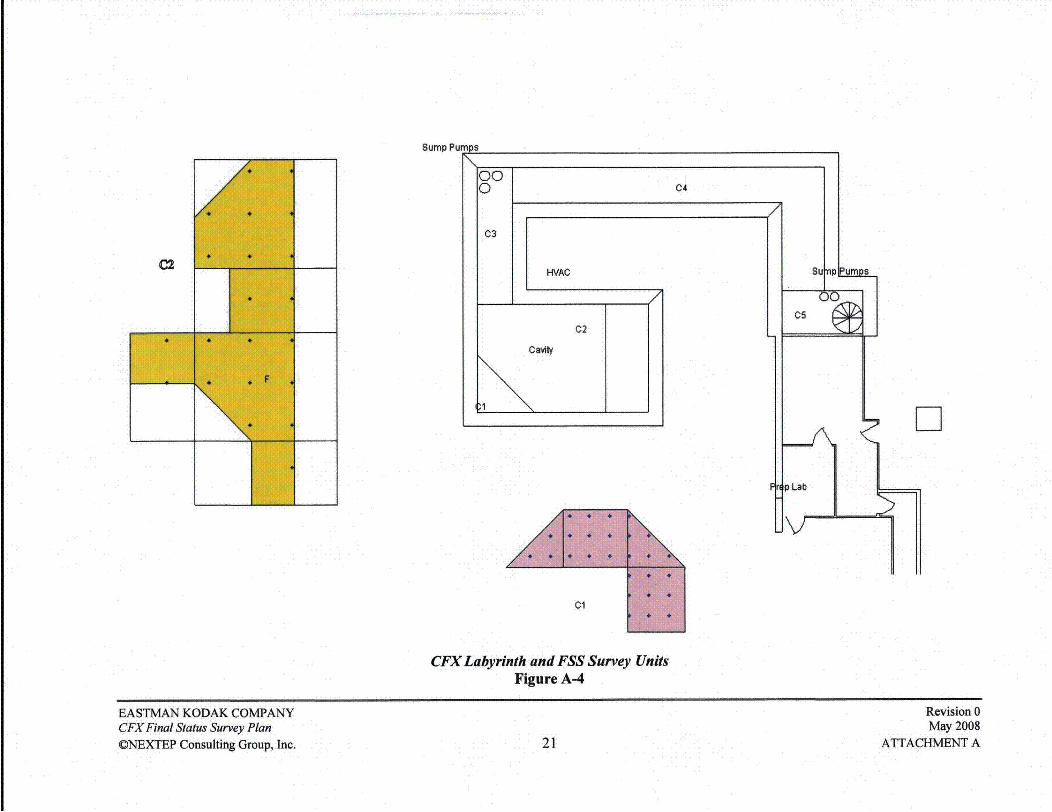
2.1.1 The underground labyrinth which housed the CFX consists of a stairwell containing a metalcircular stair and an electric hoist, a passageway winding 180 degrees over a distance ofabout 80 feet, and a cavity room which houses two large neutron generating machines andwhich used to house the CFX equipment in the southwest comer. A drawing of thelabyrinth is presented in Attachment A, Figure A-i16.
2.1.2 The labyrinth was subdivided into five rooms as shown in Figure A-2 and four of themwere surveyed as part of the Characterization Survey. The results of those surveys arepresented in the Characterization Report (RCR)7 .
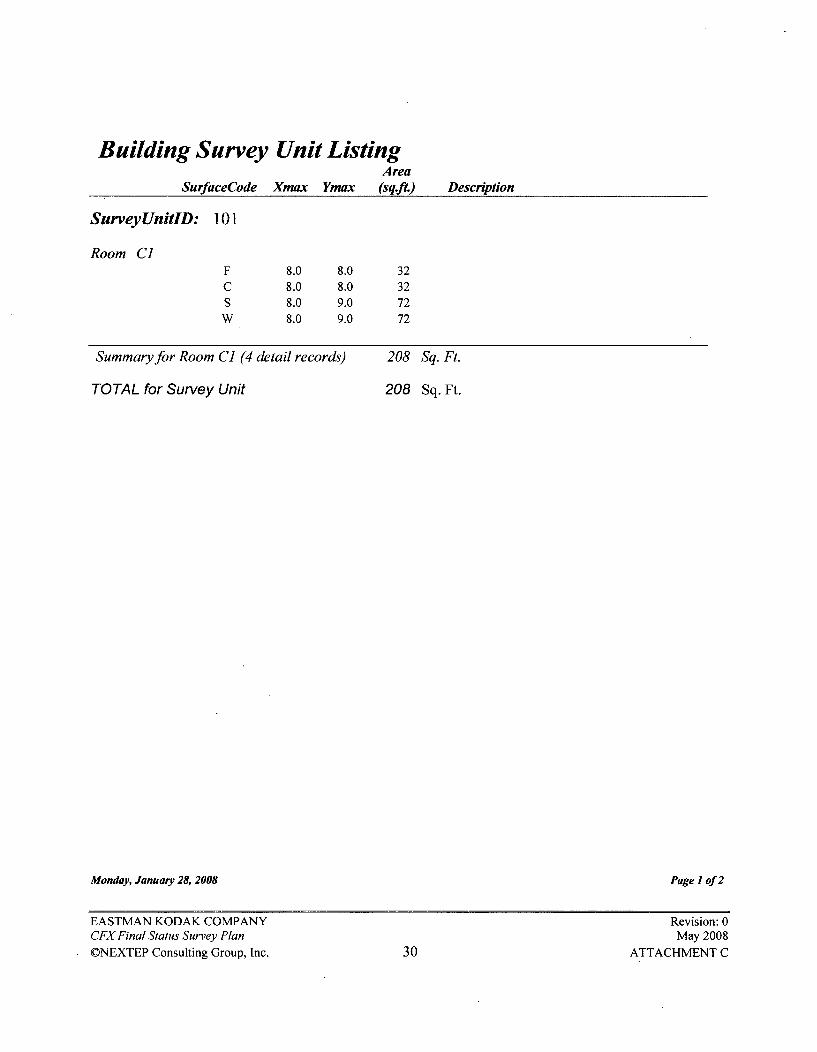
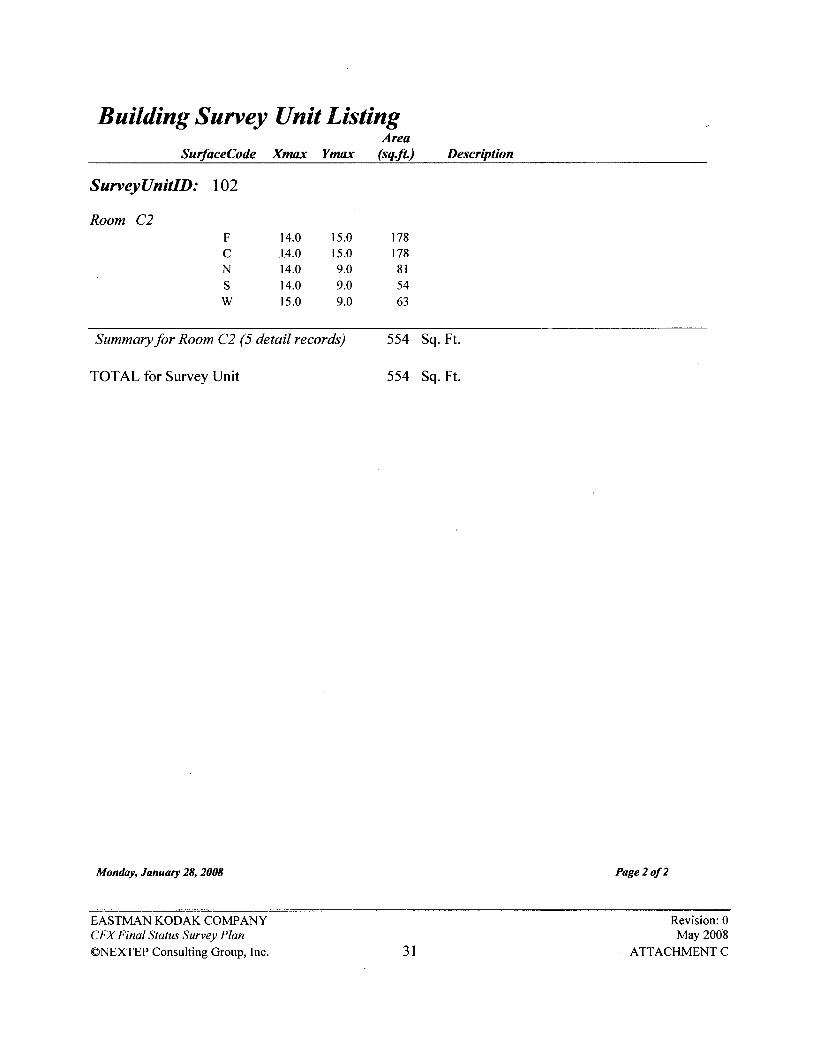
2.1.3 On the basis of the Characterization data the labyrinth has been divided and classified intosurvey units and unaffected areas as shown in Table 2.1. The survey units are depicted inFigure A-3.
2.1.4 A standard summary description of the FSS survey units taken from the project databaseoutput is presented in Attachment B, and a drawing of the labyrinth and splayed roomdiagrams for C1 and C2 are presented in Figure A-4.
6 All figures or tables beginning with an alphabetical character are included in the corresponding attachment. The
attachment designation will be left out of future references to such figures and tables.7 Eastman Kodak Co., CFXRadiological Characterization Report, NEXTEP Consulting Group, Inc., April 2008.
EASTMAN KODAK COMPANY Revision: 0CFX Final Status Survey Plan May 2008
Portion of the cavity which housed theC I CFX equipment extending 8 ft. from the 101 Class 2
corner. Includes room Cl.
Portion of the cavity room excluding 6 ft.
C2 of the eastern end which houses the 102 Class 3neutron generating machines and relatedequipment. Room C2.
C3 Labyrinth Corridor (west) Unaffected
C4 Labyrinth ICorridor (north) Unaffected
C5 Labyrinth Corridor (east) Unaffected
2.2 REPRESENTATIVE BACKGROUND REFERENCE AREAS
2.2.1 Surface Beta Background
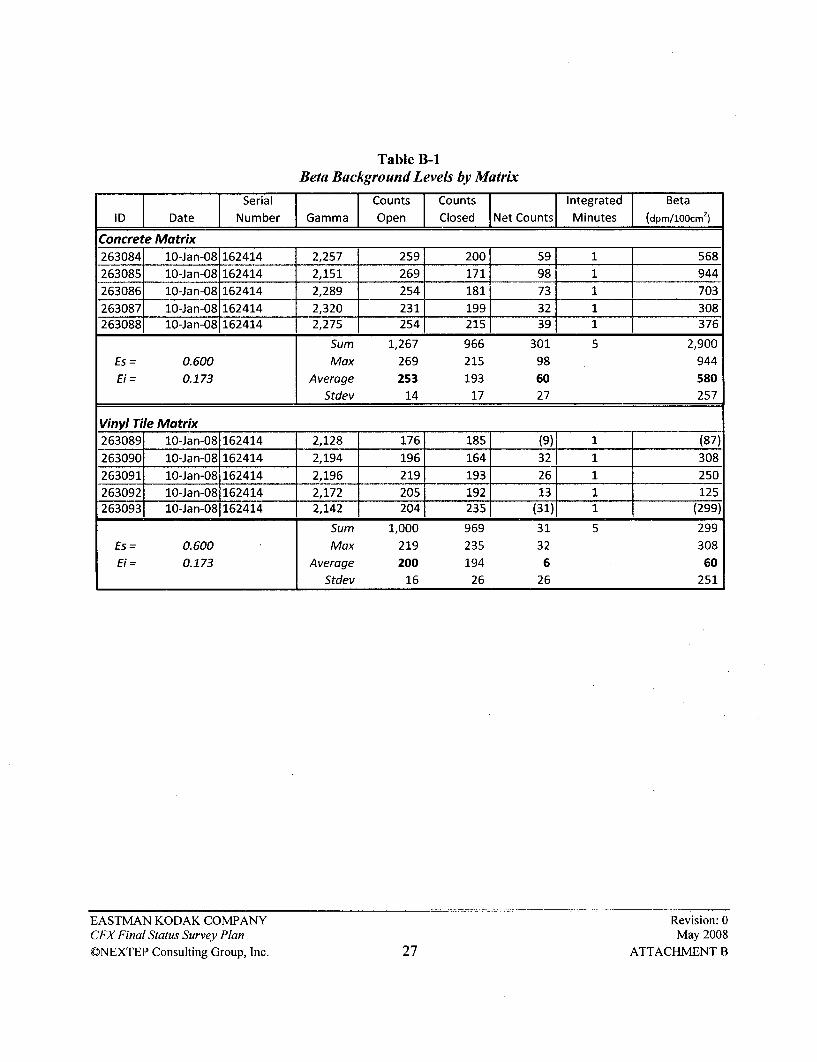
2.2.1.1 Representative background areas were selected in the control room on the basementlevel above the labyrinth. Five beta background measurements were taken on twomatrix substrates: bare concrete (C) and vinyl floor tile over concrete (VT). The dataare stored in the Radiation Database, a complete listing is presented in Table B-i, andsummarized in Table 2.2.
Table 2.2CFX Background Data
Matrix P/y Scan Beta Direct Gamma
(cpm) (dpm/1OOcm 2) (cpm)
Concrete 253 580 2,791
Vinyl Tile 200 60 N/A
2.2.1.2 Beta/gamma background for scans was computed as the average of the open windowmeasurements from the background table. These values are also included in Table 2.2.
2.2.2 Gamma Background
2.2.2.1 Gamma background was measured in the cavity during the Characterization survey inNovember, 2007. The reading was taken for one minute in the middle of room C2,and the value recorded was 3,512 cpm.
2.2.2.2 Gamma surveys taken in February after the removal of the concrete mounting padyielded an average gamma background of 2,791 cpm. A complete description of thissurvey is presented in the RCR.
2.3.1.1 NRC license SNM-1513 authorizes the possession and use of enriched U-235 in theform of MTR Type fuel plates. During the operating history of the CFX, the licensedmaterial remained in place within the CFX fuel assembly and was not disturbed. Leaktests to date indicate that no licensed material has been released from the fuel plates,and they should be considered sealed sources.
2.3.1.2 Radiological surveys performed during de-fueling operations revealed no evidence thatfuel plate handling during removal, inventory, and packaging may have generatedcontamination from the licensed material.
2.3.1.3 Contamination from licensed material, however generated, would be indicated by thepresence of licensed U-235, its natural progeny, and the products of fission producedfrom operations.
2.3.1.4 Modeling of the residual activity and fission product buildup was performed by theSCALE8 system, and is described in detail in NEXTEP Technical Memorandum (TM)05199. This analysis showed that the activity from fission products would dominate themix of any contaminants found in the CFX cavity'". Moreover, among the products offission, Sr-90, Cs-i137 and their progeny dominated by at least one order of magnitude,and were present in approximately equal quantities. Since Cs-137 and Sr-90 are bothstrong beta emitters, the primary means for detecting evidence of contamination in theFSS will be beta detection by direct measurements and scans.
2.3.2 Induced Radioactivity due to Neutron Activation
2.3.2.1 Radiological activity above background in building surfaces and equipment may alsocome from induced radioactivity caused by neutron activation. An initial theoreticalanalysis of the likely results from 30 years of activation was performed in 2005 and ispresented in TM0520". According to that analysis, it is reasonable to expect that theonly activation of significance to the FSS would be that caused within the surroundingconcrete and embedded reinforcing bars in room C I.
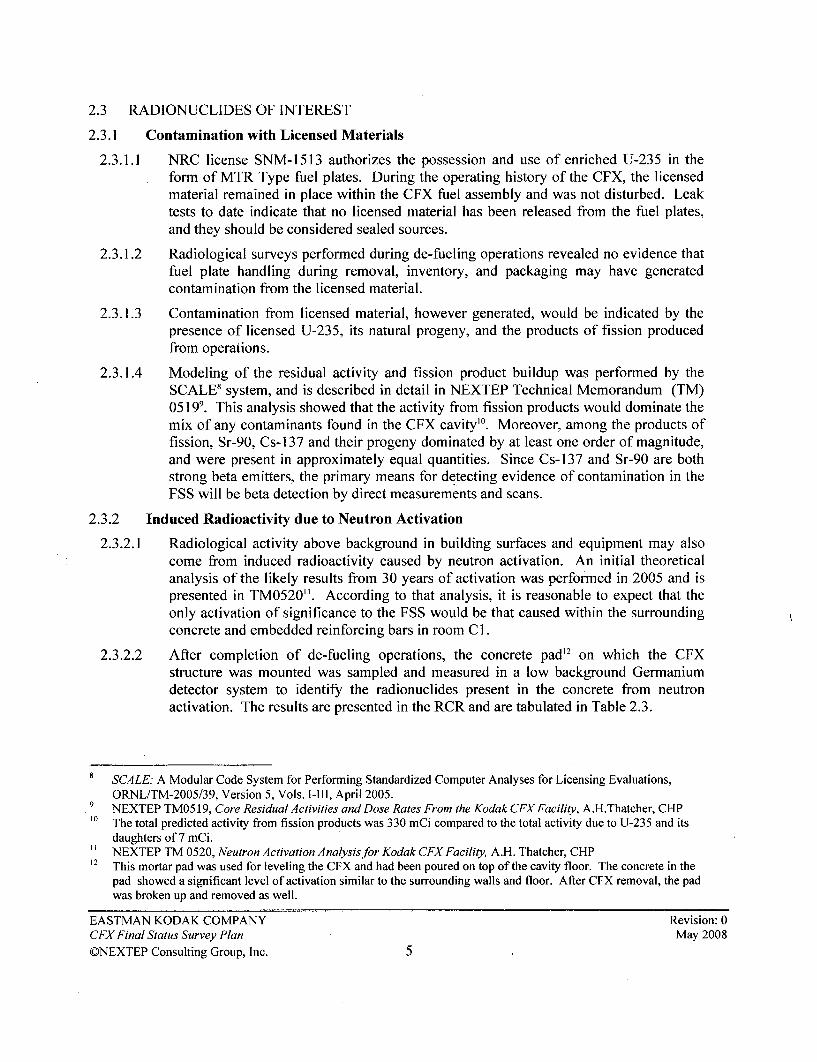
2.3.2.2 After completion of de-fueling operations, the concrete pad"2 on which the CFXstructure was mounted was sampled and measured in a low background Germaniumdetector system to identify the radionuclides present in the concrete from neutronactivation. The results are presented in the RCR and are tabulated in Table 2.3.
8 SCALE: A Modular Code System for Performing Standardized Computer Analyses for Licensing Evaluations,
ORNL/TM-2005/39, Version 5, Vols. 1-111, April 2005.9 NEXTEP TM0519, Core Residual Activities and Dose Rates From the Kodak CFXFacility, A.H.Thatcher, CHP"0 The total predicted activity from fission products was 330 mCi compared to the total activity due to U-235 and its
daughters of 7 mCi.I I NEXTEP TM 0520, Neutron Activation Analysis for Kodak CFX Facility, A.H. Thatcher, CHP12 This mortar pad was used for leveling the CFX and had been poured on top of the cavity floor. The concrete in the
pad showed a significant level of activation similar to the surrounding walls and floor. After CFX removal, the padwas broken up and removed as well.
2.3.2.3 Since all the radioisotopes shown in Table 2.3 are strong gamma emitters and, sinceactivation products in concrete would be distributed with depth and so attenuate someof the beta emissions, gamma surveys will be the primary means used to detectactivation products in the concrete surrounding the CFX (Room Cl).
2.4 RELEASE CRITERIA FOR BUILDING SURFACES & FIXED EQUIPMENT
2.4.1 Release Criteria for Surface Contamination'
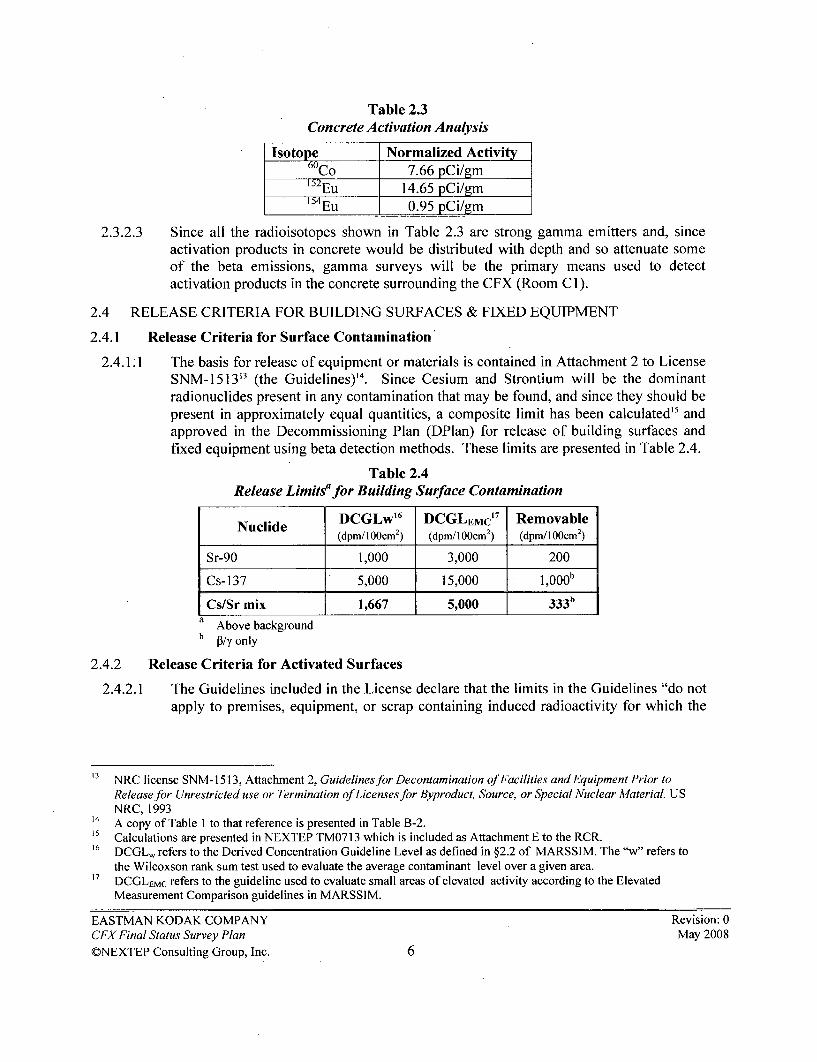
2.4.1.1 The basis for release of equipment or materials is contained in Attachment 2 to LicenseSNM-1513"3 (the Guidelines)14. Since Cesium and Strontium will be the dominantradionuclides present in any contamination that may be found, and since they should bepresent in approximately equal quantities, a composite limit has been calculated"5 andapproved in the Decommissioning Plan (DPlan) for release of building surfaces andfixed equipment using beta detection methods. These limits are presented in Table 2.4.
Table 2.4Release Limitsa for Building Surface Contamination
2.4.2.1 The Guidelines included in the License declare that the limits in the Guidelines "do notapply to premises, equipment, or scrap containing induced radioactivity for which the
NRC license SNM-1513, Attachment 2, Guidelines for Decontamination of Facilities and Equipment Prior toRelease for Unrestricted use or Termination of Licenses for Byproduct, Source, or Special Nuclear Material, USNRC, 1993
14 A copy of Table I to that reference is presented in Table B-2.15 Calculations are presented in NEXTEP TM0713 which is included as Attachment E to the RCR.16 DCGLw refers to the Derived Concentration Guideline Level as defined in §2.2 of MARSSIM. The "w" refers to
the Wilcoxson rank sum test used to evaluate the average contaminant level over a given area.DCGLEMc refers to the guideline used to evaluate small areas of elevated activity according to the Elevated
Measurement Comparison guidelines in MARSSIM.
EASTMAN KODAK COMPANY Revision: 0CFX Final Status Survey Plan May 2008
radiological considerations pertinent to their use may be different. The release of suchfacilities or items from regulatory control is considered on a case-by-case basis."
2.4.2.2 After the removal of the CFX from the cavity, the concrete pad on which it rested wascrushed and analyzed for its isotopic content."8 Release limits were developed from thisanalysis to ensure a maximum annual dose to members of the critical group of no morethan 25 mRem. The technical basis for development of the release limits andinvestigation thresholds applicable to radioactivity from neutron activated materials ispresented in TM0604' 9 which is included in Attachment D to the RCR.
2.4.2.3 The limits derived for activation products in concrete and approved in the DPlan arelisted in Table 2.5.
Table 2.5Release Limitsa for Neutron-Activated Building Surfaces
Isotope Activity(pCi/g)
Co-60 150
Eu-152 290
Eu-154 19a Above background
2.4.2.4 The release criteria for building surfaces will also be applied to fixed equipment that isnot expected to be removed. Any data measurements falling on fixed equipment weresubject to the release criteria of the underlying building surface.
2.4.3 Action Thresholds
2.4.3.1 Systematic grids of integrated (direct)2" beta and gamma readings will be taken in thecavity, along with scans which are used to confirm that neither contaminants nor smallareas of elevated induced radioactivity are present in between the grid points.
2.4.3.2 Investigation thresholds for direct beta measurements and P/7 scans were developed anddocumented in TM07132". Derivation of a gamma threshold was developed andpresented in TM080122. Details are presented in the RCR.
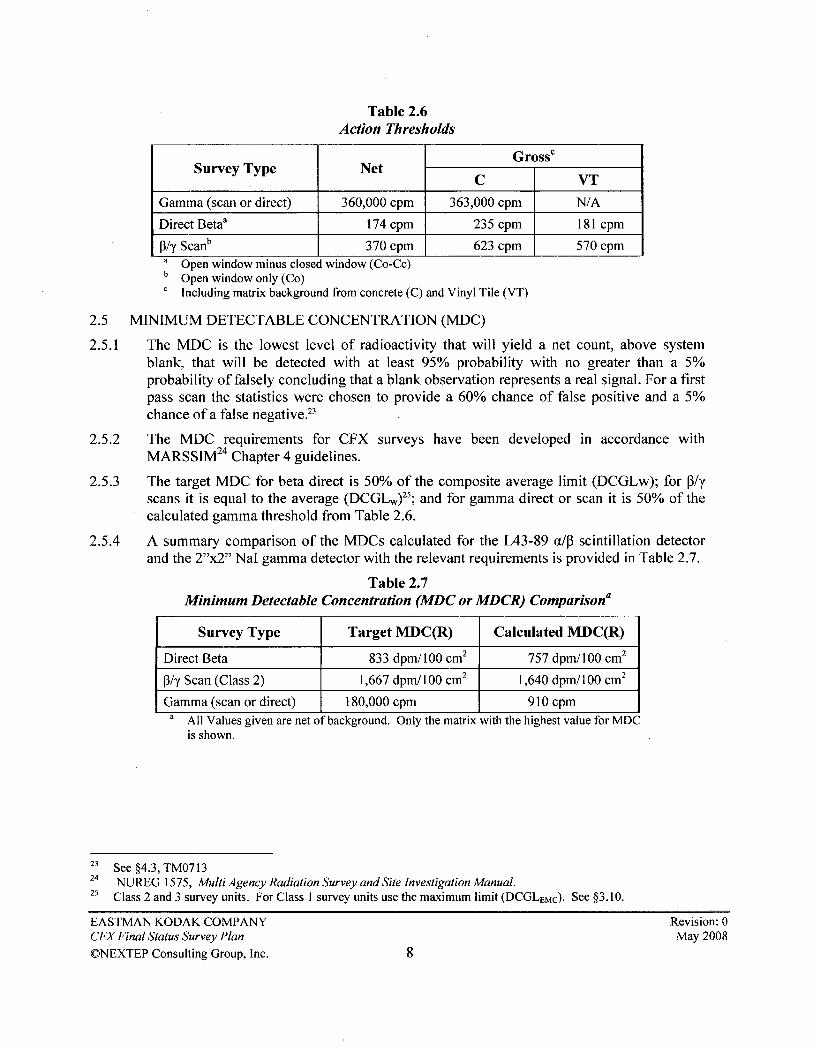
2.4.3.3 A summary of the approved action thresholds is presented in Table 2.6.
IS The activated radionuclides present in the concrete were Co-60, Eu-152 and Eu-154.
'9 NEXTEP TM0604 - Kodak CFX: Development of Release Limits for Activated Surfaces and Material, A.H.Thatcher, CHP
20 Direct beta measurements are integrated measurements taken with the detector stationary over the survey location ofinterest. Most survey measurements were integrated for 1 minute. The terms direct and integrated are usedinterchangeably throughout this plan.
Gamma (scan or direct) 360,000 cpm 363,000 cpm N/A
Direct Betaa 174 cpm 235 cpm 181 cpm
j3/y Scanb 370 cpm 623 cpm 570 cpma Open window minus closed window (Co-Cc)b Open window only (Co)C Including matrix background from concrete (C) and Vinyl Tile (VT)
2.5 MINIMUM DETECTABLE CONCENTRATION (MDC)
2.5.1 The MDC is the lowest level of radioactivity that will yield a net count, above systemblank, that will be detected with at least 95% probability with no greater than a 5%probability of falsely concluding that a blank observation represents a real signal. For a firstpass scan the statistics were chosen to provide a 60% chance of false positive and a 5%chance of a false negative. 3
2.5.2 The MDC requirements for CFX surveys have been developed in accordance withMARSSIM24 Chapter 4 guidelines.
2.5.3 The target MDC for beta direct is 50% of the composite average limit (DCGLw); for P/yscans it is equal to the average (DCGLw)25; and for gamma direct or scan it is 50% of thecalculated gamma threshold from Table 2.6.
2.5.4 A summary comparison of the MDCs calculated for the L43-89 a/P3 scintillation detectorand the 2"x2" Nal gamma detector with the relevant requirements is provided in Table 2.7.
Table 2.7Minimum Detectable Concentration (MDC or MDCR) Comparisona
Survey Type Target MDC(R) Calculated MDC(R)
Direct Beta 833 dpm/100 cm 2 757 dpm/100 cm 2
A3y Scan (Class 2) 1,667 dpm/100 cm 2 1,640 dpm!100 cm 2
Gamma (scan or direct) 180,000 cpm 910 cpma All Values given are net of background. Only the matrix with the highest value for MDC
is shown.
23 See §4.3, TM071324 NUREG 1575, Multi Agency Radiation Survey and Site Investigation Manual.25 Class 2 and 3 survey units. For Class I survey units use the maximum limit (DCGLEMC). See §3.10.
3.1.1 Operations during de-fueling and subsequently during the Characterization Survey wereconducted in accordance with the Kodak Health and Safety Plan, the NEXTEP RadiationSafety Plan and the NEXTEP Quality Management Plan. The requirements of thesegoverning documents were implemented through adherence to the project radiationprotection (RP) and quality assurance (QA) procedures. These controlling plans andprocedures used during the Characterization Survey will also be used for the FSS.
3.2 MEASUREMENTS AND INSTRUMENTATION
3.2.1 Concrete Sample Laboratory Analysis.
3.2.1.1 Isotopic analysis for activated radionuclides in the concrete surrounding the CFX willbe performed using Kodak's high purity Germanium gamma spectrometer at theRochester facility. This system is comprised of an EG&G Ortec GEM series HPGe(high-purity germanium) coaxial detector, and Canberra counting and data acquisitionmodules. Data processing is accomplished through the Canberra Genie II software.
3.2.2 Direct Beta Measurements
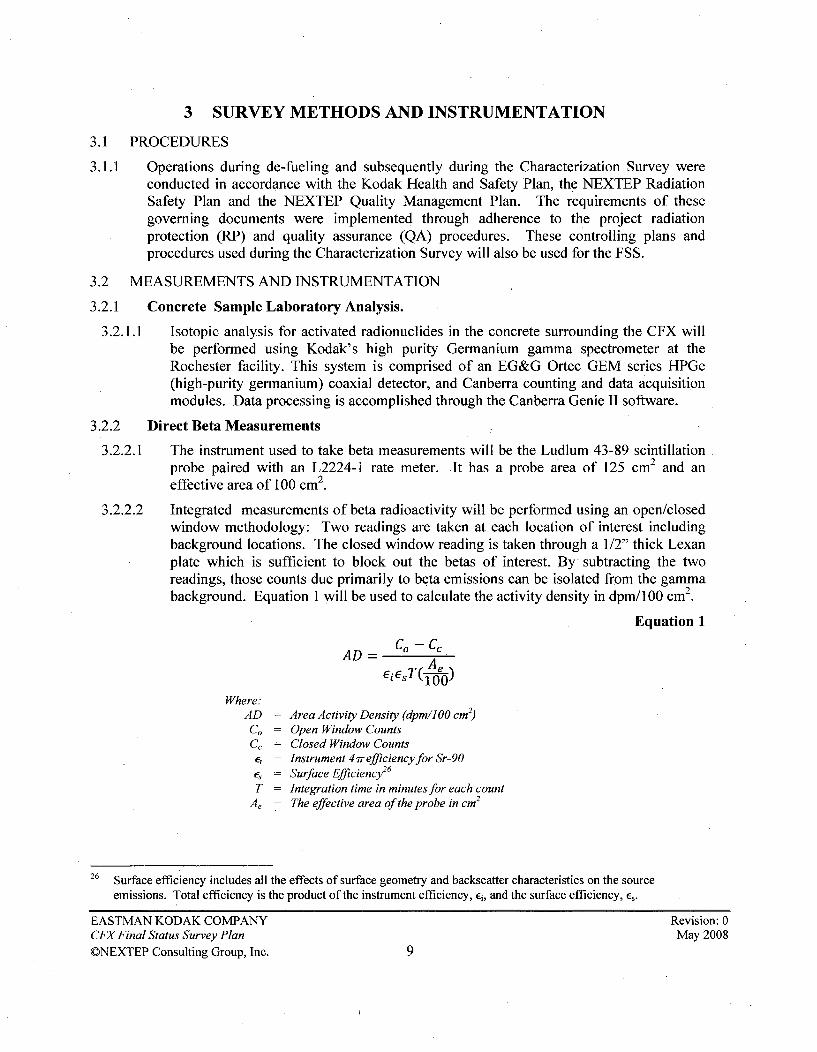
3.2.2.1 The instrument used to take beta measurements will be the Ludlum 43-89 scintillationprobe paired with an L2224-I rate meter. It has a probe area of 125 cm 2 and aneffective area of 100 cm 2.
3.2.2.2 Integrated measurements of beta radioactivity will be performed using an open/closedwindow methodology: Two readings are taken at each location of interest includingbackground locations. The closed window reading is taken through a 1/2" thick Lexanplate which is sufficient to block out the betas of interest. By subtracting the tworeadings, those counts due primarily to beta emissions can be isolated from the gamma
2background. Equation 1 will be used to calculate the activity density in dpm/l00 cm2.
Equation 1o-co
AD CA =AeEiEsT (pG-•)
Where:AD = Area Activity Density (dpm/l00 cm2)
Co = Open Window CountsC, = Closed Window Counts
ei = Instrument 47refficiencyfor Sr-90E, = Surface Efficiency
26
T = Integration time in minutes for each countAe = The effective area of the probe in cm2
26 Surface efficiency includes all the effects of surface geometry and backscatter characteristics on the source
emissions. Total efficiency is the product of the instrument efficiency, Ei, and the surface efficiency, E,.
EASTMAN KODAK COMPANY Revision: 0CFX Final Status Survey Plan May 2008
3.2.2.3 All beta measurements will be taken on either concrete or vinyl tile matrix substrates.The surface efficiency for concrete used in the Characterization Survey as an estimatefor the CFX cavity (Es = 0.60) will also be used for the FSS on all matrix materials.
3.2.2.4 Integrated beta measurements will be taken on each grid location as described inSection 3.3. Integration time will be one minute.
3.2.3 Beta-Gamma Scans
3.2.3.1 Beta-gamma scans will be performed with the same instrument and will cover aminimum of 10% of all surfaces in both survey units. Selection of the portion of eachsurface to be scanned will be left up to the HP Technician taking the survey.
3.2.3.2 Scans will be performed open window at a probe height of 0.5 cm above the surface tobe scanned. The scan speed will be approximately 5 cm/sec for the first pass. Thisyields an observation window of approximately 2 seconds.
3.2.3.3 Scan measurements will be recorded in counts per minute and compared with the scan
threshold presented in Table 2.6.
3.2.4 Gamma Measurements
3.2.4.1 A Ludlum 44-10 2"x2" Nal gamma detector probe paired with an L2221 rate meterwill be used for surveys in room C-I where activation has occurred in the concrete.The probe will be shielded by approximately 1/8" of lead. Integrated gammameasurements will be taken for one minute at each grid location where a betameasurement is made in room C-I except for the ceiling surface.
3.2.4.2 Gamma scans 27 over the activated areas will be performed to identify any isolated hotspots in the concrete. A detailed description of the activated areas on the walls andfloor of room C1 is presented in the RCR.
3.2.5 Dose Rate (pR)
3.2.5.1 1tR surveys will be taken in connection with routine radiation protection surveys usingLudlum Model 19 field instruments.
3.2.6 Removable Gross Alpha/Beta
3.2.6.1 Removable contamination will be collected using swipes counted in a TennelecSeries 5, low background, Gas Flow Proportional Alpha/Beta counting system. Aswipe sample will be collected from each MARSSIM grid location on all the surfacesin room C-I, and on the floor surface of room C-2.
3.2.7 Use of Characterization Data
3.2.7.1 Data from the Characterization Survey will be used as FSS data except in those areaswhere remediation has taken place. In such areas, the Characterization data will be
27 A much closer grid survey of integrated gamma measurements with short integration times may be used as an
equivalent to the scans. For example, the Characterization survey used the same instrument with an integrationtime of 6 seconds and a grid spacing of six inches.
EASTMAN KODAK COMPANY Revision: 0CFX Final Status Survey Plan May 2008
coded out28, and new data points will be taken to replace the old. Since the RCR doesnot show any elevated levels of radioactivity that would require remediation, all of thecharacterization data can be used for the FSS provided the limits proposed areapproved.
3.3.1.2 VSP uses the Data Quality Objective (DQO) input values to calculate the number ofmeasurement points, N, required to satisfy MARSSIM statistical guidance. The calc-ulations include excess to allow for inaccessible locations. Characterization data wereused to calculate the estimated standard deviation for each survey unit that was used inthe calculations. A summary of all the input parameters used with VSP for this report ispresented in Table 3.1.
Table 3.1VSP Inputs for CFX Survey Units
DQO SU-101 SU-102
Type I error rate 5% 5%
Type 11 error rate 5% 5%Width of Gray Region 450 dpm/1OOcm 2 400 dpm/1OOcm 2
Excess % sample points min. 12% 15%Total number of points (N) 27 21
3.3.1.3 Detailed reports describing the survey designs for each survey unit are presented inAttachment D. Each survey design report shows a Decision Performance GoalDiagram (DPGD) which indicates the power of the survey design based upon theaverage survey value in the FSS data. Comparison of these diagrams with the meanvalues from the Characterization data sets shows that the means will fall well below thelower bound of the gray region (LBGR).
3.3.1.4 A rectangular grid was used for both survey designs. The maximum grid intervalspacing, L, was calculated from the total area of each survey unit, A, and the minimum
28 Remediated data are not actually removed from the database. The records are coded with an "R" to signify that they
do not apply to current conditions. In this way it is possible to recreate the data set as it existed before theremediation, if necessary.
required number of data points, n, according to Equation 2, and the maximum griddimensions are given in Table 3.2.
Equation 2
Table 3.2Calculated Grid Point Separation
Survey Unit Class n A (ft2) L (in)
SU-101 2 24 208 35
SU-102 3 18 554 66
3.3.1.5 Integrated beta measurements will be collected at each point on the grid in both SU's.
3.3.1.6 Swipe samples will be processed for each grid point falling on all the surfaces of roomC I and on the floor of room C2.
3.3.1.7 One minute integrated gamma readings will be obtained at all grid points in room C-1except on the ceiling.
3.3.2 Bias Measurement Locations
3.3.2.1 Bias direct measurements will be taken at the discretion of the HP technicianperforming the survey.
3.3.3 Reference Coordinate System
3.3.3.1 A unified reference system was prescribed for the location of all data points taken on allbuilding surfaces and fixed equipment during the Characterization Survey. The samecoordinate system will be used for the FSS.
3.3.3.2 A data point's unique location is specified by a combination of the following dataelements: building, room, surface ID, X, and Y. The surface ID refers to the four walls,floor, ceiling and roof as shown in Table 3.3. X and Y are distances from the originmeasured as shown in the table. An example of X and Y axes for floors and walls ispresented in Figure A-5.
Table 3.3Coordinate System Locators
Location Identifier X YNorth Wall N Feet right from Feet up from floorSouth Wall S leftmost edge of or the lowest pointEast Wall E the wall surface in the roomWest Wall WFloor F Feet east from Feet North ofCeiling C western most edge southernmost edgeRoof R of the surface
EASTMAN KODAK COMPANY Revision: 0CFX Final Status Survey Plan May 2008ONEXTEP Consulting Group, Inc. 12
3.4 DATA EVALUATION
3.4.1 All of the direct, swipe and scan data will be entered into the Kodak CFX RadiationDatabase (RDB) for easy access and analysis. The direct beta measurements are theprimary means for documenting the surveys for licensed contamination. Within thedatabase, a special Threshold Comparison Test Report (TCTR) has been programmed toperform the tests specified in MARSSIM, and to provide a clear report of the results forevaluation. The calculations in this report have been validated and verified as described inTM023 130.
3.4.2 The purpose of the screening software is to compare each direct beta reading taken in thesurvey unit with specified threshold levels, to apply the statistical tests called for inMARSSIM when appropriate, and to present the results in a clear and useful manner so thatan analyst can accurately assess the action to be taken or declare that the survey unit meetsthe requirements for release. Although the TCTR and related tests have been presented inthe RCR, they are repeated here for reference.
3.4.3 Some of the screening tests apply to each record in the survey unit and failure of one datapoint results in failure of the survey unit. Other tests do not apply to each survey record butgenerate a single PASS/FAIL verdict for the entire data set. The tests are described in thefollowing paragraphs. An abbreviated summary of these tests is presented in Table 3.4.
3.4.4 Background Screen
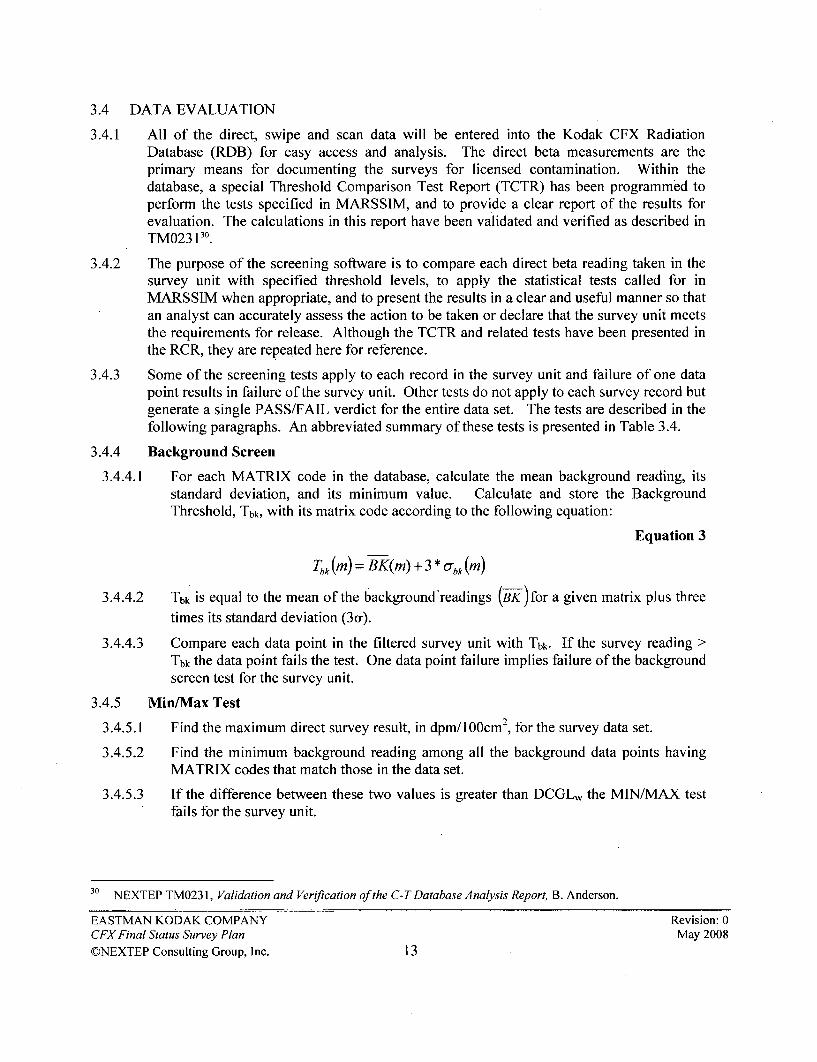
3.4.4.1 For each MATRIX code in the database, calculate the mean background reading, itsstandard deviation, and its minimum value. Calculate and store the BackgroundThreshold, Tbk, with its matrix code according to the following equation:
Equation 3
Tbk (m) = BK(m) + 3 * bk (m)
3.4.4.2 Tbk is equal to the mean of the background'readings (B-K!)for a given matrix plus three
times its standard deviation (3a-).
3.4.4.3 Compare each data point in the filtered survey unit with Tbk. If the survey reading >Tbk the data point fails the test. One data point failure implies failure of the backgroundscreen test for the survey unit.
3.4.5 Min/Max Test
3.4.5.1 Find the maximum direct survey result, in dpm/100cm2, for the survey data set.
3.4.5.2 Find the minimum background reading among all the background data points havingMATRIX codes that match those in the data set.
3.4.5.3 If the difference between these two values is greater than DCGLw the MIN/MAX testfails for the survey unit.
30 NEXTEP TM023 1, Validation and Verification of the C-T Database Analysis Report, B. Anderson.
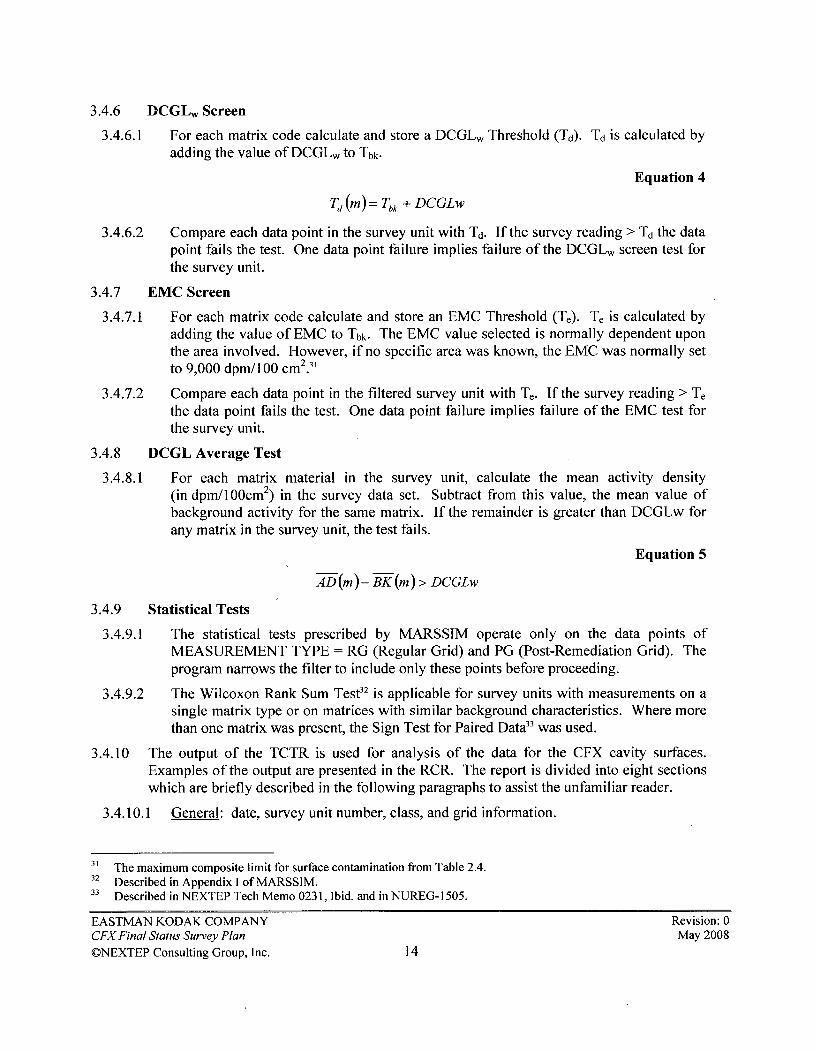
3.4.6.1 For each matrix code calculate and store a DCGLw Threshold (Td). Td is calculated byadding the value of DCGLw to Tbk.
Equation 4
T, (m)i Tbk + DCGLw
3.4.6.2 Compare each data point in the survey unit with Td. If the survey reading > Td the datapoint fails the test. One data point failure implies failure of the DCGLw screen test forthe survey unit.
3.4.7 EMC Screen
3.4.7.1 For each matrix code calculate and store an EMC Threshold (Te). Te is calculated byadding the value of EMC to Tbk. The EMC value selected is normally dependent uponthe area involved. However, if no specific area was known, the EMC was normally setto 9,000 dpm/100 cm 2.3,
3.4.7.2 Compare each data point in the filtered survey unit with T,. If the survey reading > T,the data point fails the test. One data point failure implies failure of the EMC test forthe survey unit.
3.4.8 DCGL Average Test
3.4.8.1 For each matrix material in the survey unit, calculate the mean activity density(in dpm/1 00cm2) in the survey data set. Subtract from this value, the mean value ofbackground activity for the same matrix. If the remainder is greater than DCGLw forany matrix in the survey unit, the test fails.
Equation 5
AD(m)- BK(m) > DCGLw
3.4.9 Statistical Tests
3.4.9.1 The statistical tests prescribed by MARSSIM operate only on the data points ofMEASUREMENT TYPE = RG (Regular Grid) and PG (Post-Remediation Grid). Theprogram narrows the filter to include only these points before proceeding.
3.4.9.2 The Wilcoxon Rank Sum Test32 is applicable for survey units with measurements on asingle matrix type or on matrices with similar background characteristics. Where morethan one matrix was present, the Sign Test for Paired Data33 was used.
3.4.10 The output of the TCTR is used for analysis of the data for the CFX cavity surfaces.Examples of the output are presented in the RCR. The report is divided into eight sectionswhich are briefly described in the following paragraphs to assist the unfamiliar reader.
3.4.10.1 General: date, survey unit number, class, and grid information.
31 The maximum composite limit for surface contamination from Table 2.4.32 Described in Appendix I of MARSSIM.33 Described in NEXTEP Tech Memo 0231, Ibid. and in NUREG-1505.
EASTMAN KODAK COMPANY Revision: 0CFX Final Status Survey Plan May 2008
3.4.10.2 Survey Unit Table: building surfaces included, fixed equipment (if any), and totalsurface area of the survey unit.
3.4.10.3 Initialization Data: On startup of the TCTR report program, the analyst must tell theprogram which parameters to use while running the tests described in this section. TheInitialization Data section of the report output displays the options that were chosen forthe run. The measurement types listed are those chosen by the analyst to be included inthe report. The date range chosen is also listed. The default value is "All Dates".Values for DCGLw and DCGLEMc are also specified at the start of the run and arelisted in this section. If remediated data points are included in the run, it will be notedin this section. Normally they will be excluded.
3.4.10.4 Survey Unit Test Status: Lists Pass/Fail status of all tests and gives a high level
summary of key activity levels in the SU.
3.4.10.5 Points that failed tests: Lists all points that failed each specified threshold test (EMC,DCGL, and Background).
3.4.10.6 Points that passed all the tests: This includes the remainder of all the points in the dataset. These data points have passed all the tests.
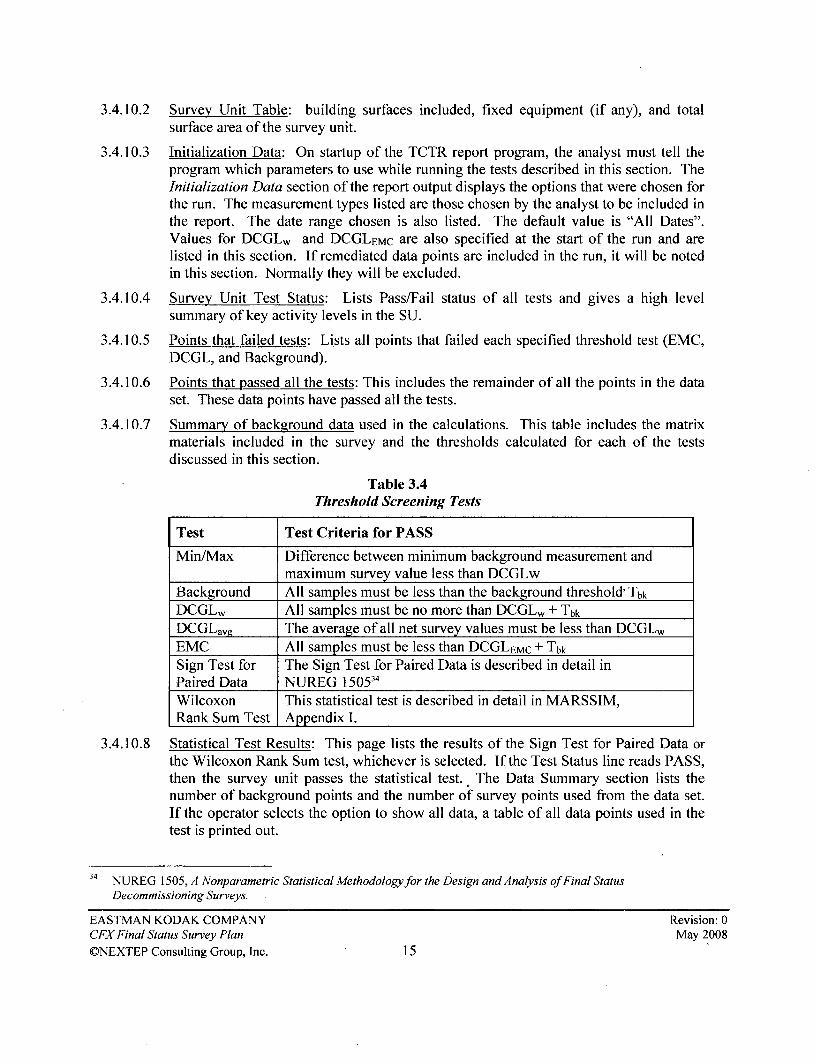
3.4.10.7 Summary of background data used in the calculations. This table includes the matrixmaterials included in the survey and the thresholds calculated for each of the testsdiscussed in this section.
Table 3.4Threshold Screening Tests
Test Test Criteria for PASS
Min/Max Difference between minimum background measurement andmaximum survey value less than DCGLw
Background All samples must be less than the background threshold' Tbk
DCGLw All samples must be no more than DCGLw + TbkDCGLavg The average of all net survey values must be less than DCGLwEMC All samples must be less than DCGLEMC + Tbk
Sign Test for The Sign Test for Paired Data is described in detail inPaired Data NUREG 150514
Wilcoxon This statistical test is described in detail in MARSSIM,Rank Sum Test Appendix I.
3.4.10.8 Statistical Test Results: This page lists the results of the Sign Test for Paired Data orthe Wilcoxon Rank Sum test, whichever is selected. If the Test Status line reads PASS,then the survey unit passes the statistical test. The Data Summary section lists thenumber of background points and the number of survey points used from the data set.If the operator selects the option to show all data, a table of all data points used in thetest is printed out.
14 NUREG 1505, A Nonparametric Statistical Methodology for the Design and Analysis of Final StatusDecommissioning Surveys.
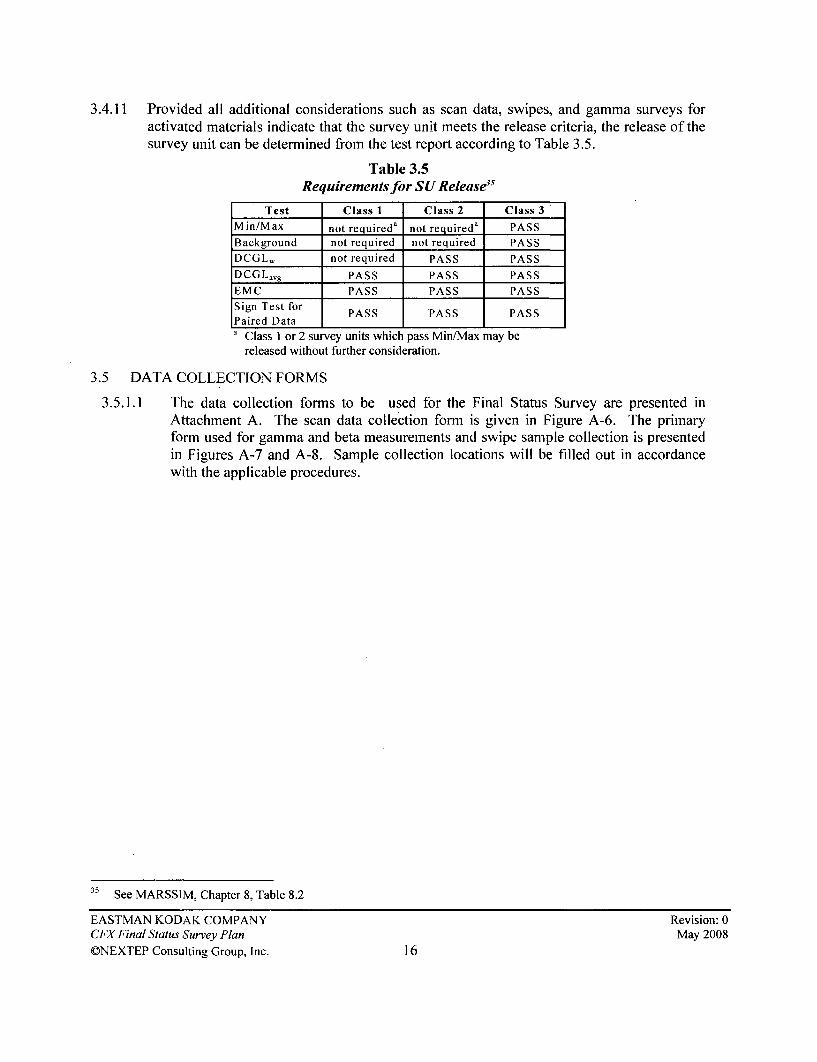
3.4.11 Provided all additional considerations such as scan data, swipes, and gamma surveys foractivated materials indicate that the survey unit meets the release criteria, the release of thesurvey unit can be determined from the test report according to Table 3.5.
Table 3.5Requirements for SU Release"5
Test Class I Class 2 Class 3
Min/Max not requireda not requireda PASS
Background not required not required PASS
DCGL, not required PASS PASS
DCGLavg PASS PASS PASS
EMC PASS PASS PASS
Sign Test for PASS PASS PASSPaired Data I I
Class 1 or 2 survey units which pass Min/Max may bereleased without further consideration.
3.5 DATA COLLECTION FORMS
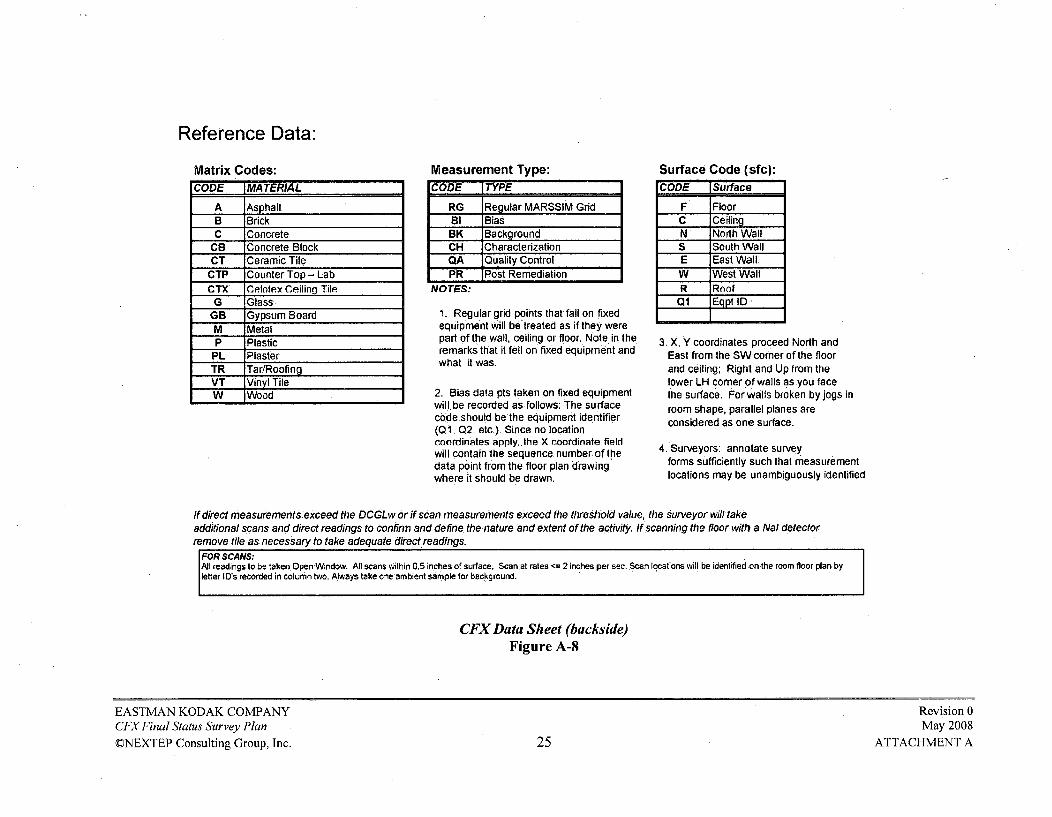
3.5.1.1 The data collection forms to be used for the Final Status Survey are presented inAttachment A. The scan data collection form is given in Figure A-6. The primaryform used for gamma and beta measurements and swipe sample collection is presentedin Figures A-7 and A-8. Sample collection locations will be filled out in accordancewith the applicable procedures.
BK BackgroundCH CharacterizationQA Quality ControlPR Post Remediation
NOTES:
1. Regular grid points that fall on fixedequipment will be treated as if they werepart of the wall, ceiling or floor. Note in theremarks that it fell on fixed equipment andwhat it was.
2. Bias data pts taken on fixed equipmentwill, be recorded as follows: The surfacecode should bethe equipment identifier(Q1, Q2, etc.). Since no locationcoordinates apply,,the X coordinate fieldwill contain the sequence numberof thedata point from the floor plan drawingwhere it should be drawn.
Surface Code (sfc):CODE lSurface
F FloorC CeilingN North WallS South WallE East Wall,
W West WallR Ronf
Q1 Eqpt ID.
3. X, Y coordinates proceed North andEastfrom the SW corner of the floorand ceiling; Right and Up from thelower LH comer of walls as you facethe surface. For walls broken by jogs inroom shape, parallel planes areconsidered as one surface.
4. Surveyors: annotate surveyforms sufficiently such that measurementlocations may be unambiguously identified
If direct measurements.exceed the DCGLw or if scan measurements exceed the threshold value, the surveyor will takeadditional scans and direct readings to confirm and define the nature and extent of the activity. If scanning the floor with a Nal detectorremove tile as necessary to take adequate direct readings.
FOR SCANS:All readings to be taken Open Window. All scans within 0.5 inches of surface. Scan at rates <= 2 inches per sec. Scan locations will be identified on the room floor plan byletter ID's recorded in column two. Always take one ambient sample for background.
Beta-gamma-emitters 5000 dpm by/100 15,000 dpm b/100 1000 dpmby/100 cm2(nuclides with decay modes cm2 cm2other than alpha emission orspontaneous fission) exceptSr-90 and others noted above.
(1) Where surface contamination by both alpha- and beta-gamma-emitting nuclides exists, the limitsestablished for alpha- and beta-gamma-emitting nuclides should apply independently.
(2) As used in this table, dpm (disintegrations per minute) means the rate of emission by radioactivematerial as determined by correcting the counts per minute observed by an appropriate detector forbackground, efficiency, and geometric factors associated with the instrumentation.
(3) Measurements of average contaminant should not be averaged over more than 1 square meter. Forobjects of less surface area, the average should be derived for each such object.
(4) The maximum contamination level applies to an area of not more than 100 cm2.
(5) The amount of removable radioactive material per 100 cm2 of surface area should be determined bywiping that area with dry filter or soft absorbent paper, applying moderate pressure, and assessing theamount of radioactive material on the wipe with an appropriate instrument of known efficiency. Whenremovable contamination on objects of less surface area is determined, the pertinent levels should bereduced proportionally and the entire surface should be wiped.
(6) The average and maximum radiation levels associated with surface contamination resulting from beta-gamma-emitters should not exceed 0.2 mrad/hr at 1 cm and 1.0 mrad/hr at 1 cm, respectively, measuredthrough not more than 7 milligrams per square centimeter of total absorber.
Systematic sampling locations for comparing a median with a fixed threshold(nonparametric - MARSSIM)
SummaryThis report summarizes the sampling design used, associated statistical assumptions, as well as generalguidelines for conducting post-sampling data analysis. Sampling plan components presented here includehow many sampling locations to choose and where within the sampling area to collect those samples. Thetype of medium to sample (i.e., soil, groundwater, etc.) and how to analyze the samples (in-situ, fixedlaboratory, etc.) are addressed in other sections of the sampling plan.
The following table summarizes the sampling design developed. A figure that shows sampling locations inthe field and a table that lists sampling location coordinates are also provided below.
SUMMARY OF SAMPLING DESIGNPrimary Objective of Design Compare a site mean or median to a fixed thresholdType of Sampling Design NonparametricSample Placement (Location) Systematic with a random start locationin the FieldWorking (Null) Hypothesis The median(mean) value at the site
exceeds the thresholdFormula for calculating Sign Test - MARSSIM versionnumber of sampling locationsCalculated total number of samples 27Number of samples on map a 27Number of selected sample areas 1Specified sampling area c 29952.00 in2Size of grid / Area of grid cell a 2.77555 feet / 7.7037 ft2Grid pattern SquareAnalyses per sample 1
a This number may differ from the calculated number because of 1) grid edge effects, 2) adding judgmentsamples, or 3) selecting or unselecting sample areas.b The number of selected sample areas is the number of colored areas on the map of the site. These sampleareas contain the locations where samples are collected.
The sampling area is the total surface area of the selected colored sample areas on the map of the site.d Size of grid / Area of grid cell gives the linear and square dimensions of the grid used to systematically place
samples.
Primary Sampling ObjectiveThe primary purpose of sampling at this site is to compare a site median or mean value with a fixed threshold.The working hypothesis (or 'null' hypothesis) is that the median(mean) value at the site is equal to or exceedsthe threshold. The alternative hypothesis is that the median(mean) value is less than the threshold. VSPcalculates the number of samples required to reject the null hypothesis in favor of the alternative one, given aselected sampling approach and inputs to the associated equation.
Selected Sampling ApproachA nonparametric systematic sampling approach with a random start was used to determine the number ofsamples and to specify sampling locations. A nonparametric formula was chosen because the conceptualmodel and historical information (e.g., historical data from this site or a very similar site) indicate that typicalparametric assumptions may not be true.
Both parametric and non-parametric equations rely on assumptions about the population. Typically, however,non-parametric equations require fewer assumptions and allow for more uncertainty about the statisticaldistribution of values at the site. The trade-off is that if the parametric assumptions are valid, the requirednumber of samples is usually less than if a non-parametric equation was used.
Locating the sample points over a systematic grid with a random start ensures spatial coverage of the site.Statistical analyses of systematically collected data are valid if a random start to the grid is used. Onedisadvantage of systematically collected samples is that spatial variability or patterns may not be discovered ifthe grid spacing is large relative to the spatial patterns.
0W 1~ .. 1 C. f .*f~ 1 xtap#
C _
Ii- Ow
ft* *Nh.d wfrh~ &' )n* x3I
a -52-t- V
Number of Total Samples: Calculation Equation and InputsThe equation used to calculate the number of samples is based on a Sign test (see PNNL 13450 fordiscussion). For this site, the null hypothesis is rejected in favor of the alternative one if the median(mean) issufficiently smaller than the threshold. The number of samples to collect is calculated so that if the inputs tothe equation are true, the calculated number of samples will cause the null hypothesis to be rejected.
The formula used to calculate the number of samples is:
_ (Zl _ +Z)
4(SignP-0.5)2
Where:
EASTMAN KODAK COMPANYCFX Final Status Survey Plan
CNEXTEP Consulting Group, Inc.
Revision: 0May 2008
ATTACHMENT DSU-101
34
1~~~
ArS+2
+$2• S rtyt
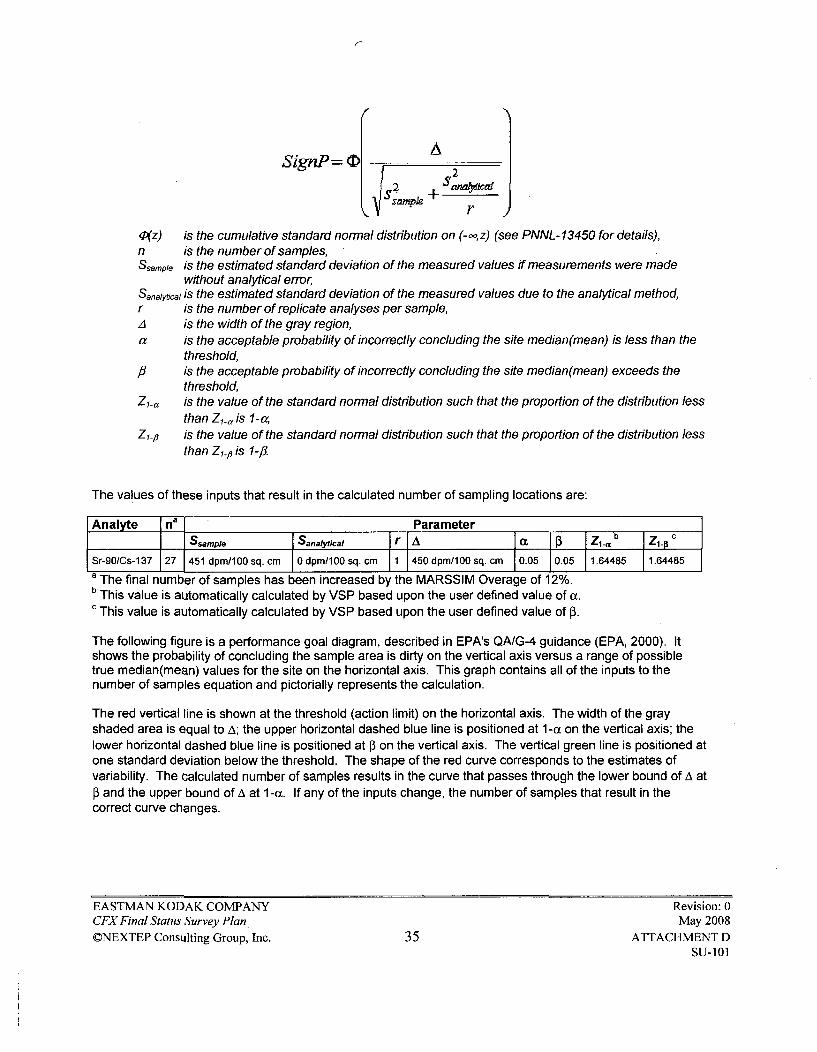
O(z) is the cumulative standard normal distribution on (-oo, z) (see PNNL-13450 for details),n is the number of samples,Ssanple is the estimated standard deviation of the measured values if measurements were made
without analytical error,Sanalytical is the estimated standard deviation of the measured values due to the analytical method,r is the number of replicate analyses per sample,A is the width of the gray region,a is the acceptable probability of incorrectly concluding the site median(mean) is less than the
threshold,#f is the acceptable probability of incorrectly concluding the site median(mean) exceeds the
threshold,ZI-1 is the value of the standard normal distribution such that the proportion of the distribution less
than Zj_ is 1-o,Zlp is the value of the standard normal distribution such that the proportion of the distribution less
than Zjp is 1-f.
The values of these inputs that result in the calculated number of sampling locations are:
Analyte n a ParameterSsample Sanalytcal r IA Ia a Zl_. b Zl, c
Sr-90/Cs-137 27 451 dpm/100 sq. cm Odpm/100 sq. cm 1 450 dpm/100 sq. cm 0.05 0.05 1.64485 1.64485
a The final number of samples has been increased by the MARSSIM Overage of 12%.b This value is automatically calculated by VSP based upon the user defined value of (.'This value is automatically calculated by VSP based upon the user defined value of a.
The following figure is a performance goal diagram, described in EPA's QA/G-4 guidance (EPA, 2000). Itshows the probability of concluding the sample area is dirty on the vertical axis versus a range of possibletrue median(mean) values for the site on the horizontal axis. This graph contains all of the inputs to thenumber of samples equation and pictorially represents the calculation.
The red vertical line is shown at the threshold (action limit) on the horizontal axis. The width of the grayshaded area is equal to A; the upper horizontal dashed blue line is positioned at 1-a on the vertical axis; thelower horizontal dashed blue line is positioned at P3 on the vertical axis. The vertical green line is positioned atone standard deviation below the threshold. The shape of the red curve corresponds to the estimates ofvariability. The calculated number of samples results in the curve that passes through the lower bound of A atf0 and the upper bound of A at 1-a. If any of the inputs change, the number of samples that result in thecorrect curve changes.
11111 I I I I I - Ii. I I•••`;:`F``•F`•i7 `•``` ` ;`••• • •?`IIII ,',I' ,Ir I',' , ', '''',700 800 000 1000 1100 1200 1300 1400 1500 1600 1700 1800 1900 2000 2100
True Sr-90/Cs-137 Mean or Median (dpm/100 sq. cm)
Statistical AssumptionsThe assumptions associated with the formulas for computing the number of samples are:1. the computed sign test statistic is normally distributed,2. the variance estimate, S2 , is reasonable and representative of the population being sampled,3. the population values are not spatially or temporally correlated, and4. the sampling locations will be selected probabilistically.The first three assumptions will be assessed in a post data collection analysis. The last assumption is validbecause the gridded sample locations were selected based on a random start.
This report was automatically produced* by Visual Sample Plan (VSP) software version 5.1.1.Software and documentation available at http://dqo.pnL gov/vspSofhvare copyright (c) 2008 Battelle Memorial Institute. All rights reserved.* - The report contents have been modified or reformatted by the end-user.
EASTMAN KODAK COMPANYCFX Final Status Survey Plan
ONEXTEP Consulting Group, Inc.
Revision: 0May 2008
36 ATTACHMENT DSU-101
KODAK CFX Final Status Survey DesignSU-102
Systematic sampling locations for comparing a median with a fixed threshold(nonparametric - MARSSIM)
SummaryThis report summarizes the sampling design used, associated statistical assumptions, as well as generalguidelines for conducting post-sampling data analysis. Sampling plan components presented here includehow many sampling locations to choose and where within the sampling area to collect those samples. Thetype of medium to sample (i.e., soil, groundwater, etc.) and how to analyze the samples (in-situ, fixedlaboratory, etc.) are addressed in other sections of the sampling plan.
The following table summarizes the sampling design developed. A figure that shows sampling locations inthe field and a table that lists sampling location coordinates are also provided below.
SUMMARY OF SAMPLING DESIGNPrimary Objective of Design Compare a site mean or median to a fixed thresholdType of Sampling Design NonparametricSample Placement (Location) Systematic with a random start locationin the FieldWorking (Null) Hypothesis The median(mean) value at the site
exceeds the thresholdFormula for calculating Sign Test - MARSSIM versionnumber of sampling locationsCalculated total number of samples 21Number of samples on map a 21Number of selected sample areas 1Specified sampling area c 79776.01 inLSize of grid / Area of grid cellW7 5.87158 feet /34.4754 ftzGrid pattern SquareAnalyses per sample 1Total cost of sampling e $11,500.00
a This number may differ from the calculated number because of 1) grid edge effects, 2) adding judgment.samples, or 3) selecting or unselecting sample areas.b The number of selected sample areas is the number of colored areas on the map of the site. These sampleareas contain the locations where samples are collected.' The sampling area is the total surface area of the selected colored sample areas on the map of the site.d Size of grid/Area of grid cell gives the linear and square dimensions of the grid used to systematically place
samples.e Including measurement analyses and fixed overhead costs. See the Cost of Sampling section for anexplanation of the costs presented here.
Primary Sampling ObjectiveThe primary purpose of sampling at this site is to compare a site median or mean value with a fixed threshold.The working hypothesis (or 'null' hypothesis) is that the median(mean) value at the site is equal to or exceedsthe threshold. The alternative hypothesis is that the median(mean) value is less than the threshold. VSPcalculates the number of samples required to reject the null hypothesis in favor of the alternative one, given aselected sampling approach and inputs to the associated equation.
rTru Meýan m Medlan o= Ption tevel (Pem Sde is DMty
r, Trii'Mean am Me&.a c= Pot .Len dee (Porie Se: I Clan)
F&ts Retedron Rate ($that 5
1!False Aocplece Rat. (MelY.: F
Wdth f GreI Vm . 1fta) F dWao1Csoq as
AenL~e (DtE GLw) F1_F _dPm1 ua sq or
Estesotd SaepfegStdDv F319- dprm/100tsq cm
EA-mted f,0eet-1e StdYev
kapeepr SamleW ý ~
M Mmm 6s ý Giot eptsn..Se,-veylk 18 %15~ 21
(F L
Selected Sampling ApproachA nonparametric systematic sampling approach with a random start was used to determine the number ofsamples and to specify sampling locations. A nonparametric formula was chosen because the conceptualmodel and historical information (e.g., historical data from this site or a very similar site) indicate that typicalparametric assumptions may not be true.
Both parametric and non-parametric equations rely on assumptions about the population. Typically, however,non-parametric equations require fewer assumptions and allow for more uncertainty about the statisticaldistribution of values at the site. The trade-off is that if the parametric assumptions are valid, the requirednumber of samples is usually less than if a non-parametric equation was used.
Locating the sample points over a systematic grid with a random start ensures spatial coverage of the site.Statistical analyses of systematically collected data are valid if a random start to the grid is used. Onedisadvantage of systematically collected samples is that spatial variability or patterns may not be discovered ifthe grid spacing is large relative to the spatial patterns.
Number of Total Samples: Calculation Equation and InputsThe equation used to calculate the number of samples is based on a Sign test (see PNNL 13450 fordiscussion). For this site, the null hypothesis is rejected in favor of the alternative one if the median(mean) issufficiently smaller than the threshold. The number of samples to collect is calculated so that if the inputs tothe equation are true, the calculated number of samples will cause the null hypothesis to be rejected.
The formula used to calculate the number of samples is:
4(SignP- 0.5) 2
where
ASignP= (D
S2 S___
O(z) is the cumulative standard normal distribution on (- z) (see PNNL- 13450 for details),n is the number of samples,Ssan,p/e is the estimated standard deviation of the measured values if measurements were made
without analytical error,SanaiyticaI is the estimated standard deviation of the measured values due to the analytical method,r is the number of replicate analyses per sample,A is the width of the gray region,a is the acceptable probability of incorrectly concluding the site median(mean) is less than the
threshold,18 is the acceptable probability of incorrectly concluding the site median(mean) exceeds the
threshold,Zi_• is the value of the standard normal distribution such that the proportion of the distribution less
than Zi.,, is 1-a;Z1./• is the value of the standard normal distribution such that the proportion of the distribution less
than Zj.# is 1-fl
Note: MARSSIM suggests that the number of samples should be increased by at least 20% to account formissing or unusable data and uncertainty in the calculated value of n. VSP allows a user-supplied percentoverage as discussed in MARSSIM (EPA 2000, p. 5-33).
The values of these inputs that result in the calculated number of sampling locations are:
Analyte na ParameterSsample SanalyticaI r A Ia I -Zla b Z1_0 C
Sr-90/Cs-137 21 319 dpm/100 sq. cm 0 dpm/100 sq. cm 1 400 dpm/100 sq. cm 0.05 0.05 1.64485 1.64485a The final number of samples has been increased by the MARSSIM Overage of 15%.b This value is automatically calculated by VSP based upon the user defined value of a.c This value is automatically calculated by VSP based upon the user defined value offl.
The following figure is a performance goal diagram, described in EPA's QA/G-4 guidance (EPA, 2000). Itshows the probability of concluding the sample area is dirty on the vertical axis versus a range of possibletrue median(mean) values for the site on the horizontal axis. This graph contains all of the inputs to thenumber of samples equation and pictorially represents the calculation.
The red vertical line is shown at the threshold (action limit) on the horizontal axis. The width of the grayshaded area is equal to A; the upper horizontal dashed blue line is positioned at 1-(x on the vertical axis; the
lower horizontal dashed blue line is positioned at P3 on the vertical axis. The vertical green line is positioned atone standard deviation below the threshold. The shape of the red curve corresponds to the estimates ofvariability. The calculated number of samples results in the curve that passes through the lower bound of A at3and the upper bound of A at 1-a. If any of the inputs change, the number of samples that result in thecorrect curve changes.
MARSSIM Sign Testn=21 al a5% beta.5% std dev.319
t -- -- - - -
0.9-
0.8\-
0.7-
C
0.6-
0.2-
L 0.i4-
_E
= 0.2-IU. 0.1-
1000 1050 1100 1150 1200 1250 1300 1350 1400 1450 1500 1550 1600 1680 1700 1750 1800 1650 1900 1950True Sr-90Cs-137 Mean or Median (dpm/100 sq. cm)
Statistical AssumptionsThe assumptions associated with the formulas for computing the number of samples are:1. the computed sign test statistic is normally distributed,2. the variance estimate, S2, is reasonable and representative of the population being sampled,3. the population values are not spatially or temporally correlated, and4. the sampling locations will be selected probabilistically.The first three assumptions will be assessed in a post data collection analysis. The last assumption is validbecause the gridded sample locations were selected based on a random start.
This report was automatically produced* by Visual Sample Plan (VSP) software version 5. 1.1.Software and documentation available at http:l/dqo.pnl.govlvspSoftware copyright (c) 2008 Battelle Memorial Institute. All rights reserved.* - The report contents have been modified or reformatted by the end-user.
EASTMAN KODAK COMPANYCFX Final Status Survey PlanONEXTEP Consulting Group, Inc.