+ All Categories
Home > Documents > Final Stormwater Management Report - City of...

Final Stormwater Management Report - City of...

Date post: 07-Feb-2019
Category:
Upload: phungthuan
View: 259 times
Download: 0 times
Share this document with a friend
150
233 JANEFIELD AVENUE Final Stormwater Management Report Project Location: 233 Janefield Avenue Guelph, Ontario Prepared for: Rockwater Incorporated 256 King Street North Waterloo, ON N2J 4T9 Prepared by: MTE Consultants Inc. 520 Bingemans Centre Drive Kitchener, ON N2B 3X9 April 28, 2017 MTE File No.: 39540-200
Transcript

233 JANEFIELD AVENUE

Final

Stormwater Management Report

Project Location: 233 Janefield Avenue

Guelph, Ontario

Prepared for: Rockwater Incorporated 256 King Street North

Waterloo, ON N2J 4T9

Prepared by: MTE Consultants Inc.

520 Bingemans Centre Drive Kitchener, ON N2B 3X9

April 28, 2017

MTE File No.: 39540-200

\\mte85.local\mte\Proj_Mgmt\39540\200\Reports\MTE Reports\SWM\39540-200_2017-04-28_SWM Report.doc

TABLE OF CONTENTS

1.0 INTRODUCTION ................................................................................................... 1

2.0 CRITERIA ............................................................................................................. 1

3.0 METHODOLOGY .................................................................................................. 1

4.0 STORMWATER MANAGEMENT ......................................................................... 2

4.1 Catchment Parameters ...................................................................................... 2 4.2 Water Quantity – Modeling Results .................................................................... 5 4.3 Water Quality Control ......................................................................................... 6 4.4 Water Balance Analysis ..................................................................................... 6 4.5 Erosion & Sediment Control ............................................................................... 7

5.0 CONCLUSIONS AND RECOMMENDATIONS ..................................................... 8

FIGURES FIGURE 1.0 PRE-DEVELOPMENT CATCHMENT AREA ........................................ 3

FIGURE 2.0 POST-DEVELOPMENT CATCHMENT AREAS ................................... 4

TABLES

TABLE 4.1 CATCHMENT PARAMETERS ............................................................. 2 TABLE 4.2 STAGE-STORAGE-DISCHARGE INFORMATION .............................. 5 TABLE 4.3 SUMMARY OF FLOWS ....................................................................... 6

APPENDICES APPENDIX A CALCULATIONS APPENDIX B MIDUSS OUTPUT APPENDIX C GEOTECHNICAL INVESTIGATION APPENDIX D WATER BALANCE ANALYSIS

\\mte85.local\mte\Proj_Mgmt\39540\200\Reports\MTE Reports\SWM\39540-200_2017-04-28_SWM Report.doc

DRAWINGS

Removals Plan MTE Drawing No. 39540-C1.1 ................................................................................. Encl. Site Grading and SWM Plan MTE Drawing No. 39540-C2.1 ................................................................................. Encl. Site Servicing Plan MTE Drawing No. 39540-C2.2 ................................................................................. Encl. Details and Notes Plan MTE Drawing No. 39540-C2.3 ................................................................................. Encl.

Final Stormwater Management Report -1- MTE File No.: 39540-200 233 Janefield Avenue April 28, 2017

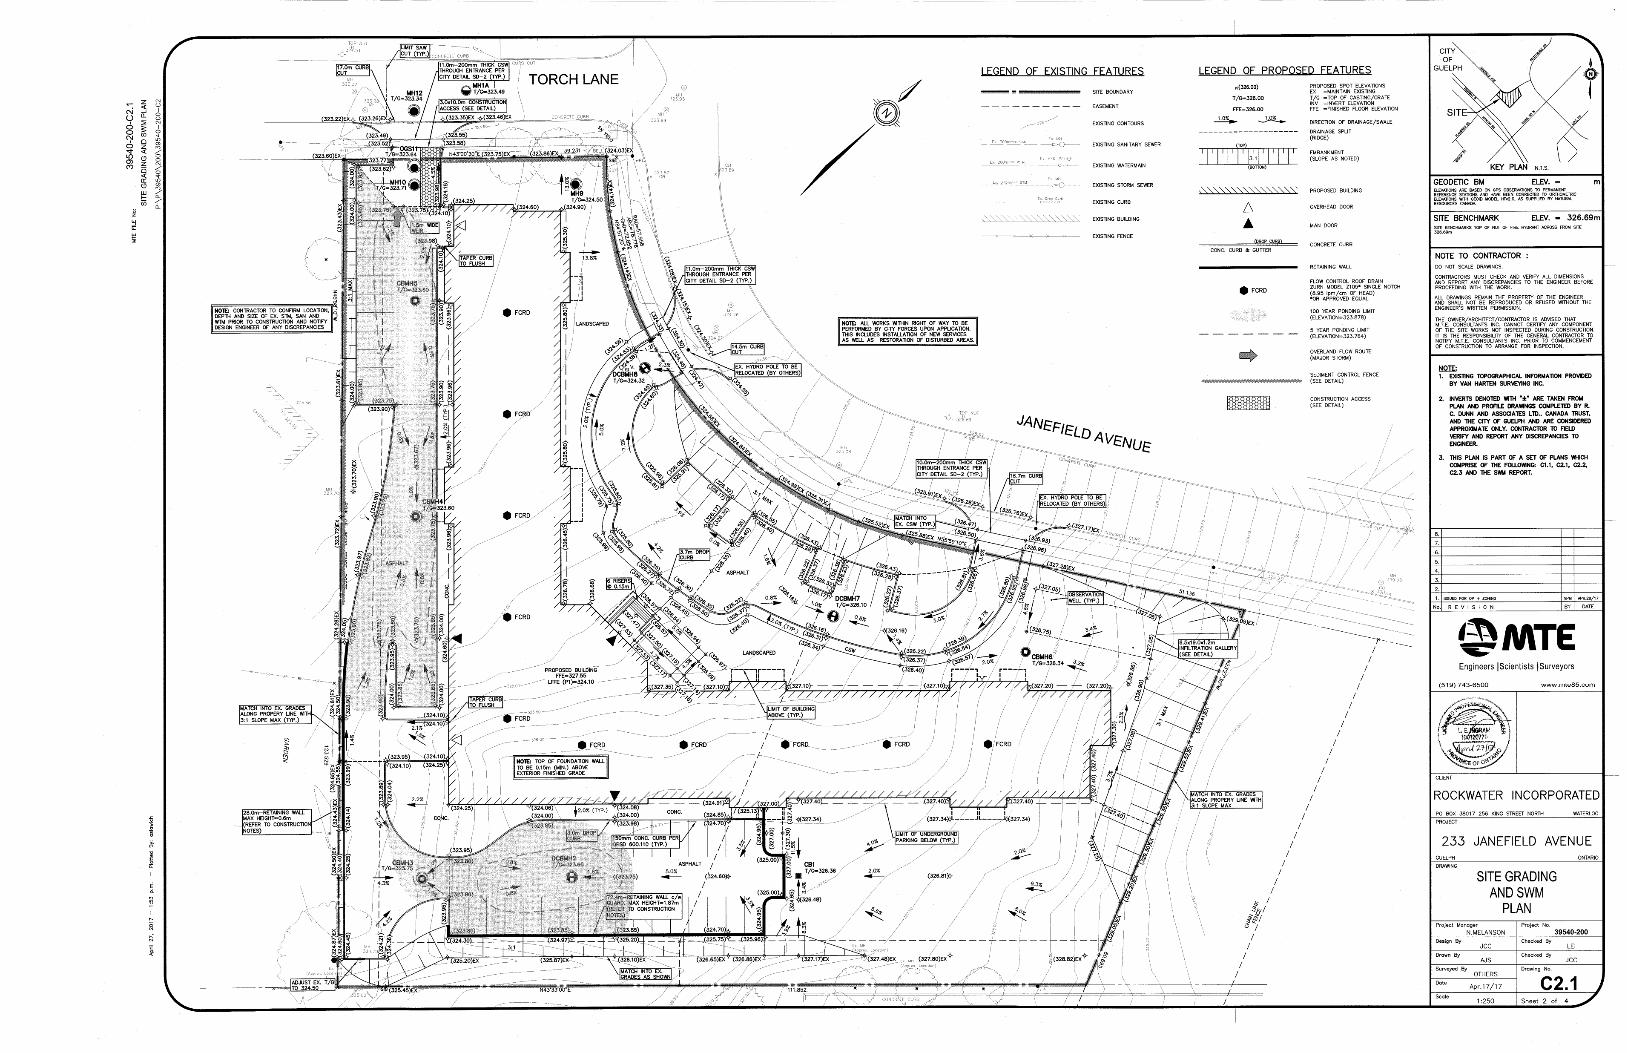
1.0 INTRODUCTION MTE Consultants Inc. was retained by Rockwater Incorporated to complete the stormwater management design for the proposed building to be constructed at 233 Janefield Avenue in the City of Guelph. The site is located south west of the intersection of Scottsdale Drive and Janefield Avenue. The property is bounded to the north by Torch Lane and Janefield Avenue, to the east by a Hydro One easement and to the south and west by existing development. For exact location of the site refer to the key plan located on the enclosed engineering drawings. The proposed development for the site is the construction of a building complete with below and at grade parking, drive aisles and landscaped areas. This report addresses the stormwater management requirements set forth by the City of Guelph and proposes a design which meets the requirements for the site. The grading, servicing and stormwater management details for the site are illustrated on the enclosed MTE engineering drawings, 39540-C2.1, C2.2 and C2.3.

2.0 CRITERIA

The stormwater management design criteria for the subject site, as established by the City of Guelph, are as follows:

i) Attenuation of the post-development peak flows for the 2, 5, 10, 25, 50 and 100 year storm events to the pre-development (existing) peak flows;

ii) Implementation of Level 2 (70% TSS removal) water quality controls; and

iii) Implementation of infiltration on-site to maintain or enhance groundwater recharge.

3.0 METHODOLOGY In order to successfully complete the stormwater management design for this site, the following specific tasks were undertaken:

i) Calculated the allowable runoff rates using MIDUSS NET;

ii) Determined the percent impervious of the site and catchment parameters for inclusion in MIDUSS modeling;

iii) Calculated post-development runoff hydrographs using MIDUSS NET; and

iv) Revised the site grades to attain the required storage for runoff control.

Final Stormwater Management Report -2- MTE File No.: 39540-200 233 Janefield Avenue April 28, 2017

4.0 STORMWATER MANAGEMENT

4.1 Catchment Parameters The following table summarizes the catchments used in the modeling of the site. The post development condition was separated into three catchment areas: the building area, the controlled area and the uncontrolled area. Figure 1.0 illustrates the limits of the pre-development catchment area. Figure 2.0 illustrates the limits of the post development catchment areas. The majority of the Hydro One easement to the east drains towards the site, and so has been included in both the pre and post development catchment areas.

TABLE 4.1 - CATCHMENT PARAMETERS

# Catchment Area (ha)

% Impervious

Pervious CN

Impervious CN

Slope (%)

Flow Length

(m)

Pre-Development Catchment Areas

101 Grass Area 1.189 0 75 98 4.0 130.0

Post Development Catchment Areas

201 Building Area 0.297 100 75 98 1.5 15.0

202 Controlled Area 0.808 44.9 75 98 2.0 25.0

203 Uncontrolled Area 0.084 6.0 75 98 10.0 6.0

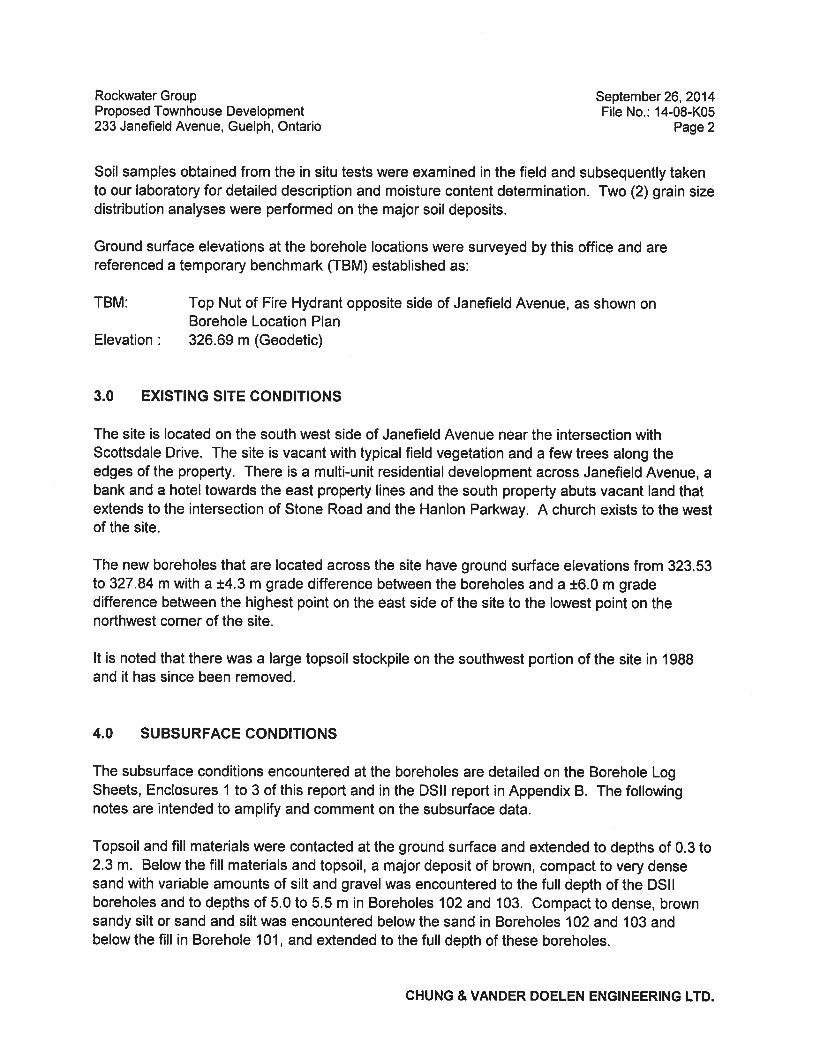
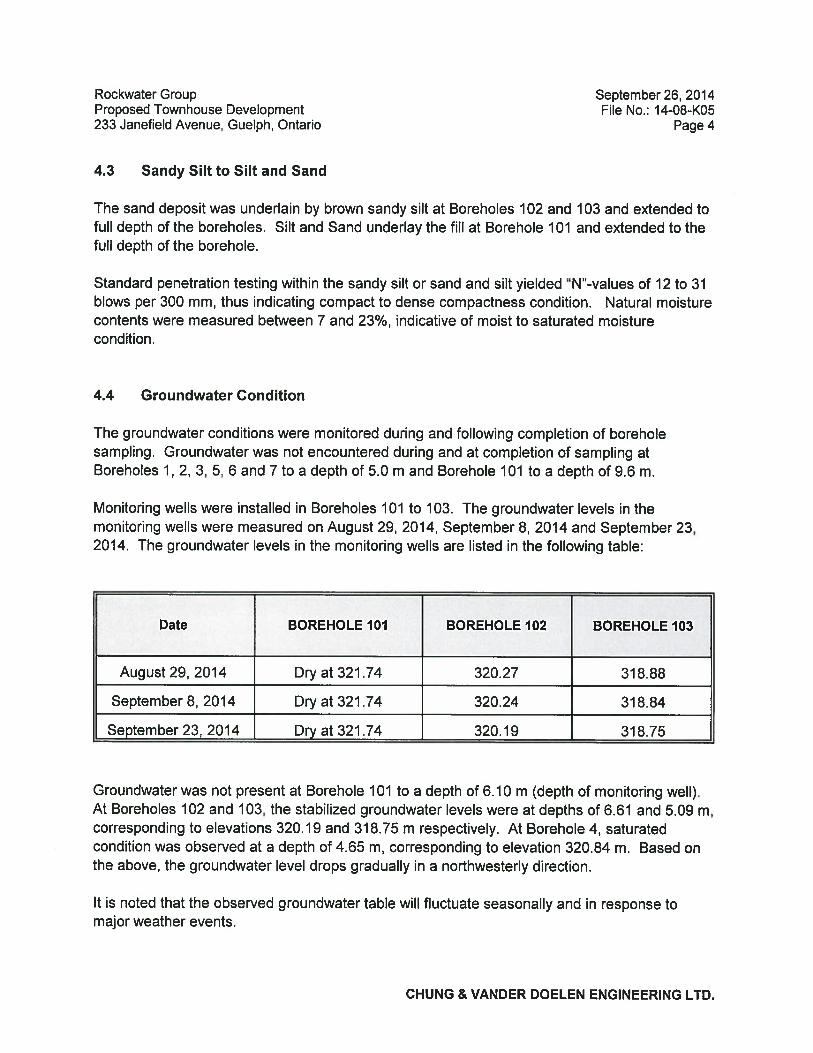
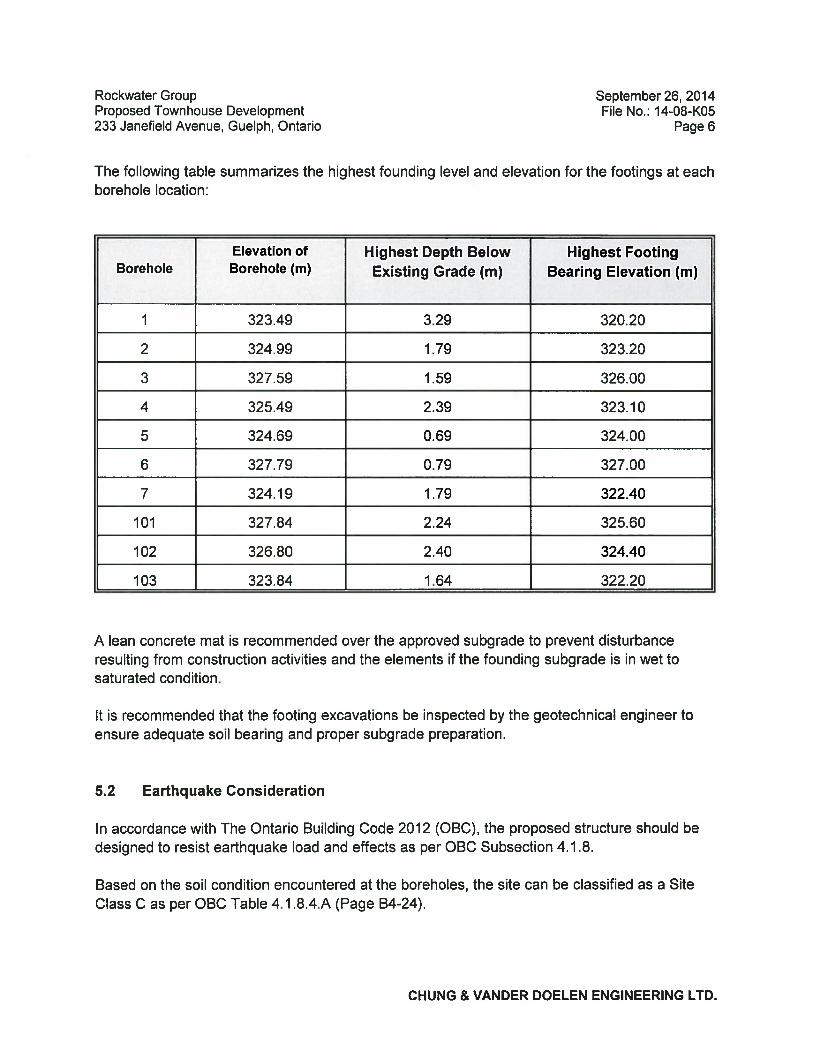
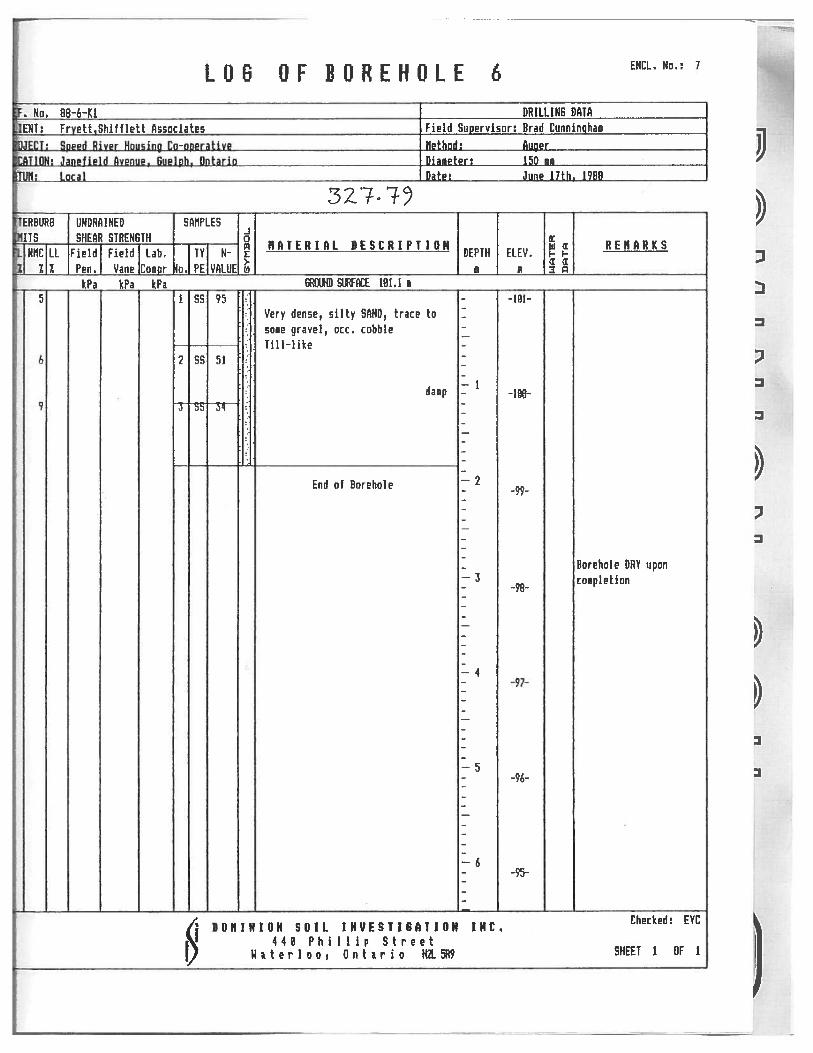
A geotechnical investigation was undertaken by Chung & Vander Doelen Engineering Ltd. and is dated September 26, 2014. A complete copy of their report is included in Appendix C for the City’s records. The investigation revealed the site is primarily underlain by sandy silt and silty sand. Therefore, a pervious CN of 75 for grass areas is appropriate. Refer to the enclosed report for details regarding the groundwater table elevation.

FIGURE 1.0 APR.26/171:750

39540-200

1010.131

1011.189

FIGURE 2.0 APR.26/171:750

39540-200

2010.131

2010.297

2020.808

2030.084

Final Stormwater Management Report -5- MTE File No.: 39540-200 233 Janefield Avenue April 28, 2017

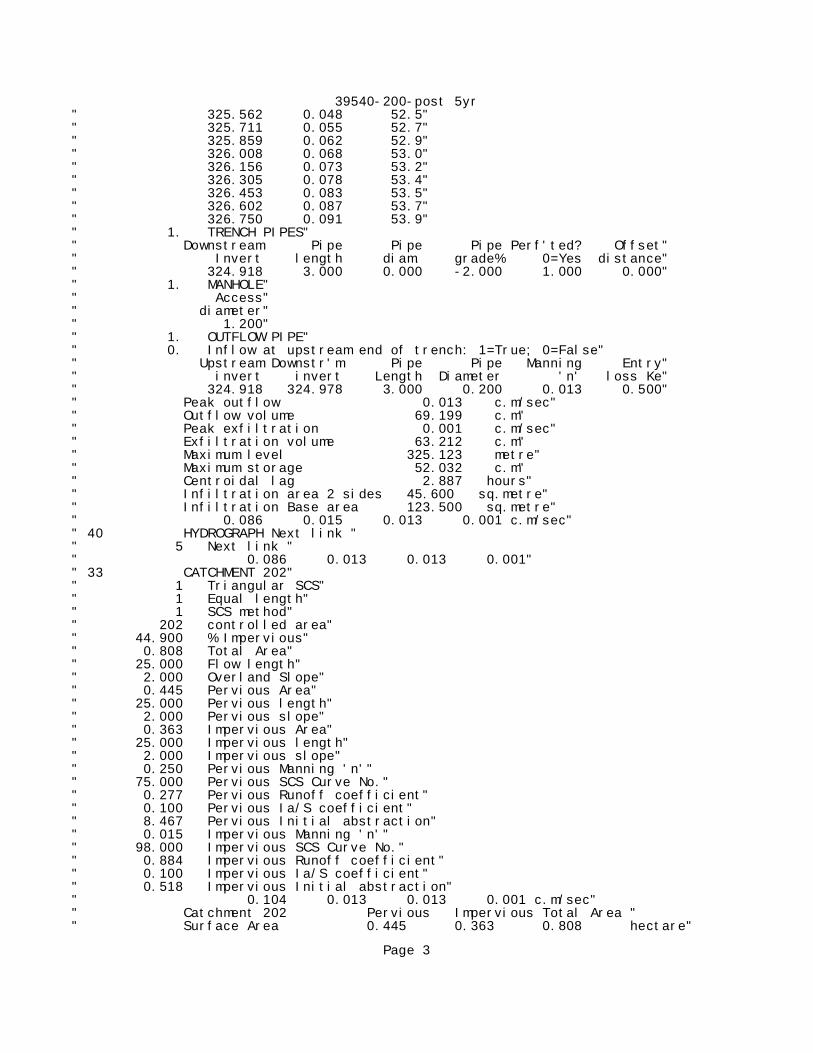
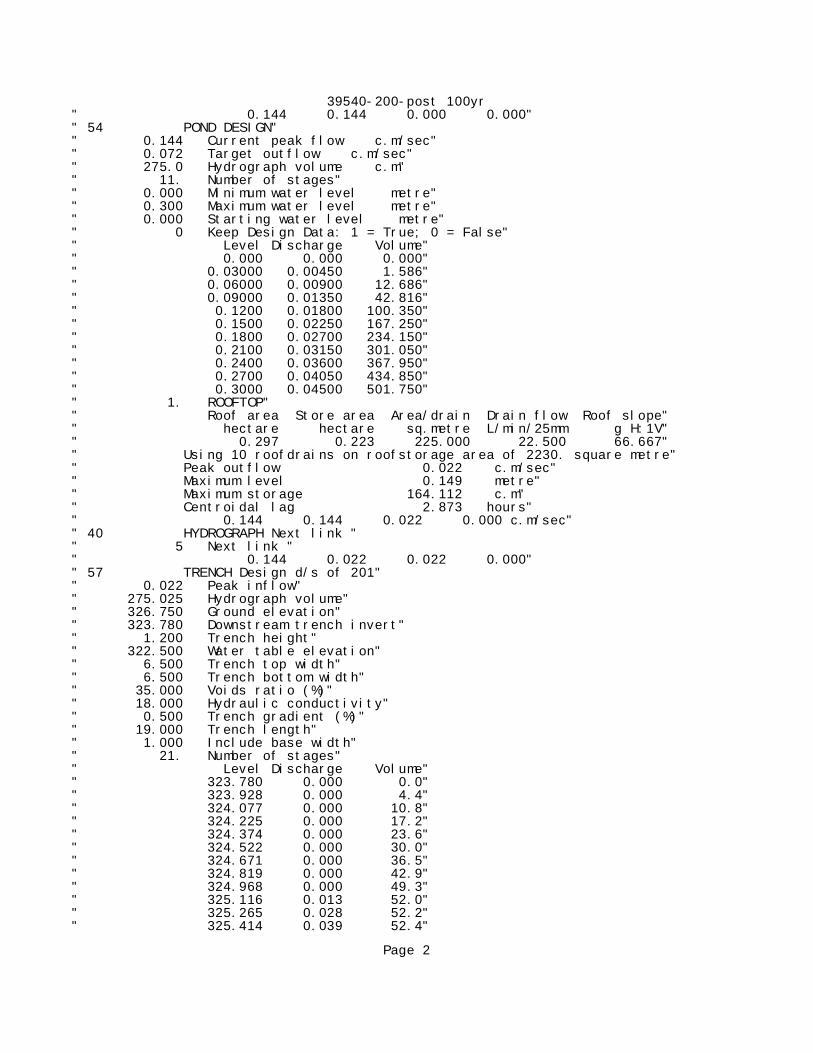
4.2 Water Quantity – Modeling Results In order to achieve the stormwater management requirements for the site, runoff generated from the controlled areas will be conveyed to catchbasin-manhole MH10, located in the driveway adjacent to the western property line, wherein the flow will be controlled with the installation of a 75 mm diameter on-line orifice plate on the outlet pipe and a 1.5 metre wide weir at the western driveway. Storage volume for the orifice and the weir will be provided within the western parking area and oversized pipes throughout the site. The maximum depth of ponding permitted within the parking area by grading is 0.3 metres. In addition, ten (10) flow control roof drains, single notch, are proposed to be installed on the roof of the proposed building. This will help to further reduce the post development runoff from the site. The flow equations for the orifice and the weir are included in Appendix A. Refer to Appendix B for the MIDUSS NET output. The following table illustrates the stage-storage-discharge relationship of the storm system. TABLE 4.2 - STAGE-STORAGE-DISCHARGE INFORMATION

Elevation (m)

Head (m)

Orifice/Weir Flow (m3/s)

Volume (m3)

Remarks

321.551 0.000 0.0000 0.0 75 mm diameter orifice invert

323.600 2.049 0.0174 64.1 Top of grate CBMH4 & CBMH5

323.650 2.099 0.0177 65.5 Top of grate DCBMH2

323.750 2.199 0.0181 97.3 1.5 m wide weir, top of grate CBMH3

323.800 2.249 0.0440 159.3 Contour

323.850 2.299 0.0913 186.0 Contour

323.900 2.349 0.1524 248.3 Contour

With the addition of the 75mm diameter orifice plate and the 1.5m wide weir, the post development runoff from the controlled portion of the site for the 5 and 100 year storm events is controlled to 0.025 m3/s and 0.126 m3/s, respectively. The following table summarizes the flows generated by the whole site for each storm event.

Final Stormwater Management Report -6- MTE File No.: 39540-200 233 Janefield Avenue April 28, 2017

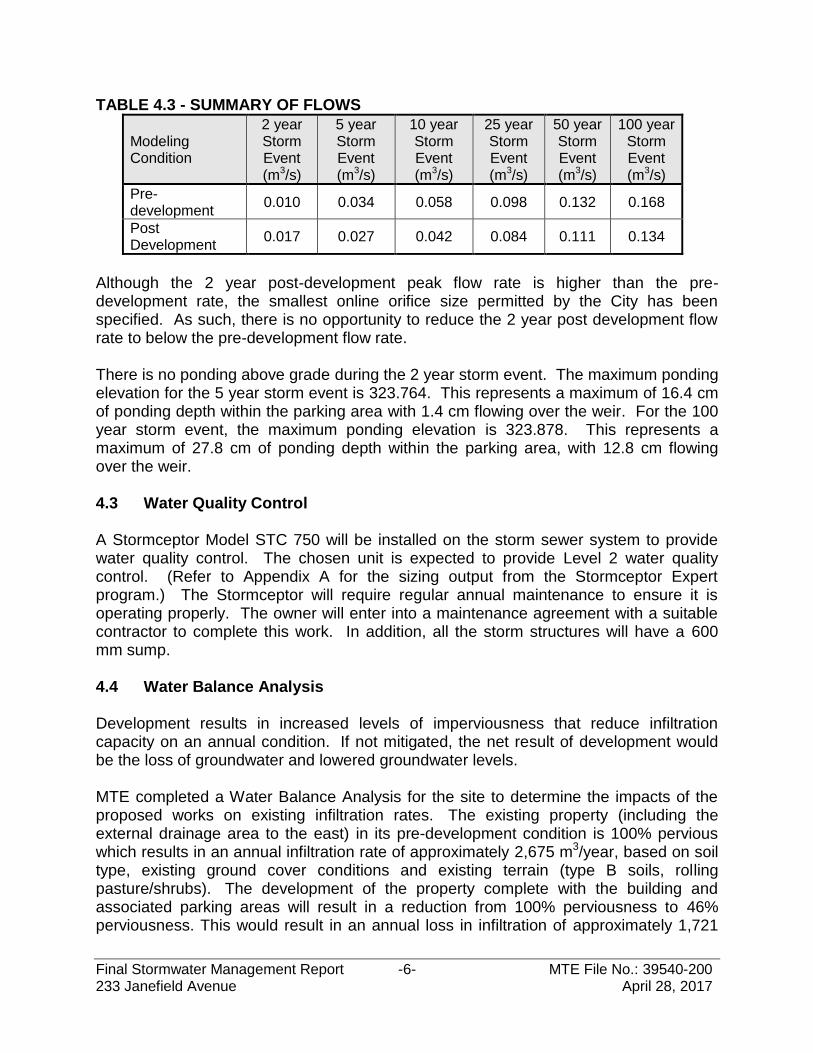
TABLE 4.3 - SUMMARY OF FLOWS

Modeling Condition

2 year Storm Event (m3/s)

5 year Storm Event (m3/s)

10 year Storm Event (m3/s)

25 year Storm Event (m3/s)

50 year Storm Event (m3/s)

100 year Storm Event (m3/s)

Pre-development

0.010 0.034 0.058 0.098 0.132 0.168

Post Development

0.017 0.027 0.042 0.084 0.111 0.134

Although the 2 year post-development peak flow rate is higher than the pre-development rate, the smallest online orifice size permitted by the City has been specified. As such, there is no opportunity to reduce the 2 year post development flow rate to below the pre-development flow rate. There is no ponding above grade during the 2 year storm event. The maximum ponding elevation for the 5 year storm event is 323.764. This represents a maximum of 16.4 cm of ponding depth within the parking area with 1.4 cm flowing over the weir. For the 100 year storm event, the maximum ponding elevation is 323.878. This represents a maximum of 27.8 cm of ponding depth within the parking area, with 12.8 cm flowing over the weir. 4.3 Water Quality Control A Stormceptor Model STC 750 will be installed on the storm sewer system to provide water quality control. The chosen unit is expected to provide Level 2 water quality control. (Refer to Appendix A for the sizing output from the Stormceptor Expert program.) The Stormceptor will require regular annual maintenance to ensure it is operating properly. The owner will enter into a maintenance agreement with a suitable contractor to complete this work. In addition, all the storm structures will have a 600 mm sump. 4.4 Water Balance Analysis Development results in increased levels of imperviousness that reduce infiltration capacity on an annual condition. If not mitigated, the net result of development would be the loss of groundwater and lowered groundwater levels. MTE completed a Water Balance Analysis for the site to determine the impacts of the proposed works on existing infiltration rates. The existing property (including the external drainage area to the east) in its pre-development condition is 100% pervious which results in an annual infiltration rate of approximately 2,675 m3/year, based on soil type, existing ground cover conditions and existing terrain (type B soils, rolling pasture/shrubs). The development of the property complete with the building and associated parking areas will result in a reduction from 100% perviousness to 46% perviousness. This would result in an annual loss in infiltration of approximately 1,721

Final Stormwater Management Report -7- MTE File No.: 39540-200 233 Janefield Avenue April 28, 2017

m3/year based on the proposed soil type ground cover and terrain (type B soils, rolling urban lawn). In order to provide for a water balance on the site following development, roof drainage for the building will be infiltrated through the implementation of an infiltration gallery. Refer to MTE Drawings 39540-200 C2.1, C2.2 and C2.3 for additional gallery details and Appendix B for MIDUSS sizing output. The infiltration gallery was sized to accommodate the runoff from up to a 15 mm rainfall event and will result in a total annual infiltration of approximately 1,871 m3/year. Therefore, through the implementation of the infiltration gallery collecting roof drainage from proposed building as well as passive infiltration in landscaped areas, there will be a net gain in annual infiltration on the site of approximately 150 m3/year. Refer to Appendix D for detailed calculations. The geotechnical investigation conducted by Chung & Vander Doelen Engineering Ltd. on September 26, 2014 revealed the existing soils to be composed primarily of sandy silt and silty sand. The constructed infiltration facility’s performance is dependent on a number of factors, one of which is subsurface soils condition. The final infiltration system was designed to ensure the long term performance through oversizing the gallery volume by 15%. With an assumed hydraulic conductivity of 10 mm/hr, the proposed gallery is able to capture and infiltrate rainfall events up to 15 mm within the 48 hour drawdown period specified by the Low Impact Development Stormwater Management Planning and Design Guide (2010).

4.5 Erosion & Sediment Control

In order to minimize the effects of erosion during the grading of the site, sediment control fencing will be installed: as shown on the enclosed engineering drawing, around any stockpiles and around the catchbasins during construction. Any sediment that is tracked onto the road way during the course of construction will be cleaned by the contractor. To help minimize the amount of mud being tracked onto the road way, a mud mat will be installed at the primary construction entrance.

APPENDIX A

CALCULATIONS

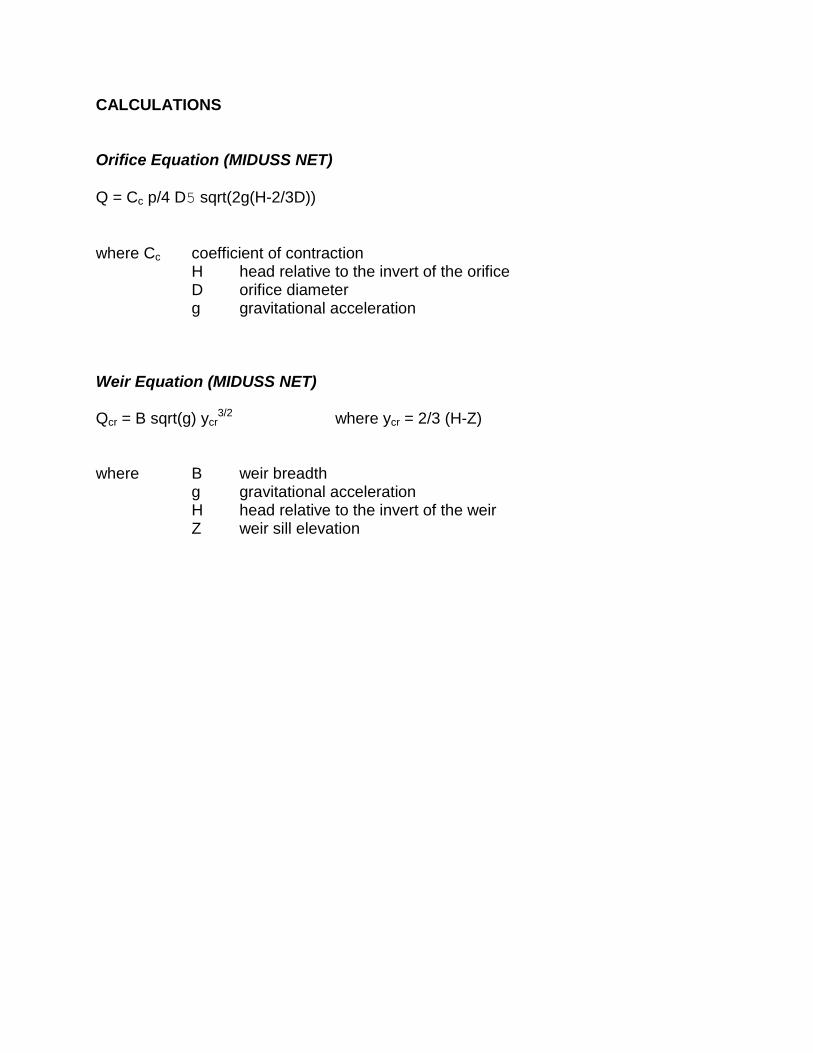
CALCULATIONS Orifice Equation (MIDUSS NET)

Q = Cc p/4 D5 sqrt(2g(H-2/3D))

where Cc coefficient of contraction

H head relative to the invert of the orifice D orifice diameter g gravitational acceleration

Weir Equation (MIDUSS NET) Qcr = B sqrt(g) ycr

3/2 where ycr = 2/3 (H-Z) where B weir breadth

g gravitational acceleration H head relative to the invert of the weir Z weir sill elevation

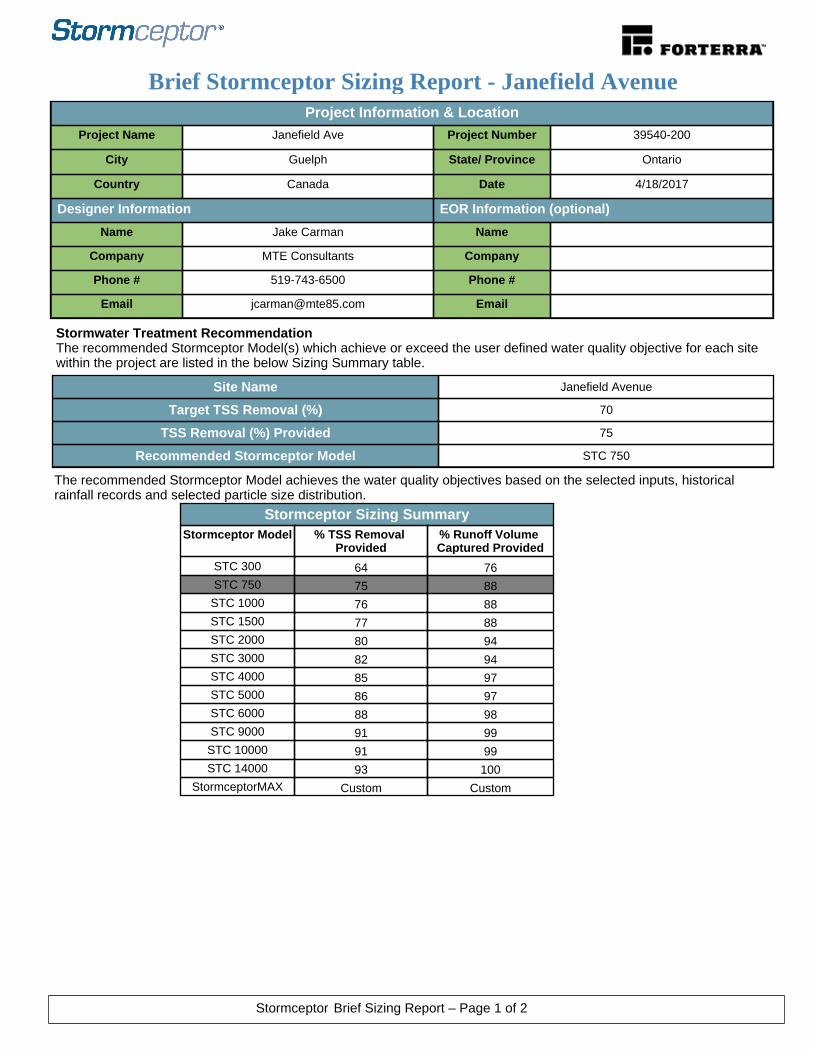
Project Information & LocationProject Name Janefield Ave Project Number 39540-200

City Guelph State/ Province Ontario

Country Canada Date 4/18/2017

Designer Information EOR Information (optional)

Name Jake Carman Name

Company MTE Consultants Company

Phone # 519-743-6500 Phone #

Email [email protected] Email

Brief Stormceptor Sizing Report - Janefield Avenue

Site Name Janefield Avenue

Target TSS Removal (%) 70

TSS Removal (%) Provided 75

Recommended Stormceptor Model STC 750

Stormceptor Sizing SummaryStormceptor Model % TSS Removal

Provided% Runoff Volume Captured Provided

STC 300 64 76STC 750 75 88

STC 1000 76 88STC 1500 77 88STC 2000 80 94STC 3000 82 94STC 4000 85 97STC 5000 86 97STC 6000 88 98STC 9000 91 99

STC 10000 91 99STC 14000 93 100

StormceptorMAX Custom Custom

The recommended Stormceptor Model achieves the water quality objectives based on the selected inputs, historical rainfall records and selected particle size distribution.

Stormwater Treatment Recommendation The recommended Stormceptor Model(s) which achieve or exceed the user defined water quality objective for each site within the project are listed in the below Sizing Summary table.

Stormceptor Brief Sizing Report – Page 1 of 2

Notes• Stormceptor performance estimates are based on simulations using PCSWMM for Stormceptor, which uses the EPA Rainfall and Runoff modules.• Design estimates listed are only representative of specific project requirements based on total suspended solids (TSS) removal defined by the selected PSD, and based on stable site conditions only, after construction is completed.• For submerged applications or sites specific to spill control, please contact your local Stormceptor representative for further design assistance.

Drainage Area

Total Area (ha) 1.105

Imperviousness % 59.7

Water Quality Objective

TSS Removal (%) 70.0

Runoff Volume Capture (%) 85.00

Oil Spill Capture Volume (L)

Peak Conveyed Flow Rate (L/s)

Water Quality Flow Rate (L/s)

Rainfall

Station Name WATERLOO WELLINGTON A

State/Province Ontario

Station ID # 9387

Years of Records 34

Latitude 43°27'N

Longitude 80°23'W

Up Stream Storage

Storage (ha-m) Discharge (cms)

0.000 0.000

Particle Size Distribution (PSD)The selected PSD defines TSS removal

Fine Distribution

Particle Diameter(microns)

Distribution %

Specific Gravity

20.0 20.0 1.30

60.0 20.0 1.80

150.0 20.0 2.20

400.0 20.0 2.65

2000.0 20.0 2.65

Up Stream Flow Diversion

Max. Flow to Stormceptor (cms)

Sizing Details

For Stormceptor Specifications and Drawings Please Visit: http://www.imbriumsystems.com/technical-specifications

Stormceptor Brief Sizing Report – Page 2 of 2

APPENDIX B

MIDUSS OUTPUT

PRE-DEVELOPMENT

39540-200-pre 2 yr" MIDUSS Output ----------------------------------------------->"" MIDUSS version Version 2.25 rev. 473"" MIDUSS created Sunday, February 07, 2010"" 10 Units used: ie METRIC"" Job folder: Q:\39540\200\SWM\MIDUSS"" Output filename: 39540-200-pre 2 yr.out"" Licensee name: Admin"" Company Microsoft"" Date & Time last used: 4/25/2017 at 7:28:35 AM"" 31 TIME PARAMETERS"" 5.000 Time Step"" 180.000 Max. Storm length"" 1500.000 Max. Hydrograph"" 32 STORM Chicago storm"" 1 Chicago storm"" 582.000 Coefficient A"" 4.600 Constant B"" 0.756 Exponent C"" 0.400 Fraction R"" 180.000 Duration"" 1.000 Time step multiplier"" Maximum intensity 105.275 mm/hr"" Total depth 33.789 mm"" 6 002hyd Hydrograph extension used in this file"" 33 CATCHMENT 101"" 1 Triangular SCS"" 1 Equal length"" 1 SCS method"" 101 total pre-development site including external drainage area"" 0.000 % Impervious"" 1.189 Total Area"" 130.000 Flow length"" 4.000 Overland Slope"" 1.189 Pervious Area"" 130.000 Pervious length"" 4.000 Pervious slope"" 0.000 Impervious Area"" 130.000 Impervious length"" 4.000 Impervious slope"" 0.250 Pervious Manning 'n'"" 75.000 Pervious SCS Curve No."" 0.173 Pervious Runoff coefficient"" 0.100 Pervious Ia/S coefficient"" 8.467 Pervious Initial abstraction"" 0.015 Impervious Manning 'n'"" 98.000 Impervious SCS Curve No."" 0.000 Impervious Runoff coefficient"" 0.100 Impervious Ia/S coefficient"" 0.518 Impervious Initial abstraction"" 0.010 0.000 0.000 0.000 c.m/sec"" Catchment 101 Pervious Impervious Total Area "" Surface Area 1.189 0.000 1.189 hectare"" Time of concentration 52.958 4.396 52.958 minutes"" Time to Centroid 169.956 95.691 169.956 minutes"" Rainfall depth 33.789 33.789 33.789 mm"" Rainfall volume 401.75 0.00 401.75 c.m"" Rainfall losses 27.960 5.306 27.960 mm"" Runoff depth 5.829 28.482 5.829 mm"" Runoff volume 69.30 0.00 69.30 c.m"" Runoff coefficient 0.173 0.000 0.173 "" Maximum flow 0.010 0.000 0.010 c.m/sec"" 40 HYDROGRAPH Add Runoff "" 4 Add Runoff "

Page 1

39540-200-pre 2 yr" 0.010 0.010 0.000 0.000"" 38 START/RE-START TOTALS 101"" 3 Runoff Totals on EXIT"" Total Catchment area 1.189 hectare"" Total Impervious area 0.000 hectare"" Total % impervious 0.000"" 19 EXIT"

Page 2

39540-200-pre 5 yr" MIDUSS Output ----------------------------------------------->"" MIDUSS version Version 2.25 rev. 473"" MIDUSS created Sunday, February 07, 2010"" 10 Units used: ie METRIC"" Job folder: Q:\39540\200\SWM\MIDUSS"" Output filename: 39540-200-pre 5 yr.out"" Licensee name: Admin"" Company Microsoft"" Date & Time last used: 4/25/2017 at 7:35:47 AM"" 31 TIME PARAMETERS"" 5.000 Time Step"" 180.000 Max. Storm length"" 1500.000 Max. Hydrograph"" 32 STORM Chicago storm"" 1 Chicago storm"" 1395.000 Coefficient A"" 12.700 Constant B"" 0.839 Exponent C"" 0.400 Fraction R"" 180.000 Duration"" 1.000 Time step multiplier"" Maximum intensity 125.177 mm/hr"" Total depth 50.662 mm"" 6 005hyd Hydrograph extension used in this file"" 33 CATCHMENT 101"" 1 Triangular SCS"" 1 Equal length"" 1 SCS method"" 101 total pre-development site including external drainage area"" 0.000 % Impervious"" 1.189 Total Area"" 130.000 Flow length"" 4.000 Overland Slope"" 1.189 Pervious Area"" 130.000 Pervious length"" 4.000 Pervious slope"" 0.000 Impervious Area"" 130.000 Impervious length"" 4.000 Impervious slope"" 0.250 Pervious Manning 'n'"" 75.000 Pervious SCS Curve No."" 0.277 Pervious Runoff coefficient"" 0.100 Pervious Ia/S coefficient"" 8.467 Pervious Initial abstraction"" 0.015 Impervious Manning 'n'"" 98.000 Impervious SCS Curve No."" 0.000 Impervious Runoff coefficient"" 0.100 Impervious Ia/S coefficient"" 0.518 Impervious Initial abstraction"" 0.034 0.000 0.000 0.000 c.m/sec"" Catchment 101 Pervious Impervious Total Area "" Surface Area 1.189 0.000 1.189 hectare"" Time of concentration 37.761 4.038 37.761 minutes"" Time to Centroid 146.074 92.964 146.074 minutes"" Rainfall depth 50.662 50.662 50.662 mm"" Rainfall volume 602.37 0.00 602.37 c.m"" Rainfall losses 36.638 5.745 36.638 mm"" Runoff depth 14.023 44.917 14.023 mm"" Runoff volume 166.74 0.00 166.74 c.m"" Runoff coefficient 0.277 0.000 0.277 "" Maximum flow 0.034 0.000 0.034 c.m/sec"" 40 HYDROGRAPH Add Runoff "" 4 Add Runoff "

Page 1

39540-200-pre 5 yr" 0.034 0.034 0.000 0.000"" 38 START/RE-START TOTALS 101"" 3 Runoff Totals on EXIT"" Total Catchment area 1.189 hectare"" Total Impervious area 0.000 hectare"" Total % impervious 0.000"" 19 EXIT"

Page 2

39540-200-pre 10 yr" MIDUSS Output ----------------------------------------------->"" MIDUSS version Version 2.25 rev. 473"" MIDUSS created Sunday, February 07, 2010"" 10 Units used: ie METRIC"" Job folder: Q:\39540\200\SWM\MIDUSS"" Output filename: 39540-200-pre 10 yr.out"" Licensee name: Admin"" Company Microsoft"" Date & Time last used: 4/25/2017 at 7:37:47 AM"" 31 TIME PARAMETERS"" 5.000 Time Step"" 180.000 Max. Storm length"" 1500.000 Max. Hydrograph"" 32 STORM Chicago storm"" 1 Chicago storm"" 2146.000 Coefficient A"" 16.900 Constant B"" 0.878 Exponent C"" 0.400 Fraction R"" 180.000 Duration"" 1.000 Time step multiplier"" Maximum intensity 142.797 mm/hr"" Total depth 62.288 mm"" 6 010hyd Hydrograph extension used in this file"" 33 CATCHMENT 101"" 1 Triangular SCS"" 1 Equal length"" 1 SCS method"" 101 total pre-development site including external drainage area"" 0.000 % Impervious"" 1.189 Total Area"" 130.000 Flow length"" 4.000 Overland Slope"" 1.189 Pervious Area"" 130.000 Pervious length"" 4.000 Pervious slope"" 0.000 Impervious Area"" 130.000 Impervious length"" 4.000 Impervious slope"" 0.250 Pervious Manning 'n'"" 75.000 Pervious SCS Curve No."" 0.336 Pervious Runoff coefficient"" 0.100 Pervious Ia/S coefficient"" 8.467 Pervious Initial abstraction"" 0.015 Impervious Manning 'n'"" 98.000 Impervious SCS Curve No."" 0.000 Impervious Runoff coefficient"" 0.100 Impervious Ia/S coefficient"" 0.518 Impervious Initial abstraction"" 0.058 0.000 0.000 0.000 c.m/sec"" Catchment 101 Pervious Impervious Total Area "" Surface Area 1.189 0.000 1.189 hectare"" Time of concentration 32.430 3.812 32.430 minutes"" Time to Centroid 137.699 91.851 137.698 minutes"" Rainfall depth 62.288 62.288 62.288 mm"" Rainfall volume 740.60 0.00 740.60 c.m"" Rainfall losses 41.386 6.196 41.386 mm"" Runoff depth 20.902 56.092 20.902 mm"" Runoff volume 248.52 0.00 248.53 c.m"" Runoff coefficient 0.336 0.000 0.336 "" Maximum flow 0.058 0.000 0.058 c.m/sec"" 40 HYDROGRAPH Add Runoff "" 4 Add Runoff "

Page 1

39540-200-pre 10 yr" 0.058 0.058 0.000 0.000"" 38 START/RE-START TOTALS 101"" 3 Runoff Totals on EXIT"" Total Catchment area 1.189 hectare"" Total Impervious area 0.000 hectare"" Total % impervious 0.000"" 19 EXIT"

Page 2

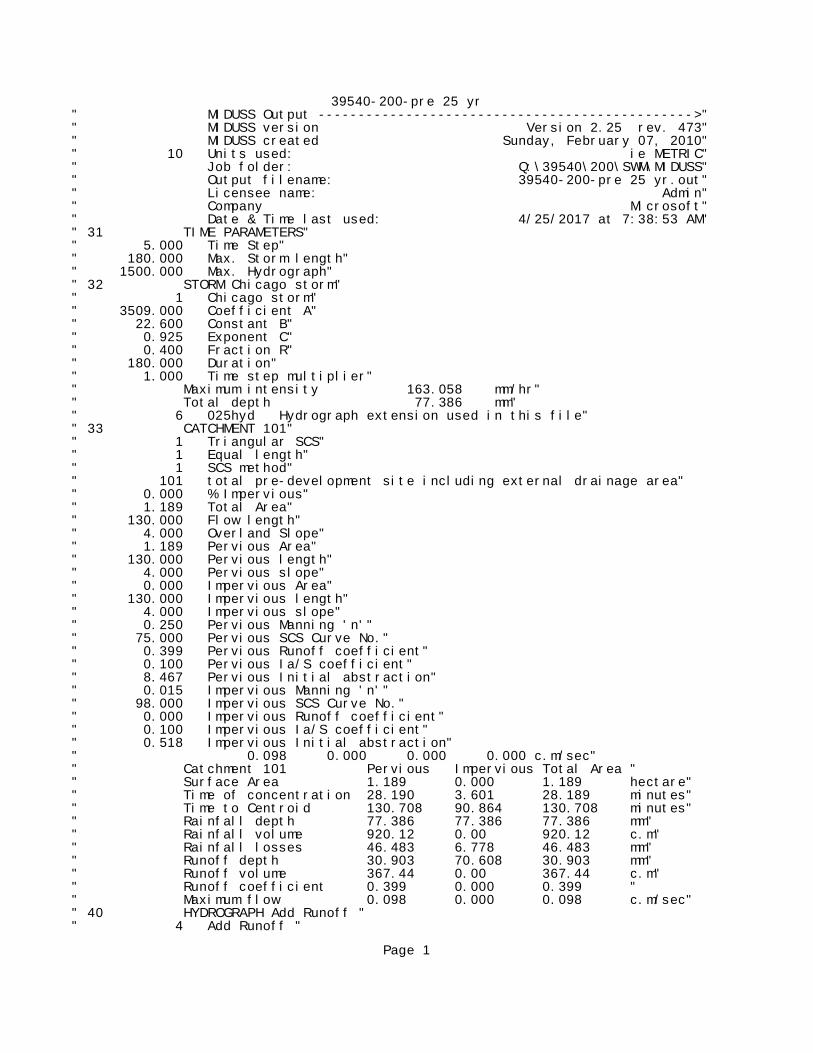
39540-200-pre 25 yr" MIDUSS Output ----------------------------------------------->"" MIDUSS version Version 2.25 rev. 473"" MIDUSS created Sunday, February 07, 2010"" 10 Units used: ie METRIC"" Job folder: Q:\39540\200\SWM\MIDUSS"" Output filename: 39540-200-pre 25 yr.out"" Licensee name: Admin"" Company Microsoft"" Date & Time last used: 4/25/2017 at 7:38:53 AM"" 31 TIME PARAMETERS"" 5.000 Time Step"" 180.000 Max. Storm length"" 1500.000 Max. Hydrograph"" 32 STORM Chicago storm"" 1 Chicago storm"" 3509.000 Coefficient A"" 22.600 Constant B"" 0.925 Exponent C"" 0.400 Fraction R"" 180.000 Duration"" 1.000 Time step multiplier"" Maximum intensity 163.058 mm/hr"" Total depth 77.386 mm"" 6 025hyd Hydrograph extension used in this file"" 33 CATCHMENT 101"" 1 Triangular SCS"" 1 Equal length"" 1 SCS method"" 101 total pre-development site including external drainage area"" 0.000 % Impervious"" 1.189 Total Area"" 130.000 Flow length"" 4.000 Overland Slope"" 1.189 Pervious Area"" 130.000 Pervious length"" 4.000 Pervious slope"" 0.000 Impervious Area"" 130.000 Impervious length"" 4.000 Impervious slope"" 0.250 Pervious Manning 'n'"" 75.000 Pervious SCS Curve No."" 0.399 Pervious Runoff coefficient"" 0.100 Pervious Ia/S coefficient"" 8.467 Pervious Initial abstraction"" 0.015 Impervious Manning 'n'"" 98.000 Impervious SCS Curve No."" 0.000 Impervious Runoff coefficient"" 0.100 Impervious Ia/S coefficient"" 0.518 Impervious Initial abstraction"" 0.098 0.000 0.000 0.000 c.m/sec"" Catchment 101 Pervious Impervious Total Area "" Surface Area 1.189 0.000 1.189 hectare"" Time of concentration 28.190 3.601 28.189 minutes"" Time to Centroid 130.708 90.864 130.708 minutes"" Rainfall depth 77.386 77.386 77.386 mm"" Rainfall volume 920.12 0.00 920.12 c.m"" Rainfall losses 46.483 6.778 46.483 mm"" Runoff depth 30.903 70.608 30.903 mm"" Runoff volume 367.44 0.00 367.44 c.m"" Runoff coefficient 0.399 0.000 0.399 "" Maximum flow 0.098 0.000 0.098 c.m/sec"" 40 HYDROGRAPH Add Runoff "" 4 Add Runoff "

Page 1

39540-200-pre 25 yr" 0.098 0.098 0.000 0.000"" 38 START/RE-START TOTALS 101"" 3 Runoff Totals on EXIT"" Total Catchment area 1.189 hectare"" Total Impervious area 0.000 hectare"" Total % impervious 0.000"" 19 EXIT"

Page 2

39540-200-pre 50 yr" MIDUSS Output ----------------------------------------------->"" MIDUSS version Version 2.25 rev. 473"" MIDUSS created Sunday, February 07, 2010"" 10 Units used: ie METRIC"" Job folder: Q:\39540\200\SWM\MIDUSS"" Output filename: 39540-200-pre 50 yr.out"" Licensee name: Admin"" Company Microsoft"" Date & Time last used: 4/25/2017 at 7:40:08 AM"" 31 TIME PARAMETERS"" 5.000 Time Step"" 180.000 Max. Storm length"" 1500.000 Max. Hydrograph"" 32 STORM Chicago storm"" 1 Chicago storm"" 4620.000 Coefficient A"" 25.800 Constant B"" 0.948 Exponent C"" 0.400 Fraction R"" 180.000 Duration"" 1.000 Time step multiplier"" Maximum intensity 179.265 mm/hr"" Total depth 88.842 mm"" 6 050hyd Hydrograph extension used in this file"" 33 CATCHMENT 101"" 1 Triangular SCS"" 1 Equal length"" 1 SCS method"" 101 total pre-development site including external drainage area"" 0.000 % Impervious"" 1.189 Total Area"" 130.000 Flow length"" 4.000 Overland Slope"" 1.189 Pervious Area"" 130.000 Pervious length"" 4.000 Pervious slope"" 0.000 Impervious Area"" 130.000 Impervious length"" 4.000 Impervious slope"" 0.250 Pervious Manning 'n'"" 75.000 Pervious SCS Curve No."" 0.440 Pervious Runoff coefficient"" 0.100 Pervious Ia/S coefficient"" 8.467 Pervious Initial abstraction"" 0.015 Impervious Manning 'n'"" 98.000 Impervious SCS Curve No."" 0.000 Impervious Runoff coefficient"" 0.100 Impervious Ia/S coefficient"" 0.518 Impervious Initial abstraction"" 0.132 0.000 0.000 0.000 c.m/sec"" Catchment 101 Pervious Impervious Total Area "" Surface Area 1.189 0.000 1.189 hectare"" Time of concentration 25.868 3.461 25.868 minutes"" Time to Centroid 127.075 90.326 127.075 minutes"" Rainfall depth 88.842 88.842 88.842 mm"" Rainfall volume 1056.33 0.00 1056.33 c.m"" Rainfall losses 49.738 7.068 49.738 mm"" Runoff depth 39.104 81.774 39.104 mm"" Runoff volume 464.95 0.00 464.95 c.m"" Runoff coefficient 0.440 0.000 0.440 "" Maximum flow 0.132 0.000 0.132 c.m/sec"" 40 HYDROGRAPH Add Runoff "" 4 Add Runoff "

Page 1

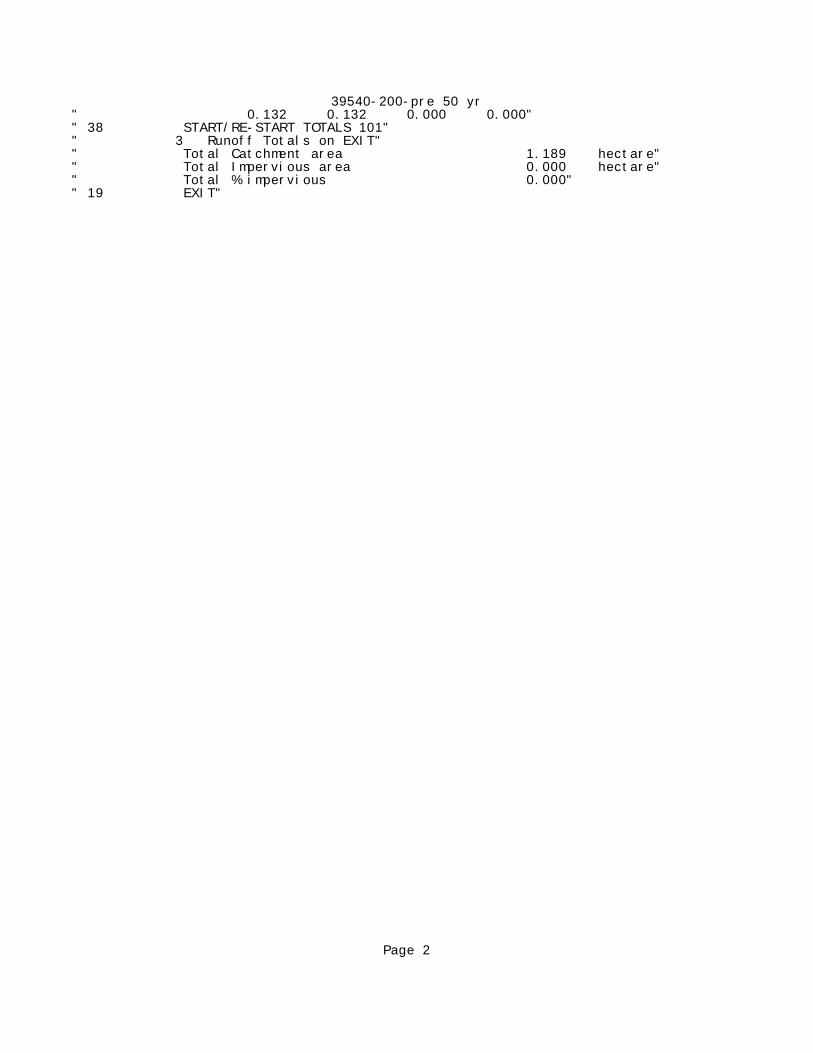
39540-200-pre 50 yr" 0.132 0.132 0.000 0.000"" 38 START/RE-START TOTALS 101"" 3 Runoff Totals on EXIT"" Total Catchment area 1.189 hectare"" Total Impervious area 0.000 hectare"" Total % impervious 0.000"" 19 EXIT"

Page 2

39540-200-pre 100 yr" MIDUSS Output ----------------------------------------------->"" MIDUSS version Version 2.25 rev. 473"" MIDUSS created Sunday, February 07, 2010"" 10 Units used: ie METRIC"" Job folder: Q:\39540\200\SWM\MIDUSS"" Output filename: 39540-200-pre 100 yr.out"" Licensee name: Admin"" Company Microsoft"" Date & Time last used: 4/25/2017 at 7:41:23 AM"" 31 TIME PARAMETERS"" 5.000 Time Step"" 180.000 Max. Storm length"" 1500.000 Max. Hydrograph"" 32 STORM Chicago storm"" 1 Chicago storm"" 5886.000 Coefficient A"" 28.600 Constant B"" 0.969 Exponent C"" 0.400 Fraction R"" 180.000 Duration"" 1.000 Time step multiplier"" Maximum intensity 195.343 mm/hr"" Total depth 99.891 mm"" 6 100hyd Hydrograph extension used in this file"" 33 CATCHMENT 101"" 1 Triangular SCS"" 1 Equal length"" 1 SCS method"" 101 total pre-development site including external drainage area"" 0.000 % Impervious"" 1.189 Total Area"" 130.000 Flow length"" 4.000 Overland Slope"" 1.189 Pervious Area"" 130.000 Pervious length"" 4.000 Pervious slope"" 0.000 Impervious Area"" 130.000 Impervious length"" 4.000 Impervious slope"" 0.250 Pervious Manning 'n'"" 75.000 Pervious SCS Curve No."" 0.475 Pervious Runoff coefficient"" 0.100 Pervious Ia/S coefficient"" 8.467 Pervious Initial abstraction"" 0.015 Impervious Manning 'n'"" 98.000 Impervious SCS Curve No."" 0.000 Impervious Runoff coefficient"" 0.100 Impervious Ia/S coefficient"" 0.518 Impervious Initial abstraction"" 0.168 0.000 0.000 0.000 c.m/sec"" Catchment 101 Pervious Impervious Total Area "" Surface Area 1.189 0.000 1.189 hectare"" Time of concentration 24.089 3.340 24.089 minutes"" Time to Centroid 124.227 89.884 124.227 minutes"" Rainfall depth 99.891 99.891 99.891 mm"" Rainfall volume 1187.70 0.00 1187.70 c.m"" Rainfall losses 52.463 7.452 52.463 mm"" Runoff depth 47.428 92.439 47.428 mm"" Runoff volume 563.92 0.00 563.92 c.m"" Runoff coefficient 0.475 0.000 0.475 "" Maximum flow 0.168 0.000 0.168 c.m/sec"" 40 HYDROGRAPH Add Runoff "" 4 Add Runoff "

Page 1

39540-200-pre 100 yr" 0.168 0.168 0.000 0.000"" 38 START/RE-START TOTALS 101"" 3 Runoff Totals on EXIT"" Total Catchment area 1.189 hectare"" Total Impervious area 0.000 hectare"" Total % impervious 0.000"" 19 EXIT"

Page 2

POST-DEVELOPMENT

39540-200-post 2yr" MIDUSS Output ----------------------------------------------->"" MIDUSS version Version 2.25 rev. 473"" MIDUSS created Sunday, February 07, 2010"" 10 Units used: ie METRIC"" Job folder: Q:\39540\200\SWM\MIDUSS"" Output filename: 39540-200-post 2yr.out"" Licensee name: Admin"" Company Microsoft"" Date & Time last used: 4/26/2017 at 7:16:31 PM"" 31 TIME PARAMETERS"" 5.000 Time Step"" 180.000 Max. Storm length"" 1500.000 Max. Hydrograph"" 32 STORM Chicago storm"" 1 Chicago storm"" 582.000 Coefficient A"" 4.600 Constant B"" 0.756 Exponent C"" 0.400 Fraction R"" 180.000 Duration"" 1.000 Time step multiplier"" Maximum intensity 105.275 mm/hr"" Total depth 33.789 mm"" 6 002hyd Hydrograph extension used in this file"" 33 CATCHMENT 201"" 1 Triangular SCS"" 1 Equal length"" 1 SCS method"" 201 roof area"" 100.000 % Impervious"" 0.297 Total Area"" 15.000 Flow length"" 1.500 Overland Slope"" 0.000 Pervious Area"" 15.000 Pervious length"" 1.500 Pervious slope"" 0.297 Impervious Area"" 15.000 Impervious length"" 1.500 Impervious slope"" 0.250 Pervious Manning 'n'"" 75.000 Pervious SCS Curve No."" 0.000 Pervious Runoff coefficient"" 0.100 Pervious Ia/S coefficient"" 8.467 Pervious Initial abstraction"" 0.015 Impervious Manning 'n'"" 98.000 Impervious SCS Curve No."" 0.839 Impervious Runoff coefficient"" 0.100 Impervious Ia/S coefficient"" 0.518 Impervious Initial abstraction"" 0.064 0.000 0.000 0.000 c.m/sec"" Catchment 201 Pervious Impervious Total Area "" Surface Area 0.000 0.297 0.297 hectare"" Time of concentration 19.454 1.615 1.615 minutes"" Time to Centroid 129.222 91.286 91.286 minutes"" Rainfall depth 33.789 33.789 33.789 mm"" Rainfall volume 0.00 100.35 100.35 c.m"" Rainfall losses 27.971 5.443 5.443 mm"" Runoff depth 5.818 28.346 28.346 mm"" Runoff volume 0.00 84.19 84.19 c.m"" Runoff coefficient 0.000 0.839 0.839 "" Maximum flow 0.000 0.064 0.064 c.m/sec"" 40 HYDROGRAPH Add Runoff "" 4 Add Runoff "

Page 1

39540-200-post 2yr" 0.064 0.064 0.000 0.000"" 54 POND DESIGN"" 0.064 Current peak flow c.m/sec"" 0.072 Target outflow c.m/sec"" 84.2 Hydrograph volume c.m"" 11. Number of stages"" 0.000 Minimum water level metre"" 0.300 Maximum water level metre"" 0.000 Starting water level metre"" 0 Keep Design Data: 1 = True; 0 = False"" Level Discharge Volume"" 0.000 0.000 0.000"" 0.03000 0.00450 1.586"" 0.06000 0.00900 12.686"" 0.09000 0.01350 42.816"" 0.1200 0.01800 100.350"" 0.1500 0.02250 167.250"" 0.1800 0.02700 234.150"" 0.2100 0.03150 301.050"" 0.2400 0.03600 367.950"" 0.2700 0.04050 434.850"" 0.3000 0.04500 501.750"" 1. ROOFTOP"" Roof area Store area Area/drain Drain flow Roof slope"" hectare hectare sq.metre L/min/25mm g H:1V"" 0.297 0.223 225.000 22.500 66.667"" Using 10 roofdrains on roofstorage area of 2230. square metre"" Peak outflow 0.013 c.m/sec"" Maximum level 0.085 metre"" Maximum storage 37.466 c.m"" Centroidal lag 2.069 hours"" 0.064 0.064 0.013 0.000 c.m/sec"" 40 HYDROGRAPH Next link "" 5 Next link "" 0.064 0.013 0.013 0.000"" 57 TRENCH Design d/s of 201"" 0.013 Peak inflow"" 84.256 Hydrograph volume"" 326.750 Ground elevation"" 323.780 Downstream trench invert"" 1.200 Trench height"" 322.500 Water table elevation"" 6.500 Trench top width"" 6.500 Trench bottom width"" 35.000 Voids ratio (%)"" 18.000 Hydraulic conductivity"" 0.500 Trench gradient (%)"" 19.000 Trench length"" 1.000 Include base width"" 21. Number of stages"" Level Discharge Volume"" 323.780 0.000 0.0"" 323.928 0.000 4.4"" 324.077 0.000 10.8"" 324.225 0.000 17.2"" 324.374 0.000 23.6"" 324.522 0.000 30.0"" 324.671 0.000 36.5"" 324.819 0.000 42.9"" 324.968 0.000 49.3"" 325.116 0.013 52.0"" 325.265 0.028 52.2"" 325.414 0.039 52.4"

Page 2

39540-200-post 2yr" 325.562 0.048 52.5"" 325.711 0.055 52.7"" 325.859 0.062 52.9"" 326.008 0.068 53.0"" 326.156 0.073 53.2"" 326.305 0.078 53.4"" 326.453 0.083 53.5"" 326.602 0.087 53.7"" 326.750 0.091 53.9"" 1. TRENCH PIPES"" Downstream Pipe Pipe Pipe Perf'ted? Offset"" Invert length diam. grade% 0=Yes distance"" 324.918 3.000 0.000 -2.000 1.000 0.000"" 1. MANHOLE"" Access"" diameter"" 1.200"" 1. OUTFLOW PIPE"" 0. Inflow at upstream end of trench: 1=True; 0=False"" Upstream Downstr'm Pipe Pipe Manning Entry"" invert invert Length Diameter 'n' loss Ke"" 324.918 324.978 3.000 0.200 0.013 0.500"" Peak outflow 0.008 c.m/sec"" Outflow volume 24.567 c.m"" Peak exfiltration 0.001 c.m/sec"" Exfiltration volume 59.542 c.m"" Maximum level 325.065 metre"" Maximum storage 51.091 c.m"" Centroidal lag 2.830 hours"" Infiltration area 2 sides 45.581 sq.metre"" Infiltration Base area 123.500 sq.metre"" 0.064 0.013 0.008 0.001 c.m/sec"" 40 HYDROGRAPH Next link "" 5 Next link "" 0.064 0.008 0.008 0.001"" 33 CATCHMENT 202"" 1 Triangular SCS"" 1 Equal length"" 1 SCS method"" 202 controlled area"" 44.900 % Impervious"" 0.808 Total Area"" 25.000 Flow length"" 2.000 Overland Slope"" 0.445 Pervious Area"" 25.000 Pervious length"" 2.000 Pervious slope"" 0.363 Impervious Area"" 25.000 Impervious length"" 2.000 Impervious slope"" 0.250 Pervious Manning 'n'"" 75.000 Pervious SCS Curve No."" 0.172 Pervious Runoff coefficient"" 0.100 Pervious Ia/S coefficient"" 8.467 Pervious Initial abstraction"" 0.015 Impervious Manning 'n'"" 98.000 Impervious SCS Curve No."" 0.839 Impervious Runoff coefficient"" 0.100 Impervious Ia/S coefficient"" 0.518 Impervious Initial abstraction"" 0.077 0.008 0.008 0.001 c.m/sec"" Catchment 202 Pervious Impervious Total Area "" Surface Area 0.445 0.363 0.808 hectare"

Page 3

39540-200-post 2yr" Time of concentration 24.246 2.012 6.490 minutes"" Time to Centroid 135.045 91.908 100.595 minutes"" Rainfall depth 33.789 33.789 33.789 mm"" Rainfall volume 150.43 122.58 273.01 c.m"" Rainfall losses 27.961 5.425 17.842 mm"" Runoff depth 5.828 28.364 15.947 mm"" Runoff volume 25.95 102.90 128.85 c.m"" Runoff coefficient 0.172 0.839 0.472 "" Maximum flow 0.006 0.076 0.077 c.m/sec"" 40 HYDROGRAPH Add Runoff "" 4 Add Runoff "" 0.077 0.077 0.008 0.001"" 54 POND DESIGN"" 0.077 Current peak flow c.m/sec"" 0.072 Target outflow c.m/sec"" 153.4 Hydrograph volume c.m"" 7. Number of stages"" 321.551 Minimum water level metre"" 323.900 Maximum water level metre"" 321.551 Starting water level metre"" 0 Keep Design Data: 1 = True; 0 = False"" Level Discharge Volume"" 321.551 0.000 0.000"" 323.600 0.01743 64.100"" 323.650 0.01765 65.500"" 323.750 0.01807 97.300"" 323.800 0.04401 159.300"" 323.850 0.09128 186.000"" 323.900 0.1524 248.300"" 1. WEIRS"" Crest Weir Crest Left Right"" elevation coefficie breadth sideslope sideslope"" 323.750 0.900 1.500 0.000 0.000"" 1. ORIFICES"" Orifice Orifice Orifice Number of"" invert coefficie diameter orifices"" 321.551 0.630 0.0750 1.000"" Peak outflow 0.016 c.m/sec"" Maximum level 323.421 metre"" Maximum storage 58.495 c.m"" Centroidal lag 2.883 hours"" 0.077 0.077 0.016 0.001 c.m/sec"" 40 HYDROGRAPH Next link "" 5 Next link "" 0.077 0.016 0.016 0.001"" 33 CATCHMENT 203"" 1 Triangular SCS"" 1 Equal length"" 1 SCS method"" 203 uncontrolled area"" 6.000 % Impervious"" 0.084 Total Area"" 6.000 Flow length"" 10.000 Overland Slope"" 0.079 Pervious Area"" 6.000 Pervious length"" 10.000 Pervious slope"" 0.005 Impervious Area"" 6.000 Impervious length"" 10.000 Impervious slope"" 0.250 Pervious Manning 'n'"" 75.000 Pervious SCS Curve No."" 0.171 Pervious Runoff coefficient"

Page 4

39540-200-post 2yr" 0.100 Pervious Ia/S coefficient"" 8.467 Pervious Initial abstraction"" 0.015 Impervious Manning 'n'"" 98.000 Impervious SCS Curve No."" 0.778 Impervious Runoff coefficient"" 0.100 Impervious Ia/S coefficient"" 0.518 Impervious Initial abstraction"" 0.002 0.016 0.016 0.001 c.m/sec"" Catchment 203 Pervious Impervious Total Area "" Surface Area 0.079 0.005 0.084 hectare"" Time of concentration 6.354 0.527 5.042 minutes"" Time to Centroid 113.404 90.395 108.222 minutes"" Rainfall depth 33.789 33.789 33.789 mm"" Rainfall volume 26.68 1.70 28.38 c.m"" Rainfall losses 28.013 7.487 26.781 mm"" Runoff depth 5.776 26.302 7.008 mm"" Runoff volume 4.56 1.33 5.89 c.m"" Runoff coefficient 0.171 0.778 0.207 "" Maximum flow 0.002 0.001 0.002 c.m/sec"" 40 HYDROGRAPH Add Runoff "" 4 Add Runoff "" 0.002 0.017 0.016 0.001"" 38 START/RE-START TOTALS 203"" 3 Runoff Totals on EXIT"" Total Catchment area 1.189 hectare"" Total Impervious area 0.665 hectare"" Total % impervious 55.915"" 19 EXIT"

Page 5

39540-200-post 5yr" MIDUSS Output ----------------------------------------------->"" MIDUSS version Version 2.25 rev. 473"" MIDUSS created Sunday, February 07, 2010"" 10 Units used: ie METRIC"" Job folder: Q:\39540\200\SWM\MIDUSS"" Output filename: 39540-200-post 5yr.out"" Licensee name: Admin"" Company Microsoft"" Date & Time last used: 4/26/2017 at 7:18:37 PM"" 31 TIME PARAMETERS"" 5.000 Time Step"" 180.000 Max. Storm length"" 1500.000 Max. Hydrograph"" 32 STORM Chicago storm"" 1 Chicago storm"" 1395.000 Coefficient A"" 12.700 Constant B"" 0.839 Exponent C"" 0.400 Fraction R"" 180.000 Duration"" 1.000 Time step multiplier"" Maximum intensity 125.177 mm/hr"" Total depth 50.662 mm"" 6 005hyd Hydrograph extension used in this file"" 33 CATCHMENT 201"" 1 Triangular SCS"" 1 Equal length"" 1 SCS method"" 201 roof area"" 100.000 % Impervious"" 0.297 Total Area"" 15.000 Flow length"" 1.500 Overland Slope"" 0.000 Pervious Area"" 15.000 Pervious length"" 1.500 Pervious slope"" 0.297 Impervious Area"" 15.000 Impervious length"" 1.500 Impervious slope"" 0.250 Pervious Manning 'n'"" 75.000 Pervious SCS Curve No."" 0.000 Pervious Runoff coefficient"" 0.100 Pervious Ia/S coefficient"" 8.467 Pervious Initial abstraction"" 0.015 Impervious Manning 'n'"" 98.000 Impervious SCS Curve No."" 0.884 Impervious Runoff coefficient"" 0.100 Impervious Ia/S coefficient"" 0.518 Impervious Initial abstraction"" 0.086 0.000 0.000 0.000 c.m/sec"" Catchment 201 Pervious Impervious Total Area "" Surface Area 0.000 0.297 0.297 hectare"" Time of concentration 13.872 1.483 1.483 minutes"" Time to Centroid 117.417 89.220 89.220 minutes"" Rainfall depth 50.662 50.662 50.662 mm"" Rainfall volume 0.00 150.47 150.47 c.m"" Rainfall losses 36.649 5.889 5.889 mm"" Runoff depth 14.013 44.772 44.772 mm"" Runoff volume 0.00 132.97 132.97 c.m"" Runoff coefficient 0.000 0.884 0.884 "" Maximum flow 0.000 0.086 0.086 c.m/sec"" 40 HYDROGRAPH Add Runoff "" 4 Add Runoff "

Page 1

39540-200-post 5yr" 0.086 0.086 0.000 0.000"" 54 POND DESIGN"" 0.086 Current peak flow c.m/sec"" 0.072 Target outflow c.m/sec"" 133.0 Hydrograph volume c.m"" 11. Number of stages"" 0.000 Minimum water level metre"" 0.300 Maximum water level metre"" 0.000 Starting water level metre"" 0 Keep Design Data: 1 = True; 0 = False"" Level Discharge Volume"" 0.000 0.000 0.000"" 0.03000 0.00450 1.586"" 0.06000 0.00900 12.686"" 0.09000 0.01350 42.816"" 0.1200 0.01800 100.350"" 0.1500 0.02250 167.250"" 0.1800 0.02700 234.150"" 0.2100 0.03150 301.050"" 0.2400 0.03600 367.950"" 0.2700 0.04050 434.850"" 0.3000 0.04500 501.750"" 1. ROOFTOP"" Roof area Store area Area/drain Drain flow Roof slope"" hectare hectare sq.metre L/min/25mm g H:1V"" 0.297 0.223 225.000 22.500 66.667"" Using 10 roofdrains on roofstorage area of 2230. square metre"" Peak outflow 0.015 c.m/sec"" Maximum level 0.103 metre"" Maximum storage 67.271 c.m"" Centroidal lag 2.304 hours"" 0.086 0.086 0.015 0.000 c.m/sec"" 40 HYDROGRAPH Next link "" 5 Next link "" 0.086 0.015 0.015 0.000"" 57 TRENCH Design d/s of 201"" 0.015 Peak inflow"" 133.009 Hydrograph volume"" 326.750 Ground elevation"" 323.780 Downstream trench invert"" 1.200 Trench height"" 322.500 Water table elevation"" 6.500 Trench top width"" 6.500 Trench bottom width"" 35.000 Voids ratio (%)"" 18.000 Hydraulic conductivity"" 0.500 Trench gradient (%)"" 19.000 Trench length"" 1.000 Include base width"" 21. Number of stages"" Level Discharge Volume"" 323.780 0.000 0.0"" 323.928 0.000 4.4"" 324.077 0.000 10.8"" 324.225 0.000 17.2"" 324.374 0.000 23.6"" 324.522 0.000 30.0"" 324.671 0.000 36.5"" 324.819 0.000 42.9"" 324.968 0.000 49.3"" 325.116 0.013 52.0"" 325.265 0.028 52.2"" 325.414 0.039 52.4"

Page 2

39540-200-post 5yr" 325.562 0.048 52.5"" 325.711 0.055 52.7"" 325.859 0.062 52.9"" 326.008 0.068 53.0"" 326.156 0.073 53.2"" 326.305 0.078 53.4"" 326.453 0.083 53.5"" 326.602 0.087 53.7"" 326.750 0.091 53.9"" 1. TRENCH PIPES"" Downstream Pipe Pipe Pipe Perf'ted? Offset"" Invert length diam. grade% 0=Yes distance"" 324.918 3.000 0.000 -2.000 1.000 0.000"" 1. MANHOLE"" Access"" diameter"" 1.200"" 1. OUTFLOW PIPE"" 0. Inflow at upstream end of trench: 1=True; 0=False"" Upstream Downstr'm Pipe Pipe Manning Entry"" invert invert Length Diameter 'n' loss Ke"" 324.918 324.978 3.000 0.200 0.013 0.500"" Peak outflow 0.013 c.m/sec"" Outflow volume 69.199 c.m"" Peak exfiltration 0.001 c.m/sec"" Exfiltration volume 63.212 c.m"" Maximum level 325.123 metre"" Maximum storage 52.032 c.m"" Centroidal lag 2.887 hours"" Infiltration area 2 sides 45.600 sq.metre"" Infiltration Base area 123.500 sq.metre"" 0.086 0.015 0.013 0.001 c.m/sec"" 40 HYDROGRAPH Next link "" 5 Next link "" 0.086 0.013 0.013 0.001"" 33 CATCHMENT 202"" 1 Triangular SCS"" 1 Equal length"" 1 SCS method"" 202 controlled area"" 44.900 % Impervious"" 0.808 Total Area"" 25.000 Flow length"" 2.000 Overland Slope"" 0.445 Pervious Area"" 25.000 Pervious length"" 2.000 Pervious slope"" 0.363 Impervious Area"" 25.000 Impervious length"" 2.000 Impervious slope"" 0.250 Pervious Manning 'n'"" 75.000 Pervious SCS Curve No."" 0.277 Pervious Runoff coefficient"" 0.100 Pervious Ia/S coefficient"" 8.467 Pervious Initial abstraction"" 0.015 Impervious Manning 'n'"" 98.000 Impervious SCS Curve No."" 0.884 Impervious Runoff coefficient"" 0.100 Impervious Ia/S coefficient"" 0.518 Impervious Initial abstraction"" 0.104 0.013 0.013 0.001 c.m/sec"" Catchment 202 Pervious Impervious Total Area "" Surface Area 0.445 0.363 0.808 hectare"

Page 3

39540-200-post 5yr" Time of concentration 17.288 1.849 6.132 minutes"" Time to Centroid 121.507 89.682 98.511 minutes"" Rainfall depth 50.662 50.662 50.662 mm"" Rainfall volume 225.55 183.80 409.35 c.m"" Rainfall losses 36.646 5.867 22.826 mm"" Runoff depth 14.016 44.795 27.835 mm"" Runoff volume 62.40 162.51 224.91 c.m"" Runoff coefficient 0.277 0.884 0.549 "" Maximum flow 0.021 0.102 0.104 c.m/sec"" 40 HYDROGRAPH Add Runoff "" 4 Add Runoff "" 0.104 0.104 0.013 0.001"" 54 POND DESIGN"" 0.104 Current peak flow c.m/sec"" 0.072 Target outflow c.m/sec"" 294.1 Hydrograph volume c.m"" 7. Number of stages"" 321.551 Minimum water level metre"" 323.900 Maximum water level metre"" 321.551 Starting water level metre"" 0 Keep Design Data: 1 = True; 0 = False"" Level Discharge Volume"" 321.551 0.000 0.000"" 323.600 0.01743 64.100"" 323.650 0.01765 65.500"" 323.750 0.01807 97.300"" 323.800 0.04401 159.300"" 323.850 0.09128 186.000"" 323.900 0.1524 248.300"" 1. WEIRS"" Crest Weir Crest Left Right"" elevation coefficie breadth sideslope sideslope"" 323.750 0.900 1.500 0.000 0.000"" 1. ORIFICES"" Orifice Orifice Orifice Number of"" invert coefficie diameter orifices"" 321.551 0.630 0.0750 1.000"" Peak outflow 0.025 c.m/sec"" Maximum level 323.764 metre"" Maximum storage 114.768 c.m"" Centroidal lag 3.169 hours"" 0.104 0.104 0.025 0.001 c.m/sec"" 40 HYDROGRAPH Next link "" 5 Next link "" 0.104 0.025 0.025 0.001"" 33 CATCHMENT 203"" 1 Triangular SCS"" 1 Equal length"" 1 SCS method"" 203 uncontrolled area"" 6.000 % Impervious"" 0.084 Total Area"" 6.000 Flow length"" 10.000 Overland Slope"" 0.079 Pervious Area"" 6.000 Pervious length"" 10.000 Pervious slope"" 0.005 Impervious Area"" 6.000 Impervious length"" 10.000 Impervious slope"" 0.250 Pervious Manning 'n'"" 75.000 Pervious SCS Curve No."" 0.275 Pervious Runoff coefficient"

Page 4

39540-200-post 5yr" 0.100 Pervious Ia/S coefficient"" 8.467 Pervious Initial abstraction"" 0.015 Impervious Manning 'n'"" 98.000 Impervious SCS Curve No."" 0.805 Impervious Runoff coefficient"" 0.100 Impervious Ia/S coefficient"" 0.518 Impervious Initial abstraction"" 0.007 0.025 0.025 0.001 c.m/sec"" Catchment 203 Pervious Impervious Total Area "" Surface Area 0.079 0.005 0.084 hectare"" Time of concentration 4.531 0.485 3.894 minutes"" Time to Centroid 106.238 88.400 103.429 minutes"" Rainfall depth 50.662 50.662 50.662 mm"" Rainfall volume 40.00 2.55 42.56 c.m"" Rainfall losses 36.731 9.876 35.120 mm"" Runoff depth 13.930 40.786 15.542 mm"" Runoff volume 11.00 2.06 13.05 c.m"" Runoff coefficient 0.275 0.805 0.307 "" Maximum flow 0.006 0.001 0.007 c.m/sec"" 40 HYDROGRAPH Add Runoff "" 4 Add Runoff "" 0.007 0.027 0.025 0.001"" 38 START/RE-START TOTALS 203"" 3 Runoff Totals on EXIT"" Total Catchment area 1.189 hectare"" Total Impervious area 0.665 hectare"" Total % impervious 55.915"" 19 EXIT"

Page 5

39540-200-post 10yr" MIDUSS Output ----------------------------------------------->"" MIDUSS version Version 2.25 rev. 473"" MIDUSS created Sunday, February 07, 2010"" 10 Units used: ie METRIC"" Job folder: Q:\39540\200\SWM\MIDUSS"" Output filename: 39540-200-post 10yr.out"" Licensee name: Admin"" Company Microsoft"" Date & Time last used: 4/26/2017 at 7:19:36 PM"" 31 TIME PARAMETERS"" 5.000 Time Step"" 180.000 Max. Storm length"" 1500.000 Max. Hydrograph"" 32 STORM Chicago storm"" 1 Chicago storm"" 2146.000 Coefficient A"" 16.900 Constant B"" 0.878 Exponent C"" 0.400 Fraction R"" 180.000 Duration"" 1.000 Time step multiplier"" Maximum intensity 142.797 mm/hr"" Total depth 62.288 mm"" 6 010hyd Hydrograph extension used in this file"" 33 CATCHMENT 201"" 1 Triangular SCS"" 1 Equal length"" 1 SCS method"" 201 roof area"" 100.000 % Impervious"" 0.297 Total Area"" 15.000 Flow length"" 1.500 Overland Slope"" 0.000 Pervious Area"" 15.000 Pervious length"" 1.500 Pervious slope"" 0.297 Impervious Area"" 15.000 Impervious length"" 1.500 Impervious slope"" 0.250 Pervious Manning 'n'"" 75.000 Pervious SCS Curve No."" 0.000 Pervious Runoff coefficient"" 0.100 Pervious Ia/S coefficient"" 8.467 Pervious Initial abstraction"" 0.015 Impervious Manning 'n'"" 98.000 Impervious SCS Curve No."" 0.901 Impervious Runoff coefficient"" 0.100 Impervious Ia/S coefficient"" 0.518 Impervious Initial abstraction"" 0.101 0.000 0.000 0.000 c.m/sec"" Catchment 201 Pervious Impervious Total Area "" Surface Area 0.000 0.297 0.297 hectare"" Time of concentration 11.913 1.400 1.400 minutes"" Time to Centroid 113.185 88.364 88.364 minutes"" Rainfall depth 62.288 62.288 62.288 mm"" Rainfall volume 0.00 184.99 184.99 c.m"" Rainfall losses 41.436 6.191 6.191 mm"" Runoff depth 20.852 56.097 56.097 mm"" Runoff volume 0.00 166.61 166.61 c.m"" Runoff coefficient 0.000 0.901 0.901 "" Maximum flow 0.000 0.101 0.101 c.m/sec"" 40 HYDROGRAPH Add Runoff "" 4 Add Runoff "

Page 1

39540-200-post 10yr" 0.101 0.101 0.000 0.000"" 54 POND DESIGN"" 0.101 Current peak flow c.m/sec"" 0.072 Target outflow c.m/sec"" 166.6 Hydrograph volume c.m"" 11. Number of stages"" 0.000 Minimum water level metre"" 0.300 Maximum water level metre"" 0.000 Starting water level metre"" 0 Keep Design Data: 1 = True; 0 = False"" Level Discharge Volume"" 0.000 0.000 0.000"" 0.03000 0.00450 1.586"" 0.06000 0.00900 12.686"" 0.09000 0.01350 42.816"" 0.1200 0.01800 100.350"" 0.1500 0.02250 167.250"" 0.1800 0.02700 234.150"" 0.2100 0.03150 301.050"" 0.2400 0.03600 367.950"" 0.2700 0.04050 434.850"" 0.3000 0.04500 501.750"" 1. ROOFTOP"" Roof area Store area Area/drain Drain flow Roof slope"" hectare hectare sq.metre L/min/25mm g H:1V"" 0.297 0.223 225.000 22.500 66.667"" Using 10 roofdrains on roofstorage area of 2230. square metre"" Peak outflow 0.017 c.m/sec"" Maximum level 0.114 metre"" Maximum storage 89.482 c.m"" Centroidal lag 2.461 hours"" 0.101 0.101 0.017 0.000 c.m/sec"" 40 HYDROGRAPH Next link "" 5 Next link "" 0.101 0.017 0.017 0.000"" 57 TRENCH Design d/s of 201"" 0.017 Peak inflow"" 166.616 Hydrograph volume"" 326.750 Ground elevation"" 323.780 Downstream trench invert"" 1.200 Trench height"" 322.500 Water table elevation"" 6.500 Trench top width"" 6.500 Trench bottom width"" 35.000 Voids ratio (%)"" 18.000 Hydraulic conductivity"" 0.500 Trench gradient (%)"" 19.000 Trench length"" 1.000 Include base width"" 21. Number of stages"" Level Discharge Volume"" 323.780 0.000 0.0"" 323.928 0.000 4.4"" 324.077 0.000 10.8"" 324.225 0.000 17.2"" 324.374 0.000 23.6"" 324.522 0.000 30.0"" 324.671 0.000 36.5"" 324.819 0.000 42.9"" 324.968 0.000 49.3"" 325.116 0.013 52.0"" 325.265 0.028 52.2"" 325.414 0.039 52.4"

Page 2

39540-200-post 10yr" 325.562 0.048 52.5"" 325.711 0.055 52.7"" 325.859 0.062 52.9"" 326.008 0.068 53.0"" 326.156 0.073 53.2"" 326.305 0.078 53.4"" 326.453 0.083 53.5"" 326.602 0.087 53.7"" 326.750 0.091 53.9"" 1. TRENCH PIPES"" Downstream Pipe Pipe Pipe Perf'ted? Offset"" Invert length diam. grade% 0=Yes distance"" 324.918 3.000 0.000 -2.000 1.000 0.000"" 1. MANHOLE"" Access"" diameter"" 1.200"" 1. OUTFLOW PIPE"" 0. Inflow at upstream end of trench: 1=True; 0=False"" Upstream Downstr'm Pipe Pipe Manning Entry"" invert invert Length Diameter 'n' loss Ke"" 324.918 324.978 3.000 0.200 0.013 0.500"" Peak outflow 0.017 c.m/sec"" Outflow volume 101.911 c.m"" Peak exfiltration 0.001 c.m/sec"" Exfiltration volume 65.494 c.m"" Maximum level 325.156 metre"" Maximum storage 52.070 c.m"" Centroidal lag 2.966 hours"" Infiltration area 2 sides 45.600 sq.metre"" Infiltration Base area 123.500 sq.metre"" 0.101 0.017 0.017 0.001 c.m/sec"" 40 HYDROGRAPH Next link "" 5 Next link "" 0.101 0.017 0.017 0.001"" 33 CATCHMENT 202"" 1 Triangular SCS"" 1 Equal length"" 1 SCS method"" 202 controlled area"" 44.900 % Impervious"" 0.808 Total Area"" 25.000 Flow length"" 2.000 Overland Slope"" 0.445 Pervious Area"" 25.000 Pervious length"" 2.000 Pervious slope"" 0.363 Impervious Area"" 25.000 Impervious length"" 2.000 Impervious slope"" 0.250 Pervious Manning 'n'"" 75.000 Pervious SCS Curve No."" 0.335 Pervious Runoff coefficient"" 0.100 Pervious Ia/S coefficient"" 8.467 Pervious Initial abstraction"" 0.015 Impervious Manning 'n'"" 98.000 Impervious SCS Curve No."" 0.902 Impervious Runoff coefficient"" 0.100 Impervious Ia/S coefficient"" 0.518 Impervious Initial abstraction"" 0.127 0.017 0.017 0.001 c.m/sec"" Catchment 202 Pervious Impervious Total Area "" Surface Area 0.445 0.363 0.808 hectare"

Page 3

39540-200-post 10yr" Time of concentration 14.848 1.745 5.849 minutes"" Time to Centroid 116.702 88.790 97.531 minutes"" Rainfall depth 62.288 62.288 62.288 mm"" Rainfall volume 277.31 225.98 503.29 c.m"" Rainfall losses 41.413 6.109 25.561 mm"" Runoff depth 20.875 56.179 36.726 mm"" Runoff volume 92.94 203.81 296.75 c.m"" Runoff coefficient 0.335 0.902 0.590 "" Maximum flow 0.036 0.121 0.127 c.m/sec"" 40 HYDROGRAPH Add Runoff "" 4 Add Runoff "" 0.127 0.127 0.017 0.001"" 54 POND DESIGN"" 0.127 Current peak flow c.m/sec"" 0.072 Target outflow c.m/sec"" 398.7 Hydrograph volume c.m"" 7. Number of stages"" 321.551 Minimum water level metre"" 323.900 Maximum water level metre"" 321.551 Starting water level metre"" 0 Keep Design Data: 1 = True; 0 = False"" Level Discharge Volume"" 321.551 0.000 0.000"" 323.600 0.01743 64.100"" 323.650 0.01765 65.500"" 323.750 0.01807 97.300"" 323.800 0.04401 159.300"" 323.850 0.09128 186.000"" 323.900 0.1524 248.300"" 1. WEIRS"" Crest Weir Crest Left Right"" elevation coefficie breadth sideslope sideslope"" 323.750 0.900 1.500 0.000 0.000"" 1. ORIFICES"" Orifice Orifice Orifice Number of"" invert coefficie diameter orifices"" 321.551 0.630 0.0750 1.000"" Peak outflow 0.039 c.m/sec"" Maximum level 323.791 metre"" Maximum storage 148.463 c.m"" Centroidal lag 3.111 hours"" 0.127 0.127 0.039 0.001 c.m/sec"" 40 HYDROGRAPH Next link "" 5 Next link "" 0.127 0.039 0.039 0.001"" 33 CATCHMENT 203"" 1 Triangular SCS"" 1 Equal length"" 1 SCS method"" 203 uncontrolled area"" 6.000 % Impervious"" 0.084 Total Area"" 6.000 Flow length"" 10.000 Overland Slope"" 0.079 Pervious Area"" 6.000 Pervious length"" 10.000 Pervious slope"" 0.005 Impervious Area"" 6.000 Impervious length"" 10.000 Impervious slope"" 0.250 Pervious Manning 'n'"" 75.000 Pervious SCS Curve No."" 0.330 Pervious Runoff coefficient"

Page 4

39540-200-post 10yr" 0.100 Pervious Ia/S coefficient"" 8.467 Pervious Initial abstraction"" 0.015 Impervious Manning 'n'"" 98.000 Impervious SCS Curve No."" 0.813 Impervious Runoff coefficient"" 0.100 Impervious Ia/S coefficient"" 0.518 Impervious Initial abstraction"" 0.010 0.039 0.039 0.001 c.m/sec"" Catchment 203 Pervious Impervious Total Area "" Surface Area 0.079 0.005 0.084 hectare"" Time of concentration 3.891 0.457 3.425 minutes"" Time to Centroid 103.767 87.573 101.569 minutes"" Rainfall depth 62.288 62.288 62.288 mm"" Rainfall volume 49.18 3.14 52.32 c.m"" Rainfall losses 41.715 11.676 39.913 mm"" Runoff depth 20.572 50.612 22.375 mm"" Runoff volume 16.24 2.55 18.79 c.m"" Runoff coefficient 0.330 0.813 0.359 "" Maximum flow 0.009 0.002 0.010 c.m/sec"" 40 HYDROGRAPH Add Runoff "" 4 Add Runoff "" 0.010 0.042 0.039 0.001"" 38 START/RE-START TOTALS 203"" 3 Runoff Totals on EXIT"" Total Catchment area 1.189 hectare"" Total Impervious area 0.665 hectare"" Total % impervious 55.915"" 19 EXIT"

Page 5

39540-200-post 25yr" MIDUSS Output ----------------------------------------------->"" MIDUSS version Version 2.25 rev. 473"" MIDUSS created Sunday, February 07, 2010"" 10 Units used: ie METRIC"" Job folder: Q:\39540\200\SWM\MIDUSS"" Output filename: 39540-200-post 25yr.out"" Licensee name: Admin"" Company Microsoft"" Date & Time last used: 4/26/2017 at 7:20:27 PM"" 31 TIME PARAMETERS"" 5.000 Time Step"" 180.000 Max. Storm length"" 1500.000 Max. Hydrograph"" 32 STORM Chicago storm"" 1 Chicago storm"" 3509.000 Coefficient A"" 22.600 Constant B"" 0.925 Exponent C"" 0.400 Fraction R"" 180.000 Duration"" 1.000 Time step multiplier"" Maximum intensity 163.058 mm/hr"" Total depth 77.386 mm"" 6 025hyd Hydrograph extension used in this file"" 33 CATCHMENT 201"" 1 Triangular SCS"" 1 Equal length"" 1 SCS method"" 201 roof area"" 100.000 % Impervious"" 0.297 Total Area"" 15.000 Flow length"" 1.500 Overland Slope"" 0.000 Pervious Area"" 15.000 Pervious length"" 1.500 Pervious slope"" 0.297 Impervious Area"" 15.000 Impervious length"" 1.500 Impervious slope"" 0.250 Pervious Manning 'n'"" 75.000 Pervious SCS Curve No."" 0.000 Pervious Runoff coefficient"" 0.100 Pervious Ia/S coefficient"" 8.467 Pervious Initial abstraction"" 0.015 Impervious Manning 'n'"" 98.000 Impervious SCS Curve No."" 0.915 Impervious Runoff coefficient"" 0.100 Impervious Ia/S coefficient"" 0.518 Impervious Initial abstraction"" 0.118 0.000 0.000 0.000 c.m/sec"" Catchment 201 Pervious Impervious Total Area "" Surface Area 0.000 0.297 0.297 hectare"" Time of concentration 10.355 1.323 1.323 minutes"" Time to Centroid 109.619 87.635 87.635 minutes"" Rainfall depth 77.386 77.386 77.386 mm"" Rainfall volume 0.00 229.84 229.84 c.m"" Rainfall losses 46.570 6.588 6.588 mm"" Runoff depth 30.816 70.799 70.799 mm"" Runoff volume 0.00 210.27 210.27 c.m"" Runoff coefficient 0.000 0.915 0.915 "" Maximum flow 0.000 0.118 0.118 c.m/sec"" 40 HYDROGRAPH Add Runoff "" 4 Add Runoff "

Page 1

39540-200-post 25yr" 0.118 0.118 0.000 0.000"" 54 POND DESIGN"" 0.118 Current peak flow c.m/sec"" 0.072 Target outflow c.m/sec"" 210.3 Hydrograph volume c.m"" 11. Number of stages"" 0.000 Minimum water level metre"" 0.300 Maximum water level metre"" 0.000 Starting water level metre"" 0 Keep Design Data: 1 = True; 0 = False"" Level Discharge Volume"" 0.000 0.000 0.000"" 0.03000 0.00450 1.586"" 0.06000 0.00900 12.686"" 0.09000 0.01350 42.816"" 0.1200 0.01800 100.350"" 0.1500 0.02250 167.250"" 0.1800 0.02700 234.150"" 0.2100 0.03150 301.050"" 0.2400 0.03600 367.950"" 0.2700 0.04050 434.850"" 0.3000 0.04500 501.750"" 1. ROOFTOP"" Roof area Store area Area/drain Drain flow Roof slope"" hectare hectare sq.metre L/min/25mm g H:1V"" 0.297 0.223 225.000 22.500 66.667"" Using 10 roofdrains on roofstorage area of 2230. square metre"" Peak outflow 0.019 c.m/sec"" Maximum level 0.128 metre"" Maximum storage 119.126 c.m"" Centroidal lag 2.641 hours"" 0.118 0.118 0.019 0.000 c.m/sec"" 40 HYDROGRAPH Next link "" 5 Next link "" 0.118 0.019 0.019 0.000"" 57 TRENCH Design d/s of 201"" 0.019 Peak inflow"" 210.258 Hydrograph volume"" 326.750 Ground elevation"" 323.780 Downstream trench invert"" 1.200 Trench height"" 322.500 Water table elevation"" 6.500 Trench top width"" 6.500 Trench bottom width"" 35.000 Voids ratio (%)"" 18.000 Hydraulic conductivity"" 0.500 Trench gradient (%)"" 19.000 Trench length"" 1.000 Include base width"" 21. Number of stages"" Level Discharge Volume"" 323.780 0.000 0.0"" 323.928 0.000 4.4"" 324.077 0.000 10.8"" 324.225 0.000 17.2"" 324.374 0.000 23.6"" 324.522 0.000 30.0"" 324.671 0.000 36.5"" 324.819 0.000 42.9"" 324.968 0.000 49.3"" 325.116 0.013 52.0"" 325.265 0.028 52.2"" 325.414 0.039 52.4"

Page 2

39540-200-post 25yr" 325.562 0.048 52.5"" 325.711 0.055 52.7"" 325.859 0.062 52.9"" 326.008 0.068 53.0"" 326.156 0.073 53.2"" 326.305 0.078 53.4"" 326.453 0.083 53.5"" 326.602 0.087 53.7"" 326.750 0.091 53.9"" 1. TRENCH PIPES"" Downstream Pipe Pipe Pipe Perf'ted? Offset"" Invert length diam. grade% 0=Yes distance"" 324.918 3.000 0.000 -2.000 1.000 0.000"" 1. MANHOLE"" Access"" diameter"" 1.200"" 1. OUTFLOW PIPE"" 0. Inflow at upstream end of trench: 1=True; 0=False"" Upstream Downstr'm Pipe Pipe Manning Entry"" invert invert Length Diameter 'n' loss Ke"" 324.918 324.978 3.000 0.200 0.013 0.500"" Peak outflow 0.018 c.m/sec"" Outflow volume 141.616 c.m"" Peak exfiltration 0.001 c.m/sec"" Exfiltration volume 68.125 c.m"" Maximum level 325.189 metre"" Maximum storage 52.106 c.m"" Centroidal lag 3.099 hours"" Infiltration area 2 sides 45.600 sq.metre"" Infiltration Base area 123.500 sq.metre"" 0.118 0.019 0.018 0.001 c.m/sec"" 40 HYDROGRAPH Next link "" 5 Next link "" 0.118 0.018 0.018 0.001"" 33 CATCHMENT 202"" 1 Triangular SCS"" 1 Equal length"" 1 SCS method"" 202 controlled area"" 44.900 % Impervious"" 0.808 Total Area"" 25.000 Flow length"" 2.000 Overland Slope"" 0.445 Pervious Area"" 25.000 Pervious length"" 2.000 Pervious slope"" 0.363 Impervious Area"" 25.000 Impervious length"" 2.000 Impervious slope"" 0.250 Pervious Manning 'n'"" 75.000 Pervious SCS Curve No."" 0.398 Pervious Runoff coefficient"" 0.100 Pervious Ia/S coefficient"" 8.467 Pervious Initial abstraction"" 0.015 Impervious Manning 'n'"" 98.000 Impervious SCS Curve No."" 0.918 Impervious Runoff coefficient"" 0.100 Impervious Ia/S coefficient"" 0.518 Impervious Initial abstraction"" 0.155 0.018 0.018 0.001 c.m/sec"" Catchment 202 Pervious Impervious Total Area "" Surface Area 0.445 0.363 0.808 hectare"

Page 3

39540-200-post 25yr" Time of concentration 12.906 1.649 5.558 minutes"" Time to Centroid 112.652 88.042 96.589 minutes"" Rainfall depth 77.386 77.386 77.386 mm"" Rainfall volume 344.53 280.75 625.28 c.m"" Rainfall losses 46.583 6.343 28.515 mm"" Runoff depth 30.803 71.043 48.871 mm"" Runoff volume 137.14 257.74 394.88 c.m"" Runoff coefficient 0.398 0.918 0.632 "" Maximum flow 0.055 0.143 0.155 c.m/sec"" 40 HYDROGRAPH Add Runoff "" 4 Add Runoff "" 0.155 0.155 0.018 0.001"" 54 POND DESIGN"" 0.155 Current peak flow c.m/sec"" 0.072 Target outflow c.m/sec"" 536.5 Hydrograph volume c.m"" 7. Number of stages"" 321.551 Minimum water level metre"" 323.900 Maximum water level metre"" 321.551 Starting water level metre"" 0 Keep Design Data: 1 = True; 0 = False"" Level Discharge Volume"" 321.551 0.000 0.000"" 323.600 0.01743 64.100"" 323.650 0.01765 65.500"" 323.750 0.01807 97.300"" 323.800 0.04401 159.300"" 323.850 0.09128 186.000"" 323.900 0.1524 248.300"" 1. WEIRS"" Crest Weir Crest Left Right"" elevation coefficie breadth sideslope sideslope"" 323.750 0.900 1.500 0.000 0.000"" 1. ORIFICES"" Orifice Orifice Orifice Number of"" invert coefficie diameter orifices"" 321.551 0.630 0.0750 1.000"" Peak outflow 0.078 c.m/sec"" Maximum level 323.837 metre"" Maximum storage 179.324 c.m"" Centroidal lag 3.014 hours"" 0.155 0.155 0.078 0.001 c.m/sec"" 40 HYDROGRAPH Next link "" 5 Next link "" 0.155 0.078 0.078 0.001"" 33 CATCHMENT 203"" 1 Triangular SCS"" 1 Equal length"" 1 SCS method"" 203 uncontrolled area"" 6.000 % Impervious"" 0.084 Total Area"" 6.000 Flow length"" 10.000 Overland Slope"" 0.079 Pervious Area"" 6.000 Pervious length"" 10.000 Pervious slope"" 0.005 Impervious Area"" 6.000 Impervious length"" 10.000 Impervious slope"" 0.250 Pervious Manning 'n'"" 75.000 Pervious SCS Curve No."" 0.390 Pervious Runoff coefficient"

Page 4

39540-200-post 25yr" 0.100 Pervious Ia/S coefficient"" 8.467 Pervious Initial abstraction"" 0.015 Impervious Manning 'n'"" 98.000 Impervious SCS Curve No."" 0.817 Impervious Runoff coefficient"" 0.100 Impervious Ia/S coefficient"" 0.518 Impervious Initial abstraction"" 0.014 0.078 0.078 0.001 c.m/sec"" Catchment 203 Pervious Impervious Total Area "" Surface Area 0.079 0.005 0.084 hectare"" Time of concentration 3.382 0.432 3.034 minutes"" Time to Centroid 101.537 86.844 99.803 minutes"" Rainfall depth 77.386 77.386 77.386 mm"" Rainfall volume 61.10 3.90 65.00 c.m"" Rainfall losses 47.208 14.133 45.223 mm"" Runoff depth 30.178 63.253 32.163 mm"" Runoff volume 23.83 3.19 27.02 c.m"" Runoff coefficient 0.390 0.817 0.416 "" Maximum flow 0.013 0.002 0.014 c.m/sec"" 40 HYDROGRAPH Add Runoff "" 4 Add Runoff "" 0.014 0.084 0.078 0.001"" 38 START/RE-START TOTALS 203"" 3 Runoff Totals on EXIT"" Total Catchment area 1.189 hectare"" Total Impervious area 0.665 hectare"" Total % impervious 55.915"" 19 EXIT"

Page 5

39540-200-post 50yr" MIDUSS Output ----------------------------------------------->"" MIDUSS version Version 2.25 rev. 473"" MIDUSS created Sunday, February 07, 2010"" 10 Units used: ie METRIC"" Job folder: Q:\39540\200\SWM\MIDUSS"" Output filename: 39540-200-post 50yr.out"" Licensee name: Admin"" Company Microsoft"" Date & Time last used: 4/26/2017 at 7:21:24 PM"" 31 TIME PARAMETERS"" 5.000 Time Step"" 180.000 Max. Storm length"" 1500.000 Max. Hydrograph"" 32 STORM Chicago storm"" 1 Chicago storm"" 4620.000 Coefficient A"" 25.800 Constant B"" 0.948 Exponent C"" 0.400 Fraction R"" 180.000 Duration"" 1.000 Time step multiplier"" Maximum intensity 179.265 mm/hr"" Total depth 88.842 mm"" 6 050hyd Hydrograph extension used in this file"" 33 CATCHMENT 201"" 1 Triangular SCS"" 1 Equal length"" 1 SCS method"" 201 roof area"" 100.000 % Impervious"" 0.297 Total Area"" 15.000 Flow length"" 1.500 Overland Slope"" 0.000 Pervious Area"" 15.000 Pervious length"" 1.500 Pervious slope"" 0.297 Impervious Area"" 15.000 Impervious length"" 1.500 Impervious slope"" 0.250 Pervious Manning 'n'"" 75.000 Pervious SCS Curve No."" 0.000 Pervious Runoff coefficient"" 0.100 Pervious Ia/S coefficient"" 8.467 Pervious Initial abstraction"" 0.015 Impervious Manning 'n'"" 98.000 Impervious SCS Curve No."" 0.922 Impervious Runoff coefficient"" 0.100 Impervious Ia/S coefficient"" 0.518 Impervious Initial abstraction"" 0.131 0.000 0.000 0.000 c.m/sec"" Catchment 201 Pervious Impervious Total Area "" Surface Area 0.000 0.297 0.297 hectare"" Time of concentration 9.503 1.271 1.271 minutes"" Time to Centroid 107.777 87.282 87.282 minutes"" Rainfall depth 88.842 88.842 88.842 mm"" Rainfall volume 0.00 263.86 263.86 c.m"" Rainfall losses 49.929 6.928 6.928 mm"" Runoff depth 38.913 81.914 81.914 mm"" Runoff volume 0.00 243.28 243.28 c.m"" Runoff coefficient 0.000 0.922 0.922 "" Maximum flow 0.000 0.131 0.131 c.m/sec"" 40 HYDROGRAPH Add Runoff "" 4 Add Runoff "

Page 1

39540-200-post 50yr" 0.131 0.131 0.000 0.000"" 54 POND DESIGN"" 0.131 Current peak flow c.m/sec"" 0.072 Target outflow c.m/sec"" 243.3 Hydrograph volume c.m"" 11. Number of stages"" 0.000 Minimum water level metre"" 0.300 Maximum water level metre"" 0.000 Starting water level metre"" 0 Keep Design Data: 1 = True; 0 = False"" Level Discharge Volume"" 0.000 0.000 0.000"" 0.03000 0.00450 1.586"" 0.06000 0.00900 12.686"" 0.09000 0.01350 42.816"" 0.1200 0.01800 100.350"" 0.1500 0.02250 167.250"" 0.1800 0.02700 234.150"" 0.2100 0.03150 301.050"" 0.2400 0.03600 367.950"" 0.2700 0.04050 434.850"" 0.3000 0.04500 501.750"" 1. ROOFTOP"" Roof area Store area Area/drain Drain flow Roof slope"" hectare hectare sq.metre L/min/25mm g H:1V"" 0.297 0.223 225.000 22.500 66.667"" Using 10 roofdrains on roofstorage area of 2230. square metre"" Peak outflow 0.021 c.m/sec"" Maximum level 0.139 metre"" Maximum storage 141.835 c.m"" Centroidal lag 2.765 hours"" 0.131 0.131 0.021 0.000 c.m/sec"" 40 HYDROGRAPH Next link "" 5 Next link "" 0.131 0.021 0.021 0.000"" 57 TRENCH Design d/s of 201"" 0.021 Peak inflow"" 243.309 Hydrograph volume"" 326.750 Ground elevation"" 323.780 Downstream trench invert"" 1.200 Trench height"" 322.500 Water table elevation"" 6.500 Trench top width"" 6.500 Trench bottom width"" 35.000 Voids ratio (%)"" 18.000 Hydraulic conductivity"" 0.500 Trench gradient (%)"" 19.000 Trench length"" 1.000 Include base width"" 21. Number of stages"" Level Discharge Volume"" 323.780 0.000 0.0"" 323.928 0.000 4.4"" 324.077 0.000 10.8"" 324.225 0.000 17.2"" 324.374 0.000 23.6"" 324.522 0.000 30.0"" 324.671 0.000 36.5"" 324.819 0.000 42.9"" 324.968 0.000 49.3"" 325.116 0.013 52.0"" 325.265 0.028 52.2"" 325.414 0.039 52.4"

Page 2

39540-200-post 50yr" 325.562 0.048 52.5"" 325.711 0.055 52.7"" 325.859 0.062 52.9"" 326.008 0.068 53.0"" 326.156 0.073 53.2"" 326.305 0.078 53.4"" 326.453 0.083 53.5"" 326.602 0.087 53.7"" 326.750 0.091 53.9"" 1. TRENCH PIPES"" Downstream Pipe Pipe Pipe Perf'ted? Offset"" Invert length diam. grade% 0=Yes distance"" 324.918 3.000 0.000 -2.000 1.000 0.000"" 1. MANHOLE"" Access"" diameter"" 1.200"" 1. OUTFLOW PIPE"" 0. Inflow at upstream end of trench: 1=True; 0=False"" Upstream Downstr'm Pipe Pipe Manning Entry"" invert invert Length Diameter 'n' loss Ke"" 324.918 324.978 3.000 0.200 0.013 0.500"" Peak outflow 0.020 c.m/sec"" Outflow volume 173.213 c.m"" Peak exfiltration 0.001 c.m/sec"" Exfiltration volume 69.952 c.m"" Maximum level 325.192 metre"" Maximum storage 52.110 c.m"" Centroidal lag 3.186 hours"" Infiltration area 2 sides 45.600 sq.metre"" Infiltration Base area 123.500 sq.metre"" 0.131 0.021 0.020 0.001 c.m/sec"" 40 HYDROGRAPH Next link "" 5 Next link "" 0.131 0.020 0.020 0.001"" 33 CATCHMENT 202"" 1 Triangular SCS"" 1 Equal length"" 1 SCS method"" 202 controlled area"" 44.900 % Impervious"" 0.808 Total Area"" 25.000 Flow length"" 2.000 Overland Slope"" 0.445 Pervious Area"" 25.000 Pervious length"" 2.000 Pervious slope"" 0.363 Impervious Area"" 25.000 Impervious length"" 2.000 Impervious slope"" 0.250 Pervious Manning 'n'"" 75.000 Pervious SCS Curve No."" 0.439 Pervious Runoff coefficient"" 0.100 Pervious Ia/S coefficient"" 8.467 Pervious Initial abstraction"" 0.015 Impervious Manning 'n'"" 98.000 Impervious SCS Curve No."" 0.927 Impervious Runoff coefficient"" 0.100 Impervious Ia/S coefficient"" 0.518 Impervious Initial abstraction"" 0.185 0.020 0.020 0.001 c.m/sec"" Catchment 202 Pervious Impervious Total Area "" Surface Area 0.445 0.363 0.808 hectare"

Page 3

39540-200-post 50yr" Time of concentration 11.843 1.585 5.357 minutes"" Time to Centroid 110.520 87.673 96.074 minutes"" Rainfall depth 88.842 88.842 88.842 mm"" Rainfall volume 395.53 322.31 717.84 c.m"" Rainfall losses 49.820 6.506 30.372 mm"" Runoff depth 39.022 82.336 58.470 mm"" Runoff volume 173.73 298.71 472.44 c.m"" Runoff coefficient 0.439 0.927 0.658 "" Maximum flow 0.071 0.159 0.185 c.m/sec"" 40 HYDROGRAPH Add Runoff "" 4 Add Runoff "" 0.185 0.185 0.020 0.001"" 54 POND DESIGN"" 0.185 Current peak flow c.m/sec"" 0.072 Target outflow c.m/sec"" 645.6 Hydrograph volume c.m"" 7. Number of stages"" 321.551 Minimum water level metre"" 323.900 Maximum water level metre"" 321.551 Starting water level metre"" 0 Keep Design Data: 1 = True; 0 = False"" Level Discharge Volume"" 321.551 0.000 0.000"" 323.600 0.01743 64.100"" 323.650 0.01765 65.500"" 323.750 0.01807 97.300"" 323.800 0.04401 159.300"" 323.850 0.09128 186.000"" 323.900 0.1524 248.300"" 1. WEIRS"" Crest Weir Crest Left Right"" elevation coefficie breadth sideslope sideslope"" 323.750 0.900 1.500 0.000 0.000"" 1. ORIFICES"" Orifice Orifice Orifice Number of"" invert coefficie diameter orifices"" 321.551 0.630 0.0750 1.000"" Peak outflow 0.104 c.m/sec"" Maximum level 323.860 metre"" Maximum storage 198.745 c.m"" Centroidal lag 2.951 hours"" 0.185 0.185 0.104 0.001 c.m/sec"" 40 HYDROGRAPH Next link "" 5 Next link "" 0.185 0.104 0.104 0.001"" 33 CATCHMENT 203"" 1 Triangular SCS"" 1 Equal length"" 1 SCS method"" 203 uncontrolled area"" 6.000 % Impervious"" 0.084 Total Area"" 6.000 Flow length"" 10.000 Overland Slope"" 0.079 Pervious Area"" 6.000 Pervious length"" 10.000 Pervious slope"" 0.005 Impervious Area"" 6.000 Impervious length"" 10.000 Impervious slope"" 0.250 Pervious Manning 'n'"" 75.000 Pervious SCS Curve No."" 0.430 Pervious Runoff coefficient"

Page 4

39540-200-post 50yr" 0.100 Pervious Ia/S coefficient"" 8.467 Pervious Initial abstraction"" 0.015 Impervious Manning 'n'"" 98.000 Impervious SCS Curve No."" 0.821 Impervious Runoff coefficient"" 0.100 Impervious Ia/S coefficient"" 0.518 Impervious Initial abstraction"" 0.017 0.104 0.104 0.001 c.m/sec"" Catchment 203 Pervious Impervious Total Area "" Surface Area 0.079 0.005 0.084 hectare"" Time of concentration 3.104 0.415 2.812 minutes"" Time to Centroid 100.327 86.472 98.823 minutes"" Rainfall depth 88.842 88.842 88.842 mm"" Rainfall volume 70.15 4.48 74.63 c.m"" Rainfall losses 50.639 15.934 48.557 mm"" Runoff depth 38.203 72.908 40.285 mm"" Runoff volume 30.16 3.67 33.84 c.m"" Runoff coefficient 0.430 0.821 0.453 "" Maximum flow 0.016 0.002 0.017 c.m/sec"" 40 HYDROGRAPH Add Runoff "" 4 Add Runoff "" 0.017 0.111 0.104 0.001"" 38 START/RE-START TOTALS 203"" 3 Runoff Totals on EXIT"" Total Catchment area 1.189 hectare"" Total Impervious area 0.665 hectare"" Total % impervious 55.915"" 19 EXIT"

Page 5

39540-200-post 100yr" MIDUSS Output ----------------------------------------------->"" MIDUSS version Version 2.25 rev. 473"" MIDUSS created Sunday, February 07, 2010"" 10 Units used: ie METRIC"" Job folder: Q:\39540\200\SWM\MIDUSS"" Output filename: 39540-200-post 100yr.out"" Licensee name: Admin"" Company Microsoft"" Date & Time last used: 4/26/2017 at 7:22:16 PM"" 31 TIME PARAMETERS"" 5.000 Time Step"" 180.000 Max. Storm length"" 1500.000 Max. Hydrograph"" 32 STORM Chicago storm"" 1 Chicago storm"" 5886.000 Coefficient A"" 28.600 Constant B"" 0.969 Exponent C"" 0.400 Fraction R"" 180.000 Duration"" 1.000 Time step multiplier"" Maximum intensity 195.343 mm/hr"" Total depth 99.891 mm"" 6 100hyd Hydrograph extension used in this file"" 33 CATCHMENT 201"" 1 Triangular SCS"" 1 Equal length"" 1 SCS method"" 201 roof area"" 100.000 % Impervious"" 0.297 Total Area"" 15.000 Flow length"" 1.500 Overland Slope"" 0.000 Pervious Area"" 15.000 Pervious length"" 1.500 Pervious slope"" 0.297 Impervious Area"" 15.000 Impervious length"" 1.500 Impervious slope"" 0.250 Pervious Manning 'n'"" 75.000 Pervious SCS Curve No."" 0.000 Pervious Runoff coefficient"" 0.100 Pervious Ia/S coefficient"" 8.467 Pervious Initial abstraction"" 0.015 Impervious Manning 'n'"" 98.000 Impervious SCS Curve No."" 0.927 Impervious Runoff coefficient"" 0.100 Impervious Ia/S coefficient"" 0.518 Impervious Initial abstraction"" 0.144 0.000 0.000 0.000 c.m/sec"" Catchment 201 Pervious Impervious Total Area "" Surface Area 0.000 0.297 0.297 hectare"" Time of concentration 8.849 1.227 1.227 minutes"" Time to Centroid 106.265 86.985 86.985 minutes"" Rainfall depth 99.891 99.891 99.891 mm"" Rainfall volume 0.00 296.68 296.68 c.m"" Rainfall losses 52.621 7.287 7.287 mm"" Runoff depth 47.270 92.604 92.604 mm"" Runoff volume 0.00 275.03 275.03 c.m"" Runoff coefficient 0.000 0.927 0.927 "" Maximum flow 0.000 0.144 0.144 c.m/sec"" 40 HYDROGRAPH Add Runoff "" 4 Add Runoff "

Page 1

39540-200-post 100yr" 0.144 0.144 0.000 0.000"" 54 POND DESIGN"" 0.144 Current peak flow c.m/sec"" 0.072 Target outflow c.m/sec"" 275.0 Hydrograph volume c.m"" 11. Number of stages"" 0.000 Minimum water level metre"" 0.300 Maximum water level metre"" 0.000 Starting water level metre"" 0 Keep Design Data: 1 = True; 0 = False"" Level Discharge Volume"" 0.000 0.000 0.000"" 0.03000 0.00450 1.586"" 0.06000 0.00900 12.686"" 0.09000 0.01350 42.816"" 0.1200 0.01800 100.350"" 0.1500 0.02250 167.250"" 0.1800 0.02700 234.150"" 0.2100 0.03150 301.050"" 0.2400 0.03600 367.950"" 0.2700 0.04050 434.850"" 0.3000 0.04500 501.750"" 1. ROOFTOP"" Roof area Store area Area/drain Drain flow Roof slope"" hectare hectare sq.metre L/min/25mm g H:1V"" 0.297 0.223 225.000 22.500 66.667"" Using 10 roofdrains on roofstorage area of 2230. square metre"" Peak outflow 0.022 c.m/sec"" Maximum level 0.149 metre"" Maximum storage 164.112 c.m"" Centroidal lag 2.873 hours"" 0.144 0.144 0.022 0.000 c.m/sec"" 40 HYDROGRAPH Next link "" 5 Next link "" 0.144 0.022 0.022 0.000"" 57 TRENCH Design d/s of 201"" 0.022 Peak inflow"" 275.025 Hydrograph volume"" 326.750 Ground elevation"" 323.780 Downstream trench invert"" 1.200 Trench height"" 322.500 Water table elevation"" 6.500 Trench top width"" 6.500 Trench bottom width"" 35.000 Voids ratio (%)"" 18.000 Hydraulic conductivity"" 0.500 Trench gradient (%)"" 19.000 Trench length"" 1.000 Include base width"" 21. Number of stages"" Level Discharge Volume"" 323.780 0.000 0.0"" 323.928 0.000 4.4"" 324.077 0.000 10.8"" 324.225 0.000 17.2"" 324.374 0.000 23.6"" 324.522 0.000 30.0"" 324.671 0.000 36.5"" 324.819 0.000 42.9"" 324.968 0.000 49.3"" 325.116 0.013 52.0"" 325.265 0.028 52.2"" 325.414 0.039 52.4"

Page 2

39540-200-post 100yr" 325.562 0.048 52.5"" 325.711 0.055 52.7"" 325.859 0.062 52.9"" 326.008 0.068 53.0"" 326.156 0.073 53.2"" 326.305 0.078 53.4"" 326.453 0.083 53.5"" 326.602 0.087 53.7"" 326.750 0.091 53.9"" 1. TRENCH PIPES"" Downstream Pipe Pipe Pipe Perf'ted? Offset"" Invert length diam. grade% 0=Yes distance"" 324.918 3.000 0.000 -2.000 1.000 0.000"" 1. MANHOLE"" Access"" diameter"" 1.200"" 1. OUTFLOW PIPE"" 0. Inflow at upstream end of trench: 1=True; 0=False"" Upstream Downstr'm Pipe Pipe Manning Entry"" invert invert Length Diameter 'n' loss Ke"" 324.918 324.978 3.000 0.200 0.013 0.500"" Peak outflow 0.021 c.m/sec"" Outflow volume 202.660 c.m"" Peak exfiltration 0.001 c.m/sec"" Exfiltration volume 71.560 c.m"" Maximum level 325.225 metre"" Maximum storage 52.147 c.m"" Centroidal lag 3.270 hours"" Infiltration area 2 sides 45.600 sq.metre"" Infiltration Base area 123.500 sq.metre"" 0.144 0.022 0.021 0.001 c.m/sec"" 40 HYDROGRAPH Next link "" 5 Next link "" 0.144 0.021 0.021 0.001"" 33 CATCHMENT 202"" 1 Triangular SCS"" 1 Equal length"" 1 SCS method"" 202 controlled area"" 44.900 % Impervious"" 0.808 Total Area"" 25.000 Flow length"" 2.000 Overland Slope"" 0.445 Pervious Area"" 25.000 Pervious length"" 2.000 Pervious slope"" 0.363 Impervious Area"" 25.000 Impervious length"" 2.000 Impervious slope"" 0.250 Pervious Manning 'n'"" 75.000 Pervious SCS Curve No."" 0.474 Pervious Runoff coefficient"" 0.100 Pervious Ia/S coefficient"" 8.467 Pervious Initial abstraction"" 0.015 Impervious Manning 'n'"" 98.000 Impervious SCS Curve No."" 0.933 Impervious Runoff coefficient"" 0.100 Impervious Ia/S coefficient"" 0.518 Impervious Initial abstraction"" 0.218 0.021 0.021 0.001 c.m/sec"" Catchment 202 Pervious Impervious Total Area "" Surface Area 0.445 0.363 0.808 hectare"

Page 3

39540-200-post 100yr" Time of concentration 11.029 1.529 5.178 minutes"" Time to Centroid 108.836 87.367 95.613 minutes"" Rainfall depth 99.891 99.891 99.891 mm"" Rainfall volume 444.72 362.40 807.12 c.m"" Rainfall losses 52.542 6.715 31.965 mm"" Runoff depth 47.349 93.176 67.925 mm"" Runoff volume 210.80 338.04 548.84 c.m"" Runoff coefficient 0.474 0.933 0.680 "" Maximum flow 0.090 0.175 0.218 c.m/sec"" 40 HYDROGRAPH Add Runoff "" 4 Add Runoff "" 0.218 0.218 0.021 0.001"" 54 POND DESIGN"" 0.218 Current peak flow c.m/sec"" 0.072 Target outflow c.m/sec"" 751.5 Hydrograph volume c.m"" 7. Number of stages"" 321.551 Minimum water level metre"" 323.900 Maximum water level metre"" 321.551 Starting water level metre"" 0 Keep Design Data: 1 = True; 0 = False"" Level Discharge Volume"" 321.551 0.000 0.000"" 323.600 0.01743 64.100"" 323.650 0.01765 65.500"" 323.750 0.01807 97.300"" 323.800 0.04401 159.300"" 323.850 0.09128 186.000"" 323.900 0.1524 248.300"" 1. WEIRS"" Crest Weir Crest Left Right"" elevation coefficie breadth sideslope sideslope"" 323.750 0.900 1.500 0.000 0.000"" 1. ORIFICES"" Orifice Orifice Orifice Number of"" invert coefficie diameter orifices"" 321.551 0.630 0.0750 1.000"" Peak outflow 0.126 c.m/sec"" Maximum level 323.878 metre"" Maximum storage 221.231 c.m"" Centroidal lag 2.913 hours"" 0.218 0.218 0.126 0.001 c.m/sec"" 40 HYDROGRAPH Next link "" 5 Next link "" 0.218 0.126 0.126 0.001"" 33 CATCHMENT 203"" 1 Triangular SCS"" 1 Equal length"" 1 SCS method"" 203 uncontrolled area"" 6.000 % Impervious"" 0.084 Total Area"" 6.000 Flow length"" 10.000 Overland Slope"" 0.079 Pervious Area"" 6.000 Pervious length"" 10.000 Pervious slope"" 0.005 Impervious Area"" 6.000 Impervious length"" 10.000 Impervious slope"" 0.250 Pervious Manning 'n'"" 75.000 Pervious SCS Curve No."" 0.464 Pervious Runoff coefficient"

Page 4

39540-200-post 100yr" 0.100 Pervious Ia/S coefficient"" 8.467 Pervious Initial abstraction"" 0.015 Impervious Manning 'n'"" 98.000 Impervious SCS Curve No."" 0.823 Impervious Runoff coefficient"" 0.100 Impervious Ia/S coefficient"" 0.518 Impervious Initial abstraction"" 0.020 0.126 0.126 0.001 c.m/sec"" Catchment 203 Pervious Impervious Total Area "" Surface Area 0.079 0.005 0.084 hectare"" Time of concentration 2.890 0.401 2.637 minutes"" Time to Centroid 99.316 86.145 97.976 minutes"" Rainfall depth 99.891 99.891 99.891 mm"" Rainfall volume 78.87 5.03 83.91 c.m"" Rainfall losses 53.538 17.682 51.387 mm"" Runoff depth 46.353 82.209 48.504 mm"" Runoff volume 36.60 4.14 40.74 c.m"" Runoff coefficient 0.464 0.823 0.486 "" Maximum flow 0.019 0.002 0.020 c.m/sec"" 40 HYDROGRAPH Add Runoff "" 4 Add Runoff "" 0.020 0.134 0.126 0.001"" 38 START/RE-START TOTALS 203"" 3 Runoff Totals on EXIT"" Total Catchment area 1.189 hectare"" Total Impervious area 0.665 hectare"" Total % impervious 55.915"" 19 EXIT"

Page 5

APPENDIX C

GEOTECHNICAL INVESTIGATION

APPENDIX D

WATER BALANCE ANALYSIS

PR

OJ

EC

T N

AM

EW

AT

ER

BA

LA

NC

E (

INF

ILT

RA

TIO

N)

AN

AL

YS

ISC

ity, O

nta

rio

Pro

ject N

um

ber:

39540-2

00

Date

:

Desig

n B

y:JC

C

File

:

INF

ILT

RA

TIO

N

ha

mm

/yr/

m2

m3/y

rha

mm

/yr/

m2

m3/y

rha

mm

/yr/

m2

m3/y

r

201

0.2

97

225

668

0.0

06

180

11

0.2

91

00

1 S

ee T

able

1

202

0.8

08

225

1818

0.4

45

180

801

0.3

63

00

203

0.0

84

225

189

0.0

79

180

142

0.0

05

00

To

tal

1.1

89

2675

0.5

30

954

0.6

59

0

SU

MM

AR

Y

Po

st-

develo

pm

en

t In

filt

rati

on

Vo

lum

e

P

erv

ious (

Passiv

e)

954

m3/y

r

Im

perv

ious (

Active)

+0

m3/y

r

In

filtra

tion G

alle

ry V

olu

me

1,8

71

2825

m3/y

rP

re-d

evelo

pm

ent soil

chara

cte

ristics:

Rolli

ng lands, pastu

re/s

hru

bs, silt

loam

Pre

-develo

pm

en

t In

filt

rati

on

Vo

lum

e-

2675

m3/y

rP

recip

itation

Evapo-

transpir

ation

Runoff

Infiltra

tion

Unit:

mm

mm

mm

mm

Net

Gain

of

Infi

ltra

tio

n150

m3/y

r923

577

121

225

IMP

ER

VIO

US

VO

LU

ME

FO

R R

OO

F A

RE

AS

Post-

develo

pm

ent soil

chara

cte

ristics:

Rolli

ng lands, urb

an law

n, silt

loam

Pre

cip

itation

Evapo-

transpir

ation

Runoff

Infiltra

tion

0.2

97

ha

Tota

l ro

of

are

a infiltra

ted

Unit:

mm

mm

mm

mm

=2,9

70

m2

Tota

l ro

of

are

a infiltra

ted

923

574

180

180

pre

cip

itation s

ourc

e: C

limate

Norm

als

, G

overn

ment of

Canada (

1971-2

000)

Tab

le 1

: Im

perv

iou

s V

olu

me f

or

Ro

of

Are

as o

n P

erv

iou

s S

oils

Rain

fall D

ep

thIn

filt

rati

on

Rate

Infi

ltra

tio

n

Vo

lum

eC

aptu

ring the 1

5 m

m s

torm

event in

an infiltra

tion g

alle

ry:

mm

mm

/yr/

m2

m3/y

rcaptu

re v

olu

me:

45

m^3

Void

ratio:

0.3

5

10

550

1,6

34

Galle

ry V

olu

me:

146.3

8m

^3(a

ccounting f

or

a 1

5%

safe

ty f

acto

r)

15

630

1,8

71

length

to w

idth

ratio

3:1

20

670

1,9

90

Galle

ry d

epth

:1.2

m

25

720

2,1

38

Galle

ry w

idth

:6.5

0m

30

750

2,2

28

Galle

ry length

:19.0

0m

Lo

cati

on

Perv

iou

s A

rea

Dra

inin

g t

o

Lo

cati

on

Infi

ltra

tio

n

Rate

Apri

l 27, 2017

Q:\

39540\2

00\S

WM

\39540-2

00_M

icro

Dra

inage A

naly

sis

_R

ev2.x

ls

Pre

-develo

pm

en

t

Infi

ltra

tio

n

Vo

lum

e

Perv

iou

s (

Passiv

e)

Co

mm

en

ts

Po

st-

develo

pm

en

t

Imp

erv

iou

s (

Acti

ve)

Are

a D

rain

ing

to

Lo

cati

on

Infi

ltra

tio

n

Vo

lum

e

Infi

ltra

tio

n

Rate

Are

a

Dra

inin

g t

o

Lo

cati

on

Infi

ltra

tio

n

Vo

lum

eIn

filt

rati

on

Rate

Q:\39540\2

00\S

WM

\39540-2

00_M

icro

Dra

inage A

naly

sis

_R

ev2

4/2

7/2

017 1

0:0

0 A

M


Recommended