FINAL SUMMARY REPORT SEDIMENT MANAGEMENT UNIT 56/57 DEMONSTRATION PROJECT FOX RIVER, GREEN BAY, WISCONSIN September 2001 Prepared For: Fox River Group of Companies and Wisconsin Department of Natural Resources ••• Prepared By: Montgomery Watson Project No. 1242291/2082057.01470101 <U}) MONTGOMERY WATSON
Transcript
FINAL SUMMARY REPORT
SEDIMENT MANAGEMENT UNIT 56/57 DEMONSTRATION PROJECT FOX RIVER, GREEN BAY, WISCONSIN
September 2001
Prepared For:
Fox River Group of Companies and
Wisconsin Department of Natural Resources
•••
Prepared By:
Montgomery Watson
Project No. 1242291/2082057.01470101
<U}) MONTGOMERY WATSON
September 21, 2001
Mark Travers
Fox River Group Representative
c/o Environ Corp.
225 West Wacker Drive
Suite 1975
Chicago, IL 60606
Re: Final Summary Report
Greg Hill
Wisconsin Department of Natural Resources
Bureau of Watershed Management- WT/2
101 South Webster Street
P.O. Box 7921
Madison, WI 53707-7921
Fox River SMU 56/57 Demonstration Project, Green Bay, Wisconsin
Gentlemen:
Enclosed is the Final Summary Report for the Fox River SMU 56/57 Demonstration
Project. The Report covers, among other things, the results of dredging that occurred in the
Fall of 1999. An interactive CD-ROM containing the Report in PDF format will be sent to
N :\Jobs\208\2057\0 I \wp\ltr\99 _ Fox River Cover Letter.doc
2082057.01470101-MADI
One Science Court
P.O. Box 5385
Madison, Wisconsin
53705-0385
Tel: 608 231 4747 Fax: 608 231 4777
Delivering Innovative Projects and Solutions Worldwide
ES-1
EXECUTIVE SUMMARY
The Sediment Management Unit 56/57 Demonstration Project in Green Bay, Wisconsinwas managed by the Wisconsin Department of Natural Resources (WDNR). The FoxRiver Group of Companies provided funding. Montgomery Watson was the engineer andgeneral contractor. The purposes of the Project were to provide information for anassessment of the implementability, environmental effectiveness, and expense of large-scale sediment dredging and disposal from the lower Fox River, while removing PCB-containing sediments from the river ecosystem. Operational monitoring provided asubstantial amount of implementation and cost information that the stakeholders can usefor these assessments. Environmental monitoring was performed and reported upon byothers.
Dredging was performed for a 15-week period between August 30 and December 15, 1999.A hydraulic dredge equipped with a 12-inch pump and a 9-foot wide horizontal augercutterhead was used for most of the dredging work. An estimated 31,346 cubic yards ofsediment and 1,441 pounds of PCBs were removed from the river. Water separated fromthe dredged solids was treated and discharged back to the river under a Project WPDESPermit. The treatment system included filtration and granular activated carbon; monitoringresults indicated the carbon was necessary to comply with the PCB discharge limit of 1.2ug/L. A total of 75,256,500 gallons of water were treated in the system with a normaloperating capacity of 900 gallons per minute. The dredged solids were mixed with limeand dewatered in a series of plate and frame filter presses, having a total capacity of 800cubic feet. The dewatered sediments were transported and disposed in a speciallyconstructed cell at the Fort James Green Bay industrial landfill, under a permitmodification from the WDNR. The work ended in December 1999 because of coldweather considerations, which delayed completion of demobilization and site restorationactivities until June and July 2000. The Project costs totaled just under $12.4 million,inclusive of investigation, pre-design, procurement, permitting, and the value of in-kindservices. The construction and monitoring portion was about $11.5 million, or $366 percubic yard of sediment removed.
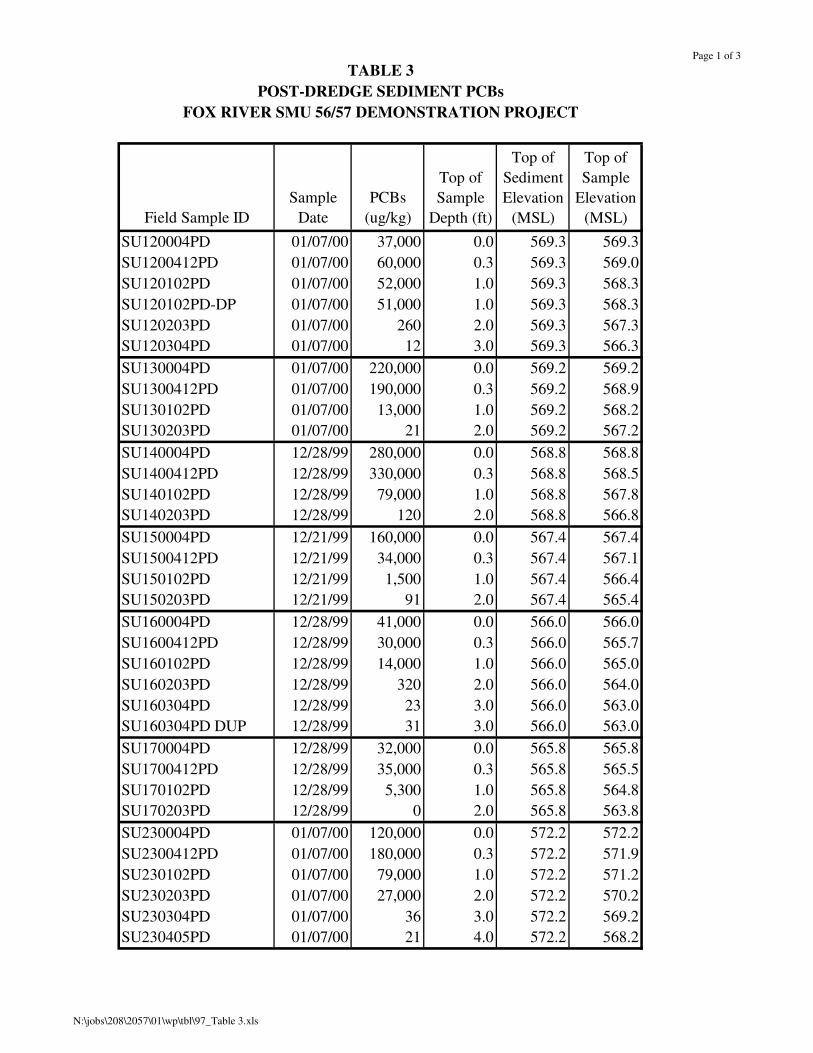
In three of four small areas where a clean-up dredging pass was performed, PCBconcentrations in the surface sediments were less after dredging compared to beforedredging. In the fourth location, the surface PCB concentrations were slightly elevated. Inareas where a clean-up dredge pass was not able to be performed before ending the work,surface PCB concentrations were higher after dredging because sediment removal was notcompleted (i.e., dredging did not reach the target elevations).
This Project demonstrated, among other things, that PCB-containing sediments could behydraulically dredged, mechanically dewatered, and disposed with large-scale equipment,but the production rates expected at the start of the Project were not achieved. Thisaffected Project duration and cost, as well as the in-river sediment conditions left when thework ended.
2.0 CONTRACTING ARRANGEMENTS AND PROJECT TIME LINE .................. 2-1
3.0 PERMITS AND APPROVALS............................................................................ 3-1
4.0 PROJECT COMPONENTS ................................................................................. 4-14.1 INVESTIGATION AND PRE-DESIGN...................................................... 4-1
4.1.1 SMU 56/57. ..................................................................................... 4-14.1.2 Former Shell Oil Company Property. ................................................ 4-24.1.3 Pre-Design of Project Elements. ....................................................... 4-2
4.2 PROCUREMENT AND PERMITTING...................................................... 4-44.3 CONSTRUCTION ...................................................................................... 4-5
4.3.1 Site Improvements............................................................................ 4-54.3.2 Dredging. ......................................................................................... 4-64.3.3 Water Treatment. ............................................................................. 4-94.3.4 Dewatering......................................................................................4-124.3.5 Transportation and Disposal. ...........................................................4-14
4.4 OPERATIONAL MONITORING...............................................................4-144.4.1 Equalization Basin Liner Testing......................................................4-164.4.2 Turbidity Monitoring During Silt Curtain Installation. ......................4-174.4.3 Real-Time Turbidity Monitoring During Dredging. ..........................4-174.4.4 Dredge Production Monitoring. .......................................................4-194.4.5 Shoreline Stability Monitoring. ........................................................4-194.4.6 Dewatered Sediment Monitoring. ....................................................4-204.4.7 Water Treatment WPDES Permit Monitoring. .................................4-214.4.8 Inner Treatment Process Monitoring................................................4-234.4.9 Other Sampling for Landfill Disposal Characterization. ....................4-234.4.10 Dredge Slurry Monitoring................................................................4-234.4.11 Pre-Dredge And Post-Dredge Monitoring........................................4-24
5.1.3 Turbidity Near the Dredge. ............................................................... 5-25.1.4 Turbidity Inside and Outside the Silt Curtain..................................... 5-25.1.5 Dredge Slurry Test Results. .............................................................. 5-4
5.2 WATER TREATMENT .............................................................................. 5-55.2.1 Influent Test Results. ........................................................................ 5-55.2.2 Effluent Test Results. ....................................................................... 5-65.2.3 PCB And Mercury Mass Discharged to the River. ............................ 5-85.2.4 Treatment Process Evaluation........................................................... 5-85.2.5 Treatment Media Residual PCB Concentrations...............................5-10
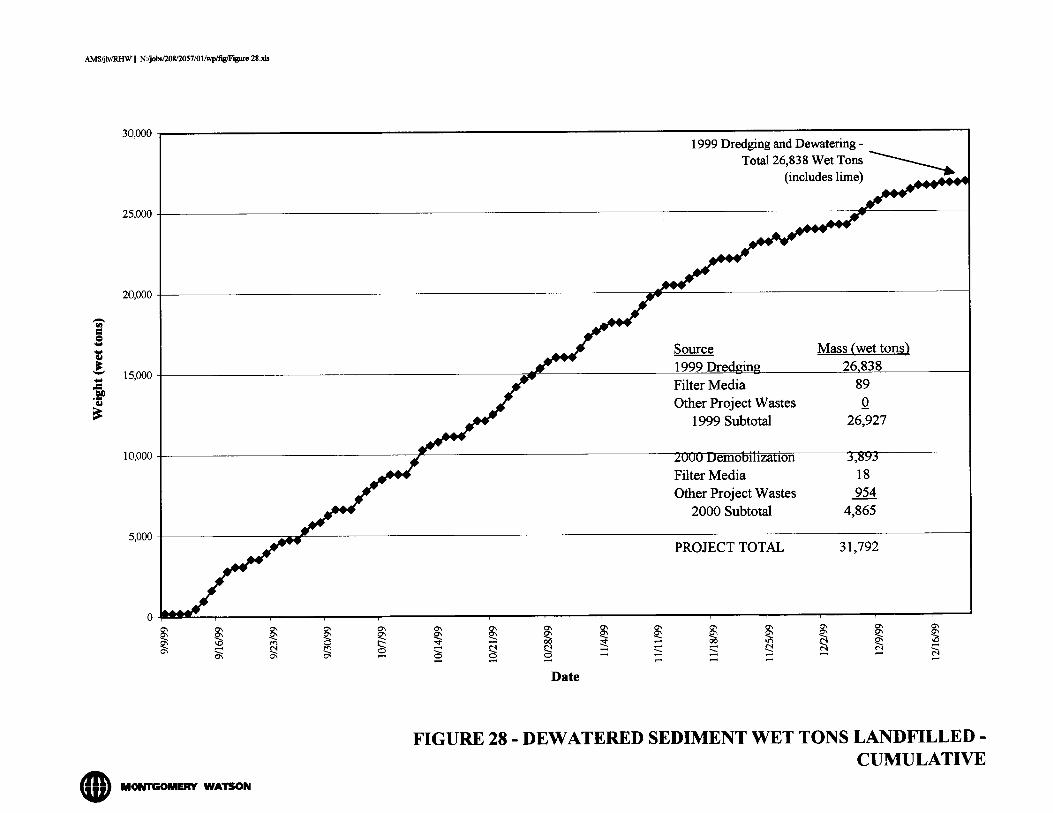
5.3 DEWATERING..........................................................................................5-105.3.1 Dewatered Sediment Physical Test Results. .....................................5-105.3.2 Mass of Sediment Landfilled............................................................5-115.3.3 Sediment PCB and Mercury Concentrations. ...................................5-125.3.4 PCB and Mercury Mass Removed By Dredging...............................5-12
5.4 DREDGE AREA CONDITIONS................................................................5-13
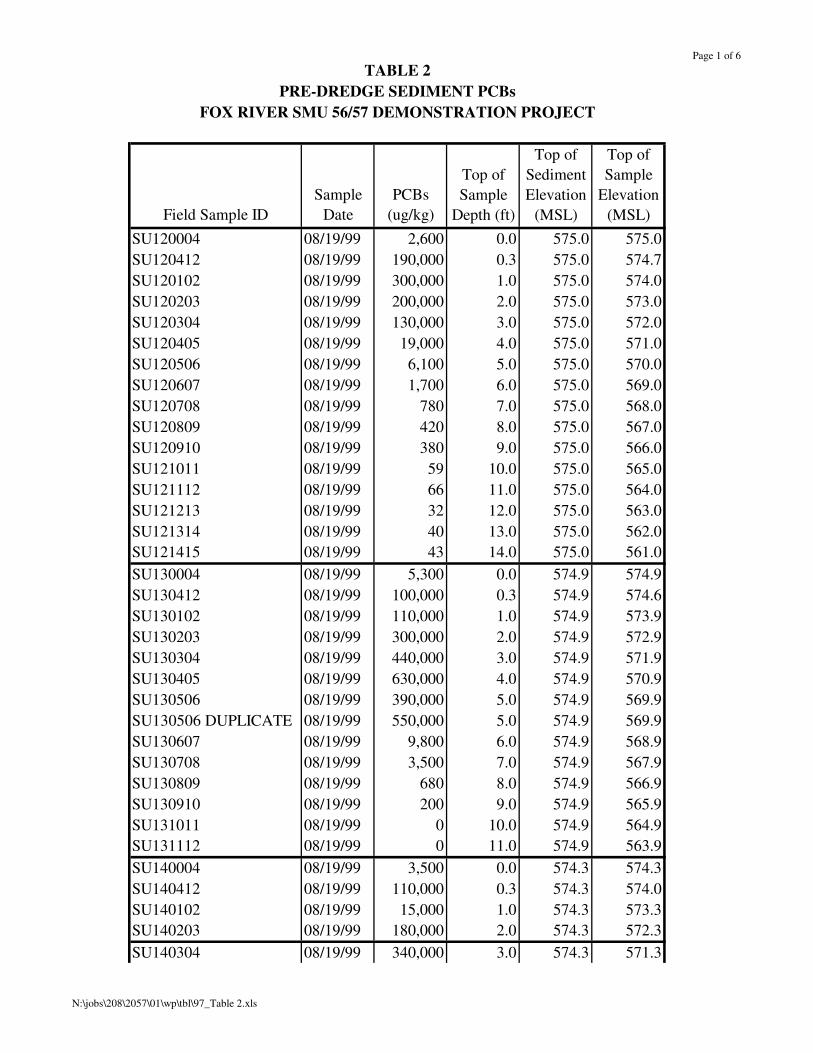
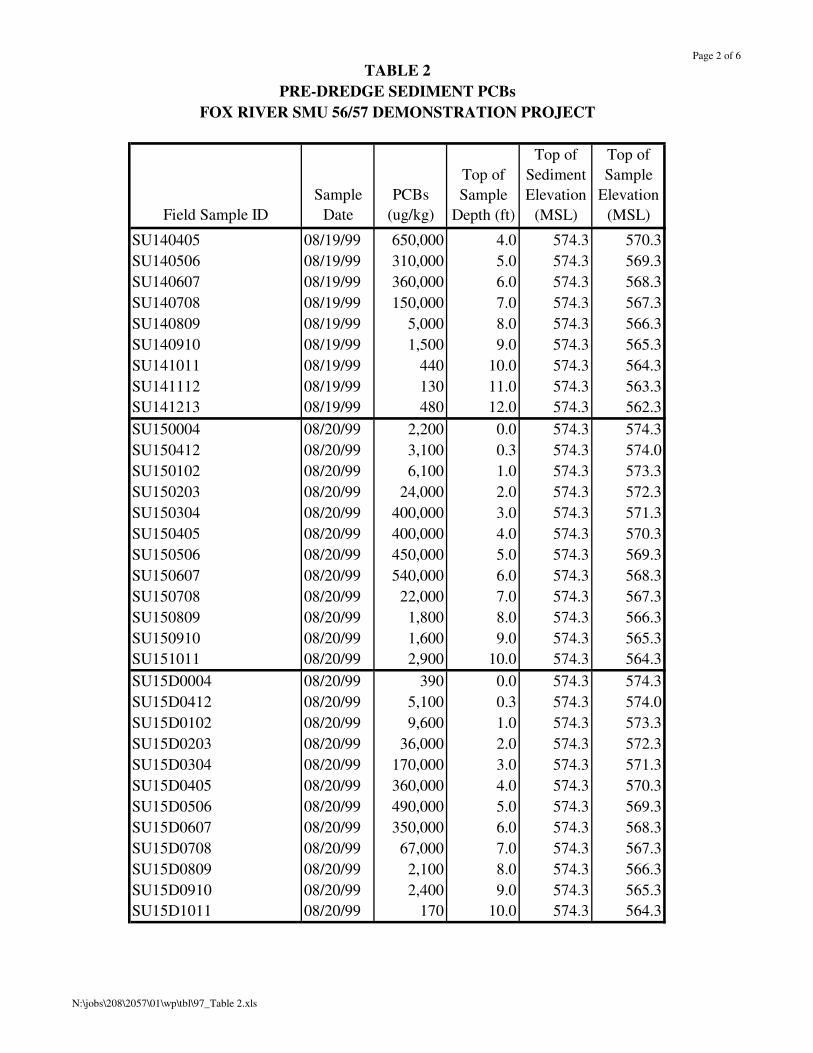
1 Final Project Metrics2 Pre-Dredge Sediment PCBs3 Post-Dredge Sediment PCBs4 Summary of Project Costs
iii
LIST OF FIGURES
Figure No.
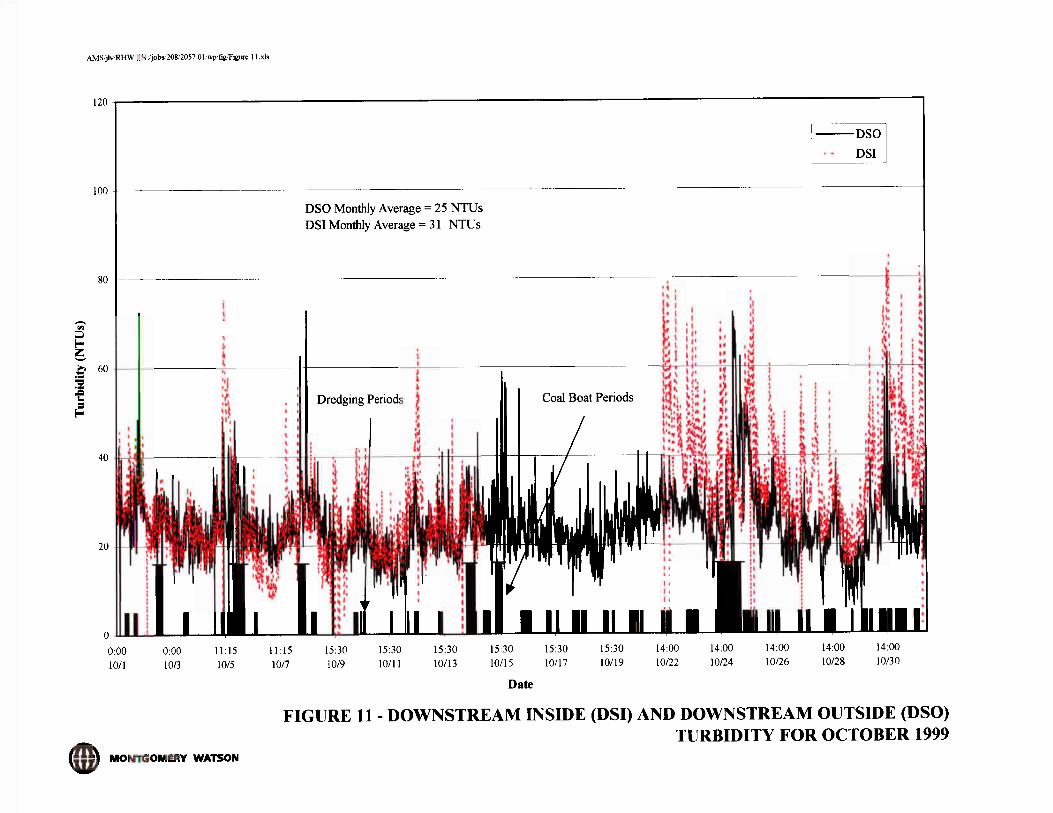
1 Project Time Line2 Dredging Volume – Each Period3 Dredging Volume - Cumulative4 Dredge Time – Each Day5 Dredge Time - Cumulative6 Dredging Rate – Cumulative (cy/hour)7 Dredging Rate – Cumulative (cy/day)8 Distance from Dredge vs. Turbidity – September 25, 29, and 30, 19999 Distance from Dredge vs. Turbidity – October 1, 24, and 26, 199910 Distance from Dredge vs. Turbidity – November 7 and 12, 199911 Downstream Inside (DSI) and Downstream Outside (DSO) Turbidity for
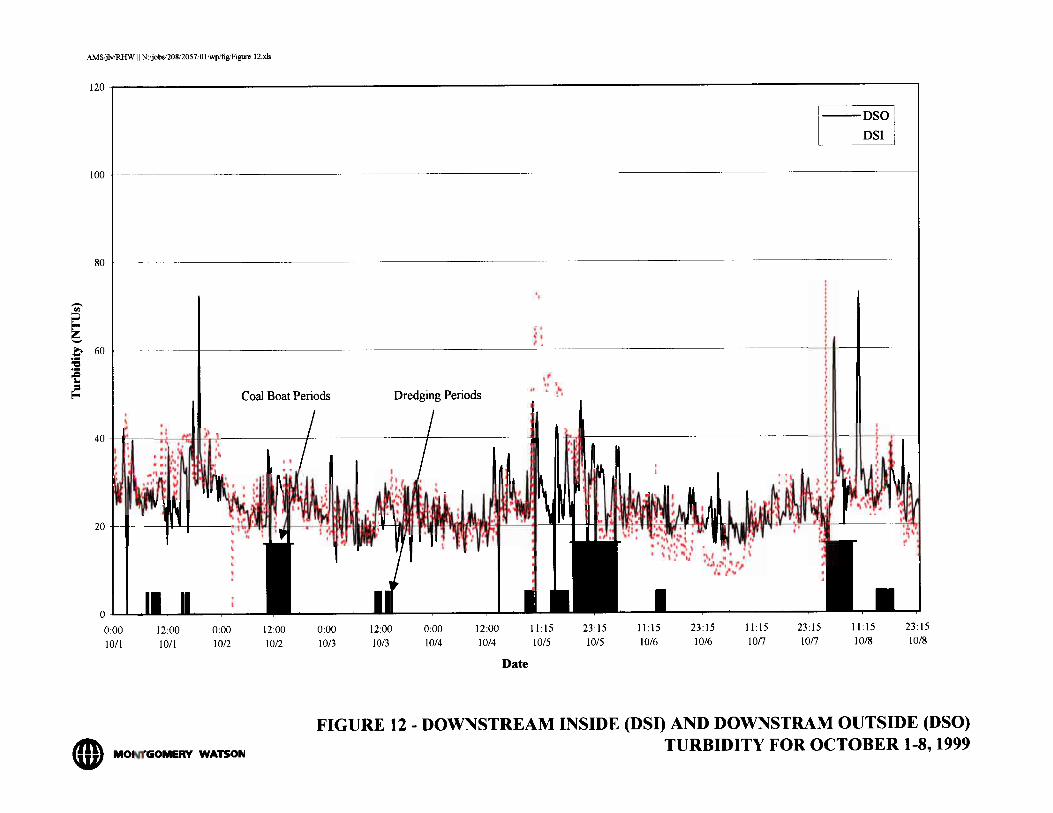
October 199912 Downstream Inside (DSI) and Downstream Outside (DSO) Turbidity for
October 1-8, 199913 Downstream Inside (DSI) and Downstream Outside (DSO) Turbidity for
October 9-16, 199914 Downstream Inside (DSI) and Downstream Outside (DSO) Turbidity for
October 17-24, 199915 Downstream Inside (DSI) and Downstream Outside (DSO) Turbidity for
October 25-31, 199916 Effluent Water (001) PCBs17 Effluent Water (001) Mercury18 Effluent Water (001) Total Suspended Solids19 Effluent Water (001) Oil and Grease20 Effluent Water (001) pH21 Effluent Water (001) Turbidity22 Effluent Water (001) BOD5
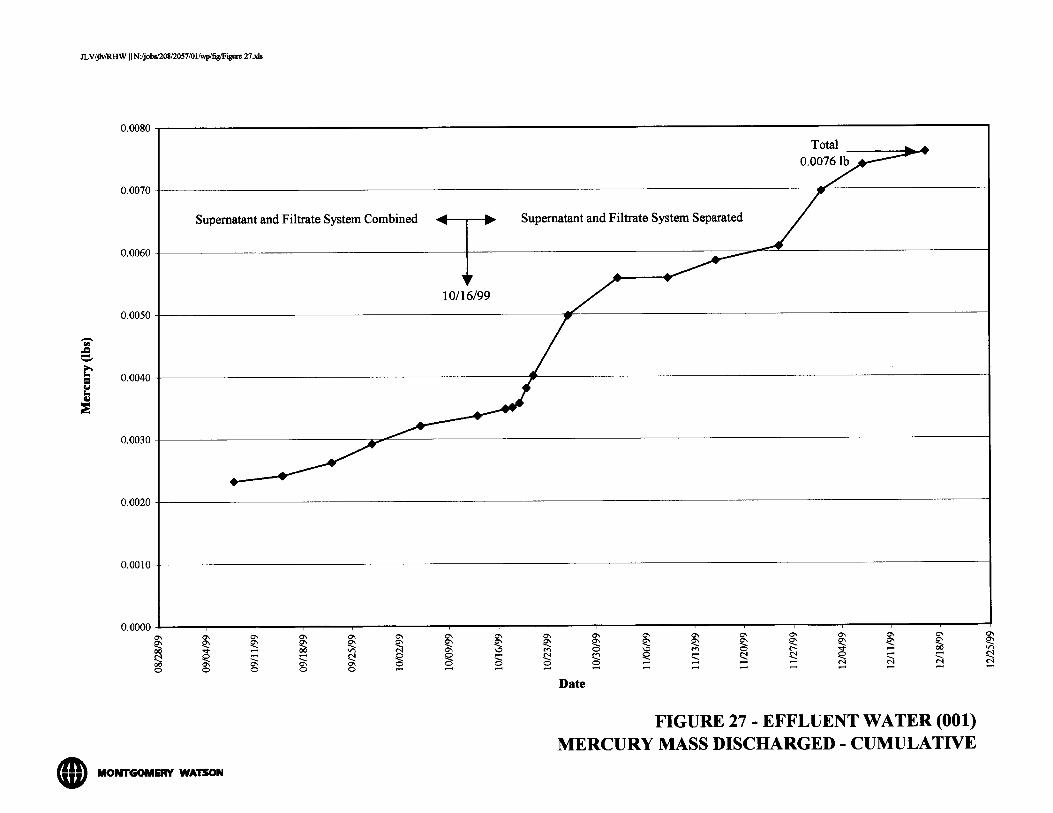
23 Effluent Water (001) Ammonia Nitrogen24 Effluent Water (001) Discharge Volume - Daily25 Effluent Water (001) Discharge Volume - Cumulative26 Effluent Water (001) PCB Mass Discharged - Cumulative27 Effluent Water (001) Mercury Mass Discharged - Cumulative28 Dewatered Sediment Wet Tons Landfilled - Cumulative29 Dewatered Sediment Dry Tons Landfilled - Cumulative30 Dewatered Sediment PCBs31 Dewatered Sediment Mercury32 PCB Mass Removed by Dredging - Cumulative33 Mercury Mass Removed by Dredging - Cumulative34 Pre- and Post-Dredge Sediment Elevations35 Pre- and Post-Dredge Surface PCB Concentrations36 Pre- and Post-Dredge Surface PCB Concentrations at Clean-Up Pass Subunits
iv
LIST OF DRAWINGS
Drawing No. A1 Vicinity MapA2 Location MapA3 Shell Property Aerial PhotographA4 Dredge Area Aerial PhotographA5 Pre-Dredge MapA6 Process Flow Diagram – Original Water Treatment SystemA7 Process Flow Diagram – Supernatant Water Treatment SystemA8 Process Flow Diagram – Filtrate Water Treatment SystemA9 Process Flow Diagram – DewateringA10 Post-Dredge Map (Scale 1”=150’)A10a Post-Dredge Map (Scale 1”=100’)A11 Dredge Thickness Isopach Map (Scale 1”=150’)A11a Dredge Thickness Isopach Map (Scale 1”=100’)
Summary Report September 2001 Fox River SMU 56/571-1
1.0 INTRODUCTION
1.1 PURPOSE
This report by Montgomery Watson summarizes information from the DemonstrationProject performed at Sediment Management Unit 56/57 (SMU 56/57) in the Lower FoxRiver at Green Bay, Wisconsin. It was prepared for the purpose of disseminatinginformation about the completed Project to the Fox River Group of Companies (FRG), theWisconsin Department of Natural Resources (WDNR), and other stakeholders in therestoration efforts for the Lower Fox River.
1.2 BACKGROUND
In 1995, the WDNR and U.S. Environmental Protection Agency (EPA) performed aninvestigation in the approximately seven-mile reach of the Fox River between the DePeredam and the mouth of Green Bay. The investigation found a more-or-less continuous massof soft sediments in the river bottom, whereas investigations above the DePere dam foundthe soft sediments were generally in discrete deposits. Approximately 100 sediment coreswere collected below the dam, and depth intervals were analyzed for polychlorinatedbiphenyls (PCBs) and other constituents.
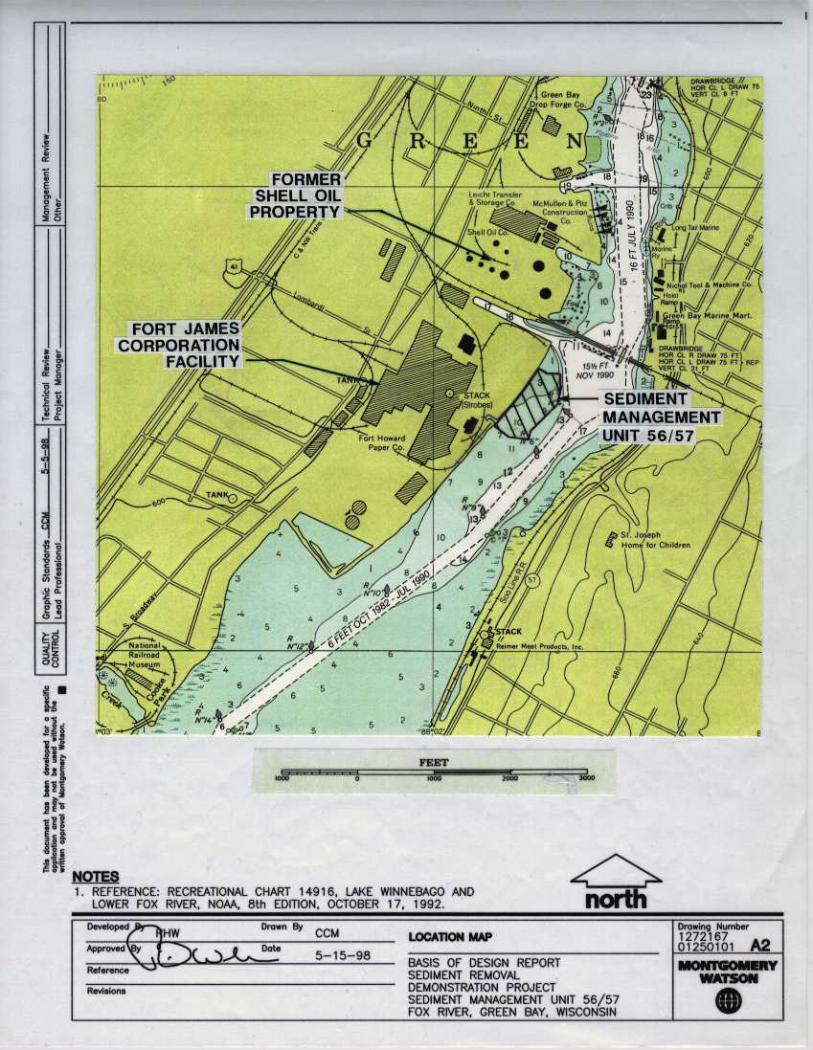
The results were used along with other data as input to a water and fish quality model bythe WDNR to assist in making sediment and risk management decisions for the Lower FoxRiver. The model established a number of “sediment management units” in the river belowthe DePere dam. Cores within Sediment Management Units 56 and 57 were found tocontain the highest known concentrations of PCBs in the river, up to 400 mg/kg in one coreat a depth interval of 3 to 5 feet (ft). SMU 56/57 is located in the City of Green Bay on thewest shore of the river, just upstream of a railroad trestle, in an area known as the FortHoward turning basin (see Drawings A1 and A2).
It was earlier determined a source of PCBs in the river sediments was from wastewaterdischarges of paper mills during the manufacturing and recycling of carbonless copy paper.On January 31, 1997, the State of Wisconsin and Certain Companies Concerning the FoxRiver (i.e., the Fox River Group (FRG)) entered into an Agreement (State Agreement),which provided for, among other things, a sediment restoration project below the DePeredam. The FRG includes the following seven companies, who either have or had papermills on the shores of the Fox River: Appleton Papers Inc., Fort James Corporation (nowGeorgia Pacific Corporation), P.H. Glatfelter Company, NCR Corporation, Riverside PaperCorporation, U.S. Paper Mills Corporation, and Wisconsin Tissue Mills Inc.
Using the 1995 investigation results, the WDNR isolated a focus area within SMU 56/57 asthe location for the restoration Demonstration Project. According to the State Agreement,the Project was intended to remove contaminated sediment from SMU 56/57, and therebyto generate as much relevant information as reasonably possible for an assessment of
Summary Report September 2001 Fox River SMU 56/571-2
implementability, environmental effectiveness, and expense of large scale sedimentdredging and disposal from the Lower Fox River. Large scale, for purposes of this Project,was defined as potential removal of 8 to 11 million cubic yards (cy) of contaminatedsediment from the river bottom over a period of 12 years.
N:\Jobs\208\2057\01\wp\rpt\97_sum rpt_sec01.doc
Summary Report September 2001 Fox River SMU 56/572-1
2.0 CONTRACTING ARRANGEMENTS AND PROJECT TIME LINE
The following summarizes the contracting arrangements on the SMU 56/57 DemonstrationProject:
• Project Funding: The Fox River Group
• Project Manager: Wisconsin Department of Natural Resources
• Engineer and General Contractor: Montgomery Watson
− Subconsultant: Harrington Engineering & Construction
− Site Improvements Subcontractor: Terra Engineering & Construction
− Dredging, Water Treatment, and Dewatering Subcontractor: Four SeasonsEnvironmental
• Transportation and Disposal Services: Fort James Corporation
− Transportation and Landfill Operations Subcontractor: Superior SpecialServices
Figure 1 provides a detailed Project time line. Work was initiated in September 1997 onthe investigation and predesign phase of the Project, which ended in May 1998 withcompletion of the Basis of Design Report (BODR). The permitting and constructionprocurement phase extended between June 1998 and June 1999. The construction phasefor sediment removal began in July 1999 with site improvements to an upland propertynear the dredge area, referred to as the former Shell Oil Company property, which is ownedby Fort James. Site improvements were completed in late August 1999, as weremobilization of dredging, water treatment, and dewatering systems and personnel. FortJames’ landfill construction was performed between middle June and late August 1999.Dredging began on August 30 and ended on December 15, 1999. Because of cold weatheroperating limitations, demobilization of some equipment and restoration of the Shellproperty was delayed. Demobilization activities were performed in June and July 2000.
N:\jobs\208\2057\01\wp\rpt\97_sum rpt_sec02.doc
Summary Report September 2001 Fox River SMU 56/573-1
3.0 PERMITS AND APPROVALS
A number of permits and approvals were required from federal, state, and local authoritiesfor Project implementation. Those that required public comment periods and/orinformation hearings are so noted.
• Environmental Assessment (EA), under authority of Chapter 150, Wis. Adm.Code and the Wisconsin Environmental Policy Act (WEPA). A two-week publiccomment period was held prior to approval.
• WDNR Dredging Permit, under authority of Chapter 30, Wis. Adm. Code. Thispermit also authorized placement of a silt curtain and temporary monitoringstations in the river in order to implement the Project.
• Army Corps of Engineers Dredging Permit, under authority of NationwideGeneral Permit 38, in accordance with 33CFR327.
• WDNR Wisconsin Pollution Discharge Elimination System (WPDES) Permit,under authority of Chapter 283, Stats. A public information hearing and commentperiod were held prior to approval. The water treatment subcontractor wasrequired to submit a final design for the Project water treatment system under theseal of a Wisconsin registered professional engineer to the WDNR for review andapproval before operation could begin.
• WDNR Plan of Operation Modification Approval, for landfill disposal of thedredged sediments, under authority of Chapter NR 500, Wis. Adm. Code. AnEPA approval dated January 24, 1995 conditionally authorized WDNR to approvefacilities for the disposal of sediments contaminated with PCBs. A publicinformation hearing was held prior to approval.
• WDNR General Permit to Discharge Stormwater under the Wisconsin PollutionDischarge Elimination System, under authority of Chapters 147 and 283 Wis.Stats. and Chapter NR 216, Wis. Adm. Code. An Erosion Control andStormwater Management Plan was required to be kept on site during constructionactivities, and a copy was also required to be submitted to the City of Green Bay.
• Fort James Access Agreement, signed by Fort James, the WDNR, andMontgomery Watson. It provided access to the former Shell Oil Companyproperty and portions of the Fort James West Mill to implement and monitor theProject.
Summary Report September 2001 Fox River SMU 56/573-2
• City of Green Bay Zoning Approval, to Fort James as owner of the former ShellOil Company property, for Project use. The zoning approval was for a temporaryoverlay of a planned commercial district. The request first received approval ofthe Plan Commission, followed by the full City Council, with opportunities inbetween for public comment.
• City of Green Bay Electric Permit, for extending temporary electrical power tothe Shell property for operation of water treatment and dewatering systems.
• WDNR Waterway Marker Application and Permit, a permit obtained by thedredging subcontractor for temporary placement of buoys in the vicinity of theriver work areas.
• Coast Guard Notification for Boaters Aid to Navigation, for informingrecreational and commercial boat traffic of marker buoys, the silt curtain, andmonitoring stations in the river.
• WDNR and FRG Approvals of an Operational Monitoring Quality AssuranceProject Plan (OMQAPP). The OMQAPP described data collection and analysesto be performed by Montgomery Watson during the Project to monitor andcontrol the construction operations. [A separate Environmental MonitoringQAPP was prepared by Blasland Bouck & Lee on behalf of the FRG, incooperation with the WDNR and the Fox River Remediation Advisory Team(FRRAT). The FFRAT was established by the WDNR to advise the WDNR onscientifically valid approaches to monitor environmental effectiveness ofdredging. FRRAT members include the U.S. Geological Survey (USGS), and theUniversity of Wisconsin Water Chemistry Department, Water Resources Institute,and Sea Grant Institute. WDNR selected USGS to conduct water columnsampling for the SMU 56/57 Demonstration Project. WDNR performedenvironmental air monitoring.]
N:\Jobs\208\2057\01\wp\rpt\97_sum rpt_sec03.doc
Summary Report September 2001 Fox River SMU 56/574-1
4.0 PROJECT COMPONENTS
4.1 INVESTIGATION AND PRE-DESIGN
The investigation and pre-design phase of the Project was performed between September1997 and May 1998, when the Basis of Design Report (BODR) was submitted to the FRGand WDNR for review. The purpose of this work phase was to further characterize theriver sediments and on-shore support areas to conceptually design a Demonstration Projectto evaluate the efficacy of conducting full-scale remediation of the Lower Fox River. TheDemonstration Project was to include dredging, on-shore dewatering and water treatment,and transportation and disposal at an approved Wisconsin solid waste landfill. Keyinformation from the BODR is provided below.
4.1.1 SMU 56/57
The Project focus area within SMU 56/57 was selected by WDNR and FRG, and isadjacent to the Fort James West Mill in Green Bay (Drawing A2). A sheet pile waterintake structure, located near the area, is used by Fort James for non-contact cooling waterand manufacturing process water. This intake is vital to plant operations. Intake volumesvary, but can reach 50 million gallons per day (mgd) in summer months. North and southof the intake, the shoreline consists of earthen slopes protected by rip rap and aggregatedebris extending about 30 to 40 ft into the river. The Fort James boat slip is located justnorth of the Project area, which is used during the navigation season for unloading boats(primarily coal) for the Mill’s operations.
Thirty-two cores taken by WDNR and EPA in November 1997, and subsequentlyprocessed and tested by Montgomery Watson, indicated the sediments in the Project areaare composed primarily of soft organic silt, overlying firmer native clay. PCBconcentrations of the sediment ranged from non-detectable to 710 mg/kg. PCBs werepredominantly identified as Aroclor 1242. The top 4 inches (in.) of sediment had PCBconcentrations ranging from 1 to 99 mg/kg. Excluding the one core with 99 mg/kg, thePCB concentration of surface sediment ranged from 1 to 7.3 mg/kg, averaging 2.3 mg/kg.The highest PCB concentrations were located below a depth of 4 in. down to about 5 to7 ft. The thickness of sediments containing at least 1 mg/kg PCBs ranged from 2 to 16 ft,and averaged about 10 ft.
Water depth in the Project area ranged from about 2 ft near the shoreline to 14 ft at theouter edge, except directly in front of the intake the water depth was about 19 ft. Thesedepths were normalized to river elevation 579.2 Mean Sea Level (MSL, NGVD29). Rivervelocity measured in the Project area one day in December 1997 ranged from 0 to 0.6 ft persecond (fps). According to a USGS gaging station near the river mouth, flow velocity overthe course of a year normally ranges from about +2.5 fps to –2.5 fps (i.e., flow reversal).Flow reversal can occur during strong and prolonged winds from the northeast.
Summary Report September 2001 Fox River SMU 56/574-2
4.1.2 Former Shell Oil Company Property
A 22-acre parcel known as the former Shell Oil Company property is owned by Fort Jamesand located north of their Mill (Drawing A2). The property was identified for location oftemporary on-shore water treatment and dewatering operations. The property was used asa bulk petroleum terminal from approximately 1940 to 1980, and included largeaboveground storage tanks (ASTs), smaller underground storage tanks (USTs), loadingracks and ancillary features. The Fort Howard Paper Company purchased the property in1981. The petroleum fuel storage systems were subsequently removed form the parcelbetween 1981 and 1989. Earthen secondary containment dikes around the former ASTswere left intact in many locations. The property had not been used since demolitionactivities were finished.
4.1.3 Pre-Design of Project Elements
The conceptual pre-design from the BODR included the following Project elements:development of the Shell property, protection of the water intake, hydraulic dredging anddredge slurry transport to on-shore equalization basins, in-river sediment suspensioncontrol, treatment of dredge carriage water and discharge back to the river, sedimentdewatering, and transportation and disposal at an off-site landfill. Some of the Projectelements were designed only to the point of establishing performance requirements.
4.1.3.1 Intake Protection. If necessary depending on the final size of the dredge area,protection of the water intake would be accomplished by temporarily extending the intakeupstream of the dredge area. Piping or a sheet pile channel were considered feasibleoptions.
4.1.3.2 Dredging and Hydraulic Pipeline. To achieve the goal of large scale dredgingestablished by the State Agreement, a dredging removal goal of 200 in-river cy/hour wasestablished. This is based on one dredge taking 12 years to remove 11 million cy ofsediment, operating 80% of the available time for eight months of each year. Hydraulicdredging was recommended given actual Project conditions (e.g., few known debris inriver bottom away from the shore protection rip rap and debris; relatively shallow waterdepths and thickness of contaminated sediments; upland area available in close proximityfor slurry discharge, dewatering, and water treatment). A dredge slurry pipeline wouldconvey the dredged sediments to the Shell property. Alternative routes around the boatslip, or across the boat slip, were considered. As a condition of the Access Agreement, theProject could not deny access to the boat slip. The pipeline across the boat slip could eitherbe submerged or be disconnected and reconnected each time a boat arrived. At thecompletion of production dredging, a clean-up pass would be performed to remove anadditional 6 in. of sediment over the dredge area. The purpose of a clean-up pass is toremove contaminated sediments that potentially were re-suspended and subsequently re-settled in the dredge area, as well as potential undredged ridges between dredge tracks.
4.1.3.3 In-River Sediment Suspension Control. The Project dredge area would beisolated from the water intake and other areas outside the dredge area by installation of a
Summary Report September 2001 Fox River SMU 56/574-3
temporary silt curtain system. Anchors in the river and on shore would hold the curtain inplace. Buoys and lights would be placed for navigation in accordance with Coast Guardrequirements. The silt curtain fabric could be permeable so that it would not have towithstand the pressure of full river currents, but the fabric openings would be small to limitmigration of sediments potentially re-suspended by dredging activities.
4.1.3.4 Sediment Dewatering. Passive and mechanical dewatering options wereconsidered in the BODR. Passive dewatering includes discharge of the all the dredgeslurry into one or more large basins where the solids would settle and the water would bepumped off, treated, and discharged back to the river. The solids remaining in the basin(s)would passively dewater over a long period of time, expected to be two or more yearsbased on bench scale testing. Then, the sediments would be solidified with the addition ofa stabilizing agent (e.g., lime), if necessary, to transport and dispose the dewateredsediment as solid waste.
Mechanical dewatering would require much smaller basins because the dredged slurrywould be processed each day to lower the water content (or increase the percent solids).Potential mechanical dewatering methods considered feasible included centrifuge, beltpress, or filter press. Landfill disposal would occur within a few days of dredging formechanical dewatering vs. years for passive dewatering. To shorten the time required tocomplete this Demonstration Project, the FRG and WDNR selected mechanicaldewatering.
4.1.3.5 Water Treatment. Dredge carriage water (supernatant), sediment pore waterremoved during mechanical dewatering, and stormwater collected from the work padswould require treatment prior to discharge back to the Fox River in accordance with theProject-specific WPDES Permit. Discharge to a publicly owned treatment works (POTW)was considered, but this option was not available. Bench scale testing indicated thattreatment could be accomplished by controlling suspended solids in the water, becausePCBs are generally hydrophobic and generally attach themselves to solids instead of goinginto solution. Therefore, the solids removal treatment system was conceptually designed toinclude filtration followed by granular activated carbon.
4.1.3.6 Transportation and Disposal. After dewatering, the sediments would be loadedinto dump trucks with sealed tailgates and tarps over the loads, and transported to an off-site landfill for disposal. This activity would be performed in accordance with state andfederal requirements using licensed haulers and waste manifest forms. At the time of theBODR in May 1998, the WDNR was in the process of soliciting licensed solid wastelandfills in Wisconsin for disposal of the dredged sediments. The EPA has granted theWDNR special authority to conditionally approve Wisconsin landfills to dispose PCBcontaminated sediments at concentrations equal to or greater than the 50 mg/kg limitestablished by the Toxic Substances Control Act (TSCA).
Summary Report September 2001 Fox River SMU 56/574-4
4.2 PROCUREMENT AND PERMITTING
The procurement and permitting phase of the Project began in June 1998 and wascompleted in June 1999. Permits were listed in Section 3.0. The time line for each majorpermit or approval is summarized as follows:
Application Submitted ApprovedEnvironmental Assessment July 1998 September 2, 1998
WPDES Permit July 7, 1998 September 15, 1998
WDNR Dredging Permit July 7, 1998 September 9, 1998
Corps Dredging Permit July 7, 1998 November 3, 1998
Written comments were taken by the WDNR on the EA and WPDES Permit, and a publicinformation hearing was held prior to issuance of the WPDES Permit.
In July 1998 while the permit applications and EA were being reviewed, the FRG andWDNR notified Montgomery Watson of their desire to follow the design-build approachfor Project implementation. A Request for Bid (RFB) for site improvements to the formerShell Oil Company property was developed, using “means and methods” specifications.This first RFB was issued to potential bidders on September 11, 1998.
A suitable state landfill to dispose of TSCA regulated sediments (> 50 mg/kg PCBs) wasunable to be secured by the WDNR in the summer and early fall of 1998. State officialshad made a policy decision to dispose of the sediments from the SMU 56/57 Project withinWisconsin. Therefore, and because the Corps dredging permit was still not in hand, Projectimplementation was delayed until the 1999 construction season. In the interim, the searchfor a state TSCA disposal site continued and remaining permits and approvals werereceived.
Bids received on September 25, 1998 for site improvements to the Shell property wereevaluated, and the work was scheduled for 1999. With concurrence from the FRG andWDNR, Montgomery Watson prepared three separate RFBs for dredging, water treatment,and dewatering to implement sediment removal. It was recognized that someenvironmental remediation contractors could have special expertise in a certain area, suchas dredging, whereas others could have the qualifications and experience to perform allaspects of the work. Performance-based specifications were developed, to take advantageof contractor expertise and available equipment, and to provide flexibility. A summary ofthe Project specifications and work scope in each RFB is provided in the next section.
After pre-qualifying subcontractors, RFBs for dredging, water treatment, and sedimentdewatering were issued in middle February 1999 to potential bidders. Pre-bid meetingswere held at the site on February 23, 1999. At the time of the pre-bid meeting,Montgomery Watson collected sediment core samples in the targeted dredge area toprovide bulk samples of sediment to interested bidders. Bids were received on March 26,1999 as follows:
Summary Report September 2001 Fox River SMU 56/574-5
Construction Phase Pre-Qualified Bidders Bids ReceivedDredging 15 9
Water Treatment 12 5
Dewatering 11 7
With concurrence from the FRG and WDNR, Four Seasons Environmental (FSE) wasselected as the dredging, water treatment, and dewatering subcontractor, and TerraEngineering & Construction (Terra) was selected as the subcontractor for siteimprovements to the Shell property. Subcontract agreements were executed in June 1999.
The terms of the Fort James Access Agreement were agreed upon for use of the Shellproperty, and the document was signed by Fort James, the WDNR, and MontgomeryWatson.
While the construction procurement activities were occurring, Fort James met with Stateofficials regarding the possibility of them disposing of Project sediments in a speciallyconstructed cell at their existing industrial landfill, located on the west side of Green Baynear the airport. Upon reaching agreement, Fort James submitted the Cell 12A Plan ofOperation Modification to the WDNR on April 21, 1999. The WDNR and Fort Jamessubsequently held a public information meeting in Green Bay in May, and the WDNRconditionally approved the Plan Modification on June 14, 1999.
4.3 CONSTRUCTION
4.3.1 Site Improvements
Site improvements to the former Shell property included:
• Clearing and grubbing of all trees and vegetation.
• Installation of erosion control measures, including a silt fence around thedisturbed areas.
• Grading and construction of gravel access roads, parking areas, and work pads,and installation of a pre-cast concrete manhole for a water collection sump in thework pad to be used for water treatment and dewatering. This work pad measuredabout 130 by 240 ft, an area large enough to also include temporary stockpiling ofdewatered sediments. A geotextile was placed over the subgrade forreinforcement before the work pad was constructed.
• Grading of two equalization basins where parts of containment dikes from formerASTs existed. Earth materials from other on-site berms were borrowed toconstruct the basins, having 2H:1V sideslopes. The basins each had plandimensions of about 180 by 250 ft, and a depth of 4 to 6 ft. Thereafter, the basins
Summary Report September 2001 Fox River SMU 56/574-6
were lined with a 12-in. thick layer of imported landfill-quality clay, overlain by a60-mil thick high density polyethylene (HDPE) liner.
• Installing temporary electrical lines and disconnects to the areas of the basins, andareas designated for water treatment, dewatering, and job trailers.
The water treatment and dewatering work pad was final graded and covered withbituminous asphalt. The asphalt was laid in two layers totaling about 4 to 8 in. in thicknessfor drainage to the sump. Site improvements began on July 12, 1998 and were completedby August 20, 1999. Drawing A3 is an aerial photograph of the former Shell propertytaken on September 29, 1999, and it shows the locations of the primary site improvements.
4.3.2 Dredging
The scope of work for dredging contained three primary items:
• Mobilization/ demobilization.
• Design, install, maintain, and remove the silt curtain.
• Operate the dredge systems and pipeline, and perform required dredge surveysand monitoring.
4.3.2.1 Silt Curtain. A silt curtain was installed around the entire dredge area. It wasanchored on the upstream side between the dredge area and the water intake, and on thedownstream side near the boat slip. A permeable turbidity barrier manufactured byBrockton Equipment/Spilldam, Inc. (Photo No. 1) was used. According to manufacturerspecifications, the turbidity barrier had an 8-in. diameter closed cell foam flotation wrappedin orange 22-oz/sy, PVC-coated polyester fabric. The skirt below the flotation was madeof black, woven polypropylene, monofilament geotextile fabric with a weight of 5.4 oz/sy,an equivalent opening size of 40-50 U.S. Standard Sieve (0.420-0.297 mm), and a percentopen area of 15%. Skirt lengths were sufficient for the silt curtain to extend through thefull water column to the top of the sediment.
Turbidity barrier panels, manufactured in 100-ft lengths, were joined in the field toapproximately 1,700 lineal ft prior to deployment (i.e., 17 panels). The panels were joinedusing universal slide connectors and tied grommets at each end, as well as at the top using a5/16-in. diameter cable and bottom using a 5/16-in. ballast chain sewn into the fabric.Deployment occurred in the last week of August 1999 and took several days. Acombination of “Manta Ray” anchors and concrete weights were used to anchor the siltcurtain once it was moved into position. Additional concrete anchors were placed duringthe Project because the silt curtain tended to move about with the wind and river currents.The silt curtain location is shown on Drawing A4, an aerial photograph of the dredge areataken on September 29, 1999. The top of the silt curtain contained battery powered lightsin accordance with Coast Guard requirements.
Summary Report September 2001 Fox River SMU 56/574-7
In the early morning hours of September 24, 1999, Montgomery Watson discovered the siltcurtain came apart at a panel joint, located approximately one-fourth of the curtain lengthfrom its southern shore anchor point. The curtain floated downstream against the piers ofthe railroad trestle. At daylight, the silt curtain was secured and plans were made foradditional resources to get the curtain back into place. The next day, a crew was mobilizedto re-position, re-connect, and re-anchor the silt curtain. No damage was done to thebridge. Several foam floats broke out of the top of the silt curtain and floated away; theywere replaced with several air-filled buoys along the damaged sections. Also, anotherturbidity barrier panel was added at the location where it came apart.
4.3.2.2 Dredge Production Monitoring. A bathymetric survey was performed beforestarting dredging, but after silt curtain installation. After dredging began, additionalbathymetric surveys were performed and the volume dredged between surveys wascomputed. A VersaFlow Doppler Flow Meter manufactured by TN Technologies wasinstalled on the dredge pipeline near the east basin outfall to measure mass flow, flow rate,and total flow (Photo No.2 ).
4.3.2.3 Dredge System and Operation. Drawing A5 shows the targeted dredge arealimits and dredge elevations, which were chosen to remove the greatest mass of PCBswithin the least volume of sediment. Based on data and a GIS model reported in the May1998 BODR, sediment below these elevations was expected to have PCB concentrations of<1 mg/kg. The dredge area was generally aligned with subunits of the grid systemestablished by the GIS model. It was offset from the shoreline to avoid known rip rap anddebris.
A hydraulic dredge with 12-in. pump and round cutterhead was mobilized to the site, anddredging began on August 30, 1999 in Subunits 12 and 23. After about one week ofintermittent dredging, an IMS 4010 Versi Dredge (10-in. pump discharge) was mobilizedto the site to try to increase solids content in the dredged slurry. It replaced the dredgeinitially mobilized. The IMS 4010 dredge began operation on September 5, 1999 with anin-line booster pump on shore near the north end of the dredge area to convey the slurry tothe equalization basins. This dredge was replaced with an IMS 5012 Versi Dredge (12-in.pump discharge) and a larger booster pump on September 10, 1999. The IMS 5012 dredgehad a six-cylinder diesel engine rated at 250 HP at 2,200 rpm. The dredge pump had a9.75-in. diameter intake and a 19.25-in. diameter impeller. It was rated for a flow of5,000 gpm at 85 ft total dynamic head and speed of 800 rpm. The booster pump was an8-in. MXT Pekor Pump, with engine rated at 250 HP. The 8-in. diameter intake anddischarge were converted with pipe fittings to a 12-in. diameter intake and discharge. Ithad a 25-in. diameter impeller. On September 22-23, 1999, a wider horizontal augercutterhead (9-ft long by 22-in. diameter) was placed on the IMS 5012 dredge. Thisconfiguration was used for the remainder of the Project (Photo Nos. 3, 4, and 5).
Production dredging was performed in an east to west direction, perpendicular to theshoreline, beginning at the north end of the targeted dredge limits. The dredge moved fromdeeper water toward the shore using a travel cable windlass. The travel cable was stretchedbetween a second cable anchored on shore and a third cable anchored east of the dredge
Summary Report September 2001 Fox River SMU 56/574-8
area, forming an “I”-configuration. The river-side anchor cable was tied between a spudbarge and the first dredge mobilized for the Project. Both the spud barge and the firstdredge were temporarily anchored in the river with piles. For each dredge cut, the dredgemoved along the travel cable, dredging a layer of sediment in each pass. According tooperational records, the depth of cut for each pass ranged from 2 to 24 in., and averaged12 in. A number of passes were required to progressively dredge down to the targetelevation. When the cut at each dredge track was completed, grip hoists on the anchorcables were used to move the dredge side to side for the next cut.
According to the dredging subcontractor’s operational records, the dredge advanced at arate of 0.5 to 4 ft/min while dredging, averaging 1.4 ft/min. The horizontal auger of thedredge cutterhead operated at a speed of 90 to 150 rpm, averaging 135 rpm. The “freeturn” maximum speed was 187 rpm. The pressure on the cutterhead hydraulic motor wasgenerally 2,200 to 2,800 psi, averaging 2,550 psi. The rated maximum pressure was3,000 psi. The dredge pump typically operated at a rotation speed of 1,300 to 1,600 rpm,averaging 1,550 rpm.
On October 12, 1999, a bathymetric survey map of the partially completed dredge areaindicated that the target elevation was not being reached, and that dredging activities wereleaving behind ridges of undredged sediment between dredge cuts. With concurrence ofthe WDNR and FRG, production dredging was subsequently halted and the dredge wasreturned to previously dredged areas to remove the ridges and complete dredging to targetelevations, progressing downstream from south to north. When the decision was made tore-dredge, the southern edge of the dredge area was approximated by a diagonal lineextending between the midpoint of the west side of Subunit 18, to the northeast corner ofSubunit 29 and part way into Subunit 39 (Drawings A5 and A10/A10-a).
Mass dredging ended on December 12, 1999 due to the onset of winter conditions. Aclean-up pass was then performed in an approximately 30 ft by 30 ft area at the center offour dredge area subunits (Nos. 25, 26, 27, and 28 on Drawing A5). This was completedon December 15, 1999, and the dredge was demobilized.
The dredging crew generally consisted of three personnel: the dredge operator, a laborerstationed on-shore to operate the booster pump and assist with dredge repositioning, andanother laborer stationed at the equalization basins to operate basin discharge valves andmonitor the slurry flow meter.
4.3.2.4 Hydraulic Pipeline. The dredged slurry was conveyed through a pipeline thatdischarged to the equalization basins in a manner to protect the basin liner systems, withvalves to direct the flow to either basin. The hydraulic pipeline was single-wall pipe insidethe silt curtain, and it was double-wall (i.e., pipe inside a pipe) between the silt curtain andthe basins for secondary containment in case of a leak in the inner carrier pipe.
The hydraulic pipeline consisted of 2,800 lineal ft of 12-in. diameter, butt-fused HDPEslurry pipe (SDR 17) inside 1,860 lineal ft of 16-in. diameter, butt-fused HDPEcontainment pipe (SDR 26) (Photo No. 6). A bolted flange coupling, located inside the silt
Summary Report September 2001 Fox River SMU 56/574-9
curtain between the on-shore booster pump and boat slip, was used to disconnect the slurrypipe for boat access. The slurry pipeline had the outer containment pipe between thiscoupling and the southeast corner of the east equalization basin. The slurry pipeline was asingle pipe between the coupling and the dredge. Before the pipe was uncoupled to allowboat passage, it was cleared of dredged slurry by pumping river water from the dredge tothe basins. Upon re-coupling, river water was again pumped to check for leaks beforedredging was re-initiated.
According to Fort James records, they received 15 boats during the dredging period. Thetime between arrival and departure at the boat slip ranged from 5 hours 15 minutes to10 hours 45 minutes.
4.3.3 Water Treatment
The water treatment scope of work included:
• Final design of the water treatment system, in accordance with the WPDESPermit and performance specifications.
• Construct, mobilize, and install the water treatment system.
• Operate the water treatment system.
• Provide and use necessary coagulant/ flocculent.
• Provide and use necessary pH adjustment chemicals.
• Provide and change-out necessary granular activated carbon.
• Decontaminate and demobilize the water treatment system.
4.3.3.1 Design. The design of the water treatment system was submitted to the WDNR onJuly 28, 1999, who conditionally approved it on August 12, 1999. The design was basedon meeting the following requirements:
Summary Report September 2001 Fox River SMU 56/574-10
Item SpecificationFlow: Minimum capacity of 600 gpm.
Flow range: Variable.
TSS @ discharge: 10 mg/L or less.
pH @ discharge: Between 6 and 9 standard units.
Oil and grease @ discharge: 10 mg/L or less.
Influent turbidity: Up to 1,200 NTUs.
Effluent turbidity: Continuously monitored; daily maximumaverage of 5 NTUs.
WPDES Permit conditions: Comply with pH, TSS, and oil & greasedischarge limits.
Discharge: 10 fps minimum velocity according to theWPDES Permit’s zone of initial dilution(ZID), with specific pipe size andorientation requirements.
Filtration: Minimum use of granular activated carbonwith a 10 minute empty bed contact time;other filtration as deemed necessary.
Normal operation: 24 hours per day, 7 days per week.
Project duration: Estimated 6-8 weeks of successful facilityoperation.
A simplified process flow diagram of the water treatment system is shown on Drawing A6.The majority of flow to the water treatment system came from two sources, which werecombined as influent to the treatment system: equalization basin supernatant (i.e., dredgecarriage water after solids settling) and press filtrate (i.e., pore water squeezed from thesediment during mechanical dewatering). Another minor source of water was from thesump on the asphalt work pad, which was pumped into the press filtrate tank. The threetreatment steps consisted of:
1. Primary Treatment: Chemical addition (i.e., polymer for TSS reduction and acidfor pH reduction) followed by flocculation and equalization (Photo No. 7).
2. Secondary Treatment: Filtration through two dual media (sand/gravel) filtervessels, connected in parallel to allow periodic back-flushing of one filter vesselwhile still maintaining operation of the other filter vessel (Photo No. 8).Approximately 20,000 lb of filter media was placed into each vessel.
3. Tertiary Treatment: Polish through a granular activated carbon (GAC) vessel(Photo No. 8). Approximately 20,000 lb of GAC was loaded into the treatmentvessel.
The first step of the water treatment system (chemical addition and flocculation) waslocated next to the settling basins. Tanks and equipment were set onto a plastic liner over agravel pad, with a raised perimeter berm. The treatment vessels were located on the
Summary Report September 2001 Fox River SMU 56/574-11
asphalt work pad. The layout is shown on Drawing A3, an aerial photograph of the Shellproperty on September 29, 1999. Most piping used in the water treatment system was 8-in.diameter, butt-fused HDPE (SDR 17). Approximately 900 lineal ft of piping connected thetwo treatment areas. The treatment system contained turbidity and pH monitors, and aneffluent flow meter (flow rate and totalized gallons) on the discharge line. Theapproximately 1,800-lineal ft discharge line reduced to 4-in. diameter at a point near theshoreline, so the discharge velocity into the river would be at least 10 fps to comply withthe WPDES Permit.
4.3.3.2 Operation. Installation and set-up of the treatment system were completed, anddischarge of treated effluent to the river began on September 1, 1999. After several weeksof operation, it was decided to segregate the flows from the equalization basin supernatantand press filtrate and to process these flows through separate treatment systems. Thepurpose was to add capacity to the system, and to better manage turbidity and pH.Specifically, basin supernatant generally had higher TSS and turbidity than the pressfiltrate, whereas the pH of the filtrate was elevated due to the addition of lime duringsediment dewatering. A water treatment design modification was submitted to the WDNRon September 21, 1999.
Two more dual media filter vessels and one more GAC vessel were installed near theequalization basins to treat basin supernatant (Drawing A7), whereas the original treatmentsystem with slight modifications in piping was used to treat press filtrate (Drawing A8).Flocculation of the basin supernatant, after these modifications were made, occurredthrough the addition of polymer in the west basin, where the dredge slurry was discharged.At this point in time, use of the east basin for slurry discharge was halted. The water in thewest basin was then pumped to the east basin for flocculation in a quiescent period beforebeing pumped through the filters.
Effluent from both the supernatant and filtrate systems was combined into the dischargepipe. A pipe wye and valve were installed in the 8-in. diameter discharge pipe near theshoreline, and a new larger 5-in. diameter pipe was extended out into the river from thiswye. This allowed discharge through either the reduced 4-in. or 5-in. diameter dischargepipe, depending on discharge flow rates, to maintain compliance with the minimum 10 fpsdischarge velocity. The separated water treatment systems began operation on October 17,1999. The reported peak capacity of the revised water treatment system was 1,100 gpm,with a normal operating capacity of 900 gpm. Water treatment operations ended onDecember 18, 1999, three days after dredging ended.
A work crew of two per 12-hour shift generally operated the water treatment system. Thetreatment system operated 24 hours per day, 7 days per week, except for breakdowns andsystem modifications.
Summary Report September 2001 Fox River SMU 56/574-12
4.3.4 Dewatering
The dewatering work scope contained two primary items:
• Mobilization/ demobilization.
• Sediment dewatering (included slurry handling, water management, stockpiling,and loading) – payment made per dry ton of sediment processed.
The purpose of dewatering the sediment removed from SMU 56/57 was to allow effectivehandling and disposal of the sediment. The dewatering was to separate the solids and waterfrom the dredge slurry. The dewatered sediment had to pass paint filter testing to bemanaged as solid waste.
Recessed chamber (also called plate and frame) filter presses were used for this Project.Four 100-cubic foot (cf) presses and one 200-cf press were initially mobilized, providing atotal press capacity of 600 cf. The presses were manufactured by JWI. Loading ofdewatered sediment into trucks for transportation to an off-site landfill began onSeptember 9, 1999. To increase production, a second 200-cf press was mobilized and set-up on October 14, 1999, bringing the total press capacity to 800 cf. Dewatering operationsended on December 15, 1999, the same day dredging ended.
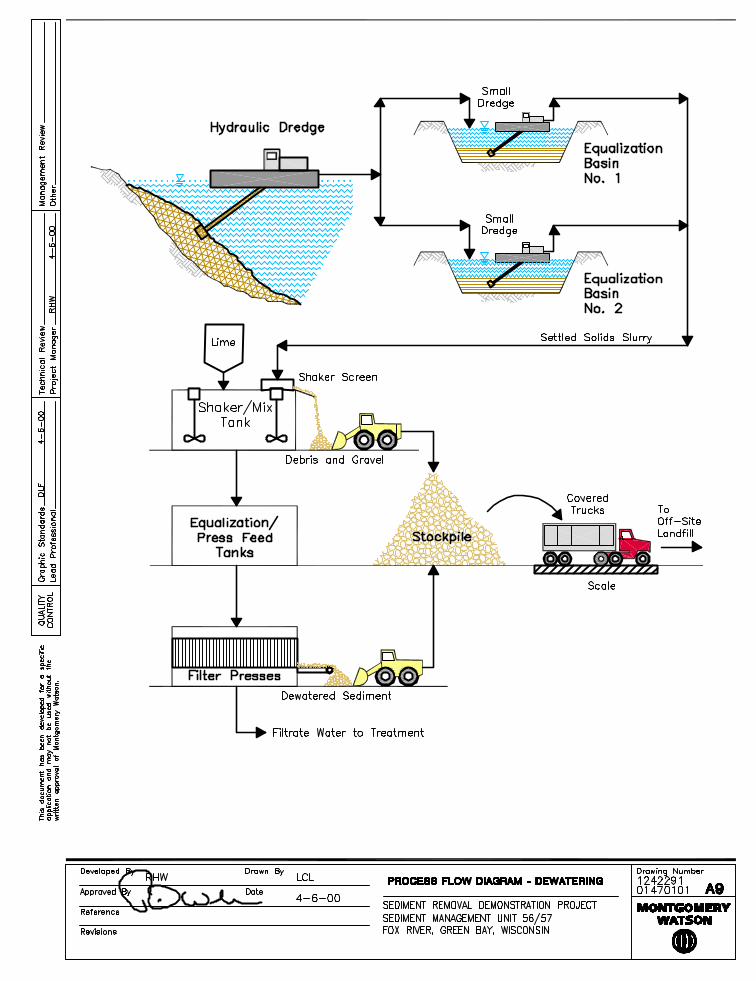
The layout of the presses and ancillary equipment is shown on Drawing A3, an aerialphotograph taken of the Shell property on September 29, 1999. A simplified process flowdiagram is shown on Drawing A9.
A small 6-in. hydraulic dredge with a horizontal auger cutterhead was placed in each basin(Photo No. 9) to remove the solids and convey them to the presses for dewatering. Thesedredges were basically smaller versions of the IMS 5012 river dredge. A cable and anchorsystem, like in the river, was used to position the dredge in each basin. Rubber-tiredwheels were installed on each side of the horizontal auger on each dredge to maintain thecutterhead above the basin liner system during sediment removal.
Sediments from the basins were conveyed through approximately 1,200 lineal ft of 6-in.diameter HDPE pipe (SDR17) to a 20,000-gal mix tank located on the asphalt work pad(Photo No. 10). The dredge slurry from the basins passed through a 4 by 8 ft shaker screenwith No. 4 sieve size before dropping into the mix tank. Gravel and/or debris from thescreen fell onto the asphalt pad, where it was scooped up with a front-end loader andplaced with the stockpiled dewatered sediment. Dry hydrated lime was fed into the tankand mixed with the dredge slurry. Lime was delivered to the site in bulk tank trucks andpneumatically fed to four lime storage silos (Photo No. 10). The dredge slurry with limewas pumped from the mix tank to a series of six 20,000-gal equalization/feed tanks (PhotoNo. 11), from which the slurry was pumped to the presses (Photo No. 12). When thesecond 200-cf press was added to the dewatering system, a seventh feed tank was alsoadded.
Summary Report September 2001 Fox River SMU 56/574-13
Press cycle times varied greatly. The goal was to operate with press cycle times on theorder of one hour. Water removed from the sediment was pumped to a 15,000-gal filtratestorage tank. When a press cycle was finished, plates were separated (Photo No. 13) andthe filter cake (about 1-in. thick) dropped onto a conveyer under the plates. The conveyerdropped the filter cake into steel bins, where the front-end loader scooped it up(Photo No. 14) and placed it into the stockpile or directly into waiting trucks.
On September 28, 1999 after a weekly construction meeting, a flap of torn HDPE wasobserved in the bottom of the east equalization basin floating at the southeast corner, nearthe dredge slurry discharge point where the small dredge was pumping out solids formechanical dewatering. Dredging to and from this basin was stopped immediately, and aplan for inspection and repair was developed.
The supernatant water and solids were removed from the east basin during the next twoweek period. Other cuts and tears in the HDPE liner were observed, determined to becaused by the steel shroud around the horizontal auger cutterhead of the small dredge. Thewheels designed to keep the shroud off the bottom had apparently deflected, bending theaxles connecting the wheels to the shroud, allowing the shroud to contact the liner.
A decision was made to cap weld an entire new bottom liner over the existing damagedliner. The 1-ft thick clay liner under the damaged HDPE liner was observed to be wet, butthe clay liner integrity did not appear to be breached. The new HDPE liner was laid out inpanels, which were fusion welded along seams. The entire top liner was then extrusionwelded to the underlying liner around the top of the interior berm sideslopes. This workwas completed and the east basin was put back into service on October 16, 1999.
While the east basin was out of service (2.5 weeks), only the west basin was used fordischarging sediments dredged from the river. At this point in the Project, modificationshad been completed to the water treatment system, adding the supernatant water treatmentsystem, and using most of the original water treatment system for press filtrate. Themodified water treatment system began operation on October 17, 1999. Accordingly, theeast equalization basin was used for flocculation of supernatant water decanted from thewest basin, and the east basin was never again used for discharge of dredged sedimentsfrom the river.
On November 26, 1999, while the supernatant level in the west basin was pumped down(water treatment had continued while the river dredge was temporarily down for repairs),two small breaches (about 2-in. and 12-in. long cuts, respectively) were noted in the HDPEliner. These breaches were about mid-height on the west basin sideslope liner, near thenortheast corner where supernatant water was being pumped from the west basin to the eastbasin. The cause of these breaches was not determined, but one or both may have beencaused by contact of the pump assembly on the liner when the water levels were pumpeddown. A decision was made to extrusion weld a piece of HDPE over each breach. Thiswork was completed on November 30, 1999.
Summary Report September 2001 Fox River SMU 56/574-14
A typical work crew operating the dewatering system included six to seven personnel per12-hour shift: the dredge operator in the basin, a laborer at the lime delivery system andmix tank, the loader operator, and three to four laborers operating the feed tanks andpresses. The dewatering system generally operated at some capacity 24 hours per day,seven days per week, except for down time associated with system repairs and routinemaintenance (e.g., maintenance and repairs of the pump on the mini-dredge, andmaintenance and repairs of the press hydraulic pumps, air compressors, and conveyorbelts). There was also one down time incident when a press operator’s hand was injuredbetween two adjacent filter plates while unloading filter cake.
The total work crew for dredging, water treatment, and dewatering was generally 11 to 12laborers per 12-hour work shift. This number increased or decreased depending on siteactivities. An additional four operational personnel performed supervisory activities,health and safety oversight, and administrative activities.
4.3.5 Transportation and Disposal
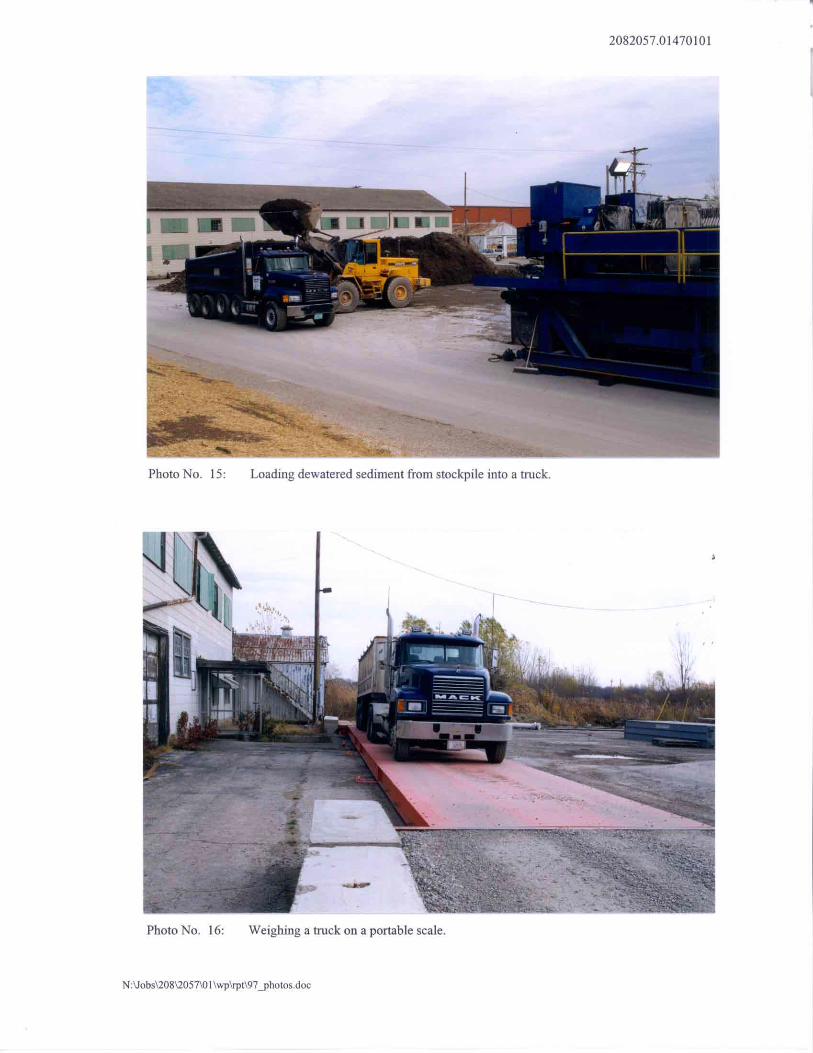
Trucks were loaded using a front-end loader (Photo No. 15). It took only a few minutes toload each truck from the stockpile of dewatered sediment. Tri-axles and semi’s were used.The trucks were weighed at the start of the day, on a temporary truck scale set up at thesite, to determine a tare weight. After loading, the trucks were re-weighed (Photo No. 16).The scale was calibrated at the start of the Project. The tri-axle trucks carriedapproximately 15 to 18 wet tons of sediment, whereas the semi’s carried approximately 20to 23 wet tons. The truck boxes were covered with tarps (Photo No. 17). The loading areawas carefully managed to keep the trucks from the stockpile and front-end loader workzone. For this reason, the trucks did not require washing before leaving the loading area.
A State of Wisconsin Uniform Hazardous Waste Manifest form was filled out for eachtruckload. A total of 1,240 loads of dewatered sediment were taken to the Fort Jameslandfill (includes water treatment filter media and other Project wastes) betweenSeptember 9, 1999 and January 17, 2000. On December 17, 1999, four additionaltruckloads (70 tons) of sediment were taken to the Brown County landfill in covered roll-off boxes under direction and control of the WDNR, to be used for pilot vitrification tests.It took about one hour for a truck to make a complete cycle between the site and the FortJames landfill. From two to five trucks were used each day hauling occurred, dependingon the size of the stockpile to be removed. Hauling was permitted to occur seven days perweek, but generally occurred only Monday through Friday because there was sufficientspace on the asphalt pad to build up the stockpile over the weekends. During finaldemobilization in Summer 2000 (see Section 4.5), an additional 249 truck loads ofsolidified sediment and other Project wastes were disposed at the Fort James landfill.
4.4 OPERATIONAL MONITORING
Monitoring of the Project was performed to provide information for an assessment ofimplementability, environmental effectiveness, and expense of large-scale sediment
Summary Report September 2001 Fox River SMU 56/574-15
dredging and disposal. Project monitoring was separated into two portions: OperationalMonitoring and Environmental Monitoring. The monitoring and evaluation of theenvironmental effectiveness of the Demonstration Project were presented in theEnvironmental Monitoring Quality Assurance Project Plan (EMQAPP) by others, and arenot covered in this report. Examples of environmental monitoring included water columnsampling of the river before, during, and after dredging, as well as air monitoring.Although not a part of the EMQAPP, the FRG also performed caged fish monitoring forthe Project.
An objective of the Operational Monitoring portion of the Project was to generateoperational information on dredging, dewatering, water treatment, and disposal tosupplement the environmental monitoring information that will be used by the stakeholdersfor their post-Project assessment. Further objectives of operational monitoring were tomonitor subcontractor work activities, check compliance with Project permits, and measuresubcontractor pay quantities.
An Operational Monitoring Quality Assurance Project Plan (OMQAPP) was prepared byMontgomery Watson for the SMU 56/57 Demonstration Project. In August 1999, it wasapproved by members of the FRG, WDNR, and EnChem, the analytical laboratory retainedby Montgomery Watson for most of the testing required by the OMQAPP. The OMQAPPdescribes data collection and analyses that were performed during the Project to monitorconstruction operations, and to ensure that Project operations did not impact Fort Jamesoperations.
Components of the operational monitoring program were:
1. Collect geotechnical and construction quality control data for earthen andgeosynthetic materials in the Shell property equalization basins to ensure theintegrity of the basins.
2. Collect river water turbidity data during installation and removal of the silt curtainto determine whether sediment resuspension occurs and to what levels.
3. Collect real-time turbidity data within and outside of the silt curtain duringdredging to monitor the performance of the silt curtain, and to optimize dredgingoperational parameters to minimize sediment resuspension.
4. Conduct sediment surface surveys before and after sediment removal and monitordredge slurry flow rates to determine and optimize the sediment removal rate andefficiency.
5. Perform optical surveys of the Fort James shoreline adjacent to the dredge area,and bathymetric surveys of shoreline transects into the dredge area, to monitorslope stability during and after dredging.
Summary Report September 2001 Fox River SMU 56/574-16
6. Obtain processed sediment PCB, mercury, percent solids, water content, strength,and paint filter test data after mechanical dewatering to assess the performance ofdewatering/solidification systems and permit operational adjustments to minimizethe cost of sediment disposal.
7. Collect water discharge concentration and flow rate data as required by theWPDES Permit.
8. Obtain water quality data at various points within the water treatment system toallow effectiveness evaluation of specific treatment system components andoptimization of operational parameters and system configuration.
9. Collect additional analytical data of Project consumables (i.e., water treatmentfilter media) upon completion, as required for proper disposal.
Before dredging began, Montgomery Watson agreed to assist with a component of theenvironmental monitoring program, because it involved sampling activities at theequalization basins and Montgomery Watson personnel were already going to be in thisarea on a daily basis. This component was sampling the dredge slurry from the pipelinebefore discharge to the basins. As the dredging work was nearing the end, the FRG andWDNR also contracted Montgomery Watson to collect post-dredge sediment cores andsubmit them to EnChem for analytical testing. At the same time, Montgomery Watson alsohad a post-dredge bathymetric survey performed, and this information was compared to thepre-dredge survey performed by the Corps of Engineers for the WDNR.
Details of the monitoring program are available in the OMQAPP, but a summary isprovided hereafter.
4.4.1 Equalization Basin Liner Testing
The operational monitoring program included collection of geotechnical and constructionquality control data of earthen and synthetic materials during construction of theequalization basins on the former Shell Oil Company property.
Compaction tests (ASTM D698, D2922, and D3017) were performed with a nucleardensity meter on the general fill materials used to construct the berms, and on the clay soilsused to construct the 12-in. thick soil liner. General fill was obtained on-site, whereas claysoils were trucked from an off-site borrow source. Samples of the compacted clay werecollected and tested for Atterberg limits (ASTM D4318), grain size - sieve and hydrometer(ASTM D422), and hydraulic conductivity (ASTM D5084) to check compliance with thespecifications in the OMQAPP. Surveying the top and bottom of the liner on a grid systemalso checked the clay liner thickness.
Quality control and quality assurance testing were performed during installation of the60-mil HDPE liner above the clay, in accordance with the Project specifications in the
Summary Report September 2001 Fox River SMU 56/574-17
OMQAPP. Both non-destructive tests (ASTM D5641 and D5820) and destructive tests(ASTM D4437) were performed to check seam integrity.
4.4.2 Turbidity Monitoring During Silt Curtain Installation
Turbidity readings were taken before and during installation of the silt curtain around thedredge area, generally at six-tenths the water depth (0.6D) of each location. Readings weretaken from a boat using a Model 6820, self-cleaning turbidity sensor and Model 610display and logger unit; both are manufactured by YSI Incorporated. The turbidity sensorhas a reported range of 0 to 1,000 NTUs, a resolution of 0.1 NTUs, and accuracy of + 5%of the reading or 2 NTUs, whichever is greater. Coordinate locations (Wisconsin StatePlane, North American Datum 1927 (NAD27)) of the turbidity readings were determinedusing a Trimble, Model ProXR differential global positioning system (GPS). Reportedaccuracy of the GPS is + 1 m. River velocity was also generally recorded when turbiditymeasurements were taken. A Marsh-McBirney, Flo-Mate Model 2000 portable flow meterwas used. It has a velocity range up to 20 fps, resolution of 0.01 fps, and accuracy of + 2%of the reading. These instruments were factory calibrated at the start of the Project.
4.4.3 Real-Time Turbidity Monitoring During Dredging
After silt curtain installation, real-time turbidity monitoring was conducted at six locations:
• Upstream of the dredge area outside the silt curtain (USO).
• Upstream of the dredge area inside the silt curtain (USI).
• Sidestream of the dredge area outside the silt curtain (SSO).
• Downstream of the dredge area outside the silt curtain (DSO).
• Downstream of the dredge area inside the silt curtain (DSI).
• Fort James water intake (FJI).
Monitoring locations are shown on Drawings A4 and A5. A YSI 6820 self-cleaningturbidity sensor was installed at each location, suspended inside a perforated PVC pipe atapproximately 0.5 to 0.6 the river depth. The turbidity sensors were connected to a YSI6200 data collection platform. The two upstream turbidity sensors shared a common datacollection platform installed at USO via cabling on floats to USI. The two downstreamsensors were installed in the same fashion. SSO and FJI had their own data collectionplatforms. Each data collection platform included a solar panel and battery, two-way radiotransceiver, and directional antenna. Data collected in the river was transmitted by radio toan antenna and YSI 6250 base station unit at Montgomery Watson’s job trailer at the Shellproperty. The base station transmitted the data to a personal computer, where it was storedon the hard drive and displayed in real time using YSI’s EcoWatch software.
Summary Report September 2001 Fox River SMU 56/574-18
Each turbidity sensor also recorded water temperature. At FJI, an electronic transducerwas also installed on the turbidity sensor to record water depth, which was then convertedto river elevation by adding the recorded depth to the surveyed elevation of the transducer.(Note: A benchmark elevation error was discovered late in the Project, which required theaddition of 0.2 ft to correct the recorded river elevations at FJI. The corrected data arereported herein.)
At SSO, a Son-Tek Argonaut-SL side looking acoustic doppler current meter was alsoinstalled to record river velocity and direction. The velocity meter was positioned to recordflow vectors parallel (i.e., downstream (positive) and upstream (negative)) andperpendicular (i.e., toward shore opposite the dredge area (positive) and toward shoreadjacent to the dredge area (negative)) to normal river flow. The reported range of thevelocity meter is + 6 mps (about 20 fps), with a resolution of 0.1 mps (about 0.3 fps) andaccuracy of + 1 % of the measured velocity. The FJI transducer and SSO velocity meterwere factory calibrated at the start of the Project.
The real-time turbidity monitors in the river (USO, USI, SSO, DSO, DSI) were initiallyinstalled on custom made floats approximately 4 ft by 5 ft in size (Photo No. 18), anchoredat each corner with a rope tied to a concrete block. However, instability problems with thefloats in rough water led Montgomery Watson to replace the floats with 6-in. or 8-in.diameter steel pipe piling (Photo No. 19), which were installed for us by McMullen & Pitzon October 5, 1999. A battery-powered, flashing amber beacon was installed at each rivermonitoring station. The turbidity monitor and transducer at FJI were installed on a woodenpole next to the water intake.
A YSI Model 6213 meteorological station was also installed on shore near the Fort Jamesboat slip (Drawing A5). It contained its own data collection platform, solar panel, battery,radio, and antenna, which transmitted data to the base station at the job trailer for real-timedisplay. Data collected included temperature, wind speed, wind direction, relativehumidity, and rainfall. The met station was factory calibrated at the start of the Project.
The real-time turbidity sensors and met station were programmed to record measurementsat 15-minute intervals, 24 hours per day. Monitoring continued through the dredgingperiod and beyond, until the instrumentation was dismantled, generally in late December1999. Montgomery Watson sent to members of Fort James, the FRG, and WDNR dailyfiles of the recorded data via electronic mail, which could be viewed on their respectivepersonal computers using YSI’s EcoWatch software. Periodic data gaps occurred, duringreplacement of the floating platforms with the fixed piling, and during mechanicalproblems with the instrumentation. Repeated problems were had with the river velocitymeter, apparently as a result of radio signal interference with the turbidity sensor, whichwere not resolved until near the end of dredging.
The 6820 turbidity sensors were factory calibrated. Calibration was checked in the field atthe time of deployment using the hand-held display unit and 0 NTU (de-ionized water) and100 NTU standard solutions provided by YSI. Calibration of the spare 6820 turbiditysensor, used for manual turbidity readings in the river and for water treatment sampling,
Summary Report September 2001 Fox River SMU 56/574-19
was checked daily with the 0 and 100 NTU standard solutions. The calibration wasadjusted, as necessary, to maintain zero scale and readings within + 5 NTU using the100 NTU standard solution (i.e., + 5%). The hand-held display unit and spare turbiditysensor were used for weekly checks of the real-time turbidity sensors. First a reading wastaken with the spare unit next to the real-time unit. Then the real-time unit wasdisconnected from the data collection platform and subsequently connected to the hand-held unit. The readings were compared. If they were within + 5%, no action wasnecessary. If they were different by more than 5%, the real-time unit was removed fromthe river, and the sensor was cleaned, replaced, and checked again. Cleaning of the sensorwas seldom necessary due to its self-cleaning mechanism of the optics.
4.4.4 Dredge Production Monitoring
A doppler flow meter was installed on the dredge slurry pipeline to measure slurry density,flow rate, and total flow. However, the dredging subcontractor experienced numerousproblems maintaining and monitoring this meter throughout the Project. Examples of theproblems included occasional loss of electric power to the instrument, and periodic andrandom stoppage of the flow meter operation for unknown reasons. This caused gaps indata acquisition, which led the subcontractor to often estimate results in his daily reports.Further, reported daily values for slurry density (in dry tons) consistently overstated thedredged mass removed, based on comparison to in-river dredge surveys and percent solidstest results on slurry samples. For these reasons, Montgomery Watson considers the data tobe unreliable and a discussion of the results is not included herein.
A pre-dredge survey was performed on August 14, 1999. Dredging began on August 30,1999. An echo-sounder in a boat, which traveled along transect lines parallel to theshoreline, was used to collect bathymetric data. Coordinate positions were determinedusing a total station on shore and a prism in the boat. Thirteen subsequent productionsurveys were performed: on September 16 and 28; October 4, 7, 15, 22, and 29;November 4, 11, 22, and 30; and December 3, and 12, 1999. About one month beforedredging ended, the positioning method was changed by integrating a GPS in the boat withthe echo-sounder. A post-dredge survey was performed on January 8, 2000, but a smallarea at the northwest corner of the dredging limit could not be completed due to thepresence of ice.
4.4.5 Shoreline Stability Monitoring
Montgomery Watson established a target dredge area that was about 20 ft beyond the edgeof measured shoreline debris (Drawing A5), which was approximately 50 ft from thewater’s edge depending on river level. As requested by Fort James, Montgomery Watsonmonitored the shoreline adjacent to the dredge area to check for potential slope instabilitycaused by dredging. The monitoring included optical surveys along the shoreline andbathymetric surveys perpendicular to the shoreline. These surveys were performedbetween dredging events, generally daily, at 50-ft stations established by a surveyor forMontgomery Watson before dredging started.
Summary Report September 2001 Fox River SMU 56/574-20
Optical surveys were performed by sighting with a transit between control points along abaseline of wooden hubs set at 50-ft stationing. Horizontal offsets from the sight line, ifany, were measured and recorded. The elevations of the wood hubs were also surveyedwith the transit or a level, and compared to elevations prior to dredging. No lateralmovement was detected over the 3.5-month dredging period, and only slight verticalmovement (within survey precision) was measured.
The bathymetric surveys were performed at transect lines at the 50-ft shoreline stationing.The top of sediment was sounded, and the elevation of the sediment was determined bysubtracting the river elevation (using a staff gage installed at the Fort James water intake)from the water depth. The bathymetric surveys were generally performed by wading fromshore, but a boat was also used. Measurements were taken at 10-ft intervals, beginning at astake on shore and extending approximately 50-ft out into the river. Recorded elevationswere compared to pre-dredge elevations along the transects. No appreciable differenceswere observed, and the bathymetric surveys were stopped on October 1, 1999 withapproval of Fort James. Cessation was approved because the optical monitoring to thispoint in time was showing no shoreline instability, and because the bathymetric surveyswere labor intensive and time consuming to complete.
4.4.6 Dewatered Sediment Monitoring
The dewatered sediments had to pass the paint filter (free liquids) test in order to beclassified as non-liquid wastes for landfill disposal under Wisconsin solid wasteregulations. A target of 58% solids and an unconfined compressive strength of 0.4 tsf werealso established so that the dewatered sediments would have adequate physicalcharacteristics for handling and disposal. In addition to these physical characteristics, theFRG, WDNR, and Fort James were interested in knowing the PCB and mercuryconcentrations of the dewatered sediments for purposes of disposal records and massbalance studies.
Samples of the dewatered sediment were collected from the front-end loader during loadingof about every third truck (i.e., about every 60 wet tons). Ten consecutive sub-sampleswere considered a whole sample representing a batch of approximately 600 wet tons ofdewatered sediment. Each of the ten sub-samples was sent to EnChem with a chain ofcustody form for compositing and analytical testing. Generally for the second, fifth, andeighth sub-samples, a second sub-sample was collected for physical testing in a fieldlaboratory. Test results from the three sub-samples were averaged to represent each wholesample.
Analytical tests performed on each whole sample composited from ten sub-samplesincluded paint filter (SW 846 9095A), percent solids (SM 2540G Mod), specific gravity(ASTM D854), PCBs (SW 846 8082), and mercury (SW 846 7471A). The laboratorypercent solids results were used to compute dry tons of dewatered sediments for paymentpurposes. The laboratory emailed test results to Montgomery Watson as they werecompleted, which were forwarded to the WDNR and FRG. Validated data packages are inMontgomery Watson’s Project files.
Summary Report September 2001 Fox River SMU 56/574-21
Physical tests performed in the field for operational quality control purposes includedpercent solids (weight of dry solids to total sample weight) (SM 2540B), moisture content(weight of water to dry weight of solids) (ASTM D2216), wet and dry density, andunconfined compressive strength using a hand-held torvane unit. Wet density wasdetermined by placing the dewatered sediment at its field moisture into a 4-in. diameterProctor mold (1/30-cf) using standard Proctor test methods (i.e., a 5.5-lb hammer, sedimentplaced in three layers, 25 hammer drops per layer; fewer hammer drops were used if thematerial was too wet). Torvane tests were performed on the ends of the Proctor mold afterit was trimmed, before the sediment was extruded. Field test results were summarized inspreadsheets and emailed to members of the FRG and WDNR weekly.
4.4.7 Water Treatment WPDES Permit Monitoring
The water treatment system operations monitored by Montgomery Watson included thedischarge flow rate, and sampling and analysis of the system influent and effluent, asrequired by the WPDES Permit. Table 2 of the WPDES Permit specified the monitoringrequirements. Since carbon was used in the treatment process (i.e., tertiary treatment),several substances were able to be omitted from the monitoring program. The monitoringprogram and discharge limits are summarized as follows:
MonitoringEffluent Limitations Requirements
Daily Weekly Monthly Sample SampleParameter (Method) Maximum Average Average Frequency Type
Effluent: 001Flow (metered in MGD) --- --- --- Daily Continuous
In addition to the above routine monitoring, sampling and testing for priority pollutants wasrequired on an effluent sample and a background river water sample soon after start-up.Similarly, a composite sample was required of the effluent for Whole Effluent Toxicity
Summary Report September 2001 Fox River SMU 56/574-22
(WET) testing, both acute and chronic. A sample of Fox River receiving water, outsidethis or other mixing zones, was also taken for use in the WET testing methods.
pH, turbidity, and flow were measured in the field. pH was measured with a portableinstrument and turbidity was measured with the spare YSI 6820 turbidity sensor; bothinstruments were calibrated daily. The flow was measured by a flow meter, whichdisplayed flow rate (gpm) and total flow (gal). With the exception of mercury and WETtests, the laboratory tests were performed for Montgomery Watson by EnChem or theirsubcontracted laboratory. Low-level mercury and WET tests were performed by theWisconsin State Lab of Hygiene under contract to the WDNR. All laboratory sampleswere shipped with a chain of custody form.
Influent (101) and effluent (001) sample locations are shown on Drawings A6, A7, and A8.A pipe saddle was mounted on the effluent pipe downstream of the flow meter, whichdirected a sidestream of treated water through an automatic turbidity monitor into a 5-galplastic container. A pH probe was mounted inside the 5-gal container. The 5-gal containeroverflowed to a larger plastic tub, which contained an electric submersible pump and floatassembly to direct overflow back to the settling basins. Composite samples of the treatedeffluent were collected from the 5-gal container by a Manning automatic vacuum samplerprovided by Montgomery Watson (Photo No. 20). Initially, the sampler was programmedto collect a sample aliquot for each 10,000 gal of flow. However, a consistent electronicsignal from the flow meter was not able to be maintained, so the automatic sampler was re-programmed to collect an aliquot at 15 minute intervals, assuming a continuous flow of600 gpm. The sample aliquots were discharged into a 2.5-gal glass jar inside a smallrefrigerator. Grab samples were collected from the 5-gal container. Low-level mercuryeffluent samples required the use of “clean hands” protocols. Four grab samples werecollected from the 5-gal container (one about every six hours), which were flow-proportionally composited at the State Lab of Hygiene. When the weather conditionsbecame colder, the effluent monitoring and sampling devices were moved inside a portabletrailer next to the flow meter, and the tubing from the effluent pipe to the trailer waswrapped with electrical heating wire and insulation.
Initially, influent samples (101) were collected from a sample port in the influent piping,located between the equalization basins and the polymer/acid mix tank. After thesupernatant and filtrate systems were separated for treatment on October 16, 1999, theinfluent sample point designation was changed to 101A, which represented basinsupernatant after polymer addition and flocculation. The 101A influent samples werecollected in the east equalization basin.
EnChem emailed test results to Montgomery Watson as they were completed, which wereforwarded to the WDNR and FRG. These unvalidated results were used by MontgomeryWatson to prepare the monthly discharge monitoring reports (DMRs) required by theWPDES Permit. Validated data packages are in Montgomery Watson’s Project files.
Summary Report September 2001 Fox River SMU 56/574-23
4.4.8 Inner Treatment Process Monitoring
In addition to required WPDES Permit monitoring, water quality grab samples werecollected at various points within the water treatment system to allow evaluation of specifictreatment system components, as well as optimization of operational parameters andsystem configuration. Process monitoring included daily measurement of pH and turbidity,and weekly sample collection for laboratory analyses of PCBs, mercury, and totalsuspended solids (TSS). Grab samples were collected from sample ports in the processpiping. After the supernatant and filtrate treatment systems were separated, collection ofweekly samples was alternated between each system to avoid doubling of analytical costs.Sample locations are shown on Drawings A6, A7, and A8, and were identified as follows:
Original Water Treatment System (up to October 16, 1999)P1 – After Chemicals (Polymer and Acid) and Flocculation/ Before Sand FilterP2 – After Sand Filters/ Before Granular Activated Carbon (GAC)P3 – Filter Press Filtrate
Supernatant Water Treatment System (after October 16, 1999)P5 – After Sand Filters/ Before GACP6 – After GAC
Filtrate Water Treatment System (after October 16, 1999)P3 – Filter Press FiltrateP1 – After Acid and Equalization/ Before Sand FilterP2 – After Sand Filters/ Before GACP4 – After GAC
The grab samples were sent to EnChem and the State Lab of Hygiene, similar to theWPDES samples, with a chain of custody form. EnChem emailed test results toMontgomery Watson as they were completed, which were forwarded to the WDNR andFRG. Validated data packages are in Montgomery Watson’s Project files.
4.4.9 Other Sampling for Landfill Disposal Characterization
During demobilization activities in December 1999 and January 2000, media from the sandand GAC vessels were sampled and tested by EnChem for PCBs and percent solids. Aseparate representative sample from each vessel in the supernatant and filtrate treatmentsystems was collected and analyzed (total of six samples). The treatment media werehauled to the Fort James landfill and disposed with the dewatered sediments.
4.4.10 Dredge Slurry Monitoring
Montgomery Watson agreed to assist the FRRAT in collection of dredge slurry samplesfrom the dredge pipeline before discharge to the equalization basins. A Manning automaticvacuum sampler, similar to the effluent water sampler but with larger diameter sampleports and tubing, was provided and installed near the southeast corner of the east basin
Summary Report September 2001 Fox River SMU 56/574-24
(Photo No. 21), just before the slurry discharge point. This was also the location where aslurry flow meter was installed. A pipe saddle was mounted near the top and bottom of the12-in. diameter slurry pipe, with separate hoses joining together at the automatic sampler.When samples were not being collected, the sidestream slurry flow bypassed the automaticsampler through a hose leading to the east basin.
The sampler was wired to the slurry flow meter. The sampler was initially programmed tocollect a representative aliquot of slurry for every 30 dry tons of sediment recorded by themass flow meter (nuclear densometer). As noted previously, there were considerableproblems maintaining the dredge slurry flow meter, and a consistent signal to the samplerwas not able to be maintained. The sediment, and occasionally gravel and debris in theslurry, also regularly clogged the sampling hose and automatic sampler. Therefore, theFRRAT agreed that Montgomery Watson personnel would manually collect a dredge slurrysample periodically during dredging. As time allowed, the automatic sampler wasmanually turned on and off to collect an aliquot of dredge slurry in a 2.5-gal glass jar insidethe refrigerated unit. The refrigerator held two glass jars, and generally a slurry samplewas collected each day dredging was performed. USGS personnel came to the sitethroughout the week to pick up the slurry samples in the 2.5-gal jars. They processed eachsample, and then returned the sample and cleaned jars. The slurry samples were submittedto EnChem with a chain of custody form for analyses.
At the laboratory, EnChem analyzed the various matrices as follows:
EnChem emailed test results to Montgomery Watson as they were completed, which wereforwarded to the WDNR and FRG. Validated data packages are in Montgomery Watson’sProject files.
4.4.11 Pre-Dredge and Post-Dredge Monitoring
Monitoring before and after dredging included bathymetric surveys and sediment coresampling.
The WDNR contracted with the Corps of Engineers to perform a pre-dredge bathymetricsurvey, which was completed on August 23, 1999. Based on the information provided toMontgomery Watson, the Corps used a single-beam sonar to collect water depths on rangelines spaced at 50-ft intervals in directions parallel and perpendicular to the shorelineacross the Project area. Coordinate positions were determined with a GPS (WisconsinState Plane, North American Datum 1983 (NAD83)). Depths were referenced to riverelevation 576.8 (International Great Lakes Datum 1955 (IGLD55)).
Summary Report September 2001 Fox River SMU 56/574-25
The WDNR provided the Corps survey file to Montgomery Watson. The top of sedimentelevations in IGLD were converted to Mean Sea Level Datum (National Geodetic VerticalDatum 1929 (NGVD29)) by adding 1.24 ft, according to instructions from the BrownCounty surveyor. The Corps pre-dredge sediment elevations were then contoured, and thetopography is shown on Drawing A5. We compared this surface to the sedimenttopography in Montgomery Watson’s March 1998 BODR, and found the surfaces to bevery similar.
On August 19 to 21, 1999, just before the Corps’ pre-dredge survey and installation of thesilt curtain, Blasland Bouck & Lee (BBL) collected pre-dredge cores at the center of mostof the subunits identified on Drawing A5. The cores were collected for the FRG andWDNR to provide additional pre-dredge physical and analytical characterization of thesediments in the Project area. Samples were analyzed for BBL by EnChem. Portions ofthe results were shared with Montgomery Watson during the middle to latter stages of thefieldwork, and a complete set of validated results was provided to us after dredging ended,during preparation of this report.
The FRG and WDNR contracted with Montgomery Watson to collect post-dredge cores inthe subunits where dredging had occurred, as close as possible to the pre-dredge corelocations. This sampling work was performed December 20 and 27, 1999, and January 7,2000. Extremely cold temperatures and river ice hindered progress. Cores were taken atSubunits 12 through 17, 23 through 28, and 38 (13 locations). Duplicate cores were takenin Subunits 25 through 28 where a clean-up dredging pass had been completed in anapproximately 30 ft by 30 ft area at the center of these subunits.
Montgomery Watson used a differential GPS to mark the BBL pre-dredge core locations(to within about 5 ft) in those subunits where survey maps showed dredging had occurred.The water depth was then sounded with the WDNR’s custom sounding pole. Using theProject staff gage at the water intake, the post-dredge sediment elevation was computed,and it was compared to the pre-dredge sediment elevation. If the difference was more thanapproximately 1 ft, a post-dredge core was collected. Cores were collected through acenter well in a 16-ft long, flat-bottom aluminum boat (Photo No. 22). Sampling tubes of4-in. diameter Schedule 40 PVC were manually pushed into the sediment until refusal, andthen were driven a few more inches with a sleeve hammer to seat the bottom of the tubes infirmer sediment. A piston assembly inside the sample tubes aided in sample recovery.Core samples were processed in a building on the former Shell Oil Company property indescending intervals from the top of 0 to 4 in., 4 to 12 in., and 1 ft intervals thereafter. Thesamples were sent to EnChem with chain of custody forms for analyses of PCBs(SW846 8082), mercury (SW846 7471A), percent solids (SM 2540G Mod), and totalorganic carbon (SW 846 9060M). Test results were provided to BBL, FRG, WDNR, andMontgomery Watson after validation by the Project data validator.
As a quality control check on dredge surveys conducted by FSE, Superior Special Servicesperformed a survey to compute the volume of sediments dredged. This survey wasperformed on December 20, 1999 inside the silt curtain. Access to the dredge area was
Summary Report September 2001 Fox River SMU 56/574-26
hindered slightly by the presence of the dredge, the dredge slurry pipeline, and one anchorbarge, which had yet to be demobilized. Superior used an integrated system comprised of a22-ft long climate-controlled boat (Photo No. 23); multi-beam sonar for determining waterdepth; differential GPS for establishing location; gyroscope for heading; motion referenceunit for heave, pitch, and roll; and software package to provide a corrected coordinate datastream. Superior worked in NAD83 horizontal datum and NGVD29 vertical datum.Montgomery Watson provided them with the Corps pre-dredge survey file and base mapsfrom the BODR.
Superior prepared full-size color drawings showing the Corps pre-dredge sedimenttopography, their post-dredge sediment topography, cross-sections, and a 3D perspectivedigital terrain model. An electronic file and one complete drawing set were provided to theFRG and WDNR for their records. Due to their size, the full-size drawings are notincluded in this summary report. However, we used Superior’s post-dredge data set (x,y,zfile) to prepare a smaller scale post-dredge topographic map – see Drawings A10 andA10a. The approximate actual limits of dredging are outlined on these drawings. We alsoprepared a dredge thickness isopach map, by subtracting the post-dredge elevations frompre-dredge elevations – see Drawings A11 and A11a. Observations from these drawingsand computed dredge volumes are discussed in Section 5.0 of this report.
4.5 DEMOBILIZATION
As noted previously, dredging was discontinued on December 15, 1999 because of theonset of winter weather conditions. Low temperatures in the latter stages of theDemonstration Project required operating adjustments for all aspects of the hydraulicdredging, water treatment, and dewatering, because of freezing water in the pipelines andprocess equipment, as well as the formation of river ice.
Partial Project demobilization was performed between December 15, 1999 and January 19,2000, including:
• Treatment and river discharge of all but approximately 0.5 to 1.0 ft of water in theeast and west equalization basins. Due to cold conditions, it was impractical toremove the last portion of dredged solids from the west equalization basin (roughestimate of 3,000 cy), and a thin layer of water treatment settled solids in the eastbasin. Therefore, both basins were then covered with a temporary polyethylenecover, weighted down at the top of the perimeter berm.
• Removal of the production river dredge, the cutterhead dredge used as an anchorbarge, and the other anchor barge.
• Removal of the water treatment system, including tanks, pumps, controls andmost of the filter media and carbon.
Summary Report September 2001 Fox River SMU 56/574-27
• Removal of the lime storage and feed system, filter press feed tanks, filter presses,and filtrate tank.
• Removal of the truck scale and job trailers.
• Removal of the real-time river turbidity monitoring equipment.
The dredges, water treatment system and dewatering system tanks, and the filter presseswere pressure washed on the asphalt pad prior to demobilization from the site. Because thewater treatment system and filter presses had been decommissioned, the wash water andsolids were collected from the sump and transferred to the west equalization basin fortemporary storage over the winter, before the basin was covered.
Montgomery Watson made periodic site visits during the winter and spring months tocheck the standby conditions of the Shell property and the items left in the river (i.e., siltcurtain, dredge slurry piping, and piling used for the turbidity monitoring system).Batteries in the lights on the monitoring piling and silt curtain were replaced after ice-out inthe spring.
On May 26, 2000, the USEPA, WDNR, and Fort James finalized an Administrative Orderby Consent under Section 106 of the Comprehensive Environmental Response,Compensation, and Liability Act (CERCLA), to perform additional dredging atSMU 56/57. As a result, the WDNR and Fort James decided the silt curtain should not beremoved so that it could possibly be re-used during the additional dredging activities. Forthe same reasons, Fort James decided that Montgomery Watson should not remove theasphalt work pad, gravel roads and parking areas, the equalization basins, and thetemporary electrical service at the Shell property during the completion of demobilization.
Demobilization activities for the Demonstration Project were subsequently re-initiated onJune 12, 2000 and substantially completed on July 24, 2000. This remaining workincluded:
• General site clean-up along the Fort James shoreline and on the former Shell OilCompany property, including removal of remaining equipment and supplies fromthe vacant building on the Shell property.
• Removal from the river the monitoring piles (Photo No. 24), dredge slurrypipeline, and water treatment discharge pipeline. The piling were salvaged by thesubcontractor who installed them for Montgomery Watson. The piping wassalvaged by FSE, the Project subcontractor for dredging, dewatering, and watertreatment operations.
• Removal from the Shell property all process piping, which was salvaged by FSE.
Summary Report September 2001 Fox River SMU 56/574-28
• Removal of remaining limited construction materials and water treatment mediafrom the asphalt work pad, which were trucked and disposed at the Fort Jameslandfill (Photo No. 25).
• Removal and disposal of the temporary cover over the two equalization basins,and pumping out the water for treatment. Water treatment was performed using ascaled-down solids removal system, similar to the process used the prior fallduring dredging. Water was pumped into a 20,000-gal portable equalization tankfor initial settling (primary treatment), from which it was pumped through amanifold of three bag filters connected in parallel (secondary treatment), and thenthrough two portable carbon vessels connected in parallel (tertiary treatment).Treated water was pumped into a second portable 20,000 gal storage tank (PhotoNo. 26). The treatment system was sized for a flow rate of approximately 100 to150 gpm. Because the Project WPDES Permit had expired on December 31,1999, WDNR approved transporting the treated water to the Fort James Millusing a tank truck, where it was discharged to the Mill wastewater collectionsystem (Photo No. 27). Wastewater at the Mill is treated and discharged to theFox River under the Mill’s WPDES Permit.
• Removal of the sediments and settled solids from the equalization basins,followed by the underlying geomembrane liners. A combination of backhoes,high pressure water hoses, and manual labor were used to remove the solids.Prior to removal, the materials were solidified, as necessary, with the addition oflime so the material would pass paint filter testing (Photo No. 28). These testswere performed daily as a backhoe mixed the lime and loaded the trucks (PhotoNo. 29). A representative sample of material was taken as each truck was loaded.These samples were shipped to EnChem’s laboratory for compositing and testing(PCBs, mercury, percent solids, specific gravity), at the same frequency as thework the prior fall. The basin HDPE liners were cut up and also loaded into thetrucks, along with the top few inches of the underlying clay liner (Photo No. 30).The trucks were visually inspected and then tarped, after which they drove a shortdistance to the Fort James West Mill to be weighed on Fort James’ truck scale.Each truck load was manifested for disposal at the Fort James landfill. Includingthe 249 truck loads of solidified sediment and other Project wastes during Projectdemobilization, a total of 1,489 loads were disposed at the Fort James landfill forthe SMU 56/57 Demonstration Project.
• Final pressure washing of the water treatment system components, equipmentused to excavate sediment from the basins (Photo No. 31), the asphalt work padand sump, and discharge of the collected water at the Fort James Mill. Whilepumping out the sump for cleaning, water was observed flowing back into thesump through the joint between the concrete lid and and underlying section ofmanhole. As a result, a decision was made to pull out the sump, and thesurrounding backfill was excavated (Photo No. 32), manifested, and hauled to theFort James landfill. The concrete manhole of the sump was salvaged by FortJames.
Summary Report September 2001 Fox River SMU 56/574-29
• Sampling of the remaining basin clay liners, surface soils around the asphalt pad,and the sump backfill, for PCBs and mercury testing. This work was done by aconsultant of Fort James to check for potential Project-related impacts. As aresult, a small amount of surficial soil (four trucks totaling 67 tons) adjacent to theasphalt pad, found to contain PCBs ranging from 0.3 to 3.9 mg/kg, was excavatedon November 20, 2000 and disposed at the Fort James landfill.
N:\Jobs\208\2057\01\wp\rpt\97_sum rpt_sec04.doc
Summary Report September 2001 Fox River SMU 56/575-1
5.0 PROJECT PERFORMANCE
This section of the Summary Report provides performance results of the construction andmonitoring activities. Table 1 summarizes the Project metrics, which are discussedthroughout the following sections.
5.1 DREDGING
5.1.1 Volume of Sediment Removed
Figures 2 and 3 show dredge volumes over the course of the Project. Figure 2 shows thedredge volumes computed between dates of bathymetric surveys, and Figure 3 shows thecumulative dredge volume, totaling 31,346 cy. The dredge volumes during the course ofthe Project were reported by Four Seasons Environmental (FSE) based on their periodicsurveys, whereas the final dredge volume was computed by Superior Special Servicescomparing the Corps pre-dredge survey data (Drawing A5) with Superior’s post-dredgesurvey data (Drawings A10 and A10a). Montgomery Watson performed an independentdredge volume calculation using the pre- and post-dredge survey data, and arrived at afigure 2.4% higher than Superior’s calculation, which is considered reasonable precision.We also calculated the volume of sediment within the dredge limits depicted onDrawings A10 and A10a, using the GIS model described in the May 1998 Basis of DesignReport (BODR). This area contained an estimated 38,670 cy of sediment, assumingvertical cuts at the outer limits and dredging to the originally established target elevation565.
5.1.2 Dredge Production
Daily dredging hours over the course of the Project are shown on Figure 4. BetweenAugust 30 and December 15, 1999, dredging occurred on 96 of 108 calendar days,averaging 4.3 hours per day. The reported cumulative dredging time was 464.5 hours asshown on Figure 5. Average dredging production rates were monitored over the course ofthe Project, by dividing cumulative dredge survey volumes by cumulative dredge hours.River bottom surveys were not performed immediately before and after the clean-up passdredging, so production results differentiating between mass removal and clean-up are notavailable.
Figure 6 shows that the average hourly dredging rate over the course of the Project was60 cy/hour, below the goal of 200 cy/hour. The highest cumulative rate achieved was90 cy/hour. Figure 7 shows the average daily dredging rate was 294 cy/day, below the goalof 900 cy/day. The highest cumulative rate achieved was 473 cy/day. The highestcumulative rates are based on the sediment volume (6,155 cy) dredged between the start ofthe Project and the first available river survey on September 16, 2000 (68 hrs of dredgingover 13 days). The figures show the initial higher average dredge rates were notsustainable. Higher dredge rates were achievable early on, in part, because the dredge was
Summary Report September 2001 Fox River SMU 56/575-2
able to crowd the horizontal auger cutterhead into the sediment, whereas later on thedredge pumped more water while overlapping adjacent dredge tracks.
Based on the total measured dry tons of sediment dredged and the total measured volumeof water treated and discharged back to the river (these figures are discussed later), theaverage percent solids in the dredge slurry was 4.4%. The goal for solids content of thedredge slurry was 7.5%.
5.1.3 Turbidity Near the Dredge
Montgomery Watson made manual turbidity measurements near the dredge periodicallyduring the course of the Project, as time allowed, to supplement real-time monitoring bythe fixed instrumentation. Measurements were made at a depth six-tenths of the waterdepth (0.6D). Of the data collected and reviewed, there were eight dates when turbiditymeasurements were taken during, or within a one-hour period after, dredging at locationsboth upstream and downstream of the dredge. The dates meeting these criteria wereSeptember 25, 29, and 30, 1999 (Figure 8); October 1, 24, and 30, 1999 (Figure 9); andNovember 7 and 12, 1999 (Figure 10). Manual turbidity measurements on other dateseither were taken before dredging began or more than one hour after it had started, or didnot include an upstream measurement for comparison of dredging effects on sedimentresuspension. One hour was chosen as a limiting criterion in data review, becausedownstream turbidity measurements were made no further than 300 ft from the dredge, adistance that would have been impacted by resuspension based on measured rivervelocities. The measured river velocity on these dates was generally between 0.1 and0.2 fps, which means a sediment particle re-suspended by dredging could travel a distanceof 360 to 720 ft in one hour.
The three figures, with one exception, indicate that turbidity downstream of the dredge washigher than turbidity upstream of the dredge. The amount of the increase, and the distancedownstream of higher turbidity, varied. The one exception is on Figure 8 formeasurements on September 29, 1999. On this date and time, the turbidity 10 ft upstreamof the dredge was higher than measured turbidity 20 to 100 ft downstream of the dredge.The turbidity value 20 ft downstream (150 NTU) was only slightly less than the value 10 ftupstream (170 NTU), however.
5.1.4 Turbidity Inside and Outside the Silt Curtain
Thousands of turbidity measurements were recorded by the real-time monitoring system ateach of six locations in the river (see Drawing A5) to check for potential sediment re-suspension due to dredging:
• Upstream of the dredge area outside the silt curtain (USO).
• Upstream of the dredge area inside the silt curtain (USI).
• Sidestream of the dredge area outside the silt curtain (SSO).
Summary Report September 2001 Fox River SMU 56/575-3
• Downstream of the dredge area outside the silt curtain (DSO).
• Downstream of the dredge area inside the silt curtain (DSI).
• Fort James water intake (FJI).
Values were recorded at 15-minute intervals whether or not dredging was occurring. All ofthe data was reviewed. Some data points were omitted, if it was determined the resultswere erroneous due to turbidity sensor malfunction. A very limited few additional datapoints were omitted, if they were many times greater than the data point 15 minutes beforeand 15 minutes after the anomalous point for no apparent reason (i.e., unrelated to adredging period). (For example, for the DSO data set, about 1% of 9,300 data points werenot used, and for DSI, about 4% of 7,700 data points were not used, for the reasons stated.)Monthly averages are summarized as follows for each location.
Average Turbidity (NTUs)Location Aug-99 Sep-99 Oct-99 Nov-99 Dec-99
FJI 46 46 29 31 16
USO 46 40 21 18 9
USI 49 44 24 21 16
SSO 43 35 21 20 11
DSO 41 33 25 22 20
DSI 38 35 31 33 20
Observations from this table include:
1. At each location, the average turbidity generally declined in successive months.
2. From month to month, the maximum difference in average turbidity between allsix locations only varied slightly (by 10 to 15 NTUs).
3. In a given month, the average turbidity at locations outside the silt curtain was notappreciably different, regardless of position relative to the dredge or normal riverflow direction.
4. From month to month, the average turbidity inside the silt curtain changed frombeing higher upstream to downstream, and vice versa, but the differences werenot appreciable (from 4 to 12 NTUs).
5. In a given month, the average turbidity inside the silt curtain was generallyslightly higher than its adjacent outside monitor, but the differences were notconsistent or significant (e.g., relative to outside the silt curtain, average turbidityinside ranged from 3 NTUs lower to 11 NTUs higher ). These differences werenot that significant considering the accuracy of the monitoring devices (+ 2 NTU).
Summary Report September 2001 Fox River SMU 56/575-4
The real-time turbidity data was plotted for each monitoring location in monthly andweekly periods, resulting in numerous figures. The dredging periods were noted on eachfigure. USO/USI data and DSO/DSI data were plotted together for ease of comparison.For examples of the figures, the October monthly and weekly charts for DSO/DSI areincluded herein. On the figures for DSO/DSI only, we also noted the periods when FortJames received coal boat deliveries to evaluate whether prop wash during docking of theboats may have caused elevated turbidity.
Figure 11 is the DSO/DSI monthly chart for October 1999. Note that dredging occurred atregular intervals throughout the month, and Fort James received six coal boats. At thisscale, it is difficult to ascertain any significant differences in turbidity between the monitorsinside and outside the silt curtain, or during periods of dredging and coal boat delivery.(Note that the vertical scale was kept the same at each of the six monitoring locations tosimplify comparisons, which is not evident when viewing this limited data set.)Differences, if any, are more evident, however, when isolating the data to a given week, asshown on Figures 12 through 15.
For example, on Figure 12 for the period of October 1-8, the DSO and DSI turbidityreadings were relatively the same for the entire week. However, on October 5, the turbidityat DSI was slightly elevated compared to DSO during, and/or following, a period ofdredging. The dredge was positioned approximately 700 ft upstream of the silt curtain atthis time. On Figure 15 for the week of October 25-31, the DSI turbidity was slightlyhigher than DSO for the entire week, regardless of whether dredging was occurring.Slightly higher turbidity is evident at DSO compared to DSI on several days when coalboats made deliveries: October 5-6, October 8, and October 25. Conversely, onOctober 24 the DSO turbidity was lower than DSI during a coal boat delivery.
In summary, the evaluation of manually-collected turbidity data generally showed thatturbidity downstream of the dredge was higher than upstream of the dredge. On the otherhand, the evaluation of extensive real-time turbidity data within and outside the silt curtainshowed inconsistent, and generally insignificant, differences. The data indicates dredge-induced turbidity was minimal to negligible at a distance tens of feet to a few hundred feetfrom the dredge. Often the dredge-induced turbidity near the silt curtain could not bereadily discerned from the background variability of turbidity during non-dredge periods.
5.1.5 Dredge Slurry Test Results
The results of tests on samples of the dredge slurry from the environmental monitoringprogram are summarized below. Note that a value of zero was used for all statisticalcalculations in this report when a test result indicated a parameter was undetected. Rangesin detection limits, as reported by the analytical laboratory, are also summarized below.
Summary Report September 2001 Fox River SMU 56/575-5
Matrix Parameter Units DetectionLimit
Average Minimum Maximum Count
Slurry Mercury ug/L 0.21-3.4 46.7 4.9 570 76
Total Solids % --- 2.6 0(1 value)
11.4 68
TSS mg/L 29-350 25,931 1,200 200,000 77
Solids PCBs ug/kg 100-5,200 56,849 700 260,000 74
Total Solids % --- 21.8 9.7 45.2 74
Specific Gravity --- --- 2.57 2.13 2.96 76
Supernatant PCBs ug/L 1.7-660 214 0(5 values)
8,800 76
TSS mg/L 2.8-290 3,107 46 180,000 76
As shown, the average percent solids of the slurry samples was 2.6% compared to theback-calculated percent solids of 4.4% for dredge slurry as described in Section 5.1.2. Theback-calculated figure is likely more representative, because of the dredge slurry samplingproblems described in Sections 4.4.4 and 4.4.10, which may have biased the percent solidsof slurry samples on the low side. The percent solids of dredge slurry samples averaged3.9% percent solids in the first two months of dredging and 1.7% in the last one and one-half months. These measured results show higher solids when the dredge is able to“crowd” the sediment during initial dredge passes, and lower solids when the dredgepumps more water during thinner cuts and overlap of adjacent dredge tracks.
5.2 WATER TREATMENT
5.2.1 Influent Test Results
The results of tests on the influent water (basin supernatant) to the water treatment system(sample point 101/101A) are summarized below. Note that a value of zero was used for allstatistical calculations when a test result indicated a parameter was undetected. Ranges indetection limits, as reported by the analytical laboratory, are also summarized below.
Parameter Units DetectionLimit
Average Minimum Maximum Count
PCBs ug/L 0.2-1.7 4.8 0.65 34 15
Mercury ng/L 0.1 71 0(3 values)
546 15
TSS mg/L 0.2-290 66 0(2 values)
3,300 100
Oil & Grease mg/L 1.4 3.9 0(23 values)
9.5 101
pH su --- 8.4 5.2 12.6 102
Turbidity NTU --- 58 0(1 value)
810 94
Summary Report September 2001 Fox River SMU 56/575-6
5.2.2 Effluent Test Results
The results of tests on the treated effluent before discharge to the Fox River aresummarized below. Note that a value of zero was used for all statistical calculations whena test result indicated a parameter was undetected. Ranges in detection limits, as reportedby the analytical laboratory, are also summarized below. Test results are plotted by sampledate on the referenced figures, except for dioxins that were undetected. Each figure notesthat through October 16, 1999 the basin supernatant and filter press filtrate were combinedfor treatment. After October 16, 1999, the supernatant and filtrate were treated in separateprocess systems.
Parameter Units DetectionLimit
Average Minimum Maximum Count WPDESLimit
ReferenceFigure
PCBs ug/L 0.33 0.02 0(14 values)
0.37 15 1.2 16
Mercury ng/L 0.1 16.5 0(1 values)
101.8 19 1,700 17
TSS mg/L 0.2-16 7.3 0(6 values)
280 102 10 18
Oil & Grease mg/L 1.4 3.4 0(24 values)
8.3 102 10 19
pH su --- 7.5 6.0 10.8 101 6-9 20
Turbidity NTU --- 1.2 0(30 values)
22 94 --- 21
BOD5 mg/L 2.0 11.5 0(3 values)
27 19 2.0 22
Ammonia N mg/L 0.012-1.2 16.7 1.6 49 102 --- 23
Dioxins pg/L 1.6-7.1 0 0(all values)
0 15 --- ---
As shown on Figure 16, PCBs were detected in only one weekly effluent sample, and theresult of 0.37 ug/L was below the WPDES Permit monthly average limit of 1.2 ug/L. TotalPCBs are reported in the tables and figures, although only Aroclor 1242 was detected in theone sample.
Figure 17 shows that the mercury concentration of 101.8 ng/L in the first weekly effluentsample was considerably higher than subsequent samples. All test results were well belowthe WPDES Permit daily maximum limit of 1,700 ng/L.
The table above includes the total suspended solids (TSS) results of all daily samples. Asnoted, TSS concentrations shown on Figure 18 exclude one result of 280 mg/L, which isanomalous compared to the other data. Without this value, the maximum measuredconcentration drops to 42 mg/L, and the average drops to 4.6 mg/L. Considering allresults, the WPDES Permit daily maximum limit of 10 mg/L was exceeded six times in thefirst five weeks of operation. After learning of the results and diagnosing possible causesfor periodic high values, the diversion valve and piping on the effluent line, used tocirculate water back to the basins, was relocated upstream of the automatic sampler. Waterwas diverted back to the basins for re-treatment instead of to the river if the pH and/or
Summary Report September 2001 Fox River SMU 56/575-7
turbidity sensors indicated upset conditions. Flow was also diverted to the basins duringperiodic back-flushing of the sand and carbon treatment vessels. Before October 7, 1999during these diversion periods, the automatic sampler continued to pull samples from theflow stream, biasing the TSS results. After relocating the diversion piping, daily TSSresults were consistently below the Permit limit, until two exceedances in the last few daysof operation. Because of lab turnaround time, these last two exceedances were unknownuntil after operations ended.
Figure 19 shows that daily oil and grease concentrations were below the Permit limit of10 mg/L for all samples.
Figure 20 shows that the field pH in daily grab samples was within the Permit range of 6 to9, except for one measured value of 10.8 on September 28, 1999. For comparison on thisday, the composite sample collected by the automatic sampler had a pH less than 9.
Figures 21 and 23 show field turbidity and laboratory ammonia nitrogen test results,respectively. No Permit limits were established for these parameters, but monitoring wasstill required.
BOD5 results shown on Figure 22 indicate that the Permit weekly average limit of 2 mg/Lwas exceeded, except for three samples when no BOD5 was detected. In accordance withthe Permit requirements, additional BOD5 samples were collected and analyzed on twooccasions when the exceedances became known. The results of the additional sampleswere still above the Permit limit. The results were discussed with the WDNR and FRG inweekly construction meetings, and it was agreed to continue treatment system operationand weekly monitoring without interruption or process modifications to the treatmentsystem.
With the exception of BOD5, the Project was successful in meeting WPDES Permit limits;minor exceedances were readily corrected with changes and adjustments to the treatmentsystems.
The daily volume of water discharged from the treatment system to the Fox River is shownon Figure 24. Before the treatment system capacity was expanded, the average dailydischarge was 385,700 gal (i.e., average 268 gpm, assuming continuous operation). Whenthe expanded capacity became operational after October 16, 1999, the average dailydischarge volume increased to 886,600 gal (i.e., average 616 gpm, assuming continuousoperation). Cumulative discharge volume is plotted on Figure 25, and indicates a total of75,256,500 gal of water were treated and discharged to the river over the course of theProject. During demobilization activities in June and July 2000, an additional 957,400 galof water were treated and discharged to the process water system at the Fort James WestMill, not directly to the river. The total volume of water treated during the DemonstrationProject was 76,213,900 gal.
Summary Report September 2001 Fox River SMU 56/575-8
5.2.3 PCB and Mercury Mass Discharged to the River
PCB and mercury concentrations of weekly samples, together with the volume of waterdischarged to the river between each sample, were used to compute the mass of PCBs andmercury discharged to the river in the treated effluent. Figure 26 shows a cumulative massof 0.028 lb of PCB was discharged to the river over the course of the Project (only onesample detected PCBs). Figure 27 shows a cumulative mass of 0.0076 lb of mercury wasdischarged to the river in the treated effluent.
5.2.4 Treatment Process Evaluation
Additional water samples were collected and tested from various points in the treatmentsystems to provide data for evaluating which steps provided the best treatment efficiency.These results could be considered in potential future sediment removal projects on thelower Fox River. Since PCBs are the primary contaminant of concern, they were used forthis evaluation. The results are summarized below for the original water treatment system,the basin supernatant water treatment system, and the filter press filtrate water treatmentsystem. It should be noted that the granular activated carbon in the original carbon vessel(about 10 tons) was replaced within a few days of Project start-up due to inadvertent solidsclogging. Thereafter, the media in the sand filter and carbon vessels (about 10 tons each)were periodically back-flushed with water, as needed, during the course of the Project, butwere not changed out until Project demobilization and final disposal in the Fort Jameslandfill.
Original Water Treatment System (up to October 16, 1999)
101 – Basin SupernatantP1 – After Chemicals (Polymer and Acid) and Flocculation/ Before Sand FilterP2 – After Sand Filters/ Before Granular Activated Carbon (GAC)P3 – Filter Press Filtrate001 – Treated Effluent
Original Water Treatment System
Sample PCBs (ug/L) Treatment Step Reduction (%)
Date 101 P3 P1 P2 001 P1/101 P1/P3 P2/P1 001/P2
Chem&Floc Chem&Floc Sand Carbon
9/8/99 10 1.5 6.0 4.7 0 40% -300% 22% 100%
9/16/99 2.7 1.0 2.1 1.6 0 22% -110% 24% 100%
9/21/99 3.6 2.5 2.7 2.3 0 25% -8% 15% 100%
9/28/99 34 1.8 2.9 1.8 0 91% -61% 38% 100%
10/5/99 2.9 1.9 2.4 2.1 0 17% -26% 13% 100%
10/13/99 1.5 2.4 2.5 2.0 0 -67% -4% 20% 100%
Average 9.1 1.9 2.5 2.4 0.0 22% -85% 22% 100%
Summary Report September 2001 Fox River SMU 56/575-9
Supernatant Water Treatment System (after October 16, 1999)
101A – Basin Supernatant after Polymers and Flocculation/ Before Sand FiltersP5 – After Sand Filters/ Before GACP6 – After GAC001 – Treated Effluent
Supernatant Water Treatment System
Sample PCBs (ug/L) Treatment Step Reduction(%)
Date 101A P5 P6 001 P5/101A P6/P5
Chem/Floc & Sand Carbon
10/19/99 1.4 0.0 0.0 0.0 100% ---
11/02/99 0.89 0.0 0.0 0.0 100% ---
11/23/99 3.2 0.0 0.0 0.0 100% ---
12/07/99 0.65 0.46 0.0 0.0 29% 100%
12/16/99 1.6 1.2 0.0 0.0 25% 100%
Average 1.6 0.4 0.0 0.0 64% 100%
Filtrate Water Treatment System (after October 16, 1999)
P3 – Filter Press FiltrateP1 – After Acid and Equalization/ Before Sand FilterP2 – After Sand Filters/ Before GACP4 – After GAC001 – Treated Effluent
Filtrate Water Treatment System
Sample PCBs (ug/L) Treatment Step Reduction (%)
Date P3 P1 P2 P4 001 P1/P3 P2/P1 001/P2
Chem&Floc Sand Carbon
10/26/99 4.9 2.3 1.6 --- 0 53% 30% 100%
11/09/99 2.2 4.5 2.8 --- 0 -105% 38% 100%
11/16/99 7.9 4.6 2.5 --- 0 42% 46% 100%
12/01/99 1.3 1.9 1.8 --- 0.37 -46% 5% 79%
Average 4.1 3.3 2.2 --- 0.1 -14% 30% 95%
A review of this data indicates that the polymer addition and flocculation step had mixedresults for PCB reduction. This step did little for the filtrate PCB removal, but it removed aconsiderable amount of PCBs from the supernatant. The next step of dual media (i.e.,sand) filters removed a large percentage of the PCBs, but the final carbon step wasessential to remove the balance of the PCBs in order to meet the WPDES Permit limit of1.2 ug/L.
Summary Report September 2001 Fox River SMU 56/575-10
5.2.5 Treatment Media Residual PCB Concentrations
PCB results of representative treatment media samples taken during Project demobilizationare summarized below. These results confirm that the carbon captured considerably morePCBs than the sand.
Sample Date Media PCB (ug/kg)
12/16/99 Supernatant Sand 1 3,300
12/20/99 Supernatant Sand 2 1,600
12/20/99 Supernatant Carbon 19,000
1/11/00 Filtrate Carbon 21,000
1/13/00 Filtrate Sand 1 1,600
1/13/00 Filtrate Sand 2 1,800
5.3 DEWATERING
5.3.1 Dewatered Sediment Physical Test Results
A summary of physical test results, (43 composite samples) on the sediment dewatered inthe filter presses, are summarized below. As shown, the percent solids measured in thefield laboratory were essentially the same as measured in the analytical laboratory; theanalytical laboratory results were used to compute dry tons of sediment. The average valueof 53.1% fell below the goal of 58% established by the dewatering subcontractor. For allsamples, the dewatered sediment passed the paint filter test (i.e., contained no free liquids).The average shear strength was below the goal of 0.4 tsf. Lower shear strength resultscorrelated with lower percent solids and higher moisture content. Occasionally in theseinstances, the dewatered sediment was more difficult to manage at the landfill. Normally,the dewatered sediment could be unloaded from the trucks at the landfill and spread with awide track bulldozer.
Parameter Units Average Minimum Maximum
Field:
Total Solids % 52.7 45.7 61.1
Moisture Content % 90.2 45.2 137.5
Wet Density pcf 87.7 79.8 101.7
Dry Density pcf 47.0 33.6 86.7
Shear Strength tsf 0.36 0.18 0.56
Laboratory:
Paint Filter --- Pass Pass Pass
Total Solids % 53.1 46.7 62.3
Specific Gravity --- 2.60 2.41 2.76
Summary Report September 2001 Fox River SMU 56/575-11
The above data excludes the sediments excavated from the equalization basins duringdemobilization activities in June and July 2000. The sediments in the equalization basinswere not dewatered in filter presses, but rather solidified with lime prior to disposal at theFort James landfill. These materials were field tested for paint filter (all samples passed),but not percent solids, moisture, density, or strength. The analytical laboratory results forpercent solids of these solidified sediments ranged from 53.8% to 67.6%, and averaged61.1%.
5.3.2 Mass of Sediment Landfilled
Figure 28 shows the cumulative wet mass (weight) of dewatered sediments disposed at theFort James landfill in 1999. The total of 26,838 wet tons through December 20, 1999 isbased on a daily summation of scaled net weights reported on the waste manifest forms foreach truck. These totals include the weight of dry hydrated lime that was added tocondition the dredge slurry before filter pressing. An additional 89 wet tons of watertreatment filter media were hauled to the landfill on January 14 and 17, 2000. Duringdemobilization activities in June and July 2000, an additional 3,893 wet tons of sedimentsolidified with lime, and 972 wet tons of other Project wastes (e.g., basin clay and HDPEliner materials, water treatment carbon) were landfilled. Therefore, the total mass ofsediment and other Project wastes disposed at the landfill was 31,792 wet tons. Accordingto records maintained by Fort James, the total volume of sediments and other wastes fromthe Demonstration Project that were placed in Cell 12A of their landfill was 27,600 cy.This is based on before and after surveys, and excludes interim cover and access roadwayaggregate. The net in-place wet density of all materials disposed in the landfill thencomputes to 85 lb/cf.
Figure 29 shows the cumulative dry mass (weight) of landfilled sediments. Laboratorypercent solids results were used to compute the dry mass, which totaled 14,335 dry tonsthrough December 20, 1999. This total includes lime added during dewatering (2,598 drytons), as well as the weight of a carbon vessel replaced at the start of the Project (estimated10 dry tons) and treatment media from the supernatant water treatment system removedduring preliminary demobilization (estimated 31 dry tons) in December 1999. Whilecompleting demobilization activities in June and July 2000, 2,344 dry tons of solidifiedsediment (including 333 dry tons of lime) was landfilled, based on laboratory percent solidsdata. Therefore, the net dry weight of dredged sediment, excluding lime and other Projectwastes, that was dewatered and hauled to the landfill, was approximately 13,707 dry tons.As noted earlier, payment for dewatering was based only on dry tons of sediment,excluding lime and other Project wastes that did not go through the dewatering orsolidification processes.
Summary Report September 2001 Fox River SMU 56/575-12
5.3.3 Sediment PCB and Mercury Concentrations
Average PCB and mercury concentrations of the dewatered sediments are summarized inthe following table. The results of individual samples are plotted by date on Figures 30 and31, respectively.
Parameter Units DetectionLimit
Average Minimum Maximum Count
PCBs mg/kg 0.22-5.3 44.4 15.0 110.0 50
Mercury mg/kg 0.0031-0.025 0.92 0.42 1.60 50
The average PCB concentration of 50 samples over the course of the Project was44.4 mg/kg, under the TSCA limit of 50 mg/kg. However, 18 of the samples had results>50 mg/kg, representing approximately one-third of the total dry mass of sedimentdisposed at the Fort James landfill. Only Aroclor 1242 was detected in the dewateredsediments, which was consistent with prior core sampling and PCB testing of the in-riversediments. As expected based on results in the May 1998 Basis of Design Report (BODR),Figure 30 indicates the highest PCB concentrations were from sediments dredged in thenorthern extent of the Project area, where dredging began and ended. Figure 31 indicatesthe mercury results were also higher in the northern area.
5.3.4 PCB and Mercury Mass Removed by Dredging
PCB and mercury concentrations of the dewatered sediment samples, together with thecalculated dry mass of dewatered sediment represented by each sample, were used todetermine the mass of PCBs and mercury removed from the river by dredging. Figure 32shows that an estimated 1,326 lb of PCBs were removed during dredging in 1999, and111 lb of PCBs were calculated to be excavated from the equalization basins duringdemobilization activities in 2000. An estimated additional 1 lb of PCB was captured in thewater treatment filter media. An estimated 3 lb of PCBs were contained in other Projectwastes, for an overall total of 1,441 lb of PCBs removed by dredging.
According to the Environmental Monitoring Report (Blasland, Bouck & Lee; July 2000),an estimated 22 kg or 48 lb of PCBs were lost to the river during dredging based on watercolumn sampling (i.e., 3.3% of the total PCB mass removed by dredging). This Reportalso estimated that less than 1 lb of PCB was released to the atmosphere during the courseof the Demonstration Project. The estimated PCB mass removed by dredging or lost to theenvironment then totals 1,490 lb.
Figure 33 shows that an estimated 27.8 lb of mercury were removed from the river duringdredging in 1999, and 2.4 lb of mercury were excavated from the equalization basinsduring demobilization activities in 2000. An estimated 0.1 lb of mercury was contained inother Project wastes, for an overall total of 30.3 lb of mercury removed by dredging. Thisamount does not include the water treatment filter media, which were not tested formercury prior to disposal at the Fort James landfill.
Summary Report September 2001 Fox River SMU 56/575-13
5.4 DREDGE AREA CONDITIONS
Dredging to elevation 565 was the goal before work began. Elevation 565 was selectedduring the procurement work phase to remove sediments with expected PCBconcentrations >1 mg/kg, based on the GIS model described in the May 1998 Basis ofDesign Report (BODR). Based on actual conditions in a few locations of the subunits, thedredge penetrated the generally dark, soft organic silty sediment before reaching elevation565. In these locations, which were not uniform across the dredge area, the dredgegenerally encountered a red-brown clay stratum and/or sand lenses. As a result, the dredgewas allowed to stop dredging above the target elevation in these locations to avoid thedredging of uncontaminated materials.
In middle November 1999 when it became apparent work would have to be discontinuedsoon due to the onset of winter weather, raising of the dredge target elevation wasdiscussed in weekly construction meetings with the WDNR and FRG. After review ofpreliminary PCB results from August 1999 pre-dredge cores obtained for theenvironmental monitoring program, the FRG and WDNR agreed to raise the targetelevation to 567. Based on progress at the time, this target was in effect for approximatelythe northern one-half of Subunits 14 and 25 and all of Subunits 13 and 24 (Drawing A5).The pre-dredge cores from the center of these four subunits indicated PCB concentrationsshould be < 1 mg/kg at elevation 567 (Table 2). At the end of November based on slowerthan expected progress, it was agreed to raise the target again, to elevation 568 in Subunits12 and 23. Based on pre-dredge cores (Table 2), the PCB concentrations in the center ofSubunits 12 and 23 at Elevation 568 should have been < 3.5 mg/kg.
Drawing A10a shows the post-dredge sediment topography in the dredge area. In thesouthern two-thirds of the dredge area where the target elevation was 565, elevations varyfrom about 562 to 568. In the northern one-third of the dredge area where the target was567 to 568, the elevations vary from about 567 to 572. The northeastern limits of dredging(e.g., east half of Subunit 23) had the least amount of sediment removed.
The irregular shapes of the contour lines in all areas dredged are evidence of ridges left bythe dredge during the production dredging phase. Ridges are not uncommon afterhydraulic (or mechanical) dredging. Due to time restrictions, a clean-up pass, which wasoriginally planned for the entire area dredged, was only performed in a 30 ft by 30 ft area atthe center of Subunits 25, 26, 27, and 28. As described in Section 4.1.3.2, the purpose of aclean-up pass is to remove contaminated sediments that potentially were re-suspended andsubsequently re-settled in the dredge area, as well as potential undredged ridges betweendredge tracks. The target elevation for the clean-up pass was 6 in. below elevation 565(i.e., elevation 564.5), or shallower if the soft silty sediments were penetrated.
Drawing A11a shows dredge thickness isopach lines. These were determined bycomparing pre-dredge (Drawing A5) and post-dredge (Drawing A10) top of sedimentsurfaces. Dredge cuts were a maximum of about 10 ft in the southern limits of the workarea. As shown on this drawing, a limited amount of sediment removal and displacement
Summary Report September 2001 Fox River SMU 56/575-14
occurred outside the depicted dredge limits, on the southern end, and on the northeastcorner. Isopach contours in these areas indicate 1 to 2 ft removed and up to 1 ft displaced(i.e., filled by displacement).
Figure 34 shows the top of sediment elevations, measured when pre- and post-dredge coreswere taken, at the approximate center of the dredge area subunits. The dredge targetelevations are also displayed. The average dredge cut at these locations was 5.8 ft. For theapproximate limits of actual dredging depicted on Drawings A10 and A11, covering anarea of about 146,000 sf (3.35 acres), this dredge cut computes to 31,400 cy of sedimentremoved, which is almost identical to the amount calculated from the pre- and post-dredgesediment surveys (31,346 cy). As noted in Section 5.0, we estimated there was 38,670 cyof sediment in the actual dredge area to elevation 565.
Tables 2 and 3 summarize PCB results from the various sample intervals of the pre-dredgeand post-dredge cores, respectively. Post-dredge surface PCB concentrations weremeasured within about two weeks after dredging ended, while the silt curtain still enclosedthe Project dredge area. Pre-dredge surface PCB concentrations averaged 4 mg/kg, and thehighest measured concentration of all cores in the work area was 650 mg/kg (Subunit 14 ata depth interval of 4 to 5 ft). Figure 35 compares the PCB concentrations in surfacesamples (0 to 4-in. depth) from the pre- and post-dredge cores, in addition to the maximumPCB concentration detected at each pre-dredge core. As shown, the post-dredge surfacePCB concentrations were considerably higher than the pre-dredge surface concentrationswhere the clean-up dredge pass was not performed, except at one core location(Subunit 38). However, the post-dredge concentrations are less than the maximum PCBconcentrations measured in the pre-dredge cores. This is not unexpected, because dredgingwas incomplete in most areas (i.e., dredging did not reach target elevations).
Figure 36 focuses on the four subunits (25 through 28) where a clean-up dredge pass wasperformed in a small area prior to discontinuing work. At three of these four locations, thepost-dredge surface PCB concentrations (ranging from no detection to 2.0 mg/kg) werebelow the pre-dredge concentrations. At the fourth location (Subunit 28), the post-dredgesurface PCB concentration was 4.5 to 17 mg/kg compared to the pre-dredge concentrationof 2.7 mg/kg.
N:\Jobs\208\2057\01\wp\rpt\97_sum rpt_sec05.doc
Summary Report September 2001 Fox River SMU 56/576-1
6.0 COSTS
A summary of Project costs are shown in Table 4, from investigation and pre-design,through procurement and permitting, and construction and monitoring. A more detailedbreakout of Project costs is contained in Table B-1 of Appendix B. The basis of the costsis described in the notes at the bottom of the tables.
The total cost for this Demonstration Project was just under $12.4 million. Investigation,pre-design, procurement, and permitting cost just under $0.9 million. Construction andmonitoring costs totaled approximately $11.5 million, or $366/cy of sediment dredged.The $11.5 million includes a value of about $3.4 million calculated by Fort James for theirin-kind services on the Project, or $108/cy. In-kind services by Fort James included use ofthe Shell property at no direct project cost, and the estimated additional costs iftransportation and disposal of the dewatered sediments to an out-of-state TCSA landfill hadbeen necessary. Other in-kind services were the costs of Fort James’ employee time on theProject, technical consultants to Fort James, and Project signage.
Costs for operational monitoring and environmental monitoring (by others) wereapproximately $2.3 million of the $11.5 million, or $72/cy. Project insurance costs werejust under $0.25 million, or about $8/cy. The net costs for site preparation, dredging,dewatering, water treatment, transportation and disposal of the sediments, and constructionmanagement, were then approximately $5.6 million, or $178/cy. Potential future dredgingprojects on the Fox River would likely have lower monitoring costs than the SMU 56/57Demonstration Project, given the lessons learned from this and the other DemonstrationProject at Deposit N. However, transportation and disposal costs ($68/cy) would likely behigher than this Demonstration Project, because of the subsidies provided by Fort Jamesand the nearness of their disposal facility to the Project site.
N:\Jobs\208\2057\01\wp\rpt\97_sum rpt_sec06.doc
Summary Report September 2001 Fox River SMU 56/577-1
7.0 SUMMARY AND CONCLUSIONS
A Sediment Removal Demonstration Project was conducted at Sediment Management Unit56/57 (SMU 56/57) on the lower Fox River in Green Bay, Wisconsin. Objectives of theProject were to:
• Evaluate potential impacts to the Fox River from large-scale dredging of PCB-contaminated sediments,
• Evaluate the efficacy of large-scale dewatering and land disposal of PCB-contaminated sediments, and
• Evaluate the potential costs of large-scale dredging, dewatering, and land disposalof PCB-contaminated sediments.
The Project was conducted by the Wisconsin Department of Natural Resources (WDNR)and the Fox River Group of Companies (FRG) beginning in September 1997. The generalcontractor for the design and implementation of the Project was Montgomery Watson.Investigation and design activities were completed between September 1997 and May1998. Procurement and permitting activities were performed between June 1998 and June1999. Site improvements for the Project began in July 1999 and dredging began in lateAugust 1999. Dredging ended in December 1999. Demobilization and site restorationwere completed in July 2001.
The objectives of the SMU 56/57 Project were met despite the fact that the volume ofsediment dredged was less than anticipated. Production goals were not achieved, andbudget constraints and winter weather forced halting of the Project. Project metricsinclude:
• A total of 31,346 cy of sediment were removed from the river, at a totalconstruction cost of about $11.5 million or $366/cy. Subtracting out costs formonitoring, insurance, and the value of in-kind services, the net costs for sitepreparation, dredging, dewatering, water treatment, transportation and disposal ofthe sediment, and construction management totaled about $178/cy.
• A total of 1,441 lb of PCBs were removed from the river, at a total constructioncost of just under $8,000/lb.
• A total of 30.3 lb of mercury were removed from the river.
• The average hourly dredge rate was 60 cy/hr compared to a goal of 200 cy/hr.
• The average daily dredge rate was 294 cy/day compared to a goal of 900 cy/day.The highest average dredge rate was 473 cy/day.
Summary Report September 2001 Fox River SMU 56/577-2
• The computed average percent solids in the dredge slurry was 4.4% compared toa goal of 7.5%.
• A total of 31,792 wet tons of sediment and other Project materials (13,707 drytons of sediment only) were disposed of in Cell 12A at the Fort JamesCorporation industrial landfill in Green Bay. These materials were transported in1,489 truck loads. According to Fort James, the Demonstration Project used27,600 cy of air space in their landfill (i.e., wet bulk density of 85 lb/cf).
• The percent solids averaged 53.1% for sediments dewatered in the filter pressescompared to a goal of 58%.
• A total of 75,256,500 gal of water from the dredging and dewatering operationswere treated and discharged to the river at an estimated cost of $0.013/gal,excluding monitoring costs.
• Turbidity changes measured at the silt curtain upstream, downstream, andsidestream of the operating dredge were low, generally less than 10 to 15 NTUs.Changes in turbidity were more evident right at the dredge, but the amounts werevariable.
• Surface PCB concentrations in post-dredge samples (range of non-detectable to2.0 mg/kg) were less than pre-dredge concentrations (2.3 to 3.3 mg/kg) in three ofthe four locations where a dredge clean-up pass was performed. In the fourthlocation where a clean-up pass was performed, the post-dredge PCBconcentrations (4.5 to 17 mg/kg) were elevated compared to the measured pre-dredge concentration (2.7 mg/kg). In areas where the clean-up pass was notperformed, surface PCB concentrations were higher, as expected, because thedredging was incomplete in these areas (i.e., dredging did not reach targetelevations). Note that post-dredge surface PCB concentrations were measuredwithin about two weeks after dredging ended, while the silt curtain still enclosedthe Project dredge area.
The Sediment Removal Demonstration Project showed that mass removal of PCBs fromcontaminated sediments can be accomplished with hydraulic dredging, mechanicaldewatering, and landfilling. However, the Demonstration Project also showed thatincomplete dredging can result in higher surficial concentrations of PCBs than pre-dredging values. In addition, while the individual process units of hydraulic dredging,mechanical dewatering, and water treatment are well understood, a continuous processtrain of these three processes proved to be more complicated than anticipated, and costs forremoval were higher than expected.
7.1 DREDGING
The hydraulic dredges used for the Demonstration Project were not able to provide thetarget production of 200 cy/hr. Three different dredges were used: one with a 12-in. pump
Summary Report September 2001 Fox River SMU 56/577-3
and round cutterhead, and two dredges with a horizontal auger cutterhead (10-in. and 12-in.pump). Different combinations of on-shore booster pumps were also used. The dredgeused for most of the Project had a 12-in. pump and 9-ft wide horizontal auger cutterhead.Several factors may have limited production. A similar dredge with a larger dredge pumpand/or on-shore booster pump (i.e., more total system horsepower), or a different type ofdredge (e.g., a swinging ladder dredge), may have provided the desired production, buttime and financial constraints prevented trials with other dredge systems. The experiencelevel of different dredge operators varied over the course of the Project, which in alllikelihood also affected dredge production.
The lower dredge production impacted the process train by requiring more dredge hoursper day, which lessened the settling time available in the equalization basins. Moresignificantly, the computed percent solids pumped with the dredge averaged about 4.4%compared to the target of 7.5%. This had an impact on the rest of the process train. It hadthe cascading effect of lowering sediment removal rates, increasing the duration of theProject, increasing the volume of water to be treated, and increasing the amount of time fordewatering, as well as the amount of lime for processing of the sediments. The increasedlime usage escalated the usage of acid to buffer the increased pH of the press filtrate water.Lower percent solids in the dredge slurry meant that the amount of water being pumpedwas considerably more than anticipated. The combination of these effects had a significantimpact on the cost of treatment.
The Demonstration Project showed the importance of the of the dredge percent solids to therest of the treatment train. Factors that may have affected the percent solids includedifficulties in precise dredge positioning, the overall horsepower of the dredging system,dredge operator experience with these specific Project and river conditions, and the densityof the river sediments. In a larger-scale sediment removal project, the process train mayneed to be oversized to account for these factors. The Demonstration Project showed that itmay also be valuable to evaluate several different dredge types to see if greater percentsolids can be achieved.
Potential ramping up to even larger-scale sediment removal projects in the future utilizinghydraulic dredging and mechanical dewatering will limit the number of environmentaldredging and dewatering contractors with proven experience at these removal scales. Mostlarge dredging contractors in the United States have little or no experience withcontaminated sediment projects, working predominantly on navigational dredging projects.Navigational dredging projects typically have no environmental controls, resulting inhigher production rates and lower unit costs. Larger-scale projects may also limit theavailable temporary water treatment and dewatering equipment unless planned well inadvance, as well as on-shore land space, that are necessary to complete the work in a timelyfashion.
An important finding of the Demonstration Project was that cable anchorage of thehorizontal auger cutterhead dredge lead to difficulties with controlling the dredge positionfor multiple passes on the same cut and on adjacent cuts, leaving undredged sedimentsbehind. The necessity to make additional passes to remove ridges or to meet targetelevations resulted in inefficient passes that generated significant additional quantities of
Summary Report September 2001 Fox River SMU 56/577-4
water requiring treatment. While use of shorter cables and positioning systems mayprovide tighter control, it should be anticipated that this would be a significant problem inlarge-scale dredging in an open river environment.
The difficulties in achieving target elevations suggest another potential problem in large-scale dredging. One clean-up pass may not be sufficient to meet target parameters. Theneed for additional passes would significantly increase costs because these passes areinefficient and generate large quantities of water.
Other findings of the Demonstration Project were:
• The unit cost for the dredging component of this Demonstration Project was about$14/cy of sediment removed. This unit cost excludes additional dredging coststhat were not approved because the dredge production goals were not achieved.Records were not kept to differentiate the unit costs of production dredgingcompared to clean-up pass dredging.
• Debris was encountered during dredging, which to a degree hindered dredgingprogress. However, the amount and type of debris encountered were neitherexcessive nor unexpected for this river environment and Project location.
• The silt curtain portion of the total dredging cost for this Demonstration Projectwas about $67/lineal ft of curtain. Differences between turbidity measurementsinside and outside the silt curtain were not that significant. This naturally leadsone to question whether a silt curtain would be cost effective and necessary onfuture dredging projects. The results of water column testing from theenvironmental monitoring studies by others should be used to address thisquestion.
• The silt curtain anchorage system installed in the soft river sediments wasmarginally adequate to keep the curtain secured around the dredge area. Futuredredging projects should consider use of other types of anchors (e.g., piling,larger concrete deadmen) at spacing sufficient to secure the curtain against lateralforces from the river current, wave action, coal boat prop wash, and wind.
• A silt curtain must be inspected frequently to ensure integrity. The batteries inlights for night-time illumination require frequent maintenance.
• Slurry sampling from the dredge pipeline proved to be difficult. Differentmethods for slurry flow monitoring should be considered.
• Dredging can accommodate commercial boat traffic, but it is disruptive toproduction. This would likely affect costs on potential future projects thatinvolved commercial boat traffic.
Summary Report September 2001 Fox River SMU 56/577-5
7.2 WATER TREATMENT
The estimated water treatment costs for this Demonstration Project totaled $31/cy ofsediment removed from the river, or $0.013/gal treated. This unit cost excludes additionalwater treatment costs that were not approved because the dredge production goals were notachieved. Using the average PCB concentration of 4.8 ug/L in the treatment systeminfluent from the equalization basins, and the 75,256,500 gal of water treated, watertreatment cost about $327,000/lb of PCBs prevented from being returned back to the river.
The water treatment system was effective in meeting the PCB discharge concentration limitof 1.2 ug/L established by the Project WPDES Permit. The PCB discharge mass limit of0.0072 lb/day was also met. An important finding of an evaluation of the treatment stepswas that tertiary treatment with granular activated carbon was necessary to comply with thePCB concentration limit; primary and secondary treatment through settling and filtrationwere insufficient. Based on detection of PCBs in only one effluent sample at aconcentration well below the discharge limit, an estimated 0.028 lb of PCBs were returnedto the river in the treated water. About 3 lb of PCBs were prevented from being dischargedcompared to about 0.028 lb that were discharged, for a 99.1% removal efficiency.
The daily maximum discharge concentration limit of 1.7 ug/L for mercury was also met bythe treatment system. However, the monthly mass limit of 0.000034 lb/day was exceeded,as reported in the monthly discharge monitoring reports to the WDNR. Based on thesample concentrations and flows, an estimated 0.0076 lb of mercury were returned to theriver over the course of the Project. For potential future sediment removal projects,consideration could be given to removing the mercury mass limit from project WPDESPermits, because of the high volumes of water to be treated and the high costs alreadyassociated with tertiary water treatment. Alternatively, additional filtration maysuccessfully lower the mercury concentrations.
Several exceedances of the 10-mg/L daily maximum discharge limit for total suspendedsolids were measured in the first few weeks of the Demonstration Project. This problemwas corrected by relocating the diversion piping used during back-washing of the filter andcarbon vessels to a point upstream of the effluent sampler, which eliminated mixing withthe treated effluent samples.
BOD5 (limit of <2mg/L) could not be controlled by the treatment system used on thisProject. A biological treatment process may be required on potential future projects unlessthe BOD5 limit can be raised or eliminated. Credits may also be available from otherindustrial dischargers on the Fox River who are well under their respective BOD5 limits.
Controlling effluent pH was complicated by the addition of lime to the dredge slurry to aidin mechanical dewatering by filter pressing. The resulting pH of the press filtrate waterwas elevated, and required acid addition to buffer the pH into the WPDES Permit range of6 to 9. Initially, the press filtrate water and basin supernatant water were processedtogether through the treatment system, and these water sources varied in volume, pH, andturbidity. After the filtrate and basin supernatant water treatment systems were separated,pH and turbidity control were much simpler. Consideration should be given to separating
Summary Report September 2001 Fox River SMU 56/577-6
water sources for treatment on future projects, and/or using additives other than lime to aidin mechanical dewatering of the sediment slurry (e.g., polymers).
No dioxins (2,3,7,8-TCDD) were measured in the effluent samples at the laboratorydetection limits. All oil and grease results were below the WPDES Permit limit of 10mg/L. Ammonia nitrogen was monitored, but the WPDES Permit did not establish adischarge limit for this parameter.
Overall, the Project successfully met Permit limits without significant exceedances. Thewater treatment system was readily adjusted to quickly correct temporary exceedances.
7.3 DEWATERING
The dewatering component of this Demonstration Project cost $30/cy of sediment removedfrom the river, almost as much as the water treatment component.
Dewatered sediment with as low as 47% solids passed paint filter testing, to be classified assolid waste for disposal. However, at this percent solids the material was very wet anddifficult to manage at the landfill. Dewatering to an average 53% solids provided materialthat could suitably be managed.
About one-third of the dewatered sediments (mass) disposed at the landfill had PCBconcentrations greater than the 50 mg/kg TSCA limit. In other areas of the river wheresediments are likely to have lower PCB concentrations, most of the sediment may able tobe managed and disposed as non-TSCA material based on PCB concentrations afterdewatering. This would potentially expand the number of landfills available for sedimentdisposal, and could save on disposal costs compared to in-state or out-of-state TSCAlandfills.
Although protective provisions were made in the equipment used to pump the dredgedslurry from the equalization basins to the filter presses for dewatering, the geomembranecomponent of the basin liners was still damaged. This caused reduced production duringrepairs. On potential future sediment removal projects where mechanical dewatering willbe used, consideration should be given to different methods of solids removal fromequalization basins (if used) to protect the liner, eliminating the membrane liner andpossibly thickening the clay liner component, or replacing earthen basins with steel tanks.
The recessed chamber filter presses used for dewatering proved to be highly sensitive tolow feed slurry concentrations. For potential future hydraulic dredging and mechanicaldewatering projects, consideration should be given to using polymers instead of lime forfeed stabilization prior to dewatering in recessed chamber filter presses. Other dewateringtechnologies could also be considered, which could be less sensitive to slurryconcentrations and reduce the water treatment impacts (e.g., belt thickener before arecessed chamber filter press, belt filter press, or centrifuge).
Summary Report September 2001 Fox River SMU 56/577-7
7.4 TRANSPORTATION AND DISPOSAL
Transportation and disposal costs at an estimated $68/cy of sediment removed from theriver were the most costly component of this Demonstration Project. However,transportation and disposal costs were partially subsidized by Fort James Corporationthrough use of their landfill and other in-kind services. Based on quotes received beforeFort James’ landfill was approved, T&D costs would have been on the order of $100 to$150/cy of dewatered sediment for an out-of-state commercial TSCA landfill. The unitcost for non-TSCA disposal would very likely be less than the cost for TSCA disposal, buthow much less would be dependent on several factors, including landfill distance from theproject site, disposal volume, and market forces.
N:\Jobs\208\2057\01\wp\rpt\97_sum rpt_sec07.doc
Summary Report September 2001 Fox River SMU 56/57Page 8-1
8.0 REFERENCES
Basis of Design Report, Sediment Management Unit 56/57, Montgomery Watson, May1998.
Environmental Monitoring Report, Fox River Dredging Demonstration Projects at
Sediment Deposit N and Sediment Management Unit 56/57, Blasland, Bouck & Lee,July 2000.
Request for Bid for Site Improvements, Sediment Management Unit 56/57, MontgomeryWatson, September 1998.
Request for Bid for Dredging, Sediment Management Unit 56/67, Montgomery Watson,February 1999.
Request for Bid for Sediment Dewatering, Sediment Management Unit 56/57, MontgomeryWatson, February 1999.
Request for Bid for Water Treatment, Sediment Management Unit 56/57, MontgomeryWatson, February 1999.
Operational Monitoring Quality Assurance Project Plan, Sediment Management Unit
Supernatant and Filtrate System Combined 4---r--. Supernatant and Filtrate System Separated 60,000,000 +-------------------------+---------------------M'-'----------------1
ERD/crd/RHW II N:/jobs/208/2057/01/wplfig/Figwc 36.xls
350 330
300
250
200
150
100
50
-0
25
• MONTGOMERY WATSON
26 27
Cleanup Pass Subunits
'21 Pre-Dredge
□ Post-Dredge
C:I Post-Dredge Duplicate
ra Pre-Dredge Maximum
28
FIGURE 36 - PRE- AND POST-DREDGE SURFACE PCB
CONCENTRATIONS
AT CLEAN-UP PASS SUBUNITS
DRAWINGS
t,·
I!: Jtf Jh
8 8
GREEN BAY A.'\D VICl.~ITY
'
r1 ih NOTES
1. REFERENCE: 1997/1998 OFFICIAL STATE HIGHWAY MAP, WISCONSIN DEPARTMENT OF TRANSPORTATION.
0-lop@HW 0,own 8y CCM
5-15-98 - By • )(_,__)~•
Reference
ReYieiona
GREEN BA Y
0.-0.ing Number
YICNTYMAP 1272167 01250101 A1
BASIS OF DESIGN REPORT SEDIMENT REMOVAL
MGNl&IF C WATSON
DEMONSTRATION PROJECT • SEDlMENT MANAGEMENT UNIT 56/57 FOX RIVER, GREEN BAY, WISCONSIN
f-g ~j
II .11 .. £
&]
ii 08
t· ilJ
l!r jlf 1f,
s
4
...
4
s
s
FEET
• .. ;;..
11l H: ~ff NOTES
I. REFERENCE: RECREATIONAL CHART 14916, LAKE WINNEBAGO AND LOWER FOX RIVER, NOAA. 8th EDmON, OCTOBER 17, 1992.
~eHW -~ CCM LOCAllON MAP
5-15-98 ~=>.:l~ BASIS OF DESIGN REPORT Reference _.-.-
SEDIMENT REMOVAL
ReYi•iOn• DEMONSTRATION PROJECT SEDIMENT MANAGEMENT UNIT 56/57 FOX RIVER, GREEN BAY, WISCONSIN
•
0..0.ing Number 1272167 01250101 A2. ..... tz C
WATSON
•
Date of photography: September 29, 1999.
NOTE:
Date of photography: September 29, 1999.
NOTE
LEGEND
River monitoring location and number
iS .. ., " "> g' Q) C
a: " 0 :z .2 t, C I>
-lie ,!?. Q.
~6 ::>~ 08
BOAT SLIP
I
LJ ~~ C
i'I .2i ~ I". -.,.! E
er; ~ ! C
•f~ WATER i ~ 988A
i1l) ~ Ii 8--., 8 C
·=¥ ~!.
Revisions
?- j
8
22,
DLF
4-6-00
l:t:t:t:t l:t:t:f:t:t-~
53
PRE-DREDGE MAP
~ LEGEND
B SUSI
~Ma
SMU 56/57 FOCUS AREA SUBUNIT AND NUMBER
RIVER MONITORING LOCATION AND NUMBER
METEOROLOGICAL STATION
· SILT CURTAIN LOCATION ON OCTOBER 5, 1999
-580- PRE-DREDGE CONTOUR CONTOUR INTERVAL: 2 FT}
SILT -/ CURTAIN
/
~ I IC )(
2
~
I /4oTES
1. VERTICAL DATUM BASED ON MEAN SEA LEVEL. NGVD 1929.
2. LAND TOPOGRAPHIC BASE MAI" WAS DEVELOPED FROM AN AERIAL SURVEY PERFORMED BY AERO-METRIC INC. FOR BROWN COUNTY, WISCONSIN. DATE OF PHOTOGRAPHY: APRIL 22, 1990.
3. RIVER TOPOGRAPHIC SURVEY WAS PERFORMED BY THE CORPS OF ENGINEERS ON AUGUST 23, 1999.
4. SUBUNIT GRID WAS TAKEN FROM DRAWING A5 OF THE MAY 1996 BASIS OF DESIGN REPORT •
~ 0 150 300
SCALE IN FEET
Drawin!l_ Number
6tt~~n, A5 SEDIMENT REMOVAL DEMONSTRATION PROJECT SEDIMENT MANAGEMENT UNIT 56/57
MONTGOll ■ RY WATSON
FOX RIVER, GREEN BAY, WISCONSIN
e
.... C ., ~ "' .. "" C .C
~o
it .. ., " ·- "' ' " 0:: ~ '6 ::I!
.!! 1, C I)
-fie {!!. 0..
LEGEND
Hydraulic Dredge
Press Filtrate Storage Tank
Filter Presses
Treated Water
@ Sample location and designation
Developedri,HW Drown By LCL
Approved' \ l,)CL,J_ Dote 4-6-00
Reference "'-Revisions
Equalization Basin No. 1
Equalization Basin No. 2
Supernatant
Polymer Acid
PROCESS FLOW DIAGRAM Drowin; Number 1242 91 ORIGINAL WATER TREATMENT SYSTEM 01470101 A6
SEDIMENT REMOVAL DEMONSTRATION PROJECT MONTGOlll!RY SEDIMENT MANAGEMENT UNIT 56/57 WATSON FOX RIVER, GREEN BAY, WISCONSIN e
.... C ., ~ "' .. "" C .C
~o
it .. ., " ·- "' ' " 0:: ~ '6 ::I!
.!! 1, C I)
-fie {!!. 0..
LEGEND
Hydraulic Dredge
Press Filtrate Storage Tank
Filter Presses
Treated Water
@ Sample location and designation
Developedri,HW Drown By LCL
Approved' \ l,)CL,J_ Dote 4-6-00
Reference "'-Revisions
Equalization Basin No. 1
Polymer Acid
P8
PROCESS FLOW DIAGRAM Drowin; Number 1242 91 SUPERNATANT WA1ER TREATMENT SYSTEM 01470101 A7
SEDIMENT REMOVAL DEMONSTRATION PROJECT MONTGOlll!RY SEDIMENT MANAGEMENT UNIT 56/57 WATSON FOX RIVER, GREEN BAY, WISCONSIN e
.... C ., ~ "' .. "" C .C
~o
it .. ., " ·- "' ' " 0:: ~ '6 ::I!
.!! 1, C I)
-fie {!!. 0..
LEGEND
Hydraulic Dredge
Press Filtrate Storage Tank
Filter Presses
Treated Water
® Sample location and designation
Developedri,HW Drown By LCL
Approved' \ l,)CL,J_ Dote 4-6-00
Reference "'-Revisions
Equalization Basin No. 1
Equalization Basin No. 2
P4
PROCESS FLOW DIAGRAM Drowin; Number 1242 91 FILTRATE WATER TREATMENT SYSTEM 01470101 AS
SEDIMENT REMOVAL DEMONSTRATION PROJECT MONTGOlll!RY SEDIMENT MANAGEMENT UNIT 56/57 WATSON FOX RIVER, GREEN BAY, WISCONSIN e
.... C ., ~ "' .. "" C .C
~o
it .. ., " ·- "' ' " 0:: ~ '6 ::I!
.!! 1, C I)
-fie {!!. 0..
Developedl"°7\HW
Hydraulic Dredge
Lime
Equalization/ Press Feed
Tanks
Debris and
Dewatered Sediment
Filtrate Water to Treatment
Drown By
Equalization Basin No. 1
Equalization Basin No. 2
Settled Solids Slurry
To Off-Site Landfill
►
Scale
LCL PROCESS FLOW DIAGRAM - DEWATERING Drowin; Number 1242 91
Approved'Z_ \ l,)<.'\J_ Dote 01470101 A9 4-6-00
SEDIMENT REMOVAL DEMONSTRATION PROJECT MONTGOlll!RY Reference "'- SEDIMENT MANAGEMENT UNIT 56/57 WATSON Revisions FOX RIVER, GREEN BAY, WISCONSIN e
2. LAND TOPOGRAPHIC BASE MAP WAS DEVELOPED FROM AN AERIAL SURVEY PERFORMED BY AERO-METRIC INC. FOR BROWN COUNTY, WISCONSIN. DATE OF PHOTOGRAPHY: APRIL 22, 199D.
3. RIVER TOPOGRAPHIC SURVEY WAS PERFORMED BY SUPERIOR SPECIAL SERVICES ON DECEMBER 2D, 1999.
4. SUBUNIT GRID WAS TAKEN FROM DRAWING AS OF THE MAY 1996 BASIS OF DESIGN REPORT.
~ 0 150 300
SCALE IN FEET
Drowin!l_ Number
1242291 01410101 A10
SEDIMENT REMOVAL DEMONSTRATION PROJECT SEDIMENT MANAGEMENT UNIT 56/57
2. LAND TOPOGRAPHIC BASE MAP WAS DEVELOPED FROM AN AERIAL SURVEY PERFORMED BY AERO-METRIC INC. FOR BROWN COUNTY, WISCONSIN. DATE OF PHOTOGRAPHY: APRIL 22, 199D.
3. DREDGE THICKNESS ISOPACH LINES WERE DEVELOPED BY COMPARING PRE-DREDGE AND POST-DREDGE ELEVATIONS.
4. SUBUNIT GRID WAS TAKEN FROM DRAWING AS OF THE MAY 1996 BASIS OF DESIGN REPORT.
~ 0 150 300
SCALE IN FEET
DREDGE THICKNESS ISOPACH MAP Drowin!l_ Number
6f!~~n1 A11 SEDIMENT REMOVAL DEMONSTRATION PROJECT SEDIMENT MANAGEMENT UNIT 56/57 FOX RIVER, GREEN BAY, WISCONSIN
MONTGOll ■ RY WATSON
e
iS .. ., " "> g' Q) C
a: " "6 :z .2 t, C I>
-lie ,!?. Q.
.. -"E " .g .§ C o,
.B :l (I) ...
e .2 ~ .s:: Q..., e " u~
6
86,4 7
8 '\-9 Q
DevelopedritHW
Approved ~ , l ,.J(."\1...._ Reference --Revisions
Drown By DLF
Dote 4-6-00
41
0
..
0 0 I> I>
. ~
47
.,o <
◊
f\. """ I
~
LEGEND
B SMU 56/57 FOCUS AREA SUBUNIT AND NUMBER
- ------ - •5 - DREDGE THICKNESS ISOPACH
49
50
CONTOUR (CONTOUR INTERVAL: 1 FT)
NOTES 1. VERTICAL DATUM BASED ON MEAN SEA
LEVEL. NGVD 1929.
2. LAND TOPOGRAPHIC BASE MAP WAS DEVELOPED FROM AN AERIAL SURVEY PERFORMED BY AERO-METRIC INC. FOR BROWN COUNTY, WISCONSIN. DATE Of' PHOTOGRAPHY: APRIL 22, 1990.
3. DREDGE THICKNESS ISOPACH LINES WERE DEVELOPED BY COMPARING PRE-DREDGE AND POST-DREDGE ELEVATIONS.
4. SUBUNIT GRID WAS TAKEN FROM DRAWING A5 OF THE MAY 1996 BASIS Of' DESIGN REPORT.
~ 0 100 200
SCALE IN FEET
DREDGE THICKNESS ISOPACH MAP Drowin~ Number 1242 91 01410101 A11-a
SEDIMENT REMOVAL DEMONSTRATION PROJECT MONTGOll ■ RY SEDIMENT MANAGEMENT UNIT 56/57 WATSON FOX RIVER, GREEN BAY, WISCONSIN
e
APPENDICES
APPENDIX A
PHOTOGRAPHS
Photo No. 1:
Photo No. 2:
2082057.01470101
Spare silt curtain panel. Note orange floatation, black silt curtain skirt, and slide
connector.
Dredge slurry flow meter.
N:\Jobs\208\2057\01 \wplrpt\97 _photos.doc
,
, 2082057 01470101
Photo No. 3: IMS 5012 Versi-Dredge in river.
Photo No. 4: HorizontaJ auger cutterhead on IMS 4010 Versi-Dredge.
N:Vobs\208\205710 I \wp\rpt\97 _photos.doc
, 2082057.01470101
Photo No. 5: On-shore booster pump.
Photo No. 6: Dredge slurry pipeline across boat slip.
N:\Jobs\208\2057\0 I \wp\rpt\97 _photos.doc
, 2082057 .01470101
Photo No. 7: Water treatment - chemical adrution and flocculation/equalization.
Photo No. 8: Water treatment - filtration and granular activated carbon.
N:Vobs\208\2057\01 lwp\rpt\97 _photos.doc
Photo No. 9:
Photo No. J 0:
2082057.01470101
Small hydraulic dredge in west equalization basin. Note anchor and travel cables, and