80
1 February 2016 Final Survey Report Nutrition Indicators Results from Six Districts in South Western and East Central Uganda July 2014

1
February 2016
Final Survey Report Nutrition Indicators Results from Six Districts in South Western and East Central Uganda July 2014

About SPRING The Strengthening Partnerships, Results, and Innovations in Nutrition Globally (SPRING) project is a five-year USAID-funded cooperative agreement to strengthen global and country efforts to scale up high-impact nutrition practices and policies and improve maternal and child nutrition outcomes. The project is managed by JSI Research & Training Institute, Inc., with partners Helen Keller International, the Manoff Group, Save the Children, and the International Food Policy Research Institute.
Disclaimer This report is made possible by the generous support of the American people through the United States Agency for International Development (USAID) under the terms of the Cooperative Agreement AID-OAA-A-11-00031 (SPRING), managed by JSI Research & Training Institute, Inc. (JSI). The contents are the responsibility of JSI, and do not necessarily reflect the views of USAID or the United States Government.
Recommended Citation SPRING. 2016. Final Survey Report: Nutrition Indicator Results from Six Districts in South Western and East Central Uganda. July 2014. Arlington, VA: Strengthening Partnerships, Results, and Innovations in Nutrition Globally (SPRING) project.
SPRING JSI Research & Training Institute, Inc. 1616 Fort Myer Drive 16th Floor Arlington, VA 22209 USA Phone: 703-528-7474 Fax: 703-528-7480 Email: [email protected] Internet: www.spring-nutrition.org
Photo Credit: Begumisa Anthony, TIL Consultant

Table of Contents Acronyms ...................................................................................................................................................................... v
Highlights ................................................................................................................................................................... vii
1.0 Introduction ........................................................................................................................................................... 1
1.1 Background .................................................................................................................................................................................................. 1
1.2 Objectives of Survey ................................................................................................................................................................................. 2
2.0 Methodology .......................................................................................................................................................... 3
3.0 Results ..................................................................................................................................................................... 5
3.1 Social Demographic Characteristics of Respondents ................................................................................................................. 5
3.2 Core IYCF Indicators ................................................................................................................................................................................. 9
3.3 Optional IYCF Indicators ....................................................................................................................................................................... 19
3.4 Additional Nutrition Indicators .......................................................................................................................................................... 22
3.5 Goal-Oriented Antenatal Care Indicators ...................................................................................................................................... 24
3.6 Social and Behavior Change Communication .............................................................................................................................. 26
4.0 Challenges, Lessons Learned, and Responses to These Challenges ............................................................... 29
4.1 Challenges and Responses to These Challenges ........................................................................................................................ 29
4.2 Lessons Learned ....................................................................................................................................................................................... 30
5.0 Conclusions ........................................................................................................................................................... 31
6.0 Recommendations ............................................................................................................................................... 33
7.0 Resources/Reference Materials .......................................................................................................................... 35
Appendix 1. Progress on IYCF, ANC and Additional Indicators - 2013 and 2014 (intervention Vs control
district) ........................................................................................................................................................................ 37
Appendix 2. Nutrition SBCC Survey Results, 2013 and 2014 ............................................................................... 51


Nutrition Indicators Results from Six Districts in South Western and East Central Uganda | v
Acronyms AIDS acquired immunodeficiency syndrome
ANC antenatal care
EC east central Uganda
HIV human immunodeficiency virus
IYCF infant and young child feeding
JSI JSI Research & Training Institute, Inc.
LQAS Lot Quality Assurance Sampling
ORS oral rehydration salts
p-value probability value
PHFS Partnership for HIV-Free Survival
SA supervision area
SBCC social and behavior change communication
SPRING Strengthening Partnerships, Results and Innovations in Nutrition Globally
STAR-EC Strengthening Tuberculosis and HIV&AIDS Responses in East Central Uganda
STAR-SW Strengthening Tuberculosis and HIV&AIDS Responses in South Western Uganda
SW south western Uganda
USAID United States Agency for International Development
WASH water, sanitation, and hygiene
WHO World Health Organization

vi | Final Survey Report
Nutrition Indicators Results from Six Districts in South Western and East Central Uganda | vii
Highlights The Strengthening Partnerships, Results, and Innovations in Nutrition Globally (SPRING) project is a five-year cooperative agreement, funded by the U.S. Agency for International Development (USAID); it began in October 2011. SPRING’s overarching vision is preventing stunting and working with women and children to reduce anemia through social and behavior change communication for nutrition. This includes maternal, infant, and young child nutrition programming, with a focus on the first 1,000 days of life; and implementation research that addresses the challenges of delivering effective nutrition programming at scale.
In May and July 2014, follow-up surveys to the 2013 SPRING household baseline survey were separately conducted in each region after a period of one year among the intervention (Kisoro and Ntungamo) and control districts (Buhweju and Rubirizi) of south western (SW) Uganda, and among the intervention (Namutumba) and control (Mayuge) districts of east central (EC) Uganda. The main focus areas in both annual surveys were nutrition, HIV and AIDS, and other child health–related indicators. To guide and achieve better program implementation, data were collected using the Lot Quality Assurance Sampling (LQAS) methodology.
Overall, the assessment of 2014 performance in the SW region among intervention districts revealed improvements—some were significant—for all investigated infant and young child feeding (IYCF) indicators. Exceptions included indicators on early initiation of breastfeeding and milk feeding frequency for non-breastfed children. On the contrary, the EC region results showed significant improvements and performance on two IYCF indicators (early initiation of breastfeeding and minimum meal frequency) in Namutumba district when compared to the 2013 baseline survey findings. Similar changes were found in Mayuge, a control district.
Additionally, the 2014 SW follow-up survey results showed that intervention district performance is generally higher than that of the control districts for IYCF, antenatal care (ANC), social and behavior change communication (SBCC), and other assessed indicators. In the EC region, results demonstrate that, while almost all children had been breastfed in Namutumba (intervention district), significant increments were reported in Mayuge (control district) on the same indicator since the baseline.
Details about the survey methodology and most of the findings can be found in the main body of this report, including the 2013 SPRING household baseline survey report. Table 1 summarizes findings and progress on key indicators.

viii | Final Survey Report
Table 1. Progress on Key SPRING Indictors, 2013 and 2014
Indicators and Definitions
South Western Region East Central Region
Total (Intervention
Districts)
p-value (Year 2013 Vs 2014
except comparisons between age
groups)
Total (Control Districts)
p-value (Intervention Vs Control)
or age comparisons
Total Intervention
District (Namutumba)
p-value (Year 2013
Vs 2014 except
comparisons between
age groups)
Total Control District
(Mayuge) p-value
(Control Vs Intervention,
2014) 2013 2014 2013 2014 2013 2014 2013 2014
Early initiation of breastfeeding: % of children born in the last 24 months who were put to breast within one hour of birth
83.4 83.4 p=1.000 72.9 94.8 p< 0.001 76.3 87.8 <0.001 77.4 81.4 p=0.137
Exclusive breastfeeding under 6 months: % of infants 0–5 months who are fed exclusively with breastmilk
63.7 66.5 p>0.05 59.1 60.5 p>0.050 ◊ 54.7 ◊ 42.1 p<0.001
Continued breastfeeding at one year: % of children 12–15 months of age who are fed breastmilk
82.6Ϯ 87.9 p=0.337 87.7Ϯ 80.5Ϯ p=0.179 ◊ 86.1 ◊ 82.9 p=0.701
Introduction of solid, semi-solid, or soft foods: % of infants 6–8 months who received solid, semi-solid, or soft foods
72.7Ϯ 74.3 p=0.824 92.7Ϯ 85.3 p=0.045 ◊ 88.6 Ϯ ◊ 94.6 Ϯ p=0.272
Minimum dietary diversity: % of children 6–23 months who received foods from 4
43.3 43.4 p=0.976 53.3 22.5 p<0.001 51.0 54.7 0.491 52.3 49.0 p=0.259

Nutrition Indicators Results from Six Districts in South Western and East Central Uganda | ix
Indicators and Definitions
South Western Region East Central Region
Total (Intervention
Districts)
p-value (Year 2013 Vs 2014
except comparisons between age
groups)
Total (Control Districts)
p-value (Intervention Vs Control)
or age comparisons
Total Intervention
District (Namutumba)
p-value (Year 2013
Vs 2014 except
comparisons between
age groups)
Total Control District
(Mayuge) p-value
(Control Vs Intervention,
2014) 2013 2014 2013 2014 2013 2014 2013 2014
or more food groups
Minimum meal frequency: % of breastfed and non-breastfed children 6–23 months who received solid, semi-solid, or soft solid (but also including milk feeds for non-breastfed children) the minimum number of times or more
37.7 58.8 p<0.001 56.9 47.1
33.8 45.3 <0.05 34.1 51.6 p<0.05
Minimum acceptable diet: % of children 6–23 months who received a minimum acceptable diet (apart from breastmilk)
17.0 29.9 p<0.001 24.5 15.5 p>0.050 21.2 26.8 17.4 24.7
Consumption of iron-rich or iron fortified foods: % of children 6–23 months who receive an iron rich food, or iron fortified food that is specially designed for infants and young children, or that is fortified in the home
17.3 31.2 p<0.001 41.6 26.5 p=0.137 35.1 44.7 0.072 47.7 46.3 p=0.757

x | Final Survey Report
Indicators and Definitions
South Western Region East Central Region
Total (Intervention
Districts)
p-value (Year 2013 Vs 2014
except comparisons between age
groups)
Total (Control Districts)
p-value (Intervention Vs Control)
or age comparisons
Total Intervention
District (Namutumba)
p-value (Year 2013
Vs 2014 except
comparisons between
age groups)
Total Control District
(Mayuge) p-value
(Control Vs Intervention,
2014) 2013 2014 2013 2014 2013 2014 2013 2014
Children ever breastfed: % of children born in the last 24 months who were ever breastfed
97.9 98.1 p=0.825 96.9 98.1 p=0.946 95.8 97.1 0.429 85.0 97.2 p=0.965
% of biological mothers of children 6–23 months who reported that their children consumed any food to which they added a powder or sprinkles within the last 24 hours prior to the survey
2.7 4.9 p=0.149 1.5 0.8 p<0.001 6.0 11.1 0.277 0.8 1.1 p<0.001
% of pregnant women attending ANC at least 4 times during the last pregnancy
49.5 56.0 FE=0.013 63.5 67.4 p<0.001 54.7 56.1 0.085 55.3 59.7 p=0.139
% of deliveries that took place in a health facility
71.7 83.5 p<0.001 68 74.5 p<0.001 74.7 78.25 0.374 81.6 81.05 p=0.405
% of women who reported having taken any drug for intestinal worms during their last pregnancy
59.8 71.7 p<0.001 64.2 57.0 p<0.001 48.6 53.2 0.321 66.7 68.5 p=0.001
% of households that consumed fortified maize
19.2 4.1 p<0.001 5.0 7.3 p<0.001 2.6 3.2 0.794 30.5 15.1 p<0.001

Nutrition Indicators Results from Six Districts in South Western and East Central Uganda | xi
Indicators and Definitions
South Western Region East Central Region
Total (Intervention
Districts)
p-value (Year 2013 Vs 2014
except comparisons between age
groups)
Total (Control Districts)
p-value (Intervention Vs Control)
or age comparisons
Total Intervention
District (Namutumba)
p-value (Year 2013
Vs 2014 except
comparisons between
age groups)
Total Control District
(Mayuge) p-value
(Control Vs Intervention,
2014) 2013 2014 2013 2014 2013 2014 2013 2014
flour during the last 7 days prior to the survey
% of households that consumed fortified salt during the last 7 days prior to the survey
69.5 53.8 p<0.001 72.7 65.5 p<0.001 73.7 64.2 <0.001 67.9 51.2 p<0.001
† Results derived from a sample below the recommended sample size but can be used as a proxy.
◊ Sample size is too low for results to be disaggregated or analyzed.
FE Fisher's exact test.
p Probability value.
Comparison between age groups total within the year 2014.

xii | Final Survey Report

Nutrition Indicators Results from Six Districts in South Western and East Central Uganda | 1
1.0 Introduction 1.1 Background The Strengthening Partnerships, Results, and Innovations in Nutrition Globally (SPRING) project is a five-year cooperative agreement. Funded by the U.S. Agency for International Development (USAID), it began in October 2011. SPRING’s overarching vision is preventing stunting and working with women and children to reduce anemia through social and behavior change communication for nutrition. This includes maternal, infant, and young child nutrition programming, with a focus on the first 1,000 days of life; and implementation research that addresses the challenges of delivering effective nutrition programming at scale.
SPRING began work in Kisoro, Ntungamo, and Namutumba districts in 2012. The project used USAID’s funds to integrate treatment and prevention–nutrition services in selected health facilities, and to support the development and implementation of a comprehensive package of high-impact nutrition services through capacity and systems strengthening at the facility, community, and district levels. The interventions have been developed to impact stunting, anemia, and severe acute malnutrition; they also include—
• increased demand for nutrition prevention and treatment services
• increased availability of nutrition services at the facility and community levels
• increased access and coverage of targeted nutrition interventions for vulnerable groups
• improved quality of nutrition services at the facility and community levels
• advocacy at the national level to improve the social and policy environment for nutrition programs.
The project impact pathways are shown in figure 1.
Figure 1. SPRING Project Impact Pathways

2 | Final Survey Report
In late 2012, SPRING entered into an agreement with the Partnership for HIV-Free Survival (PHFS) to implement their intervention in SPRING’s existing districts—Ntungamo and Kisoro—in south western (SW) Uganda, as well as in Namutumba in the east central (EC) Uganda region. The PHFS intervention is in addition to SPRING’s original interventions, with the goal of reducing mother-to-child transmission of HIV from 15 percent to 3 percent by 2015. This will be done by integrating nutrition services—such as assessment, counseling, and support—into ongoing antenatal and postnatal interventions. Activities include capacity building of service providers in nutrition assessment, counseling, and support; improving quality, creating demand for services through community mobilization, strengthening the health service delivery system, and strengthening monitoring and evaluation for nutrition services within the HIV and AIDS services.
Prior to adding PHFS interventions to SPRING’s mandate, SPRING had designed an analysis plan and survey protocol to measure the effects of SPRING’s interventions—the surveys were fielded in early 2013. Given this new partnership—and knowing that many other partners are working on similar goals in SPRING districts—the project explored alternative analysis and data collection options to reduce the redundancy of surveys in these districts, and to strengthen the project’s ability to collectively show change in these districts, without attribution to one single project.
During the 2013 survey, SPRING successfully used the Lot Quality Assurance Sampling (LQAS) methodology to establish the performance of program-level indicators for baseline purposes, within different districts.
1.2 Objectives of Survey The objectives were to collect and analyze nutrition survey data in two districts of EC Uganda, as well as four districts of SW Uganda, using LQAS techniques.
This 2014 survey activity was conducted to allow SPRING to collect ongoing monitoring information that could be used in program planning, as well as for program evaluation at the end of the project’s lifetime. SPRING/Uganda’s primary goals include reducing stunting levels in children aged 0–23 months, and reducing anemia in children 0–23 months and in women of childbearing age. In addition, SPRING/Uganda focuses on using social and behavior change communication (SBCC) as a tool to improve nutrition outcomes.
Given these goals, the implementation team highlighted a number of key indicators to track the program’s effectiveness. These key indicators were collected in the May 2013 baseline survey; they included nutrition practices, access to quality nutritious foods, and use of health and community services to improve nutrition. The 2014 survey conducted household data collection on these same key indicators. Through this data collection activity, SPRING/Uganda was able to track variables related to knowledge of infant and young child feeding (IYCF) practices, exposure to SBCC messaging around these topics, as well as additional indicators related to goal-oriented antenatal care (ANC). To compare information, the same control districts that were used in the 2013 baseline survey were included, in the following rounds of data collection.

Nutrition Indicators Results from Six Districts in South Western and East Central Uganda | 3
2.0 Methodology LQAS is a lower cost, less time consuming sampling method that can be adapted to the service sector by using supervision areas (SAs) instead of production lots to identify poorly performing areas that do not reach an established benchmark. It can also provide an accurate measure of coverage or service system quality at a more aggregate level (e.g., program area). For more details on the LQAS survey methodology; questionnaire preparation; training/re-training of research assistants; village and household sampling; ethical considerations; data sources and analysis; and how all the aforementioned were used during the 2014 SPRING household survey, please refer to section 2.0 of the 2013 SPRING baseline survey report.1
However, several notable changes are noted in the 2014 survey. Instead of three survey target groups/questionnaires that were part of the 2013 survey, the 2014 survey divided the youngest child group into two separate samples, for a total of four target groups/questionnaires: (1) biological mothers with children 0–5 months of age; (2) biological mothers with children 6–11 months of age,2 (3) biological mothers with children 12–23 years of age,3 and (4) men aged 15–54 years.4 The introduction of the 0–5 and 6–11 months target age group—as opposed to the original 0–11 month—was to increase the sample size required to report on nutrition and feeding indicators, relevant to the smaller subgroups of children. As a result of this sampling method, results have been weighted to properly account for the over-representation of young children for the nutrition and feeding indicators.
Survey methodology and data collection training for both region districts was conducted prior to and soon after data collection; field teams were sent to collect data in all six survey districts. Each of the six survey districts in 2014 were divided along the same 2013 baseline survey SA boundaries. However, for some districts (i.e., Kisoro and Ntungamo), most of the data were collected along six SAs each, instead of the original five baseline survey SAs. To promote consistence and follow up on the performance and progress of SAs, all analysis to the 2014 survey was conditioned along the 2013 SA boundaries. Table 2 summarizes information on the original baseline and the 2014 SAs, which have been used for analysis and reporting of the 2014 follow-up findings.
1 Alexis D’Agostino, Anthony Begumisa, Robert Wamala, Fred Werikhe, Amanda Pomeroy, and Denis Businge. 2014. “Survey Report Results on Nutrition Indicators from Six Districts in Southwest and East Central Uganda.” Arlington, VA: USAID/Strengthening Partnerships, Results, and Innovations in Nutrition Globally (SPRING) Project. 2 The biological mothers 0–5 and 6–11 months old questionnaires included the following modules: the World Health Organization 2010 “indicators for assessing infant and young child feeding practices –part 2 measurement;” a behavioral change communication module on nutrition; maternal, and child health; malaria management; HIV and AIDS knowledge, practices, and perceptions module, as well as one on water and sanitation. 3 The biological mothers 12–23 months old questionnaire included all the 0–11 months target group modules, plus the immunization module. 4 The men 15–54 years questionnaire included the following modules: a behavioral change communication module on nutrition HIV and AIDS knowledge, practices, and perceptions module; water and sanitation, as well as the care and support module.

4 | Final Survey Report
Table 2. District Supervision Areas (for analysis and consistence in comparison of the 2013 and 2014 results)
Region Districts Type of District Supervision Areas (counties or sub-counties)
South western
Buhweju Control 1.Bihanga, 2. Burere, 3. Karungu, and 4. Rwengwe sub-counties
Kisoro Intervention
1. Busanza, Nyarubuye, Nyabwishenya (Kisoro A); 2.Bukimbiri, Nyundo, Kirundo (Kisoro B);3. Muramba, Nyarusiza (Kisoro C); 4. Chahi, Kisoro TC, Nyakinama (Kisoro D); and 5. Kanaba, Murora, Nyakabande (Kisoro E). All listed are sub-counties.
Ntungamo Intervention 1.Rushenyi county; 2.Ruhaama and Rwekinihiro sub-counties; 3. Nyakyera and Rukoni sub-counties; 4. Itojo, Ntungamo, and Ntungamo TC sub-counties; and 5. Kajara county.
Rubirizi Control 1.Katerera, 2.Katunguru, 3.Kichwamba, and 4. Ryeru (all sub-counties).
East central
Mayuge Control
1.Baitambogwe, Wairasa, Imanyiro (Bunya A); 2.Bukatube, Mayuge TC, Mpungwe (Bunya B); 3.Buwaaya, Bukabooli, Kigandalo (Bunya C); 4.Kityerera, Busakira (Bunya D); and 5.Malongo, Malongo Islands (Bunya E). All listed are sub-counties.
Namutumba Intervention 1. Bulange; 2. Ivukula; 3.Kibaale and Nsinze; and 4.Magada and 5.Namutumba (all sub-counties).
Nutrition Indicators Results from Six Districts in South Western and East Central Uganda | 5
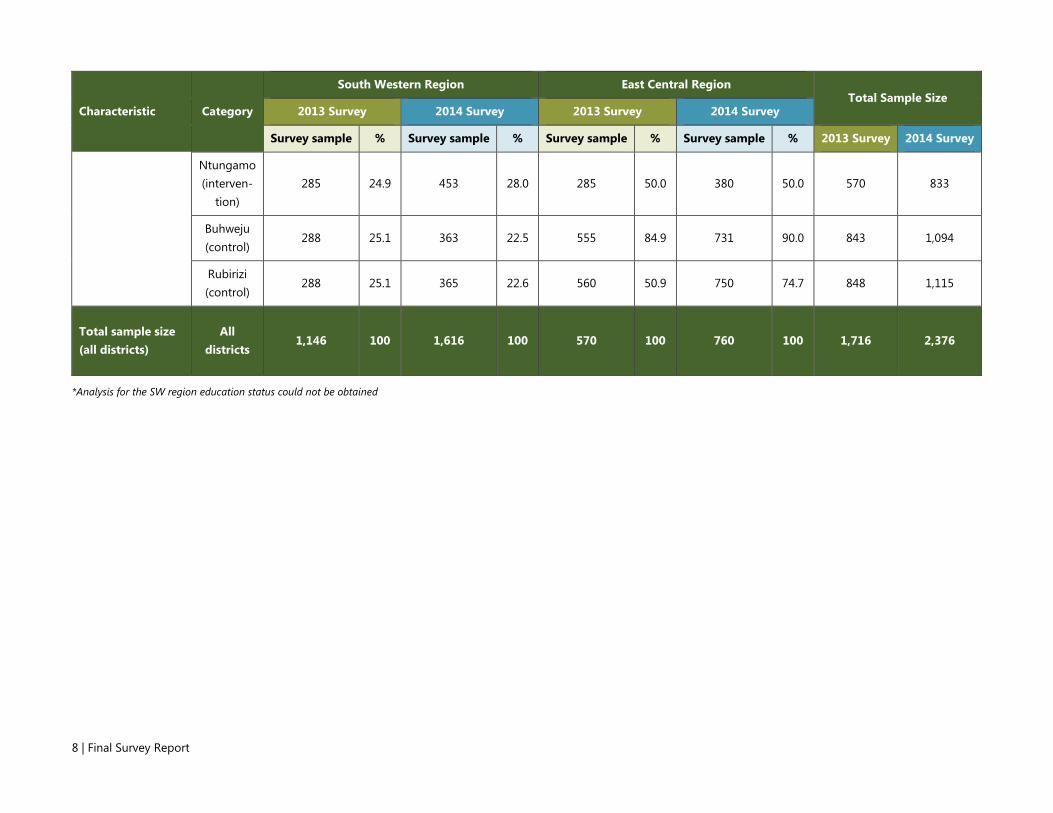
3.0 Results 3.1 Social Demographic Characteristics of Respondents Overall, four districts from SW and two districts from EC Uganda took part in this survey. More details on the list of supervision areas/sub-counties involved in this survey, by district, can be found in table 2. Primarily, when compared to the 2013 baseline survey samples, more biological mothers of children were interviewed because the 0–11 months target group was divided into two groups: 0–5 and 6–11 months target groups. Additionally, most performance for the socio-demographic indicators remains the same for most indicators. Table 3 shows more details on the type of respondents interviewed in this survey; and their different social demographic characteristics, including gender and specific age groups of children 0–23 months old.

6 | Final Survey Report
Table 3. Demographic Characteristics of Survey Population, a Comparison between the 2013 and 2014 Surveys
Characteristic Category
South Western Region East Central Region Total Sample Size
2013 Survey 2014 Survey 2013 Survey 2014 Survey
Survey sample % Survey sample % Survey sample % Survey sample % 2013 Survey 2014 Survey
Sex of respondents Male 381 33.3 401 24.8 190 33.3 190 25.0 571 591
Female 765 66.7 –1,215 75.2 380 66.7 570 75.0 1,145 1,785
Adult's age group (years)
15-24 352 30.7 548 33.9 159 27.9 285 37.5 511 833
25-34 478 41.7 703 43.5 257 45.1 316 41.6 735 1,019
35-44 233 20.3 289 17.9 119 20.9 107 14.1 352 396
45-54 83 7.2 76 4.7 35 6.1 52 6.8 118 128
Children's sex Male 353 46.2 1,012 62.6 192 50.5 281 49.3 545 1,293
Female 411 53.8 604 37.4 188 49.5 289 50.7 599 893
Children's age group (months), based on IYCF recommended disaggregation for children under 2 years
.0–5 201 26.3 389 32.0 97 25.5 190 33.3 298 579
6–8 96 12.6 222 18.3 47 12.4 100 17.5 143 322
9–11 85 11.1 191 15.7 46 12.1 90 15.8 131 281
12–15 134 17.5 176 14.5 85 22.4 77 13.5 219 253
16–19 131 17.2 136 11.2 73 19.2 87 15.3 204 223
20–23 117 15.3 101 8.3 32 8.4 26 4.6 149 127
No school education
* * * * 35 6.2 63 8.3 35 63
Primary 1–4
* * * * 94 16.5 100 13.2 94 100
Primary 5–7
* * * * 271 47.5 375 49.3 271 375

Nutrition Indicators Results from Six Districts in South Western and East Central Uganda | 7
Characteristic Category
South Western Region East Central Region Total Sample Size
2013 Survey 2014 Survey 2013 Survey 2014 Survey
Survey sample % Survey sample % Survey sample % Survey sample % 2013 Survey 2014 Survey
Education status (highest level of school attained)
Secondary * * * * 139 24.4 193 25.4 139 193
Tertiary * * * * 24 4.2 15 2.0 24 15
Missing responses
* * * * 7 1.2 14 1.8 7 14
Marital status
Single, no partner
54 4.7 41 2.5 15 2.6 37 4.9 69 78
Single, regular partner
20 1.7 34 2.1 20 3.5 15 2.0 40 49
Single, non-
regular partner
9 0.8 28 1.7 8 1.4 7 0.9 17 35
Married/ cohabiting
1,033 90.1 1,457 90.2 505 88.6 672 88.4 1,538 2,129
Divorced/ separated
19 1.7 39 2.4 13 2.3 17 2.2 32 56
widowed 9 0.8 16 1.0 4 0.7 4 0.5 13 20
Others/ missing
responses 2 0.2 1 0.1 5 0.9 8 1.1 7 9
District of residence Kisoro
(interven-tion)
285 24.9 435 26.9 285 50.0 380 50.0 570 815
8 | Final Survey Report
Characteristic Category
South Western Region East Central Region Total Sample Size
2013 Survey 2014 Survey 2013 Survey 2014 Survey
Survey sample % Survey sample % Survey sample % Survey sample % 2013 Survey 2014 Survey
Ntungamo (interven-
tion) 285 24.9 453 28.0 285 50.0 380 50.0 570 833
Buhweju (control)
288 25.1 363 22.5 555 84.9 731 90.0 843 1,094
Rubirizi (control)
288 25.1 365 22.6 560 50.9 750 74.7 848 1,115
Total sample size (all districts)
All districts
1,146 100 1,616 100 570 100 760 100 1,716 2,376
*Analysis for the SW region education status could not be obtained
Nutrition Indicators Results from Six Districts in South Western and East Central Uganda | 9
3.2 Core IYCF Indicators 3.2.1 Early Initiation of Breastfeeding
Early initiation of breastfeeding refers to feeding breastmilk to newly born children within one hour of birth. This practice ensures that babies receive colostrum from their mother. Breastfeeding has many health benefits for both the mother and infant. To reduce infant mortality and ill health, the World Health Organization (WHO) recommends that all mothers breastfeed their infants within one hour of birth, continue breastfeeding exclusively for the first six months, and start complementing breastmilk with other foods beginning at six months to at least 24 months. In many parts of the world, the rates of early initiation of breastfeeding are extremely low. Therefore, as part of this study biological mothers of children less than 24 months were asked about the time when they first breastfed their children after birth.
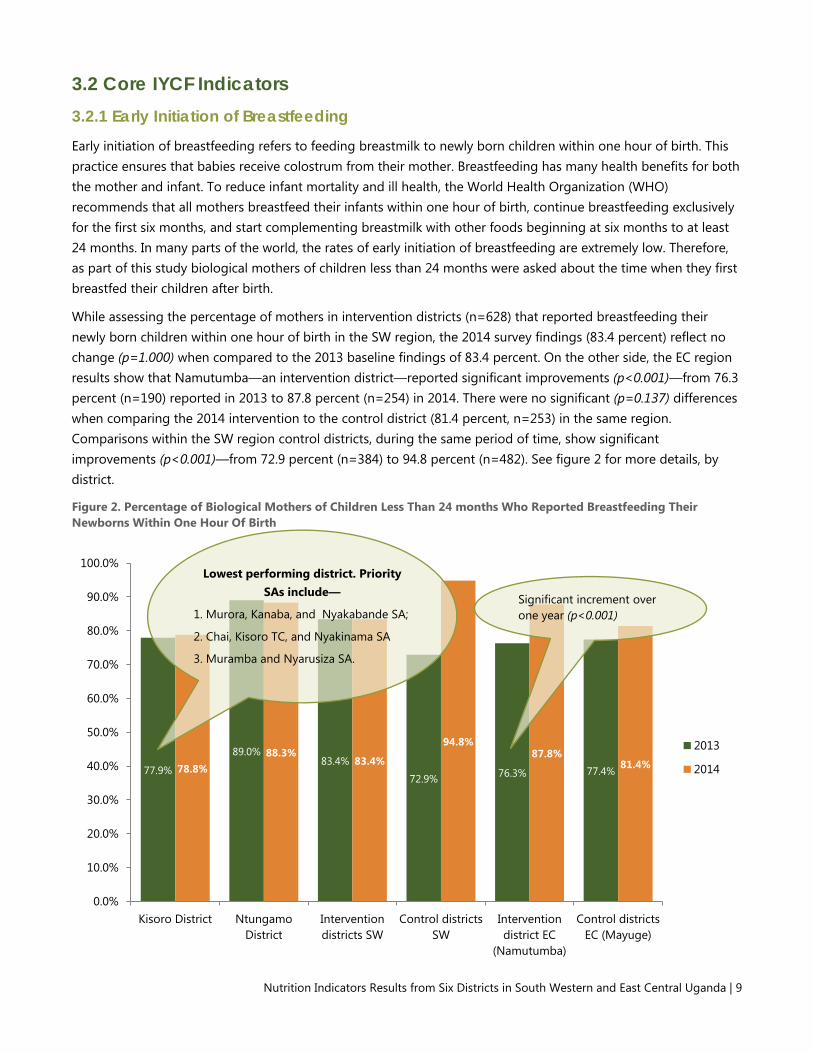
While assessing the percentage of mothers in intervention districts (n=628) that reported breastfeeding their newly born children within one hour of birth in the SW region, the 2014 survey findings (83.4 percent) reflect no change (p=1.000) when compared to the 2013 baseline findings of 83.4 percent. On the other side, the EC region results show that Namutumba—an intervention district—reported significant improvements (p<0.001)—from 76.3 percent (n=190) reported in 2013 to 87.8 percent (n=254) in 2014. There were no significant (p=0.137) differences when comparing the 2014 intervention to the control district (81.4 percent, n=253) in the same region. Comparisons within the SW region control districts, during the same period of time, show significant improvements (p<0.001)—from 72.9 percent (n=384) to 94.8 percent (n=482). See figure 2 for more details, by district.
Figure 2. Percentage of Biological Mothers of Children Less Than 24 months Who Reported Breastfeeding Their Newborns Within One Hour Of Birth
77.9%
89.0% 83.4%
72.9% 76.3% 77.4% 78.8% 88.3%
83.4%
94.8% 87.8%
81.4%
0.0%
10.0%
20.0%
30.0%
40.0%
50.0%
60.0%
70.0%
80.0%
90.0%
100.0%
Kisoro District NtungamoDistrict
Interventiondistricts SW
Control districtsSW
Interventiondistrict EC
(Namutumba)
Control districtsEC (Mayuge)
2013
2014
Significant increment over one year (p<0.001)
Lowest performing district. Priority SAs include—
1. Murora, Kanaba, and Nyakabande SA;
2. Chai, Kisoro TC, and Nyakinama SA
3. Muramba and Nyarusiza SA.

10 | Final Survey Report
Within the SW intervention districts, a significantly higher performance (p<0.001) was reported from Ntungamo district (88.3 percent, n=308), compared to 78.8 percent (n=320) from Kisoro district—whose priority SAs include Murora, Kanaba, and Nyakabande SA; Chahi, Kisoro TC, and Nyakinama SA, as well as Muramba and Nyarusiza SA. Ntungamo district does not stand out as a priority, since all SAs performed above 80 percent.
In the EC region, among SAs within Namutumba district, Bulange and Namutumba sub-county SAs were performing below the district average coverage; therefore, they need to be prioritized for interventions. At the same time, the 2014 survey results show significant differences (p=0.024) between the 0–11 months age group (90.1 percent, n=161), when compared to 83.9 percent (n=93) from the 12–23 months age group.
3.2.2 Exclusive Breastfeeding Under Six Months
For the first six months of life, an infant should receive only breastmilk, without any other liquid or solid foods; even water is unacceptable. However, drops or syrups of vitamins, mineral supplements, or medicines are allowed. The 2014 survey investigated this practice among biological mothers of children 0–5 months old. They found that 66.5 percent (n=227) had exclusively breastfed their children the previous day in the intervention districts, when compared to 60.5 percent (n=162) in control districts (p>0.050) in the SW region. Furthermore, there was no significant increment (p>0.050) when compared to the 2013 baseline findings of 63.7 percent in the intervention districts.
In the EC region, the survey showed findings at 54.7 percent (n=95) in Namutumba district; this was higher compared to 42.1 percent (n=95) in Mayuge (control district). See figure 3 for additional details. It should be noted, however, that the differences in annual performance could not prevail because the sample size for the 0–5 months age group used to collect data in 2013 was too small; that is why results at the district level are not available in the baseline year.
Figure 3. Percentage of Infants 0–5 Months Who Were Exclusively Breastfed the Previous Day
*The 2013 district-specific baseline totals could not be presented because the sample size was too small.
63.7% 59.1% 55.3%
77.9% 66.5%
60.5% 54.7%
42.1%
0
0.1
0.2
0.3
0.4
0.5
0.6
0.7
0.8
0.9
1
Kisoro Ntungamo Interventiondistricts SW
Control districtsSW
InterventionDistrict EC
(Namutumba)
Control DistrictEC (Mayuge)
2013
2014
EC region: Higher performance in the
intervention district when compared to control
(p<0.05)

Nutrition Indicators Results from Six Districts in South Western and East Central Uganda | 11
3.2.3 Continued Breastfeeding at One Year
From six months on, all babies need complementary foods, because breastmilk can no longer meet the increasing caloric and other nutritional needs of the child. However, breastmilk is an important source of energy with high-quality nutrients; therefore, it is expected that the mother will continue until the child is two years old. According to available research, breastmilk can provide about 75 percent of vitamin A that a child needs, if the mother is not deficient in vitamin A. As part of the investigations for this survey, biological mothers of children were asked about continued breastfeeding at one year.
Overall, the SW region results showed that there were no significant differences (p=0.179) between intervention (87.9 percent, n=99) and control (80.5 percent, n=77) districts when assessing the percentage of children 12–15 months of age that were reported to have been breastfed the day prior to the survey. Performance from Kisoro district (93.8 percent) was reported to be higher than any other of the assessed districts. In the EC region, findings were registered at 86.1 percent and 82.9 percent in Namutumba and Mayuge districts, respectively; however, this difference was not significant. It should be noted that results on this particular indicator can only be used as a proxy. The sample size for the 12–15 months age group was smaller than the LQAS recommended minimum of 19 respondents per supervision area. Therefore, further disaggregation at the SA level was impossible.
Figure 4. Percentage of Children 12–15 Months Whose Mothers Reported Feeding Them Breastmilk the Day Prior to This Survey in 2014
Note: Results are a proxy and involve a low sample size (district specific baseline results not reported because sample size was extremely low).
3.2.4 Introducing Solid, Semi-Solid, or Soft Foods
At six months of age, a child is expected to start receiving solid (or semi-solid) food, in addition to breastmilk or a breastmilk substitute. In the SW region, significant differences (p=0.045) were found among control (85.3 percent, n=109) and intervention (74.3 percent, n=113) districts when the percentage of infants 6–8 months of age were assessed as to whether they received solid, semi-solid, or soft foods one day prior to this survey. For intervention districts, performance from Kisoro (80.4 percent) was higher when compared to results from Ntungamo at 70.2 percent.
83%
88%
94%
82%
88%
81%
86.1% 82.9%
0.7
0.75
0.8
0.85
0.9
0.95
Kisoro Ntungamo Interventiondistricts SW
Control districtsSW
Interventiondistrict EC
(Namutumba)
Control districtsEC (Mayuge)
2013
2014

12 | Final Survey Report
Though not significant (p=0.272), Mayuge (control district) has a better performance at 94.6 percent when compared to 88.6 percent in Namutumba (intervention district) in the EC region. SA results for this indicator could not be obtained because the sample size for the 6–8 years age group was too small.
3.2.5 Minimum Dietary Diversity
As part of investigations among children who receive a minimum dietary diversity—the percentage of 6–23 months children who received foods from four or more food groups—there were high and significant findings (p<0.001) among intervention districts (43.4 percent, n=452) when compared to control districts (22.5 percent, n=374) in the SW region. However, when assessing performance within intervention districts in the same region, there were no significant changes (p=0.976) between the baseline (43.3 percent) and the 2014 survey results (43.4 percent). Interestingly, among control districts, baseline (53.3 percent) and the 2014 follow-on results (22.5 percent) show a significant drop in coverage (p<0.001). Analysis on age groups within intervention districts shows that most (57.0 percent) children 18–23 months, when compared to 38.9 percent (12–17 months) and 40.4 percent (6–11 months) age groups, were reported as having received four or more food groups.
In the EC region, there was a slight increment (though not significant, p=0.491) in Namutumba district—from 51.0 percent (n=151) reported in 2013 to 54.7 percent (n=190) in 2014. Additionally, differences between the intervention and control (49.0 percent, n=190) district show no significant outcomes (p=0.259). Among age groups within Namutumba district, most (75.8 percent) children 18–23 months, when compared to 51.6 percent (12–17 months) and 49.5 percent (6–11 months), reported receiving four or more food groups. Tables 4a and 4b provide more details, by region.
Among priority intervention supervision areas identified in the EC region were Bulange and Magada; their performance was below the overall Namutumba district average of 55 percent. In the SW region, priority supervision areas include Muramba and Nyarusiza SA; Chahi, Kisoro TC, and Nyakinama SA; as well as Murora, Kanaba, and Nyakabande SA in Kisoro district. Others include Ruhama and Rwekinihiro SA; Kajara County SA; and Rushenyi county in Ntungamo district.

Nutrition Indicators Results from Six Districts in South Western and East Central Uganda | 13
Table 4a. South Western Region—Percentage of Children 6–23 Months Whose Mothers Reported Providing Four or More Food Groups the Day Prior to Survey
Indicator Disaggregation
Intervention Districts by Year of Survey p-value (Year 2013 Vs
2014 except comparisons between age groups)
Total (control districts)
Total South West Districts
p-value (intervention vs control) or age comparisons
Kisoro Ntungamo Total
2013 2014 2013 2014 2013 2014 2013 2014 2013 2014
6–11 months ◊ ◊ ◊ ◊ ◊ 40.4
p=0.012
◊ 22.2 36.5 32.2
p=0.041 12–17 months ◊ ◊ ◊ ◊ ◊ 38.9 ◊ 21.0 52.9 30.9
18–23 months ◊ ◊ ◊ ◊ ◊ 57.0 Ϯ ◊ 25.0Ϯ 54.5 41.8
Total 43.2 43.8 43.3 42.9 43.3 43.4 p=0.976 53.3 22.5 48.1 33.9◊ p<0.001
Table 4b. East Central Region—Percentage of Children 6–23 months Whose Mothers Reported Providing Four or More Food Groups the Day Prior to Survey
Disaggregation
Intervention District: Namutumba Control District: Mayuge Total East Central Districts
p-value year of survey and p-value
2013 2014 p-value 2013 2014 2013 2014
total 51 54.7 0.491 52.3 49.0 51.6 51.8 0.259 (intervention vs control)
6–11 months ◊ 49.5
◊ 41.1 41.9 Ϯ 45.3 0.03 (difference between age groups for both East Central districts)
12–17 months ◊ 51.6 Ϯ
◊ 70.4 54.8 60.3
18–23 months ◊ 75.8 Ϯ
◊ 39.0 59.4 Ϯ 55.4 Ϯ
Ϯ Sample size low but results can be used as a proxy.
◊ Sample size too low for results to be disaggregated.

14 | Final Survey Report
For the second year in a row, in both region intervention districts, most biological mothers of children age 6–23 months reported that the children had received WHO recommended food group 3 (SW: 25.4 percent, n=374 and EC: 22.1 percent, n=190) and food group 4 (SW: 17.0 percent, n= 374 and EC: 30.5 percent, n=190) the day prior to the survey. Food groups 7 and 6 were consumed the least—only 3.1 percent and 7.5 percent, respectively—in the SW region; while, in the EC region food groups 7 and 1 were reportedly consumed the least, at 0.5 percent and 5.8 percent, respectively. Figures 5a and 5b illustrate the most common WHO recommended food group types, by intervention districts and year, in both regions.
Figure 5a. South Western Region—Most Common WHO Recommended Food Group Types Consumed by Children 6–23 Months the Day Prior to the Survey (annual progress comparisons)
Figure 5b. East Central Region—Commonest WHO Recommended Food Group Types Consumed by Children 6–23 Months the Day Prior to the Survey (annual progress comparisons)
Source: SPRING Household Baseline Survey, 2013 Source: SPRING Household Baseline Survey, 2014
4%
18%
29% 26%
12%
5%
1% 5%
SW Intervention Districts, 2013
9%
14%
25%
17%
16%
8%
3%
8%
SW Intervention District Results, 2014
food group 1
food group 2
food group 3
food group 4
food group 5
food group 6
food group 7
didn't take anyrecommended food
4%
11%
31%
23%
14%
10%
4% 3%
Namutumba district, 2013
6%
14%
22%
30%
16%
8% 1% 3%
Namutumba district results, 2014
food group 1
food group 2
food group 3
food group 4
food group 5
food group 6
food group 7
didn't take anyrecommended food

Nutrition Indicators Results from Six Districts in South Western and East Central Uganda | 15
WHO Recommended Food Group Classification
Food Group 1 (Thin porridge & porridge, bread, chapati, posho, rice, bushera tea, or other foods made from grains) & (White/Irish potatoes, white yams, manioc, cassava, or any other foods made from roots)
Food Group 2 Any foods made from beans, peas, lentils, nuts, or seeds
Food Group 3 (Milk, such as tinned, powdered, or fresh animal milk) & (Infant formula such as NAN, LACTOGEN, SMA GOLD, COW&GET) & (Yogurt or bongo) & (Cheese, yogurt, or other milk products)
Food Group 4 (Liver, kidney, heart, or other organ meats) & (Any meat, such as beef, pork, lamb, goat, chicken, or duck ) & (Fresh or dried fish, shellfish, or seafood)
Food Group 5 Eggs
Food Group 6 (Pumpkin, carrots, squash, or sweet potatoes that are yellow or orange inside) & (Any dark green leafy vegetables ) & (Ripe mangoes or ripe papayas)
Food Group 7 Any other fruits or vegetables
3.2.6 Minimum Meal Frequency
According to WHO, minimum meal frequency is defined as the percentage of breastfed and non-breastfed children, 6–23 months of age, who receive solid, semi-solid, soft foods, or milk feeds the minimum number of times or more. Minimum meal frequency includes—
• 2 times for breastfed infants 6–8 months
• 3 times for breastfed children 9–23 months
• 4 times for non-breastfed children 6–23 months.
In the SW region, in 2014, significant increments (p<0.001) were reported from intervention districts as percentages were reported to increase from 37.7 percent (n=289) at baseline to 58.8 percent (n=452). While the control district percentages (56.9 percent, n=274) were significantly higher (p<0.001) than those from intervention districts at baseline, the 2014 results show a significant reverse (p<0.001) and decrease to 47.1 percent (n=374) among the control districts. Of all the assessed districts, Kisoro district (61.5 percent, n=226) reported the highest percentage among breastfed and non-breastfed children, aged 6–23 months of age; they received solid, semi-solid, or soft foods—also including milk feeds for non-breastfed children—the minimum number of times or more. Priority SAs include Kajara county SA, as well as Ruhama and Rwekinihiro SA in Ntungamo district; while in Kisoro district, they include Muramba and Nyarusiza SA, as well as Murora, Kanaba, and Nyakabande SA. Figure 6 details findings by district, and control and intervention districts.
In the EC region, results from Mayuge (the control district) were reported at 51.6 percent (n=190) and Namutumba (intervention district) at 45.3 percent (n=190). Most of the biological mothers reported that 54.5 percent of children 18–23 months old compared to 44.2 percent and 41.9 percent from the 6–11 and 12–17 months old age groups, respectively, had fulfilled this indicator’s requirements. Comparisons between years show

16 | Final Survey Report
an increment from 33.8 percent reported in 2013 to 45.3 percent reported in 2014. Among SAs, Bulange and Magada sub-counties were performing below the district average performance benchmark of 45.3 percent.
The 2014 results on disaggregation by age groups show that the percentage of children fulfilling minimum meal frequency standards varies and it increases with the age group, within intervention groups; while it is the reverse with control districts. More of this analysis can be found in appendix 1a and 1b.
Figure 6. Percentage of Children 6–23 Months Who Reported Having Received Solid, Semi-Solid, or Soft Foods (the minimum number of times or more) the Day Prior to Survey
Source: SPRING Household Surveys, 2013 and 2014
3.2.7 Minimum Acceptable Diet
This composite indicator is calculated from the percentage of breastfed children aged 6–23 months who had at least the minimum dietary diversity and the minimum meal frequency during the previous day; and the percentage of non-breastfed children aged 6–23 months who received at least two milk feedings and had at least the minimum dietary diversity, not including milk feeds, and the minimum meal frequency during the previous day. A minimum acceptable diet is essential to ensure appropriate growth and development of infants and young children. Without adequate diversity and meal frequency, infants and young children are vulnerable to malnutrition, especially stunting and micronutrient deficiencies, and to increased morbidity and mortality.5
In the EC region, the 2014 Namutumba district survey results on the percentage of children 6–23 months who received a minimum acceptable diet (apart from breastmilk) show results at 26.8 percent (n=190) in 2014 and at 21.2 percent (n=151) reported as part of the 2013 baseline survey findings. In addition, comparisons drawn between Namutumba (intervention district) and Mayuge (control district at 24.7 percent, n=190) show slightly higher findings with Namutumba. Among SAs, Bulange, Magada, and Ivukula sub-counties were identified as the lowest performers, prioritizing them for programming aimed at improving this indicator.
5 WHO Indicators to monitor the implementation of the comprehensive implementation plan http://www.who.int/nutrition/EB128_18_backgroundpaper4_nutrition_indicators.pdf
37.8% 37.6% 37.7%
56.9%
33.8% 34.1%
61.5% 56.2% 58.8%
47.1% 45.3% 51.6%
0.0%
10.0%
20.0%
30.0%
40.0%
50.0%
60.0%
70.0%
Kisoro Ntungamo Interventiondistricts SW
Control districtsSW
Interventiondistrict EC
(Namutumba)
Control districtEC (Mayuge)
2013
2014
Nutrition Indicators Results from Six Districts in South Western and East Central Uganda | 17
In the SW region, the 2014 intervention district survey results show results at 29.9 percent (n=452), a highly significant (p<0.001) finding when compared to 17.0 percent (n=289). Among districts, the highest priority areas for the next interventions were identified as Muramba and Nyarusiza SA; as well as Murora, Kanaba, and Nyakabande in Kisoro district. In Ntungamo district, Kajara County SA, as well as Ruhama and Rwekinihiro SA, were identified. See appendix 1a and 1b for more results.
3.2.8 Consumption of Iron-Rich6 or Iron-Fortified7 Foods
Iron-rich foods include any food item that contains relatively large amounts of iron; for example, liver, kidney, heart, lean meat, or other organ meats. The best plant sources include leafy green vegetables, whole grains, and legumes. Iron-fortified foods are foods that have certain nutrients added to improve their nutrient content. Children 6–23 months were assessed for consumption of both types of foods.
The 2014 SW region survey results for children 6–23 months who were reported having received an iron-rich food or iron-fortified food that was especially designed for infants and young children, or that was fortified in the home, show no significant (p=0.137) differences between the control (26.5 percent, n=374) and the intervention (31.2 percent, n=452) district findings. However, within intervention districts, highly significant increments (p<0.001)—from 17.3 percent (n=289) were reported at baseline in 2013. Contrariwise, control districts’ results were significantly reduced (p<0.001) from 41.6 percent (n=274) to 26.5 percent (n=374), while Ntugamo district (36.1 percent) reported the highest performance. Among SAs, Muramba and Nyarusiza SA; Murora, Kanaba, and Nyakabande, as well as Chahi, Kisoro TC, and Nyakinama in Kisoro district were the poorest performing in the entire district. But, in Ntungamo district, all the SAs except Nyakyera and Rukoni SA, performed poorly and should be prioritized for increased programming.
Although not significant (p=0.072), there was an increment from 35.1 percent (n=151) during baseline in 2013 when compared to 44.7 percent (n=190) in the EC region. Among SAs, Bulange and Namutumba sub-counties were the poorest performing in the entire district. Tables 5a and 5b illustrate disaggregation by region, control/intervention districts, and age group.
6 Iron-rich foods investigated as part of this survey include the WHO recommended food groups that include liver, kidney, heart, or other organ meats; any meat, such as beef, pork, lamb, goat, chicken, or duck; fresh or dried fish, shellfish, or seafood. 7 Iron-fortified foods investigated during the survey include any foods with added powder or sprinkles.

18 | Final Survey Report
Table 5a. South Western Region—Percentage of Children 6–23 Months Who Received an Iron-Rich or Iron-Fortified Food
Characteristics Children 6–23 months
Total all South West Districts Intervention Districts Control Districts
Year of survey and p-values
2013 2014 p-value (by year)
2013 2014 2013 2014 p-value (Intervention
Vs Control)
Age
6–11 months 11.1 29.8 37.8 28.7 23.2 29.3
12–17 months 20.8 29.0 37.9 31.4 29.3 30.1
18–23 months 20.2 37.6 Ϯ 48.5 15.5 Ϯ 34.6 27.1
Intervention districts
Kisoro 18.2 26.1
Ntungamo 16.3 36.3
Control districts
Buhweju 23.9 14
Rubirizi 59.6 38.8
Overall Total 17.3 31.2 p<0.001 41.6 26.5 29.1 29.1 p=0.137
Ϯ: Sample size low but results can be used as a proxy.
Table 5b. East Central Region—Percentage of Children 6–23 Months Who Received an Iron-Rich or Iron-Fortified Food
Characteristics Children 6–23 months
Total all East Central Districts Namutumba (intervention district) Mayuge (control district)
Year of survey and p-values
2013 2014 p-value (by
year) 2013 2014
p-value (by year)
2013 2014 p-value
(comparisons as specified)
Age
6–11 months 33.9 44.2 0.231 (2014 results only)
43.2 42.1 0.154 (2014 results only)
37.6 43.2 0.055 (2014 results only)
12–17 months 37.3 Ϯ 51.6 Ϯ 52.2 Ϯ 57.4 Ϯ 45.2 54.3
18–23 months 33.3 Ϯ 33.3 Ϯ 42.9 Ϯ 41.5 Ϯ 37.5 37.8
Sex
Males (6–23 months) 32.8 44.1 0.860 (2014 results only)
52.6 36.4 0.011 (2014 results only)
43.7 40.3 0.052 (2014 results only)
Females (6–23 months) 36.8 45.4 40.7 54.9 38.8 50.3
District Total 35.1 44.7 0.072 47.7 46.3 0.803 41 45.5
0.757 (control vs intervention)
Ϯ: Sample size low but results can be used as a proxy.

Nutrition Indicators Results from Six Districts in South Western and East Central Uganda | 19
3.3 Optional IYCF Indicators Among the optional IYCF indicators assessed, this study included those on children ever breastfed, continued breastfeeding at 2 years, age-appropriate breastfeeding, predominant breastfeeding under 6 months old, bottle feeding, and milk feeding frequency.
3.3.1 Children Ever Breastfed
Overall, the 2014 results from both the SW and EC regions intervention districts show high findings of 98.1 percent (n=676) and 97.1 percent (n=278), respectively, among children aged 0–23 months, who had ever been breastfed since they were born. Additionally, results from either region control districts were found at (98.1 percent, n=535) and 97.2 percent (n=284), respectively; while, at the same time, no significant (p>0.050) differences were found between control and intervention districts or annual progress, in either regions. Furthermore, no significant differences were found on SA performances in both Ntungamo (p=0.723) and Kisoro district (p=0.779). Among other findings, in Namutumba district, significant differences (p<0.001) were found between the 0–11 and 12–23 months age groups—at 99.5 percent (n=185) and 92.5 percent (n=93), respectively. There were no significant differences (p=0.730) on SA performances in the same district.
3.3.2 Age Appropriate Breastfeeding
In the Indicators for Assessing Infant and Young Child Feeding Practices Handbook, WHO defines “age-appropriate breastfeeding” as a summary measure of the proportion of children less than 2 years of age who are appropriately breastfed and who receive complementary foods when needed (2010). The sample universe for this indicator is last-born children 0–23 months of age living with their mothers. This indicator captures information about exclusive breastfeeding for children 0–5 months; including the dual practice of breastfeeding and complementary feeding for children 6–23 months.
In the EC region, the 2014 survey findings in Namutumba district (71.2 percent, n=285) were almost identical to those from the baseline year of 2013 (71.6 percent, n=190); no differences were found between Mayuge (control district) whose performance in 2014 was at 71.6 percent (n=285). Among SAs, Magada and Namutumba sub-counties had the poorest performance when compared to the rest of the SAs in the same district. In addition, the SW region intervention (75.8 percent, n=679) and control (73.5 percent, n=536) district findings were almost identical (p>0.050); while, at the same time, slightly higher than the baseline findings of 70.3 percent (intervention district). The following SAs were identified as low performers that should be prioritized in future programming: Muramba and Nyarusiza SA, Chahi, Kisoro TC, and Nyakinama (Kisoro district); and Kajara County SA, and Itojo, Ntungamo, and Ntungamo TC SA (Ntungamo district).
3.3.3 Predominant Breastfeeding Under Six Months
As pointed out in the WHO’s guidelines (2010), although previous studies did not find any significant effect on mortality between exclusive and predominant breastfeeding, there are other reasons to recommend exclusive breastfeeding as the preferred option when compared to predominant feeding for children under 6 months of age. The same WHO report details that predominant breastfeeding has been associated with an increased risk of diarrhea. Avoidance of any liquids, other than breastmilk, is key to ensure appropriate feeding of infants less than 6 months of age, unless there is a medical reason to do otherwise. Predominant breastfeeding allows oral rehydration salts (ORS), vitamin and/or mineral supplements, ritual fluids, water and water-based drinks, and fruit
Both the SW and EC region
intervention districts show
high findings of 98.1 percent
and 97.1 percent, respectively,
for children ever breastfed.

20 | Final Survey Report
juice. Other liquids are not allowed, including non-human milks and food-based fluids, or semi-solid or solid foods. 8
The EC region findings show that, overall, in 2014, 69.5 percent (n=95) and 64.2 percent (n=95) of biological mothers with children under 6 months of age in the intervention and control districts, respectively, reported that their aforementioned infants were predominantly breastfed. Although based on the 2013 low baseline survey sample size of 97 respondents (for both districts), findings showed an increment in Namutumba and Mayuge from 64.1 percent and 51.7 percent (p<0.05), respectively. In the SW region, 69.6 percent (n=227) and 65.4 percent (n=162) were the findings in the intervention and control districts, respectively. These findings showed no significant increments (p>0.050) when compared to the baseline findings of 65.9 percent (n=91) and 63.6 percent (n=110), respectively, in the same region.
3.3.4 Bottlefeeding
Bottlefeeding is the practice of feeding an infant or any young child from a bottle that contains a nipple or rubber at its tip; it is normally used as a substitute for and/or as a supplement to breastfeeding. This practice is rarely seen; it is mainly practiced by urban women in areas of Uganda. Although a significant increment (p<0.001) was reported from 3.1 percent (n=353) in 2013 to 9.8 percent (n=667) reported in 2014 among intervention districts in the SW region, bottlefeeding practices remain low. In the EC region, no significant changes (p=0.485) in results were seen when comparing differences between survey years for Namutumba district. A total of 3.2 percent (n=187) and 3.4 percent (n=269) for the 2013 baseline and 2014 follow-on surveys, respectively, show similar findings. However, there were significant differences (p=0.012) between Mayuge (6.4 percent, n=280) and Namutumba (3.4 percent, n=269) districts when analysis for control and intervention districts was done. In addition, as illustrated in table 6, there were significant differences (p=0.007) between control and intervention districts when comparing the 2014 results.
8 http://whqlibdoc.who.int/publications/2010/9789241599757_eng.pdf pages 27 and 28

Nutrition Indicators Results from Six Districts in South Western and East Central Uganda | 21
Table 6. Percentage of Children 0–23 Months of Age Who Are Bottlefed
Disaggregation
South West Region East Central Region
Intervention Districts Total
Control Districts Total
p-value Namutumba (intervention
district)
Mayuge (control district)
p-value Kisoro Ntugamo
Total Intervention
Districts
year of survey
2013 2014 2013 2014 2013 2014 2013 2014 2014
results only 2013 2014 2013 2014 2014 results only
Total 2.2 11.0 4.1 8.5 3.1 9.8 5.1 5.1 p=0.007
(intervention vs control)
3.2 3.4 6.2 6.4 0.012 (intervention
vs control,)
0–5 months ◊ ◊ ◊ ◊ 1.2 3.1 2.8 1.2 p<0.001 (comparison between age
groups,)
◊ 2.3 ◊ 3.2 0.091 (comparison
between age groups)
6–11 months ◊ ◊ ◊ ◊ 2.2 14.2 12.4 9.3 ◊ 3.4 ◊ 13.0
12–23 months ◊ ◊ ◊ ◊ 4.4 12.0 3.2 4.3 ◊ 4.3 ◊ 3.2
◊ Sample size too low for results to be disaggregated.
Ϯ: Sample size low but results can be used as a proxy.

22 | Final Survey Report
3.3.5 Milk Feeding Frequency for Non-Breastfed Children
For the second survey year running, the sample size for this indicator was too low for both intervention and control districts. As a proxy, 23.1 percent and 16.4 percent of non-breastfed children 6–23 months of age were reported to have received at least two milk feedings, within intervention and control areas, respectively, in the SW region. Similarly, in the EC region, findings showed a proxy result of 44 percent (n=50) for both districts.
3.4 Additional Nutrition Indicators 3.4.1 Consumption of Home Fortified Foods
To assess the consumption of home fortified foods, two questions were asked to respondents about the consumption of these foods within the last 24 hours and the last six months, prior to the survey. When assessing the biological mothers of children 6–23 months who reported that their children consumed any food to which they added powder or sprinkles within the last 24 hours prior to the survey, there were significant differences in coverage (p<0.001) within each region intervention and control districts, by year. Table 7 illustrates more findings.
Among the intervention districts in the SW region, there were no significant differences (p=0.149) when the 2013 baseline results (2.7 percent, n= 259) were compared to the 2014 follow-up results (4.9 percent, n=445). Ntungamo district, Ruhama and Rwekinihiro SA; Itojo, Ntungamo, and Ntungamo TC, with Kajara county, were performing below the district average coverage; while, in Kisoro district, the list included all SAs except Murora, Kanaba, and Nyakabande; as well as Nyarubuye, Busanza, and Nyabwishenyi.
When compared to Mayuge district (1.1 percent, n=186), Namutumba district reported a significantly (p<0.001) higher coverage (11.1 percent, n=181) in the EC region. Among SAs, Bulange, Kibaale, and Nsinze sub-counties reported performance below the district average performance benchmark.

Nutrition Indicators Results from Six Districts in South Western and East Central Uganda | 23
Table 7. Consumption of Home Fortified Food
Disaggregation
South West Districts East Central Districts
Intervention Districts Control
Districts Total
p-value (Intervention Vs Control,
2014 results)
Namutumba (Intervention
District)
Mayuge (Control District)
p-value (Intervention Vs Control,
2014 results) Kisoro Ntugamo Total Intervention
year of survey
2013
2014
2013
2014
2013
2014
2013
2014
2014
2013
2014
2013
2014
2014
% of biological mothers of children 6–23 months who reported that their children consumed any food to which they added a powder or sprinkles within the last 24 hours prior to the survey
3.2 1.4 2.2 8.5 2.7 4.9 1.5 0.8 p<0.001 6 11.1 0.8 1.1 p<0.001
% of biological mothers of children 6–23 months who reported that their children consumed any food to which they added a powder or sprinkles within the last 6 months prior to the survey
6.1 5.5 13.9 9.9 10.5 8.5 7.1 1.8 p<0.001 8.2 13.7 5.7 2.2 p<0.001

24 | Final Survey Report
3.4.2 Consumption of Industrially Fortified Foods at Household Level
In addition to consumption of home fortified foods, respondents were asked about the consumption of industrially fortified maize flour, cooking oil, sugar, and salt in the last seven days, prior to the survey.
Compared to the baseline year’s finding (96.8 percent, n=187) in the EC region, an insignificant (p<0.496) increase was noted to 97.8 percent (n=275) in the percentage of households that reported consumption of any salt in 2014 in Namutumba district. Conversely, there was a significant (p<0.001) reduction in the percentage of households consuming fortified salt—from 73.7 percent (n=190) to 64.2 percent (n=285) reported in 2013 and 2014, respectively. In addition, while comparing intervention and control districts, survey results showed more (p<0.001) consumption in Namutumba (64.2 percent, n=285) than Mayuge (51.2 percent, n=285). Among the SW intervention districts, there was an insignificant (p<0.495) decrease to 8.5 percent (n=283) from the baseline year’s finding of 10.5 percent (n=228). Similarly, a decrease from 7.1 percent to 1.8 percent was reported among the SW control districts. The same region’s results show a significant (p<0.001) difference between intervention (8.5 percent) and control districts (1.8 percent). Among districts, consumption was highest in Ntungamo, followed by Kisoro; while in control districts, there were 0 percent findings in Buhweju district.
Consumption of fortified maize flour was at 3.2 percent in 2014 (n=285), and 2.6 percent in 2013 (p=0.794)) in Namutumba district; while, at the same time, it was higher in Mayuge (control district), but had decreased significantly (p<0.001) from 30.5 percent (n=190) to 15.1 percent (n=285). Appendix 1C provides more details on other fortified foods consumption at the household level.
3.5 Goal-Oriented Antenatal Care Indicators Improved and quality ANC services play a big role in improving nutrition outcomes for mothers and their babies. As part of this survey, biological mothers of children 0–23 months were asked about goal-oriented ANC. Indicators assessed included ANC attendance and frequency of such ANC visits at the health facility; and utilization of iron and intestinal drugs during pregnancy, as well as during deliveries at health facilities.
Similar to baseline findings, a high percentage of women attending ANC at least once during their most recent pregnancy was found in all districts assessed during this study. Significantly higher findings (p=0.027) were noted in Namutumba district (95.8 percent, n=285) when compared to Mayuge district (91.2 percent, n=285) in the EC region. No significant differences (p=0.683) were found in the SW region between the intervention (97.0 percent, n=536) and control (97.4 percent, n=97.4 percent) districts—when comparing differences between baseline and the 2014 follow-on results for both intervention- and control-districts.
However, among the SW intervention districts, significant differences were found (fisher’s exact test=0.013) in ANC attendance of four or more visits—from 49.5 percent (n=379) reported during the 2013 baseline to 56.0 percent (n=529). A slight increment was found—from 54.7 percent (n=190) reported during the 2013 baseline to 56.1 percent (n=285) in Namutumba district, EC Uganda (p=0.085). More details on goal ANC can be found in figures 7a and 7b, as well as appendix 1a and 1c.

Nutrition Indicators Results from Six Districts in South Western and East Central Uganda | 25
Figure 7a. Results on Different Goal-Oriented ANC Indicators (percentages) in Intervention Districts, by Year
Figure 7b. Results on Different Goal Oriented ANC Indicators (percentages), 2014 by Control versus Intervention Districts
71.7 75.0
49.5
97.1
83.5 83.4
56.0
97.0
Deliveryfrom ahealthfacility
Deliveryperformedby a skilledand trained
provider
4 or moreANC visits
Atleast oneANC visit
South Western Region
Year 2013
Year 2014
74.7 74.7
54.3
97.9
76.8 76.8
56.1
95.8
Delivery from ahealth facility
Deliveryperformed by a
skilled andtrained
provider
4 or more ANCvisits
Atleast oneANC visit
East Central Region
83.5 83.4
56.0
97.0
74.5 76.0 67.4
97.4
0.0
20.0
40.0
60.0
80.0
100.0
Deliveryfrom ahealthfacility
Deliveryperformedby a skilledand trained
provider
4 or moreANC visits
Atleast oneANC visit
South Western Region
Intervention Districts Control Districts
81.1 78.3
59.7
91.2
76.8 76.8
56.1
95.8
0.0
20.0
40.0
60.0
80.0
100.0
Deliveryfrom ahealthfacility
Deliveryperformedby a skilledand trained
provider
4 or moreANC visits
Atleast oneANC visit
East Central Region
Mayuge (control) Namutumba (intervention)

26 | Final Survey Report
3.6 Social and Behavior Change Communication Like all other programs, SPRING uses SBCC as a strategic intervention in promoting knowledge, practices, and behavior that would yield positive nutrition outcomes, especially among mothers of children 0–23 months, as well as other household members that have influence over these children.
Except for knowledge on how to prevent a child from getting diarrhea (the recommended 4Fs9 and boiled water)—which is still low and shows no significant improvements (p>0.050)—significant improvements were seen across most of the major SBCC and nutrition knowledge indicators during the last one-year period, when compared to the 2013 baseline survey findings. Additionally, results from the intervention districts show significantly higher performances and increments over a one-year period, when compared to control districts.
Health facilities, village health team members, and radio continue to be the most common types of media through which SBCC messages are received in the communities. More females than males reported having received messages on most of the indicators assessed; however, more males, compared to women, reported having received messages through the radio. See table 8 and appendix 2 for more detailed findings on different SBCC indicators.
9 The “4Fs” for diarrhea prevention include avoiding contamination via fluids, fields, flies, and fingers.

Nutrition Indicators Results from Six Districts in South Western and East Central Uganda | 27
Table 8. Knowledge on Nutrition and Access to SBCC Messages
Indicator/Indicator Disaggregation
South Western Region East Central Region
Intervention Districts Total
Intervention Total
Control p-value 2014 control vs
intervention
Namutumba (intervention
district)
Mayuge (control district)
p-value 2014 (control Vs
intervention)
Kisoro Ntungamo
Year of survey
2013
2014
2013
2014
2013
2014
2013
2014
2013
2014
2013
2014
% of individuals reporting that their households have (in the last 3 months) received at least one message about:
proper nutrition for women or children
28.6 42 23.9 38 26.3 40 25.3 36 p=0.222 16.7 40.6 37.4 50.5 p=0.014
proper breastfeeding practices
32.4 51 33.8 44 33.1 47 39 39 P=0.001 26.6 43 41.8 49.2 p=0.078
proper feeding for children 6 months or older
34.9 42 33.5 40 34.2 41 33.9 34 p=0.004 29.5 41.7 41.2 50.5 p=0.021
deworming medications for children
47.5 56 37.6 50 42.6 53 46.4 45 p=0.001 23.1 38.3 41.2 46.9 p=0.011
how women can stay healthy during pregnancy
33.7 49 36.4 52 35.1 50 41.7 40 p<0.001 20.9 35.8 37.6 39.6 p= 0.260
% of individuals who know;
when or how to wash hands 48.9 60 42.1 62 1.1 61 0.4 58 p=0.091 44.3 59 40.8 54.6 p=0.303
when a newborn should be put to breast after birth
68.3 76 89 86 78.7 81 71 74 p<0.001 72.1 85.8 80.4 87 p=0.003
what a woman who has just delivered should do with the first yellow breastmilk
78.5 81 78.1 88 78.3 85 76.4 78 p<0.001 71.3 80.6 76.3 82.1 p=0.005
how long a woman should exclusively breastfeed
62.9 75 83.7 82 13.6 78 12 78 p<0.001 65.6 83.5 67.2 82.3 p=0.031

28 | Final Survey Report

Nutrition Indicators Results from Six Districts in South Western and East Central Uganda | 29
4.0 Challenges, Lessons Learned, and Responses to These Challenges Most of the lessons learned and challenges experienced during the preparations, collection, and analysis of the 2013 baseline survey continued to affect the 2014 survey. However, a few new additional challenges remain toward the implementation of the 2014 survey, including some of the following:
4.1 Challenges and Responses to These Challenges • The same look and paper color (white) was used to print all questionnaire target groups in the SW region;
therefore, judging by the completed questionnaires received from the field, there were some situations of mixed age category respondents. For example, cases of a respondent belonging to one age category were interviewed with a different age category’s questionnaire. Most cases, however, were cleaned out during the data entry and cleaning process prior to analysis.
• One of the major objectives for this survey was to follow up on the progress of indicators assessed during the 2013 baseline survey. However, for Kisoro and Ntungamo districts there were some inconsistencies in the data collection approach. Both districts were divided into six SAs, instead of the five SAs used during the baseline. To promote consistency, and follow up on the performance and tracking of progress of SAs, all analysis for the 2014 survey were conditioned using the 2013 SA original boundaries. However, some SAs had with a bigger sample size, while others had slightly less of the LQAS prescribed minimum of 19 randomly sampled respondents. As a result, the sample sizes are acceptable at an aggregate level, while several SAs had fewer than the recommended size.
• In the SW region, some of the received questionnaires had missing, unfilled, or inconsistent variable entries; while others could be cleaned by following the consistence of one’s responses, others could not.
Other challenges and limitations to this year’s survey were new, while others were similar to those noted during the baseline survey, including—
• Part of this survey’s questions required observations; therefore, interviewers were instructed to observe some items; for example, fortified foods, especially for those respondents who reported having such food stuff in their household. However, some of the respondents could not allow interviewers to make these observations. Another example was observations required to analyze ANC information from the ANC card. Without the cards, recall failure among some respondents could not be ruled out, even though interviewers tried their best to probe for responses. Building rapport with respondents helped minimize such occurrences.
• In both regional surveys, some supervision areas’ sampled villages that had their names changed; the interviewers took significant time and money trying to trace these villages. However, later, the villages were traced with the help of the local guides. Therefore, the objectives of the survey were not compromised.
• In some parts of these districts, the rural road network is in a poor state—they have huge pot holes, which slowed transportation. In some areas, while pursuing sampled villages, data collectors had to walk for miles on foot because roads were so difficult to navigate. Most of the interviewers complained about the length of time it took to find a randomly selected village, as well as the time it took to randomly select the first household. Also, they had very few days with which to complete the allocated interviews. Also,

30 | Final Survey Report
interviewers found it was hard to access Lake Victoria’s island sampled villages in Mayuge district, EC Uganda.
4.2 Lessons Learned • Partnerships between USAID’s international partners on these undertakings are skilled with promoting
improved collaboration and coordination of activities and, also, with reducing the activity costs that mainly come from the advantages of the economies of scale. This is evident with the continued SPRING and the Strengthening Tuberculosis and HIV&AIDS Responses in East Central Uganda (STAR-EC) partnership in the east central region.
• During data collection, when research assistants used local boda boda cyclists as village guides, and as transport to various sampled villages, they can quickly reach out to sampled households and respondents; also, the transport is cheaper than if each data collector had a hired car every day.
• Building rapport, especially with the local authorities, is very important; it builds confidence in the local community as they freely share their ideas and experiences.
• District health personnel continue to demonstrate divided attention while conducting this survey. Some were seen, simultaneously, performing other district roles, while participating in this household survey exercise. This increased the time they took to collect this information.
More details on such challenges and lessons learned can be found under section 4.0 of the SPRING 2013 baseline survey report.
However, it is still worth noting that—although a separate questionnaire targeting the 0–5 months age group was created, and this helped increase the sample size required to report on indicators affected by this age group—challenges remained on how to analyze some IYCF indicators whose denominators include the 6–8, 12–15, and 20–23 months old, especially at a disaggregated level. Some of the information reported on these indicators is a proxy. Additionally, the degree of precision is compromised with smaller sample sizes arising from such aforementioned age categories.
It should also be noted that outcomes and results of this survey are subject to the ability of respondents to remember past occurrences—some involve long periods of time, especially among biological mothers of children 12–23 months old. Although this survey’s data collectors were trained to minimize this kind of bias by using various checks, the respondents’ recall bias and memory lapse cannot be entirely ruled out.

Nutrition Indicators Results from Six Districts in South Western and East Central Uganda | 31
5.0 Conclusions In conclusion, the assessment of 2014 performance in both regional intervention districts showed improvements across several indicators since the 2013 baseline assessment.
Among the SW intervention districts over the last two years, improvements—some significant—were seen for all investigated IYCF indicators, except for two: (1) early initiation of breastfeeding and (2) milk feeding frequency for non-breastfed children. However, significant improvements and performance on early initiation of breastfeeding and minimum meal frequency were noted within Namutumba district in the EC region. Although not significant, other IYCF indicators were largely found to be on an upward trend in both regional intervention districts.
In both regions, the 2014 follow-up survey results showed that intervention district performances are largely higher than those from control districts for IYCF, ANC, SBCC, and other assessed indicators, except in the EC region. The EC region had better performance in the control district on almost all SBCC indicators, excluding the indicator on the percentage of individuals receiving messages about when or how to wash hands.
Comparisons among intervention districts in the SW region showed that Ntungamo had better performance when compared to Kisoro district on several IYCF and ANC indicators, including SBCC indicators on knowledge and perceptions of breastfeeding practices and hygiene. However, Kisoro district reported better performance on the percentages of individuals who had received at least one SBCC message within the three months prior to the survey.
In the EC region, though baseline findings across most indicators showed a wider significant gap between the two districts (with Mayuge having better performances), the 2014 findings showed narrower gaps—Mayuge is still performing better than Namutumba district.
Overall, across supervision areas in the SW region: Muramba and Nyarusiza SA; Chahi, Kisoro TC, and Nyakinama SA; as well as Murora, Kanaba, and Nyakabande SA in Kisoro district, with Ruhama and Rwekinihiro SA; Kajara county SA; and Rushenyi county in Ntungamo district were identified as the neediest sub-counties for interventions. Bulange, Magada, and Namutumba sub-counties were identified in Namutumba district, EC region.

32 | Final Survey Report

Nutrition Indicators Results from Six Districts in South Western and East Central Uganda | 33
6.0 Recommendations Some of the recommendations presented during the baseline survey report are still useful for this follow-on survey progress report, including—
Support to goal-oriented ANC and giving birth at health facilities for pregnant women will help improve IYCF indicators; for example, breastfeeding of babies immediately after birth plus empowerment of expectant mothers with nutrition information through ANC counseling. The more mothers who attend ANC and deliver at health facilities, the more likely it is that they will have knowledge of and, subsequently, practice good nutrition habits.
SPRING needs to increasingly take advantage of integrated outreach service delivery models that several partners in the country are championing; this will increase access to nutrition services for the target groups. USAID existing partners— Strengthening Tuberculosis and HIV&AIDS Responses in South Western Uganda (STAR-SW), STAR-EC, and others—have outreach models that mobilize target group individuals for immunization, family planning, HIV and AIDS, and other services. Such mobilized target groups are a good opportunity and platform for SPRING to consider when providing nutrition-based services.
Improved male involvement interventions, coupled with involvement of the civil society, religious leaders, and others would help support and encourage mothers of children 0–23 to improve their nutrition-based practices for children and at the household level. SBCC should be scaled up to involve some unique approaches that can effectively deliver designed messages. Infotainment has, over many years, been seen as one of the most effective ways to educate, especially young mothers.
Evidence-based and district-centered information is vital for efficient allocation of scarce resources, planning, and decision making—and this can be made possible by using LQAS data at the district- or lower-levels. SPRING or other development partners may consider providing and/or increasing the provision of fortified foods for affected households at subsidized rates or free of cost. The distribution mechanism for such fortified foods needs to be carefully planned to avoid misallocation or abuse of intended interventions.
In addition to some of the recommendations stated in the 2013 baseline report, the following recommendations need to be considered:
When planning follow-up interventions that will be used to address some of the findings from this report, priority should be given to the following set of sub-county or county SAs, which were already mentioned in the conclusion section. They include the SW supervision areas of Muramba and Nyarusiza SA; Chahi, Kisoro TC, and Nyakinama SA; as well as Murora, Kanaba, and Nyakabande SA in Kisoro district; alongside Ruhama and Rwekinihiro SA; Kajara county SA; and Rushenyi county in Ntungamo district. In the EC region, the list includes Bulange, Magada, and Namutumba sub-counties in Namutumba district.
Looking at the analysis from the various indicators, more focus needs to be given to improving the performance of indicators that include minimum acceptable diet, minimum meal frequency, and consumption of iron-rich or fortified foods.
It is also imperative to work on improving water, sanitation, and hygiene (WASH) indicators, as knowledge and practices were low in both regions. It should also be noted that in Namutumba district, not one respondent in all SAs, except Namutumba sub-county, could identify all the recommended 4Fs and boiled water as a standard to prevent children from getting diarrhea. This suggests further messaging around WASH, as part of the response.

34 | Final Survey Report
As indicated under the baseline survey recommendations, follow-up action research on some of the key indicator findings may be imperative in explaining certain behaviors. As in any other quantitative study, numbers or percentages on their own may not fully explain some situations, but they can be supplemented with follow-up qualitative research findings. Therefore, a diagnostic study is recommended in following up some of the 2014 findings that have been indicated in this report.
As part of improving male involvement into nutrition, ANC, and other services given to young children/babies and their mothers, radio should be considered for such information dissemination, while complementing it with other media. Most men reported receiving SBCC messages through the radio, when compared to any other media source—something that may be easily explained—males own most radios; therefore, they spend a lot of time listening to them.

Nutrition Indicators Results from Six Districts in South Western and East Central Uganda | 35
7.0 Resources /Reference Materials D. Businge, M.O.Smith, S. Kironde, and A. Begumisa. 2012. STAR-EC LQAS Survey Report 2012: A health facility
assessment and household LQAS survey on HIV&AIDS and TB interventions in nine districts in East Central Uganda. Jinja, Uganda: Strengthening TB and HIV & AIDS Responses in East-Central Uganda (STAR-EC) project.
Lemeshow S., Taber S. 1991. “Lot quality assurance sampling: single and double-sampling plans.” World Health Statistics Quarterly 44, 115-132.
Uganda Bureau of Statistics (UBOS) and Macro International Inc. 2011. Uganda Demographic and Health Survey, 2011. Calverton, Maryland, USA: UBOS and Macro International Inc.
Valadez J. et al. 2003. Assessing Community health programs, Using LQAS for baseline and monitoring. Washington, DC: NGO Networks for Health project.
WHO, UNICEF, UNFPA, UNAIDS. 2008. HIV transmission through breastfeeding: A review of available evidence, 2007 update. Geneva: World Health Organization. http://www.who.int/child_adolescent_health/documents/9789241596596/en/index.html
WHO, UNICEF, WFP, UN-SCN. 2007. Community-based management of severe acute malnutrition: A joint statement. Geneva: World Health Organization. http://www.who.int/child_adolescent_health/documents/a91065/en/index.html
WHO/UNICEF. 2003. Global strategy for infant and young child feeding. Geneva: World Health Organization. http://www.who.int/child_adolescent_health/documents/9241562218/en/index.html
WHO/UNICEF. 2007. Planning Guide for national implementation of the Global Strategy for Infant and Young Child Feeding. Geneva: World Health Organization. http://www.who.int/child_adolescent_health/documents/9789241595193/en/index.html
World Health Organization. 2001. The optimal duration of exclusive breastfeeding: report of an expert consultation. Geneva: World Health Organization. http://www.who.int/nutrition/publications/optimal_duration_of_exc_bfeeding_report_eng.pdf
World Health Organization. 2005. Guiding principles for feeding non-breastfed children 6–24 months of age. Geneva: World Health Organization. http://www.who.int/child_adolescent_health/documents/9241593431/en/index.html
World Health Organization. 2007. Evidence on the long-term effects of breastfeeding. Geneva: World Health Organization. http://www.who.int/child_adolescent_health/documents/9241595230/en/index.html
World Health Organization. 2009. Infant and young child feeding. Model Chapter for textbooks for medical students and allied health professionals. Geneva: World Health Organization. http://www.who.int/child_adolescent_health/documents/9789241597494/en/index.html
World Health Organization. 2010. Guidelines on HIV and Infant Feeding, 2010. Geneva: World Health Organization. http://www.who.int/child_adolescent_health/documents/9789241599535/en/index.html

36 | Final Survey Report

Nutrition Indicators Results from Six Districts in South Western and East Central Uganda | 37
Appendix 1. Progress on IYCF, ANC and Additional Indicators - 2013 and 2014 (intervention Vs control district) Appendix 1a. South Western Region Survey Findings
Indi
cato
r co
de
Indicator Disaggrega-
tion
South West Districts
Intervention Districts Control Districts Total
South West Districts
p value (Intervention Vs Control)
or age comparisons
Districts p value (Year 2013 Vs 2014
except comparisons between age
groups)
Districts Total
Kisoro Ntugamo Total Buhweju Rubirizi
2013
2014
2013
2014
2013
2014
2013
2014
2013
2014
2013
2014
2013
2014
1YCFI
Early initiation of breast feeding: % of children born in the last 24 months were put to breast within one hour of birth.
total 77.9 78.8 89.0 88.3 83.4 83.4 p=1.000 64.1 94.2 81.8 95.4 72.9 94.8 78.1 88.4 p < 0.001
1YCF2
Exclusive breast feeding under 6 months:% of infants 0-5 months who are fed exclusively with breast milk
total ◊ 55.3 ◊ 77.9 63.7 66.5 p>0.05 ◊ 56.8
Ϯ ◊
64.2Ϯ
59.1 60.5 61.2 64.0 p>0.050
1YCF3
Continued breast feeding at one year: % of children 12-15 months of age who are fed breast milk
total ◊ 93.8
Ϯ ◊
82.4Ϯ
82.6Ϯ
87.9 p=0.337 ◊ 80.4
Ϯ ◊
80.7Ϯ
87.7Ϯ
80.5Ϯ
85.1 84.7 p=0.179
1YCF4
Introduction of solid, semi-solid or soft foods: % of infants 6-8 months who received solid, semi-solid or soft foods
total ◊ 80.4 ◊ 70.2
Ϯ 72.7
Ϯ 74.3 p=0.824 ◊
87.0Ϯ
◊ 83.6
Ϯ 92.7
Ϯ 85.3 81.3 79.7 p=0.045
1YCF5 Minimum dietary diversity: % of children
total 43.2 43.8 43.3 42.9 43.3 43.4 p=0.976 53.6 18.8 52.9 26.1 53.3 22.5 48.1 33.9
◊ p<0.001

38 | Final Survey Report
Indi
cato
r co
de
Indicator Disaggrega-
tion
South West Districts
Intervention Districts Control Districts Total
South West Districts
p value (Intervention Vs Control)
or age comparisons
Districts p value (Year 2013 Vs 2014
except comparisons between age
groups)
Districts Total
Kisoro Ntugamo Total Buhweju Rubirizi
2013
2014
2013
2014
2013
2014
2013
2014
2013
2014
2013
2014
2013
2014
6-23 months who received foods from 4 or more food groups
6-11 months ◊ ◊ ◊ ◊ ◊ 40.4
p=0.012
◊ ◊ ◊ ◊ ◊ 22.2 36.5 32.2
p=0.041 12-17 months ◊ ◊ ◊ ◊ ◊ 38.9 ◊ ◊ ◊ ◊ ◊ 21.0 52.9 30.9
18-23 months ◊ ◊ ◊ ◊ ◊ 57.0
Ϯ ◊ ◊ ◊ ◊ ◊
25.0Ϯ
54.5 41.8
1YCF6
Minimum meal frequency: % of breast fed and non-breast fed childern 6-23 months who received solid, semi-solid or soft solid (but also including milk feeds for non-breast fed childern) the minimum number of times or more
total 37.8 61.5 37.6 56.2 37.7 58.8 p<0.001 55.8 45.7 58.1 48.4 56.9 47.1 47.1 53.5
6-11 months ◊ ◊ ◊ ◊ 34.3 57.5 ◊ ◊ ◊ ◊ 64.6
Ϯ 52.4 48.1 55.2
12-17 months ◊ ◊ ◊ ◊ 43.8 58.0 ◊ ◊ ◊ ◊ 50.5 41.9 47.1 50.8
18-23 months ◊ ◊ ◊ ◊ 35.1 63.4
Ϯ p>0.05 ◊ ◊ ◊ ◊ 56.7
41.7Ϯ
46.1 53.1
1YCF7
Minimum acceptable diet: % of children 6-23 months who received a minimum acceptable diet (apart from breast milk)
17.6 29.6 16.3 30.1 17.0 29.9 p<0.001 26.1 11.8 22.8 19.2 24.5 15.5 20.6 23.4 p>0.050
1YCF8
Consumption of iron-rich or iron fortified foods: % of children 6-23 months who receive an iron rich food or iron fortified food that is specially designed for infants and young children, or that is fortified in the home
total 18.2 26.1 16.3 36.3 17.3 31.2 p<0.001 23.9 14.0 59.6 38.8 41.6 26.5 29.1 29.1 p=0.137
6-11 months ◊ ◊ ◊ ◊ 11.1 29.8
p=0.319
◊ ◊ ◊ ◊ 37.8 28.7 23.2 29.3
p=0.796
12-17 months ◊ ◊ ◊ ◊ 20.8 29.0 ◊ ◊ ◊ ◊ 37.9 31.4 29.3 30.1
18-23 months ◊ ◊ ◊ ◊ 20.2 37.6
Ϯ ◊ ◊ ◊ ◊ 48.5
15.5Ϯ
34.6 27.1
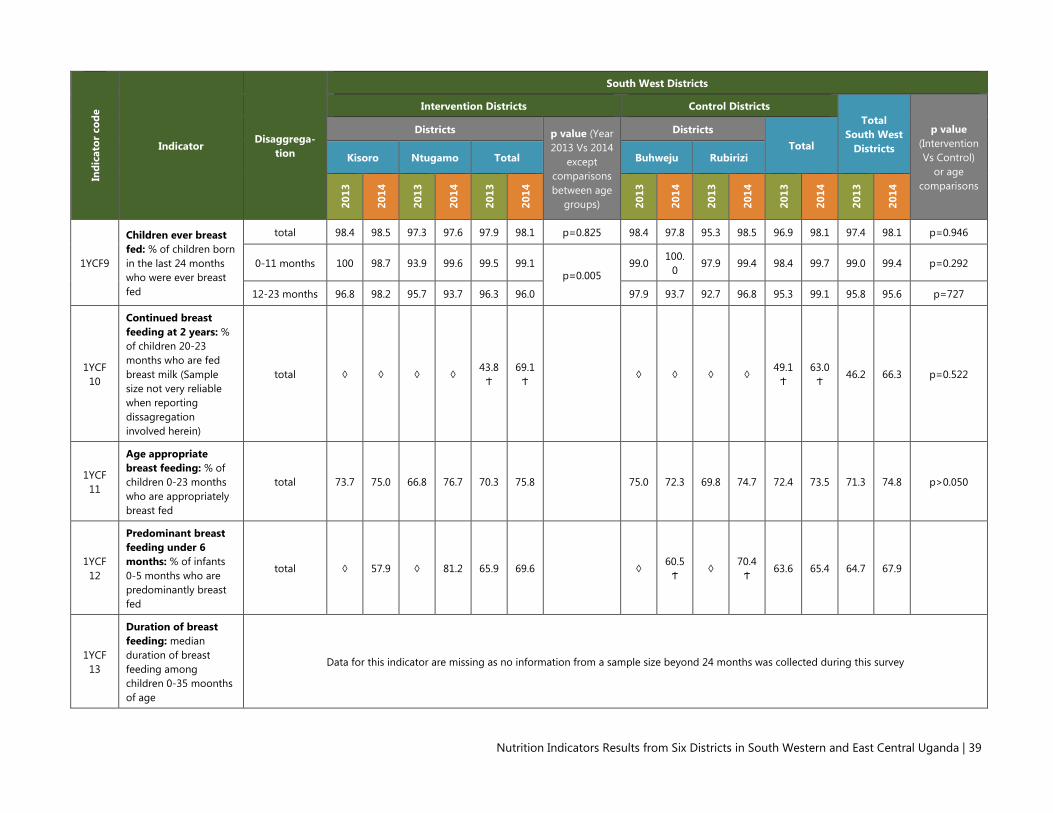
Nutrition Indicators Results from Six Districts in South Western and East Central Uganda | 39
Indi
cato
r co
de
Indicator Disaggrega-
tion
South West Districts
Intervention Districts Control Districts Total
South West Districts
p value (Intervention Vs Control)
or age comparisons
Districts p value (Year 2013 Vs 2014
except comparisons between age
groups)
Districts Total
Kisoro Ntugamo Total Buhweju Rubirizi
2013
2014
2013
2014
2013
2014
2013
2014
2013
2014
2013
2014
2013
2014
1YCF9
Children ever breast fed: % of children born in the last 24 months who were ever breast fed
total 98.4 98.5 97.3 97.6 97.9 98.1 p=0.825 98.4 97.8 95.3 98.5 96.9 98.1 97.4 98.1 p=0.946
0-11 months 100 98.7 93.9 99.6 99.5 99.1 p=0.005
99.0 100.
0 97.9 99.4 98.4 99.7 99.0 99.4 p=0.292
12-23 months 96.8 98.2 95.7 93.7 96.3 96.0 97.9 93.7 92.7 96.8 95.3 99.1 95.8 95.6 p=727
1YCF 10
Continued breast feeding at 2 years: % of children 20-23 months who are fed breast milk (Sample size not very reliable when reporting dissagregation involved herein)
total ◊ ◊ ◊ ◊ 43.8
Ϯ 69.1
Ϯ ◊ ◊ ◊ ◊
49.1Ϯ
63.0Ϯ
46.2 66.3 p=0.522
1YCF 11
Age appropriate breast feeding: % of children 0-23 months who are appropriately breast fed
total 73.7 75.0 66.8 76.7 70.3 75.8 75.0 72.3 69.8 74.7 72.4 73.5 71.3 74.8 p>0.050
1YCF 12
Predominant breast feeding under 6 months: % of infants 0-5 months who are predominantly breast fed
total ◊ 57.9 ◊ 81.2 65.9 69.6 ◊ 60.5
Ϯ ◊
70.4Ϯ
63.6 65.4 64.7 67.9
1YCF 13
Duration of breast feeding: median duration of breast feeding among children 0-35 moonths of age
Data for this indicator are missing as no information from a sample size beyond 24 months was collected during this survey
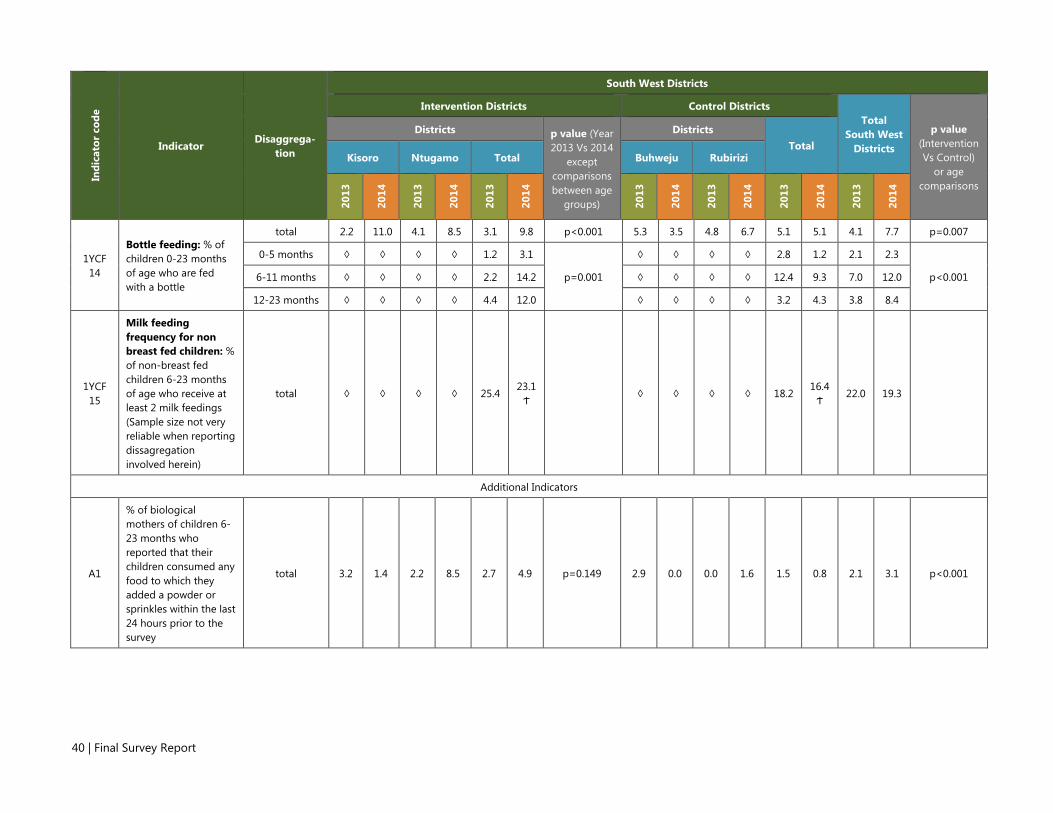
40 | Final Survey Report
Indi
cato
r co
de
Indicator Disaggrega-
tion
South West Districts
Intervention Districts Control Districts Total
South West Districts
p value (Intervention Vs Control)
or age comparisons
Districts p value (Year 2013 Vs 2014
except comparisons between age
groups)
Districts Total
Kisoro Ntugamo Total Buhweju Rubirizi
2013
2014
2013
2014
2013
2014
2013
2014
2013
2014
2013
2014
2013
2014
1YCF 14
Bottle feeding: % of children 0-23 months of age who are fed with a bottle
total 2.2 11.0 4.1 8.5 3.1 9.8 p<0.001 5.3 3.5 4.8 6.7 5.1 5.1 4.1 7.7 p=0.007
0-5 months ◊ ◊ ◊ ◊ 1.2 3.1
p=0.001
◊ ◊ ◊ ◊ 2.8 1.2 2.1 2.3
p<0.001 6-11 months ◊ ◊ ◊ ◊ 2.2 14.2 ◊ ◊ ◊ ◊ 12.4 9.3 7.0 12.0
12-23 months ◊ ◊ ◊ ◊ 4.4 12.0 ◊ ◊ ◊ ◊ 3.2 4.3 3.8 8.4
1YCF 15
Milk feeding frequency for non breast fed children: % of non-breast fed children 6-23 months of age who receive at least 2 milk feedings (Sample size not very reliable when reporting dissagregation involved herein)
total ◊ ◊ ◊ ◊ 25.4 23.1
Ϯ ◊ ◊ ◊ ◊ 18.2
16.4Ϯ
22.0 19.3
Additional Indicators
A1
% of biological mothers of children 6-23 months who reported that their children consumed any food to which they added a powder or sprinkles within the last 24 hours prior to the survey
total 3.2 1.4 2.2 8.5 2.7 4.9 p=0.149 2.9 0.0 0.0 1.6 1.5 0.8 2.1 3.1 p<0.001

Nutrition Indicators Results from Six Districts in South Western and East Central Uganda | 41
Indi
cato
r co
de
Indicator Disaggrega-
tion
South West Districts
Intervention Districts Control Districts Total
South West Districts
p value (Intervention Vs Control)
or age comparisons
Districts p value (Year 2013 Vs 2014
except comparisons between age
groups)
Districts Total
Kisoro Ntugamo Total Buhweju Rubirizi
2013
2014
2013
2014
2013
2014
2013
2014
2013
2014
2013
2014
2013
2014
A2
% of biological mothers of children 6-23 months who reported that their children consumed any food to which they added a powder or sprinkles within the last 6 months prior to the survey
total 6.1 5.5 13.9 9.9 10.5 8.5 p=0.495 13.3 0.0 0.0 3.5 7.1 1.8 8.7 5.1 p<0.001
A3
% of pregnant women attending ANC at least one time during the last pregnancy
total 97.4 100 96.8 94.8 97.1 97.0 p>0.05 99.0 95.7 96.9 99.2 97.9 97.4 97.5 97.2 p=0.683
0-11 months 96.8 100 95.8 96.4 96.3 98.2 p<0.001
97.9 96.5 94.8 100 96.4 98.2 96.3 98.2 p=0.978
12-23 months 97.9 100 97.9 90.8 97.9 90.9 100 94.4 99.0 97.4 99.5 95.8 98.7 94.1 p=0.120
A4
% of pregnant women attending ANC at least 4 times during the last pregnancy
total 38.4 50.7 60.5 59.9 49.5 56.0 FE=0.013 58.9 56.8 68.2 78.2 63.5 67.4 56.5 61.5 p<0.001
0-11 months 40.0 50.9 57.9 62.6 49.0 56.7
FE=0.693
55.2 55.5 68.8 80.2 62.0 68.2 55.5 61.6 p=0.002
12-23 months 36.8 ◊ 63.2 52.9
Ϯ 50.0 52.3 62.5
59.1Ϯ
67.7 73.7
Ϯ 65.1 65.9 57.6 61.2 p=0.037
A5
% of deliveries that were assisted by a trained /skilled health service provider (doctor/nurse/midwife/nursing aide)
total 73.2 81.3 76.8 84.9 75.0 83.4 p<0.001 60.9 70.5 75.0 81.5 68.0 76.0 71.5 79.8 p=0.004
0-11 months 76.8 81.3 82.1 84.9 79.5 83.1
p=0.648
63.5 73.7 81.3 86.3 72.4 80.2 75.9 81.8 p=0.323
12-23 months 69.5 ◊ 71.6 84.9 70.5 85.1 58.3 64.6 68.8 70.4 63.5 67.3 67.0 73.8 p=0.003
A6 % of DELIVERIES that took place in a HEALTH FACILITY
total 67.4 82.1
* 74.7 84.4 71.7 83.5 p<0.001 65.1 67.7
* 70.8 76.4
* 68 74.5 69.5 79.1 p<0.001
0-11 months 68.4 82.1 79 85.1 73.7 83.6
p=0.888
69.8 67.7 75 84.2 72.4 76 73 80.3 p=0.009
12-23 months 66.3 ◊ 70.5 82.8 68.4 83 60.4 66.7 66.7 76.4 63.5 71.2 66 75.4 p=0.040

42 | Final Survey Report
Indi
cato
r co
de
Indicator Disaggrega-
tion
South West Districts
Intervention Districts Control Districts Total
South West Districts
p value (Intervention Vs Control)
or age comparisons
Districts p value (Year 2013 Vs 2014
except comparisons between age
groups)
Districts Total
Kisoro Ntugamo Total Buhweju Rubirizi
2013
2014
2013
2014
2013
2014
2013
2014
2013
2014
2013
2014
2013
2014
Ϯ Ϯ Ϯ
A8
% of women who reported having taken any drug for intestinal worms during their last pregnancy
total 66.7 67.7 53.0 74.5 59.8 71.7 p<0.001 69.3 57.5 59.2 56.6 64.2 57.0 62.1 64.6 p<0.001
A9a
% of households that consumed maize flour during the last 7 days prior to the survey
total 79.9 67.3 83.4 74.8 81.7 71.6 p=0.001 64.6 50.6 64.2 60.2 64.4 55.4 73.0 63.7 p<0.001
A9b
% of households that consumed fortified maize flour during the last 7 days prior to the survey
total 13.2 4.7 25.3 3.5 19.2 4.1 p<0.001 5.7 6.0 4.2 8.6 5.0 7.3 12.0 5.5 p<0.001
A10a
% of households that consumed cooking oil during the last 7 days prior to the survey
total 26.3 32.6 55.1 33.6 40.8 33.1 p=0.020 31.6 19.6 51.8 44.6 41.4 31.9 41.3 32.5 p=0.678
A10b
% of households that consumed fortified cooking oil during the last 7 days prior to the survey
total 13.7 9.4 22.1 24.2 17.9 16.8 p>0.05 20.8 12.7 9.9 29.7 15.4 21.3 16.6 18.8 p<0.001
A11a
% of households that consumed salt during the last 7 days prior to the survey
total 96.8 94.6 100.
0 93.3 98.4 93.9 p=0.001 99.5 84.1 92.2 87.8 95.8 85.9 97.1 90.0 p<0.001

Nutrition Indicators Results from Six Districts in South Western and East Central Uganda | 43
Indi
cato
r co
de
Indicator Disaggrega-
tion
South West Districts
Intervention Districts Control Districts Total
South West Districts
p value (Intervention Vs Control)
or age comparisons
Districts p value (Year 2013 Vs 2014
except comparisons between age
groups)
Districts Total
Kisoro Ntugamo Total Buhweju Rubirizi
2013
2014
2013
2014
2013
2014
2013
2014
2013
2014
2013
2014
2013
2014
A11b
% of households that consumed fortified salt during the last 7 days prior to the survey
total 56.3 38.5 82.6 69.0 69.5 53.8 p<0.001 73.4 61.8 71.9 69.1 72.7 65.5 71.1 58.9 p<0.001
† results derived from a sample below the recommended sample size but can be used as a proxy ◊ Sample size is too low for results to be disaggregated or analysed
FE Fisher's exact test
p probability value
* Total includes 0-11 months age group results as a proxy Comparison between age groups total within the year 2014

44 | Final Survey Report
Appendix 1b. East Central Region; Progress on IYCF Indicators - 2013 and 2014 (intervention Vs control district) In
dica
tor
Code
Indicator Disaggregation
Namutumba Mayuge p value (Control Vs Intervention
2014) 2013 2014 p value 2013 2014 p value
EC Total 2014
1YCFI Early initiation of breast feeding: % of children born in the last 24 months were put to breast within one hour of birth.
total 76.3 87.8 <0.001 77.4 81.4 <0.001 84.6 0.137
1YCF2 Exclusive breast feeding under 6 months:% of infants 0-5 months who are fed e◊clusively with breast milk
total ◊ 54.7 ◊ 42.1 48.4 <0.001
1YCF3 Continued breast feeding at one year: % of children 12-15 months of age who are fed breast milk
total ◊ 86.1 ◊ 82.9 84.4 0.701
1YCF4
Introduction of solid, semi-solid or soft foods: % of infants 6-8 months who received solid, semi-solid or soft foods (note: sample size for this indicator was low but acceptable when control and intervention results are aggregated)
total ◊ 88.6 Ϯ ◊ 94.6 Ϯ 92.0 0.272
1YCF5 Minimum dietary diversity: % of children 6-23 months who received foods from 4 or more food groups
total 51.0 54.7 0.491 52.3 49.0 0.557 51.8 0.259
6-11 months ◊ 49.5
0.027
◊ 41.1 45.3
0.030 12-17 months ◊ 51.6 Ϯ ◊ 70.4 Ϯ 60.3
18-23 months ◊ 75.8 Ϯ ◊ 39.0 Ϯ 55.4
1YCF6
Minimum meal frequency: % of breast fed and non-breast fed childern 6-23 months who received solid, semi-solid or soft solid (but also including milk feeds for non-breast fed childern) the minimum number of times or more
total 33.8 45.3 <0.05 34.1 51.6 <0.05 48.4 <0.05
6-11 months 44.2 ◊ 55.8 50.0
12-17 months ◊ 41.9 Ϯ ◊◊ 42.6 Ϯ 42.2
18-23 months ◊ 54.5 Ϯ ◊◊ 53.7 Ϯ 54.1
1YCF7 Minimum acceptable diet: % of children 6-23 months who received a minimum acceptable diet (apart from breast milk)
21.2 26.8 17.4 24.7 25.8

Nutrition Indicators Results from Six Districts in South Western and East Central Uganda | 45
Indi
cato
r Co
de
Indicator Disaggregation
Namutumba Mayuge p value (Control Vs Intervention
2014) 2013 2014 p value 2013 2014 p value
EC Total 2014
1YCF8
Consumption of iron-rich or iron fortified foods: % of children 6-23 months who receive an iron rich food or iron fortified food that is specially designed for infants and young children, or that is fortified in the home
total 35.1 44.7 0.072 47.7 46.3 0.803 45.5 0.757
6-11 months ◊ 44.2
0.231
◊ 42.1 43.2
0.055 12-17 months ◊ 51.6 Ϯ ◊ 57.4 Ϯ 54.3
18-23 months ◊ 33.3 Ϯ ◊ 41.5 Ϯ 37.8 Ϯ
1YCF9 Children ever breast feeding: % of children born in the last 24 months who were ever breast fed
total 95.8 97.1 0.429 85.0 97.2 <0.001 97.2 0.965
0-11 months 98.9 99.5
0.001
87.0 98.9
<0.001
99.2
<0.001
12-23 months 92.6 92.5 83.2 93.7 93.1
1YCF10
Continued breast feeding at 2 years: % of children 20-23 months who are fed breast milk (Sample size not very reliable when reporting dissagregation involved herein)
total ◊ ◊ ◊ ◊ ◊
1YCF11 Age appropriate breast feeding: % of children 0-23 months who are appropriately breast fed
total 71.6 71.2 > 0.05 62.1 71.6 <0.05 71.4 > 0.05
1YCF12 Predominant breast feeding under 6 months: % of infants 0-5 months who are predominantly breast fed
total ◊ 69.5 ◊ 64.2 66.8
1YCF13 Duration of breast feeding: median duration of breast feeding among children 0-35 months of age
Data for this indicator are missing as no information from a sample size beyond 24 months was collected during this survey
1YCF14 Bottle feeding: % of children 0-23 months total 3.2 3.4 0.485 6.2 6.4 0.401 4.9 0.012

46 | Final Survey Report
Indi
cato
r Co
de
Indicator Disaggregation
Namutumba Mayuge p value (Control Vs Intervention
2014) 2013 2014 p value 2013 2014 p value
EC Total 2014
of age who are fed with a bottle 12-23 months ◊ 4.3 0.749 ◊ 3.2 3.7 0.091
1YCF15
Milk feeding frequency for non breast fed children: % of non-breast fed children 6-23 months of age who receive at least 2 milk feedings (Sample size not very reliable when reporting dissagregation involved herein)
total ◊ 44.8 Ϯ ◊ 42.9 Ϯ 44.8
◊ sample size too low for results to be disaggregated
Ϯ sample size lower than recommended LQAS survey size but results can be used as a proxy

Nutrition Indicators Results from Six Districts in South Western and East Central Uganda | 47
Appendix 1C. East Central Region; Progress on Additional Indicators - 2013 and 2014 (analysis by district) In
dica
tor
code
Indicator Disaggregation
Intervention District Control District Total East Central Districts
Namutumba Mayuge
2013 2014 p value 2013 2014 p value 2013 2014 p value (intervention
Vs control)
Additional Indicators
A1
% of biological mothers of children 6-23 months who reported that their children consumed any food to which they added a powder or sprinkles within the last 24 hours prior to the survey (sachets/tins of sprinkles observed by research assistants)
total 6.0 11.1 0.277 0.8 1.1 0.270 3.7 6.0 <0.001
A2
% of biological mothers of children 6-23 months who reported that their children consumed any food to which they added a powder or sprinkles within the last 6 months prior to the survey
total 8.2 13.7 0.289 5.7 2.2 0.078 7.1 8.7 <0.001
A3 % of pregnant women attending ANC at least one time during the last pregnancy
total 97.9 95.8 0.213 98.4 91.2 <0.001 98.2 93.5 0.027
0-11 months 97.9 96.3 0.472 97.9 90.5 0.022 97.9 93.4 0.023
12-23 months 97.9 94.7 0.248 99.0 92.6 0.329 98.4 93.7 0.551
A4 % of pregnant women attending ANC at least 4 times during the last pregnancy
total 54.7 56.1 0.085 55.3 59.7 0.037 55.0 57.9 0.139
0-11 months 55.8 56.3 0.414 57.9 57.9 0.138 56.8 57.1 0.455
12-23 months 53.7 55.8 0.172 52.6 63.2 0.081 53.2 59.5 0.241
A5 % of deliveries that were assisted by a total 74.7 76.8 0.599 76.3 78.3 0.622 75.5 77.5 0.688
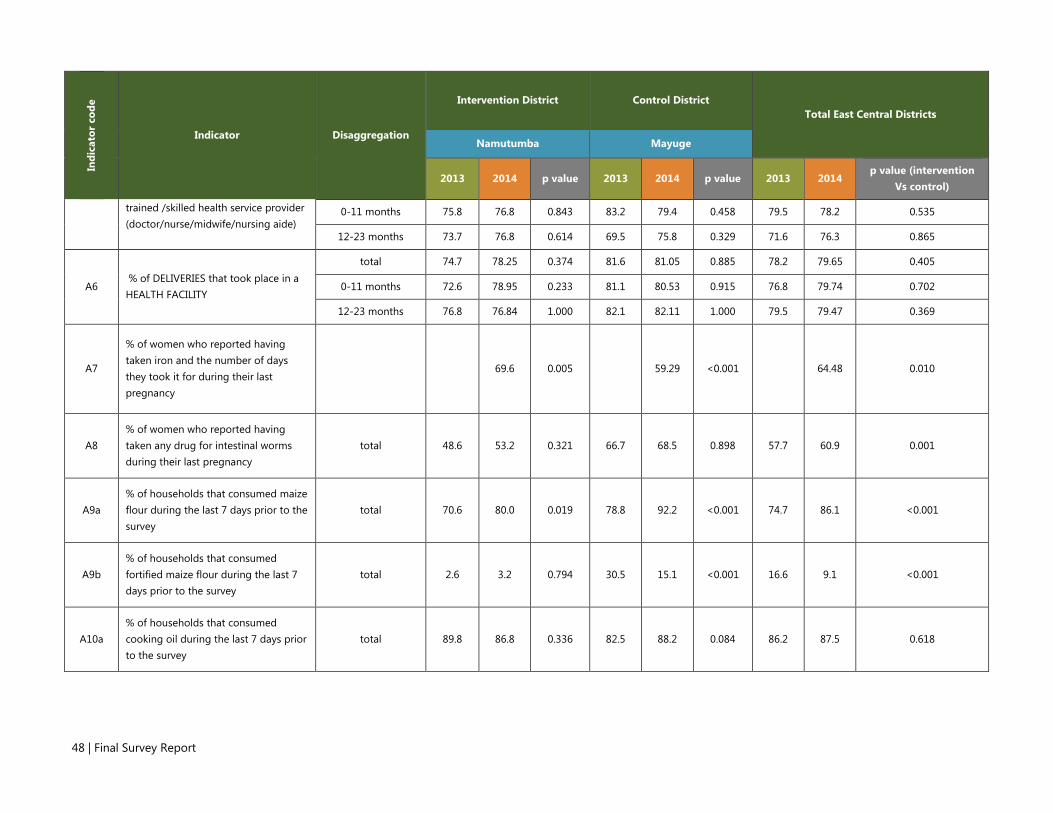
48 | Final Survey Report
Indi
cato
r co
de
Indicator Disaggregation
Intervention District Control District Total East Central Districts
Namutumba Mayuge
2013 2014 p value 2013 2014 p value 2013 2014 p value (intervention
Vs control)
trained /skilled health service provider (doctor/nurse/midwife/nursing aide)
0-11 months 75.8 76.8 0.843 83.2 79.4 0.458 79.5 78.2 0.535
12-23 months 73.7 76.8 0.614 69.5 75.8 0.329 71.6 76.3 0.865
A6 % of DELIVERIES that took place in a HEALTH FACILITY
total 74.7 78.25 0.374 81.6 81.05 0.885 78.2 79.65 0.405
0-11 months 72.6 78.95 0.233 81.1 80.53 0.915 76.8 79.74 0.702
12-23 months 76.8 76.84 1.000 82.1 82.11 1.000 79.5 79.47 0.369
A7
% of women who reported having taken iron and the number of days they took it for during their last pregnancy
69.6 0.005
59.29 <0.001
64.48 0.010
A8 % of women who reported having taken any drug for intestinal worms during their last pregnancy
total 48.6 53.2 0.321 66.7 68.5 0.898 57.7 60.9 0.001
A9a % of households that consumed maize flour during the last 7 days prior to the survey
total 70.6 80.0 0.019 78.8 92.2 <0.001 74.7 86.1 <0.001
A9b % of households that consumed fortified maize flour during the last 7 days prior to the survey
total 2.6 3.2 0.794 30.5 15.1 <0.001 16.6 9.1 <0.001
A10a % of households that consumed cooking oil during the last 7 days prior to the survey
total 89.8 86.8 0.336 82.5 88.2 0.084 86.2 87.5 0.618

Nutrition Indicators Results from Six Districts in South Western and East Central Uganda | 49
Indi
cato
r co
de
Indicator Disaggregation
Intervention District Control District Total East Central Districts
Namutumba Mayuge
2013 2014 p value 2013 2014 p value 2013 2014 p value (intervention
Vs control)
A10b % of households that consumed fortified cooking oil during the last 7 days prior to the survey
total 45.8 41.4 0.070 59.0 48.8 <0.001 52.4 45.1 <0.001
A11a % of households that consumed salt during the last 7 days prior to the survey
total 96.8 97.8 0.496 85.3 92.2 0.018 91.1 95.0 0.002
A11b % of households that consumed fortified salt during the last 7 days prior to the survey
total 73.7 64.2 <0.001 67.9 51.2 <0.001 70.8 57.7 <0.001

50 | Final Survey Report
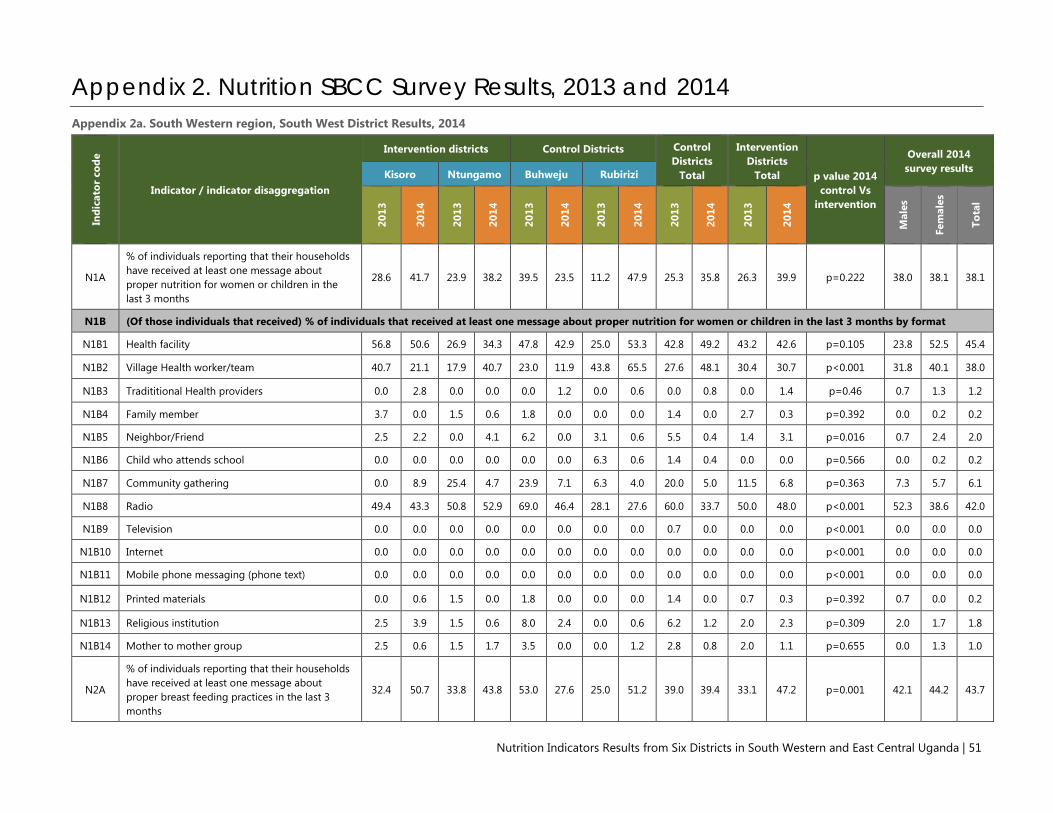
Nutrition Indicators Results from Six Districts in South Western and East Central Uganda | 51
Appendix 2. Nutrition SBCC Survey Results, 2013 and 2014 Appendix 2a. South Western region, South West District Results, 2014
Indi
cato
r co
de
Indicator / indicator disaggregation
Intervention districts Control Districts Control Districts
Total
Intervention Districts
Total p value 2014 control Vs
intervention
Overall 2014 survey results Kisoro Ntungamo Buhweju Rubirizi
2013
2014
2013
2014
2013
2014
2013
2014
2013
2014
2013
2014
Mal
es
Fem
ales
Tota
l
N1A
% of individuals reporting that their households have received at least one message about proper nutrition for women or children in the last 3 months
28.6 41.7 23.9 38.2 39.5 23.5 11.2 47.9 25.3 35.8 26.3 39.9 p=0.222 38.0 38.1 38.1
N1B (Of those individuals that received) % of individuals that received at least one message about proper nutrition for women or children in the last 3 months by format
N1B1 Health facility 56.8 50.6 26.9 34.3 47.8 42.9 25.0 53.3 42.8 49.2 43.2 42.6 p=0.105 23.8 52.5 45.4
N1B2 Village Health worker/team 40.7 21.1 17.9 40.7 23.0 11.9 43.8 65.5 27.6 48.1 30.4 30.7 p<0.001 31.8 40.1 38.0
N1B3 Tradititional Health providers 0.0 2.8 0.0 0.0 0.0 1.2 0.0 0.6 0.0 0.8 0.0 1.4 p=0.46 0.7 1.3 1.2
N1B4 Family member 3.7 0.0 1.5 0.6 1.8 0.0 0.0 0.0 1.4 0.0 2.7 0.3 p=0.392 0.0 0.2 0.2
N1B5 Neighbor/Friend 2.5 2.2 0.0 4.1 6.2 0.0 3.1 0.6 5.5 0.4 1.4 3.1 p=0.016 0.7 2.4 2.0
N1B6 Child who attends school 0.0 0.0 0.0 0.0 0.0 0.0 6.3 0.6 1.4 0.4 0.0 0.0 p=0.566 0.0 0.2 0.2
N1B7 Community gathering 0.0 8.9 25.4 4.7 23.9 7.1 6.3 4.0 20.0 5.0 11.5 6.8 p=0.363 7.3 5.7 6.1
N1B8 Radio 49.4 43.3 50.8 52.9 69.0 46.4 28.1 27.6 60.0 33.7 50.0 48.0 p<0.001 52.3 38.6 42.0
N1B9 Television 0.0 0.0 0.0 0.0 0.0 0.0 0.0 0.0 0.7 0.0 0.0 0.0 p<0.001 0.0 0.0 0.0
N1B10 Internet 0.0 0.0 0.0 0.0 0.0 0.0 0.0 0.0 0.0 0.0 0.0 0.0 p<0.001 0.0 0.0 0.0
N1B11 Mobile phone messaging (phone text) 0.0 0.0 0.0 0.0 0.0 0.0 0.0 0.0 0.0 0.0 0.0 0.0 p<0.001 0.0 0.0 0.0
N1B12 Printed materials 0.0 0.6 1.5 0.0 1.8 0.0 0.0 0.0 1.4 0.0 0.7 0.3 p=0.392 0.7 0.0 0.2
N1B13 Religious institution 2.5 3.9 1.5 0.6 8.0 2.4 0.0 0.6 6.2 1.2 2.0 2.3 p=0.309 2.0 1.7 1.8
N1B14 Mother to mother group 2.5 0.6 1.5 1.7 3.5 0.0 0.0 1.2 2.8 0.8 2.0 1.1 p=0.655 0.0 1.3 1.0
N2A
% of individuals reporting that their households have received at least one message about proper breast feeding practices in the last 3 months
32.4 50.7 33.8 43.8 53.0 27.6 25.0 51.2 39.0 39.4 33.1 47.2 p=0.001 42.1 44.2 43.7

52 | Final Survey Report
Indi
cato
r co
de
Indicator / indicator disaggregation
Intervention districts Control Districts Control Districts
Total
Intervention Districts
Total p value 2014 control Vs
intervention
Overall 2014 survey results Kisoro Ntungamo Buhweju Rubirizi
2013
2014
2013
2014
2013
2014
2013
2014
2013
2014
2013
2014
Mal
es
Fem
ales
Tota
l
N2B (Of those individuals that received) % of individuals reporting that their households have received at least one message about proper breast feeding practices in the last 3 months by format
N2B1 Health facility 70.7 53.9 31.6 49.5 54.0 65.0 50.0 64.2 52.7 64.5 50.8 51.8 p=0.001 44.4 60.9 57.0
N2B2 Village Health worker/team 44.6 19.2 12.6 40.4 16.5 15.0 11.1 64.2 14.7 47.0 28.3 29.3 p<0.001 37.9 36.1 36.5
N2B3 Tradititional Health providers 0.0 2.7 0.0 1.0 0.0 4.0 0.0 1.6 0.0 2.4 0.0 1.9 p=0.638 1.8 2.2 2.1
N2B4 Family member 3.3 0.5 0.0 0.5 4.0 1.0 0.0 0.0 2.7 0.4 1.6 0.5 p=0.793 0.0 0.6 0.4
N2B5 Neighbor/Friend 0.0 1.8 0.0 5.6 7.2 2.0 0.0 0.5 4.9 1.1 0.0 3.6 p=0.035 0.6 3.2 2.6
N2B6 Child who attends school 2.2 0.0 0.0 0.0 0.7 1.0 0.0 0.0 0.5 0.4 1.1 0.0 p=0.228 0.0 0.2 0.1
N2B7 Community gathering 1.1 7.8 20.0 2.0 19.1 15.0 4.2 3.7 14.3 7.7 10.7 5.0 p=0.152 13.6 3.7 6.1
N2B8 Radio 42.4 53.9 45.3 54.0 58.6 63.0 29.2
49.1 49.1 43.9 54.0 p=0.208 70.4 46.2 52.0
N2B9 Television 1.1 0.0 0.0 0.0 1.3 0.0 4.2 0.0 2.2 0.4 0.5 0.5 p=0.793 0.0 0.6 0.4
N2B10 Internet 0.0 0.0 0.0 0.0 0.0 0.0 0.0 0.0 0.0 0.0 0.0 0.0 p<0.001 0.0 0.0 0.0
N2B11 Mobile phone messaging (phone text) 0.0 0.0 1.1 0.0 0.0 0.0 0.0 0.0 0.0 0.0 0.5 0.0 p<0.001 0.0 0.0 0.0
N2B12 Printed materials 1.1 0.5 1.1 2.0 3.3 3.0 0.0 0.5 2.2 1.4 1.1 1.2 p=0.821 3.6 0.6 1.3
N2B13 Religious institution 1.1 3.2 1.1 0.5 1.3 3.0 0.0 1.6 0.9 2.1 1.1 1.9 p=0.872 1.8 2.1 2.0
N2B14 Mother to mother group 6.5 0.5 3.2 1.5 1.3 0.0 0.0 1.6 0.9 1.1 4.8 1.0 p=0.91 0.0 1.3 1.0
N2C (of those individuals that received) % of individuals reporting that their households have received at least one message about proper breast feeding practices and the particular messages they received in the last 3 months
N2C1 "Start breast feeding within one hour of delivery" 35.9 56.2 37.9 61.6 28.3 57.0 36.1 61.5 30.8 59.9 36.9 58.8 p=0.755 41.4 64.9 59.2
N2C2 "Giving colostrum/first milk to child" 22.8 31.1 6.3 19.2 15.1 27.0 31.9 30.0 20.5 28.9 14.4 25.7 p=0.338 21.9 28.6 27.0
N2C3 "Feeding only breast milk to children 0-6 months (exclusive breast feeding)"
40.2 51.1 67.4 56.1 70.4 46.0 72.2 40.6 71.0 42.5 54.0 53.5 p=0.004 43.8 50.7 49.0
N2C4 "continuing breast feeding through years" 30.4 25.6 19.0 27.8 36.2 14.0 6.9 17.7 26.8 16.4 24.6 26.6 p=0.001 23.1 22.2 22.4
N2C5 "Continuing breast feeding through one year for HIV+ women"
6.5 1.8 2.1 5.6 2.0 2.0 1.4 2.1 1.8 2.1 4.3 3.6 p=0.248 1.8 3.4 3.0

Nutrition Indicators Results from Six Districts in South Western and East Central Uganda | 53
Indi
cato
r co
de
Indicator / indicator disaggregation
Intervention districts Control Districts Control Districts
Total
Intervention Districts
Total p value 2014 control Vs
intervention
Overall 2014 survey results Kisoro Ntungamo Buhweju Rubirizi
2013
2014
2013
2014
2013
2014
2013
2014
2013
2014
2013
2014
Mal
es
Fem
ales
Tota
l
N2C6 "Avoid bottle feeding" 5.4 7.3 0.0 4.0 2.6 0.0 5.6 4.8 3.6 3.1 2.7 5.8 p=0.106 5.3 4.5 4.7
N2C7 "Breast feed child on demand" 13.0 13.7 12.6 14.1 19.7 3.0 37.5 21.4 25.5 15.0 12.8 13.9 p=0.69 14.8 14.2 14.4
N2C8 "Continuing breast feeding during illness" 1.1 6.9 3.2 14.7 2.6 4.0 2.8 8.0 2.7 6.6 2.1 10.6 p=0.073 10.1 8.6 9.0
N3A
% of individuals reporting that their households have received at least message about proper feeding for children 6 months or older in the last 3 months
34.9 41.7 33.5 40.0 49.3 23.5 18.5 44.0 33.9 33.8 34.2 40.8 p=0.004 36.2 38.1 37.6
N3B (Of those individuals that received) % of individuals reporting that their households have received at least one message about proper feeding for children 6 months or older in the last 3 months by format
N3B1 Health facility 65.3 58.3 26.9 56.7 45.7 55.3 49.1 66.9 46.6 62.9 46.6 57.5 p=0.187 49.0 63.0 59.7
N3B2 Village Health worker/team 48.0 22.8 8.6 38.9 17.1 16.5 30.2 69.4 20.7 51.0 28.8 30.8 p<0.001 38.6 39.1 39.0
N3B3 Tradititional Health providers 0.0 3.3 0.0 1.1 0.0 1.2 0.0 0.0 0.0 0.4 0.0 2.2 p=0.070 2.1 1.3 1.5
N3B4 Family member 7.1 0.0 0.0 0.0 1.4 1.2 0.0 1.9 1.0 1.6 3.7 0.0 p=0.015 0.7 0.7 0.7
N3B5 Neighbor/Friend 4.1 0.0 1.1 0.0 7.1 1.2 0.0 1.9 5.2 1.6 2.6 2.2 p=0.61 0.7 0.7 0.7
N3B6 Child who attends school 4.1 0.0 1.1 0.0 0.0 0.0 0.0 0.6 0.0 0.4 2.6 0.0 p=0.225 0.7 0.0 0.2
N3B7 Community gathering 2.0 5.0 23.7 1.7 25.0 15.3 1.9 2.5 18.7 6.9 12.6 3.3 p=0.042 4.8 4.8 4.8
N3B8 Radio 37.8 50.6 54.8 56.1 61.4 62.4 28.3 35.0 52.3 44.5 46.1 53.3 p=0.033 65.5 44.8 49.8
N3B9 Television 0.0 0.0 0.0 0.0 0.7 0.0 1.9 0.0 1.0 0.0 0.0 0.0 p<0.001 0.0 0.0 0.0
N3B10 Internet 0.0 0.0 0.0 0.0 0.0 0.0 0.0 0.0 0.0 0.0 0.0 0.0 p<0.001 0.0 0.0 0.0
N3B11 Mobile phone messaging (phone text) 0.0 0.0 0.0 0.0 0.0 0.0 0.0 0.6 0.0 0.4 0.0 0.0 p=0.225 0.0 0.2 0.2
N3B12 Printed materials 1.0 0.6 0.0 1,11 0.7 0.0 0.0 1.3 0.5 0.8 0.5 0.8 p=0.982 2.1 0.4 0.8
N3B13 Religious institution 3.1 2.8 2.2 0.6 4.3 9.4 0.0 0.6 3.1 3.7 2.6 1.7 p=0.119 3.5 2.2 2.5
N3B14 Mother to mother group 4.1 0.6 1.1 0.6 1.4 0.0 1.9 0.0 1.6 0.0 2.6 0.6 p=0.243 0.0 0.4 0.3

54 | Final Survey Report
Indi
cato
r co
de
Indicator / indicator disaggregation
Intervention districts Control Districts Control Districts
Total
Intervention Districts
Total p value 2014 control Vs
intervention
Overall 2014 survey results Kisoro Ntungamo Buhweju Rubirizi
2013
2014
2013
2014
2013
2014
2013
2014
2013
2014
2013
2014
Mal
es
Fem
ales
Tota
l
N3C (Of those individuals that recieved) % of individuals reporting that their households have received at least one messgae about proper feeding for children 6 months or older and the particular messages they received in the last 3 months
N3C1 "Introducing soild, semi-soild or soft foods at 6 months
66.3 87.2 69.9 76.1 73.6 68.2 66.0 74.4 71.5 72.2 68.1 81.7 p=0.006 71.0 80.0 77.9
N3C2 "Giving children foods from four diverse groups" 31.6 30.0 46.2 28.3 30.7 45.9 37.7 46.9 32.6 46.5 38.7 29.2 p<0.001 43.5 33.9 36.2
N3C3 "Feeding children on demand, multiple times a day"
20.4 19.4 17.2 43.9 24.3 23.5 32.1 40.0 26.4 34.3 18.9 31.7 p=0.500 28.3 34.1 32.7
N3C4 "Continuing to breast feed beyond six months with appropraite complementary foods"
23.5 19.4 29.0 43.9 37.9 23.5 34.0 40.0 36.8 32.7 26.2 34.4 p=0.647 28.3 34.1 32.7
N3C5 "continuing feeeding during illness 5.1 10.6 3.2 16.1 5.0 1.2 3.8 5.0 4.7 3.7 4.2 13.3 p<0.001 0.0 12.4 9.4
N3C6 "consumption of iron-rich or iron-fortified foods" 9.2 7.2 16.1 11.7 20.7 5.9 1.9 5.6 15.5 5.7 12.6 9.4 p=0.096 6.2 8.5 7.9
N3C7 "others" 0.0 0.0 0.0 0.0 0.0 0.0 0.0 0.0 0.0 0.0 0.0 0.0 p<0.001 0.0 0.0 0.0
N4A
% of individuals reporting that their households have received at least one message on deworming medications for children in the last 3 months
47.5 56.3 37.6 50.3 67.5 39.7 25.1 50.6 46.4 45.2 42.6 53.2 p=0.001 53.5 48.3 49.6
N4B (Of those individuals that received) % of individuals reporting that their househods have received at least one message on deworming medicatios for children in the last 3 months by format:
N4B1 Health facility 64.4 57.6 46.2 44.0 58.6 69.9 38.0 62.5 53.0 65.8 56.4 51.1 p<0.001 46.7 60.9 57.1
N4B2 Village Health worker/team 62.2 51.0 40.6 64.9 28.5 45.5 57.8 72.3 36.4 60.6 52.7 57.7 p=0.42 62.6 57.5 58.9
N4B3 Tradititional Health providers 0.0 2.1 0.9 1.8 0.0 0.7 0.0 0.5 0.0 0.6 0.4 1.9 p=0.119 1.9 1.2 1.4
N4B4 Family member 3.0 0.8 0.9 0.0 6.2 0.7 0.0 1.1 4.6 0.9 2.1 0.4 p=0.39 0.0 0.9 0.6
N4B5 Neighbor/Friend 3.0 0.8 0.0 3.1 7.3 0.7 1.4 1.1 5.7 0.9 1.7 1.9 p=0.252 0.9 1.7 1.5
N4B6 Child who attends school 10.4 1.7 9.4 0.4 8.8 1.4 0.0 1.6 6.4 1.5 10.0 1.3 p=0.566 3.3 0.5 1.3
N4B7 Community gathering 5.2 3.3 20.8 3.1 22.3 11.9 4.2 1.6 17.4 6.1 12.0 3.2 p=0.049 2.3 5.2 4.4
N4B8 Radio 31.1 36.2 23.6 38.2 52.3 41.3 22.5 34.2 44.3 37.3 27.8 37.2 p=0.970 49.1 32.9 37.2
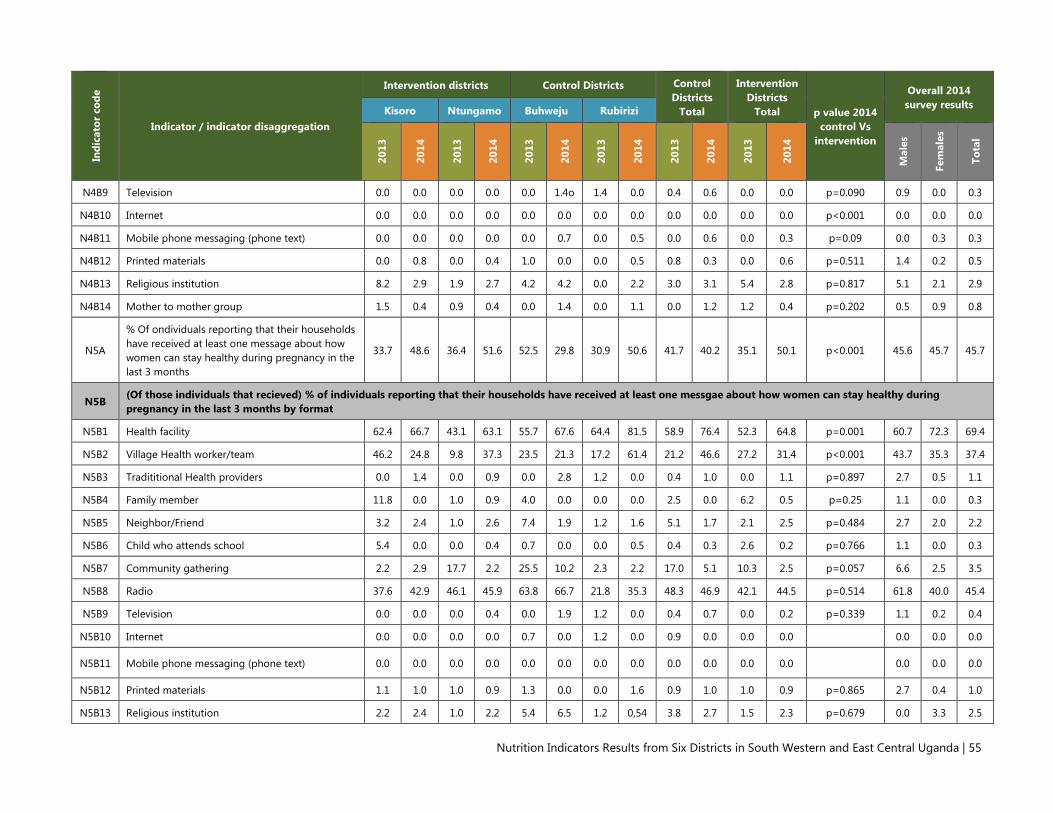
Nutrition Indicators Results from Six Districts in South Western and East Central Uganda | 55
Indi
cato
r co
de
Indicator / indicator disaggregation
Intervention districts Control Districts Control Districts
Total
Intervention Districts
Total p value 2014 control Vs
intervention
Overall 2014 survey results Kisoro Ntungamo Buhweju Rubirizi
2013
2014
2013
2014
2013
2014
2013
2014
2013
2014
2013
2014
Mal
es
Fem
ales
Tota
l
N4B9 Television 0.0 0.0 0.0 0.0 0.0 1.4o 1.4 0.0 0.4 0.6 0.0 0.0 p=0.090 0.9 0.0 0.3
N4B10 Internet 0.0 0.0 0.0 0.0 0.0 0.0 0.0 0.0 0.0 0.0 0.0 0.0 p<0.001 0.0 0.0 0.0
N4B11 Mobile phone messaging (phone text) 0.0 0.0 0.0 0.0 0.0 0.7 0.0 0.5 0.0 0.6 0.0 0.3 p=0.09 0.0 0.3 0.3
N4B12 Printed materials 0.0 0.8 0.0 0.4 1.0 0.0 0.0 0.5 0.8 0.3 0.0 0.6 p=0.511 1.4 0.2 0.5
N4B13 Religious institution 8.2 2.9 1.9 2.7 4.2 4.2 0.0 2.2 3.0 3.1 5.4 2.8 p=0.817 5.1 2.1 2.9
N4B14 Mother to mother group 1.5 0.4 0.9 0.4 0.0 1.4 0.0 1.1 0.0 1.2 1.2 0.4 p=0.202 0.5 0.9 0.8
N5A
% Of ondividuals reporting that their households have received at least one message about how women can stay healthy during pregnancy in the last 3 months
33.7 48.6 36.4 51.6 52.5 29.8 30.9 50.6 41.7 40.2 35.1 50.1 p<0.001 45.6 45.7 45.7
N5B (Of those individuals that recieved) % of individuals reporting that their households have received at least one messgae about how women can stay healthy during pregnancy in the last 3 months by format
N5B1 Health facility 62.4 66.7 43.1 63.1 55.7 67.6 64.4 81.5 58.9 76.4 52.3 64.8 p=0.001 60.7 72.3 69.4
N5B2 Village Health worker/team 46.2 24.8 9.8 37.3 23.5 21.3 17.2 61.4 21.2 46.6 27.2 31.4 p<0.001 43.7 35.3 37.4
N5B3 Tradititional Health providers 0.0 1.4 0.0 0.9 0.0 2.8 1.2 0.0 0.4 1.0 0.0 1.1 p=0.897 2.7 0.5 1.1
N5B4 Family member 11.8 0.0 1.0 0.9 4.0 0.0 0.0 0.0 2.5 0.0 6.2 0.5 p=0.25 1.1 0.0 0.3
N5B5 Neighbor/Friend 3.2 2.4 1.0 2.6 7.4 1.9 1.2 1.6 5.1 1.7 2.1 2.5 p=0.484 2.7 2.0 2.2
N5B6 Child who attends school 5.4 0.0 0.0 0.4 0.7 0.0 0.0 0.5 0.4 0.3 2.6 0.2 p=0.766 1.1 0.0 0.3
N5B7 Community gathering 2.2 2.9 17.7 2.2 25.5 10.2 2.3 2.2 17.0 5.1 10.3 2.5 p=0.057 6.6 2.5 3.5
N5B8 Radio 37.6 42.9 46.1 45.9 63.8 66.7 21.8 35.3 48.3 46.9 42.1 44.5 p=0.514 61.8 40.0 45.4
N5B9 Television 0.0 0.0 0.0 0.4 0.0 1.9 1.2 0.0 0.4 0.7 0.0 0.2 p=0.339 1.1 0.2 0.4
N5B10 Internet 0.0 0.0 0.0 0.0 0.7 0.0 1.2 0.0 0.9 0.0 0.0 0.0
0.0 0.0 0.0
N5B11 Mobile phone messaging (phone text) 0.0 0.0 0.0 0.0 0.0 0.0 0.0 0.0 0.0 0.0 0.0 0.0
0.0 0.0 0.0
N5B12 Printed materials 1.1 1.0 1.0 0.9 1.3 0.0 0.0 1.6 0.9 1.0 1.0 0.9 p=0.865 2.7 0.4 1.0
N5B13 Religious institution 2.2 2.4 1.0 2.2 5.4 6.5 1.2 0,54 3.8 2.7 1.5 2.3 p=0.679 0.0 3.3 2.5
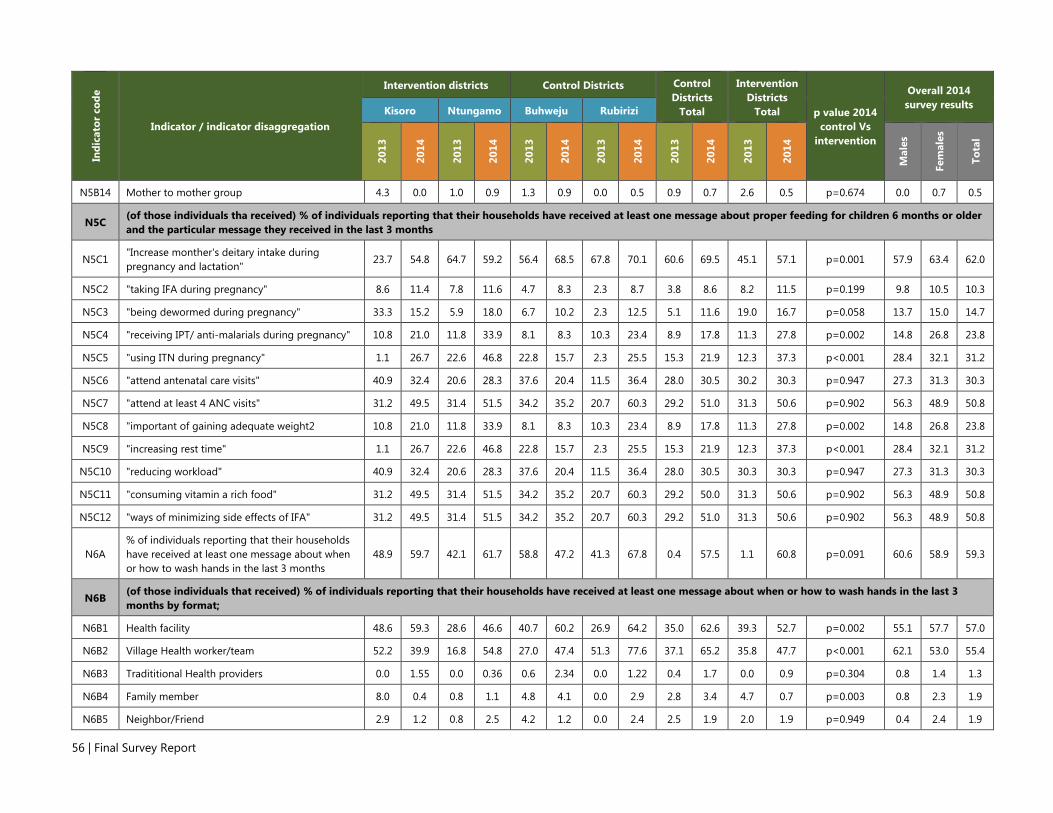
56 | Final Survey Report
Indi
cato
r co
de
Indicator / indicator disaggregation
Intervention districts Control Districts Control Districts
Total
Intervention Districts
Total p value 2014 control Vs
intervention
Overall 2014 survey results Kisoro Ntungamo Buhweju Rubirizi
2013
2014
2013
2014
2013
2014
2013
2014
2013
2014
2013
2014
Mal
es
Fem
ales
Tota
l
N5B14 Mother to mother group 4.3 0.0 1.0 0.9 1.3 0.9 0.0 0.5 0.9 0.7 2.6 0.5 p=0.674 0.0 0.7 0.5
N5C (of those individuals tha received) % of individuals reporting that their households have received at least one message about proper feeding for children 6 months or older and the particular message they received in the last 3 months
N5C1 "Increase monther's deitary intake during pregnancy and lactation"
23.7 54.8 64.7 59.2 56.4 68.5 67.8 70.1 60.6 69.5 45.1 57.1 p=0.001 57.9 63.4 62.0
N5C2 "taking IFA during pregnancy" 8.6 11.4 7.8 11.6 4.7 8.3 2.3 8.7 3.8 8.6 8.2 11.5 p=0.199 9.8 10.5 10.3
N5C3 "being dewormed during pregnancy" 33.3 15.2 5.9 18.0 6.7 10.2 2.3 12.5 5.1 11.6 19.0 16.7 p=0.058 13.7 15.0 14.7
N5C4 "receiving IPT/ anti-malarials during pregnancy" 10.8 21.0 11.8 33.9 8.1 8.3 10.3 23.4 8.9 17.8 11.3 27.8 p=0.002 14.8 26.8 23.8
N5C5 "using ITN during pregnancy" 1.1 26.7 22.6 46.8 22.8 15.7 2.3 25.5 15.3 21.9 12.3 37.3 p<0.001 28.4 32.1 31.2
N5C6 "attend antenatal care visits" 40.9 32.4 20.6 28.3 37.6 20.4 11.5 36.4 28.0 30.5 30.2 30.3 p=0.947 27.3 31.3 30.3
N5C7 "attend at least 4 ANC visits" 31.2 49.5 31.4 51.5 34.2 35.2 20.7 60.3 29.2 51.0 31.3 50.6 p=0.902 56.3 48.9 50.8
N5C8 "important of gaining adequate weight2 10.8 21.0 11.8 33.9 8.1 8.3 10.3 23.4 8.9 17.8 11.3 27.8 p=0.002 14.8 26.8 23.8
N5C9 "increasing rest time" 1.1 26.7 22.6 46.8 22.8 15.7 2.3 25.5 15.3 21.9 12.3 37.3 p<0.001 28.4 32.1 31.2
N5C10 "reducing workload" 40.9 32.4 20.6 28.3 37.6 20.4 11.5 36.4 28.0 30.5 30.3 30.3 p=0.947 27.3 31.3 30.3
N5C11 "consuming vitamin a rich food" 31.2 49.5 31.4 51.5 34.2 35.2 20.7 60.3 29.2 50.0 31.3 50.6 p=0.902 56.3 48.9 50.8
N5C12 "ways of minimizing side effects of IFA" 31.2 49.5 31.4 51.5 34.2 35.2 20.7 60.3 29.2 51.0 31.3 50.6 p=0.902 56.3 48.9 50.8
N6A % of individuals reporting that their households have received at least one message about when or how to wash hands in the last 3 months
48.9 59.7 42.1 61.7 58.8 47.2 41.3 67.8 0.4 57.5 1.1 60.8 p=0.091 60.6 58.9 59.3
N6B (of those individuals that received) % of individuals reporting that their households have received at least one message about when or how to wash hands in the last 3 months by format;
N6B1 Health facility 48.6 59.3 28.6 46.6 40.7 60.2 26.9 64.2 35.0 62.6 39.3 52.7 p=0.002 55.1 57.7 57.0
N6B2 Village Health worker/team 52.2 39.9 16.8 54.8 27.0 47.4 51.3 77.6 37.1 65.2 35.8 47.7 p<0.001 62.1 53.0 55.4
N6B3 Tradititional Health providers 0.0 1.55 0.0 0.36 0.6 2.34 0.0 1.22 0.4 1.7 0.0 0.9 p=0.304 0.8 1.4 1.3
N6B4 Family member 8.0 0.4 0.8 1.1 4.8 4.1 0.0 2.9 2.8 3.4 4.7 0.7 p=0.003 0.8 2.3 1.9
N6B5 Neighbor/Friend 2.9 1.2 0.8 2.5 4.2 1.2 0.0 2.4 2.5 1.9 2.0 1.9 p=0.949 0.4 2.4 1.9

Nutrition Indicators Results from Six Districts in South Western and East Central Uganda | 57
Indi
cato
r co
de
Indicator / indicator disaggregation
Intervention districts Control Districts Control Districts
Total
Intervention Districts
Total p value 2014 control Vs
intervention
Overall 2014 survey results Kisoro Ntungamo Buhweju Rubirizi
2013
2014
2013
2014
2013
2014
2013
2014
2013
2014
2013
2014
Mal
es
Fem
ales
Tota
l
N6B6 Child who attends school 5.8 1.2 1.7 0.7 9.0 3.5 0.0 2.0 5.2 2.6 3.9 0.9 p=0.042 0.8 2.0 1.7
N6B7 Community gathering 1.5 3.1 28.6 5.4 32.3 15.8 4.2 6.1 20.6 10.1 14.0 4.3 p<0.001 9.1 6.1 6.8
N6B8 Radio 44.2 47.7 45.4 55.2 59.9 56.1 31.1 35.0 47.9 43.7 44.8 51.6 p=0.015 55.1 45.7 48.1
N6B9 Television 0.0 0.0 0.0 0.4 0.0 0.6 0.0 0.0 0.0 0.2 0.0 0.2 p=0.858 0.4 0.1 0.2
N6B10 Internet 0.0 0.0 0.0 0.0 0.0 0.0 0.0 0.0 0.0 0.0 0.0 0.0
0.0 0.0 0.0
N6B11 Mobile phone messaging (phone text) 0.0 0.0 0.0 0.0 0.0 0.0 0.0 0.0 0.0 0.0 0.0 0.0
0.0 0.0 0.0
N6B12 Printed materials 0.0 0.4 0.0 0.4 1.8 0.0 0.0 0.8 1.1 0.5 0.0 0.4 p=0.799 1.7 0.0 0.4
N6B13 Religious institution 2.9 2.7 0.8 1.8 7.8 4.1 0.8 2.4 4.9 3.1 2.0 2.2 p=0.397 2.1 2.8 2.6
N6B14 Mother to mother group 0.7 0.0 0.0 0.4 1.8 0.0 0.0 0.4 1.1 0.2 0.4 0.2 p=0.858 0.0 0.3 0.2
N6C (of those individuals that received) % of individuals reporting that their households have received at least one message about when or how to wash hands and the particular messages they received in the last 3 months;
N6C1 "Wash hands properly before preparing food" 44.9 68.6 44.5 65.2 53.3 49.7 57.1 57.7 54.9 54.4 44.8 66.9 p<0.001 60.5 61.7 61.4
N6C2 "wash hands properly before feeding children 38.4 49.2 32.8 52.7 32.9 43.3 37.0 44.3 34.6 43.9 35.8 51.0 p=0.029 36.6 51.8 47.9
N6C3 "wash the child's hands before feeding" 23.2 36.4 24.4 40.5 22.8 30.4 32.8 32.9 26.9 31.9 23.7 38.6 p=0.033 30.0 37.6 35.6
N6C4 "wash hands after defecating/visiting the toilet 73.9 76.0 80.7 77.4 77.8 67.3 76.5 73.2 77.3 70.7 77.0 76.7 p=0.037 77.0 73.1 74.1
N6C5 "using soap when washing hands" 36.2 40.3 55.5 33.3 31.1 35.1 35.3 44.3 32.9 40.5 45.1 36.7 p=0.226 38.7 38.3 38.4
N6C6 "others" 0.0 0.0 0.0 0.0 0.0 0.0 0.0 0.0 0.0 0.0 0.0 0.0
0.0 0.0 0.0
N9 % of individuals who know when a new born should be put to breast after birth
68.3 76.4 89.0 86.2 67.4 64.2 74.6 84.3 71.0 74.3 78.7 81.4 p<0.001 64.7 82.7 78.2
N10 % of individuals who know what a woman who has just delivered should do with the first yellow breast milk
78.5 80.9 78.1 88.0 79.1 73.0 73.8 83.0 76.4 78.1 78.3 84.5 p<0.001 70.5 85.5 81.6
N11 % of individuals who know how long a woman should exclusively breast feed
62.9 75.0 83.7 81.5 78.8 73.0 71.5 82.6 12.0 77.8 13.6 78.3 p<0.001 71.5 80.3 78.1
Appendix 2b. East Central Region; Progress on SBCC indicators
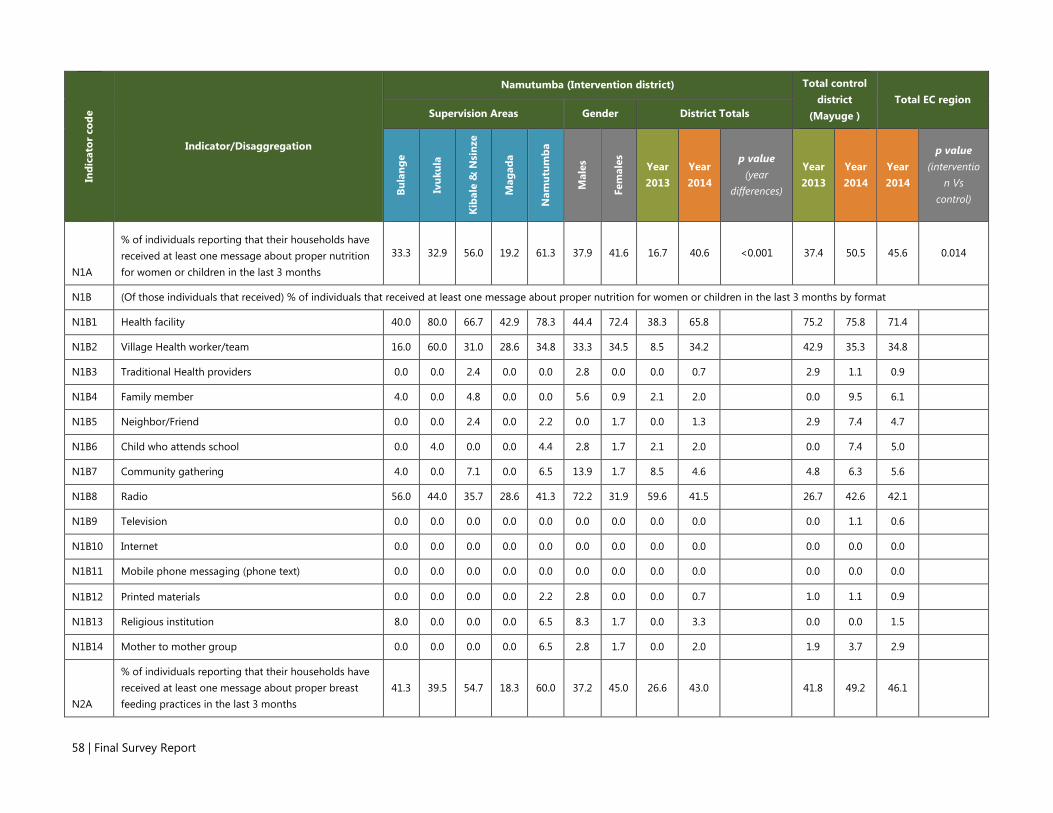
58 | Final Survey Report
Indi
cato
r co
de
Indicator/Disaggregation
Namutumba (Intervention district) Total control district
(Mayuge ) Total EC region
Supervision Areas Gender District Totals
Bula
nge
Ivuk
ula
Kiba
le &
Nsi
nze
Mag
ada
Nam
utum
ba
Mal
es
Fem
ales
Year 2013
Year 2014
p value (year
differences)
Year 2013
Year 2014
Year 2014
p value (interventio
n Vs control)
N1A
% of individuals reporting that their households have received at least one message about proper nutrition for women or children in the last 3 months
33.3 32.9 56.0 19.2 61.3 37.9 41.6 16.7 40.6 <0.001 37.4 50.5 45.6 0.014
N1B (Of those individuals that received) % of individuals that received at least one message about proper nutrition for women or children in the last 3 months by format
N1B1 Health facility 40.0 80.0 66.7 42.9 78.3 44.4 72.4 38.3 65.8 75.2 75.8 71.4
N1B2 Village Health worker/team 16.0 60.0 31.0 28.6 34.8 33.3 34.5 8.5 34.2 42.9 35.3 34.8
N1B3 Traditional Health providers 0.0 0.0 2.4 0.0 0.0 2.8 0.0 0.0 0.7 2.9 1.1 0.9
N1B4 Family member 4.0 0.0 4.8 0.0 0.0 5.6 0.9 2.1 2.0 0.0 9.5 6.1
N1B5 Neighbor/Friend 0.0 0.0 2.4 0.0 2.2 0.0 1.7 0.0 1.3 2.9 7.4 4.7
N1B6 Child who attends school 0.0 4.0 0.0 0.0 4.4 2.8 1.7 2.1 2.0 0.0 7.4 5.0
N1B7 Community gathering 4.0 0.0 7.1 0.0 6.5 13.9 1.7 8.5 4.6 4.8 6.3 5.6
N1B8 Radio 56.0 44.0 35.7 28.6 41.3 72.2 31.9 59.6 41.5 26.7 42.6 42.1
N1B9 Television 0.0 0.0 0.0 0.0 0.0 0.0 0.0 0.0 0.0 0.0 1.1 0.6
N1B10 Internet 0.0 0.0 0.0 0.0 0.0 0.0 0.0 0.0 0.0 0.0 0.0 0.0
N1B11 Mobile phone messaging (phone text) 0.0 0.0 0.0 0.0 0.0 0.0 0.0 0.0 0.0 0.0 0.0 0.0
N1B12 Printed materials 0.0 0.0 0.0 0.0 2.2 2.8 0.0 0.0 0.7 1.0 1.1 0.9
N1B13 Religious institution 8.0 0.0 0.0 0.0 6.5 8.3 1.7 0.0 3.3 0.0 0.0 1.5
N1B14 Mother to mother group 0.0 0.0 0.0 0.0 6.5 2.8 1.7 0.0 2.0 1.9 3.7 2.9
N2A
% of individuals reporting that their households have received at least one message about proper breast feeding practices in the last 3 months
41.3 39.5 54.7 18.3 60.0 37.2 45.0 26.6 43.0 41.8 49.2 46.1

Nutrition Indicators Results from Six Districts in South Western and East Central Uganda | 59
Indi
cato
r co
de
Indicator/Disaggregation
Namutumba (Intervention district) Total control district
(Mayuge ) Total EC region
Supervision Areas Gender District Totals
Bula
nge
Ivuk
ula
Kiba
le &
Nsi
nze
Mag
ada
Nam
utum
ba
Mal
es
Fem
ales
Year 2013
Year 2014
p value (year
differences)
Year 2013
Year 2014
Year 2014
p value (interventio
n Vs control)
N2B (Of those individuals that received) % of individuals reporting that their households have received at least one message about proper breast feeding practices in the last 3 months by format
N2B1 Health facility 51.6 93.3 85.4 61.5 86.7 68.6 81.6 58.7 78.8 74.4 78.1 78.4
N2B2 Village Health worker/team 12.9 63.3 22.0 38.5 33.3 37.1 31.2 12.0 32.5 45.3 39.3 36.2
N2B3 Traditional Health providers 0.0 0.0 4.9 0.0 0.0 2.9 0.8 0.0 1.3 2.6 1.1 1.2
N2B4 Family member 0.0 10.0 7.3 0.0 2.2 0.0 5.6 0.0 4.4 4.3 10.9 7.9
N2B5 Neighbor/Friend 3.2 0.0 2.4 0.0 2.2 0.0 2.4 0.0 1.9 3.4 9.3 5.8
N2B6 Child who attends school 0.0 0.0 0.0 0.0 0.0 0.0 0.0 0.0 0.0 0.9 3.3 1.8
N2B7 Community gathering 3.2 0.0 7.3 0.0 4.4 11.4 1.6 2.7 3.8 4.3 6.6 5.3
N2B8 Radio 54.8 56.7 31.7 23.1 33.3 60.0 35.2 50.7 40.6 31.6 47.5 44.3
N2B9 Television 3.2 3.3 0.0 0.0 0.0 2.9 0.8 0.0 1.3 2.6 1.6 1.5
N2B10 Internet 0.0 0.0 0.0 0.0 0.0 0.0 0.0 0.0 0.0 0.0 0.0 0.0
N2B11 Mobile phone messaging (phone text) 0.0 0.0 0.0 0.0 0.0 0.0 0.0 0.0 0.0 0.0 0.0 0.0
N2B12 Printed materials 9.7 0.0 0.0 0.0 6.7 11.4 1.6 1.3 3.8 3.4 1.6 2.6
N2B13 Religious institution 3.2 0.0 0.0 0.0 2.2 5.7 0.0 0.0 1.3 0.9 0.0 0.6
N2B14 Mother to mother group 0.0 0.0 0.0 0.0 6.7 2.9 1.6 0.0 1.9 3.4 4.4 3.2
(of those individuals that received) % of individuals reporting that their households have received at least one message about proper breast feeding practices and the particular messages they received in the last 3 months
N2C1 "Start breast feeding within one hour of delivery"
45.2 80.0 90.2 61.5 77.8 62.9 76.8 30.7 73.8 55.6 59.5 72.6
N2C2 "Giving colostrum/first milk to child" 19.4 40.0 24.4 23.1 46.7 31.4 32.8 8.0 32.5 21.4 41.0 37.0

60 | Final Survey Report
Indi
cato
r co
de
Indicator/Disaggregation
Namutumba (Intervention district) Total control district
(Mayuge ) Total EC region
Supervision Areas Gender District Totals
Bula
nge
Ivuk
ula
Kiba
le &
Nsi
nze
Mag
ada
Nam
utum
ba
Mal
es
Fem
ales
Year 2013
Year 2014
p value (year
differences)
Year 2013
Year 2014
Year 2014
p value (interventio
n Vs control)
N2C3 "Feeding only breast milk to children 0-6 months (exclusive breast feeding)"
38.7 53.3 39.0 38.5 77.8 45.7 54.4 61.3 52.5 69.2 70.0 61.8
N2C4 "continuing breast feeding through years"
12.9 16.7 7.3 23.1 31.1 17.1 18.4 18.7 18.1 18.0 24.0 21.3
N2C5 "Continuing breast feeding through one year for HIV+ women"
6.5 10.0 2.4 0.0 2.2 2.9 4.8 0.0 4.4 0.0 8.2 6.4
N2C6 "Avoid bottle feeding" 16.1 3.3 19.5 15.4 2.2 14.3 9.6 6.7 10.6 8.6 16.9 10.6
N2C7 "Breast feed child on demand" 0.0 13.3 24.4 0.0 13.3 2.9 15.2 20.0 12.5 0.9 9.8 11.1
N2C8 "Continuing breast feeding during illness"
6.5 0.0 4.9 0.0 4.4 2.9 4.0 2.7 3.8 5.1 10.4 7.3
N3A
% of individuals reporting that their households have received at least message about proper feeding for children 6 months or older in the last 3 months
36.0 39.5 52.0 19.2 61.6 32.6 44.8 29.5 41.7 <0.001 41.2 50.5 46.1 0.078
N3B (Of those individuals that received) % of individuals reporting that their households have received at least one message about proper feeding for children 6 months or older in the last 3 months by format
N3B1 Health facility 55.6 #### 79.5 50.0 86.7 77.4 79.0 49.4 78.7 70.4 78.7 78.7
N3B2 Village Health worker/team 22.2 53.3 23.1 35.7 37.8 48.4 30.7 20.5 34.2 42.6 36.7 35.2
N3B3 Tradititional Health providers 0.0 0.0 0.0 0.0 0.0 0.0 0.0 0.0 0.0 1.7 0.5 0.3
N3B4 Family member 0.0 3.3 2.6 0.0 2.2 0.0 2.4 2.4 1.9 0.9 11.7 7.3
N3B5 Neighbor/Friend 0.0 0.0 0.0 0.0 2.2 0.0 0.7 0.0 8.5 0.7
N3B6 Child who attends school 0.0 0.0 2.6 0.0 0.0 0.0 0.8 0.0 0.7 1.7 5.9 3.5

Nutrition Indicators Results from Six Districts in South Western and East Central Uganda | 61
Indi
cato
r co
de
Indicator/Disaggregation
Namutumba (Intervention district) Total control district
(Mayuge ) Total EC region
Supervision Areas Gender District Totals
Bula
nge
Ivuk
ula
Kiba
le &
Nsi
nze
Mag
ada
Nam
utum
ba
Mal
es
Fem
ales
Year 2013
Year 2014
p value (year
differences)
Year 2013
Year 2014
Year 2014
p value (interventio
n Vs control)
N3B7 Community gathering 7.4 0.0 2.6 0.0 6.7 12.9 1.6 1.2 3.9 3.5 4.8 4.4
N3B8 Radio 33.3 60.0 25.6 14.3 37.8 54.8 31.5 49.4 36.1 40.0 44.2 40.5
N3B9 Television 0.0 0.0 0.0 0.0 0.0 0.0 0.0 0.0 0.0 2.6 0.0 0.0
N3B10 Internet 0.0 0.0 0.0 0.0 0.0 0.0 0.0 0.0 0.0 1.7 0.0 0.0
N3B11 Mobile phone messaging (phone text) 0.0 0.0 0.0 0.0 0.0 0.0 0.0 0.0 0.0 0.0 0.0 0.0
N3B12 Printed materials 0.0 0.0 0.0 0.0 2.2 0.0 0.8 0.0 0.7 0.9 2.1 1.5
N3B13 Religious institution 3.7 0.0 0.0 0.0 2.2 3.2 0.8 0.0 1.3 0.0 0.5 0.9
N3B14 Mother to mother group 0.0 0.0 0.0 0.0 4.4 0.0 1.6 0.0 1.3 0.9 2.7 2.0
N3C (Of those individuals that recieved) % of individuals reporting that their households have received at least one messgae about proper feeding for children 6 months or older and the particular messages they received in the last 3 months
N3C1 "Introducing soild, semi-soild or soft foods at 6 months
59.3 96.7 92.3 57.1 80.0 67.7 83.9 72.3 80.7 76.5 79.8 80.2
N3C2 "Giving children foods from four diverse groups"
18.5 26.5 10.3 35.7 28.9 32.3 20.2 1.2 22.6 44.4 29.3 26.2
N3C3 "Feeding children on demand, multiple times a day"
18.5 60.0 23.1 0.0 37.8 29.0 32.3 12.1 31.6 13.9 41.0 36.7
N3C4
"Continuing to breast feed beyond six months with appropraite complementary foods"
11.1 36.7 28.2 14.3 55.6 34.9 33.6 21.7 39.4 36.7
N3C5 "continuing feeeding during illness 18.5 3.3 7.7 7.1 8.9 3.2 10.5 1.2 9.0 1.7 12.8 11.1
N3C6 "consumption of iron-rich or iron-fortified foods"
14.8 3.3 7.7 14.3 8.9 6.5 9.7 2.4 9.0 4.4 21.3 15.7
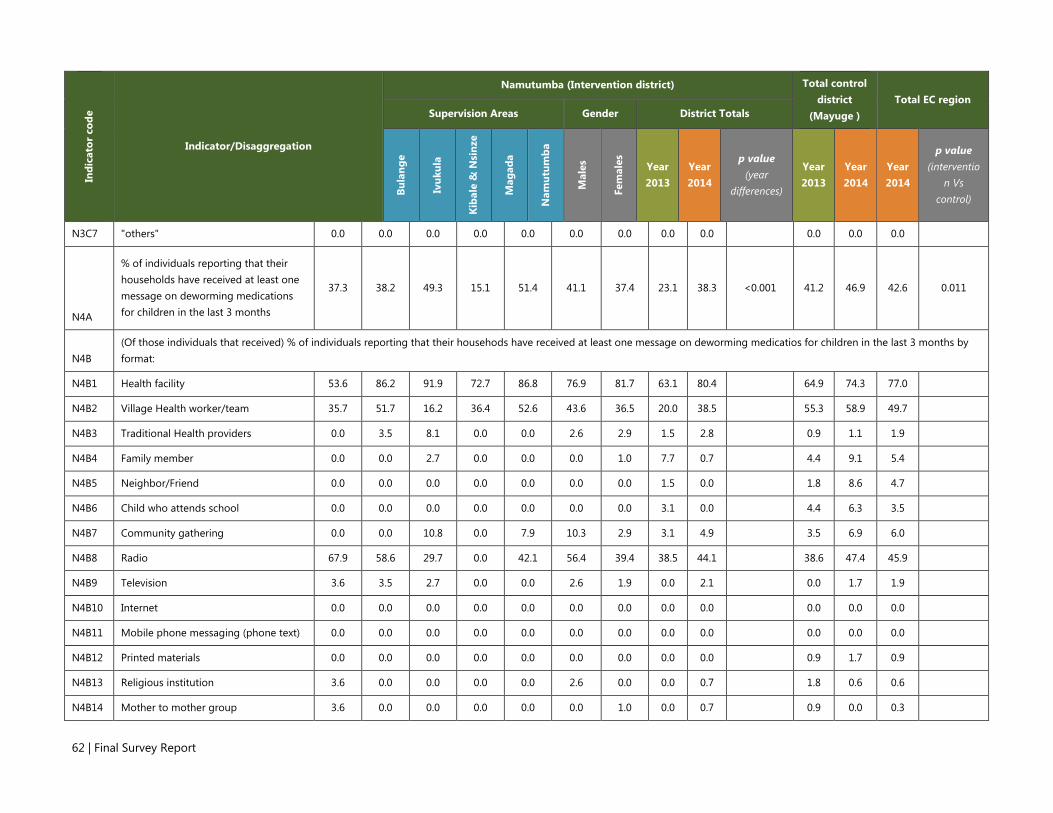
62 | Final Survey Report
Indi
cato
r co
de
Indicator/Disaggregation
Namutumba (Intervention district) Total control district
(Mayuge ) Total EC region
Supervision Areas Gender District Totals
Bula
nge
Ivuk
ula
Kiba
le &
Nsi
nze
Mag
ada
Nam
utum
ba
Mal
es
Fem
ales
Year 2013
Year 2014
p value (year
differences)
Year 2013
Year 2014
Year 2014
p value (interventio
n Vs control)
N3C7 "others" 0.0 0.0 0.0 0.0 0.0 0.0 0.0 0.0 0.0 0.0 0.0 0.0
N4A
% of individuals reporting that their households have received at least one message on deworming medications for children in the last 3 months
37.3 38.2 49.3 15.1 51.4 41.1 37.4 23.1 38.3 <0.001 41.2 46.9 42.6 0.011
N4B (Of those individuals that received) % of individuals reporting that their househods have received at least one message on deworming medicatios for children in the last 3 months by format:
N4B1 Health facility 53.6 86.2 91.9 72.7 86.8 76.9 81.7 63.1 80.4 64.9 74.3 77.0
N4B2 Village Health worker/team 35.7 51.7 16.2 36.4 52.6 43.6 36.5 20.0 38.5 55.3 58.9 49.7
N4B3 Traditional Health providers 0.0 3.5 8.1 0.0 0.0 2.6 2.9 1.5 2.8 0.9 1.1 1.9
N4B4 Family member 0.0 0.0 2.7 0.0 0.0 0.0 1.0 7.7 0.7 4.4 9.1 5.4
N4B5 Neighbor/Friend 0.0 0.0 0.0 0.0 0.0 0.0 0.0 1.5 0.0 1.8 8.6 4.7
N4B6 Child who attends school 0.0 0.0 0.0 0.0 0.0 0.0 0.0 3.1 0.0 4.4 6.3 3.5
N4B7 Community gathering 0.0 0.0 10.8 0.0 7.9 10.3 2.9 3.1 4.9 3.5 6.9 6.0
N4B8 Radio 67.9 58.6 29.7 0.0 42.1 56.4 39.4 38.5 44.1 38.6 47.4 45.9
N4B9 Television 3.6 3.5 2.7 0.0 0.0 2.6 1.9 0.0 2.1 0.0 1.7 1.9
N4B10 Internet 0.0 0.0 0.0 0.0 0.0 0.0 0.0 0.0 0.0 0.0 0.0 0.0
N4B11 Mobile phone messaging (phone text) 0.0 0.0 0.0 0.0 0.0 0.0 0.0 0.0 0.0 0.0 0.0 0.0
N4B12 Printed materials 0.0 0.0 0.0 0.0 0.0 0.0 0.0 0.0 0.0 0.9 1.7 0.9
N4B13 Religious institution 3.6 0.0 0.0 0.0 0.0 2.6 0.0 0.0 0.7 1.8 0.6 0.6
N4B14 Mother to mother group 3.6 0.0 0.0 0.0 0.0 0.0 1.0 0.0 0.7 0.9 0.0 0.3

Nutrition Indicators Results from Six Districts in South Western and East Central Uganda | 63
Indi
cato
r co
de
Indicator/Disaggregation
Namutumba (Intervention district) Total control district
(Mayuge ) Total EC region
Supervision Areas Gender District Totals
Bula
nge
Ivuk
ula
Kiba
le &
Nsi
nze
Mag
ada
Nam
utum
ba
Mal
es
Fem
ales
Year 2013
Year 2014
p value (year
differences)
Year 2013
Year 2014
Year 2014
p value (interventio
n Vs control)
N5A
% Of individuals reporting that their households have received at least one message about how women can stay healthy during pregnancy in the last 3 months
21.3 36.5 41.9 12.3 67.1 33.0 36.7 20.9 35.8 <0.001 37.6 39.6 37.6 0.260
N5B (Of those individuals that recieved) % of individuals reporting that their households have received at least one messgae about how women can stay healthy during pregnancy in the last 3 months by format
N5B1 Health facility 68.8 92.6 87.1 77.8 85.7 77.4 87.1 60.3 84.9 71.8 85.9 85.4
N5B2 Village Health worker/team 6.3 48.2 9.7 11.1 36.7 38.7 23.8 10.3 27.3 39.8 47.2 37.6
N5B3 Tradititional Health providers 0.0 0.0 0.0 0.0 0.0 0.0 0.0 1.7 0.0 1.0 0.7 0.4
N5B4 Family member 0.0 3.7 6.5 0.0 0.0 3.2 2.0 1.7 2.3 2.9 8.5 5.5
N5B5 Neighbor/Friend 0.0 0.0 3.2 0.0 0.0 0.0 1.0 0.0 0.8 3.9 12.0 6.6
N5B6 Child who attends school 0.0 0.0 0.0 0.0 0.0 0.0 0.0 1.7 0.0 1.9 2.8 1.5
N5B7 Community gathering 0.0 3.7 12.9 0.0 6.1 16.1 3.0 6.9 6.1 2.9 4.2 5.1
N5B8 Radio 43.8 55.6 38.7 33.3 42.9 64.5 37.6 48.3 43.9 31.1 45.1 44.5
N5B9 Television 0.0 0.0 0.0 0.0 2.0 0.0 1.0 1.7 0.8 1.9 0.0 0.4
N5B10 Internet 0.0 0.0 0.0 0.0 0.0 0.0 0.0 0.0 0.0 0.0 0.0 0.0
N5B11 Mobile phone messaging (phone text) 0.0 0.0 0.0 0.0 0.0 0.0 0.0 0.0 0.0 0.0 0.0 0.0
N5B12 Printed materials 0.0 0.0 0.0 0.0 0.0 0.0 0.0 0.0 0.0 2.9 2.1 1.5
N5B13 Religious institution 6.3 0.0 0.0 0.0 2.0 0.0 2.0 0.0 1.5 0.0 0.0 0.7
N5B14 Mother to mother group 0.0 0.0 0.0 0.0 4.1 3.2 1.0 1.7 1.5 0.0 3.5 2.6
N5C (of those individuals tha received) % of individuals reporting that their households have received at least one message about proper feeding for children 6 months or older and the

64 | Final Survey Report
Indi
cato
r co
de
Indicator/Disaggregation
Namutumba (Intervention district) Total control district
(Mayuge ) Total EC region
Supervision Areas Gender District Totals
Bula
nge
Ivuk
ula
Kiba
le &
Nsi
nze
Mag
ada
Nam
utum
ba
Mal
es
Fem
ales
Year 2013
Year 2014
p value (year
differences)
Year 2013
Year 2014
Year 2014
p value (interventio
n Vs control)
particular message they received in the last 3 months
N5C1 "Increase monther's deitary intake during pregnancy and lactation"
31.3 66.7 58.1 44.4 59.2 54.8 56.4 37.9 56.1 53.4 66.9 61.7
N5C2 "taking IFA during pregnancy" 12.5 0.0 3.2 11.1 4.1 6.5 4.0 3.5 4.6 14.6 25.4 15.3
N5C3 "being dewormed during pregnancy" 18.8 29.6 6.5 22.2 28.6 22.6 21.8 12.1 22.0 26.2 41.6 32.1
N5C4 "receiving IPT/ anti-malarials during pregnancy"
25.0 37.0 19.4 11.1 40.8 32.3 30.7 32.8 31.1 24.3 45.1 38.3
N5C5 "using ITN during pregnancy" 0.0 44.4 58.1 33.3 34.7 29.0 40.6 31.0 37.9 22.3 26.8 37.2
N5C6 "attend antenatal care visits" 12.5 11.1 6.5 11.1 42.9 19.4 22.8 34.5 22.0 13.6 28.2 25.2
N5C7 "attend at least 4 ANC visits" 18.8 55.6 58.1 33.3 49.0 35.5 51.5 36.2 47.7 34.0 50.7 49.3
N5C8 "important of gaining adequate weight2
25.0 37.0 19.4 11.1 40.8 32.3 30.7 32.8 31.1 24.3 45.1 38.3
N5C9 "increasing rest time" 0.0 44.4 58.1 33.3 34.7 29.0 40.6 31.0 37.9 22.3 36.6 37.2
N5C10 "reducing workload" 12.5 11.1 6.5 11.1 42.9 19.4 22.8 34.5 22.0 13.6 28.2 25.2
N5C11 "consuming vitamin a rich food" 18.8 55.6 58.1 33.3 49.0 35.5 51.5 36.2 47.7 34.0 50.7 49.3
N5C12 "ways of minimizing side effects of IFA" 18.8 55.6 58.1 33.3 49.0 35.5 51.5 36.2 47.7 34.0 50.7 49.3
N6A
% of individuals reporting that their households have received at least one message about when or how to wash hands in the last 3 months
58.7 45.3 58.7 65.3 67.6 68.8 55.8 44.3 59.0 <0.001 40.8 54.6 56.8 0.303
N6B (of those individuals that received) % of individuals reporting that their households have received at least one message about when or how to wash hands in the last 3 months by format;
N6B1 Health facility 52.3 91.2 81.8 36.2 78.0 62.5 68.4 50.0 66.7 51.3 77.3 69.4

Nutrition Indicators Results from Six Districts in South Western and East Central Uganda | 65
Indi
cato
r co
de
Indicator/Disaggregation
Namutumba (Intervention district) Total control district
(Mayuge ) Total EC region
Supervision Areas Gender District Totals
Bula
nge
Ivuk
ula
Kiba
le &
Nsi
nze
Mag
ada
Nam
utum
ba
Mal
es
Fem
ales
Year 2013
Year 2014
p value (year
differences)
Year 2013
Year 2014
Year 2014
p value (interventio
n Vs control)
N6B2 Village Health worker/team 47.7 55.9 25.0 31.9 42.0 40.6 39.4 27.4 39.4 51.3 53.5 46.3
N6B3 Traditional Health providers 0.0 2.9 4.6 4.3 0.0 4.7 1.3 0.8 2.3 1.8 1.5 2.0
N6B4 Family member 2.3 11.8 20.5 4.3 12.0 10.9 9.7 2.4 10.1 4.4 10.9 10.5
N6B5 Neighbor/Friend 2.3 0.0 2.3 2.1 4.0 3.1 1.9 0.0 2.3 3.5 7.9 5.0
N6B6 Child who attends school 4.6 0.0 2.3 4.3 8.0 9.4 1.9 0.8 4.1 3.5 11.4 7.6
N6B7 Community gathering 2.3 0.0 9.1 2.1 10.0 10.9 2.6 4.0 5.0 5.3 6.9 5.9
N6B8 Radio 77.2 47.1 45.5 14.9 42.0 53.1 41.3 61.3 44.8 47.8 54.5 49.4
N6B9 Television 0.0 0.0 2.3 0.0 2.0 0.0 1.3 0.8 0.9 5.3 2.0 1.4
N6B10 Internet 0.0 0.0 0.0 0.0 2.0 1.6 0.0 0.0 0.5 1.8 0.0 0.2
N6B11 Mobile phone messaging (phone text) 0.0 0.0 0.0 0.0 0.0 0.0 0.0 0.0 0.0 1.8 0.0 0.0
N6B12 Printed materials 4.6 0.0 0.0 0.0 0.0 1.6 0.7 0.0 0.9 1.8 2.0 1.4
N6B13 Religious institution 2.3 0.0 0.0 0.0 0.0 1.6 0.0 0.0 0.5 0.9 0.5 0.5
N6B14 Mother to mother group 2.3 0.0 0.0 0.0 2.0 0.0 1.3 0.0 0.9 3.5 0.5 0.7
N6C (of those individuals that received) % of individuals reporting that their households have received at least one message about when or how to wash hands and the particular messages they received in the last 3 months;
N6C1 "Wash hands properly before preparing food"
54.6 61.8 65.9 29.8 48.0 45.3 53.6 25.0 51.1 44.3 65.8 58.2
N6C2 "wash hands properly before feeding children
22.7 41.2 36.4 59.6 64.0 29.7 52.3 38.7 45.7 46.9 50.0 47.7
N6C3 "wash the child's hands before feeding" 29.6 32.4 29.6 38.3 60.0 45.3 36.1 36.3 38.8 49.6 34.2 36.6
N6C4 "wash hands after defecating/visiting 68.2 76.5 68.2 53.2 80.0 64.1 71.0 83.9 69.0 46.0 67.3 68.2
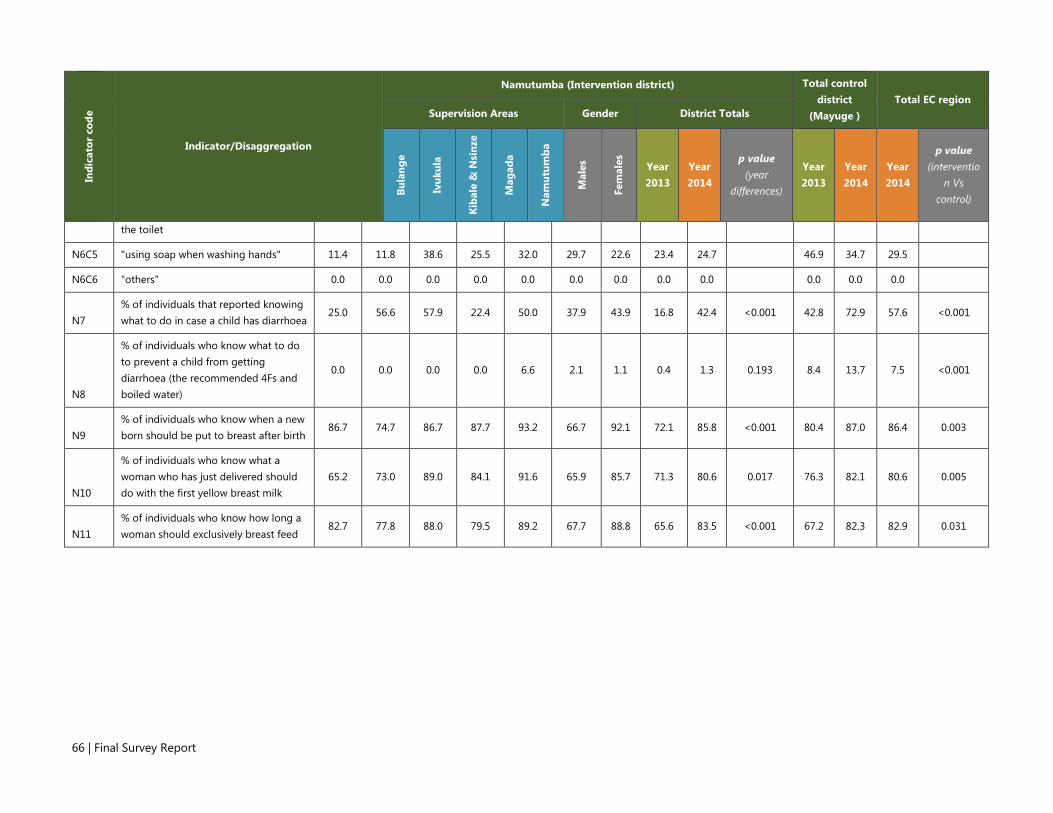
66 | Final Survey Report
Indi
cato
r co
de
Indicator/Disaggregation
Namutumba (Intervention district) Total control district
(Mayuge ) Total EC region
Supervision Areas Gender District Totals
Bula
nge
Ivuk
ula
Kiba
le &
Nsi
nze
Mag
ada
Nam
utum
ba
Mal
es
Fem
ales
Year 2013
Year 2014
p value (year
differences)
Year 2013
Year 2014
Year 2014
p value (interventio
n Vs control)
the toilet
N6C5 "using soap when washing hands" 11.4 11.8 38.6 25.5 32.0 29.7 22.6 23.4 24.7 46.9 34.7 29.5
N6C6 "others" 0.0 0.0 0.0 0.0 0.0 0.0 0.0 0.0 0.0 0.0 0.0 0.0
N7 % of individuals that reported knowing what to do in case a child has diarrhoea
25.0 56.6 57.9 22.4 50.0 37.9 43.9 16.8 42.4 <0.001 42.8 72.9 57.6 <0.001
N8
% of individuals who know what to do to prevent a child from getting diarrhoea (the recommended 4Fs and boiled water)
0.0 0.0 0.0 0.0 6.6 2.1 1.1 0.4 1.3 0.193 8.4 13.7 7.5 <0.001
N9 % of individuals who know when a new born should be put to breast after birth
86.7 74.7 86.7 87.7 93.2 66.7 92.1 72.1 85.8 <0.001 80.4 87.0 86.4 0.003
N10
% of individuals who know what a woman who has just delivered should do with the first yellow breast milk
65.2 73.0 89.0 84.1 91.6 65.9 85.7 71.3 80.6 0.017 76.3 82.1 80.6 0.005
N11 % of individuals who know how long a woman should exclusively breast feed
82.7 77.8 88.0 79.5 89.2 67.7 88.8 65.6 83.5 <0.001 67.2 82.3 82.9 0.031


SPRING JSI Research & Training Institute, Inc. 1616 Fort Myer Drive, 16th Floor ○ Arlington, VA 22209 ○ USA Phone: 703-528-7474 Fax: 703-528-7480 Email: [email protected] Internet: www.spring-nutrition.org
JSI Research & Training Institute, Inc. ○ Helen Keller International ○
The International Food Policy Research Institute ○ Save the Children ○ The Manoff Group


