1 Final Technical Report Project title: Lamont Cooperative Seismographic Network and the Advanced National Seismic System: Earthquake Hazards Studies in the Northeastern United States USGS Cooperative Agreement number: G10AC00094 Principal Investigator: Won-Young Kim Lamont-Doherty Earth Observatory of Columbia University 61 Route 9W, PO Box 1000 Palisades, NY 10964 Phone 845-365-8387, Fax: 845-365-8150 Email Address: [email protected]Project Web Site: http://www.ldeo.columbia.edu/LCSN Term covered by this report: February 1, 2010 – January 31, 2015
Transcript
1
Final Technical Report Project title: Lamont Cooperative Seismographic Network and the Advanced National Seismic
System: Earthquake Hazards Studies in the Northeastern United States USGS Cooperative Agreement number: G10AC00094 Principal Investigator: Won-Young Kim Lamont-Doherty Earth Observatory of Columbia University 61 Route 9W, PO Box 1000 Palisades, NY 10964 Phone 845-365-8387, Fax: 845-365-8150 Email Address: [email protected] Project Web Site: http://www.ldeo.columbia.edu/LCSN Term covered by this report: February 1, 2010 – January 31, 2015
2
THE LAMONT COOPERATIVE SEISMOGRAPHIC NETWORK AND THE ADVANCED NATIONAL SEISMIC SYSTEM: EARTHQUAKE HAZARD STUDIES IN THE NORTHEASTERN UNITED STATES. USGS Cooperative Agreement Number: G10AC00094 Won-Young Kim Lamont-Doherty Earth Observatory of Columbia University Palisades, NY 10964
Abstract
The operation of the Lamont Cooperative Seismographic Network (LCSN) to monitor earthquakes in the northeastern United States is supported under this award. The goal is to compile a complete earthquake catalog for this region to assess the earthquake hazards correctly, and to understand the causes of the earthquakes in the Northeast. LCSN currently operates 35 broadband stations in the Northeastern U.S. due to its successful cooperative approach to develop, modernize and expand a regional seismic network in the Northeast in the past 15 years. It covers Connecticut, Delaware, Maryland, New Hampshire, New Jersey, New York, Pennsylvania, and Vermont. Accelerographic stations are also deployed around metropolitan New York City as part of the ANSS urban ground motion network. During February 2010 through January 2015, scientists and staff at the Lamont-Doherty Earth Observatory of Columbia University (LDEO) satisfactorily carried out three main objectives of the project: 1) continued seismic monitoring for improved delineation and evaluation of hazards associated with earthquakes in the Northeastern United States, 2) improved real-time data exchange between regional networks and the NEIC for development of an Advanced National Seismic System (ANSS) and expanded earthquake reporting capabilities, and 3) promoted effective dissemination of earthquake data and information products.
Seismographic stations were upgraded during 2009-2011 through the support of the American Reinvestment and Recovery Act of 2009 (ARRA). New instruments, notably the digital recorders with Ethernet communication protocol, allow remote control of seismometers that improved greatly the quality of seismic data, and allow higher sample rate recordings. LCSN is furnished with a fully functioning ANSS Quake Monitoring System (AQMS) since the fall of 2011 as a Tier 1 regional seismic network of ANSS. LCSN detects and locates earthquakes in automatic fashion using AQMS, and produces hypocenter and magnitude in near-real time and sends earthquake alarm message to NEIC and other interested parties using PDL. ShakeMaps and focal mechanisms are also generated in near-real time. Since the fall of 2013, seismic data from 150 Transportable Array (TA) stations of the EarthScope program in the Central & Eastern U.S. are available for earthquake monitoring in the Northeast, and hence, the AQMS at Lamont functions very well with fairly good station coverage. This development presents us with an unprecedented opportunity to perform regional earthquake monitoring at the highest level. As only 56 TA stations will be retained after FY15, we plan to calibrate Earthworm modules in AQMS with fewer TA stations during FY15.
The LCSN is unusual in using a variety of station operators (college & university faculty, secondary school teachers, museums, etc.) to engage a wide variety of audiences and to reach out to large numbers of the general public. It also provides professional development and improved awareness among station operators who are not professional seismologists. About half of the broadband station operators and stations belong to each participating organization. Hence, a large portion of the operation and maintenance cost are born by about 40 participating organizations.
3
Milestones
Snap shot of key activities and results are given here as an overview of the achievements during the project period (February 2010 – January 2015).
2010 June – ANSS Quake Management System (AQMS) with three UNIX server computers (SUN Microsystems) installed at the Data Collection and Processing Center of LCSN at Palisades, NY as ANSS Tier I network. Jiggle and other tools of AQMS are actively used at LCSN by the end of 2010.
2011 January – AQMS became fully operational as production system at LCSN at Palisades, NY.
2011 April – Most broadband stations of LCSN starting to be upgraded to record three-component data in 100 samples/sec (HH?), 40 samples/sec (BH?) and 1 sample/sec (LH?) continuous data streams. Strong-motion accelerographs are recording at 200 samples/sec continuous (PAL) or triggered.
2011 September – Seismographic station upgrades under ARRA (American Reinvestment and Recovery Act of 2009) are completed for broadband stations (2009-1011). New digital recorders with Ethernet communication protocol that allow remote control of seismometers greatly improved the quality of seismic data and allow higher sample rate recordings.
2012 January – NEIC/USGS at Golden, Colorado assumes responsibility of earthquake monitoring for the New England states formerly carried out by Weston Observatory of Boston College in Massachusetts (ANSS Tier II network). Station and network maintenance will be performed by ASL/USGS.
2013 September – Patrick Bastien joined LCSN as the field engineer. John Contino (senior electronic technician) who worked for LCSN during 1999-2012 moved to the Polar Program at Lamont-Doherty Earth Observatory.
2014 January – 151 Transportable Array stations of the USArray are integrated into AQMS at LCSN for event detection, location and post-processing in real time. This followed the completion of TA deployment in the Northeastern US at the end of October 2013.
2014 February – LCSN meets the ANSS Performance Standard for areas of earthquake location and magnitude determination and posting in 4 minutes for Mod-risk area. Other areas of APS are met as well.
2014 December – LCSN adopts usage of ANSS Station Information System (SIS) for inventory control and metadata generation.
4
1. Operation of the Lamont Cooperative Seismographic Network (LCSN) The operational goal of the LCSN is to monitor seismic activity throughout the northeastern
United States to catalog the occurrence of earthquakes and archive the appropriate data for seismic hazard evaluation and earthquake research.
LCSN continuously operates remote seismic stations – 35 broadband and 8 short-period stations, with dedicated telemetry and data acquisition systems (see Figure 1, Tables 1 & 2). These broadband seismographic stations record the data continuously at a nominal sampling rate of 100 samples/sec and send the digital seismogram data to the data collection and processing facility at the Lamont-Doherty Earth Observatory (LDEO) via the Internet.
At remote seismographic stations, broadband seismometers are installed in the modified ANSS standard McMillan type (McMillan, 2002) concrete vault and digitized with 24 bit A/D dataloggers. These remote seismographic station sites are selected among seismically quiet areas with minimum cultural noise and bedrock outcrops. The concrete vaults are constructed usually on bedrock to minimize tilt, and at a sufficient depth (60-90 cm) with soil cover to reduce effects of temperature and pressure fluctuation on broadband sensors. The remote seismographic stations are usually powered by solar panels and backup batteries. Timing is provided by a GPS clock and digital data are telemetered to a stable Internet access point, usually at schools, and then to data acquisition (DA) site at LDEO. Telemetry between the remote seismographic stations and the Internet access points are through digital spread-spectrum radio, and most stations use a data collection server computer at DA site at LDEO.
The LCSN promotes active participation of over 40 organizations in the northeastern US and relies upon their support in station maintenance and operation in the region. The organizations that operate LCSN stations consist of 3 secondary schools, 3 environmental research and education centers, 2 state geological surveys, two museums dedicated to Earth system history, 2 public places (Central Park, NYC & Howe Caverns), 4 two-year colleges and 20 four-year colleges and universities (see Section 2.8 for a full list). We installed the Earthworm system at many of these organizations (DA sites) providing them with an ability to utilize the acquired data. These sites collect seismic data from a single 3-component broadband seismograph and send the data in real time to the central data processing facility at LDEO via the Internet (direct Ethernet or Earthworm export). These cooperative efforts provide cost-effective earthquake monitoring capability in the region and facilitate data acquisition efforts of LCSN, and serve as an education and outreach program.
The configuration of the LCSN has evolved continuously during the project period, and now consists of a sub-network with 5 short-period stations (Delaware sub-network) and an additional 3 short-period stations, 35 three-component broadband stations, and five ANSS urban ground motion monitoring stations, covering NY, NJ, DE, MD, PA and District of Columbia, and portions of CT, NH and VT (see Figure 1). During FY2010-2011, under support from the American Recovery and Reinvestment Act (ARRA) of 2009, several short-period seismic stations with mostly 1 sec natural period sensors and analog FM radio telemetry (“legacy stations” that have existed since the 1970's) were upgraded to broadband stations (HBVT, FLET, BMNY). Network average station uptime is significantly improved after the ARRA upgrade (see Figure 2). Our target station uptime is 90%, however for 7 stations out of 35 in 2014, station uptimes were less than 90% (see Figure 2).
Two legacy stations in greater New York City region were converted into full digital seismographic stations that utilize the Rockland County, NY emergency microwave communication network for telemetry - TRNY and CMNY (see Figure 3).
5
1.1 New Broadband Seismographic Stations Deployed During 2010-2014 Nine new broadband seismographic stations were deployed during this period (Feb. 2010 - Jan. 2015).
TUPA (Temple University, PA) was installed at the Ambler campus of Temple University in Philadelphia. The station provides coverage in southeastern Pennsylvania and southern New Jersey.
WVNY (West Valley, NY) was installed at the West Valley Central School and provides important coverage in western New York. WVNY was supported by $25,000 funds from NYSERDA (New York State Energy Research and Development Agency).
BMNY (Brushton-Moira, NY) is installed at a farm near the town of Brushton, NY, and the digital data is telemetered to the Brushton-Moira Central School about 2 km from the station. This station replaces the short-period legacy station BGR (Bangor, NY).
MCVT (Middlebury College, VT) is installed at the Bread Loaf campus of Middlebury College, VT. MCVT replaces the short-period legacy station MDV (Middlebury, VT).
KSCT (Kent School, CT) is installed at the Kent School in Kent, CT along the Housatonic River. KSCT replaces the USNSN contributing station LSCT (Lakeside, CT), which was closed in 2004. The station provides coverage in northwestern Connecticut and southeastern New York.
UNH (University of New Hampshire, Durham, NH): We deployed a new broadband seismographic station at Jackson Estuarine Laboratory located at Adams Point, Durham, NH on November 26, 2013. The station is affiliated with the Department of Earth Sciences, University of New Hampshire which owns a broadband seismometer (model, Trillium 120-PA) and digital recorder (model RT130-01/6).
CCNY (Canisius College, Buffalo, NY): We deployed a new broadband seismographic station at Canisius College, Buffalo, NY on December 4-5, 2013. The station site had been surveyed in the summer of 2012. A key question at the site was to locate a site with bedrock outcrop at shallow depth. GPR (ground penetrating radar) was used to map the limestone bedrock which was about 8 feet below ground level. We installed a broadband seismometer (model, Trillium 120-P) and digital recorder (model RT130-01/6). This is an important location to monitor earthquakes in western New York.
WUPA (West Chester University, Pennsylvania): A week of site survey at the West Chester University campus for a broadband seismographic station development was made in the summer of 2012. Robert Gordon Natural Area at the university campus is selected for a new broadband seismographic station. The new station was deployed at the end of June 2014. The station is affiliated with the Department of Geology and Astronomy, West Chester University of Pennsylvania, which owns a broadband seismometer (model, Trillium 120-PA) and digital recorder (model RT130-01/3).
TRNY (Table Rock, Ramapo, NY): A broadband seismograph was installed at Table Rock, Ramapo, NY close to an Emergency Microwave Communication tower of Rockland County, New York. The data from the station is telemetered via the county’s microwave communication system to the tower located within Lamont-Doherty campus in Palisades, NY. The new station replaces TBR, a legacy short-period seismographic station located less than a kilometer from the site. This station provides denser coverage for the Greater New York City region, which is classified as a High-risk urban area.
6
Figure 1. Map showing the overview of the broadband and short-period seismographic stations of Lamont Cooperative Seismographic Network (LCSN), USNSN, NESN (New England Seismic Network), and Transportable Array stations of the EarthScope project in northeastern United States and stations in southeastern Canada (CNSN and Western University) as of December 2014. 35 LCSN Broadband stations are plotted with red triangles, USNSN-GSN stations are plotted with filled green squares, and 56 TA stations of the USArray, that will be retained after formal 2-year deployments, are plotted with inverted open triangles, whereas those TA stations that will be removed during 2015 are plotted with shaded circles. Waveform data from all of these stations are available to us in real time for earthquake monitoring in the region.
LCSN Stations in the Northeastern United States, December 2014
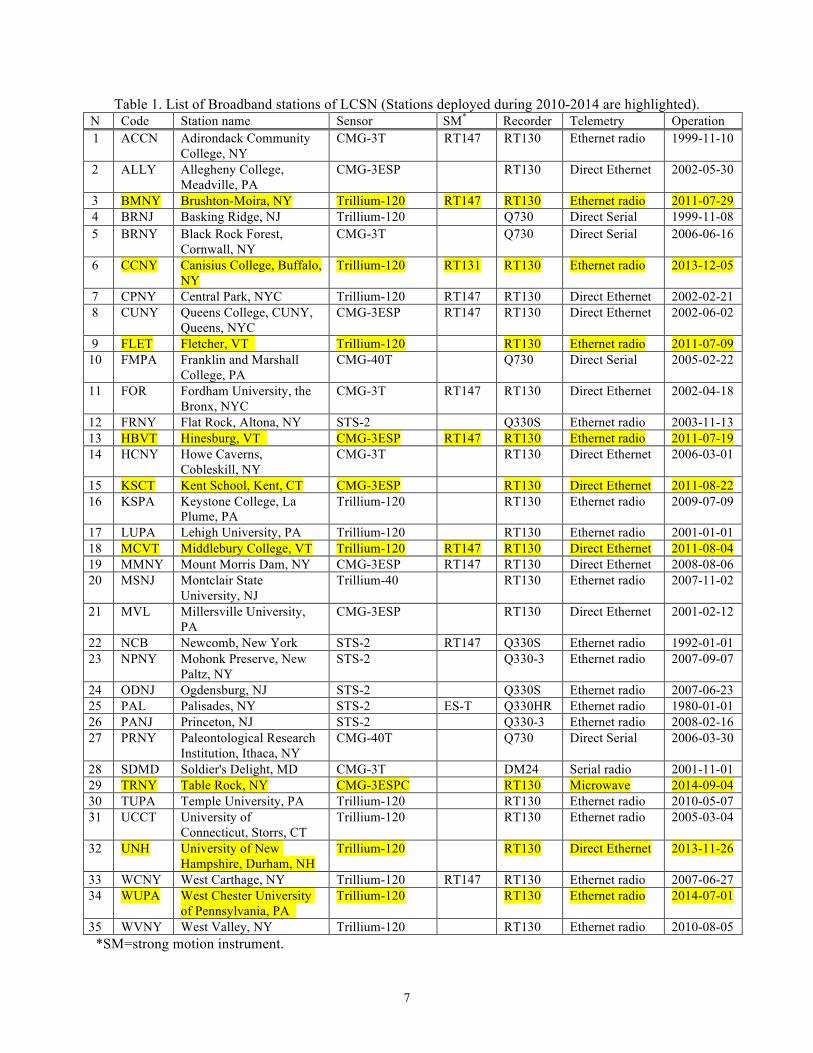
Table 1. List of Broadband stations of LCSN (Stations deployed during 2010-2014 are highlighted). N Code Station name Sensor SM* Recorder Telemetry Operation 1 ACCN Adirondack Community
College, NY CMG-3T RT147 RT130 Ethernet radio 1999-11-10
2 ALLY Allegheny College, Meadville, PA
CMG-3ESP RT130 Direct Ethernet 2002-05-30
3 BMNY Brushton-Moira, NY Trillium-120 RT147 RT130 Ethernet radio 2011-07-29 4 BRNJ Basking Ridge, NJ Trillium-120 Q730 Direct Serial 1999-11-08 5 BRNY Black Rock Forest,
Cornwall, NY CMG-3T Q730 Direct Serial 2006-06-16
6 CCNY Canisius College, Buffalo, NY
Trillium-120 RT131 RT130 Ethernet radio 2013-12-05
7 CPNY Central Park, NYC Trillium-120 RT147 RT130 Direct Ethernet 2002-02-21 8 CUNY Queens College, CUNY,
Queens, NYC CMG-3ESP RT147 RT130 Direct Ethernet 2002-06-02
9 FLET Fletcher, VT Trillium-120 RT130 Ethernet radio 2011-07-09 10 FMPA Franklin and Marshall
College, PA CMG-40T Q730 Direct Serial 2005-02-22
11 FOR Fordham University, the Bronx, NYC
CMG-3T RT147 RT130 Direct Ethernet 2002-04-18
12 FRNY Flat Rock, Altona, NY STS-2 Q330S Ethernet radio 2003-11-13 13 HBVT Hinesburg, VT CMG-3ESP RT147 RT130 Ethernet radio 2011-07-19 14 HCNY Howe Caverns,
Cobleskill, NY CMG-3T RT130 Direct Ethernet 2006-03-01
15 KSCT Kent School, Kent, CT CMG-3ESP RT130 Direct Ethernet 2011-08-22 16 KSPA Keystone College, La
Plume, PA Trillium-120 RT130 Ethernet radio 2009-07-09
17 LUPA Lehigh University, PA Trillium-120 RT130 Ethernet radio 2001-01-01 18 MCVT Middlebury College, VT Trillium-120 RT147 RT130 Direct Ethernet 2011-08-04 19 MMNY Mount Morris Dam, NY CMG-3ESP RT147 RT130 Direct Ethernet 2008-08-06 20 MSNJ Montclair State
University, NJ Trillium-40 RT130 Ethernet radio 2007-11-02
21 MVL Millersville University, PA
CMG-3ESP RT130 Direct Ethernet 2001-02-12
22 NCB Newcomb, New York STS-2 RT147 Q330S Ethernet radio 1992-01-01 23 NPNY Mohonk Preserve, New
Paltz, NY STS-2 Q330-3 Ethernet radio 2007-09-07
24 ODNJ Ogdensburg, NJ STS-2 Q330S Ethernet radio 2007-06-23 25 PAL Palisades, NY STS-2 ES-T Q330HR Ethernet radio 1980-01-01 26 PANJ Princeton, NJ STS-2 Q330-3 Ethernet radio 2008-02-16 27 PRNY Paleontological Research
Institution, Ithaca, NY CMG-40T Q730 Direct Serial 2006-03-30
28 SDMD Soldier's Delight, MD CMG-3T DM24 Serial radio 2001-11-01 29 TRNY Table Rock, NY CMG-3ESPC RT130 Microwave 2014-09-04 30 TUPA Temple University, PA Trillium-120 RT130 Ethernet radio 2010-05-07 31 UCCT University of
Connecticut, Storrs, CT Trillium-120 RT130 Ethernet radio 2005-03-04
32 UNH University of New Hampshire, Durham, NH
Trillium-120 RT130 Direct Ethernet 2013-11-26
33 WCNY West Carthage, NY Trillium-120 RT147 RT130 Ethernet radio 2007-06-27 34 WUPA West Chester University
of Pennsylvania, PA Trillium-120 RT130 Ethernet radio 2014-07-01
35 WVNY West Valley, NY Trillium-120 RT130 Ethernet radio 2010-08-05 *SM=strong motion instrument.
8
Table 2. Short-period stations. Code Station name Sensor Datalogger Telemetry Operation BVD Bellevue State Park,
POTS SUNY Potsdam, NY S-13J RT130 Direct Ethernet 2006-05-22 SCOM Sussex County
Emergency Operation Center, DE
HS-10 Q730 Microwave 1999-10-01
Figure 2. Diagram showing broadband station uptime percentage during 2014. Target is over 90% up time across the network and over 95% data recovery rate (few data gaps). Stations with less than 90% uptime such as LUPA, TUPA, HBVT had a shortage of power supply from solar panels, whereas MMNY and KSPA had Ethernet communication problems. These problems have been addressed during the July-September main fieldwork season in 2014.
0 10 20 30 40 50 60 70 80 90
100
PAL
WC
NY
BR
NY
HC
NY
CU
NY
TRN
Y K
SC
T M
VL
NC
B
FOR
FM
PA
MC
VT
MS
NJ
WV
NY
AC
CN
B
RN
J C
CN
Y FR
NY
CP
NY
OD
NJ
PR
NY
ALL
Y S
DM
D
WU
PA
UN
H
FLE
T B
MN
Y PA
NJ
NP
NY
LUPA
U
CC
T M
MN
Y H
BV
T TU
PA
KS
PA
2014
9
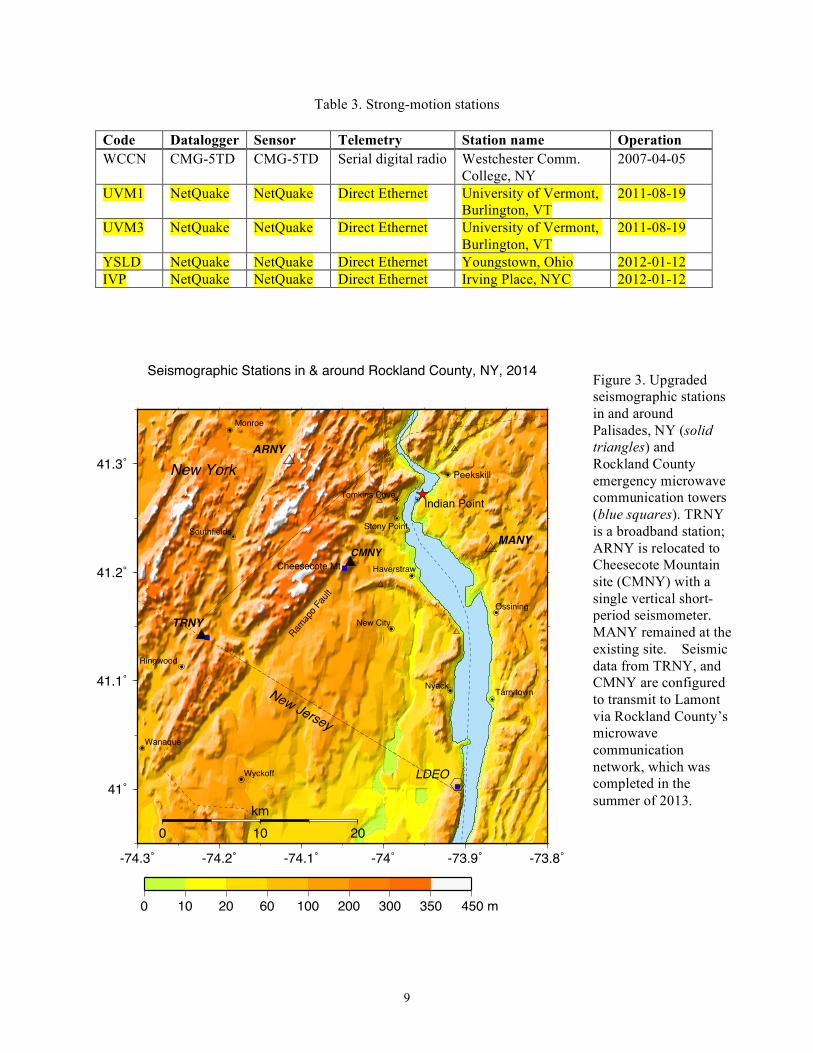
Table 3. Strong-motion stations Code Datalogger Sensor Telemetry Station name Operation WCCN CMG-5TD CMG-5TD Serial digital radio Westchester Comm.
College, NY 2007-04-05
UVM1 NetQuake NetQuake Direct Ethernet University of Vermont, Burlington, VT
2011-08-19
UVM3 NetQuake NetQuake Direct Ethernet University of Vermont, Burlington, VT
2011-08-19
YSLD NetQuake NetQuake Direct Ethernet Youngstown, Ohio 2012-01-12 IVP NetQuake NetQuake Direct Ethernet Irving Place, NYC 2012-01-12
Seismographic Stations in & around Rockland County, NY, 2014
-74.3˚ -74.2˚ -74.1˚ -74˚ -73.9˚ -73.8˚
41˚
41.1˚
41.2˚
41.3˚
0 10 20km
0 10 20 60 100 200 300 350 450 m
Indian Point
LDEO
MANY
TRNY
ARNY
Ramap
o Fau
lt
Wyckoff
Wanaque
Nyack
Ringwood
New City
Ossining
Peekskill
Monroe
Haverstraw
Southfields Stony Point
Tarrytown
Tomkins Cove
New Jersey
New York
Cheesecote MtCMNY
Figure 3. Upgraded seismographic stations in and around Palisades, NY (solid triangles) and Rockland County emergency microwave communication towers (blue squares). TRNY is a broadband station; ARNY is relocated to Cheesecote Mountain site (CMNY) with a single vertical short-period seismometer. MANY remained at the existing site. Seismic data from TRNY, and CMNY are configured to transmit to Lamont via Rockland County’s microwave communication network, which was completed in the summer of 2013.
10
1.2 Deployment of Urban Ground Motion Network in the Metropolitan New York City Region
Greater New York City region is classified as a High-Risk Urban Area (ANSS Performance Standards, v2.8, 2014), and is one of 26 metropolitan regions at risk from damaging earthquakes (Table 3 in USGS Circular 1188). Though the earthquake hazard is low, the risk is amplified due to large population and concentration of critical infrastructure. A relative risk factor, which is determined by multiplying the hazard by the population, of NYC is 0.41, which is the 4th highest among the 26 urban areas at risk in the nation (Table 3 in USGS Circular 1181). Los Angeles, CA with risk factor of 5.12, San Francisco, CA (risk factor 2.43) and Seattle, WA (risk factor 0.42) are the only urban areas that have a greater relative risk factor than New York City. The Moderate-to-High hazard region has a relative earthquake hazard probability of 10% in 50 years for an acceleration ≥8%G. This acceleration level is the approximate threshold of damage to older dwellings or structures not built to resist earthquakes. Other areas with high hazard are the Adirondacks, Boston and central New Hampshire.
LCSN deployed five digital accelerographs in NYC area as part of the ANSS Urban Strong Motion Network. They are at Central Park, NYC; Fordham University, the Bronx; Queens College, Queens, NYC; Westchester Community College, Valhalla, NY; Palisades, NY. The data are continuously recorded with 100 samples/s with 200 samples/s triggered data stream and are sent to NSMP for event waveform data.
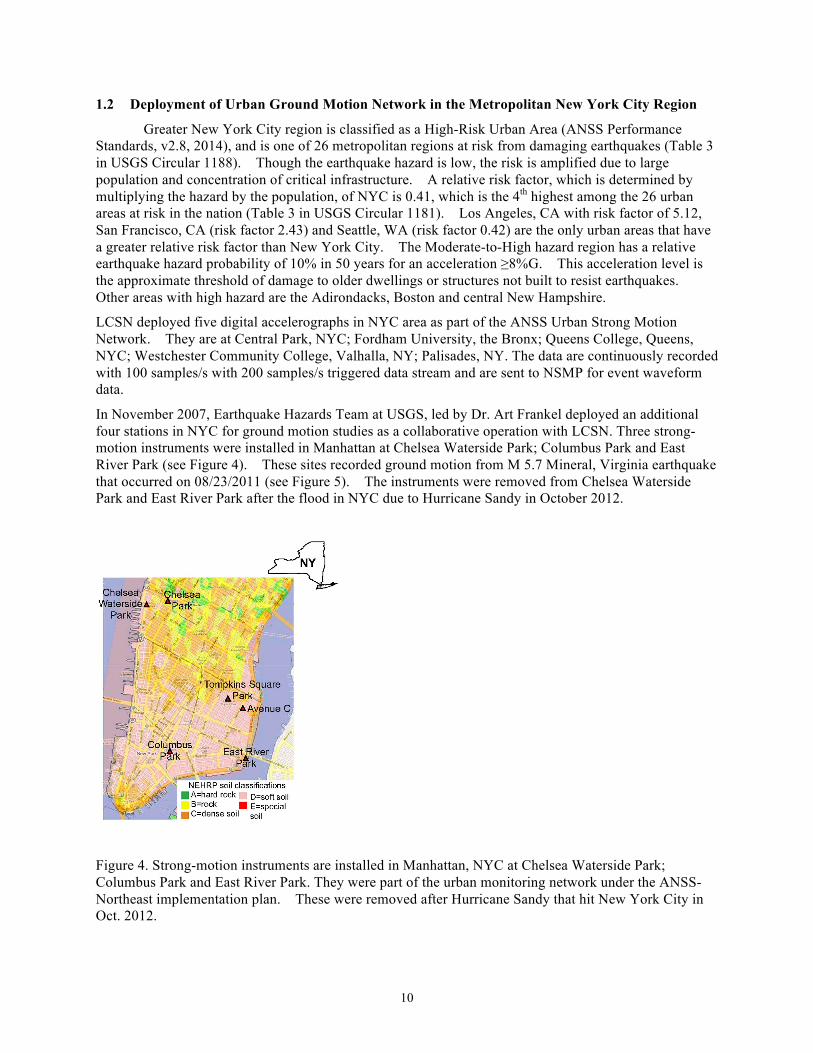
In November 2007, Earthquake Hazards Team at USGS, led by Dr. Art Frankel deployed an additional four stations in NYC for ground motion studies as a collaborative operation with LCSN. Three strong-motion instruments were installed in Manhattan at Chelsea Waterside Park; Columbus Park and East River Park (see Figure 4). These sites recorded ground motion from M 5.7 Mineral, Virginia earthquake that occurred on 08/23/2011 (see Figure 5). The instruments were removed from Chelsea Waterside Park and East River Park after the flood in NYC due to Hurricane Sandy in October 2012.
Figure 4. Strong-motion instruments are installed in Manhattan, NYC at Chelsea Waterside Park; Columbus Park and East River Park. They were part of the urban monitoring network under the ANSS-Northeast implementation plan. These were removed after Hurricane Sandy that hit New York City in Oct. 2012.
11
Figure 5. Strong-motion records from Mw5.7 Mineral, VA earthquake in 2011 recorded at stations in Manhattan, NYC. These records are obtained on sites with NEHRP soil classifications: A (hard rock)=CPNY and C(soft solid) = CLP, CHW and ERP.
08/23/2011, 17:51:04.5, 37.936˚N, 77.933˚W, Depth= 6 km, Mw 5.73-Component Acceleration Data at Manhattan, NYC from Mineral, Va Earthquake
CLP HHZ0.013 gColumbus Park
458.5 kmaz= 46.5baz=229.0
CLP HHN0.029 g
CLP HHE0.028 g
ERP HHZ0.013 gEast River Park
459.8 kmaz= 46.7baz=229.2
ERP HHN0.049 g
ERP HHE0.036 g
CHW HHZ0.030 gChelsea Waterside Park
460.5 kmaz= 46.1baz=228.6
CHW HHN0.020 g
CHW HHE0.028 g
CPNY HNZ0.014 gCentral Park
466.6 kmaz= 46.0baz=228.5
CPNY HNN0.020 g
CPNY HNE0.010 g
12
2. Operation of the Northeastern US Earthquake Data Center
AQMS (ANSS Quake Monitoring System), which consists of three Unix server computers (Sun Microsystem products) loaded with CISN software package and Oracle database server, was installed at the data collection and processing center located at Lamont-Doherty Earth Observatory (LDEO) in the fall of 2010. Hence, the earthquake data processing started to migrate from an Earthworm and Antelope based system to AQMS. By the fall of 2011, AQMS became our production RealTime (RT) and post-processing (PP) system. During 2012 and 2013, we compared and documented that the locations and magnitudes computed by AQMS are comparable to the old system. Hence, currently:
• AQMS is the source of RT and PP information submitted into PDL (Product Distribution Layer) and to the ANSS catalog;
• Alarm configurations are appropriately set to ensure that reliable information is publicly distributed.
However, we need to make sure that, event data from NetQuakes and NSMP dial-up datalogger deployed in our region are automatically integrated into our system. A screen capture of a smart phone showing the AQMS Duty Review Page is shown in Figure 6. By using smart phones an analyst can Accept or Cancel automatic solutions from further processing. Hence, the network operation can be covered virtually 24/7. Overview of AQMS at the Northeastern US earthquake data center at Lamont is given in Figure 7.
Figure 6. Screen capture of a smart phone showing the AQMS Duty Review Page. Analyst can Accept or Cancel automatic solution from further processing. Duty Review Page can be carried out on a smart phone, so that network operation is covered virtually 24/7.
13
Figure 7. Flow chart shows AQMS data collection and processing at LCSN. (Bottom panel) Data collection and export to IRIS-DMC, NEIC, and other RSNs, (middle panel) Real time processing (RT1), and (top panel) Post-processing with information production. Automatic location with magnitude are quickly brought to human review, and we use Duty Review Page (DRP) on WWW before it goes into PDL to prevent false detections and quarry blasts. Duty Review Page is carried out on a smart phone, so that network operation is covered virtually 24/7.
Data Export
ew2wda
Request CardGenerator
Data Collection
eqproceqcoda
hypoinverse
rad2
Duty Review Page
SmartphoneQuick Review
Product Distribution Layer
Waveforms
MT
Alarming
Wave Archiver
Wave ServerProxy
PTWC, NTWC(EW Import)
TANESN
CNSN/SOSN
(IRIS Seedlink)
Shakemap
ampgen
trimagEvent Coordinator
Picking
Association
Posting
To ANSS PDL server
Wave PoolArchive
Data AreaWaveform
AmplitudeData Area
M>=3.5
M>=2.5
Relocation (Jiggle)
Human Review (DRP)QuakeML
Email/Page
DatabaseOracle
NEIC/GSNLCSN
CNSNNEIC
PRSN, SEUSN, NESN
IRIS−DMC
AQMS at Northeastern U.S. Earthquake Data Center
14
2.1 Integration of TA stations into Earthquake Monitoring in the Northeastern US
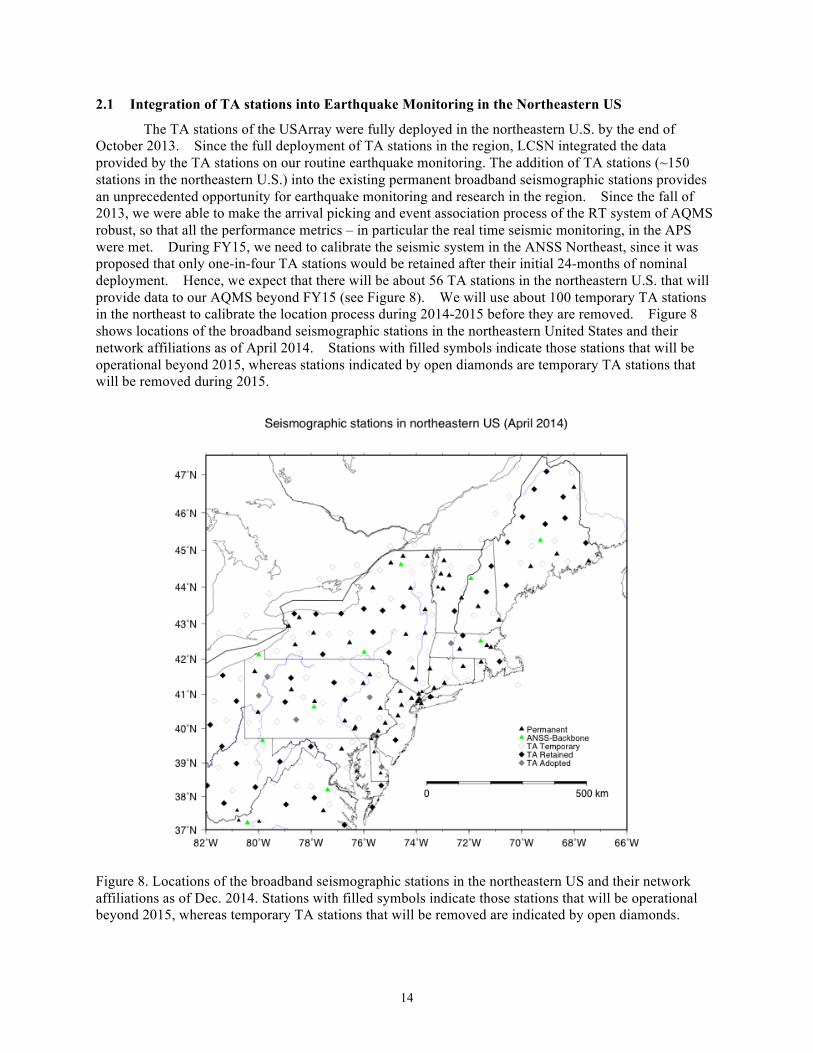
The TA stations of the USArray were fully deployed in the northeastern U.S. by the end of October 2013. Since the full deployment of TA stations in the region, LCSN integrated the data provided by the TA stations on our routine earthquake monitoring. The addition of TA stations (~150 stations in the northeastern U.S.) into the existing permanent broadband seismographic stations provides an unprecedented opportunity for earthquake monitoring and research in the region. Since the fall of 2013, we were able to make the arrival picking and event association process of the RT system of AQMS robust, so that all the performance metrics – in particular the real time seismic monitoring, in the APS were met. During FY15, we need to calibrate the seismic system in the ANSS Northeast, since it was proposed that only one-in-four TA stations would be retained after their initial 24-months of nominal deployment. Hence, we expect that there will be about 56 TA stations in the northeastern U.S. that will provide data to our AQMS beyond FY15 (see Figure 8). We will use about 100 temporary TA stations in the northeast to calibrate the location process during 2014-2015 before they are removed. Figure 8 shows locations of the broadband seismographic stations in the northeastern United States and their network affiliations as of April 2014. Stations with filled symbols indicate those stations that will be operational beyond 2015, whereas stations indicated by open diamonds are temporary TA stations that will be removed during 2015.
Figure 8. Locations of the broadband seismographic stations in the northeastern US and their network affiliations as of Dec. 2014. Stations with filled symbols indicate those stations that will be operational beyond 2015, whereas temporary TA stations that will be removed are indicated by open diamonds.
15
2.2 Implementation of ANSS Performance Standard Geographic Divisions and Designation: The New York City area is classified as one of 26 High-Risk Urban Areas in the nation based on its high risk factor (see Table 3, USGS Circular 1188). 31 Counties of the Metropolitan New York City region and Adirondack Mountain region are Mod-High Hazard Areas based on their seismic hazard probability of 10% in 50 years for an acceleration ≥8%G. The rest of the areas not included in Mod-High Hazard Area within the region that LCSN cover are “National”. We use the Mod-High Hazard Areas as default designation for the region that we cover for purpose of reviewing metrics of Performance Standard.
Overview: AQMS was operational at the Northeast Data Center at Lamont since November 2011. However, we struggled to meet the ANSS performance standards, in particular, real time Seismic Monitoring, mainly due to poor station coverage. A significant breakthrough came in the fall of 2013, when deployment of TA stations in the northeastern U.S. was nearly completed, and waveform data from nearly 160 TA stations were integrated to our AQMS real-time processing system, then we were able to make the arrival picking and event association process of the AQMS RT system robust, and much of the performance metrics in the APS were met by February 2014.
We review details of the APS metrics in performance areas to identify results achieved during the project period.
1.1 Magnitude Completeness Level – During 2014 we are meeting the target of M 2.0 in the NYC and M 2.5 in other areas in the northeastern U.S. since the integration of TA station data into our AQMS RT in the late fall of 2013.
1.2 Epicenter Uncertainty – We are meeting the target of 5 km, however no formal calculation has been performed. We need to carry out location calibration by using quarry blasts in the region that can be recorded on-site using a portable station. There are quarries in the region whose shots were large enough to be recorded by many permanent stations in the region. Those quarry blasts can be used as ground truth events.
1.3 Depth Uncertainty – we are meeting the target of 10 km, however no formal calibration has been performed. We propose to carry out focal depth calibration with large events (M ≥ 3.5) that can be modeled by regional waveform modeling technique with uncertainty approximately ±2 km. We need to estimate the depth uncertainty for the sake of APS metrics using locations in AQMS database.
1.4 Magnitude Uncertainty for M ≥ 4.5 – target is ±0.2 magnitude units. We have no solid estimates. We need to determine the uncertainty by using moment magnitude, Mw, as reference for earthquakes greater than M 4.5, and check station magnitude scatter that can be attributed to instrument and site correction.
1.5 Magnitude Estimation Accuracy (Md, Ml, Mo, Mb) for M < 4.5 – We accumulated enough Md and Ml measurements within AQMS during 2013-2014, hence, we will carry out scatter analysis among the magnitude estimates by using moment magnitude, Mw, as reference. Ml formula is available by Kim (1998) and we can check for station corrections and instrument responses.
1.6 Network average station uptime – target is 90%, and we are meeting this target (see Figure 2), however for 7 stations out of 35 in 2014, station uptimes were less than 90%.
1.7 Waveform Data Return Rate for Triggered Data – We are recording accelerometer with 200 samples/sec as triggered event data, and need to evaluate rate of triggered data recovery. This has not yet been performed, and we will carry out the task in FY15-19.
2.2.2 Real-Time/Automated Product generation
2.1 Hypocenter Post Time – target is 4 minutes. We are barely meeting the target because of latency in
16
the process; the primary cause is the eqproc Earthworm module which takes about 140 seconds to reach to the coda duration to take duration magnitude. We are experimenting with alternative module eqassemble that does not wait for coda duration to complete, and hence, it can pass the location to the event coordinator on post-proc.
For NYC area as a High-Risk Urban Area, the target is 2 minutes, which requires tighter processing flow. We need to reduce delay due to message propagation (email/page) within AQMS and quick human review time before allowing the automated solution to be posted within the target time.
2.2 Magnitude Post Time – target is 4 minutes as hypocenter post time. We are barely meeting the target because of latency in the process. We will switch to eqassemble and localmag_east to reduce post time delay.
2.3 Moment Tensor Post Time for M ≥ 4.5 – target is 15 minutes. We implemented a regional moment tensor inversion code on our AQMS post-proc (PP) (Figure 6). Although, we did not have a good example to test with current network configuration, it should be possible to meet the time line even for events down to M 3.5 in the northeastern U.S.
2.4 Initial COSMOS V0–V3 Products Post Time – target is 10 minutes to post PGA/PGV/PGD, time history and spectra for recordings with a PGA > 0.01g for events of 4 < M < 4.5 in CEUS. Products are sent to the Center for Engineering Strong Motion Data (CESMD) for posting. We do not have a submission routine implemented yet.
2.5 Shakemap Post Time – target is 10 minutes. We generate the Shakemap for events greater than M 2.5, and it is initiated by shake_alarm on the real-time system and revised by the post-proc system (Figure 6).
2.2.3 Preparation of Seismologist-Reviewed Products for Significant Earthquakes
3.1 Reviewed Hypocenter Post Time – target is 10 minutes. Formally, it is within our range during weekdays 9am-5pm (EST). We will arrange with NEIC to cover weekends and off-office hours.
3.2 Reviewed Magnitude Post Time – target is 10 minutes, the same as reviewed hypocenter post time.
3.3 Reviewed Moment Tensor Post Time M>4.5 – target is 30 minutes. Formally, it is within our range.
3.4 Reviewed COSMOS V0-V3 Products Post Time – target is 7 days. It is within our range.
3.5 Reviewed ShakeMap Post Time – target is 30 minutes. Formally, it is within our range during weekdays 9am-5pm (EST). We will arrange with ShakeMap group at NEIC to cover weekends and off-office hours.
2.2.4 Data Exchange Between ANSS Participating Networks
4.1 Waveform Availability Timeliness – target is 30 seconds. We meet the target. For TA stations, data latency is about 30-40 seconds, so it should be reviewed when CEUSN is fully integrated in the near future.
4.2 Amplitude Availability Timeliness – target is 30 seconds. We meet the target, but we don't currently supply these to other networks. We shall implement the scheme to export.
4.3 Phase Picks Availability Timeliness – target is 30 seconds. We meet the target.
2.2.5 Data Archiving and Public Distribution
5.1 Availability of Waveforms to External Users – target is 60 minutes. We meet the target.
5.2 Availability of Event Bulletin (parametric data) – target is 60 minutes. We meet the target, and it is posted via PDL immediately with the reviewed products.
17
5.3 Metadata availability (current) – target 99% within 3 business days of a hardware change. We meet the target.
5.4 Data import into archive – Waveform data are supplied immediately to IRIS-DMC, in real time for dissemination and for permanent archiving.
2.3 Station Inventory and Metadata
LCSN has worked with staff at Southern California Earthquake Data Center (SCEDC) to generate a database and to utilize SIS (Station Information System) to track ANSS-supplied station equipment, and to provide metadata for station attributes (e.g., response, digitizer, and sensor). SIS is our working system since the fall of 2014. Currently, LCSN uses PDCC v3.8 to generate dataless SEED volume for station response attributes, and SIS for current station dataless seed.
We submit the dataless SEED volume to IRIS-DMC for dissemination, as well as post it on our web site (http://www.ldeo.columbia.edu/LCSN/Metadata/DATALESS_LD_seed ) as soon as updates are available.
2.4 Distribution of Earthquake Products
We use PDL as the earthquake information product distribution software as required (version 1.9.6). We use PDL with the following implementation. Automatic: Event triggers alarming and alarming triggers email
Manual: Duty Review Page or Jiggle review If false, event deleted; if true and solution reasonable, event is Accepted (DRP) (status: human reviewed) or saved in Jiggle (status: intermediate). If true, but solution is poor, event is quickly modified in Jiggle and saved.
Automatic: POSTPROC alarm runs script 'postpdl' immediately if event type is Local. If event type is Regional, an e-mail with preliminary picks is sent to NEIC and regional networks, and postpdl is run after 5 minutes.
postpdl script runs command "qml -S" to convert AQMS information of event origin and picks and amplitudes to QuakeML;
Submit QuakeML to PDL with java program ProductClient.jar. Bulletin data are also submitted to ANSS Composite Catalog and Bulletin database at UC Berkeley.
2.5 ShakeMaps
We distribute to NEIC all appropriate ShakeMap parameters and configurations to ensure redundant computation and delivery of ShakeMaps. On our AQMS, ShakeMaps is configured: Automatic: as above, a shakemap shake_alarm is generated if the automatic solution from Earthworm is: in same LD region listed above M ≥ 2.5, nph ≥ 15, LocRMS ≤ 1.5s. On Postproc: the same POSTPROC script will trigger a shake_alarm in the same region if M ≥ 2.5 and event type is Local or Regional. This shake_alarm is run twice, once with the real-time associated data available, then again after ampgenpp.pl is run to get amplitudes from waveforms not recorded or associated within the automatic time window. Shakemap can also be triggered manually from postproc by issuing the command: shake_alarm eventid version. We compute automatic and reviewed ShakeMaps within our authoritative region for all M3.5 or larger earthquakes.
2.6 Real-time Distribution and Archiving of Waveform Data
18
The real-time waveform data exchange and integration are achieved using the Earthworm system. Data exchange with neighboring networks and national networks are: exporting 20 sites and importing 10 sites to and from USNSN/NEIC; exporting 8 and importing 11 from CNSN/POLARIS of Canada; exporting two sites data to CERI (SDMD, MVL); exporting 5 and importing 2 stations from NESN (New England Seismic Network); exporting 2 and importing 3 stations from PRSN (Puerto Rico); exporting 2 and importing 3 from VTSO (Virginia Tech Seismic Observatory). PTWC (Pacific Tsunami Warning Center) and Alaska/West Coast Tsunami Warning Center (NTWC) since July 2010.
Since January of 2001, LCSN sends all waveform data to IRIS-DMC in real-time for archiving at the data center. All continuous waveform data recorded at a sampling rate of 100 samples/s and 40 samples/s as well as 1 sample/s are submitted in real time without delay at a rate of 2.0 Gigabytes/day.
Waveform data from all stations of the LCSN (network code: LD) are available at the IRIS-DMC in near real-time as Buffer of Uniform Data (BUD) via worldwide web, the URL is, <http://www.iris.washington.edu/bud_stuff/dmc/>. All archived data at the DMC are available at <http://www.iris.edu/SeismiQuery/> and users can query waveform data using network code “LD”.
For waveform data archived at IRIS-DMC, the metadata are available on-line as well as on LCSN web site with URL: <www.ldeo.columbia.edu/LCSN/Metadata/DATALESS.LD.seed>.
2.7 Post-earthquake Reporting
We provide a post-event report summarizing the response to a significant earthquake or an incident that negatively impacted ANSS performance, upon request by the ANSS coordinator within a mutually agreed upon timeframe. The report shall includes: 1) A summary timeline, 2) A list of products and distribution mechanisms, 3) Highlights of what went well and might be applicable to other events and networks, 4) Technical problems encountered, and 5) A list of corrective actions completed or planned.
2.8 Websites
As a Tier I network, we will list the following items on our website: 1) Computed hypocenters and magnitudes, 2) The network’s monitoring objectives in the context of the ANSS, 3) The scope of coordination with other monitoring networks, 4) Maps and lists of stations used in routine monitoring, 5) Links to earthquake products and network services, 6) Acknowledgement of participation in ANSS and support from USGS with links to EHP and ANSS webpages, and 7) Partnering networks and archives that receive waveform data and earthquake information products.
2.9 Efforts to Enhance Coordination Among Regional Seismic Networks and the EHP.
1) LCSN staff closely work with the event coordinator at NEIC when a significant earthquake occurs in the region. LCSN sends catalog data to the NEIC in E-mail and talks to staff.
2) Coordinated exchange of real-time waveform data with regional and national networks (see E. 2.7.7).
• LCSN exports/imports waveform data in real time to NEIC, CNSN (Canadian National Seismic Network, Ottawa, Canada), NESN (New England Seismic Network), PRSN (Puerto Rico Seismic Network), VTSO (Virginia Tech Seismic Observatory), PSSN (Penn State Seismic Network), CERI (Center for Earthquake Research and Information) in Memphis, and Southern Ontario Seismic Network, Canada.
• LCSN also sends continuous waveform data from seven stations to PTWC (Pacific Tsunami Warning Center) and Alaska/West Coast Tsunami Warning Center (NTWC) since July 2010.
• Strong motion data are sent to NSMP as event triggered data.
3) Coordinated exchange of real-time picks, amplitudes/durations, and earthquake locations to other ANSS networks
19
• LCSN is configured to send real-time picks, amplitudes/durations, and earthquake locations to other ANSS networks including the NEIC under AQMS. In 2013 we converted to PDL as a drop-in replacement for EIDS.
• Location, arrival picks and magnitudes are sent out via PDL once a final solution is made. Email is sent to neighboring regional networks and partners (eq-alert3 mailing list), and if timely -- within 24 hours -- text emails are also sent to emergency management agencies and other non-technical recipients (eq-alert4).
1) ShakeMaps and Regional moment tensor: (see E. 2.7.6) • LCSN has discussed with David Wald and agreed to work with staff at NEIC to generate the
ShakeMaps at NEIC. ShakeMap is now installed on our IBM Linux platform, and maps are being generated locally.
• Regional moment tensor solutions are sent and received between St. Louis University and LCSN as well as other recipients in the region.
2) Real time data from TA stations of the USArray are being received and integrated to the processing: • Real time data from ~150 TA stations in the northeastern United States and southeastern Canada
data are received and processed. In light of the TA station retention program in the Central and Eastern US, 56 selected stations in the northeast are carefully integrated into our network processing.
3.0 Partnerships and Education & Outreach
The Lamont Cooperative Seismographic Network is unusual in using a variety of station operators (college & university faculty, secondary school teachers, museums, etc.) to engage a wide variety of audiences and to reach out to large numbers of the general public. It also provides professional development and improved awareness among station operators who are not professional seismologists. All of this is an example of involving the community to extend observations and thereby make science accessible to the public. Examples include research seismometers installed and used for education in a high school in Carthage, NY, at the Black Rock Forest Consortium for environmental research and education in the Hudson Highlands, and at a museum dedicated to Earth system history in Ithaca, NY.
About one third of the broadband seismometers belong to participating organizations. Hence, a large portion of the operation and maintenance cost are born by the participating organizations. A complete list of ~40 partners are listed below.
The LCSN relies upon their support in station maintenance and operation in the region. The organizations who operate LCSN stations consist of 7 secondary schools, 4 environmental research and education centers, 2 state geological survey, US Army Corps of Engineers, NY State Energy Research & Development Agency, Rockland County, NY, 2 museums dedicated to Earth system history, 2 public place (Central Park, NYC & Howe Caverns), 4 two-year colleges and 18 four-year universities, and so on. New Partnerships during the project period
We had new partnerships with the following institutions: • Temple University, PA • West Valley Central School, NY • NYSERDA (New York State Energy Research and Development Agency) • Brushton-Moira Central School, NY • Kent School, Kent, CT • Bread Loaf, Middlebury College, VT • University of Vermont, Burlington, VT • West Chester University, Pennsylvania (Robert Gordon Natural Area)
20
• University of New Hampshire, Durham (Jackson Estuarine Lab, Durham, NH) • Youngstown State University, Youngstown, Ohio • Rockland County, New York • Canisius College, Buffalo, New York
All List of Partners of LCSN are (ordered by station code):
1 Adirondack Community College, SUNY + North Hudson School District (ACCN) 2 Allegheny College, PA (ALLY) 3 William Annin Middle School, NJ (BRNJ) 4 Brushton-Moira High School, New York (BMNY) 5 Black Rock Forest Consortium, Cornwall, NY (BRNY) 6 Canisius College, Buffalo, NY (CCNY) 7 Cheesecote Mountain, Pomona, NY – Rockland County, NY (CMNY) 8 Central Park Conservancy, NYC (CPNY) 9 Queens College, CUNY, NY (CUNY) 10 Delaware Geological Survey, DE (DGS subnet) 11 Delaware Emergency Management Agency (DEMA) 12 Franklin and Marshall College, PA (FMPA) 13 Fordham University, the Bronx, NY (FOR) 14 Miner Agricultural Research Institute, West Chazy, NY (FRNY) 15 Plattsburgh State, SUNY (FRNY) 16 University of Vermont, Burlington, VT (HBVT) 17 Howe Caverns, Cobleskill, New York & SUNY Cobleskill (HCNY) 18 Kent School, Kent, Connecticut (KSCT) 19 Keystone College, PA (KSPA) 20 Lehigh University, PA (LUPA) 21 Middlebury College, Bread Loaf campus, VT (MCVT, MDV) 22 POLARIS Consortium, Canada (MEDO) 23 Mt Morris Dam, NY & Army Corps of Engineers + SUNY – Geneseo (MMNY) 24 Montclair State University, NJ & Rifle Camp Park, Passaic County, NJ (MSNJ) 25 Millersville University, PA (MVL) 26 College of Environmental Science and Forestry, Syracuse, SUNY (NCB) 27 Mohonk Preserve & SUNY – New Paltz + ISTI (NPNY) 28 Sterling Hill Mining Museum, Ogdensburg, NJ (ODNJ) 29 Princeton Academy of the Sacred Heart and Princeton University, NJ (PANJ) 30 Museum of the Earth, Paleontological Research Institution, & Cornell Univ., Ithaca, NY (PRNY) 31 Potsdam College, SUNY (PTN) 32 Maryland Geological Survey, Maryland Emergency Management Agency & Towson University,
MD (SDMD) 33 Rockland County, Emergency Communication System, New York (TRNY) 34 Temple University, Pennsylvania (TUPA) 35 University of Connecticut, CT (UCCT) 36 University of New Hampshire, Durham, NH (Jackson Estuarine Lab, Durham, NH) (UNH) 37 Westchester Community College, SUNY (WCCN) 38 Carthage Central High School, Carthage, NY (WCNY) 39 West Chester University of Pennsylvania (Robert Gordon Natural Area) (WUPA) 40 West Valley Regional School, New York (WVNY) 41 NYSERDA (NY State Energy Research & Development Authority) (WVNY) 42 Youngstown State University, Ohio (YSLD).
21
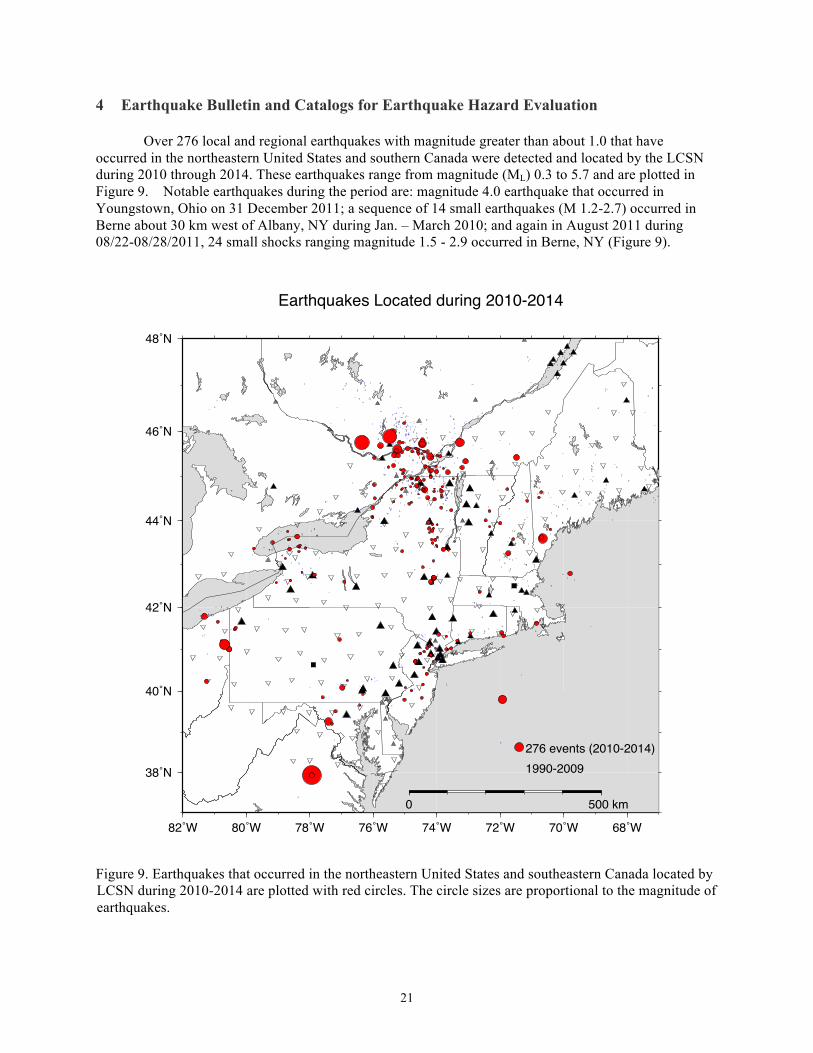
4 Earthquake Bulletin and Catalogs for Earthquake Hazard Evaluation
Over 276 local and regional earthquakes with magnitude greater than about 1.0 that have occurred in the northeastern United States and southern Canada were detected and located by the LCSN during 2010 through 2014. These earthquakes range from magnitude (ML) 0.3 to 5.7 and are plotted in Figure 9. Notable earthquakes during the period are: magnitude 4.0 earthquake that occurred in Youngstown, Ohio on 31 December 2011; a sequence of 14 small earthquakes (M 1.2-2.7) occurred in Berne about 30 km west of Albany, NY during Jan. – March 2010; and again in August 2011 during 08/22-08/28/2011, 24 small shocks ranging magnitude 1.5 - 2.9 occurred in Berne, NY (Figure 9).
Figure 9. Earthquakes that occurred in the northeastern United States and southeastern Canada located by LCSN during 2010-2014 are plotted with red circles. The circle sizes are proportional to the magnitude of earthquakes.
Earthquakes Located during 2010-2014
82˚W 80˚W 78˚W 76˚W 74˚W 72˚W 70˚W 68˚W
38˚N
40˚N
42˚N
44˚N
46˚N
48˚N
0 500 km
276 events (2010-2014)1990-2009
22
4.1 Induced Seismicity around Youngstown, Ohio Over the last several years, hydraulic fracturing has become widely used in the northeastern
United States to extract natural gas from the Marcellus Shale (tight Devonian black shale). Much of the hydraulic fracturing of shale gas has been carried out in Pennsylvania, but the wastewater (brine) from the hydraulic fracturing process is being transported to Ohio and disposed of by injecting into deep wells at a depth range of 2.0 – 3.0 km under high pressure of up to 17.2 MPa (2,500 PSI [pounds per square inch]). The target injection intervals are usually sandstone layers in the Knox Dolomite (Lower Ordovician to Upper Cambrian) to Mt. Simon sandstone (Middle Cambrian). Five deep injection wells were drilled in the Youngstown, Ohio area since 2010, but only the Northstar 1 injection well was operational during 2011 (Figure 10). Since the Northstar 1 waste disposal well became operational in late December 2010, Youngstown, Ohio has experienced small earthquakes. On 17 March 2011, residents in Youngstown, Ohio felt a MW 2.3 earthquake. By 25 November 2011, nine earthquakes (MW ~1.8 – 2.8) occurred near Youngstown, Ohio. Prior to 2011, no earthquakes were recorded around Youngstown. Although these earthquakes could not be accurately located due to sparse coverage of seismic stations in the region, these shocks were occurring close to a deep waste injection well – Northstar 1 (Figure 10). On 1 December 2011, LCSN deployed four portable seismographic stations around Youngstown at the request of and in collaboration with ODNR to monitor seismicity at close distances and to determine hypocenters of the small earthquakes accurately for assessing whether these shocks were induced by the deep waste disposal well injecting fluid since the end of 2010 in the area (see Figure 10). On 24 December 2011, a magnitude 2.7 shock occurred in the epicentral area, which was well recorded by the four-station local network in the distance range from 1.9 to 6.5 km from the epicenter. The hypocenter of the shock was very well determined by the local station data, which had adequate coverage with the station azimuthal gap of 119º and distance to the two closest stations less than the focal depth. The shock was located about 0.8±0.4 km west of the Northstar 1 well at a focal depth of 3.6±0.8 km (95% confidence level). On 30 December 2011, ODNR requested the operator to shut down the Northstar 1 well, because the 24 December 2011 event was located close to the injection well with high confidence. On 31 December 2011 at 20:05 (UTC), a magnitude Mw 3.9 earthquake occurred in the same epicentral area within 24 hours from the shut down of the injection operation. This is a rare case of likely induced seismicity in the northeastern United States where major events in a sequence have been well recorded by local portable seismographs in place (with a high sample rate of up to 500 samples/s), providing an opportunity to study the sequence of seismicity in detail.
Figure 10. Accurately relocated earthquakes that have occurred during 03/17/2011 – 01/13/2012 in Youngstown, Ohio are plotted by circles and denoted by event ids. The deep injection well (NS#1) is plotted for reference. Events on 17 March 2011 (#1 and #2) are located close to the injection well. Subsequent later events have occurred further away from the injection well and the events on December 2011 to January 2012 are located at the western end of the rupture zone.
Youngstown, Ohio, 2011
-0.4
-0.2
0.0
0.2
0.4
North
-Sou
th (k
m)
-0.5 0.0 0.5 1.0West-East distance (km)
1 2
3 4
5
6
7
8
910 1112
NS#1 N
E
1.2 km
23
5. DISSEMINATION OF EARTHQUAKE INFORMATION PRODUCTS AND DATA
We will adhere to reporting requirements described in the Special Terms and Conditions that will be incorporated into the award documents as listed in the project management plan section (7). 5.1 Dissemination of Continuous Waveform Data
Continuous, broadband (100, 40 & 1 samples/sec) and short-period (100 samples/sec) waveform data are acquired in real time via the Internet (digital radio telemetry and Ethernet communication) and are submitted to IRIS-DMC for public dissemination in real time and permanent archiving. Waveform data from all stations of the LCSN (network code: LD) are available at the IRIS-DMC in near-real time as Buffer of Uniform Data (BUD) via worldwide web, the URL is, <http://www.iris.washington.edu/bud_stuff/dmc/>.
All archived data are available at <http://www.iris.edu/SeismiQuery/> and users can query waveform data using network code “LD”. A complete instrument response and other information for the waveform data are available as “dataless SEED volume for LCSN Data” at the LCSN web site or from the IRIS-DMC.
5.2 Dissemination of Event Waveform Data
Waveform data of all regional events located by LCSN are available through entry on “finger quake” list with URL <http://www.ldeo.columbia.edu/cgi-bin/quake.cgi>. The data are in full SEED volumes and users do not need additional metadata. In the summer of 2006, we increased the data availability to most users by using an event oriented waveform database via URL. The phase data as well as full waveform data for the earthquakes in recent years are available from the LCSN web site as “LCSN Database/waveform archive” <http://almaty.ldeo.columbia.edu:8080/cgi-bin/eventwfdb.pl>. Part or all of the waveform data are also sent to NEIC, CERI and Geological Survey of Canada in real time. Event database for selected regional events are also available at LCSN web site. 5.3 Dissemination of Processed Parametric Data
Epicenter, origin time and magnitude of local and regional events are sent out as earthquake alert messages to Emergency Management Offices at counties and states, local and regional authorities who are responding to earthquake inquiries. Earthquake locations and magnitudes are promptly contributed to ANSS composite earthquake catalog via PDL (Product Distribution Layer) and are available through “Recent Earthquakes” with URL: <http://URL.ldeo.columbia.edu/LCSN/recenteqs/>. Automatic solutions from AQMS are posted at http://aqms.ldeo.columbia.edu/auto.html for LCSN and other regional and national network operators. Earthquake information is also routinely disseminated to the news media, and to the general public in the form of press releases using FAX, phone, e-mails and WWW. We will coordinate for rapid earthquake reporting among regional seismic networks and the USNSN/NEIC as recommended by ANSS TG - v1.0. Timely coordination with neighboring networks such as NEIC and Geological Survey of Canada is important, and we will maintain near real-time communication capability among these networks. Earthquake parameters are sent via PDL for compiling an ANSS composite earthquake catalog as recommended by the ANSS. The results of various scientific studies such as detailed distribution of micro-earthquakes and possible seismogenic faults revealed by the aftershock monitoring surveys are disseminated to various users using the LCSN web page. 5.4 Earthquake Catalog Archive
We developed a standard earthquake catalog search tool with the ability to plot the results on a postscript map using GMT (General Mapping Tool). The LCSN earthquake catalog search tool is at URL: <http://almaty.ldeo.columbia.edu:8080/data.search.html>. We will make available some related databases such as the NCEER earthquake catalog.
24
LCSN as an ANSS Tier 1 network, we will check its website regularly for the following minimum components. • Computed hypocenters and magnitudes (in recenteqs and catalogs). • The network’s monitoring objectives in the context of the ANSS (mission statement and
introduction). • The scope of coordination with other monitoring networks. (in recenteqs and data source) • Maps and lists of stations used in routine monitoring. • Links to earthquake products and network services. (catalog search, waveform search, special event
pages) • Acknowledgement of participation in ANSS and support from USGS with links to EHP and ANSS
webpages. • Partnering networks and archives that receive waveform data and earthquake information products.
6 References ANSS Technical Integration Committee (2002), Technical Guidelines for the Implementation of the
Advanced National Seismic System – Version 1.0, U.S. Geological Survey Open-File Report 02-92, 92pp.
Kim, W. Y. (1998), The ML scale in Eastern North America, Bulletin of the Seismological Society of America, 88, 935-951.
Kim, Won-Young (2013). Induced seismicity associated with fluid injection into a deep well in Youngstown, Ohio, J. Geophys. Res. 118, 3506-3518, doi:10.1002/jgrb.50247.
McMillan, J. (2002). Method of Installing United States National Seismographic Network (USNSN) Stations –A Construction Manual, USGS Open-File Report 02-144, 23pp.
Petersen, M. D., Moschetti, M. P., Peter M. Powers, Charles S. Mueller, Kathleen M. Haller, Arthur D. Frankel, Yuehua Zeng, Sanaz Rezaeian, Stephen C. Harmsen, Oliver S. Boyd, Ned Field, Rui Chen, Kenneth S. Rukstales, Nico Luco, Russell L. Wheeler, Robert A. Williams, and Anna H. Olsen (2014). Documentation for the 2014 Update of the United States National Seismic Hazard Maps, Open-File Report 2014–1091.
U.S. Geological Survey Circular 1188, (1999). An Assessment of Seismic Monitoring in the United States: Requirement for an Advanced National Seismic System, U. S. Geological Survey Circular 1188, 55 pages.