In accordance with the Americans with Disabilities Act, this information is available in alternative forms of communication upon request by calling 651-201-6000. TTY users can call the Minnesota Relay Service at 711. The MDA is an equal opportunity employer and provider. Final Township Testing Nitrate Report: Cottonwood County 2018-2019 December 2020 Minnesota Department of Agriculture Pesticide and Fertilizer Management Division
Transcript
In accordance with the Americans with Disabilities Act, this information is available in alternative forms of communication upon request by calling 651-201-6000. TTY users can call the Minnesota Relay Service at 711.
The MDA is an equal opportunity employer and provider.
Final Township Testing Nitrate Report:
Cottonwood County 2018-2019
December 2020
Minnesota Department of Agriculture
Pesticide and Fertilizer Management Division
2
ACKNOWLEDGEMENTS
MDA PRIMARY AUTHOR
Jaime Nielsen and Nikol Ross
MDA CONTRIBUTORS AND REVIEWERS
Kimberly Kaiser, Larry Gunderson, and Jen Schaust
FUNDING
Project dollars provided by the Clean Water Fund (from the Clean Water, Land and Legacy Amendment).
Table of Contents .......................................................................................................................................... 3
List of Figures ................................................................................................................................................ 4
List of Tables ................................................................................................................................................. 5
Final Results ................................................................................................................................................ 24
Appendix A .................................................................................................................................................. 34
Appendix B .................................................................................................................................................. 36
Appendix C .................................................................................................................................................. 42
Appendix D .................................................................................................................................................. 46
Appendix E .................................................................................................................................................. 47
Appendix F .................................................................................................................................................. 48
Appendix G .................................................................................................................................................. 50
Appendix H .................................................................................................................................................. 50
Appendix I ................................................................................................................................................... 56
Appendix K .................................................................................................................................................. 58
4
LIST OF FIGURES
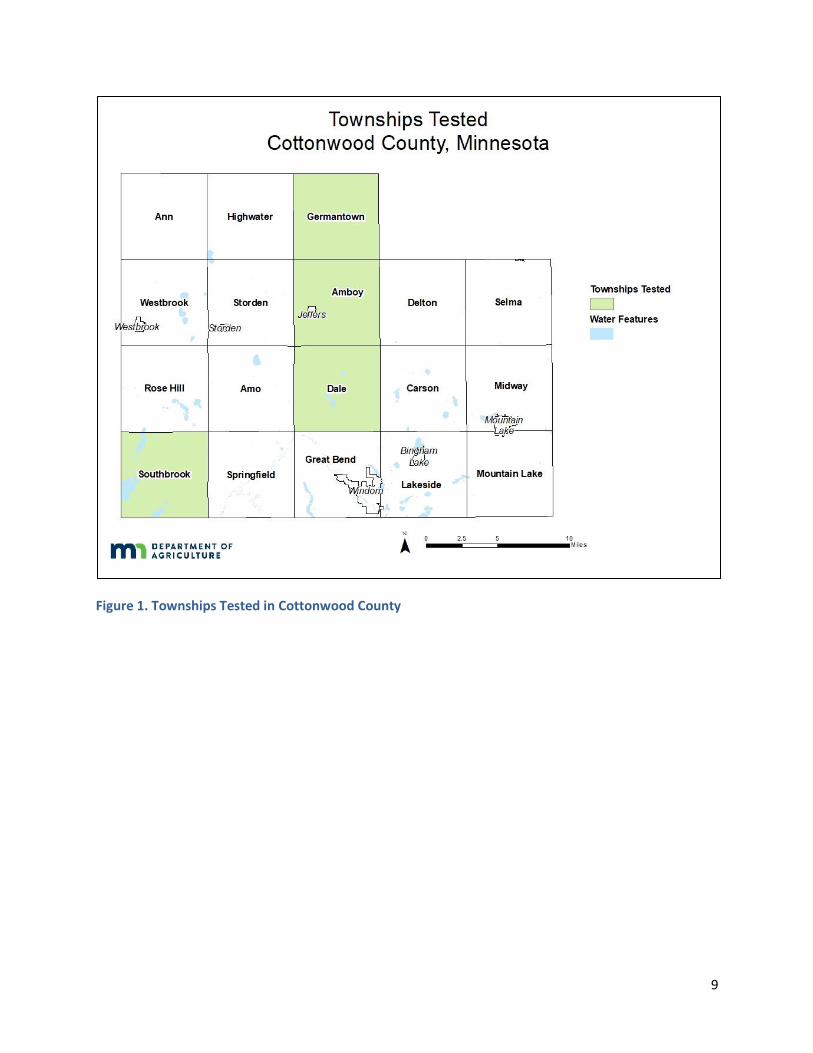
Figure 1. Townships Tested in Cottonwood County ..................................................................................... 9
Figure 2. Statewide Geomorphology Layer, Sediment Association in Cottonwood County (MDNR, MGS,
and UMD, 1997) .......................................................................................................................................... 11
Figure 3. Minnesota Vulnerable Townships Tested for Nitrate in Private Wells. ....................................... 13
Figure 4. Pollution Sensitivity of Near Surface Materials (Adams, 2016) in Cottonwood County.............. 15
Figure 5. Well Locations and Nitrate Results from Initial Dataset in Cottonwood County ........................ 18
Figure 6. Results of Initial Testing by Township in Cottonwood County .................................................... 19
Figure 7. Well Locations and Nitrate Results from Final Well Dataset in Cottonwood County.................. 25
Figure 8. Results of Final Testing by Township in Cottonwood County ...................................................... 26
Figure 9. Feedlot Locations in Cottonwood County (MPCA, 2020) ............................................................ 39
Figure 10. Fertilizer Spills and Investigations in Cottonwood County (MDA, 2018a) ................................. 41
Figure 11. Land Cover in Cottonwood County (USDA NASS Cropland Data Layer, 2013) .......................... 42
Figure 12. Active Groundwater Use Permits in Cottonwood County (MDNR, 2018) ................................. 45
Table 2. Homeowner Participation in Initial and Follow-Up Well Water Sampling, Cottonwood County . 16
Table 3. Cottonwood County Township Testing Summary Statistics for Initial Well Dataset .................... 20
Table 4. Estimated Population with Water Wells Over 10mg/L Nitrate-N, Cottonwood County .............. 21
Table 5. Nitrate Concentrations within Sampled Groundwater Aquifers ................................................... 22
Table 6. Initial and Final Well Dataset Results, Cottonwood County ......................................................... 24
Table 7. Cottonwood County Township Testing Summary Statistics for Final Well Dataset...................... 27
Table 8. Township Nitrate Results Related to Vulnerable Geology and Row Crop Production, Cottonwood
County ......................................................................................................................................................... 28
Table 9. Animal Unit Calculations (MPCA, 2017b) ...................................................................................... 37
Table 10. Feedlots and Permitted Animal Unit Capacity, Cottonwood County ......................................... 38
Table 11. Fertilizer Storage Facility Licenses and Abandoned Sites, Cottonwood County ......................... 39
Table 12. Spills and Investigations by Chemical Type, Cottonwood County .............................................. 40
Table 13. Fertilizer Related Spills and Investigations by Township, Cottonwood County .......................... 40
Table 14. Land Cover Data (2013) by Township, Cottonwood County (USDA NASS Cropland Data Layer,
Table 18. Completed Site Visits for Wells Removed from the Final Well Dataset by Township,
Cottonwood County .................................................................................................................................... 47
Table 19. Aquifer Type Distribution of Active Drinking Water Wells in Minnesota Well Index by
Township, Cottonwood County .................................................................................................................. 49
Table 20. Property Setting for Well Location .............................................................................................. 51
Table 21. Well Construction Type ............................................................................................................... 51
6
Table 22. Age of Well .................................................................................................................................. 51
Table 23. Depth of Well .............................................................................................................................. 52
Table 24. Unique Well ID Known ................................................................................................................ 52
Table 25. Livestock Located on Property .................................................................................................... 52
Table 26. Fertilizer Stored on Property ....................................................................................................... 52
Table 27. Farming on Property ................................................................................................................... 53
Table 28. Distance to an Active or Inactive Feedlot ................................................................................... 53
Table 29. Distance to Septic System ........................................................................................................... 53
Table 30. Distance to an Agricultural Field ................................................................................................. 54
Table 31. Drinking Water Well .................................................................................................................... 54
Table 32. Treatment System Present (Treatment System Used for Drinking Water) ................................ 54
Table 33. Last Tested for Nitrate................................................................................................................. 55
Table 34. Last Nitrate Test Result ............................................................................................................... 55
Table 35. Well Construction Type for Final Well Dataset ........................................................................... 56
Table 36. Well Depth for Final Well Dataset ............................................................................................... 56
Table 37. Year of Well Construction for Final Well Dataset........................................................................ 56
Table 38. Temperature (°C) of Well Water for Final Well Dataset ............................................................. 58
Table 39. pH of Well Water for Final Well Dataset ..................................................................................... 58
Table 40. Specific Conductivity (µS/cm) of Well Water for Final Well Dataset .......................................... 58
Table 41. Dissolved Oxygen (mg/L) of Well Water for Final Well Dataset ................................................. 58
7
EXECUTIVE SUMMARY
Nitrate is a naturally occurring, water soluble molecule that is made up of nitrogen and oxygen. Although nitrate occurs naturally, it can also originate from sources such as fertilizer, animal manure, and human waste. Nitrate is a concern because it can be a risk to human health at elevated levels. The Minnesota Department of Health (MDH) has established a Health Risk Limit (HRL) of 10 mg/L nitrate-N as nitrogen (nitrate-N) for private drinking water wells in Minnesota.
In response to health concerns over nitrate-N in drinking water the Minnesota Department of Agriculture (MDA) developed the Nitrogen Fertilizer Management Plan (NFMP). The NFMP outlines a statewide plan to assess vulnerable areas for nitrate in groundwater known as the Township Testing Program.
The primary goal of the Township Testing Program is to identify areas that have high nitrate concentrations in their groundwater. The program also informs residents about the health risk of their well water. Areas were selected based on historically elevated nitrate conditions, aquifer vulnerability and row crop production. More than 90,000 private well owners have been offered nitrate testing in 344 townships since 2013. This is one of the largest nitrate testing efforts ever conducted and completed.
In 2018, private wells in the Cottonwood County study area (four townships) were sampled for nitrate-N. Samples were collected from private wells using homeowner collection and mail-in methods. These initial samples were collected from 34 wells representing an average response rate of 13 percent of homeowners. Well log information was obtained when available and correlated with nitrate-N results. Initial well dataset results showed that across the study area, 8.8 percent of private wells sampled were at or above the health standard of 10 mg/L for nitrate-N. Based on the initial results, it is estimated that 64 residents could be consuming well water with nitrate-N at or over the HRL.
The MDA completed follow-up sampling and well site visits at five wells in 2019. A follow-up sampling was offered to all homeowners with wells that had a detectable nitrate-N result.
A well site visit was conducted to identify wells that were unsuitable for final analysis. The final well dataset is intended to only include private drinking water wells potentially impacted by applied commercial agricultural fertilizer. Therefore, wells that had nitrate-nitrogen results over 5 mg/L were removed from the initial dataset to form the final dataset if a potential non-fertilizer source or well problem was identified, there was insufficient information on the construction or condition of the well, or for other reasons which are outlined in Appendix E. Point sources of nitrogen can include: feedlots, subsurface sewage treatment systems, fertilizer spills, and bulk storage of fertilizer. A total of seven (20.6 percent) wells were determined to be unsuitable and were removed from the dataset. The final well dataset had a total of 27 wells.
The final well dataset was analyzed to determine the percentage of wells at or over the HRL of 10 mg/L nitrate-N. When analyzed at the township scale there were no wells at or over the HRL. However, it is important to note that in all four townships there were 11 or less samples in each township. The final dataset is not adequate to characterize a township in terms of private drinking water wells.
8
INTRODUCTION
The Minnesota Department of Agriculture (MDA) is the lead agency for nitrogen fertilizer use and management. The Nitrogen Fertilizer Management Plan (NFMP) is the state’s blueprint for prevention or minimization of the impacts of nitrogen fertilizer on groundwater. The MDA revised the NFMP in 2015. Updating the NFMP provided an opportunity to restructure county and state strategies for reducing nitrate contamination of groundwater, with more specific, localized accountability for nitrate contamination from agriculture. The NFMP outlines how the MDA addresses elevated nitrate levels in groundwater. The NFMP has four components: prevention, monitoring, assessment and mitigation.
The goal of nitrate monitoring and assessment is to develop a comprehensive understanding of the severity, magnitude, and long-term trends of nitrate in groundwater as measured in public and private wells. The MDA established the Township Testing Program to determine current nitrate concentrations in private wells on a township scale. This program is designed to quickly assess a township in a short time window. Monitoring focuses on areas of the state where groundwater nitrate contamination is more likely to occur. This is based initially on hydrogeologically vulnerable areas where appreciable acres of agricultural crops are grown. Statewide more than 90,000 private well owners have been offered nitrate testing in 344 townships since 2013.
In 2018, four townships in Cottonwood County were selected to participate in the Township Testing Program (Figure 1). Areas were chosen based on several criteria. Criteria used includes: professional knowledge shared by the local soil and water conservation district (SWCD) or county environmental departments, past high nitrate as nitrogen (nitrate-N) results, vulnerable groundwater, and the amount of row crop production. Initial water samples were collected from private wells by homeowners and mailed to a laboratory. Sample results were mailed by the laboratory to the participating homeowners. The sampling, analysis, and results were provided at no cost to participating homeowners and paid for by the Clean Water Fund.
Well owners with detectable nitrate-N results were offered a no cost pesticide sample and a follow-up nitrate-N sample collected by MDA staff. The MDA began evaluating pesticide presence and concentrations in private water wells at the direction of the Minnesota Legislature. The follow-up pesticide and nitrate-N sampling in Cottonwood County occurred during 2019. The follow-up included a well site visit (when possible) in order to rule out well construction issues and to identify potential point sources of nitrogen (Appendix B).
Wells that had nitrate-nitrogen results over 5 mg/L were removed from the initial dataset to form the final dataset if a potential non-fertilizer source or well problem was identified, there was insufficient information on the construction or condition of the well, or for other reasons which are outlined in Appendix E. After the unsuitable wells were removed, the nitrate-N concentrations of well water were assessed for each area.
For further information on the NFMP and Township Testing Program, visit the following webpages:
In many rural areas of Minnesota, nitrate is one of the most common contaminants in groundwater, and in some localized areas, a significant number of wells have high nitrate levels.
Nitrate is a naturally occurring, water soluble molecule that is made up of nitrogen and oxygen. Although nitrate occurs naturally, it can also originate from other sources such as fertilizer, animal manure, and human waste. Nitrate is a concern because it can have a negative effect on human health at elevated levels. The United States Environmental Protection Agency has established a drinking water Maximum Contaminant Level (MCL) of 10 mg/L for nitrate-N (US EPA, 2009) in municipal water systems. The Minnesota Department of Health (MDH) has also established a Health Risk Limit (HRL) of 10 mg/L nitrate-N for private drinking water wells in Minnesota.
Nitrogen present in groundwater can be found in the forms of nitrite and nitrate. In the environment, nitrite generally converts to nitrate, which means nitrite occurs very rarely in groundwater. The nitrite concentration is commonly less than the reporting level of 0.01 mg/L, resulting in a negligible contribution to the nitrate plus nitrite concentration (Nolan and Stoner, 2000). Therefore, analytical methods generally combine nitrate plus nitrite together. Measurements of nitrate plus nitrite as nitrogen and measurements of nitrate as nitrogen will hereafter be referred to as “nitrate”.
NITRATE FATE AND TRANSPORT
Nitrate is considered a conservative anion and is highly mobile in many shallow coarse-textured groundwater systems. Once in groundwater, nitrate is often considered very stable and can move large distances from its source. However, in some settings nitrate in groundwater may be converted to nitrogen gas in the absence of oxygen and the presence of organic carbon through a natural process called denitrification. Denitrification occurs when oxygen levels are depleted and nitrate becomes the primary oxygen source for microorganisms (Dubrovsky et al., 2010). In sandy glacial stream deposits, such as parts of Cottonwood County, contaminants like nitrate can travel quickly to the aquifer (Brant, 1997), leaving little chance for denitrification or other attenuating processes. As a result, certain areas of Cottonwood County with glacial stream deposits and intensive row crop agriculture may be particularly vulnerable to elevated nitrate concentrations. It is important to note that geochemical conditions can be highly variable within an aquifer or region and can also change over-time (MPCA, 1998).
GEOLOGY AND HYDROGEOLOGY
From approximately 2.5 million years ago to 11,700 years ago, much of the northern Hemisphere, including Minnesota, was intermittently covered by sheets of slowly moving ice known as glaciers (Lusardi & Dengler, 2017). During colder times, the glaciers would grow and move farther south, sometimes covering most of Minnesota, and during warmer times the glaciers would melt and retreat farther north, away from Minnesota (Lusardi & Dengler, 2017). As these glaciers moved, they moved the earth beneath them and deposited it in other places, destroying the old landscapes and creating new ones in their place (Lusardi & Dengler, 2017).
The geology of Cottonwood County was heavily shaped by glaciation. During the most recent glacial period, about 14,000 to 12,000 years ago, the Des Moines Lobe glacier advanced and retreated across southwestern Minnesota leaving behind sediments, mostly tills (Gowan and Jennings, 2016). Veins of sandy glacial stream deposits were left by the meltwater of the Des Moines Lobe and by older glaciers
11
(Lusardi et al., 2019). These glacial stream deposits contain more sand and gravel than the till, allowing for contaminated water to more easily travel through (Bradt, 1997). Thus, aquifers within or beneath the glacial stream deposits tend to be more vulnerable to contamination (Adams, 2016; Bradt, 1997).
The eastern, central, and much of the western portion of Cottonwood County is dominated by supraglacial deposits (Figure 2). This till was often deposited on ice, such as on lakes and streams, and experienced mass movements during deposition (Patterson et al., 1995).
Figure 2. Statewide Geomorphology Layer, Sediment Association in Cottonwood County (MDNR, MGS,
and UMD, 1997)
NITROGEN POINT SOURCES
The focus of the Township Testing Program is to assess nitrogen contamination in groundwater as a result of commercial nitrogen fertilizer applied to cropland. Any wells potentially impacted by point sources were removed from the final well dataset. Potential point sources such as subsurface sewage treatment systems (more commonly known as septic systems), feedlots, bulk storage of fertilizer and fertilizer spillsare considered in this section. Below is a brief overview of these sources in Cottonwood County. Further details are in Appendix B.
12
SUBSURFACE SEWAGE TREATMENT SYSTEM
Subsurface sewage treatment systems (SSTS) can be a potential source for contaminants in groundwater such as nitrate and fecal material (MDH, 2014). A total of 1,524 SSTS were reported in Cottonwood County for 2018. Over a recent 17-year period (2002-2018), 606 construction permits for new, replacement, or repairs for SSTS were issued. Of all the reported septic systems in Cottonwood County, 40 percent are newer than 2002 or have been repaired since 2002 (MPCA, 2019b). When new SSTS’s are installed they are required to be in compliance with the rules at the time of installation. Newer systems meet modern SSTS regulations and must comply with the current well code; which requires a 50-foot horizontal separation from the well (MDH, 2014).
FEEDLOT
Manure produced on a feedlot can be a potential source of nitrogen pollution if improperly stored or spread. In the Cottonwood County study area, there are a total of 48 active feedlots. Nineteen are permitted to house 300 or more animal units (AU) (Appendix B; Figure 9).
FERTILIZER STORAGE LOCATION
Bulk fertilizer storage locations are potential point sources of nitrogen because they store large concentrations of nitrogen-based chemicals. Licenses are required for individuals and companies that store large quantities of fertilizer. The Cottonwood County study area has four fertilizer storage licenses, two each in Amboy and Southbrook Townships (Appendix B; Table 11).
FERTILIZER SPILLS AND INVESTIGATIONS
Two historic fertilizer spill and investigation were recorded in the Cottonwood County study area, both were categorized as small spills and investigations (Appendix B; Table 13).
13
TOWNSHIP TESTING METHODS
VULNERABLE TOWNSHIPS
Well water sampling is focused on areas that are considered vulnerable to groundwater contamination by commercial nitrogen fertilizer. Typically, townships and cities are selected for sampling if more than 30 percent of the underlying geology is considered vulnerable and more than 20 percent of the land cover is row crop agriculture. These are not rigid criteria but are instead used as a starting point for creating an initial plan. Additional factors such as previous nitrate results and local knowledge of groundwater conditions were used to prioritize townships for testing. A statewide map of townships that were chosen for testing is shown in Figure 3.
Figure 3. Minnesota Vulnerable Townships Tested for Nitrate in Private Wells.
14
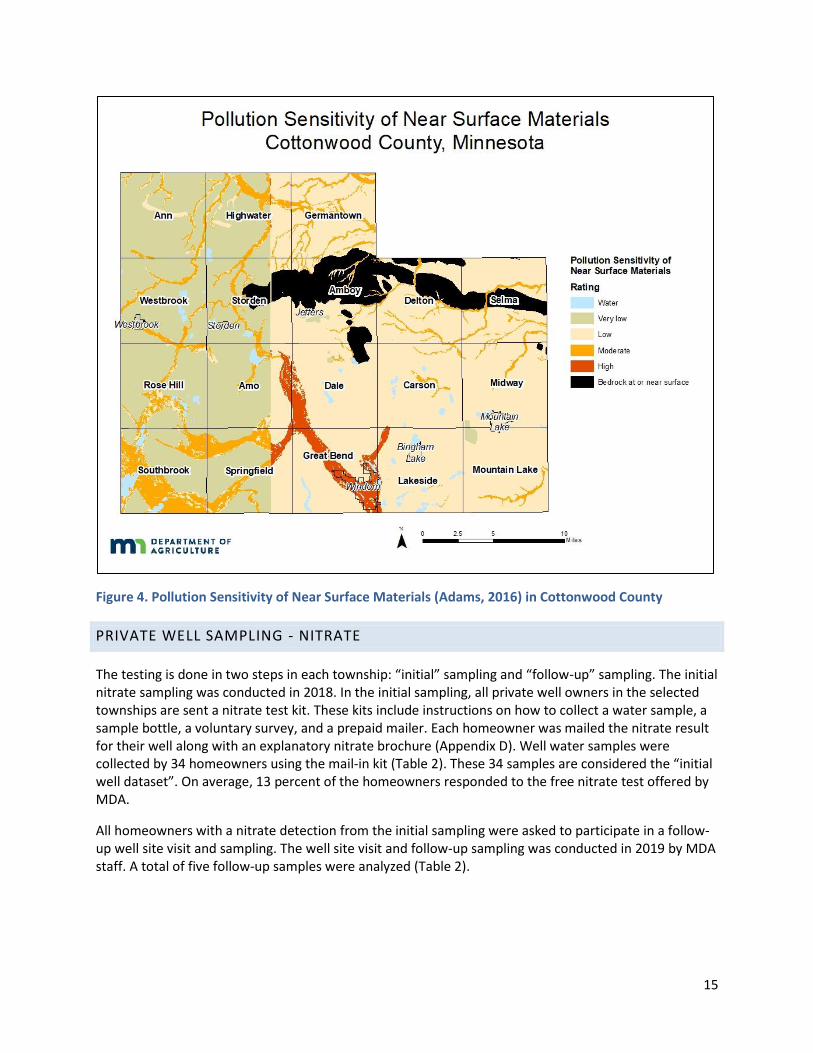
An updated statewide sensitivity rating from the Minnesota Department of Natural Resources (Adams, 2016) was used to estimate the percentage of geology vulnerable to groundwater contamination when it became available. There are several ratings for aquifer sensitivity: ultra-low, very low, low, moderate, and high. Sensitivity ratings are described in Table 1. The ratings are based upon DNR’s “Pollution Sensitivity of Near-Surface Materials” (Adams, 2016).
There are several “special conditions” classifications in the statewide sensitivity ratings where unique geological environments occur (Figure 4). The special conditions include: karst, bedrock at or near surface, peatlands, and disturbed lands. Karst is defined as “terrain with distinctive landforms and hydrology created primarily from the dissolution of soluble rocks”. Distinctive features such as sink holes, springs and caves are visual evidence of karst activity on the land’s surface. Karst features are important when discussing groundwater because these features can allow rapid water flow from the surface to the groundwater, which can allow contaminants to move quickly as well (Adams, Barry, & Green, 2016). Bedrock at or near the surface can have unpredictable and variable transmission rates for water due to local macro features such fractures, and voids. Peatlands are located in north central Minnesota. They are composed of saturated organic materials that are 6 to 175 feet thick. Since the model to determine the sensitivity ratings only uses unsaturated conditions the peatlands do not fit this model. Disturbed lands include areas such as mining pits, or other large areas disturbed by humans. However, this does not include urban areas, which are undifferentiated on the map.
Table 1. Pollution Sensitivity of Near-Surface Materials, (Adams, 2016)
Near-Surface Pollution Sensitivity Time of Travel Description
High ≤ 170 hours Hours to a week
Moderate >170–430 hours A week to weeks
Low >430–1600 hours Weeks to months
Very Low >1600–8000 hours Months to a year
Ultra-Low >8000 hours More than a year
15
Figure 4. Pollution Sensitivity of Near Surface Materials (Adams, 2016) in Cottonwood County
PRIVATE WELL SAMPLING - NITRATE
The testing is done in two steps in each township: “initial” sampling and “follow-up” sampling. The initial nitrate sampling was conducted in 2018. In the initial sampling, all private well owners in the selected townships are sent a nitrate test kit. These kits include instructions on how to collect a water sample, a sample bottle, a voluntary survey, and a prepaid mailer. Each homeowner was mailed the nitrate result for their well along with an explanatory nitrate brochure (Appendix D). Well water samples were collected by 34 homeowners using the mail-in kit (Table 2). These 34 samples are considered the “initial well dataset”. On average, 13 percent of the homeowners responded to the free nitrate test offered by MDA.
All homeowners with a nitrate detection from the initial sampling were asked to participate in a follow-up well site visit and sampling. The well site visit and follow-up sampling was conducted in 2019 by MDA staff. A total of five follow-up samples were analyzed (Table 2).
16
Table 2. Homeowner Participation in Initial and Follow-Up Well Water Sampling, Cottonwood County
Township Kits Sent Initial Well Dataset Well Site Visits &
Follow-Up Sampling Conducted
Amboy 94 7 1
Dale 48 5 2
Germantown 88 10 1
Southbrook 30 12 1
Total 260 34 5
Each follow-up visit was conducted at the well site by a trained MDA hydrologist. Well water was purged from the well for 15 minutes before a sample was collected to ensure a fresh water sample. Additionally, precautions were taken to ensure no cross-contamination occurred. A more thorough explanation of the sampling process is described in the sampling and analysis plan (MDA, 2018b). As part of the follow-up sampling, homeowners were offered a no cost pesticide test. As pesticide results are finalized, they will be posted online in a separate report (www.mda.state.mn.us/pwps).
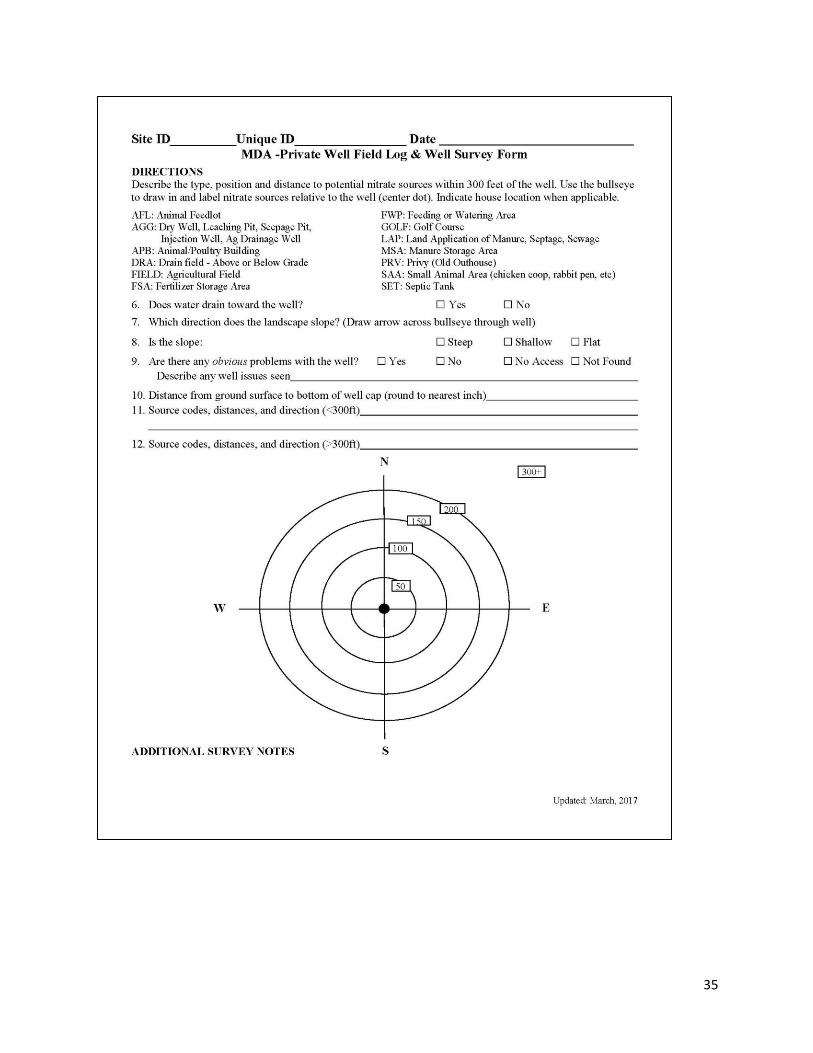
The well site visit was used to collect information on potential nitrogen point sources, well characteristics (construction type, depth, and age), and the integrity of the well construction. Well site visit information was recorded on the Private Well Field Log & Well Survey Form (Appendix A). Starting in 2018 a digital version of this form was utilized.
WELL ASSESSMENT
All wells testing higher than 5 mg/L were carefully examined for potential well construction, potential point sources, and other potential concerns.
Using the following criteria, a total of seven wells were removed to create the final well dataset. See Appendix E (Tables 17 and 18) for a summary of the removed wells.
HAND DUG
All hand dug wells were excluded from the dataset, regardless of the nitrate concentration. Hand dug wells do not meet well code and are more susceptible to local surface runoff contamination. Hand dug wells are often very shallow, typically just intercepting the water table, and therefore are much more sensitive to local surface runoff contamination (feedlot runoff), point source pollution (septic system effluent), or chemical spills.
POINT SOURCE
Well code in Minnesota requires wells to be at least 50 feet away from most possible nitrogen point sources such as SSTS (septic tanks and drain fields), animal feedlots, etc. Wells with a high nitrate (>5 mg/L) concentration that did not maintain the proper distance from these point sources were removed from the final well dataset. Information gathered from well site visits was used to assess these distances. If a well was not visited by MDA staff, the well survey information provided by the homeowner and aerial imagery was reviewed.
The well site visits allowed the MDA staff to note the well construction of each well. Some wells had noticeable well construction problems. For instance, wells with a cap missing or a crack in the cap makes the groundwater in that well susceptible to pollution. Other examples include wells buried underground or wells with cracked casing. Wells with significant problems such as these were excluded from the final well dataset.
UNSURE OF WATER SOURCE OR KNOWN NON DRINKING WATER SOURCE
If the water source of the sample was uncertain, or from an unwanted source, then data pertaining to the sample was removed. For example, these samples include water that may have been collected from an indoor tap with a reverse osmosis system. Water samples that were likely collected from a municipal well were also removed from the dataset. This study examines raw well water not treated water or municipal water.
SITE VISIT COMPLETED - WELL NOT FOUND & CONSTRUCTED BEFORE 1975 OR AGE
UNKNOWN & NO WELL ID
Old wells with no validation on the condition of well construction were removed from the dataset. These wells were installed before the well code was developed in Minnesota (mid-1975), did not have a well log, and MDA staff could not locate the well during a site visit. Additionally, if the age of the well could not be determined it was assumed to be an older well.
NO SITE VISIT & CONSTRUCTED BEFORE 1975 OR AGE UNKNOWN & NO WELL ID
If no site visit was conducted, and the well is an older well (pre-1975), the well would not be used in the final analysis. If the age of the well could not be determined these were again assumed to be older wells.
NO SITE VISIT & INSUFFICIENT DATA & NO WELL ID
Wells that were clearly lacking necessary background information were also removed from the final well dataset. These wells did not have an associated well log, were not visited by MDA staff, and the homeowner did not fill out the initial well survey or the address could not be found.
18
INITIAL RESULTS
INITIAL WELL DATASET
A total of 34 well owners returned water samples for analysis in the study area (Figure 5). These wells represent the initial well dataset. The following paragraphs provide a brief discussion of the statistics presented in Table 3.
The minimum values of nitrate were less than the detection limit (<DL) which is 0.03 mg/L. The maximum values ranged from 1.3 to 16.3 mg/L, with Amboy Township having the highest result. The mean values ranged from 0.3 to 7.8 mg/L. The 90th percentiles ranged from 1.3 to 16.1 mg/L, with Amboy Township having the highest 90th percentile.
Initial results from the sampling showed that three of the four townships in the study area had less than 5 percent of wells at or over 10 mg/L nitrate-N and one township had more than 10 percent of wells at or over 10 mg/L nitrate-N (Figure 6). The township testing results are similar to findings from a 2010 USGS report on nitrate concentrations in private wells in the glacial aquifer systems across the upper United States (US) in which less than five percent of sampled private wells had nitrate concentrations greater than 10 mg/L (Warner and Arnold, 2010). Both the USGS and the township testing studies indicate that nitrate concentrations can vary considerably over short distances.
Figure 5. Well Locations and Nitrate Results from Initial Dataset in Cottonwood County
19
Figure 6. Results of Initial Testing by Township in Cottonwood County
20
Table 3. Cottonwood County Township Testing Summary Statistics for Initial Well Dataset
Values Percentiles Number of Wells Percent of Wells
<DL stands for less than a detectable limit. This means results are less than 0.03 mg/L. The 50th percentile (75th, 90th, 95th, and 99th) is the value below which 50 percent
(75%, 90%, 95%, and 99%) of the observed values fall.
ESTIMATES OF POPULATION AT RISK
The human population at risk of consuming well water at or over the HRL of 10 mg/L nitrate-N was estimated based on the sampled wells. An estimated 64 people in Cottonwood County’s study area have drinking water over the nitrate HRL (Table 4). Nitrate contamination in wells is not a widespread problem for Cottonwood County homeowners.
Table 4. Estimated Population with Water Wells Over 10mg/L Nitrate-N, Cottonwood County
Township Estimated Households
on Private Wells* Estimated Population
on Private Wells* Estimated Population ≥10 mg/L Nitrate-N**
Amboy 66 150 64
Dale 57 131 0
Germantown 32 81 0
Southbrook 85 197 0
Total 240 559 64
*Data collected from the Minnesota State Demographic Center (Minnesota SDC, 2020) **Estimates based off the 2018 estimated households per township gathered from Minnesota State Demographic Center and percentage of wells at or over the HRL from the initial well dataset
WELL SETTING AND CONSTRUCTION
MINNESOTA WELL INDEX AND WELL LOGS
The Minnesota Well Index (MWI) (formerly known as the “County Well Index”) is a database system developed by the Minnesota Geological Survey and the Minnesota Department of Health (MDH) for the storage, retrieval, and editing of water-well information. The database contains basic information on well records (e.g. location, depth, static water level) for wells constructed in Minnesota.
The database also contains information on the well log and the well construction for many private drinking water wells. The MWI is the most comprehensive Minnesota well database available but contains only information for wells in which a well log is available. Most of the records in MWI are for wells drilled after 1974, when water-well construction code required well drillers to submit records to the MDH (MGS, 2012). The MWI does contain data for some records obtained by the MGS through the cooperation of drillers and local government agencies for wells drilled before 1974 (MDH, 2019).
In some cases, well owners were able to provide unique well identification numbers for their wells. When the correct unique IDs are provided, a well log can be used to identify the aquifer that the well withdraws water from. The well logs were obtained from the MWI for six documented wells (Table 5). Therefore, approximately 18 percent of the sampled wells had corresponding well logs with two having an aquifer identified. Thus, the data gathered on aquifers represents approximately six percent of the total sampled wells.
The aquifers in Table 5 are arranged from the geologically youngest units on the top to the older units. According to the well log data of the documented wells sampled, there were two identified aquifer
22
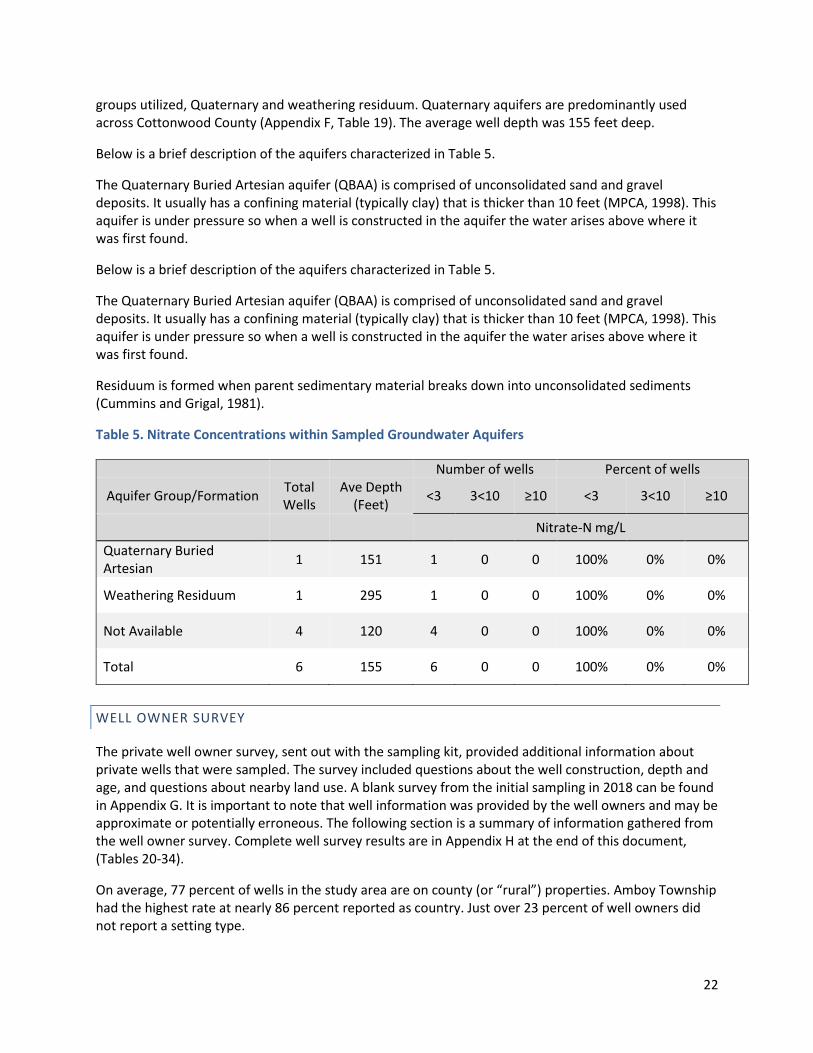
groups utilized, Quaternary and weathering residuum. Quaternary aquifers are predominantly used across Cottonwood County (Appendix F, Table 19). The average well depth was 155 feet deep.
Below is a brief description of the aquifers characterized in Table 5.
The Quaternary Buried Artesian aquifer (QBAA) is comprised of unconsolidated sand and gravel deposits. It usually has a confining material (typically clay) that is thicker than 10 feet (MPCA, 1998). This aquifer is under pressure so when a well is constructed in the aquifer the water arises above where it was first found.
Residuum is formed when parent sedimentary material breaks down into unconsolidated sediments (Cummins and Grigal, 1981).
Table 5. Nitrate Concentrations within Sampled Groundwater Aquifers
Number of wells Percent of wells
Aquifer Group/Formation Total Wells
Ave Depth (Feet)
<3 3<10 ≥10 <3 3<10 ≥10
Nitrate-N mg/L
Quaternary Buried Artesian
1 151 1 0 0 100% 0% 0%
Weathering Residuum 1 295 1 0 0 100% 0% 0%
Not Available 4 120 4 0 0 100% 0% 0%
Total 6 155 6 0 0 100% 0% 0%
WELL OWNER SURVEY
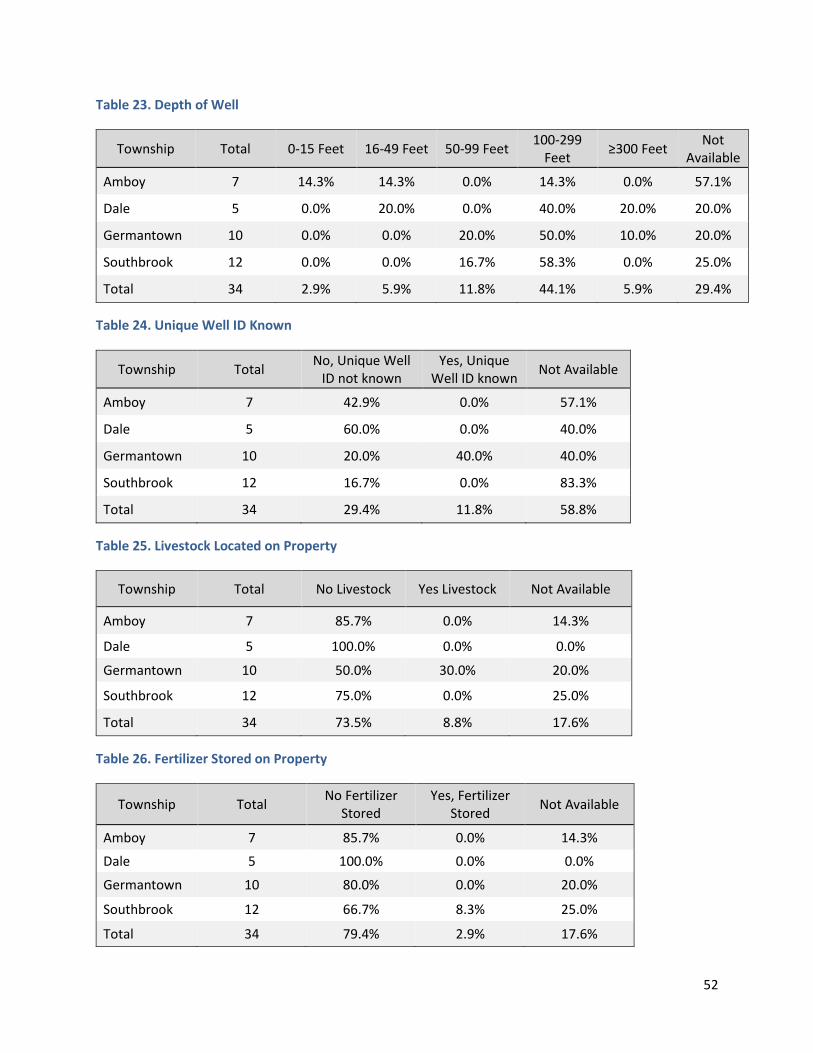
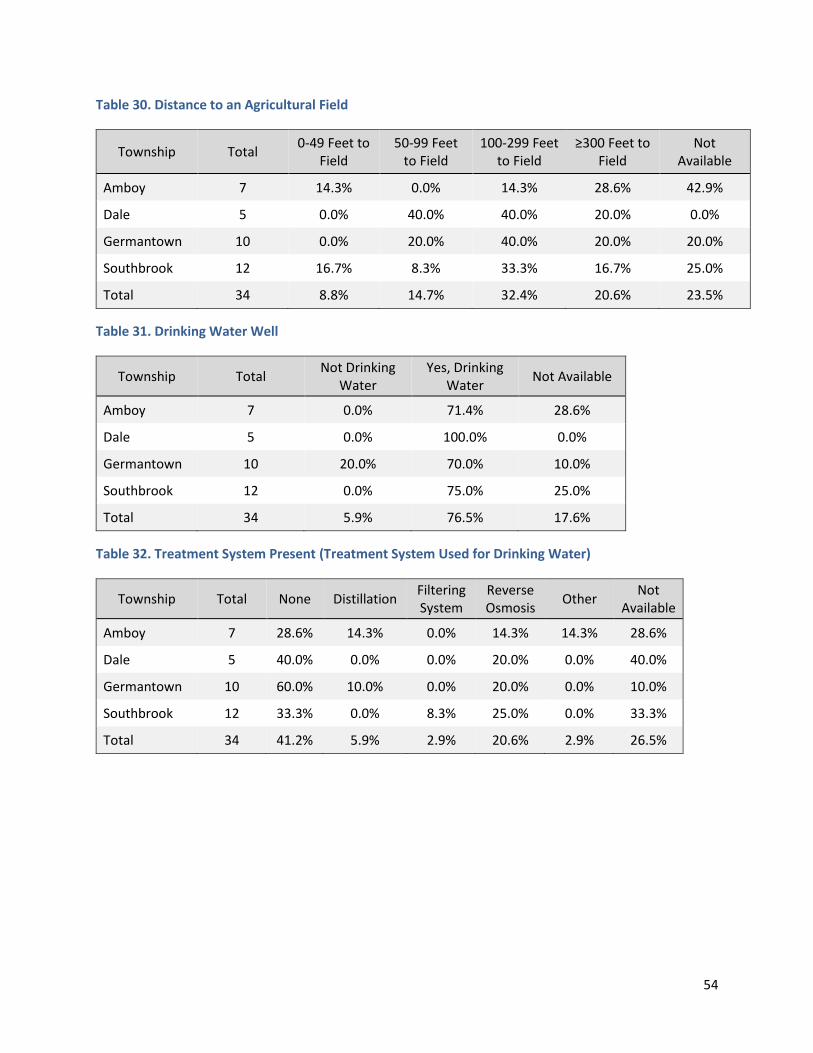
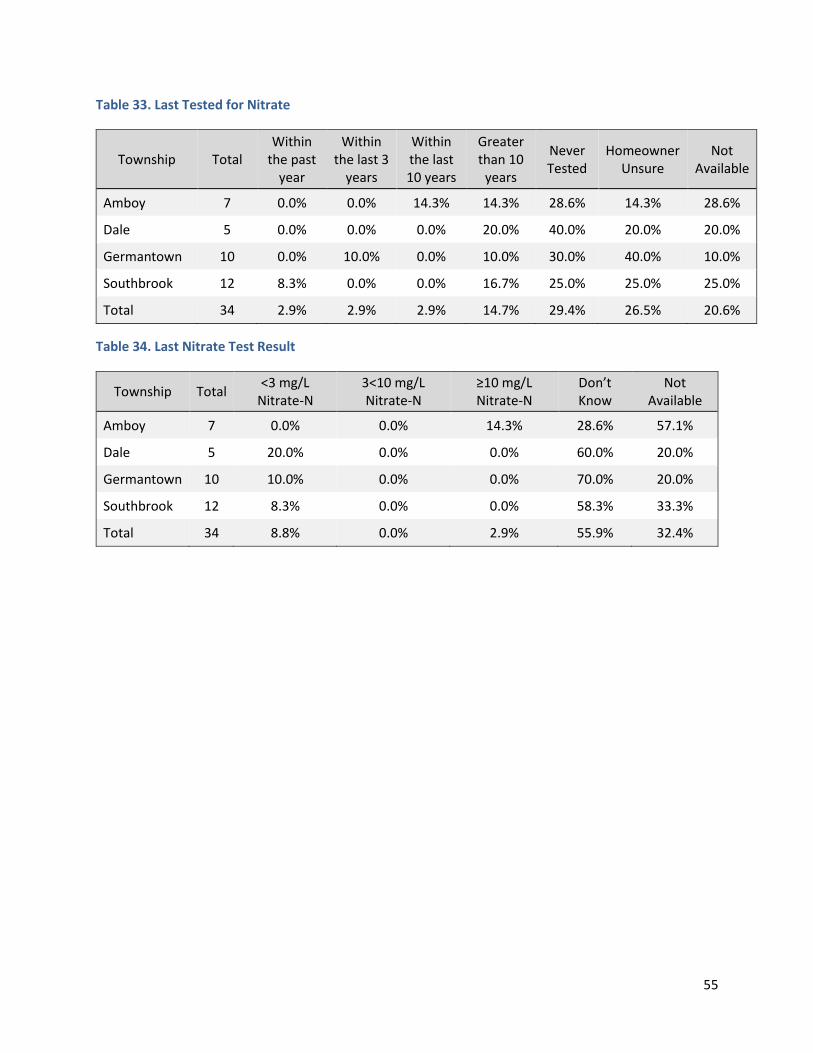
The private well owner survey, sent out with the sampling kit, provided additional information about private wells that were sampled. The survey included questions about the well construction, depth and age, and questions about nearby land use. A blank survey from the initial sampling in 2018 can be found in Appendix G. It is important to note that well information was provided by the well owners and may be approximate or potentially erroneous. The following section is a summary of information gathered from the well owner survey. Complete well survey results are in Appendix H at the end of this document, (Tables 20-34).
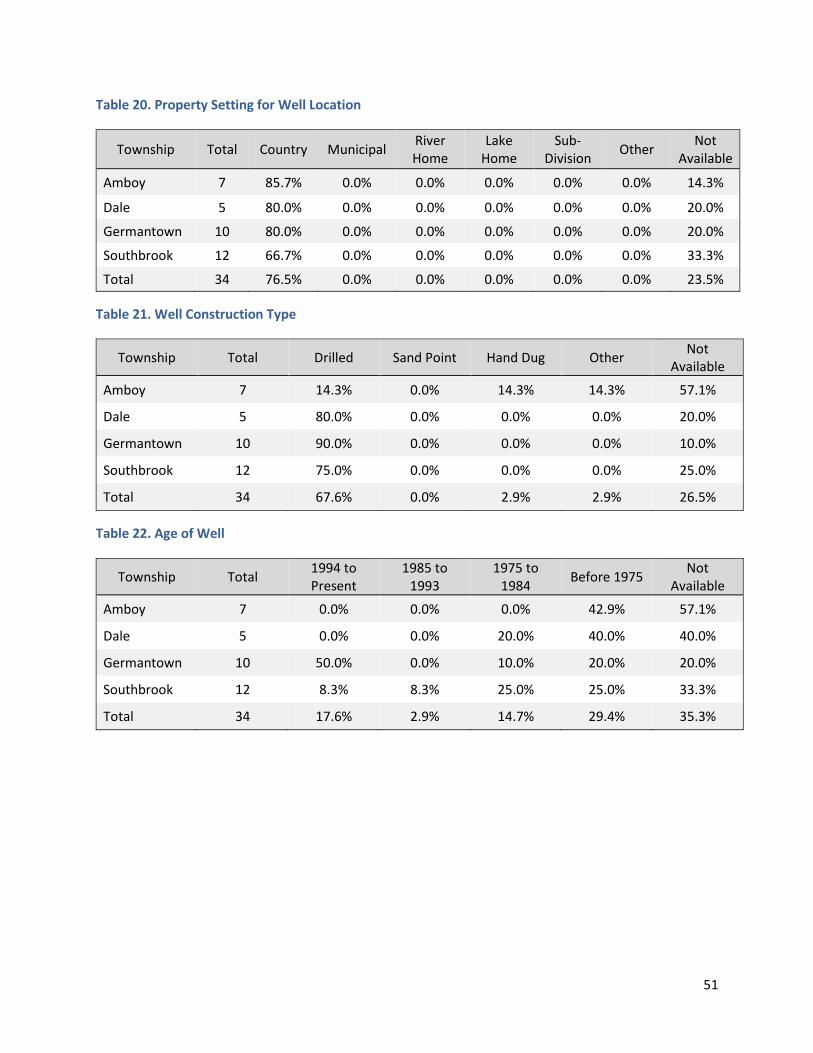
On average, 77 percent of wells in the study area are on county (or “rural”) properties. Amboy Township had the highest rate at nearly 86 percent reported as country. Just over 23 percent of well owners did not report a setting type.
23
Approximately 68 percent of sampled wells are of drilled construction. Three percent are hand dug and three percent reported as other. There are no sand point wells. Sand point wells are also usually installed in areas where sand is the dominant geologic material and where there are no thick confining units such as clay. This makes sand point wells more vulnerable to contamination from the surface. As mentioned previously, hand dug wells are also shallow and more sensitive to local surface runoff contamination than deeper drilled wells.
Most of the sampled wells are between 100-299 feet deep, and few wells (six percent) are over 300 feet deep. Approximately 29 percent of homeowners did not know or did not respond to this question.
Most of the wells (71 percent) had not been tested for nitrate within the last ten years or homeowners were unsure if they had been tested. Approximately three percent of homeowners responded that their well had been tested for nitrate in the last year. Therefore, the results most homeowners receive from this study will provide new information.
POTENTIAL NITRATE SOURCE DISTANCES
The following summary relates to isolation distances of potential point sources and non-point sources of nitrate that may contaminate wells. This information was obtained from the well surveys completed by the homeowner. Complete well survey results are in Appendix H at the end of this document (Tables 20-34).
• On average, farming takes place on 61.8 percent of the properties.
• Agricultural fields further than 300 feet from wells at about 20.6 percent of the properties.
• Most well owners (73.5 percent) across all townships responded that they do not have livestock (greater than ten head of cattle or other equivalent) on their property.
• Less than nine percent of wells are less than 100 feet from an active or inactive feedlot.
• Very few well owners (2.9 percent) across all townships store more than 500 pounds of fertilizer on their property.
• A small minority of wells (2.9 percent) are less than 50 feet away from septic systems.
24
FINAL RESULTS
FINAL WELL DATASET
A total of 34 well water samples were collected by homeowners in four townships. Seven wells (20.6 percent) were found to be unsuitable and were removed to create the final well dataset. The final analysis was conducted on the remaining 27 wells (Table 6). The wells in the final well dataset represent drinking water wells potentially impacted by applied commercial agricultural fertilizer.
WELL WATER NITROGEN ANALYSIS
The final analysis was based on the number of wells at or over the nitrate HRL of 10 mg/L.
Table 6 shows the results for all townships sampled. No wells were at or over the HRL.
Table 6. Initial and Final Well Dataset Results, Cottonwood County
Township Initial Well Dataset Final well Dataset Final Wells ≥10 mg/L Nitrate-N
Count Percentage
Amboy 7 3 0 0.0%
Dale 5 3 0 0.0%
Germantown 10 10 0 0.0%
Southbrook 12 11 0 0.0%
Total 34 27 0 0.0%
The individual nitrate results from this final well dataset are displayed spatially in Figure 7. Due to the inconsistencies with geocoding the locations, the accuracy of the points is variable.
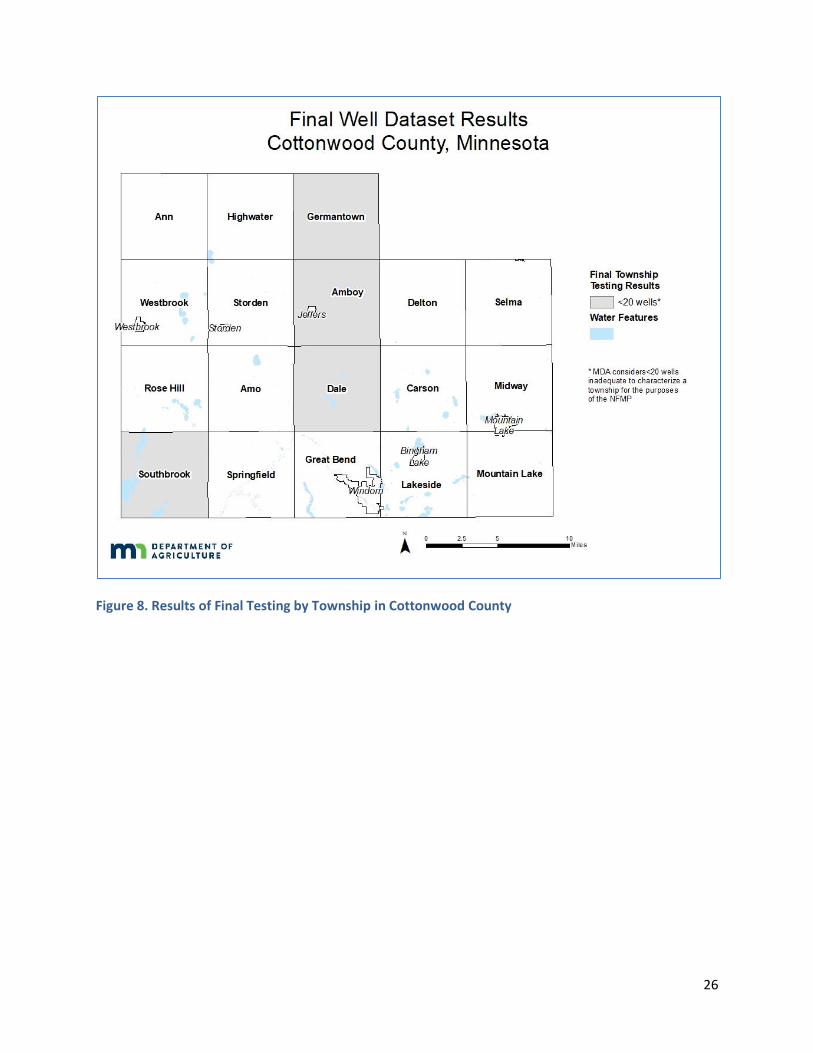
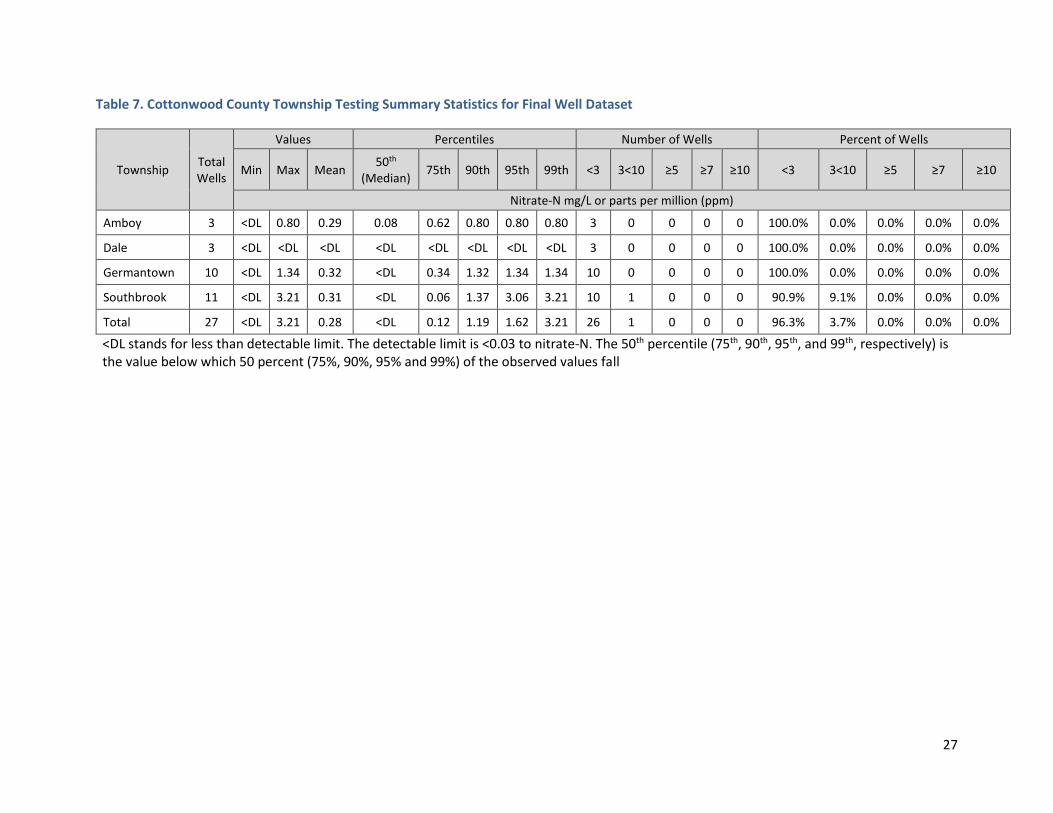
The final well dataset summary statistics are shown in Table 7. The minimum values were all below the detection limit. The maximum values ranged from below the detection limit to 3.21 mg/L nitrate-N, with Southbrook Township having the highest result. The 90th percentile ranged from below the detection limit to 1.37 mg/L nitrate-N. Final results showed that every township in the study area had less than 5 percent of wells at or over 10 mg/L nitrate-N However, it is important to note that in all four townships there were 11 or less samples in each township. The final dataset is not adequate to characterize a township in terms of private drinking water wells (Figure 8).
25
Figure 7. Well Locations and Nitrate Results from Final Well Dataset in Cottonwood County
26
Figure 8. Results of Final Testing by Township in Cottonwood County
27
Table 7. Cottonwood County Township Testing Summary Statistics for Final Well Dataset
Township Total Wells
Values Percentiles Number of Wells Percent of Wells
<DL stands for less than detectable limit. The detectable limit is <0.03 to nitrate-N. The 50th percentile (75th, 90th, 95th, and 99th, respectively) is the value below which 50 percent (75%, 90%, 95% and 99%) of the observed values fall
28
As discussed previously, the areas selected were deemed most vulnerable to nitrate contamination of groundwater. Table 8 compares the final results to the percent of vulnerable geology (Adams, 2016) and row crop production (USDA NASS, 2013) in each township. The percent land area considered vulnerable geology and in row crop production was estimated using a geographic information system known as ArcGIS.
Table 8. Township Nitrate Results Related to Vulnerable Geology and Row Crop Production,
Cottonwood County
Township Final Well Dataset
Percent of Land in Row Crop
Production 2013*
Percent of Land in Vulnerable Geology**
Percent ≥7 mg/L Percent ≥10 mg/L
Nitrate-N mg/L or parts per million (ppm)
Amboy 3 89% 55% 0.0% 0.0%
Dale 3 82% 12% 0.0% 0.0%
Germantown 10 80% 16% 0.0% 0.0%
Southbrook 11 58% 37% 0.0% 0.0%
Total 27 77% 30% 0.0% 0.0%
*Data retrieved from USDA NASS Cropland Data Layer, 2013. ** The DNR Pollution Sensitivity of Near Surface Materials was used determine vulnerability (ratings of High, Karst, Moderate and Bedrock at or close to surface are included in this "vulnerable" rating)
WELL AND WATER CHARACTERISTICS
WELL CONSTRUCTION
Unique identification numbers from well logs were compiled for the wells in the Cottonwood County final well dataset. The well logs provided information on the well age, depth, and construction type (MDH Minnesota Well Index Database; https://apps.health.state.mn.us/cwi/). These well characteristics for the final well dataset were also provided by some homeowners. The well characteristics are described below, and a more comprehensive view is provided in Appendix I (Tables 35-37).
• Most wells were drilled (78 percent), and none were identified as sand point wells.
• The median depth of wells was 151 feet, and the deepest was 295 feet.
• The median year the wells were constructed in was 2008.
WELL WATER PARAMETERS
MDA staff conducted the follow-up sampling and well site surveys at five wells. Three of these wells were removed, leaving two follow-up wells included in the final well dataset. Field measurements of the well water parameters were recorded on the Private Well Field Log & Well Survey Form (Appendix J). Starting in 2018 a digital version of this form was utilized. The measurements included temperature, pH, specific conductivity, and dissolved oxygen. The well was purged for 15 minutes, so that the measurements stabilized, ensuring a fresh sample of water was collected. The stabilized readings for the
final well dataset are described below and a more comprehensive view is available in Appendix K (Tables 38-41). No measurements were recorded in Amboy or Dale Township.
• The temperatures ranged from 10.78 °C to 10.97 °C
• The water from the wells had a median pH of 7.48
• The median specific conductivity was 1,741 µS/cm, and was as high as 2,220 µS/cm
• The dissolved oxygen readings ranged from 0.14 mg/L to 0.81 mg/L
Water temperature can affect many aspects of water chemistry. Warmer water can facilitate quicker chemical reactions, and dissolve surrounding rocks faster; while cooler water can hold more dissolved gases such as oxygen (USGS, 2016).
The United States Environmental Protection Agency has set a secondary pH standard of 6.5-8.5 in drinking water. These are non-mandatory standards that are set for reasons not related to health, such as taste and color (40 C.F.R. §143).
Specific conductance is the measure of the ability of a material to conduct an electrical current at 25°C. Thus, the more ions present in the water, the higher the specific conductance measurement (Hem, 1985). Rainwater and freshwater range between 2 to 100 µS/cm. Groundwater is between 50 to 50,000 µS/cm (Sanders, 1998).
Dissolved oxygen concentrations are important for understanding the fate of nitrate in groundwater. When dissolved oxygen concentrations are low (<0.5 mg/L) (Dubrovsky et al., 2010), bacteria will use electrons on the nitrate molecule to convert nitrate into nitrogen gas (N2). Thus, nitrate can be removed from groundwater through the process known as bacterial denitrification (Knowles, 1982).
30
SUMMARY
The focus of this study was to assess nitrate concentrations in groundwater impacted by commercial agricultural fertilizer in selected townships in Cottonwood County. In order to prioritize testing, the MDA looked at townships with significant row crop production and vulnerable geology. Row crop agriculture covers 77 percent of the land in the study area with eight wells permitted for groundwater irrigation in the study area.
Four townships were sampled covering over 92,007 acres. The initial (homeowner collected) nitrate sampling resulted in 34 samples. The 34 households that participated represent an approximately 13.1 percent return rate of homeowner-offered sampling kits. The initial well dataset represents private well drinking water regardless of the potential source of nitrate. Well owners with measurable nitrate results were offered a follow-up nitrate sample and a pesticide sample. The MDA visited and collected follow-up samples at five wells.
The MDA conducted a nitrogen source assessment and identified wells near potential point sources and wells with poor construction. A total of seven (20.6 percent) wells were found to be unsuitable and were removed from the initial dataset to form the final dataset of 27 wells. The remaining wells were believed to be impacted by nitrogen fertilizer and were included in the final well dataset.
In the final well dataset, most of the wells (77.8 percent) are drilled. Information on construction type for the remaining wells is not available. The median depth of the wells is 151 and depths range from 64 to 295 feet.
For the final well dataset, there were no townships that had more than 10 percent of wells at or over the nitrate Health Risk Limit of 10 mg/L. All tested townships had no wells at or over the nitrate Health Risk Limit. However, it is important to note that in all four townships there were 11 or less samples in each township. The final dataset is not adequate to characterize a township in terms of private drinking water wells.
31
REFERENCES
Adams, R. (2016). Pollution sensitivity of near-surface materials: St. Paul, Minnesota Department of
Natural Resources, Minnesota Hydrogeology Atlas Series HG-02, report and plate, accessible at
Cottonwood County, MN. (2013). Cottonwood County Subsurface Sewage Treatment System Ordinance
38. Retrieved from https://www.co.cottonwood.mn.us/files/2515/5838/8036/June_2016_SSTS_
Ordinance_38.pdf
Cummins, J. F. and Grigal, D. F. (1981). Legend to Map Soil and Land Surfaces of Minnesota 1980. Agricultural Experiment Station St. Paul, MN 55108: Department of Soil Science University of Minnesota. Retrieved from www.mngeo.state.mn.us/pdf/Cummins&Grigal%20soils.pdf
Minnesota Pollution Control Agency [MPCA]. (2017a). Feedlot Registration Form (wq-f4-12). St. Paul, MN: Minnesota Pollution Control Agency. Retrieved from www.pca.state.mn.us/quick-links/registration-permits-and-environmental-review.
Minnesota Pollution Control Agency [MPCA]. (2017b). Livestock and the Environment: MPCA Feedlot
Program Overview (wq-f1-01). St. Paul, MN: Minnesota Pollution Control Agency. Retrieved
from www.pca.state.mn.us/sites/default/files/wq-f1-01.pdf.
Minnesota Pollution Control Agency [MPCA]. (2020). Feedlots in Minnesota [Data file]. St. Paul, MN:
Minnesota Pollution Control Agency. Retrieved from https://gisdata.mn.gov/dataset/env-
Well information and Potential Nitrate Source Inventory Form
35
36
APPENDIX B
SUBSURFACE SEWAGE TREATMENT SYSTEM
Most homes that have private wells also have private subsurface sewage treatment systems (SSTS). These treatment systems can be a potential point source for contaminants such as nitrate, and fecal material. To protect drinking water supplies in Minnesota, SSTS septic tanks and the associated drain fields are required to be at least 50 feet away from private drinking water wells. The minimum required distance doubles for wells that have less than ten feet of a confining layer or if the well has less than 50 feet of watertight casing (MDH, 2014).
Technical and design standards for SSTS systems are described in Minnesota Rules Chapter 7080 and 7081. Some local government units (LGU) have their own statutes that may be more restrictive or differ from these standards.
Many LGUs collect information on the condition of SSTS in their jurisdiction. Often information is collected when a property is transferred, but inspections can occur at other times as well. A SSTS inspection determines if a system is compliant or non-compliant. A non-compliant treatment system can be further categorized as “failing to protect groundwater (FTPGW)” or “imminent threat to public health and safety (ITPHS)”. A system is considered FTPGW if it is a seepage pit, cesspool, the septic tanks are leaking below their operating depth, or if there is not enough vertical separation to the water table or bedrock. A system is considered ITPHS if the sewage is discharging to the surface water or groundwater, there is sewage backup, or any other condition where the SSTS would harm the health or safety of the public (Minnesota Statutes, section 115.55.05; MPCA, 2019a).
In 2018 Cottonwood County reported a total of 1,524 SSTS and 1.3 percent were inspected for compliance (MPCA, 2019b). Compliance inspections are conducted in Cottonwood County during property transfers, which is common in Minnesota, but it is not a state-level requirement. Inspections are also required for the addition of a bedroom or bathroom, when there is an expansion of use of the building which may impact the performance of the existing system, during systematic area-wide inspections, and any time deemed necessary or appropriate for public safety (Cottonwood County, MN, 2013).
FEEDLOT
The amount of nitrogen in manure depends on the species of animal. For example, there is approximately 31 pounds of nitrogen in 1,000 gallons of liquid dairy cow manure, and 53-63 pounds in 1,000 gallons of liquid poultry manure. Most of the nitrogen in manure is in organic nitrogen or in ammonium (NH4+) forms (Hernandez and Schmitt, 2012).
Under the right conditions organic nitrogen can be converted into ammonium and then eventually transformed into nitrate. Nitrate is a highly mobile form of nitrogen that can move into groundwater and become a contamination concern (MPCA, 2013).
Government agencies regulate feedlots to reduce the risk of contamination to water resources. Rules pertaining to feedlots have been in place since the 1970’s; they were revised in 2000 and 2014 (MPCA, 2017b). The degree of regulation of a feedlot is dependent on the amount of manure that is
37
produced; measured in animal units (AU) (MPCA, 2011). One AU is equal to the amount of manure produced by one beef cow (Table 9) (MPCA, 2017b).
Table 9. Animal Unit Calculations (MPCA, 2017b)
Animal Type Number of Animal Units (AU)
Mature dairy cow (over 1,000 lbs.) 1.4
Cow/calf pair 1.2
Stock cow/steer 1.0
Horse 1.0
Dairy heifer 0.7
Swine (55-300 lbs.) 0.3
Sheep 0.1
Broiler (over 5 lbs., dry manure) 0.005
Turkey (over 5 lbs.) 0.018
Animal feedlots with 1-300 AU require a 50-foot setback from private water wells. Larger feedlots (≥300 AU) must be at least 100 feet away from private water wells. The minimum required distance doubles for wells that have less than ten feet of a confining layer or if the well has less than 50 feet of watertight casing (MDH, 2014).
Farmers must register a feedlot through the Minnesota Pollution Control Agency (MPCA) if they have at least 50 AU, or 10 AU if the feedlot is located near shoreline. Larger feedlots must follow additional regulations. Feedlots with more than 300 AU must submit a manure management plan if they do not use a licensed commercial applicator. Feedlots with more than 1,000 AU are regulated through federal National Pollutant Discharge Elimination (NPDES) permits (MPCA, 2011) and must submit an annual manure management plan as part of their permit (MPCA, 2015).
As part of new feedlot construction, an environmental assessment must be completed for feedlots with a proposed capacity of greater than 1,000 AU. If the feedlot is in a sensitive area the requirement for an environmental assessment is 500 AU (MPCA, 2017b). Farmers must register their feedlot if it is in active status. Feedlots are considered active until no animals have been present on the feedlot for five years. To register, farmers fill out paperwork which includes a chart with the type and maximum number of animals on the feedlot (MPCA, 2017a). Registration is required to be completed at least once during a set four-year period; the current period runs from January 2018 to December 2021. As of November 2017, approximately 24,000 feedlots were registered in Minnesota (MPCA, 2017b). A map and table of the feedlots located in the Cottonwood County study area can be found below (Figure 9; Table 10).
38
Table 10. Feedlots and Permitted Animal Unit Capacity, Cottonwood County
Township Total
Feedlots Active
Feedlots Inactive Feedlots
Average AU Permitted** Per Feedlot
Total Permitted**
AU
Total Square Miles
Permitted** AU per
Square Mile
Amboy 16 9 7 241 2,169 36 61
Dale 11 8 3 131 1,050 36 29
Germantown 36 24 12 343 8,234 36 230
Southbrook 13 7 6 443 3,098 36 85
Total 76 48 28 *303 14,550 144 *101
*Represents an average value **Animals permitted may not be the actual animals on site. The total animals permitted is the maximum number of animals that are permitted for a registered feedlot. It is common for feedlots to be have less livestock than permitted.
On average there are 101 AU per square mile (0.16 AU/acre) over the study area (Table 10). Manure is often applied to cropland, so it is pertinent to look at the AU per cropland acre. In the Cottonwood County study area livestock densities average 0.20 AU per acre of row crops (MPCA, 2018; USDA NASS, 2013).
39
Figure 9. Feedlot Locations in Cottonwood County (MPCA, 2020)
FERTILIZER STORAGE LOCATION
MDA tracks licenses for bulk fertilizer storage facilities, anhydrous ammonia, and chemigation sites (Table 11). Abandoned sites are facilities that once housed fertilizer chemicals. These sites are also noted and tracked by the MDA as they are potential contamination sources.
Table 11. Fertilizer Storage Facility Licenses and Abandoned Sites, Cottonwood County
Township Bulk Fertilizer
Storage
Anhydrous Ammonia
Chemigation Sites
Abandoned Sites Total
Amboy 1 1 0 0 2 Dale 0 0 0 0 0
Germantown 0 0 0 0 0
Southbrook 0 0 2 0 2
Total 1 1 2 0 4
Data retrieved from MDA Pesticide and Fertilizer Management Division, 2018; updated March 2018
40
SPILLS AND INVESTIGATIONS
The MDA is responsible for investigating any fertilizer spills within Minnesota. Figure 10 shows the locations of mapped historic fertilizer spills within the Cottonwood County study area. While other types of spills are recorded, only sites that are potential point sources of nitrogen to the groundwater are reported here (MDA, 2018a).
The MDA tracks several types of incidents. Incident investigations are typically for larger spills. There are none in the study area. Contingency areas are locations that have not been remediated because they were inaccessible, or the contaminant could not be removed for some other reason. They are often a part of an incident investigation. There are no contingency areas in this study area. Old emergency incidents were closed prior to March 1st, 2004 (MDA, 2018a), but they can still be a point source. At most of these older sites, the contaminants are unknown and their location may not be precise. There are none in the study area. Small spills and investigations are typically smaller emergency spills such as a truck spilling chemical. There are two in the study area. It is important to note that while the locations of the incidents described are as accurate as possible, it is an incomplete dataset (MDA, 2018a). A breakdown of chemical type of these incidents can be found in Table 12. A breakdown of the fertilizer specific spills and investigations, by township, can be found in Table 13.
Table 12. Spills and Investigations by Chemical Type, Cottonwood County
Contaminant Incident
Investigations Contingency
Areas Small Spills and Investigations
Old Emergency Incidents
Total
Fertilizer 0 0 2 0 2
Pesticides & Fertilizer
0 0 0 0 0
Anhydrous Ammonia
0 0 0 0 0
Total 0 0 2 0 2
Table 13. Fertilizer Related Spills and Investigations by Township, Cottonwood County
Township Incidents and Spills
Amboy 0
Dale 0
Germantown 1
Southbrook 1
Total 2
41
Figure 10. Fertilizer Spills and Investigations in Cottonwood County (MDA, 2018a)
42
APPENDIX C
LAND AND WATER USE
LAND COVER
Typically, locations were selected for the Township Testing Program if at least 20 percent of the land cover was in row crop production. Cottonwood County has a significant amount of land devoted to row crop agriculture (Figure 11; Table 14). Row crops can include: corn, sweet corn, soybeans, alfalfa, sugar beets, potatoes, durum wheat, dry beans and double crops involving corn and soybeans.
Cottonwood County is in southwest Minnesota. The land use of the study area is primarily agricultural, with 77 percent being used for row crops. Relatively little land (five percent) in the study area is considered developed.
Figure 11. Land Cover in Cottonwood County (USDA NASS Cropland Data Layer, 2013)
43
Table 14. Land Cover Data (2013) by Township, Cottonwood County (USDA NASS Cropland Data Layer, 2013)
Township Total Acres Row Crop
Other Crops
Forest Open Water
Pasture/ Hay
Wetland Developed Fallow/ Barren
Grassland/ Shrubland
Amboy 22,751 89% 1% 0% 0% 3% 0% 5% 0% 1%
Dale 23,083 82% 1% 0% 2% 5% 2% 5% 0% 3%
Germantown 22,943 80% 0% 1% 0% 8% 4% 5% 0% 2%
Southbrook 23,230 58% 0% 1% 7% 13% 10% 4% 0% 8%
Average 92,007 77% 1% 0% 2% 7% 4% 5% 0% 3%
* Represents a total
44
WATER USE
Water use permits are required for wells withdrawing more than 10,000 gallons of water per day or 1,000,000 gallons of water per year (MDNR, 2019). There are 11 active groundwater well permits in the study area, eight of which are used for major crop irrigation (Figure 12). About 1,511 acres of cropland are permitted for groundwater irrigation in this area (Table 15). Most permitted wells are withdrawing groundwater from quaternary aquifers (Table 16; MDNR, 2018).
Table 15. Active Groundwater Use Permits by Township, Cottonwood County
Township Major Crop Irrigation
Well Permits Average Depth (feet) Acres Permitted
Amboy 0 NA NA
Dale 2 95 640
Germantown 1 76 115
Southbrook 5 172 756
Total 8 141 1,511
Table 16. Active Groundwater Use Permits by Aquifer, Cottonwood County
Water Use Well Permits Total Average Depth (feet) Aquifer
Water Table Quaternary Not
Classified
Major Crop Irrigation 8 141 2 5 1
Waterworks 1 141 0 1 0
Special Categories 2 209 0 1 1
Total 11 153 2 7 2
45
Figure 12. Active Groundwater Use Permits in Cottonwood County (MDNR, 2018)
46
APPENDIX D
Nitrate Brochure
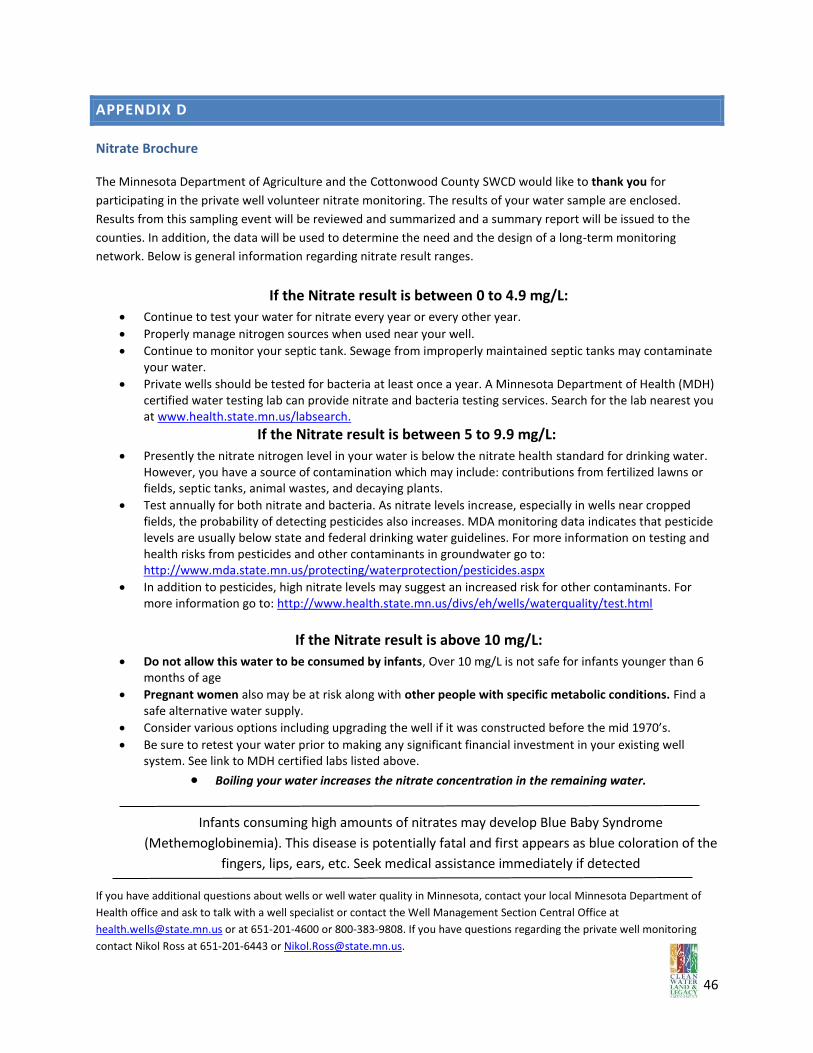
The Minnesota Department of Agriculture and the Cottonwood County SWCD would like to thank you for
participating in the private well volunteer nitrate monitoring. The results of your water sample are enclosed.
Results from this sampling event will be reviewed and summarized and a summary report will be issued to the
counties. In addition, the data will be used to determine the need and the design of a long-term monitoring
network. Below is general information regarding nitrate result ranges.
If the Nitrate result is between 0 to 4.9 mg/L:
• Continue to test your water for nitrate every year or every other year.
• Properly manage nitrogen sources when used near your well.
• Continue to monitor your septic tank. Sewage from improperly maintained septic tanks may contaminate your water.
• Private wells should be tested for bacteria at least once a year. A Minnesota Department of Health (MDH) certified water testing lab can provide nitrate and bacteria testing services. Search for the lab nearest you at www.health.state.mn.us/labsearch.
If the Nitrate result is between 5 to 9.9 mg/L:
• Presently the nitrate nitrogen level in your water is below the nitrate health standard for drinking water. However, you have a source of contamination which may include: contributions from fertilized lawns or fields, septic tanks, animal wastes, and decaying plants.
• Test annually for both nitrate and bacteria. As nitrate levels increase, especially in wells near cropped fields, the probability of detecting pesticides also increases. MDA monitoring data indicates that pesticide levels are usually below state and federal drinking water guidelines. For more information on testing and health risks from pesticides and other contaminants in groundwater go to: http://www.mda.state.mn.us/protecting/waterprotection/pesticides.aspx
• In addition to pesticides, high nitrate levels may suggest an increased risk for other contaminants. For more information go to: http://www.health.state.mn.us/divs/eh/wells/waterquality/test.html
If the Nitrate result is above 10 mg/L:
• Do not allow this water to be consumed by infants, Over 10 mg/L is not safe for infants younger than 6 months of age
• Pregnant women also may be at risk along with other people with specific metabolic conditions. Find a safe alternative water supply.
• Consider various options including upgrading the well if it was constructed before the mid 1970’s.
• Be sure to retest your water prior to making any significant financial investment in your existing well system. See link to MDH certified labs listed above.
• Boiling your water increases the nitrate concentration in the remaining water.
Infants consuming high amounts of nitrates may develop Blue Baby Syndrome
(Methemoglobinemia). This disease is potentially fatal and first appears as blue coloration of the
fingers, lips, ears, etc. Seek medical assistance immediately if detected
If you have additional questions about wells or well water quality in Minnesota, contact your local Minnesota Department of
Health office and ask to talk with a well specialist or contact the Well Management Section Central Office at
[email protected] or at 651-201-4600 or 800-383-9808. If you have questions regarding the private well monitoring
Table 17. Reasons Wells Were Removed from the Final Well Dataset by Township, Cottonwood County
Township Point
Source
Well Construction
Problem
Hand Dug Well
Unsure of water source or Known
Non Drinking Water Source
Site Visit Completed - Well Not Found &
Constructed before 1975 or Age Unknown
& No Well ID
No Site Visit & Constructed
before 1975 or Age Unknown &
No Well ID
No Site Visit & Insufficient
Data & No Well ID
Total
Amboy 0 1 1 0 0 2 0 4
Dale 0 2 0 0 0 0 0 2
Germantown 0 0 0 0 0 0 0 0
Southbrook 0 0 0 0 0 0 1 1
Total 0 3 1 0 0 2 1 7
Table 18. Completed Site Visits for Wells Removed from the Final Well Dataset by Township, Cottonwood County
Township Site Visit No Site Visit Total
Amboy 1 3 4
Dale 2 0 2
Germantown 0 0 0
Southbrook 0 1 1
Total 3 4 7
48
APPENDIX F
MINNESOTA WELL INDEX
The MWI was used to gather information about the four townships in Cottonwood County. This section includes all documented drinking water wells in the study area, not just wells MDA sampled. Table 19 summarizes the general aquifer types, while the following is a brief summary of the major aquifer types with the average well depth. According to the information from the MWI (MDH, 2019):
In these townships, there are 49 documented (have a verified location in the MWI) drinking water wells:
• The Quaternary Water Table aquifer is the uppermost aquifer and has one well. That well is 31 feet deep.
• The Quaternary Buried Artesian aquifer has the most documented drinking water wells (49 percent).
• There were 15 (31 percent) drinking water wells in the Cretaceous Aquifers. These wells are 221 feet depth on average.
• Three wells were completed in Precambrian Aquifers. The average depth of these wells is 290 feet
• One well was completed in Weathering Residuum and is at 295 feet deep.
• Approximately ten percent of wells with a well log did not have a defined aquifer.
49
Table 19. Aquifer Type Distribution of Active Drinking Water Wells in Minnesota Well Index by Township, Cottonwood County