UBC Student Housing Demand Study
FINAL REPORT
December 2009
Submitted By:
McClanaghan & Associates
Email: [email protected]
For:
UBC Campus & Community Planning
Student Housing & Hospitality Services
UBC Student Housing Demand Study and Forecast Page 1
Purpose
UBC Vancouver is transitioning from a commuter campus to a sustainable campus community.
A significant expansion in housing for graduate and undergraduate students has occurred over
the past 15 years with the addition of approximately 3,800 new student beds on campus.
Today, UBC provides approximately 8,680 beds for student living on campus for an estimated
on-campus population of 11,000 students and student family members.
Campus & Community Planning (C&CP), and Student Housing & Hospitality Services (SHHS)
commissioned a study in 2008 to prepare a housing demand forecast for on-campus student
housing. The study is part of the Campus Plan process, and also responded to the AMS request
which was based on their major policy paper in 2008. The analysis set out in this report included
a comprehensive student survey and a series of focus group sessions designed to explore the
full range of student housing needs, as well as a benchmarking survey which made
comparisons with other comparable universities.
The results of the analysis show that the demand for additional on-campus housing is significant
and that UBC should plan to provide capacity for at least 45% of full-time students to live-on
campus.1 The analysis also showed that the demand pressures and competitive nature of the
Vancouver rental housing market will continue to have a significant impact on the off-campus
housing choices available to students. UBC will need almost 6,400 new student housing beds
over next 20 years just to maintain the current availability of student housing choices in the face
of on-going pressures in the Vancouver rental market.
The study findings confirm that there is a high level of interest in living on campus among those
who are currently living in different housing arrangements off campus, and that the level of
demand could be even higher given the significant social and academic advantages that on-
campus living brings to the university experience, and that many students indicate they want.
The feedback received through this study, also suggests that many students face long
commuting times, difficulty in finding suitable housing and on-going affordability pressures.
Working with a Steering Committee of representatives from across the university community
including representatives from the societies representing graduate and under-graduate
students, this study was designed to gain a better understanding of the nature of student
housing demand and related issues.
1 The work to date on the Campus Plan provides capacity to accommodate up to 50% of the estimated number of
full time students.
UBC Student Housing Demand Study and Forecast Page 2
In preparing the on-campus student housing demand forecast set out in this report, a major
focus was on analyzing the choices available to UBC students both on and off campus.2 This
included:
• The current housing demand profile;
• The current housing and living arrangements;
• The geographic distribution and housing preferences of students;
• The propensity of students to share accommodation and the number of students sharing;
• Housing costs and affordability; and,
• Commuting distances and travel times.
The analysis also took into consideration broader systemic and market forces including:
• The expected increase in the student population;
• The expected increase in non-student housing demand; and,
• The expected increase/decrease in housing supply in key Vancouver neighbourhoods.
Data on the Vancouver rental housing market was also analyzed. This included information
from the 2006 Census as well as information on average rents and vacancy rates for different
unit sizes and types as reported by Canada Mortgage and Housing Corporation (CMHC)
through their annual rental market survey.
The Research Approach
In preparing the student housing demand forecast, the following actions were taken:
1. Analysis of administrative data provided by the Office of the Registrar to develop a profile of
the 32,981 full-time and near full-time students currently enrolled at UBC;
2. Analysis of the results of a web-based survey3 of students living on and off campus
including information on their current housing situation, housing choices, and housing
needs;
2 This was done through a web-based survey which received 5,684 responses from students living both on campus
and off campus. There were a total of 2,401 responses from student living on campus and 3,283 responses from
students living off campus. Detailed results from the survey, as well as a copy of the survey instrument are
included in the Technical Appendices that have been prepared to complement this report.
UBC Student Housing Demand Study and Forecast Page 3
3. Analysis of the data provided by the Financial Awards Office including information on the
number of applicants, the number of awards granted, and the average award amount in
order to understand some of the potential implications and constraints with respect to
affordability;
4. Analysis of feedback gathered through stakeholder interviews including members of the
Study Steering Committee;
5. Analysis of feedback gathered through a series of focus group sessions including students
living on campus, students living off campus who wished to live on campus, and students
who were satisfied living off campus; and,
6. Administration of a benchmarking study to other comparable universities to determine the
extent to which they were experiencing similar challenges and pressures.
This report sets out a 20 year housing demand forecast for on-campus student housing along
with the high level findings used to guide and inform the development forecast model.
Additional details related to each of the different elements can be found in the Technical
Appendices which have been prepared to complement this report.
The Nature of Student Housing Demand
Housing choices always include some mix of housing preferences and price, as well as trade-
offs around factors such as location, amenity, condition and affordability. These choices are
further shaped by the availability of suitable housing within a given market. In a conventional
housing analysis, one of the central features is affordability, usually expressed as a percentage
of household income relative to housing costs.
Student housing affordability adds another layer of complexity in that many students have
limited incomes and significant financial obligations including tuition payments, rent and basic
living expenses. While many students are able to rely on assistance from parents and other
sources, others are dependent on student loans and grants to help them make ends meet.
In preparing the student housing demand forecast set out in this report, a central focus was on
understanding the inter-relationship between student housing choices on campus and the
housing choices available to students living off campus. In looking at the different housing
choices, the analysis considered the trade-offs between factors such as independence,
3 The 5,684 responses generated through the web-based survey represent approximately 17% of the full-time
graduate and under-graduate student population. A sample of this size provides a high degree of confidence in the
reliability of the reported findings both at the aggregate and sub-group level.
UBC Student Housing Demand Study and Forecast Page 4
autonomy, affordability, suitability, adequacy and proximity to campus. These different trade-
offs were tested through a survey of students living on and off campus which was initiated in
March 2009.
In terms of student housing choices, it is important to recognize that students also possess a
unique set of circumstances which influence their housing choices. This includes the need to
attend classes at a central location, affordability concerns (often closely linked to family
resources) and the desire to engage in a variety of on-campus activities that, for many, help to
enrich their post secondary student experience.4
For students living off campus, access to campus is an important consideration and is central to
the housing decisions they make. Outside of those living at home, it is likely that students will
be looking for housing choices and opportunities which ensure that they can live close to
campus, or at the very least have good access to transit in order to provide them with the
opportunity to engage in the different social, cultural and recreation activities that are part of the
broader campus experience.5
In examining the range of factors influencing student housing choices, it is necessary to
consider both push-related and pull-related factors. Push-related factors are those which result
from increased competition for available units or the lack of availability of suitable housing
choices, and that lead to a situation in which individuals have less control over the decisions
that they make, or are ‘pushed’ towards specific decisions or choices about their housing. In the
case of on-campus housing, it is possible that students are pushed into making other housing
choices simply out of the lack of available spaces on campus. Resource constraints, personal
circumstances as well as income or local market conditions can also be seen as factors which
may push an individual into making a specific housing choice.6
Pull-related factors, on the other hand, are decisions that individuals make based on their
preferences or requirements and generally involve a significant degree of choice. In the case of
on-campus housing, pull-related factors could be seen as those which draw individuals towards
specific choices. This could include factors such as convenience, proximity to campus,
enhanced student engagement, as well as access to specific services and amenities.
4 Among those living on campus, 81% indicated that the academic benefits of living on campus were important or
very important while 76% indicated that the social benefits and a close connection to the larger university
experience were strong reasons for choosing to live on campus. 5 Among the survey respondents living off campus, 65% were living west of Main Street.
6 Among those living off campus, average reported rents were approximately 22% lower for those living one hour
from campus compared to those living between 11 to 20 minutes away.
UBC Student Housing Demand Study and Forecast Page 5
The housing choices available in the broader Vancouver rental housing market can also have
an impact on the demand for on-campus housing. In particular, it should be noted that, as the
choices in the Vancouver rental market become more constrained through on-going growth
pressure or the on-going loss of rental units, the demand for on-campus housing will increase.
Key Findings
The following reflect some of the key findings and observations to emerge through this study:
• Students are frequently required to look for housing in a competitive housing market.
Furthermore, while the vacancy rate for rental housing in the Vancouver market has shown
a slight improvement in recent months7, the Vancouver region has traditionally been seen to
have some of the lowest vacancy rates and highest rents in the country8. These types of
rental market conditions can make it difficult for students to have quality choices about
where they live and can often lead to on-going affordability pressure.
• Proximity to campus is a significant factor in shaping the off-campus housing choices for
many students. This was tested through the collection of student addresses by postal code
and data related to average commuting times. Once those who are still living in the family
home are removed from the analysis the data shows that 65% of students living off campus
are likely to be living in neighbourhoods west of Main Street or in areas which have good
access to transit.
• There is a clear spatial or locational aspect to the housing choices that many students
make. At the same time, access to transit is also an important consideration with 86% of
survey respondents identifying proximity to transit as an important factor in shaping their
housing decision. At the same time, proximity to campus was also ranked highly in terms of
the housing choices that students make. 9
7 The most recent Rental Market Report published by CMHC (April 2009) reported a 1.9% vacancy rate within the
Metro Vancouver rental market area with an average market rent of $982 per month. 8 This observation was confirmed through the results of the benchmarking study which included questions of local
market conditions. A full copy of the results of the benchmarking study and the market comparisons can be found
in the Technical Appendices which has been prepared to support this study. 9 Among those who responded to the survey, 86% ranked proximity to transit as being important to their housing
choices while 67% identified proximity to campus as an important consideration.
UBC Student Housing Demand Study and Forecast Page 6
• Growth in the number of non-student households from in-migration into Vancouver is also a
factor which can affect the housing choices available. Based on the most recent housing
demand estimates prepared by Canada Mortgage and Housing Corporation (CMHC) it is
expected that there will be an annual increase in housing demand of between 16,000 and
18,000 households per year across the Metro Vancouver region. This will result in
increased competition for available units and is likely to make it more difficult for students to
find suitable and appropriate housing.
• It is estimated that approximately 35% of the increase in housing demand in the Vancouver
CMA will be in the form of rental demand10. Assuming an annual increase of between
16,000 and 18,000 households per year, this can mean an annual increase of between
5,600 and 6,300 new renter households per year. Data for Vancouver shows an average
annual increase of only 560 new rental housing units per year over the past 10 years (1999
to 2008).11 This is well below the level required to keep pace with demand. In addition,
without an increase in the supply of rental housing, the increased competition for available
units can lead to upward pressure on rents and can further erode affordability.
• On-going growth pressures will also result in increased ownership demand. This can affect
the supply of single detached houses available for rent as the value and desirability of this
form of housing continues to increase. In particular, the demand for this form of housing can
mean that the attractiveness of retaining this housing as rental housing is diminished. This
was reflected in the most recent Census data where the data shows that, for the period
between 2001 and 2006, the total number of rental housing units across the City of
Vancouver dropped by 1,220 with a large proportion of the change being reflected in
changes in the rented single detached stock.
• Neighbourhood development patterns can also have an impact on the profile of the housing
stock as single detached homes which were previously rented are sold or demolished in
order to build new ownership units.12 The loss of this form of housing can have a significant
impact on student housing choices, not only from the fact that this stock represents an
10
These estimates were presented at the CMHC Housing Outlook Conference (November 2009) and are based on
current population trends and household projections. 11
Over the last 5 years (2003 to 2008) there were 1,145 new purpose-built rental housing units constructed across
Vancouver. This represents an average of 229 units per year. Of these units, almost 47% were construction at
UBC. The construction of these units is important in terms of off-setting the loss of units in other parts of the City.
The other area which saw a significant increase in new supply was downtown Vancouver. However, this was
mostly in the form of higher end condo stock. 12
Shared houses are a popular form of housing for students. Based on the results of the off-campus student
survey, approximately 1 in 5 students reported that they currently live in this form of housing.
UBC Student Housing Demand Study and Forecast Page 7
important segment of the rental housing continuum, but also from the fact that rented single
detached homes can often accommodate a large number of students13.
• Another observation to emerge through the study relates to the expansion in the range of
on-campus housing choices and food service options available. In looking at the full array of
on-campus housing choices, it is clear that the on-campus housing available through UBC
has developed appeal which extends beyond the traditional younger, undergraduate cohort.
This observation was confirmed through the responses received through the web-based
survey in which a significant number of students living off campus reported that they would
prefer to live on campus if they could.14 Similarly, the university currently has a waiting list of
more than 400 students who have indicated an interest in on-campus housing if space
becomes available.
• The results from the benchmarking survey completed as part of this study showed that many
universities faced constraints on the supply of available land and did not have the same
growth potential as UBC. At the same time the feedback received suggested that the local
market conditions, both in terms of vacancy and affordability of units was typically not as
challenging as in the Vancouver market.
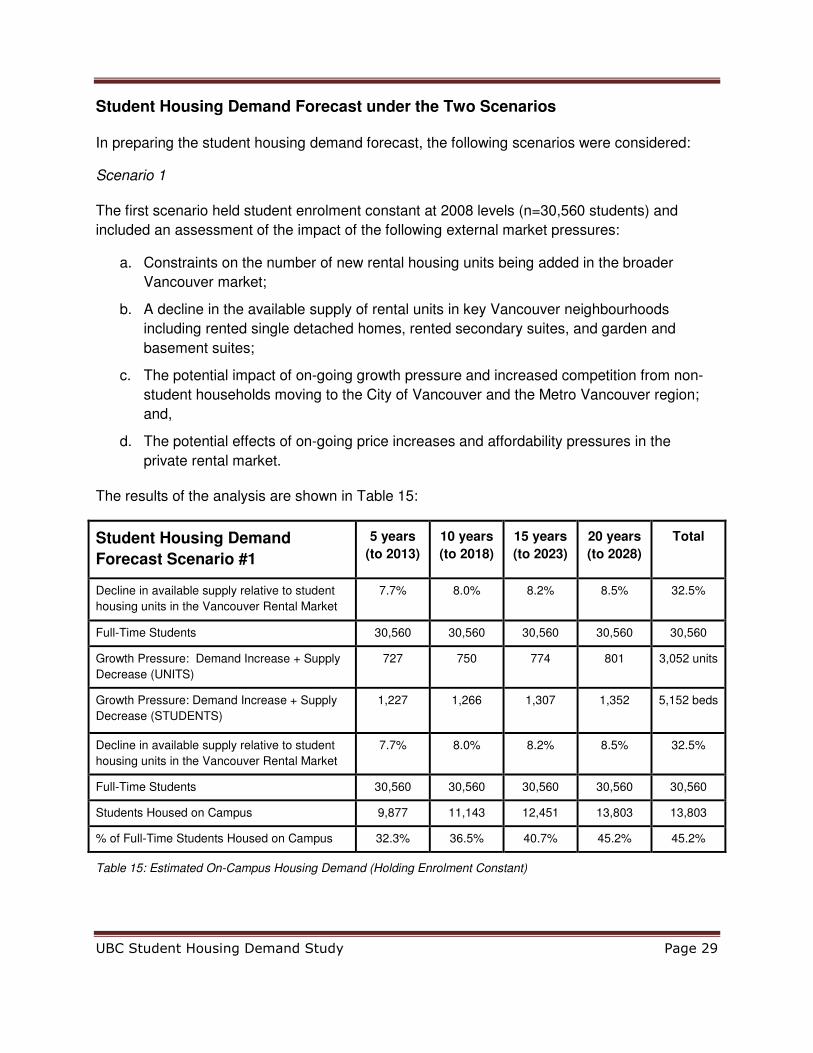
Findings of the Student Housing Demand Forecast under the Two Scenarios
In preparing the student housing demand forecast, the following scenarios were considered:
Scenario 1: Held student enrolment constant at 2008 levels (n=30,560 students) and included
an assessment of the impact of the following external market pressures:
a. Constraints on the number of new rental housing units being added in the broader
Vancouver market;
b. A decline in the available supply of rental units in key Vancouver neighbourhoods including
rented single detached homes, rented secondary suites, and garden and basement suites;
c. The potential impact of on-going growth pressure and increased competition from non-
student households moving to the City of Vancouver and the Metro Vancouver region; and,
d. The potential effects of on-going price increases and affordability pressures in the private
rental market.
13
Sixty nine percent of those living in shared households reported that they were typically sharing with 2 or more
other people. Therefore, for every single detached home that is lost from the rental housing supply, it is possible
that up to three students could be displaced. 14
Approximately 27% of students living off campus indicated that they would like to live on campus if they could.
At the same time, 43% indicated that they might be interested in living on campus depending on the housing type.
UBC Student Housing Demand Study and Forecast Page 8
The results of the analysis are shown in Table 1:
Student Housing Demand
Forecast Scenario #1
5 years
(to 2013)
10 years
(to 2018)
15 years
(to 2023)
20 years
(to 2028)
Total
Decline in available supply relative to student
housing units in the Vancouver Rental Market
7.7% 8.0% 8.2% 8.5% 32.5%
Full-Time Students 30,560 30,560 30,560 30,560 30,560
Growth Pressure: Demand Increase + Supply
Decrease (UNITS)
727 750 774 801 3,052 units
Growth Pressure: Demand Increase + Supply
Decrease (STUDENTS)
1,227 1,266 1,307 1,352 5,152 beds
Decline in available supply relative to student
housing units in the Vancouver Rental Market
7.7% 8.0% 8.2% 8.5% 32.5%
Full-Time Students 30,560 30,560 30,560 30,560 30,560
Students Housed on Campus 9,877 11,143 12,451 13,803 13,803
% of Full-Time Students Housed on Campus 32.3% 36.5% 40.7% 45.2% 45.2%
Table 1: Estimated On-Campus Housing Demand (Holding Enrolment Constant)
Scenario 2: Maintained all of the assumptions of the first scenario but assumed that there
would be a modest increase in student enrolment (approximately 9%).
Student Housing Demand
Forecast Scenario #2
5 years
(to 2013)
10 years
(to 2018)
15 years
(to 2023)
20 years
(to 2028)
Total
Full-Time Students 30,560 33,362 33.362 33,362 33,362
Students Housed on Campus 10,554 12,385 13,692 15,044 15,044
Growth Pressure: Demand Increase + Supply
Decrease (UNITS)
1,128 1,084 774 801 3,787
units
Growth Pressure: Demand Increase + Supply
Decrease (STUDENTS)
1,904 1,803 1,307 1,352 6,366
beds
Decline in available supply relative to student
housing units in the Vancouver Rental Market
12.0% 11.5% 8.2% 8.5% 39.2%
% of Full-Time Students Housed on Campus 33.0% 37.1% 41.0% 45.1% 45.1%
Table 2: Estimated On-Campus Housing Demand (increase of 2,800 students-9% growth)
UBC Student Housing Demand Study and Forecast Page 9
Under Scenario 1, even without an increase in student enrolment, the university would have to
plan to add 5,152 spaces or approximately 3,052 additional units of on-campus housing just to
maintain the current availability of student housing within the broader rental housing market.
Under the second scenario, assuming a modest increase in student enrolment, UBC would
have to plan to add 6,366 spaces or approximately 3,787 new on-campus housing units.
In putting forward these estimates, the analysis is intended to help to provide important data for
informing UBC’s planning activities and for guiding and informing future planning decisions. At
the same time, it is important to recognize that the timing of the construction of the units as well
as decisions around establishing targets for the proportion of on-campus student housing are
decisions which should be evaluated within the broader context of UBC’s strategic goals and
objectives.
The next section lays out in more detail the full on-campus housing demand estimates along
with the key underlying assumptions.
UBC Student Housing Demand Study and Forecast Page 10
The On-Campus Student Housing Demand Forecast—Method and Assumptions
A major output from this study was the development of a 20 year housing demand forecast
which sets out the estimated demand for on-campus student housing. The demand forecast
which was developed covers the period from 2008 to 2028.
This section sets out some of the key findings and assumptions used in preparing the demand
forecast. This includes consideration of:
• The inter-relationship between student housing choices on campus and the housing choices
available to students living off campus.15 The study assumes that changes in the available
choices off campus can have an impact on the demand for on-campus housing.
• The different trade-offs and choices that students make around independence, autonomy,
suitability, adequacy and proximity to campus, as well as specific consideration related to
affordability.
• The impact of changes in the broader Vancouver rental housing market and the potential
implications for the demand for on-campus housing including consideration of the potential
implications arising from on-going population, household growth, and increased student
enrolment.16
• The impact of changes in the profile of the current housing stock including changes in the
types of units available for rent, as well as potential pressures arising from the on-going loss
of rental units in key Vancouver neighbourhoods.
• The potential implications of on-going tight rental market conditions in the Vancouver market
including potential implications related to on-going affordability pressures.
In modeling the different scenarios set out in this report, it is clear that many of the pressures
identified would be made worse if alternate sources of new rental supply are not found or if the
supply of rental housing continues to lag behind demand.
15
The study assumes that changes in the available choices off-campus can have an impact on the demand for on-
campus housing. 16
This number assumes only modest increases of 3,000 full-time student over 20 years.
UBC Student Housing Demand Study and Forecast Page 11
Scenario Testing and Data Modeling
In order to estimate the potential future demand for on-campus housing, this report modelled a
number of different scenarios. As set out at the beginning of this report, it is acknowledged that
student housing choices typically include different requirements and trade-offs when compared
with other types of households.
In order to gain a better understanding of the nature of the choices and trade-offs among
students this study relied on a number of different data sources including an analysis of the
administrative data maintained by UBC as well as feedback received from 5,684 students who
responded to the web-based survey.
In preparing the on-campus housing demand forecast the following variables were analyzed:
• The current housing demand profile;
• The current housing and living arrangements;
• The geographic distribution and housing preferences of students;
• The propensity of students to share accommodation and the number of students sharing;
• Housing costs and affordability; and,
• Commuting distances and travel times.
The analysis also took into consideration broader systemic and market forces including:
• The expected increase in the student population;
• The expected increase in non-student housing demand; and,
• The expected increase/decrease in rental housing supply in key Vancouver
neighbourhoods.
The Current Housing Demand Profile
The analysis of the current housing demand profile was constructed from a number of different
sources including information obtained from the Office of the Registrar, as well as from the
results of the web-based survey.
To understand the current housing situation and housing choices of UBC students, this study
examined the administrative data maintained by UBC for 32,981 full-time or near full-time
graduate and under-graduate students enrolled at UBC.
UBC Student Housing Demand Study and Forecast Page 12
The administrative data obtained from the Office of the Registrar included general socio-
demographic data on the student population including information on their age, gender,
graduate and undergraduate status, as well as information on the mailing address, postal code
and home community17 of students attending UBC. It also included information on the high
school that students attended prior to coming to UBC.
While the mailing information was not necessarily reliable in terms of understanding the current
housing choices across the student population, an analysis of mailing addresses combined with
information on the high school that the student attended prior to admission to UBC helped to
provide a better sense of the number of students who were from the Metro Vancouver and
Fraser Valley market areas.
The analysis of the administrative data showed that approximately 31% of all full-time or near
full-time students enrolled at UBC had attended high school locally and still have a mailing
address in the same municipality. These general findings were compared with the feedback
received through the off-campus survey which also showed that approximately 34% of those
living off campus were still living at home.18
In looking at the specific housing circumstances for those who were still living at home, it was
clear that this segment of the student population does not have the same housing requirements
as other segments of the student population. However, commuting times and access to transit
remain important issues. Similarly, many of those living at home may be conscious of the
affordability pressures in the broader rental market.
For the purposes of preparing the on-campus housing demand forecast, the student population
was segmented by postal code and then grouped into different zones.
• Zone 1 includes students from the Vancouver market area.
• Zone 2 includes students from North Vancouver, Burnaby, New Westminster, and the Tri-
Cities.
• Zone 3 includes students from Surrey, Richmond, Pitt Meadows, Maple Ridge, Langley, and
the Fraser Valley.
17
There are some limitations to this data as the address information could refer to the home address of the
student or the address where the student is currently living. To address this constraint the administrative data was
cross-referenced with the results from the web-based survey to determine the degree of alignment. 18
When asked about their current living arrangements, 34% of off-campus respondents reported that they were
living in the family home. The large sample size of the web-based survey and the relative alignment between the
two different data sources helps to provide a high degree of confidence in the findings.
UBC Student Housing Demand Study and Forecast Page 13
• Students from outside the Vancouver market area (international students, or students from
other parts of BC or Canada) were assumed to be living in the Vancouver market area.19
The study assumed that all of those from Zone 1 (Vancouver) were still living at home or on
campus.
Among those from Zone 2, it was assumed that 60% were still living at home while 40% had
sought housing in the Vancouver area. For those from Zone 3 it was assumed that 50% had
relocated to the Vancouver rental market or to the UBC campus.
A comparison of the feedback received through the survey of students living off campus helped
to confirm and validate these assumptions. 20 In particular, the findings from the web-based
survey showed that the majority of students not living at home (77%) were likely to be living in
the Vancouver market area.
For the purpose of the analysis, it was assumed that the distribution of students relocating to
Vancouver would be distributed within the City in the same proportion as respondents to the
web-survey (along a distribution by postal code).
The table on the following page shows the general distribution of UBC students across the
different postal codes and neighbourhoods once these different assumptions were applied.
19
For the purposes of the analysis, this segment of the student population was distributed across the Vancouver
market area. 20
The feedback received through the web-based survey was seen as a reliable indication of the types of
choices/preferences students make, in terms of the geographic location of the housing and the proximity to
campus, as well as in terms of the different housing types and living arrangements.
UBC Student Housing Demand Study and Forecast Page 14
Table 3 UBC Student Place of Residence Estimate
Adjusted Data Base - Registar
Vancouver Market Estimate
Postal Code Neighbourhood
Total,
Reg.
data
At Home
est.In Market
Zone 2
adjust.
Zone 3
adjust.
Outside
Lower
Mainland
Total Estimated
UBC students in
Vanc'r Market
V6K Kits 1,101 131 970 340 192 315 1816
V6R Pt Grey 975 194 781 273 154 254 1462
V6L Arbutus 376 203 173 61 34 56 324
V6P Kerrisdale 846 464 382 134 75 124 715
V5R Renfrew Collingwood 537 293 244 85 48 79 457
V6J Fairview 620 98 522 183 103 169 977
V6M Shaughnessy 541 262 279 98 55 91 522
V6E West End 388 35 353 124 70 115 661
V6B Downtown 336 36 300 105 59 97 562
V6N Dunbar Southlands 529 234 295 103 58 96 552
V5T Commercial Dr 375 52 323 113 64 105 605
V6H Fairview 526 98 428 150 85 139 801
V5Z Fairview Cambie 550 156 394 138 78 128 738
V5N Kennsigton 402 147 255 89 50 83 477
V6Z West End 270 36 234 82 46 76 438
V6S Dunbar 353 93 260 91 51 84 487
V6G West End 305 20 285 100 56 93 534
V5Y Mt. Pleasant 308 115 193 68 38 63 361
V5P Victoria-Fraserview 456 317 139 49 27 45 260
V5X Sunset 305 197 108 38 21 35 202
V5V Mt Pleasant 326 133 193 68 38 63 361
V5S Killarney 374 276 98 34 19 32 183
V5W Riley Park 234 109 125 44 25 41 234
V5L Granview Woodlands 220 42 178 62 35 58 333
V5M Hastings Sunrise 239 163 76 27 15 25 142
V6A Strathcona 104 28 76 27 15 25 142
V5K Hasings Sunrise 95 14 81 28 16 26 152
V6C DTES 32 4 28 10 6 9 52
V6T UBC 8,399 0 8,399 84 84 84 8650
Vancouver & UBC 20,122 3,950 16,172 2,806 1619 2,607 23,204
Estimate of Vancouver Market 7,773 2,722 1,535 2,523 14,554
Zone 2 7,014 4,208 4,208
Zone 3 3,238 1,619 1,619
Outside Canada 363 0 0
Elsewhere in BC 1,725 0 0
Elsewhere in Canada 519 0 0
TOTAL Full Time Students 32,981 3,950 16,172 7,014 3,238 2,607 32,981
Zone 2 - North Van.; Burnaby, New West., Tri-cities
Zone 3 - Surrey, Richmond, Pitt Meadows, Langley & Fraser Valley
UBC Student Housing Demand Study and Forecast Page 15
The Current Housing and Living Arrangements
The second major area which was analyzed in preparing the on-campus student housing
demand forecast examined the different types of housing and living arrangements reported by
UBC students. This included an analysis of the feedback received through the web-based
survey in terms of the different types of housing choices that were identified. As shown in Table
4, excluding those who were living at home:
• 39% of students living off campus reported that they were living in apartment type
arrangements. This could include the existing purpose-built rental housing stock as well as
rented condo apartment units;
• 28% of students living off campus reported that they live in a garden or basement suite while
approximately 19% of students reported that they shared a house.
• The remaining 14% of students reported that they live in a variety of different housing
arrangements including student housing, social housing or couch surfing. A small number
of respondents also reported that they own their own home.
In general, the different types of housing arrangements identified by those living off campus are
consistent with the types of choices one would expect both in terms of the choices that are
available as well as the choices that students are likely to make.
Housing Arrangements (Excluding Those Living At Home) Number of Respondents
Percentage of Respondents
Apartment 779 39.4%
Garden or basement suite 553 28.0%
Shared house 375 19.0%
Couch surfing 6 0.3%
Student housing 23 1.2%
Social housing 11 0.6%
Own their own home 181 9.2%
Other 50 2.5%
Total (Excluding Not Living at Home and Non-Responses)21
1978 100%
Table 4: Housing Arrangements of Off-Campus Students (n=1,978)
21
There were a total of 1,034 individuals who indicated that they were living at home.
UBC Student Housing Demand Study and Forecast Page 16
Table 5 shows the general distribution of housing choices across the different neighbourhoods
and postal codes.
Table 5 (n=1,387)
Neighbourhood Postal Code
Shared
house
Garden or
Basement
Suite
Apartment Other Total
Kits V6K 9% 55% 9% 27% 100%
Pt Grey V6R 13% 19% 63% 6% 100%
Arbutus V6L 31% 38% 31% 0% 100%
Kerrisdale V6P 35% 16% 39% 10% 100%
RenfrewCollingwood V5R 18% 50% 9% 23% 100%
Fairview V6J 14% 33% 33% 19% 100%
Shaughnessy V6M 18% 55% 18% 9% 100%
West End V6E 21% 8% 58% 14% 100%
Downtown V6B 30% 45% 13% 13% 100%
DunbarSouthlands V6N 33% 46% 17% 4% 100%
Commercial Dr V5T 38% 38% 15% 8% 100%
Fairview V6H 29% 43% 21% 7% 100%
Fairview Cambie V5Z 12% 39% 39% 10% 100%
Kennsigton V5N 8% 8% 42% 42% 100%
West End V6V 0% 0% 64% 36% 100%
Dunbar V6S 0% 0% 100% 0% 100%
West End V6G 0% 0% 100% 0% 100%
Mt. Pleasant V5Y 2% 4% 87% 6% 100%
Victoria-Fraserview V5P 5% 3% 88% 3% 100%
Sunset V5X 10% 18% 58% 13% 100%
Mt Pleasant V5V 18% 26% 50% 7% 100%
Killarney V5S 10% 73% 13% 5% 100%
Riley Park V5W 15% 35% 50% 0% 100%
GrandviewWoodlands V5L 31% 57% 8% 5% 100%
Hastings Sunrise V5M 19% 27% 49% 4% 100%
Strathcona V6A 25% 44% 25% 5% 100%
Hasings Sunrise V5K 26% 65% 3% 6% 100%
DTES V6C 16% 10% 52% 23% 100%
UBC V6T 100% 0% 0% 0% 100%
19% 30% 42% 9% 100%
22% 32% 46% 0% 100%
Type of Housing Arrangements
Selected Postal Code
Sample Distribution
UBC Student Housing Demand Study and Forecast Page 17
The Geographic Distribution and Housing Preferences of UBC Students
In addition to looking at the different types of housing choices that students make, the feedback
received through the survey showed that proximity to campus and access to transit are both
important factors in shaping the decisions that students make about where to live.
Table 6 shows the average commuting times reported across those living off campus. As
shown in Table 6, 41% of respondents reported that it takes them over 40 minutes to get to
campus. This translates into a minimum commute of 1 hour and 20 minutes each day.22
Including those Living at Home Excluding those Living at Home
Time to Get to Campus # of Students % # of Students %
Less than 10 minutes 112 3.4% 100 4.4%
11-20 minutes 443 13.5% 374 16.6%
21-30 minutes 482 14.7% 403 17.9%
31-40 minutes 416 12.7% 318 13.8%
41-50 minutes 370 11.3% 217 9.6%
51-60 minutes 402 12.2% 207 9.2%
More than an hour 581 17.7% 223 9.9%
Unknown 33 1.0% 30 1.3%
Total 2,839 86.5% 1,864 82.9%
No response 444 13.5% 385 17.1%
Total responses 3,283 100% 2,249 100%
Table 6: Time Required to Commute to Campus (n=3,283)
Spatial Considerations
The feedback received through the web-based survey shows that a large proportion of the off-
campus student population lives in one of ten neighbourhoods: Kitsilano, Point Grey,
Kerrisdale, Dunbar, Oakridge, Arbutus, Shaughnessy, South Cambie, Marpole, and Fairview. In
addition, approximately 11% of the off-campus student population live in the West End.
22
Based on the feedback received through the student survey and the student focus group sessions, a large
proportion of students living off campus reported that long commuting times affected their ability to engage fully
in student life. Of those who reported that it takes them more than 40 minutes to get to campus, approximately
two-thirds were also living at home.
UBC Student Housing Demand Study and Forecast Page 18
Graph 1 shows the general distribution of students across different Vancouver neighbourhoods
as well as the general profile of the housing stock. In looking at the general housing profile and
distribution across key Vancouver neighbourhoods, it is clear that both the type and the location
of the housing are important in terms of the choices available to UBC students.
Graph 1: Distribution of UBC Students by Neighbourhood and Housing Type
Table 7 shows the total number of rental units by postal code as reported in the 2006 Census
compared with the estimated demand based on the feedback received through the web-based
survey. As shown in Table 7, in some neighbourhoods student housing demand can account
for as much as 15% to 25%23 of the total market share.24
23
This is true for the Kitsilano, Point Grey and Arbutus neighbourhoods. 24
In the Dunbar area, the data suggests that student housing demand could account for as much as 43% of the
available rental units.
UBC Student Housing Demand Study and Forecast Page 19
Estimate of Student Market Share
Neighbourhood
Total
Rental
Universe
Census
Student
(Units)
Market Share
%
V6K Kits 7,335 1,076 14.7%
V6r Pt Grey 3,405 866 25.4%
V6L Arbutus 755 192 25.4%
V6P Marpole 6,350 424 6.7%
V5R Renfrew Collingwood 5,550 271 4.9%
V6J Kits (2) 6,510 579 8.9%
V6M Kerrisdale 2,850 309 10.9%
V6E West End 11,640 391 3.4%
V6B Downtown 5,575 333 6.0%
V6N Dunbar Southlands 740 327 n/a
V5T Mount Pleasant (2) 7,490 358 4.8%
V6H Fairview 8,215 475 5.8%
V5Z Fairview Cambie 4,480 437 9.8%
V5N Kennsigton 6,665 283 4.2%
V6Z West End 4,370 259 5.9%
V6S Dunbar 665 288 43.4%
V6G West End 13,130 316 2.4%
V5Y Mt. Pleasant 2,150 214 10.0%
V5P Victoria-Fraserview 3,320 154 4.6%
V5X Sunset 3,340 120 3.6%
V5V Mt Pleasant 3,225 214 6.6%
V5S Killarney 3,575 109 3.0%
V5W Riley Park 2,625 139 5.3%
V5L Granview Woodlands 6,510 197 3.0%
V5M Hastings Sunrise 2,520 84 3.3%
V6A Strathcona 7,840 84 1.1%
V5K Hasings Sunrise 2,685 90 3.3%
V6C DTES 0 31
V6T UBC
Total 133,515 8,619 10.9% Table 7: Estimate of Students by Postal Code
UBC Student Housing Demand Study and Forecast Page 20
The Potential Loss of Vancouver Rental Units
The student housing demand forecast which was prepared also takes into consideration the
potential considerations arising from increased competition from on-going population and
household growth within the broader Vancouver market, as well as potential pressures arising
from the loss of rental housing in key Vancouver neighbourhoods.
In looking at the rental housing data for the City of Vancouver, the findings suggest that, not
only has there been limited new rental housing construction but there has also been a loss of
stock in key neighbourhoods. The housing starts data publisher by CMHC shows that housing
starts for the City of Vancouver have averaged approximately 560 new units per year. This is
well below the estimated future demand for rental housing and will continue to lead to on-going
supply pressures.
The loss of rental housing stock in key Vancouver neighbourhoods was also examined as part
of this study. This included the loss of rented single detached housing stock in neighbourhoods
such as Point Grey and Dunbar where there has been a significant level of growth and change
including the redevelopment of older single detached homes, often with basement suites, into
new, expensive detached homes without secondary suites.25 This trend has significantly
reduced an important source of student housing and is a “push factor” in terms of increased
demand for on-campus housing. 26
These types of pressures are reflected in the most recent Census data. In particular, an
analysis of the 2006 Census data shows that there has been a net loss of approximately 1,220
rental housing units across the City of Vancouver between 2001 and 2006. The data also
shows that between 1996 and 2006, 13 out of the 22 neighbourhoods across the City of
Vancouver reported a net loss of rental housing units. Among the key Vancouver
neighbourhoods analyzed for this study, there was a cumulative loss of 2,156 rental housing
units identified. This represents a loss of approximately 4.7% of the total rental housing stock
for these neighbourhoods or a loss of approximately one half of 1% (0.50%) per year.
25
Shared houses are a popular form of housing for students. Based on the results of the off-campus student
survey, approximately 1 in 5 students reported that they currently live in this form of housing. 26
Sixty nine percent of those living in shared households reported that they were typically sharing with 2 or more
other people. Therefore, for every single detached home which is lost from the rental supply, at least three
students are displaced.
UBC Student Housing Demand Study and Forecast Page 21
Affordability Considerations and Other Trade-Offs
As discussed at the outset of this report, housing choices frequently include trade-offs around
different factors such as location, amenity, condition and affordability. In a conventional housing
analysis, one of the central features is affordability, usually expressed as a percentage of
household income relative to housing costs.
For students, housing affordability adds another layer of complexity in that many students have
limited incomes and significant financial obligations including tuition payments, rent and basic
living expenses. Furthermore, while many students are able to rely on assistance from parents
and other sources, others are dependent on student loans and grants to help them make ends
meet. This section examines some of the general affordability pressures identified by those
who responded to the survey, as well as other types of changes that they would make if they
could.
Table 8 shows the range of responses received from those living off campus regarding the
types of changes that they would make to their housing situation if they could. Based on the
responses received, 39% identified affordability as a concern while 38% reported that they
would prefer to live closer to campus. Twenty-nine percent indicated that they would prefer to
live in nicer housing while 27% indicated that they would like to live on campus. Approximately
22% indicated that they would like to have more independence while 20% reported that they
would like to have more privacy.
Open-Ended Responses on Changes in Housing Situation % of Responses
more affordable housing 39%
live closer to campus 38%
nicer place to live 29%
live on campus 27%
more independence 22%
more privacy 20%
more amenities 17%
different type of unit 16%
different neighbourhood 15%
Table 8 Based on the open ended responses to the student web-based survey (n=600-1200 responses)
UBC Student Housing Demand Study and Forecast Page 22
Average Housing Costs
In terms of the general affordability of their housing, the feedback received through the web-
based survey suggests that the average reported rent across those living off campus was $918
per month with a median rent of $800 per month. This is relatively comparable to the average
reported rents for the Vancouver CMA which was equal to $982 per month as of April 2009.
The data in Table 9 also shows the average housing costs across the different housing types
and living arrangements. As shown in Table 9, the average housing costs can vary across the
different living arrangements. The data in Table 10 shows that sharing is frequently used by
students as a means to help reduce their housing costs.
Housing Arrangements No. of Responses Average Rents
Shared house 319 $796.19
Garden or basement suite 516 $908.03
Apartment 714 $1,024.72
Couch surfing 3 $541.67
Student housing 18 $581.28
Social housing 11 $453.18
Other 25 $812.76
Total 1,675 $918.49
Table 9: Average Monthly Rent for Different Housing Types (n=1,675)
As shown in Table 10, 28% of all students reported that they live alone while 52% reported that
they share with at least one other person. Among those living in a shared house, 42% reported
that they share the rent with at least three other people.
Living Alone
Share with 1 other
Share with 2 others
Share with 3 others
Share with 4 others
Share with 5+ others
Shared house 73 27 44 41 28 34
30% 11% 18% 17% 11% 14%
Garden/bsmt suite 131 252 52 13 0 1
29% 56% 12% 3% 0% 0%
Apartment 160 402 45 10 2 3
26% 65% 7% 2% 0% 0%
Other 28 43 9 3 3 0
31% 48% 10% 3% 3% 0%
Table 10: Type of Housing Arrangement by the Number of People Sharing (n=1,404)
UBC Student Housing Demand Study and Forecast Page 23
Average Housing Cost by Neighbourhood
Table 11 shows the average rents by postal code as reported in the 2006 Census compared to
the average rents by postal code as reported by those who responded to the web-based survey.
Postal Code Neighbourhood
Number of
Respondents
Web Survey
Average Rent
(2006 Census)
Average Rent
(Student Web
Survey)
V6K Kits 178 1,175$ 965$
V6R Pt Grey 154 1,304$ 975$
V6L Arbutus 36 1,570$ 855$
V6P Marpole 63 1,044$ 907$
V5R Renfrew Collingwood 17 829$ 793$
V6J Kits (2) 69 1,238$ 1,112$
V6M Kerrisdale 58 1,304$ 955$
V6E West End 35 1,049$ 1,071$
V6B Downtown 18 1,232$ 1,195$
V6N Dunbar Southlands 60 1,576$ 931$
V5T Mount Pleasant (2) 57 801$ 802$
V6H Fairview 59 1,105$ 952$
V5Z Fairview Cambie 40 1,214$ 961$
V5N Kennsigton 46 833$ 800$
V6Z West End 19 1,397$ 1,218$
V6S Dunbar 62 1,573$ 860$
V6G West End 44 1,083$ 929$
V5Y Mt. Pleasant 26 1,197$ 1,042$
V5P Victoria-Fraserview 17 846$ 683$
V5X Sunset 11 792$ 713$
V5V Mt Pleasant 44 849$ 721$
V5S Killarney 12 908$ 781$
V5W Riley Park 23 848$ 859$
V5L Granview Woodlands 16 761$ 847$
V5M Hastings Sunrise 9 821$ 643$
V6A Strathcona 9 684$ 778$
V5K Hasings Sunrise 9 931$ 565$
V6C DTES 1 $ n/a $ n/a
V6T UBC 76 1,208$ 1,140$
Total student demand Vancouver 918.00$
CMHC Rental Market Data 982.00$
Table 11: Average Rents by Postal Code, 2006 Census and results from student survey (n=1,268)
UBC Student Housing Demand Study and Forecast Page 24
Average Housing Cost by Commuting Time
The feedback received through the web-based survey shows that housing costs are lower for
those who live further away from campus. For example, the data on Graph 2 shows that the
average rent for those who reported that they had a commute of between 11-20 minutes was
$969 per month while those who reported a commute of one hour or more reported average
rents of $753. Over an eight month period, the difference in the two rent levels can be
significant representing a savings of over $1,700. The feedback received through the off-
campus survey also shows that approximately 1 in 3 students living off campus reported that
they have an average commute of 50 minutes or more. This includes those who are living at
home as well as those who may be living further away from campus because of difficulties in
finding suitable housing closer to campus or because of affordability considerations.
$969.38 $975.05$916.85 $912.92
$815.82
$753.10
$0
$200
$400
$600
$800
$1,000
$1,200
11-20
minutes
21-30
minutes
31-40
minutes
41-50
minutes
51-60
minutes
More than
an hour
Graph 2: Rents by Length of Commute
Affordability Pressures
Among those who responded to the web-based survey, the high cost of housing and
affordability concerns were identified by 38% of those living off campus as the one thing that
they would change about their housing if they could. Table 12 shows the average reported
rents for the Vancouver market area for different unit sizes based on the most recent rental
market data published by CMHC (Fall 2008). The information reported in Table 12 includes the
Vancouver CMA, the City of Vancouver, as well as local market data for the Kitsilano and Point
UBC Student Housing Demand Study and Forecast Page 25
Grey neighbourhoods. The information in Table 12 is also reasonably aligned with the feedback
received through the web-based survey in which students reported an average rent of $918 per
month. Table 12 also provides the basic housing cost allowances specified by the Ministry of
Advanced Education and Labour Market Development used by the Student Awards Office which
includes $535 for a single student to between $821 and $1,070 per month for single parent
families or couples with children.
# of bedrooms Vancouver CMA
City of Vancouver
Kitsilano and Point Grey
Student Housing Awards Allowances
Bachelor $754 $779 $800 $535
(single student) 1 bedroom $880 $936 $953
2 bedroom $1,124 $1,318 $1,365 $821
(single parent family)
$1,070
(couple with children)
3 bedroom $1,356 $1,749 $2,036
Total $937 $985 $1,012
Table 12: Average Monthly Rents, CMHC Rental Market Report (Autumn 2008)
It is evident that the housing allowance amounts are significantly below the rent levels paid by
UBC students. If the Housing Awards Allowance rent levels were to be used as an indicator of
student housing affordability or the affordability of attending UBC, it would seriously
underestimate actual affordability pressures. Housing costs are a large part of student budgets
and these allowances send unrealistically low suggestions to out of town applicants as to actual
local market conditions, and may result in financial hardship for newly arrived UBC students. It
is understandable to limit student debt loads by modeling typical budgets, however, these
unrealistically low cost allowances do not match the current housing market. In the event the
Ministry wishes to cap debt levels, they could consider doing so more directly rather than
through the assumptions used in the model budget. The findings of this report suggest that
consideration of revised allowances or an alternative housing supplement (grant) is warranted.
UBC Student Housing Demand Study and Forecast Page 26
The Propensity of Students to Share Accommodation
Taking into account the different arrangements identified through the survey of students living
off campus, it was determined that, on average, for each new student there is the need for
0.5923 units. This conversion factor is relevant because most housing and demographic data is
expressed by household or dwelling unit and most university data is on a per student basis.27
Estimate of Student Housing Units by Postal Code
Conversion
Factor59.23%
STUDENTS Students Units
V6K Kits 1,816 1,076
V6R Pt Grey 1,462 866
V6L Arbutus 324 192
V6P Marpole 715 424
V5R Renfrew Collingwood 457 271
V6J Kits (2) 977 579
V6M Kerrisdale 522 309
V6E West End 661 391
V6B Downtown 562 333
V6N Dunbar Southlands 552 327
V5T Mount Pleasant (2) 605 358
V6H Fairview 801 475
V5Z Fairview Cambie 738 437
V5N Kennsigton 477 283
V6Z West End 438 259
V6S Dunbar 487 288
V6G West End 534 316
V5Y Mt. Pleasant 361 214
V5P Victoria-Fraserview 260 154
V5X Sunset 202 120
V5V Mt Pleasant 361 214
V5S Killarney 183 109
V5W Riley Park 234 139
V5L Granview Woodlands 333 197
V5M Hastings Sunrise 142 84
V6A Strathcona 142 84
V5K Hasings Sunrise 152 90
V6C DTES 52 31
V6T UBC 8650
Total student demand Vancouver 23,203
In Vancouver Market 14,553 8,619 Table 13: Estimate of Student Housing Units by Postal Code
27
The estimate of the propensity to share was derived through developing a weighted average of aggregate off-
campus respondents indicating single occupancy or the number of roommates who shared.
UBC Student Housing Demand Study Page 27
On-Campus Housing Choices
UBC currently maintains an inventory of 8,680 beds for students living on campus, for an
estimated on-campus population of 11,000 students and student family members. The housing
that is provided through UBC includes a mix of different housing types and living arrangements
including single rooms, shared living arrangements and family housing.
As the university has continued to expand the range of housing types and service options
available, it is clear that this housing has generated a wider level of interest and appeal beyond
the traditional under-graduate housing choices. This final section looks at the feedback
received from the 2,401 students who responded to the web-based survey28 including their
general satisfaction with the different aspects of their housing situation and the factors which
influenced their decision to live on campus.
Based on the feedback received, 89% of those living on campus reported that they were
satisfied or very satisfied with their housing situation. In addition, 38% reported that access to
residence played a role in shaping their decision to attend UBC.
When asked about the different aspects of campus life that were important to them:
• 91% found the quality of student housing as satisfactory to very good;
• 81% viewed the academic benefits of living on campus as important or very important;
• 76% said the social benefits and a close connection to the larger university experience were
a strong reason to live on campus; and,
• 74% said that more shops and services would improve the quality of the on-campus living
experience.
A number of students also identified the desire for more shops, services or social amenities on
campus with 46% reporting that they frequently leave campus for groceries and supplies.
Table 14 provides additional details on the different aspects of on-campus housing that
respondents identified as being most important to them. This included factors related to
convenience, access to services and amenities, as well as the ability to engage in student life.
28
A response rate of 2,401 represents approximately 28% of all students currently living on campus based on an
estimated inventory of 8,680 on-campus housing spaces. A sample of this size provides a high degree of
confidence in the reliability of the findings.
UBC Student Housing Demand Study Page 28
Importance of Aspects of Living On-Campus % of Responses
not having to commute 91%
convenience of on-campus living 89%
access to the library, study spaces and other academic supports 81%
freedom from the hassles of renting 76%
sense of engagement and connectedness with the university 76%
social opportunities 76%
sense of community and engagement with external environment 75%
housing affordability 70%
sense of independence 62%
access to cultural and recreational activities 61%
quality of housing 60%
access to services and amenities 49%
access to a meal plan and other services 39%
access to childcare 11%
Table 14: Important Aspects of Living On Campus from student web-based survey (n=2,231)
As a broad observation to emerge from the above data, it can be stated that the importance that
students place on living on campus as part of the broader academic and student experience
suggests that there exists a significant pull for on-campus housing.
UBC Student Housing Demand Study Page 29
Student Housing Demand Forecast under the Two Scenarios
In preparing the student housing demand forecast, the following scenarios were considered:
Scenario 1
The first scenario held student enrolment constant at 2008 levels (n=30,560 students) and
included an assessment of the impact of the following external market pressures:
a. Constraints on the number of new rental housing units being added in the broader
Vancouver market;
b. A decline in the available supply of rental units in key Vancouver neighbourhoods
including rented single detached homes, rented secondary suites, and garden and
basement suites;
c. The potential impact of on-going growth pressure and increased competition from non-
student households moving to the City of Vancouver and the Metro Vancouver region;
and,
d. The potential effects of on-going price increases and affordability pressures in the
private rental market.
The results of the analysis are shown in Table 15:
Student Housing Demand
Forecast Scenario #1
5 years
(to 2013)
10 years
(to 2018)
15 years
(to 2023)
20 years
(to 2028)
Total
Decline in available supply relative to student
housing units in the Vancouver Rental Market
7.7% 8.0% 8.2% 8.5% 32.5%
Full-Time Students 30,560 30,560 30,560 30,560 30,560
Growth Pressure: Demand Increase + Supply
Decrease (UNITS)
727 750 774 801 3,052 units
Growth Pressure: Demand Increase + Supply
Decrease (STUDENTS)
1,227 1,266 1,307 1,352 5,152 beds
Decline in available supply relative to student
housing units in the Vancouver Rental Market
7.7% 8.0% 8.2% 8.5% 32.5%
Full-Time Students 30,560 30,560 30,560 30,560 30,560
Students Housed on Campus 9,877 11,143 12,451 13,803 13,803
% of Full-Time Students Housed on Campus 32.3% 36.5% 40.7% 45.2% 45.2%
Table 15: Estimated On-Campus Housing Demand (Holding Enrolment Constant)
UBC Student Housing Demand Study Page 30
Under this scenario, even without an increase in student enrolment, the university would have to
add 5,152 spaces or approximately 3,052 additional units of on-campus housing just to maintain
the current availability of student housing within the broader rental housing market.
Scenario 2
The second scenario modeled maintained all of the assumptions of the first scenario but
assumed that there would be an increase in student enrolment by approximately 9% or an
additional 2,800 new students over the 20 year time frame.
Student Housing Demand
Forecast Scenario #2
5 years
(to 2013)
10 years
(to 2018)
15 years
(to 2023)
20 years
(to 2028)
Total
Full-Time Students 30,560 33,362 33.362 33,362 33,362
Students Housed on Campus 10,554 12,385 13,692 15,044 15,044
Growth Pressure: Demand Increase + Supply
Decrease (UNITS)
1,128 1,084 774 801 3,787
units
Growth Pressure: Demand Increase + Supply
Decrease (STUDENTS)
1,904 1,803 1,307 1,352 6,366
beds
Decline in available supply relative to student
housing units in the Vancouver Rental Market
12.0% 11.5% 8.2% 8.5% 39.2%
% of Full-Time Students Housed on Campus 33.0% 37.1% 41.0% 45.1% 45.1%
Table 16: Estimated On-Campus Housing Demand (increase of 2,800 students-9% growth)
Under this scenario, UBC would have to add 6,366 spaces or approximately 3,787 new on-
campus housing units just to maintain the current availability of student housing within the
broader rental housing market.
Conclusions
In looking at the feedback received from students living on campus, it appears that many of the
factors identified could be described as “pull factors” or factors which draw students toward the
different housing options offered on campus. The feedback provided also suggests that, for
many living on campus, their housing has provided them with the ability to more fully engage in
student life.
The study findings also suggest that the demand for on-campus housing can be influenced by a
variety of “push-related” and “pull-related” factors including diminished choice within the broader
rental housing market. This can be the result of increased competition for available units and
can result in a situation where there is even greater demand for on-campus housing.
The on-campus housing demand forecast set out in this report examined the inter-relationship
between on- and off-campus housing choices. It also looked at the different choices and trade-
offs that students make including trade-offs between independence, privacy, suitability and
UBC Student Housing Demand Study Page 31
affordability. Changes in the broader rental housing market, both in terms of supply- and
demand-related pressures can also influence the outcome.
Different scenarios modeled in this report took into consideration the likely outcomes under a
modest growth scenario as well as under a scenario of “no growth”. Under both scenarios,
modest growth of the student population; and a cap on growth, it was concluded that, because
of larger housing market forces (supply-related and demand-related), there will continue to be
significant pressure for an expansion of on-campus student housing. In particular, it is
estimated that there will be the need for between 5,152 and 6,366 new student spaces just to
maintain the current availability of student housing.
In putting forward these estimates, the analysis is intended to help to provide important data for
informing UBC’s planning activities and for guiding and informing future planning decisions. At
the same time, it is important to recognize that the timing of the construction of the units as well
as decisions around establishing targets for the proportion of on-campus student housing are
decisions which should be evaluated within the broader context of UBC’s strategic goals and
objectives.