17
The Effect of Varying Strobe Light Frequencies on Visual Reaction Time BE 301 Group #103 Daniel W. Shin, Sarah McKinley, Ryan Hubbell, Andrea Ciolko December 5th, 2014
| Date post: | 15-Apr-2017 |
| Category: |
Documents |
| Upload: | daniel-w-shin |
| View: | 28 times |
| Download: | 3 times |

The Effect of Varying Strobe Light Frequencies on Visual Reaction Time BE 301
Group #103 Daniel W. Shin, Sarah McKinley, Ryan Hubbell, Andrea Ciolko
December 5th, 2014

Abstract: The purpose of this experiment is to determine the effect of a strobing light on visual reaction time and brainwave activity. To gather data, the subject performed a visual reaction time test in different lighting conditions: ambient light, dark, and dark in the presence of a 2, 10, and 20 Hz strobe light. EEG data was also taken for each lighting condition, with two sets of electrodes attached posteriorly to both the right and left side of the subject’s scalp. This testing sequence was repeated twice for each subject. The subject’s mean reaction time and alpha wave RMS value were calculated for each section. For the 10 Hz sections, EEG peak amplitude and frequency were also calculated. Results were based on the reaction time, alpha wave RMS, and peak amplitude values averaged for all twelve subjects. It was found that there is no correlation between strobing lights and reaction time or alpha wave activity. There is a relationship between EEG activity and strobing lights, as each flash resulted in a spike in waveform amplitude three times larger than the dark control with no flashes. Improvements in future testing include improving electrode contact with scalp in order to increase EEG accuracy, and testing all subjects in the same room to ensure consistent lighting conditions. Introduction and Theory: Strobe lights produce a rapidly flashing light at a variety of frequencies. Frequencies between 5 and 30 Hz are the most likely to evoke quantifiable responses in brainwave activity in subjects. This is induced by the rapid contrast between light and dark over stimulating the visual cortex, the region of the brain responsible for visual processing, resulting in rapid activation of neurons that then trigger a nervous response through the brain. The flash of a strobe light is transmitted to the visual cortex though the visual pathway, beginning with light entering the eye and striking the retina, the photosensitive nervous layer that comprises the posterior portion of the eyeball. When this occurs, the photosensitive cells, rods and cones, convert the energy of the transmitted light to an electrical nervous signal, which then enters the central nervous system through the optic nerve to be processed in the visual cortex. An electroencephalogram, or EEG, can be used to detect patterns in brainwave activity, such as the changes that occur with exposure to a strobing light or processing changing amounts of visual information. EEGs utilize electrodes placed on the scalp of the subject to detect changes in electrical signals of nerve impulses that create brainwaves.

Investigation into the negative side effects of strobing lights and brain activity began in the mid-1960s. Studies showed that in 5% of the population, exposure to strobing lights created anomalous and erratic spikes in the brain waves, indicative that the subject has photosensitive epilepsy. More recently, the correlation between the strobe effect and reaction time has been investigated. In 2012, Nike released stroboscopic eyewear intended to be used as a tool in reaction time training. The lenses of the glasses flicker between clear and opaque, alternatively allowing for and blocking the transmission of visual information to the wearer. The limited amount of visual information received by the wearer is intended to increase the individual’s reaction time by allowing them to perceive motion without consistent visual input.
A preliminary study conducted by Duke University in 2012 found that in 500 athletes performing visual-motor reaction time tasks, two 25-minute sessions of training using the stroboscopic eyewear produced a decrease in reaction time in some participants, but as the improvement was not consistent, the researchers deemed their initial findings inconclusive. The visual reaction time test utilized for this experiment is the ruler drop test, where the distance the ruler drops before it is caught by the subject is used to calculate the amount of time the ruler is dropping, the reaction time. The governing equation for this is based on the kinematic relationship between initial velocity, time, acceleration due to gravity, and distance traveled.
d = Distance v i = Initial velocity g = 981 cm/sec2
t = Reaction time
d = v i t + ½ gt 2
Initial velocity of the ruler is zero. Rearranging for time yields the final equation, t = √(2d/g)
The purpose of this experiment is to determine the effect of a strobing light on
visual reaction time, and to observe the changes, if any, in brainwave activity when a subject is exposed to changing light conditions. Hypothesis:
Increasing the frequency of a strobe light will result in faster visual reaction time and increase in amplitude of the EEG waveform.

Setup & Method: EEG Setup: Electrodes were applied to the right and left halves of the scalp of the subject according to Table 1. Electrodes were attached with conductive gel and pressed firmly in place for 60 seconds. Two three-lead sets attached the electrodes to the MP36 data acquisition unit. EEG data was gathered using a BSL EEG Lab acquisition file. Table 1: Area of electrode application to skull and color of lead to be attached to each
electrode.
Electrode Placement (For Each Hemisphere) Color of Lead Attached
Inferior to ear, posterior to jaw Black
Posterior superior portion of skull Red
Posterior inferior portion, directly below previously placed electrode
White
Reaction Time Test: The subject was seated, with dominant arm bent at the elbow resting on a table. The subject’s wrist and hand overhung the edge of the table, as shown in figure 1. The experimenter held the ruler just above the opening between the subject’s thumb and forefinger.
Figure 1: The subject’s arm rest at his or her side on the table, with wrist overhanging the edge. Ruler should be suspended just level with the opening of the subject’s hand.

The experimenter performed the ruler drop at random within a 30 second period without informing subject. The distance of the ruler drop was then recorded, measuring from top of the subject’s thumb. Lighting Setup: The subject performed the reaction time test in ambient lighting, dark, and in the dark with 2, 10, and 20 Hz strobe lighting. The strobe light was placed 10 feet in front of subject, at eye level. The subject was positioned so that his or her arm could comfortably rest on the table to their side to perform the reaction time test, while still facing the strobe light head on. While the strobe was on, the subject focused on his or her hand, not the strobe light. Data Collection: BSL Lesson and EEG acquisition file were used to gather data. A ruler-drop reaction time test is performed for each lighting segment, starting with ambient light. When changing from a light to dark segments, there was a 120 second adjustment period, and a 60 second recovery period between each strobing segment. No reaction time test was performed in these segments.
Table 2: Light segment, duration, and required data collection
Section: Duration of Segment
EEG Recording Time
Reaction Time Test
Ambient Light -- 30 seconds Yes
Adjustment 120 seconds 60 Seconds No
Dark -- 30 seconds Yes
2 Hz 30 seconds 30 seconds Yes
Dark Recovery 1
60 Seconds 60 seconds No
10 Hz 30 seconds 30 seconds Yes
Dark Recovery 2
60 Seconds 60 seconds No
20 Hz 30 seconds 30 seconds Yes
Ambient 5 minutes -- --

Data Analysis: The reaction time was recorded for both trials for each segment (ambient light,
dark, 2, 10, and 20 Hz) for each subject. The average reaction time for each segment and each subject for the two trials was then calculated. To normalize the data, the percent change in the average reaction time for each subject was calculated. The different strobe light frequencies were compared to the dark condition which was the control. Specifically the following formula was used:
% change in avg. reaction time = 100(Average reaction time for dark)
(Average reaction time for strobe −Average reaction time for dark) ×
Mean alpha wave RMS was calculated for each lighting section in BSL student by using averaged value of the calculated RMS channel over 15 seconds. To normalize the data, the percent change in the average reaction time for each subject was calculated.
% change in alpha RMS = 100(Average RMS dark)(Average RMS strobe −Average RMS dark) ×
For both reaction time and alpha wave RMS, 95% confidence intervals were
calculated, using [(1.96)x (standard deviation) ]/ [(sample size)^(1/2)].
Results & Discussion: Reaction Time Results
The results from this normalization are shown in Figure 1. The x-axis represents the average reaction time for dark segment for each subject respectively. Furthermore, a positive percent change indicates that the subject had a slower reaction time for the strobing segment than the dark segment while a negative percent change indicates that the subject had a faster reaction time for the strobing segment compared to the dark condition. It can be seen from Figure 1 that 10 out of the 12 total subjects had a slower reaction time for the 2 Hz segment. The positive percent change for the 2 Hz segment varied from 2.5% for subject 1 to 55.2% for subject 12. This could be due to the fact that the 2 Hz strobe light segment was the first segment using the strobe light and the subjects were not used to it. For the 10 Hz segment, 8 out of the 12 subjects had a faster reaction time compared to the dark condition. The negative percent change for the 10 Hz segment varied from -9.1% for subject 8 to -48.5% for subject 11. For the 20 Hz segment, it was split almost in half; 7 subjects had a slower reaction time and 5 subjects had a faster reaction time compared to the dark condition. The positive percent change for the 20 Hz segment ranged from 1.1% for subject 10 to 24.5% for subject 1.

The negative percent change for the 20 Hz segment ranged from -2.1% for subject 7 to -44.8% for subject 4.
Figure 1: The majority of subjects had a slower reaction time for the 2Hz segment, and a faster reaction time for the 10 Hz segment. For the 20 Hz segment, 7 subjects had a
slower reaction time and 5 subjects had a faster reaction time.
In order to determine if increasing the strobe light frequency results in a faster reaction time, the reaction times for trial 1 and trial 2 for each subject were considered. The hypothesis was only supported for both trial 1 and trial 2 for one subject (subject 4). The results from subject 4 are shown in Figure 2. The reaction time for trial 1 decreased from 0.374s to .305s to.204s for 2Hz to 10Hz to 20Hz respectively. For trial 2, the reaction time decreased from .274s to .153s to .135s for 2Hz to 10Hz to 20Hz respectively.

Figure 2: Faster reaction time for subject 4 for both trial 1 and trial 2 when increasing
the frequency of the strobe light from 2Hz, to 10 Hz, to 20 Hz.
The average of the reaction times for the two trials for each subject was calculated next. The results showed that the hypothesis was only partially supported for one subject (Subject 10).The reaction time was shown to decrease when the frequency of the strobe light increased from 2 Hz to 10 Hz but stayed about the same from 10Hz to 20 Hz. Figure 3 shows this trend for Subject 10, with error bars indicating a 95% confidence interval. The average reaction time for 2 Hz was .346s +/-.432, for 10 Hz it was .269s +/-.278, for 20 Hz it was .259s +/-.274.
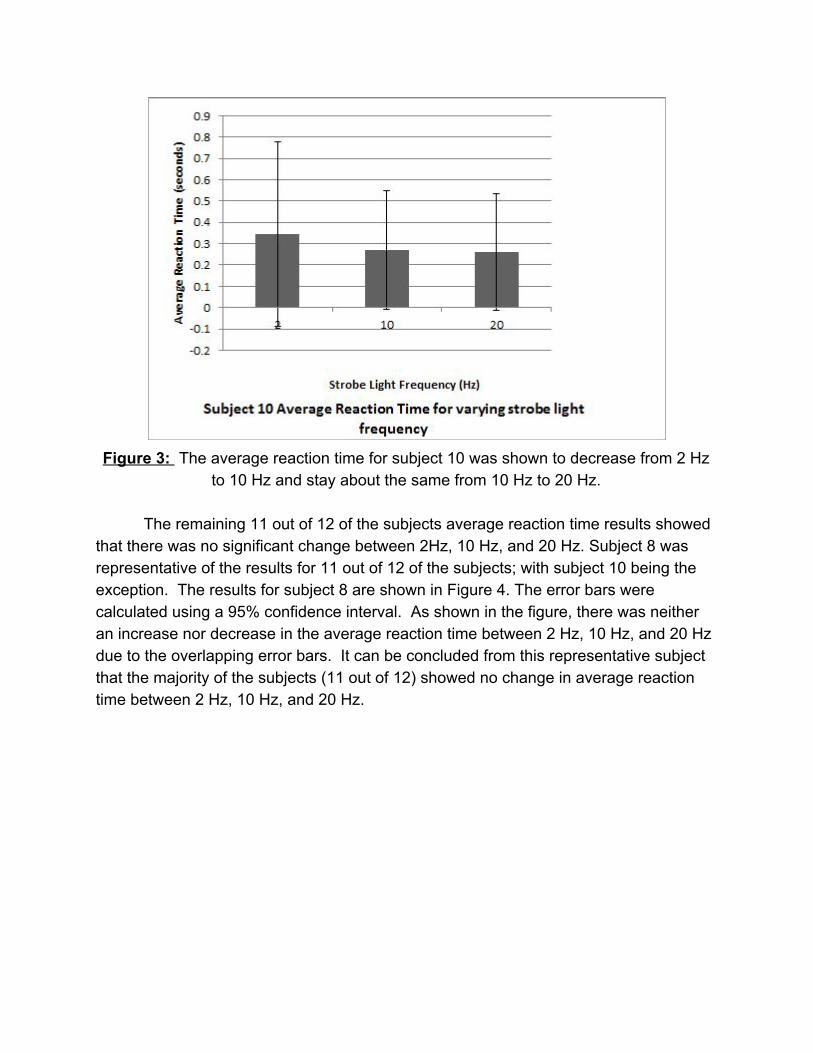
Figure 3: The average reaction time for subject 10 was shown to decrease from 2 Hz
to 10 Hz and stay about the same from 10 Hz to 20 Hz.
The remaining 11 out of 12 of the subjects average reaction time results showed that there was no significant change between 2Hz, 10 Hz, and 20 Hz. Subject 8 was representative of the results for 11 out of 12 of the subjects; with subject 10 being the exception. The results for subject 8 are shown in Figure 4. The error bars were calculated using a 95% confidence interval. As shown in the figure, there was neither an increase nor decrease in the average reaction time between 2 Hz, 10 Hz, and 20 Hz due to the overlapping error bars. It can be concluded from this representative subject that the majority of the subjects (11 out of 12) showed no change in average reaction time between 2 Hz, 10 Hz, and 20 Hz.

Figure 4: The average reaction time for subject 8 was shown to stay within the same
range as defined by the error bars from 2 Hz to 10 Hz to 20 Hz.
The results supported the hypothesis that the average reaction time for the 2nd trial was faster than the 1st trial. However, the average reaction time in the 2nd trial under dark condition stayed almost the same compared to the 1st trial. Subjects were able to react faster on the ruler drop in the 2nd trial because they were able to adjust more on the strobe light condition. The results are shown in the Figure 5.

Figure 5: Average reaction time was calculated for 1st and 2nd trial under different
conditions (dark, 2 Hz, 10 Hz, and 20 Hz). Not much of difference of reaction time was found under dark condition between 1st and 2nd trial. However, the 2nd trial of the reaction time under strobe light decreased compared to the 1st trial. The error bars are indicating
95% confidence interval.
According to the data shown in Figure 6, 9 out of 12 subjects fell exactly or almost into our hypothesis. Their reaction time on the 2nd trial decreased compared to the 1st trial. There are some outliers on the data in Figure 6 which were inconsistent with the percent change in the reaction time. This inconsistency on the outcome of 3 other subjects may have been affected by the distraction of flickering strobe light. The subjects may have been more uncomfortable than others under flickering strobe light.

Figure 6: Percent change in reaction time in 2nd trial compared to 1st trial under different condition is plotted for every subjects. Error bars are indicating 95% confidence interval. The 95% confidence interval lies between the range of -17.02% to 20.39% for the dark condition, -28.00% to -7.00% for 2 Hz strobe light condition, -29.84% to -6.17% for 10
Hz strobe light condition, and -35.62% to 0.977% for 20 Hz strobe light condition.
EEG Activity Results When analyzing the correlation between lighting conditions and EEG activity,
both the overall change in brainwave activity as well as changes in waveform frequency and shape were considered for the 10 Hz section. For overall change in activity, the alpha wave was selected as the type of brainwave most representative of changes in brain activity, as alpha waves originate from the occipital lobe, the visual processing center of the brain. The alpha wave RMS value was averaged for each light and dark for all twelve subjects. For the strobing sections, percent change with respect to dark was calculated for the three frequencies. The change in mean RMS value from light to dark was surprising, and countered the expected result. As a definition, the amplitude of alpha waves increase when a subject transitions from eyes open to eyes closed. Assuming that this increase is due to amount of visual stimulation entering the eye, the amplitude would be expected to increase from light to dark. However, there was a 73.2% decrease in mean RMS from light to dark. This decrease is statistically significant, as the 95% confidence intervals do

not overlap. This indicated that light and dark and eyes open and shut are not equivalent, as earlier assumed.
Figure 7: Averaged Alpha Wave RMS for Twelve Subjects. The 73.2% decrease in
value from light to dark was opposite the expected trend, suggesting that transitioning from light to dark and eyes open to closed do not produce the same changes in alpha
wave RMS. This decrease is statistically significant, as the 95% confidence intervals do not overlap
It was hypothesized that EEG activity would increase as frequency of the strobe
light increased, but this trend is not reflected in the data. The 2 Hz has the highest percent difference from the dark control, with a 111% increase in alpha wave RMS value. 10 Hz decreased by 28.5% relative to the dark control, the opposite of the hypothesized result. The change from 10 Hz to 20 Hz does reflect the hypothesized increase in activity, and mean RMS value increased to 413% greater than 10 Hz. However, the error bars, representative of a 95% confidence interval, overlap, indicating that these changes are not statistically significant, and no definitive change in brainwave activity can be correlated with changing frequencies of strobe light.

Figure 8: Percent change in Alpha Wave RMS with respect to the dark control. The
change in alpha wave RMS from the increasing frequencies were not found to be statistically significant, as the 95% confidence intervals overlap.
When considering trends and changes in waveform shape between sections, it
was hypothesized that there would be a spike in the EEG that correlated to each flash of the strobe light.
In order to evaluate this, the EEG waveform of 10 Hz was compared to that of the dark section. The peak values of the 10 Hz spikes were then averaged for ten peaks; in comparison to the average dark amplitude, the spikes were 3.12 times larger. Furthermore, the duration of time between from peak to peak had an average value of 0.989 seconds, correlating strongly to the 10 Hz frequency.

Figure 9: A comparison on dark EEG (top) and 10 Hz EEG waveforms. 10 Hz shows spikes every 0.1 seconds. correlating to the 10 Hz strobe light. The spike was times greater than the average dark EEG amplitude value. Improvements:
There are several factors that should be improved in this experiment. One of the most important factors that could be improved was the strobe light that was used. In the experiment, a strobe light app downloaded onto a smartphone was used which consisted of the camera flash blinking at specified frequencies. In future experiments, a real strobe light could potentially allow for more clearly defined results. However, the drawback to using a real strobe light is that it could also negatively affect the subjects and make them uncomfortable and nausea more quickly than a strobe light app. Differentiating the cause of the results due to changes in brain waves, or due to the negative side effects of the strobe light could potentially be problematic.
Electrode adhesion is another area that could be improved. EEG tests can be quite tedious to set up due to applying the electrode to the subject’s scalp. With a poor attachment, the results can be skewed and it is difficult to decipher trends in the graph. A more efficient way of securing the electrodes to the subject’s head would result in better data.
Conducting more trials for each subject would allow for a more accurate representation of the average reaction time for each subject. Two trials was simply not enough to get a full understanding of the trends in reaction time. More trials would decrease the error bars. But unfortunately more trials would result in taking more of the subjects time.
Consistency of the room where the experiment took place is one factor that should be controlled. It was not guaranteed that the same classroom that was used for testing would be open for every subject that was tested, and therefore the testing location varied between a couple of different classrooms. These different classrooms had slightly different ambient light conditions and completely dark conditions and therefore could have affected the results. In the future, ensuring that the same classroom is used would allow for more consistency in our experiment.
Conclusions:
The percent change in the average reaction time results lead to the conclusion that the majority of the subjects (11 out of 12) had a slower reaction time for the 2 Hz segment compared to the dark segment. In addition, it was seen that that 8 out of the 12 subjects had a faster reaction time for the 10 Hz segment compared to dark segment.

For the 20 Hz segment, the results were split almost 50/50, with 7 subjects having a slower reaction time and 5 subjects having a faster reaction time.
When the trends in average reaction times between 2 Hz, 10 Hz, and 20 Hz were considered, the hypothesis that increasing the frequency of the strobe light would lead to a faster reaction time could not be supported. Instead, it was seen that for the majority of the subjects (11 out of 12), the average reaction times overlapped indicating there was no change between different strobe light frequencies.
The hypothesis that subjects would have a faster reaction time for trial 2 compared to trial 1 was supported by the data for all segments except for the dark condition when the average reaction time was calculated for each subject Moreover, when the data was normalized the percent change in reaction time for the 2nd trial compared to the first trial was seen to decrease for 9 out of the 12 subjects.
The EEG results concluded that the amplitude of the alpha waves decreased from light to dark by 73.2%, which is opposite of what was expected. In addition, the hypothesis that the alpha wave RMS values would increase as the frequency of the strobe light increased was not shown in the data. The results with 95% confidence errors bars indicated that there was no significant change between 2 Hz, 10 Hz, and 20 Hz.
The hypothesis that there would be a spike in the EEG that correlated with the flash of the strobe was supported by the change in peak amplitude from 10 Hz to dark trials. The amplitude of 10 Hz was on average 3.12 times larger, and spaced 0.989 seconds apart, strongly correlating to the 0.1 spacing of the strobe flashes.
Further studies are needed to confirm or reject the hypotheses posed in this study. Specifically, future studies should consider using a real strobe light, should include more trials per person, and should modify how electrodes are attached to the skull in order to receive better results . Understanding the correlation between strobe lights and brain activity would be beneficial for preventing unwanted side effects of strobe lights such as nausea, dizziness, and seizures. In addition, an optimal frequency that increases visual reaction time could be established for athletes to use as a training tool.
References: " Electroencephalogram (EEG)." EEG Electroencephalogram . Web. 21 Nov. 2014.
<http://www.mayfieldclinic.com/PE-EEG.htm>. Fedotchev, Alexander I., Alexander T. Bondar, and Vladimir F. Konovalov. "Stability of
Resonance EEG Reactions to Flickering Light in Humans."International Journal of Psychophysiology, 9 (1989): 189-93. National Center for Biotechnology Information. U.S. National Library of Medicine. Web. 23 Oct. 2014.
Herrmann, Christoph S. "Human EEG Responses to 1-100 Hz Flicker: Resonance
Phenomena in Visual Cortex and Their Potential Correlation to Cognitive Phenomena." Experimental Brain Research137.3-4 (2001): 346-53. Web. 23 Oct. 2014.
Mitroff, Stephen R., P.h.D, Peter Friesen, Bsc,PT, PE, Doug Bennett, MA, Herb Yoo,
MS, and Alan W. Reichow, OD. "Enhancing Ice Hockey Skills Through Stroboscopic Visual Training: A Pilot Study." Athletic Training and Sports Health Care 5.6 (2013): 261-64. Web. 23 Oct. 2014.
"Strobe Eyewear Training May Improve Visual Abilities." Duke Today . Web. 18 Nov.
2014. <http://today.duke.edu/2011/05/nikestrobe>.

![FinalProjectReport [EDocFind.com]](https://static.documents.pub/doc/80x56/577d2c441a28ab4e1eabbfc2/finalprojectreport-edocfindcom.jpg)


