61
1 FINA/MANA 4397 Behavioral Finance Class Notes and Problems Instructor: Dale Rude Fall Semester, 2004

1
FINA/MANA 4397 Behavioral Finance Class Notes and Problems Instructor: Dale Rude Fall Semester, 2004

2
TABLE OF CONTENTS Setting the Stage 3 Teams 6 Some Generic Types of Decision Strategies 12 Lens Model: Overview 13 Lens Model: Statistics Made Easy 16 Lens Model: A Step by Step Method for Interpreting 21 Policy Capturing Results from a Lens Model Analysis Lens Model: Four Measures of Judgment Accuracy 23 Lens Model: Five Steps to Making Accurate Judgments 23 Lens Model: The Lens Model Equation 24 Lens Model: Ascertaining Relationship Between Cues and Outcome 24 Lens Model: Glossary 25 Lens Model: Performance of Professional Handicapper 27 Rationalist vs. Behavioralist Paradigms 37 Are Investors Rational? A Look at US Literacy 43 Perception 49 Operant Learning Theory 50 Heuristics and Biases 51 Prospect Theory 53 Winner's Curse 57 Nonrational Escalation of Commitment 58 Expertise: Analysis & Intuition 60

3
Setting the Stage: Introductory Problems 1. A major purpose of this course is to enable you to "manipulate" your work environment and the people within it more effectively. Is it ethical to "manipulate" your work environment and the people within it? 2. The following quote is from Managing by Harold Geneen (former CEO of ITT). Theory G: You cannot run a business, or anything else, on a theory. Theories are like those paper hoops I remember from the circuses of my childhood. They seemed so solid until the clown crashed through them. Then you realized that they were paper-thin and that there was little left after the event; the illusion was gone. In more than fifty years in the business world, I must have read hundreds of books and thousands of magazine articles and academic papers on how to manage a successful business. When I was young, I used to absorb and believe those theories and formulas propounded by professors and consultants. Their reasoning was always solid and logical, the grains of wisdom true and indisputable, the conclusions inevitable. But when I reached a position in the corporate hierarchy where I had to make decisions which governed others, I found that none of these theories really worked as advertised. Fragments here and there were helpful, but not one of those books or theories ever reduced the operation of a business, or even part of one business, to a single formula or an interlocking set of formulas that I could use. Assess the validity of the following statements:
In the MBA curriculum (and most graduate curricula), the argument can be made that students invest huge amounts of money, time, and effort to learn theories. Geneen observes that theories are worthless. Thus, education is a scam. Students are wasting their time, effort, and money.
3. a) What is science? b) What are theories and what do they tell us? c) What does it mean to say that something is "true?" d) In Zen and the Art of Motorcycle Maintenance, Robert Pirsig has written, "It's completely natural to think of Europeans who believed in ghosts as ignorant. The scientific point of view has wiped out every other view to the point that they all seem primitive, so that if a person today talks about ghosts or spirits he is considered ignorant or maybe nutty. Oh, the laws of physics and logic . . . the number system . . . the principles of algebraic substitution. These are ghosts. We just believe in them so thoroughly that they seem real." Assess the validity of his statements.

4
4. Leverage Points---aspects of a situation to which if you apply your efforts, you will maximize your chances for creating a desired outcome. Leverage points are causes of the variable of interest. How to identify: In a causal box and arrow model, locate the variable of interest. Typically, it is a behavior or an attitude. Locate all boxes from which arrows lead to the box containing the variable of interest. These variables are the leverage points. a) What are the leverage points in the example below and how did Soros make use of one of them. From George Soros from "The man who moves markets" Business Week cover story 8/23/93: George Soros is the most powerful and successful investor in the world. As a student of philosophy at the London School of Economics, Soros developed ideas about political systems, society, and human behavior that would engross him for the rest of his life. Since closed political systems are inherently unstable, Soros reasoned that he could generate a major change by exerting just a little force. "Soros constantly chooses those (leverage) points where he can influence with his limited power. By choosing carefully where and how to step in, he can gain maximum impact. It's like the stock exchange and knowing at what time to intervene," says Tibor Vamos, a long-time friend of Soros. In the closed Hungarian society, tight control of information, the military, and financial resources gave the rulers power prior to 1989. One of Soros' cleverest ploys was giving hundreds of photocopiers to Hungarian libraries in the mid-1980s. Up to that time, copying machines had been monitored by secret-service agents to prevent their use by the underground press. Soros proposed donating the machines in 1985 under the condition that they not be controlled. The government was eager to accept, because it couldn't afford to buy them with its ever shrinking reserves of hard currency. Vamos recalls, "After that, the secret service stopped patrolling all copy machines. . . . It helped the underground press tremendously" in its efforts to overthrow the Hungarian government.

5
5. a) What is "fairness?" b) In a classroom setting, what is "fair?" 6. In a Risk Management Bulletin dated February 1, 1997, the Director of Rick Management for the University of Houston System presented the following: Topic: Physical Damage Coverage for Car Rental The State of Texas has state contracts for two rental car agencies, Avis and Advantage. These contracts are for continental United States travel only. These contracts are for a set rate for daily car rental and include liability coverage, free Loss Damage Waiver (L/DW) and unlimited mileage in most locations. There are exceptions, so please consult the Texas State Travel Directory. Liability coverage pays for damage and/or bodily injury sustained by a third party. L/DW is comprehensive or collision coverage on the rental vehicle. It pays for any physical damage sustained to the vehicle. Neither the State of Texas nor the University of Houston will reimburse for payment for liability coverage on car rental agreements other than Avis or Advantage. L/DW costs will be reimbursed on other rental car agreements as long as an acceptable exception exists for non-use of Avis or Advantage. This is VERY IMPORTANT because if an employee does not purchase physical damage coverage for a rental vehicle and the vehicle is damaged, the University does not have the insurance coverage to pay for the damage. DID YOU KNOW that you can rent a car or van from the UH Physical Plant? Cars cost $25.00 per day, $.28 per mile and the first 30 miles are free. Vans cost $30.00 per day, $.36 a mile with the first 30 miles free. The bulletin was forwarded to all College of Business Administration faculty and staff by the College Business Manager. a) Assign a grade (A, B, C, D, F) to this writing sample. b) Critique the memo. c) Edit the memo to make it more effective.

6
Teams LEARNING OBJECTIVES: a) the forming, storming, norming, and performing model, b) Gersick's punctuated equilibrium model, c) the six variable model of team effectiveness and four trip wires, d) norms, e) sources of norms, enforcing norms, and breaking norms. 1. Definition: two or more individuals who perceive of themselves as interdependent and act as a single unit, typically with a common goal. 2. Stages of team development a) Forming (orientation to task)-initial stage of group development, represents the movement of an individual into group member status. Team member characteristics Determination of which behaviors will be appropriate Hestitant participation tempered with optimism, Organizational complaints and gripes common, Some suspicion and fear of team situation Looking for a sense of belonging Closely watching their team members' behaviors Learning what contributions members should be expected to make Facilitator behaviors Ensure that team members get acquainted Be sensitive to team members' needs Provide clear direction and information Give team simple tasks Provide training on team building tools b) Storming (redefinition of appropriate behavior)-this stage is characterized by conflicts that erupt as members seek agreement on the purpose, goals, and objectives of the group and the roles of its members. Although one would expect progress to pick up during this stage, little actually develops. This stage has great "downside" possibilities if not managed well.

7
Team member characteristics Conflict between team members begins to show. One upmanship can develop Continuing confusion over team member roles Facilitator behaviors Continue to be positive and informative Reassure team that current conflict is normal Deal openly with conflict Give team more responsible tasks Continue to train on team building and team tools c) Norming (coordination of group behaviors)-this stage is focused on reestablishing the central purpose of the team in light of the structure of roles developed during the storming stage. Team begins to come together. Conflict is subsequently reduced as the teams grows in confidence and begins to find that the team concept is working Team member characteristics Over reliance on team leader/facilitator is possible. Conflicts reduced among team members Sharing and discussing become team norms Greater team cohesiveness develops Harmony among team members becomes common Facilitator behaviors Provide less structure as team matures Give team even more responsibility Ensure that team does not over rely on one member Continue to provide team development and training opportunities d) Performing (formalization of functional group behavior)-members fulfill their prescribed roles and work toward attaining team goals. "Team" behavior becomes the norm. While team members may occasionally be replaced, the team has become self functioning. The team routinely defines and solves difficult issues.

8
Team member characteristics Intense loyalty among team members develops Teams may mask individual dysfunctional members Teams can become competitive with other teams Teams become more innovative Team members become more confident Facilitator behaviors Ensure that team information needs are fulfilled Ensure that team celebrates its successes Encourage team toward continued growth Continue to train and ensure that new members are trained Reduce your involvement as team grows Continue to foster trust and commitment among team members 3. Group may recycle through the stages especially if changes in membership, task or environment occur. 4. Alternate approach--Gersick's punctuated equilibrium model (perhaps better described as the "mid-life crisis" model). The team spends first half of its time working toward direction set by team at end of its first meeting. At half-way point, group experiences transition, in which it uses learning gained in first phase to change direction and generate work for second phase. 5. A model of team effectiveness
a) Six leverage points for effective team performance: to perform well, a team must 1) exert sufficient effort to accomplish the task at an acceptable level of performance--
motivational structure of task. Is the task clear, consistent with a team's purpose, and high on intrinsic motivation?
2) bring adequate knowledge and skill to bear on the task work--team composition. Critical skills for team members include i) technical or functional expertise, ii) problem solving and decision making skills, and iii) interpersonal skills. Is the team well staffed? Do members have sufficient expertise? Do they have sufficient interpersonal skill to interact as a team? Are they so similar as to no be able to learn from one another or so different that they can't work together?
3) employ task strategies that are appropriate to the work and to the setting in which it is being performed--team norms that regulate behavior and foster scanning and planning. Are team norms clear and strong enough to regulate behavior efficiently, thereby making coordinated action possible? Do they actively promote continuous scanning of the performance situation

9
and proactive planning of the team performance strategies? 4) agree upon a common purpose which translates into specific team and individual performance
goals--put a demand or opportunity in the team's path. Devote large amounts of time and effort to exploring, shaping, and agreeing upon a purpose that belongs to team members collectively and individually.
5) coordinate time management strategies--facilitate the efforts of organized and deadline driven members by recognizing differences and setting intermediate deadlines.
6) Size--Is it the right size given the work to be done? b) Trip wires which cause teams to fail
1. Call the performing unit a team but really manage members as individuals. 2. Fall off authority balance beam (too much or too little) How to avoid it: Managers should assign direction (end state to be pursued) and outer-limit constraints (what should always or never be done) but delegate means to the team. Assemble a large team of people, tell them in general terms what needs to be done, and let them "work out the details." How to avoid it: Provide an enabling structure. Well-designed team task that engages and sustains member motivation.
As small a size as possible. Clear boundaries
Members with adequate task and interpersonal skills. Good mix of members-varied skills. Clear and explicit specification of the extent and limits of team authority and accountability.
3. Specify challenging objectives, but skimp on organizational support. How to avoid it provide key supports
Reward system that recognizes and reinforces excellent team (not merely individual) performance. Educational system that provides teams, at their initiative, with training & technical cooperation needed to supplement members' knowledge and expertise. Information system that provides needed data and forecasts in a timely fashion Mundane material resources such as equipment, tools, money, staff, etc.
4. Assume that members already have all the competence they need to work as a team. How to avoid it: Provide key supports Create favorable performance conditions for the team. Build and maintain the team as a unit. Coach and help the team in real time, timing help efforts carefully.
6. Some guidelines a) Establish urgent, demanding performance standards and direction. b) Select members for skill and skill potential not personality. c) Pay particular attention to first meetings and actions (first impressions). d) Set some clear rules of behavior. e) Set and seize immediate performance oriented tasks and goals. f) Challenge the team regularly with fresh facts and information (team enriches and redefines its

10
understanding of the performance challenge). g) Spend lots of time together (time to learn to be a team). h) Exploit the power of positive feedback, recognition and reward.
i) Providing a vision: transformational leadership-leader motivates followers to do more than originally expected. It is achieved by (i) raising an awareness of the importance and value of desired outcomes and (ii) getting followers to transcend their own self interests.
Teams Problems 1. Sam is the chairperson of a department "morale boosting" team whose focus is promotion of an atmosphere conducive to teamwork, communication, and individual development. The eight members of the team are selected from the eight work groups in the 60 person department. Members are drafted to the team. Some want to be on it, others do not. Sam has no control over performance appraisals or raises. Sam needs to have motivated and creative members in order to have "fun" and get things done. Historically, there has not been much enthusiasm about joining the team because it is not seen as being fun and people do not want to find the time to do it. a) Using the team model and trip wires, how would you select and lead this team? 2. In a department which is responsible for development and support of all computer systems used for business processing in a large corporation, the departmental manager has selected five of the best employees for a special project. The project objective is to deliver a set of techniques and standards for use in all future systems development and support efforts. One of the team members serves as an informal team leader. The team reports to a panel of five supervisors in the department. The team members cannot seem to agree on anything. Each team member wants to promote a different approach to the solution. After three months, the team still has not agreed to a single technique or standard. Apply relevant team concepts to diagnose the problem and suggest a solution.

11
3. The setting is the engineering department of a small oil and gas company. Key players are the student case author Steve, his supervisor Ed, and his co-worker Pat. Pat comes to work late most days, sometimes as late as 10:00 a.m. Although Pat's work can rarely tolerate close scrutiny, Ed trusts him almost to the point of "rubber stamping" his reports. In meetings with managers from other parts of the company, Pat quietly leaves the table minutes before his work is discussed. When present during discussions of his work, his explanations are shallow and repetitious. Ed realizes there may be a problem but neglects to address it. Morale has fallen within the group, total productivity has decreased, and bickering among group members has increased. a) Why have morale and productivity fallen? Why has bickering increased among group members because of Pat's behavior? b) Most groups use powerful norms to influence members' behavior. Explain the inability of Steve's group to use norms to influence Pat's behavior. What can Steve and his group do to rectify the situation?
4. The technical writing group within the Manufacturing and Engineering Services Department of a mid-sized engineering firm. The group is responsible for producing and maintaining the company's written documents (e.g., maintenance manuals, procedures, technical notes). The technical writing group is composed of four men in their mid to late twenties. All members have salary-nonexempt status and have been employed by the firm for two to five years. None of the team members possess the leadership skills necessary for team leadership of the group. The team reports to a supervisor who is not a member of the team. The group members want to be treated professionally but do not act accordingly. They abuse sick leave and have low productivity. When told they would be learning a new software package, they complained that they were not getting a raise. They felt that if their skills increase the company should pay them more. Meetings have been held with the team to improve their attitude and morale but to no avail. Apply relevant team concepts to diagnose the problem and suggest a solution.

12
Some Generic Types of Decision Strategies
Many decisions are made in a contingent manner--the process used depends upon the characteristics of the decision making situation and task. Among the relevant situational characteristics is the type of decision--choice vs. evaluation. Choices are defined as the choice of one or a small subset of alternatives from a well-defined set of alternatives. Evaluations focus on one alternative at a time as the decision maker assesses the worth of that alternative. Linear compensatory: can be described by a linear (no higher order power terms such as squared or cubed) equation. Being high on one cue compensates for being low on another. Our lens model applications will be linear compensatory models. Conjunctive: minimum levels set for a group of cues. All alternatives which are above the minimums set for all cues will be selected. Also called the multiple hurdle model. Corresponds to a logical "and" Disjunctive: minimum levels set for a group of cues. All alternatives which are above one or more of the minimums set the cues will be selected. Corresponds to a logical "or" Lexicographic: rank order the cues in terms of importance. Taking the most important cue, select the alternative which is highest on that cue. If two or more alternatives are tied for highest value for that cue, discard the rest of the alternatives and consider the second most important cue. Select the alternative which is highest on that cue. If two or more are tied, keep them and consider the third most important cue. Continue until only one alternative remains. Select it. Related word: a lexicograph is a dictionary.
Problems 1. Bob is considering four cars. Assume that his criteria are color (blue preferred), gas mileage (at 25 mpg), and transmission (automatic). Which would he select is using a conjunctive decision strategy? A disjunctive decision strategy? A lexicographic strategy with order of consideration: transmission, gas mileage, and color? A linear compensatory (30 if red, 15 if silver, 0 if blue or black; 3 times mpg, and 50 for automatic, zero for stick)? Car MPG Color Transmission A 30 mpg blue automatic B 20 mpg silver stick C 25 mpg red automatic D 23 mpg black stick 2. Go to the mutual fund screener (http://cgi.money.cnn.com/tools/fundscreener/fundscreener.jsp.) found at the Money Magazine website.
a) Which of the four generic decision strategies does it use? b) How would it be set up (that is, what would it ask you for and how would it make
decisions?) if it applied the each of the other three decision strategies?

13
Lens Model: Overview Background In the seventeenth century, the French nobleman and social critic La Rouchefoucauld said, "Everybody complains about the badness of his memory, nobody about his judgment." Everybody knows what a decision is. For purposes of this class, we will define a decision as an action taken with the intention of producing favorable outcomes. As decision is said to be successful if the chosen action brings about outcomes that are at least as good or satisfying as any other action that could have been pursued. An unsuccessful decision results from one or more decision errors committed when the decision was being deliberated. For example, choosing I45 for the drive from the Woodlands and being delayed for an hour when Hardy Toll Road is clear would be a decision error. Decision errors may or may not be preventable. Most human learning takes place in uncertain, probabilistic circumstances. Individuals must learn to function, to adapt, in situations in which the information they have available is not a completely reliable indicator of reality. It is the individual's task to identify the most useful sources of information and how to combine them in order to maximize adaptation to the environment. For example, there is no set of wholly reliable rules which one can apply to determine who will be a good friend, to whom to loan money, whom to trust, etc. Further, since there is a multitude of potential cues which might be useful in making this decision the individual must sort through them, identifying the most useful ones and come to use several of them for making the most effective judgments. Robin Hogarth has suggested that uncertainty lies within us, not in the world around us. Because of inadequacies in a) our levels of knowledge and b) abilities to process information, we use terms such as "uncertain", "random", “probabilistic”, or "chance" to describe events or processes. Strictly speaking, it is inaccurate to do so because the environment "knows" what it will do. As such, we must learn to make effective decisions under conditions of limited knowledge and uncertainty. The lens model informs us about doing so. Russell Ackoff has observed that the "real people" and academician groups deal with uncertainty in different ways. "Real people" perceive only two probabilities--zero and one. Events are either not going to happen or they are going to happen. Academicians see the world in terms of every probability between zero and one but never in terms of zero and one. In their view, events are never completely certain because they can always think of ways that what may appear certain may not happen. For the purposes of this class, we will take the academicians' view. Although someone may profess to be certain that an event will occur, that does not mean that the probability is 1.00. The uncertainty we experience can be represented effectively using the lens model. The outcome represents an unknown event that the judge would like to predict. The judgment is an

14
estimate of the outcome by the decision maker. All the judge has available for predicting this event are the decision variables, called cues. Some cues may be more helpful than others, but none perfectly predict the outcome. For example, the outcome might be whether it rains today. The cues might be temperature, wind speed, dew point, and barometric pressure. Cues are depicted in the middle of the lens model diagram. The right side of the lens represents the forecaster's judgment whether rain will occur. The wide arc connecting judgment and outcome represents the achievement index, a relational measure of the forecaster's success or achievement over a series of judgments. In other words, it is the correlation between the forecaster's judgments and the actual conditions that occur (whether it rains or not).
The Lens Model Diagram
Outcome Whether it rains
Cues Temperature Wind Speed Barometric Pressure
Judgment Forecaster's Prediction
Achievement Index

15
The lens model is an extremely useful tool for analyzing decision situations that involve uncertainty. It uses inferential statistics (e.g., correlation, regression, mean and standard deviation) to give us four important aids to decision making: a) a vocabulary for thinking about and discussing decision making, b) measures for assessing accuracy of decisions (for which an outcome is known), c) identification of the source(s) of inaccuracies in decision making and ways to correct them, and d) assistance in resolving conflicts by identifying situations in which a difference in decision strategies produces conflict. There are three basic techniques for learning how people make decisions. First, we can ask them what strategy(ies) they used. Second, we can ask them to speak their thoughts while making a decision. This is called process tracing. Finally, we can use a “black box” approach. We provide information to them and have them make decisions using it. Then, we examine relationship between information available to them and their decision to identify which decision variables were used. If correlation and/or regression are used to devise a model of the decision process, the process is termed policy capturing and the lens model is being applied. Policy capturing is a “black box” process of describing and presenting a judge's decision strategy using correlational and regression models or influence weights and graphs based on those models. The course team project will apply policy capturing to study investment decision making processes. There are three basic ways to describe decision strategies which has been assessed using policy capturing a) regression equation b) correlation coefficients (used in the horse race task) c) graphs depicting form of relationship and weights measuring relative influence of each decision variable which are derived from the regression equations and correlations (used in the auto country of origin task). For the team project, the following step-by-step, policy-capturing approach will be used: Step 1 Identify outcome(s), judgment(s), and cues, all of which must be quantifiable. Step 2 Collect data for outcome(s) and cues. Step 3 Compute correlations among cues to assess degree to which multicollinearity is present. Any inter-cue correlations which have an absolute value greater than .5 will be likely to complicate the interpretation of cue validities and cue utilization coefficients. To simplify matters, one of the cues may need to dropped. Step 4 Collect judgments. Step 5 Perform statistical analyses to produce lens model indices.

16
Lens Model: Statistics Made Easy Sum of Absolute Differences Absolute values are obtained by dropping any negative signs from the numbers. To obtain the sum of absolute differences, one a) computes difference scores between two variables by subtracting one variable from the other, b) obtains the absolute values of each difference score by dropping any negative signs, and c) then sums the transformed numbers. In the context of the lens model, the sum of the absolute differences between judgments and outcomes is a very useful overall index of accuracy. ∑ |Outcomei - Judgmenti| Mean The mean is simply the average of a variable. It is an important measure of central tendency. To compute it, one sums the variable and divides by the number of values summed. It is typically denoted Y or X. In the context of the lens model, one compares the means of judgment and outcome to assess an important dimension of distributional accuracy--whether, on average, judgments are systematically higher or lower than the outcome. Standard Deviation Standard deviation is an important measure of "spread" or variability of a variable. Computation formulas are below. _ _ SX = ( ∑(Xi - X)2 ) 1/2 SY = ( ∑(Yi - Y)2 ) 1/2 (N-1) (N-1) In the context of the lens model, one compares the standard deviations of judgment and outcome to assess an important dimension of distributional accuracy--whether, on average, judgments are spread out more or less than the outcomes.

17
Correlation Correlation (shortened version of the term "Pearson product moment correlation coefficient") is an index which summarizes the direction and strength of linear relationship between two variables. Correlation indicates the degree to which variation (or change) in one variable is related consistently to variation in the other. A correlation can take on any value between -1.00 and +1.00. To interpret correlation, one examines its sign and absolute value. The sign indicates direction of relationship. A negative sign indicates an inverse relationship (as one variable goes up, the other tends to go down). A positive sign indicates a direct relationship (as one variable goes up, the other does also). The absolute value varies between 0.00 and +1.00 and indicates the strength of linear relationship. An absolute value of 0.00 indicates no linear relationship. An absolute value of +1.00 indicates a perfect linear relationship. If the relationship between the two variables is nonlinear, we may wrongly conclude that a relationship is weak or does not exist when a correlation is near zero because correlation measures only linear relationships. It is possible to transform variables and test for nonlinear relationships using correlation. This will not be done for the Horse Race task nor for the team project. A correlation is expressed as a decimal number but cannot be interpreted directly as a percentage. For example, an achievement index of .20 does not mean that the judge was correct 20% of the time. Within the context of the lens model, correlation is used to a) assess relational accuracy by correlating judgment and outcome, b) assess which cues have been used in the judgment process by correlating judgments with each of the cues, and c) determine which are the most useful cues and how they relate to the outcome by correlating the outcome with each of the cues. It is computed using the formula below. _ _ r = ∑ (Yi - Y)(Xi - X) (SX)(SY)(N-1) Autocorrelation A time series consists of the values of a variable (e.g., temperature, stock price) over time. If the observations in a given time series are highly correlated over time, it may be possible to forecast a future value of the time series using past observations. Autocorrelation is the correlation between members of a time series separated by a constant interval of time. It is a measure of how useful a time series is for forecasting future values. It can be computed for a lag of one time period, two time periods, etc. The formula is the similar to that for correlation. _ _ rk = ∑ (Xt – Xt)(Xt-k- Xt-k) where k = the lag. (St)(St-k)(N-1)

18
Standardization of Variables Standardizing a variable provides it with a mean of zero and standard deviation of one. To do so, compute the mean and standard deviation for the variable. Then subtract the mean from each observation and divide by the standard deviation. In a lens model context, summing the standardized cues is a potentially useful way to estimate an outcome which often performs better than human judges. Dummy Coding Dummy coding is a process for assigning numbers to categorical variables so that correlation and regression analyses can be performed. For purposes of this course we will consider dummy coding for a categorical variable with two values such as gender. We would code one group 0 and the other 1. For the variable gender, females would be coded 1 and males, 0. For categorical variables with more than two levels, we will combine levels until only two groups are left. Simple (Bivariate) Regression Simple regression is an analysis of the relationship between two variables, typically denoted X and Y. It can be illustrated by plotting the two variables on a scatterplot. The axes on the graph represent the two variables. Each data point on the graph represents an individual case (the coordinates of the point are the two scores, one for each variable). A straight line can be drawn on the scatterplot which is called a regression line. It is positioned to provide the "best fit" of the data points (meaning that it minimizes the sum of the squared vertical distances between the data points and the line). The theoretical equation for the line that is derived is called the regression equation. Its is represented in the equation below: Yi = B0 + B1 Xi + ei where ei is the error due to the points not all falling on the regression line, B0 is the Y axis intercept and B1 is the slope of the line. Because we don't know the exact equation for the line but are estimating it, we use the following notation to represent the line. The hats (^) indicate that Y, B0, and B1 terms in the equation are estimates. ^ ^ ^ Yi = B0 + B1 Xi This equation can be used to make predictions about the observations in the data set from which the weights were derived or to predict future events. One simply plugs in values of X and computes the Y estimate.

19
Multiple Regression Multiple regression is a general statistical technique for analyzing the relationship between a dependent variable (e.g., outcome or judgment) and a set of two or more predictor variables (e.g., cues). Through multiple regression techniques, a prediction equation can be determined that indicates the manner in which a number of predictor variables should be weighted to obtain the best possible prediction of the dependent variable. Furthermore, statistics can be calculated which indicate the degree of accuracy of the prediction equation and the amount of variation in the dependent variable which is accounted for by the predictor variables. The multiple correlation coefficient (R) is the correlation between the dependent variable and an equation containing the predictor variables. It indicates how well the regression equation that has been derived "fits." The symbol R indicates that the multiple correlation involves multiple predictor variables as opposed to the correlation (r) which involves a single predictor variable. Unlike r, R does not take on negative values and ranges from 0 to 1. Similar to r, R can be squared to obtain an index of strength of association or the proportion of variance accounted for by the joint influence of the predictor variables. In the context of the lens model, R from the regression of the outcome on the cues gives us the outcome predictability. R from the regression of judgments on cues gives us the judgmental predictability. The theoretical equation that is derived is called the multiple regression equation. It is represented below: Yi = B0 + B1 X1i + B2 X2i + . . . + BN XNi + ei where ei is the error due to the points not all falling on the regression plane, B0 is the Y axis intercept and B1 is the slope of the line. Because we don't know the exact equation but are estimating it, we use the following notation. The hats (^) indicate that Y, B0, B1, B2, and BN terms are estimates. This equation can be used to make predictions about the observations in the ^ ^ ^ ^ ^ Yi = B0 + B1 X1i + B2 X2i + . . . + BN XNi data set from which the weights were derived or to predict future events. One simply plugs in values of the Xs and computes the Y estimate. Our use of multiple regression will include assessment of only linear relationships between the dependent variable and the predictors. It is possible to use multiple regression to assess nonlinear relationship such as curvilinear relationships and interactions. To do so, one standardizes each variable. To assess curvilinear relationships, one then raises the standardized variable to the appropriate power (squared, cubed, etc.) and includes it in the multiple regression. To assess interactions, one multiples the standardized Xs together to form an interaction term and includes it in the multiple regression. Unfortunately, assessing nonlinear relationships requires a large amount of data and, in a real life setting, is often complicated by the presence of multicollinearity (which clouds the interpretation of results).

20
Statistical Significance Statistical significance is an imperfect decision rule for determining when to conclude that (1) a relationship exists two or more variables or (2) differences exist between two or more groups. First, one derives a "test statistic" which assesses the relationship and an associated probability value (termed a "p value"). The p value indicates how rare the test statistic is, in other words, how likely that a test statistic of that size or larger would be to occur by chance if (1) no relationship exists between the variables or (2) no differences exist between the groups. If sufficiently rare (the standard is if p is less than .05), then we conclude that the test statistic did not occurred by chance and that instead it is due to (1) a relationship between the variables or (2) differences among the groups. The sensitivity of the testing process is directly related to the sample size (number of observations) and (1) the strength of relationship between the variables or (2) the amount of difference between the groups. This highly useful process has two important flaws that can occur. The first is termed a Type I error or an alpha error. When it occurs, we have obtained a rare value of the test statistic by chance and wrongly concluded that (1) a relationship exists between two or more variables or (2) differences exist between two or more groups. The second is termed a Type II error or a beta error. When it occurs, we have obtained a small test statistic by chance, observed a p value is that is greater than .05, and wrongly concluded that (1) no relationship exists between the variables or (2) no differences exist between the groups. Expected Value A commonly used rule for making decisions under uncertain conditions is to maximize expected value by selecting the decision alternative with the highest expected value. One computes the expected value of a decision alternative by multiplying the probability of each potential outcome associated with that alternative by the corresponding payoff value of the outcome.

21
Lens Model: A Step by Step Method for Interpreting Policy Capturing Results from a Lens Model Analysis Step 1 Look at sum of absolute differences. Divide by number of judgments made to determine average error on each judgment. Use your "common sense" to evaluate accuracy at this level. Step 2 a) Compare judgment mean and standard deviation to the outcome mean and standard deviation (distributional accuracy) and b) examine the achievement index (relational accuracy). Means and Standard Deviations. If judgment mean is lower (higher) than outcome mean, judgments need to be increased (decreased), on average. If judgment standard deviation is higher (lower) than the outcome standard deviation, the spread of judgments about the mean needs to decreased (increased). Achievement Index. The achievement index tells us about the relationship of judgments to outcomes in a relative order sense. To interpret it, examine sign and absolute value. The sign indicates the direction of relationship (+ sign means direct relationship, - sign indicates inverse relationship). The absolute value indicates the strength of relationship. An absolute value which is close to zero indicates a weak relationship. An absolute value which is close to one indicates a very strong relationship. It is possible to have a negative achievement index (indicating that cues were used in a "backward" fashion). To assess accuracy relative to the potential usefulness of the cues, compare the achievement index to the linear outcome predictability (which is an estimate of the upper limit for the achievement index). If the achievement index is far below the linear outcome predictability, the cues are not being used effectively. If the achievement index is far above (+.10 or more) the linear outcome predictability, one or more of the following is true:
a) the judge is using the cues in a nonlinear fashion which matches the nonlinear relationship of the cues to the outcome,
b) the judge is using cues that are not included in the analysis, c) the judge is being very lucky, or d) the judge is reviewing the outcome before making a judgment (cheating). Step 3 If achievement index is low, examine judgmental predictability, outcome
predictability and knowledge linear and nonlinear indices to ascertain cause(s). Linear Judgmental Predictability. If the judgmental predictability is low, the judge
was probably inconsistent in the application of their decision strategy during the task. Because this index does not assess nonlinear usage of cues, a judge who relies heavily upon nonlinear usage of cues may appear inconsistent.

22
Linear Outcome Predictability. If the outcome predictability is low, the cues may not be useful for predicting this outcome. To improve performance, the decision maker must find new, more useful cues or explore nonlinear relationships between cues and outcome. The outcome predictability estimates an upper limit for the achievement index. Because this index does not assess nonlinear relationships between cues and outcomes, a set of cues which has one or more strong nonlinear relationships with the outcome may appear worthless. Knowledge (Linear Component) Index. The knowledge (linear component) index assesses the linear match between cue usage and how the cues relate to the outcome. The closer that this index is to 1.00, the better linear use of the cues the judge is making. An index of 0 means that the judge's cue usage is unrelated to how the cues relate to the outcome. It is possible to use cues in a "backward" fashion and have a negative knowledge index, even one as low as -1.00 which would mean the cues were used in a completely inverse linear fashion to what they should have been used. If this index is low, compare cue utilization coefficients to the cue validity coefficients to ascertain where the problem(s) is. To maximize accuracy, change decision strategy so that cue utilization coefficients match the cue validity coefficients. Knowledge (Nonlinear Component) Index. The knowledge (nonlinear component) index assesses the match between nonlinear cue usage and how the cues relate to the outcome. The closer that this index is to 1.00, the better nonlinear use of the cues the judge is making. An index of 0 means that there judge's nonlinear cue usage is unrelated to how the cues relate to the outcome.

23
Lens Model: Four Measures of Judgment Accuracy An Overall Measure of Accuracy 1. For an overall assessment of accuracy, examine the sum of the absolute differences (the closer this index is to 0, the more accurate you were). Divide the sum of absolute differences by the number of judgments to determine the average error that you made. Use your "common sense" to judge your accuracy from this average error. Its Three "Independent" Component Measures 2. Examine achievement index to assess relational accuracy (the closer it is to 1.00, the more accurate you were.) 3. By comparing judgment mean to outcome mean, assess the mean component of distributional accuracy (the closer the two values are, the more accurate you were). 4. By comparing judgment standard deviation to the outcome standard deviation, assess the standard deviation component of distributional accuracy (the closer the two values are, the more accurate you were). Lens Model: The Five Steps to Making Accurate Judgments Matching Your Frequency Distribution to that of the Outcome: Two Steps 1. Match your judgment mean to the outcome mean. 2. Match your judgment standard deviation to the outcome standard deviation. Obtaining a High Achievement Index: Three Steps 3. Use cues that relate to the outcome (examine linear outcome predictability to assess useful of the cues as a group and examine cue validity coefficients to assess usefulness of individual cues. If the cues as a group appear useless, a) test for nonlinear relationships between cues and outcome or b) ignore them and find other, more useful cues. 4. Use the cues in the manner in which they relate to the outcome (examine knowledge linear and nonlinear coefficient for assessment of match; compare individual cue utilization coefficients with the corresponding cue validity coefficients to assess how well individual cues were used in a linear fashion). 5. Be consistent in the use of your decision strategy (examine linear judgmental predictability coefficient). If your judgmental predictability is low and you used the cues in primarily a linear fashion, consciously try to be more uniform in your application of your decision strategy.
24
Lens Model: The Lens Model Equation The Lens Model Equation provides a useful mathematical summary of the requirements for a high achievement index. Achievement Index = Linear Match Component + Nonlinear Match Component Linear Match Component = Knowledge x Linear x Linear Linear Outcome Judgmental Predictability Predictability Nonlinear Match Component = Achievement Index - Linear Match Component Lens Model: Ascertaining the Relationship Between Cues and Outcome There are a number of ways to learn about the relationship between cues and outcome including the following: a) Collect data on cues and outcome. Then perform a statistical analysis using correlation and multiple regression to compute cue validities and outcome predictability. b) Ask experts with extensive experience which cues they use in predicting an outcome and how they use the cues. c) Do research in the library to learn about relevant cues and how they should be used. d) Develop your own expertise by making judgments, observing outcomes, comparing judgments and cues to outcomes, and developing a decision strategy. If these are not available, estimate using the additive model below: a) Standardize the cues (see description in Review of Statistics section). b) Assign signs (plus or minus) based upon whether a direct relationship (use a + sign) or an inverse relationship (use a - sign) is expected. c) Sum the cues after standardizing them and assigning appropriate sign. d) If one alternative is to be selected, rank order the sums and pick the alternative with the highest sum.

25
Lens Model: Glossary Achievement Index: correlation between judgment and outcome. Range is from -1.00 to 1.00. The closer to 1.00, the more accurate. Computation: correlate judgment and outcome. Achievement Index (Linear Match Component): portion of achievement index due to linear cue usage. Range is from -1.00 to 1.00. Computation: multiply linear knowledge, linear outcome predictability, and linear judgmental predictability Achievement Index (Nonlinear Match Component): portion of achievement index due to nonlinear cue usage which matches nonlinear cue-outcome relationships. Range is from -1.00 to 1.00. Computation: Nonlinear Knowledge x (1 – Lin Outcome Pred2) x (1 – Lin Judgmental Pred2) Consistency: the uniformity with which a judge applies the decision strategy. One form is the linear judgmental predictability (see definition below). Range is from 0.00 to 10.00. Computation: obtain judgments of repeat scenarios, correlate judgements of repeated scenarios with judgments of repeat scenarios, and multiply the resulting correlation by 10. Cue Utilization Coefficients: correlations between judgment and cues. Assesses linear relationship between cue and judgment. Indices of cue usage. As absolute value increases so did reliance on the cue. Range is from -1.00 to 1.00. These should match the corresponding cue validity coefficients. Computation: correlate judgment with each cue. Cue Validity Coefficients: correlations between outcome and cues. It assesses linear relationship between cue and outcome. As absolute value increases, so does the potential usefulness of the corresponding cue. The sign indicates how the cue should be used--a negative sign means that is should be used in an inverse fashion (as cue goes up, judgment should diminish), a positive sign means that it should be used in a directly (as cue goes up, judgment should increase). Range is from -1.00 to 1.00. The higher the absolute value is the more useful a cue is and the more it should be relied upon. Computation: correlate outcome with each cue. Judgment Mean: simple average of judgments. The closer to the outcome mean, the more accurate you are.

26
Judgment Standard Deviation: a measure of the degree of spread of judgments. The closer to the outcome standard deviation, the more accurate you are. Linear Judgmental Predictability: a measure of consistency. It is the multiple correlation between judgment and cues. It is based upon the linear relationships between cues and judgment. Range is from 0 to 1.00. The closer this index is to 1.00, the more consistent you were when making your judgments. Computation: regress judgment on all cues to obtain multiple correlation. (Note that this is R, not R2.) Knowledge (linear): correlation between predicted outcome and predicted judgments. Range is from -1.00 to 1.00. The closer this index is to 1.00, the more effective linear use you made of the cues. Computation: correlate predicted outcome with predicted judgment. Knowledge (nonlinear): correlation between outcome error and judgment error. Range is from -1.00 to 1.00. The closer this index is to 1.00, the more effective nonlinear use you made of the cues. Computation: correlate outcome error (outcome-predicted outcome) values with judgment error (judgment-predicted judgment) values. Outcome Mean: simple average of outcome. Linear Outcome Predictability: multiple correlation between outcome and cues. It is based upon the linear relationships between outcome and cues. Range is from 0 to 1.00. The higher this index is, the more useful the cues are (as a group) for predicting this outcome. Computation: regress outcome on all cues to obtain multiple correlation. (Note that this is R, not R2.) Outcome Standard Deviation: a measure of the degree of spread of the outcome. Sum of Absolute Differences between Outcome and Judgments: an overall index of accuracy. Range is from 0 to infinity. The closer to zero, the more accurate. Computation: sum the absolute differences between corresponding values of judgments and the outcome.

27
Lens Model: Performance of Professional Handicapper Order of Finish Analysis for Sweep Number of orders correctly predicted= 10 Number of Winners correctly predicted= 3 Payoff= $73680 Net winnings (Payoff-$80,000)= $-6320 Net winnings (No cut for state)= $19600 Sum of absolute differences between outcome and judgment= 84.00 Outcome Mean= 3.50 Judgment Mean= 3.50 Outcome Std Deviation= 1.73 Judgment Std Dev= 1.73
Achievement Index = 0.21 Achievement Index (linear match) = 0.05 Achievement Index (nonlinear match) = 0.16 Linear Outcome Predictability= 0.33 Linear Judgmental Predictability= 0.40 Knowledge Linear match= 0.39 Nonlinear match= 0.18 Cue Cue Validity Utilization -0.04 Jockey Winning % -0.08 -0.27 Speed Rating -0.09 Actual Actual Outcome Judgment -0.01 Post Position 0.25 -0.18 Handicappers Choice -0.39

28
Odds Analysis for Sweep Number of odds correctly predicted= 0 Sum of absolute differences between outcome and judgment= 262.86 Outcome Mean= 7.62 Judgment Mean= 7.06 Outcome Std Deviation= 7.47 Judgment Std Dev= 4.60
Achievement Index = 0.27 Achievement Index (linear match) = 0.13
Achievement Index (nonlinear match) = 0.14 Linear Outcome Predictability= 0.58 Linear Judgmental Predictability= 0.34 Knowledge Linear match= 0.67 Nonlinear match= 0.18 Cue Cue Validity Utilization -0.40 Jockey Winning % -0.14 -0.38 Speed Rating -0.10 Actual Actual Outcome Judgment 0.10 Post Position 0.24 -0.45 Handicappers Choice -0.33

29
Lens Model: Problems 1 Graph the outcome order (A, B, C, D, E, F, G, H) versus each of the following orders for Arlie. Then on each graph, draw a vertical line at the Arlie (X axis) mean and a horizontal line at the outcome (Y axis) mean. Count the observations in each quadrant and note their position relative to intersection of the horizontal and vertical lines that you have drawn. Then by looking at the number of observations and their position in each quadrant and the general shape of the scatterplot, match them to the appropriate correlation in the left hand column. After completing all of the graphs and matches, compute the correlation between Arlie's order and the outcome (the correlation formula can be found in the "Lens Model: Review of Statistics" section in this packet).
Correlation Arlie's Order ____ -1.00 a) A, B, E, F, C, D, H, G ____ -0.79 b) F, G, A, H, E, D, C, B ____ -0.50 c) F, B, A, H, G, E, D, C ____ -0.26 d) A, B, C, D, E, F, G, H ____ 0.00 e) H, G, F, E, D, C, B, A ____ 0.26 f) F, C, B, E, A, G, H, D ____ 0.50 g) H, F, C, G, D, E, B, A ____ 0.79 h) E, F, H, B, C, A, G, D ____ 1.00 i) B, C, G, A, F, D, H, E

30
Example: a) Arlie's Order A, B, E, F, C, D, H, G Outcome Order A, B, C, D, E, F, G, H
8 H 7 G 6 F 5 E
Outcome 4 D
3 C 2 B 1 A
1 2 3 4 5 6 7 8
Arlie

31
2 Arlie is an engineer who bids engineering projects in a very competitive market. If he bids the right amount (equal to the outcome), his firm gets the job and makes a small profit. If he bids too much, another company gets the job. If he bids too little, his firm gets the job but loses money. Assume that both Arlie's judgments and the outcomes are equally spaced. What are the implications of the following scenarios for Arlie's company? A B C D E F G 1 10 20 30 40 50 60 70 80 90 100 Outcome distribution ($ millions) Case I Achievement index = 1.0 MeanArlie < MeanOutcome Std DevArlie = Std DevOutcome Case II Achievement index = 1.0 MeanArlie > MeanOutcome Std DevArlie = Std DevOutcome Case III Achievement index = 1.0 MeanArlie = MeanOutcome Std DevArlie < Std DevOutcome Case IV Achievement index = 1.0 MeanArlie = MeanOutcome Std DevArlie > Std DevOutcome Case V Achievement index = 0.0 MeanArlie = MeanOutcome Std DevArlie = Std DevOutcome Case VI Achievement index = -1.0 MeanArlie = MeanOutcome Std DevArlie = Std DevOutcome Case VII Achievement index = 1.0 MeanArlie = MeanOutcome Std DevArlie = Std DevOutcome Case VIII Achievement index = -1.0 MeanArlie > MeanOutcome Std DevArlie < Std DevOutcome Case IX Achievement index = 0.0 MeanArlie < MeanOutcome Std DevArlie > Std DevOutcome

32
3 Arlie has changed jobs and become an interviewer for a major Houston company. In his new job he rates applicants using a 1 to 100 scale. He is one of ten interviewers. Each applicant is interviewed and rated by only one interviewer. Any applicant who receives a rating of 75 or more is hired. Assume that both Arlie's judgments and the outcomes are equally spaced. What are the implications of each scenarios for Arlie's company? A B C D E F G 1 10 20 30 40 50 60 70 80 90 100 Outcome distribution Case I Achievement index = 1.0 MeanArlie < MeanOutcome Std DevArlie = Std DevOutcome Case II Achievement index = 1.0 MeanArlie > MeanOutcome Std DevArlie = Std DevOutcome Case III Achievement index = 1.0 MeanArlie = MeanOutcome Std DevArlie < Std DevOutcome Case IV Achievement index = 1.0 MeanArlie = MeanOutcome Std DevArlie > Std DevOutcome Case V Achievement index = 0.0 MeanArlie = MeanOutcome Std DevArlie = Std DevOutcome Case VI Achievement index = -1.0 MeanArlie = MeanOutcome Std DevArlie = Std DevOutcome Case VII Achievement index = 1.0 MeanArlie = MeanOutcome Std DevArlie = Std DevOutcome Case VIII Achievement index = 1.0 MeanArlie > MeanOutcome Std DevArlie < Std DevOutcome Case IX Achievement index = 0.0 MeanArlie < MeanOutcome Std DevArlie = Std DevOutcome
33
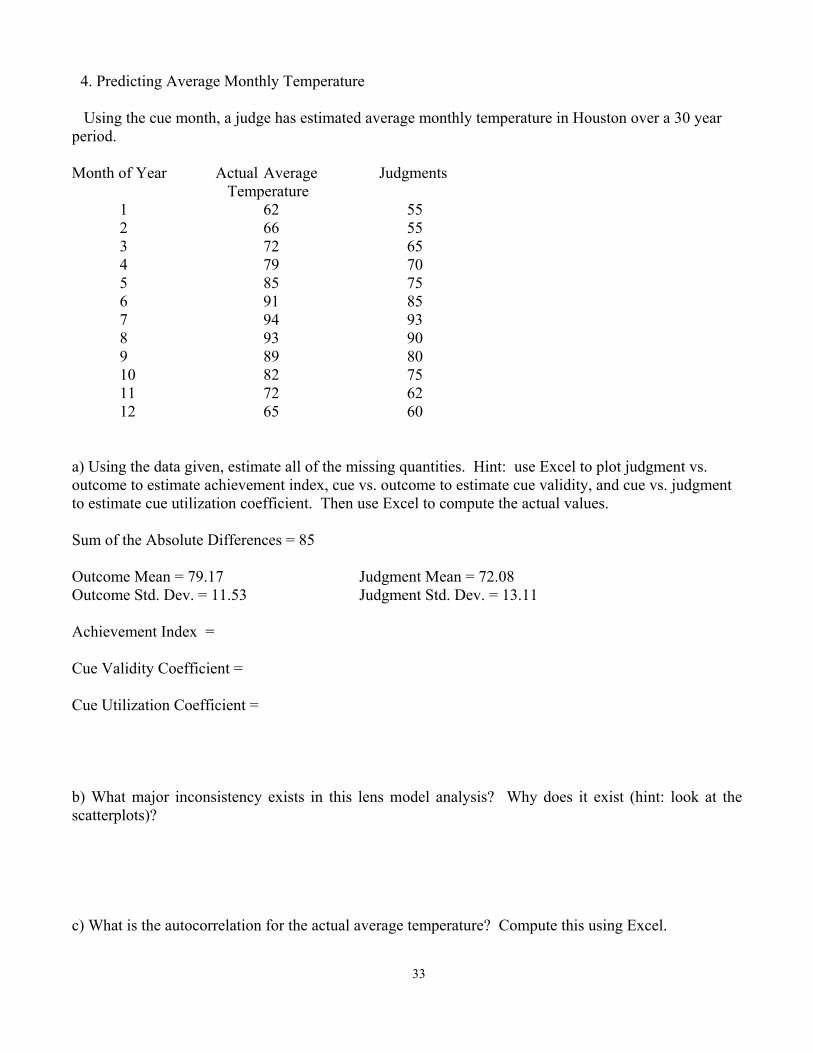
4. Predicting Average Monthly Temperature Using the cue month, a judge has estimated average monthly temperature in Houston over a 30 year period. Month of Year Actual Average Judgments Temperature 1 62 55 2 66 55 3 72 65 4 79 70 5 85 75 6 91 85 7 94 93 8 93 90 9 89 80 10 82 75 11 72 62 12 65 60 a) Using the data given, estimate all of the missing quantities. Hint: use Excel to plot judgment vs. outcome to estimate achievement index, cue vs. outcome to estimate cue validity, and cue vs. judgment to estimate cue utilization coefficient. Then use Excel to compute the actual values. Sum of the Absolute Differences = 85 Outcome Mean = 79.17 Judgment Mean = 72.08 Outcome Std. Dev. = 11.53 Judgment Std. Dev. = 13.11 Achievement Index = Cue Validity Coefficient = Cue Utilization Coefficient = b) What major inconsistency exists in this lens model analysis? Why does it exist (hint: look at the scatterplots)? c) What is the autocorrelation for the actual average temperature? Compute this using Excel.

34
5. For the situation below, a) Assess accuracy using achievement index, mean and std. deviation, b) Interpret linear outcome predictability, linear and nonlinear knowledge, linear judgmental predictability, and linear & nonlinear achievement indices. c) What advice would you give the judge to help him/her improve? Outcome Mean= 3.50 Judgment Mean= 33.48 Outcome Std Deviation= 5.73 Judgment Std Dev= 5.75 Achievement Index = -0.04 Linear Achievement Index = -.04 Nonlinear Achievement Index = .000 Linear Outcome Predictability= 0.83 Linear Judgmental Predictability= 0.06 Knowledge Linear Knowledge = -0.01 Nonlinear knowledge = 0.00 Cue Cue Validity Utilization 0.15 W -0.02 -0.48 X 0.00 Actual Actual Outcome Judgment +0.11 Y 0.05 0.70 Z -0.04 6. How many errors can you find in the following lens analysis? Sum of Absolute Differences= -157.6 Outcome Mean = 3.50 Judgment Mean = 33.48 Outcome Std Dev = -5.73 Judgment Std Dev = 5.75 Achievement Index = .74 Linear Outcome Predictability = 0.03 Linear Judgmental Predictability = 0.97 Knowledge Linear Knowledge = -1.01 Nonlinear Knowledge = 1.10 Cue Validity Cue Utilization 0.15 W -0.02 -0.48 X 0.00 Actual Actual Outcome Judgment 0.11 Y 10.05 0.70 Z -0.04

35
7. Classify statements a through e as true or false and justify your answer. a) In order to be a good decision maker, all I need to do is to be consistent. A linear judgmental predictability index of 1.00 means that I am an excellent decision maker. b) An achievement index of .50 for the horse race order of finish task means that I correctly predicted the finishing position for 50% of the horses. c) Sam radically changed his decision strategy midway through the horse race task. This will lower his linear judgmental predictability index. d) For a judgment that I am making, there are no good cues available (linear outcome predictability = 0). However, if I am careful, I can still make accurate judgments. e) Stephanie states, "I am an excellent decision maker. The setting does not matter. Whether I have extensive experience with the decision or am in a brand new situation, I have a knack for making the correct decision." 8. During the NFL players strike of the late 1980s, replacement players were hired and played games which counted in the standings. During the strike, Las Vegas casinos limited wagers on games involving replacement players to $20,000. When the strike was over, the betting limit returned to its normal much higher amount. Explain the reduced betting limit using the lens model.

36
9. Jurors are being selected for a drug trial involving possession of under 50 grams (about 2 ounces) of cocaine. If found guilty, the defendant can be sentenced to from 2 years to 20 years of prison. a) Jurors are asked if they could assign prison terms within the full range allowed by the law. Those who said that they could not assign terms within the full range are not chosen for the jury. b) Jurors were also asked if they had ever been arrested and/or had negative experiences with any police officer and whether they or relatives had served time in jail. Those who answered yes to any of these questions were not selected for the jury. Why are defense and prosecuting attorneys asking these questions? What are they hoping to find out about the decision processes of potential jurors? 10. Each month, the Wall Street Journal begins a new stock picking contest pitting investment professionals against darts. A team of four experienced investment professionals picks its favorite four stocks (one pick per person) to form a portfolio that will compete with a portfolio selected by throwing four darts at a stock listing. Six months later, the performances of the two stock picking methods are compared to see which has achieved the highest rate of return. Eighty three contests have occurred since the current rules were adopted in July, 1990. The pros have won 48 of the contests and the darts have won 35 of contests. In addition, their performance is compared to the Dow Jones industrial index. The score is a close 42 to 41 when the pros are pitted against the Dow industrial. The pros have an average six month gain of 10.5% over the 83 contests. That is about twice the 5.3% average six month gain for the forces of chance and better than the average 6.6% rise for the Dow industrials. Using the lens model, explain why the experienced professionals have not beaten the Dow industrial index and the darts more consistently.

37
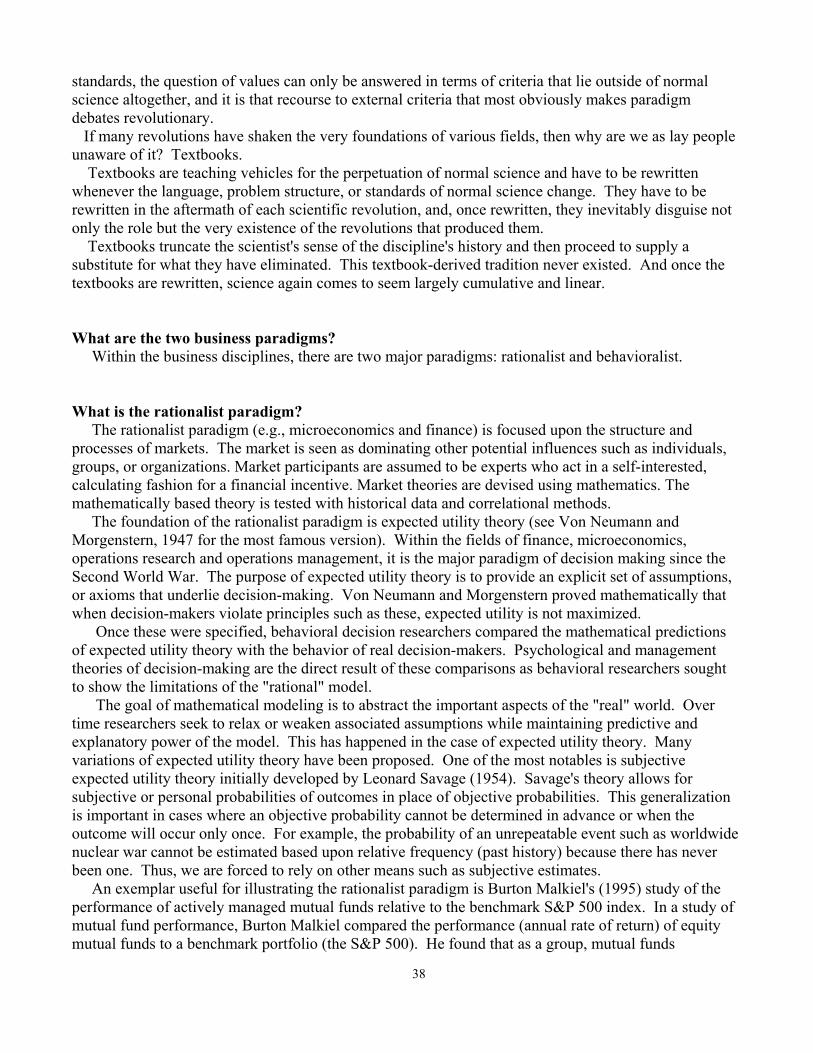
Rationalist vs. Behavioralist Paradigms Learning objectives: Be able to summarize the roles paradigms, normal science, and scientific revolutions in scientific progress. Be able to compare and contrast rational and behavioralist paradigms and to classify a research study or text/observation on the continuum between the two paradigms. What is a paradigm? Thomas Kuhn's concept of paradigm is useful background for the debate between rationalists and behavioralists over decision making. His book The Structure of Scientific Revolutions is the premier philosophy of science work written during the 20th century. In it, he argues that science is not an inexorable truth machine that grinds out knowledge an inch at a time. Instead science progresses via leaps (termed scientific revolutions) separated by periods of calm (termed normal science). An important basic concept in Kuhn's work is his concept of paradigm-a term he originated but which has expanded to have many more meanings today. A scientific community consists of practitioners of a scientific specialty (e.g., physicists, chemists, psychologists, economists). According to Kuhn, a paradigm is what members of a scientific community share, and, conversely, a scientific community consists of people who share a paradigm. It includes a set of assumptions (many of which are unarticulated) and definitions. Paradigms gain status when they are more successful than their competitors in solving a few problems that the group of practitioners has come to recognize as acute. One of the things a scientific community acquires with a paradigm is a criterion for choosing problems that, while the paradigm is taken for granted, can be assumed to have solutions. To a great extent these are the only problems that the community will as admit as scientific or encourage its members to undertake. Other problems, including many that had previously been standard, are rejected as metaphysical, as the concern of another discipline, or sometimes as just too problematic to be worth the time. Few people who are not practitioners of a mature science realize how much mop-up work remains after a paradigm shift occurs. Mopping-up operations are what engage most scientists throughout their careers. They constitute what Kuhn calls normal science. Normal science is defined as research firmly based upon one or more past scientific achievements, achievements that some scientific community acknowledges as supplying the foundation for its further practice. Normal science seems to progress very rapidly because its practitioners concentrate on problems that only their own lack of ingenuity should keep them from solving. When engaged in normal science, the research worker is a solver of puzzles, not a tester of paradigms. However, through the course of puzzle solving, anomalies sometimes develop which cannot be explained within the current paradigm. Paradigm-testing occurs when persistent failure to solve a noteworthy puzzle gives rise to a crisis and when the crisis has produced an alternate candidate for a paradigm. Paradigm testing never consists, as puzzle solving does, simply in the comparison of a single paradigm with nature. Instead, testing occurs as part of the competition between two rival paradigms for the allegiance of the scientific community. The choice between two competing paradigms regularly raises questions that cannot be resolved by the criteria of normal science. To the extent, as significant as it is incomplete, that two scientific schools disagree about what is a problem and what a solution, they will inevitably talk through one another when debating the relative merits of their respective paradigms. In the partially circular arguments that regularly result, each paradigm will be shown to satisfy more or less the criteria it dictates for itself and to fall short of a few of those dictated by its opponent. Since no paradigm ever solves all the problems it defines and since no two paradigms leave all the same problems unsolved, paradigm debates always involve the question: Which problem is it more significant to have solved? Like the issue of competing
38
standards, the question of values can only be answered in terms of criteria that lie outside of normal science altogether, and it is that recourse to external criteria that most obviously makes paradigm debates revolutionary. If many revolutions have shaken the very foundations of various fields, then why are we as lay people unaware of it? Textbooks. Textbooks are teaching vehicles for the perpetuation of normal science and have to be rewritten whenever the language, problem structure, or standards of normal science change. They have to be rewritten in the aftermath of each scientific revolution, and, once rewritten, they inevitably disguise not only the role but the very existence of the revolutions that produced them. Textbooks truncate the scientist's sense of the discipline's history and then proceed to supply a substitute for what they have eliminated. This textbook-derived tradition never existed. And once the textbooks are rewritten, science again comes to seem largely cumulative and linear. What are the two business paradigms? Within the business disciplines, there are two major paradigms: rationalist and behavioralist. What is the rationalist paradigm? The rationalist paradigm (e.g., microeconomics and finance) is focused upon the structure and processes of markets. The market is seen as dominating other potential influences such as individuals, groups, or organizations. Market participants are assumed to be experts who act in a self-interested, calculating fashion for a financial incentive. Market theories are devised using mathematics. The mathematically based theory is tested with historical data and correlational methods. The foundation of the rationalist paradigm is expected utility theory (see Von Neumann and Morgenstern, 1947 for the most famous version). Within the fields of finance, microeconomics, operations research and operations management, it is the major paradigm of decision making since the Second World War. The purpose of expected utility theory is to provide an explicit set of assumptions, or axioms that underlie decision-making. Von Neumann and Morgenstern proved mathematically that when decision-makers violate principles such as these, expected utility is not maximized.
Once these were specified, behavioral decision researchers compared the mathematical predictions of expected utility theory with the behavior of real decision-makers. Psychological and management theories of decision-making are the direct result of these comparisons as behavioral researchers sought to show the limitations of the "rational" model.
The goal of mathematical modeling is to abstract the important aspects of the "real" world. Over time researchers seek to relax or weaken associated assumptions while maintaining predictive and explanatory power of the model. This has happened in the case of expected utility theory. Many variations of expected utility theory have been proposed. One of the most notables is subjective expected utility theory initially developed by Leonard Savage (1954). Savage's theory allows for subjective or personal probabilities of outcomes in place of objective probabilities. This generalization is important in cases where an objective probability cannot be determined in advance or when the outcome will occur only once. For example, the probability of an unrepeatable event such as worldwide nuclear war cannot be estimated based upon relative frequency (past history) because there has never been one. Thus, we are forced to rely on other means such as subjective estimates. An exemplar useful for illustrating the rationalist paradigm is Burton Malkiel's (1995) study of the performance of actively managed mutual funds relative to the benchmark S&P 500 index. In a study of mutual fund performance, Burton Malkiel compared the performance (annual rate of return) of equity mutual funds to a benchmark portfolio (the S&P 500). He found that as a group, mutual funds

39
underperformed the S&P 500 Index for the years 1982-1991 both before and after expenses. If only survivor funds are included (poorly performing funds often disappear because they are merged with better performing funds of the same type), capital appreciation funds and growth funds outperformed the S &P 500 as a group for this time period. Malkiel concludes that the survivorship bias is important and should be controlled for in future studies. What are the six major arguments for investor rationality? 1. Nonrational investors either quickly learn to become rational or lose all of their money and are forced to leave the market. 2. The investor may not be rational but the fund manager/broker who is making decisions for them is rational. 3. Arguing that each of the axioms (e.g. transitivity) taken separately is a reasonable condition to put on decision making. (If a person prefers $20 to $10 and $10 to $5, then they will certainly prefer $20 to $5.) If each axiom is reasonable, then the conclusion that investors are rational (based upon the axioms) is also reasonable. 4. When empirical evidence supports a market model that assumes rational investors, this is evidence for investor rationality. This is the fallacy of affirming the consequent, a logical fallacy. 5. If an anomaly does exist, investors will exploit it until it disappears. 6) "Tell me a different story." This request from rationalists is for a complete explanation of how an approach other than decision-maker rationality can explain market efficiency. That is, before I will accept criticism of the rational decision maker model, you must provide a complete alternative explanation which doe not include rational decision makers.
40
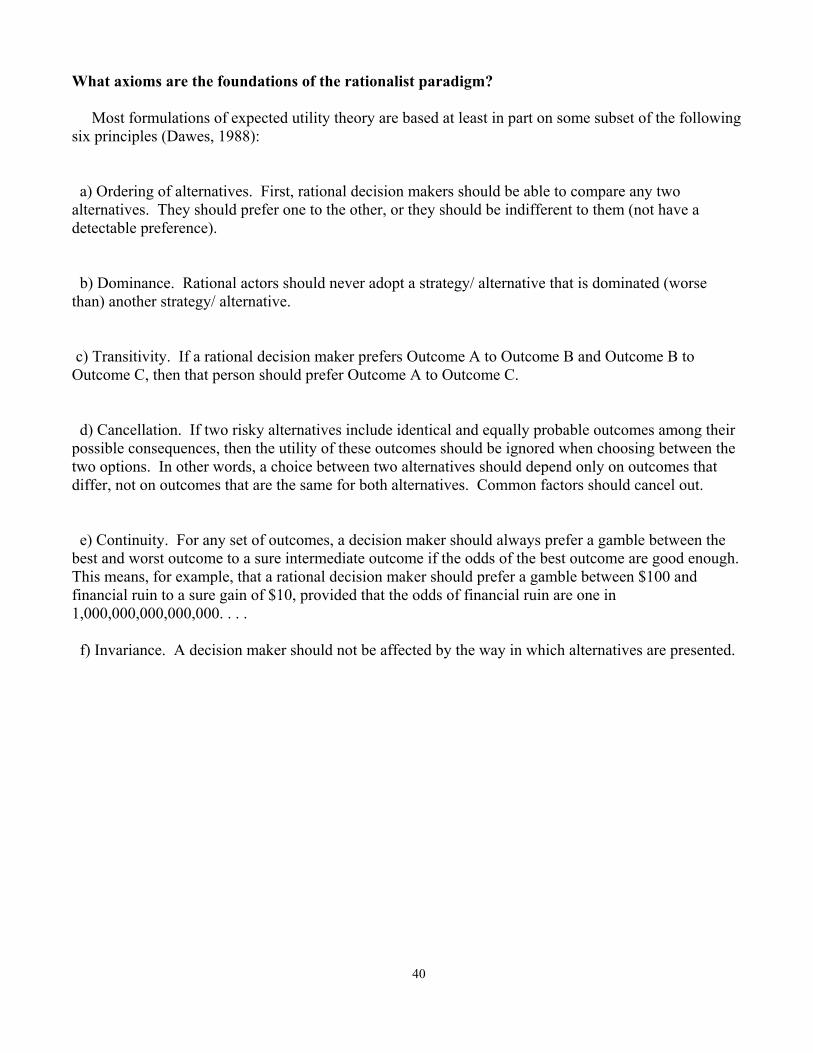
What axioms are the foundations of the rationalist paradigm? Most formulations of expected utility theory are based at least in part on some subset of the following six principles (Dawes, 1988): a) Ordering of alternatives. First, rational decision makers should be able to compare any two alternatives. They should prefer one to the other, or they should be indifferent to them (not have a detectable preference). b) Dominance. Rational actors should never adopt a strategy/ alternative that is dominated (worse than) another strategy/ alternative. c) Transitivity. If a rational decision maker prefers Outcome A to Outcome B and Outcome B to Outcome C, then that person should prefer Outcome A to Outcome C. d) Cancellation. If two risky alternatives include identical and equally probable outcomes among their possible consequences, then the utility of these outcomes should be ignored when choosing between the two options. In other words, a choice between two alternatives should depend only on outcomes that differ, not on outcomes that are the same for both alternatives. Common factors should cancel out. e) Continuity. For any set of outcomes, a decision maker should always prefer a gamble between the best and worst outcome to a sure intermediate outcome if the odds of the best outcome are good enough. This means, for example, that a rational decision maker should prefer a gamble between $100 and financial ruin to a sure gain of $10, provided that the odds of financial ruin are one in 1,000,000,000,000,000. . . . f) Invariance. A decision maker should not be affected by the way in which alternatives are presented.

41
What is the efficient market hypothesis (an important rationalist model)? An important rational model from the field of finance is the efficient markets hypothesis (also called random walk theory). It states that stock prices vary randomly around their respective intrinsic values (their "true" values). Intrinsic values, in turn, rationally reflect all relevant publicly available information, and perhaps even privately available information, as well. Prices adjust very quickly to new information, which enters in a random fashion. Stock prices are the best estimate of underlying value. There are three versions of the efficient market hypothesis: weak, semi-strong, and strong forms. The weak form asserts that stock prices already reflect all information that can be derived by examining market trading data such as history of past prices, trading volume, or short interest. The semi-strong form states that all publicly available information regarding the prospects of a firm must be reflected already in the stock price. In addition to past prices, this includes fundamental data on the firm's product line, quality of management, balance sheet composition, patents held, earnings forecasts, and accounting practices. Any such information from publicly available sources is reflected in the stock prices. The strong form states that stock prices reflect all information relevant to the firm including information available only to company insiders. What is the behavioralist paradigm? The behavioralist paradigm (e.g., management) has its roots in psychology and takes an information processing approach. The individual/group/organization takes in information from the environment, processes it internally, creating representations; makes decisions based upon represented information; and in consequence behaves. The behavioralist paradigm is less constrained than the rational choice paradigm, with less emphasis placed upon using prior theoretical work as a foundation for current work. Creativity and novelty are valued in its theories and models. The result is a theoretical montage, some pieces minutely focused and others more broadly based. The behavioralist paradigm is focused upon the explaining the structure and process of individuals, groups, and organizations. Within this paradigm, few observations or predictions are made about the structure of processes of markets. Assumptions about the expertise of decision-makers or financial incentives are typically not made. Theorizing is done almost entirely in words, mathematics being rarely incorporated. There are neither assumptions regarding individual expertise level nor any for financial incentives. Experimental research methods, which utilize random assignment, are preferred. When experimental methods are not feasible, correlational methods are used. Ellen Langer's (1971) study of the illusion of control is an exemplar useful for illustrating the behavioralist paradigm,. In a study of the effects of choice on the illusion of control, 53 subjects were sold lottery tickets for $1 apiece. If selected as the winner, the person would receive $50. The lottery tickets were standard football cards. On each card appeared a famous football player, his name, and his team. One half of the subjects selected their own lottery card. The other half received a lottery card selected by the experimenter (to avoid bias, each card selected in the choice condition was given to a subject in the no-choice condition). Later, the subjects were approached again by the experimenter and asked what amount they would sell their lottery ticket for. The mean amount of money required for the subject to sell the ticket was $8.67 in the choice condition and $1.96 in the no-choice condition (this difference was statistically significant at p<.005). The experimenter did not subsequently buy back any lottery tickets.

42
How can we compare the rationalist and behavioralist paradigms? a) Normative-ought. Has to do with how idealized, rational, super intelligent, people should think and act. It abstracts away known cognitive concerns of real people, their internal turmoils, shifting values, and lingering post decisional regrets. b) Descriptive-is. Attempts to describe and predict behavior. c) Prescriptive-a middle ground? Addresses question "What should an individual do in order to make better choices?" Exploits logical consequences of normative theory and empirical findings of descriptive studies. The rational and behavioral paradigms offer competing views of decision makers. Much debate has centered on whether the expected utility model is merely a normative model of how decision makers should behave or whether it is also a descriptively accurate model of how decision makers really make decisions. Many economics and finance academics view it as descriptively accurate. Many behavioralists disagree because of the many anomalies (decision phenomena which violate the rational paradigm) and frequently argue that the expected utility model is only normative. Additional criteria for comparing the paradigms. Rational Behavioral Level of Analysis Market Individual/group/
organizational $ Incentives? Yes No
Experienced Unspecified Experience Level of Decision Maker Language Math Words Basic Research Design/Methods Correlational (using historical
data) Experimental and Correlational
Variables of Interest
Market Volume Security Prices Market Volatility Risk due to Variance in Price
Decision Strategies Decision Aids Shortcomings of Rational Model Risk taking Bias & errors
Note. For our use, level of analysis, dollar incentive, and experience level of decision maker are the most relevant dimensions of comparison. In the many of the problems, you will use these criteria to classify studies on the rationalist and behavioralist paradigm continuum. If a study involves a direct or indirect test of the efficient market hypothesis, it is a market level study. Assume that stock market investors are experienced.

43
Are Investors Rational? A Look at U.S. Literacy 1. Definition of literacy: using printed and written information to function in society, to achieve one's goals, and to develop one's knowledge and potential. 2. During 1992, nearly 13,600 individuals aged 16 and older were interviewed and tested to assess their literacy as part of the U.S. National Adult Literacy Survey. Participants were randomly selected to represent the U.S. adult population. In addition, about 1,000 adults were surveyed in each of twelve states (including Texas) that chose to participate and obtain state level results. Over 1,100 inmates from 80 federal and state prisons were also included for a total of over 26,000 respondents. Each participant was paid $20. 3. Description of literacy scales.
Prose literacy-- the knowledge and skills needed to understand and use information from texts that include news stories, editorials, poems and fiction.
Document literacy--the knowledge and skills required to locate and use information contained in materials that include job applications, payroll forms, transportation schedules, maps, tables, and graphs.
Quantitative literacy--the knowledge and skills required to apply arithmetic operations, either alone or sequentially, using numbers embedded in printed materials. 4. The study identified the proportion of people from each region who fell into each of five levels of literacy (1-lowest; 5-highest) for prose, document, and quantitative literacies. Breakdown of Literacy Levels by Region Literacy Level South Nation 1 P-23%; D-26%; Q-25% P-21%; D-23%; Q-22% 2 P-28%; D-29%; Q-27% P-27%; D-28%; Q-25% 3 P-30%; D-29%; Q-29% P-32%; D-31%; Q-31% 4 P-15%; D-14%; Q-15% P-17%; D-15%; Q-17% 5 P-03%; D-02%; Q-04% P-03%; D-03%; Q-04%
The above percentages indicate what proportion of the populace falls in a given literacy level for prose (P), document (D), and quantitative (Q) literacies. For example, for the South, 23% of the populace performs at level I for prose literacy, 26%, for document literacy, and 25%, for quantitative literacy.

44
5. Samples of Items Comprising the Literacy Dimensions and Their Difficulty Levels
Prose Scale Document Scale Quantitative Scale
Level 1 (Scores 0-225) (92% get these right)
(92% get these right) (91% get these right)
149 Identify country in short article. 69 Sign your name. 191 Total a bank deposit entry. 210 locate one piece of information in a
sports article 170 Locate expiration date on driver's
license
224 Underline sentence explaining action stated in a short article
180 Locate time of meeting on a form
Level 2 (Scores 226-275) (80% get these right)
(78% get these right) (80% get these right)
226 Underline meaning of a term given in governmental brochure on supplemental security income.
230 Locate intersection on a street map 238 Calculate postage and fees for certified mail
250 Locate two features of information in sports article
246 Locate eligibility from table of employee benefits
246 Determine difference in price between tickets for two shows
275 Interpret instructions from appliance warranty
259 Identify and enter background information on application for social security card
270 Calculate total costs of purchase from an order form
Level 3 (Scores 276-325) (61% get these right)
(60% get these right) (62% get these right)
288 Write a brief letter explaining error made on credit card bill
277 Identify information from bar graph depicting source of energy and year
278 Using calculator, calculate difference between regular and sale price from an advertisement
316 Read a lengthy article to identify two behaviors that meet a stated condition
314 Use bus schedule to determine appropriate bus for given set of conditions
321 Calculate miles per gallon using information given on mileage record chart
323 Enter information given into an auto maintenance record form
325 Plan travel arrangements for meeting using flight schedules

45
Level 4 (Scores 326-375) (38% get these right)
(47% get these right) (41% get these right)
328 State in writing an argument made in lengthy newspaper article
342 Identify the correct percentage meeting specified conditions from a table of such information
331 Determine correct change using information in a menu
347 Explain difference between two types of employee benefits
352 Use a bus schedule to determine appropriate bus for a given set of conditions
350 Using information stated in a news article, calculate amount of money that should go to raising a child
359 Contrast views expressed in two editorials on technologies available to make fuel efficient cars
352 Use table of information to determine pattern in oil exports across years
368 Using eligibility pamphlet, calculate the yearly amount a couple would receive for basic supplemental security income
362 Generate unfamiliar theme from short poems
374 Compare two metaphors used in poem Level 5 (Scores 376-500) (18% get these right)
(33% get these right) (26% get these right)
382 Compare approaches stated in narrative on growing up
378 Use information in table to complete a graph including axes
382 Determine shipping and total costs from an order form for items in a catalog
410 Summarize two ways lawyers may challenge prospective jurors
387 Use table comparing credit cards. Identify the two categories used and write two differences between them
405 Using information in a news article, calculate difference in time for completing a race
423 Interpret a brief phrase from a lengthy news article
395 Using a table depicting information about parental involvement in school survey to write a paragraph about extent to which parents and teachers agree
421 Using calculator, determine total cost of carpet to cover a room
From: U.S. Department of Education, National Center for Education Statistics, National Adult Literacy Survey, 1992

46
Rationalist vs. Behavioralist Paradigm Problems
1. During the last five years, your instructor has discussed the emerging field of behavioral finance with many colleagues. The most common reaction has been for those colleagues to smile and say, "Behavioral finance? That's an oxymoron." Oxymoron is defined as a combination of contradictory or incongruous words (e.g. cruel kindness). Explain this reaction using a) the concept of paradigm and b) attributes of the behavioral and rational paradigms. 2. The Structure of Scientific Revolutions triggered diverse reactions. Most “hard” scientists shrugged and went about their business. But many in the soft, or social, sciences “loved” the book, Kuhn says, perhaps because it offered a hope that they could attain the same level of legitimacy (or illegitimacy) as physicists or chemists. “Some of them even said, ‘Wow, all we have to do is to figure out what our paradigm is and enforce it.,’” Kuhn explains. Some philosophers, on the other hand, deplored Kuhn’s brusque dismissal of empiricism and objective truth. He was accused of claiming that science is nothing more than “power politics” or “mob psychology.” “Look, I think that is nonsense, and I am prepared to argue that,” Kuhn says heatedly. Kuhn has been even more distressed by those who admiringly misinterpret him. “I’ve often said that I am much fonder of my critiques than my fans,” he comments. In the 1960s his work was seized on by radicals opposed to science and its offspring, technology, and indeed to any “cognitive authority that might distort “pure experience.” Kuhn recalls students telling him, “Oh, thank you, Mr. Kuhn, for telling us about paradigms. Now that we know about them, we can get rid of them.” a) How would Kuhn address the criticism that he is claiming science to be nothing more than
“power politics” or “mob psychology? b) Did the 60s radicals rid the world of paradigms? Why or why not?

47
3. In a study of portfolio allocation decisions, Moore, Kurtsberg, Fox, and Bazerman had 80 business students make decisions in a computer-based, mutual-fund-investing simulation. Each student performed the simulation by him/herself. The goal was to better understand why investors spend so much time and money on actively managed mutual funds despite the majority of those funds being outperformed by passively managed index funds (at least in recent years). The researchers hypothesized that the illusion of control would lead students to overestimate their future portfolio returns from actively selecting mutual funds and that anchoring and adjustment would influence investment decisions. (Recall that illusion of control suggests that decision makers value choice even when predicting random events outcomes for which they have no valid cues.) Most participants consistently overestimated the future performance of their investments consistent with the illusion of control. The researchers hypothesized that anchoring and adjustment would influence portfolio allocation decisions. The students were more likely to change their portfolio allocation following poorer fund performance than better fund performance, a tendency which had a negative impact on portfolio returns. The researchers attributed this to students anchoring on past performance (expecting both poor and good fund performances to continue) as they made allocation decisions. The students reported that they had an average of $20,500 of their own money invested in stocks and mutual funds and that they had been investing for an average of 4.7 years. Participants received course credit for participating in the research. a) What causal model(s) is (are) being tested? b) Who are the decision makers who are being studied? c) On continuum below, place an X. Justify your answer using the relevant three criteria. |---------------------------------------------------------------------------------------------------------------| Behavioralist Rationalist Paradigm Paradigm 4. Metcalf etal. analyzed the Wall Street Journal's contests pitting the US traded equity recommendations of four expert portfolio managers and strategists against the random selection of four darts (a proxy for the random walk of the efficient market). The experts receive no money for their participation. The total return of the experts' selections was 9.5%, substantially better than the 6.9% returned by the dart stocks and the 4.3% returned by the S&P 500. The market was beaten by the experts 18 times and by the darts 15 times during the 30 contests The experts beat the darts 16 of 30 times. The experts tend to pick riskier stocks and to do no better than the darts after controlling for risk. The authors conclude that the performance of the stock pickers is consistent with the efficient market hypothesis. a) What causal model(s) is (are) being tested? b) Who are the decision makers that are being studied? c) On continuum below, place an X. Justify your answer using the relevant three criteria. |---------------------------------------------------------------------------------------------------------------| Behavioralist Rationalist Paradigm Paradigm

48
5. In a study titled "Are investors reluctant to realize their losses?" Terrance Odean compared the percentage of paper losses realized by a sample of 10,000 discount brokerage accounts to the percentage of paper gains realized. A paper loss or gain the change in stock price that occurs while an investor owns a stock. To "realize" a paper loss or paper gain, the investor sells the stock. The period considered is 1987-1993. He found that for the entire year, a higher percentage of gains (23.3%) than losses (15.5%) is realized. For the month of December, a higher percentage of losses than gains are realized. For the subsequent year, he found that the winners (which were sold) outperformed the losers (which were retained).
Rate of Return for Subsequent 84 days 252 days 504 days
Sold winners .0047 .0235 .0645 Kept Losers -.0056 -.0106 .0287 All differences are statistically significant. a) What causal model(s) is (are) being tested? b) Who are the decision makers that are being studied? c) On continuum below, place an X. Justify your answer using the relevant three criteria. |---------------------------------------------------------------------------------------------------------------| Behavioralist Rationalist Paradigm Paradigm 6. Chan, Jegadeesh, and Lakonishok tested the profitability of momentum strategies. They addressed the question, “Does a stock price going up considerably over several months imply anything about its price in the future? Their sample included all stocks listed on the NYSE, Amex, and NASDAQ during the periods 1973-1993 and 1994-1998. They assigned stocks to deciles based upon prior six month return. They examined the performance of winner stock portfolios (selected from the top 10%) and the performance of loser stock portfolios (selected from the bottom 10%) over the subsequent 6 months and 12 months. They found that the winner portfolios outperformed the loser portfolios by 8.8% over the subsequent six months and by 15.4% over the subsequent 12 months. They conclude that momentum strategies (as a method for stock selection) can be profitable in the short term and intermediate term. a) What causal model(s) is (are) being tested? b) Who are the decision makers that are being studied? c) On continuum below, place an X. Justify your answer using the relevant three criteria. |---------------------------------------------------------------------------------------------------------------| Behavioralist Rationalist Paradigm Paradigm

49
Perception Definition: process of sensing reality and resulting understanding or view people have of it. Two step model of perceptual process a. Attention i. Stimuli which are larger, more intense, in motion, repetitive, novel or very familiar, or in contrast with their background are more likely to be selected ii. Stimuli which are small, less intense, stationary, or that blend in with their background are less likely to be selected b. Organization: methods for categorizing of selected stimuli so they make sense i. Figure & background: perceive stimuli as figures standing out against a background ii. Closure: tendency to form a complete image out of incomplete data,among related stimuli iii. Representativeness (see below under heuristics and biases)

50
Operant Learning Theory The objection to inner states is not that they don't exist, but that they are not relevant in a functional analysis. We cannot account for the behavior of any system while staying inside it; eventually we must turn to forces operating upon the organism from without. B.F. Skinner (1953) Thorndike's Law. A behavior which is followed by positive consequences will have a greater probability of occurring again. A behavior which is followed by negative consequences has a reduced probability of occurring again. Learning: acquisition of skills, knowledge, ability, or attitudes. S-B-C model Stimulus (also called antecedent) Behavior (what person does, must be directly observable, countable, and measurable to be useful) Consequences Techniques for affecting behavior a) Positive reinforcement: actively encouraging behavior by repeatedly pairing b) Punishment: actively eliminates undesirable behaviors by application of aversive reinforcer after the behavior to be extinguished/diminished.

51
Heuristics and Biases Heuristics are highly useful mental tricks or rules of thumb that we use to simplify decision making. Biases are common errors that result from the use of heuristics. Availability-managers assess the frequency, probability, or likely causes of an event by the degree to which instances or occurrences of that event are readily "available" in memory. Biases related to the availability bias include: i) Ease of recall: Individuals judge events that are more easily recalled from memory, based upon vividness or recency, to be more numerous than events of equal frequency whose instances are less easily recalled. ii) Presumed associations: individuals tend to overestimate the probability of two events co-occurring based upon the number of similar associations that are easily recalled, whether from experience or social influence. Representativeness: a) assign to categories (called schemas) based upon simple resemblance or "goodness of fit" to individual categories b) react based upon characteristics of that category. Schemas: knowledge stored in a categorical structure which often is hierarchical; not normally expressed in a verbal cognitive form or propositional form Biases emanating from the representativeness heuristic include: i) Insensitivity to base rates: individuals tend to ignore the base rates in assessing the likelihood of events when any other descriptive information is provided--even if it is irrelevant. ii) Insensitivity to sample size: individuals fail to appreciate the role of sample size in assessing the reliability and usefulness of sample information.

52
iii) Misconceptions of chance: individuals expect that a sequence of data generated by a random process will look "random," even when the sequence is too short for those expectations to be statistically valid. iv) Regression to the mean: individuals tend to ignore that extreme events tend to regress to the mean on subsequent trials. Anchoring and adjustment-assess by starting from an initial value and adjusting it to yield a final value/decision. Biases related to anchoring and adjustment include: i) Insufficient anchor adjustment: individuals make estimates based upon an initial value (derived from past experience, random assignment, or whatever information is available) and typically make insufficient adjustments from that anchor when establishing a final value. ii) Conjunctive and disjunctive events bias: individuals exhibit a bias toward overestimating the probability of conjunctive events and under estimating the probability of disjunctive events. iii) Overconfidence: individuals tend to be overconfident of the infallibility of their judgments when answering moderately to extremely difficult questions. Three More General Biases i) The confirmation trap: individuals tend to seek confirmatory information for what they think is true and to neglect the search for disconfirmatory evidence. ii) Hindsight and the curse of knowledge: after finding out whether or not an event occurred, individuals tend to overestimate the degree to which they would have correctly predicted the correct outcome. Furthermore, individuals fail to ignore information that they possess which others do not when predicting others' behavior. iii) Coincidence-conclude that two factors/variables are causally related because they happened together in a rare event.

53
Prospect Theory Rewards and losses are evaluated relative to a neutral reference point. Potential outcomes are expressed as gains or losses relative to this fixed neutral point. An S-shaped value function guides choices to be made. Important aspects of value function a) The marginal impact of gains or losses diminishes as one moves away from the reference point. b) The loss portion of the curve is steeper than the gain portion. A given loss "hurts" more than an equivalent gain gives pleasure. Biases related to prospect theory i) Disposition effect-predisposition to hold losers too long and sell winners too soon ii) Loss aversion-reluctance to sell at a loss as the investor hopes to get back to at least even
54
Problems 1. A representative of Company A, a stock mutual funds company, contacts you about investing your IRA savings with her firm. As part of the sales presentation, she produces a listing of stock funds from a large number of firms which have been rank ordered by performance. Company A has two funds in the top 5. The other companies you were considering for investment have funds in the list which are ranked much lower. Later you discover that the list contained only Company A's best funds and only the worst funds of other companies you are considering. Explain how the Company A sales representative has attempted to manage your perceptions. 2. a) Sally is shopping for a new car. She is thinking seriously of buying a Ford Mustang until she remembers that a close friend had a Mustang which was a real "lemon". Sally decides to buy some other car. Which concept(s) best fit this situation? Briefly explain why you chose the one you did. b) A recent Toyota truck commercial states that over 80% of the Toyota trucks sold in the U.S. are still in use. Further, they state that no American manufacturer can match this claim. Large numbers of trucks made by Ford, General Motors, and Chrysler (U.S. manufacturers) have been sold in this country for over 40 years. Large numbers of trucks made by Toyota have been sold in the U.S. for only about 10 years. Thus, the percentage of trucks still in use is not an accurate measure of quality. Which concept(s) is Toyota attempting to exploit? Briefly explain why you chose the one which you did. c) In a June 19, 1998 US News & World Report story titled "Get Real," the mortality illusion is described. That is, people tend to underestimate their life expectancy by assuming that they will live to about the same age as their parents. However, in an era of rapidly improving life expectancy, this "look around" method gives the wrong answer. Which concept(s) is best exemplified by this illusion? Briefly justify your answer. d) In the same article, the bull-market illusion is described. That is, people assume that they will make the same high return on savings in the future as they made in the past. Which of the concepts below is best exemplified by this illusion? Briefly justify your answer.

55
3. Assume you are a stockbroker. A new client invested $100,000 with you following your advice.
a) What are the implications of prospect theory for telling the new client that s/he has suffered a $10,000 loss in her/his accounts? Draw a prospect theory diagram in support of your answer.
b) What are the implications of prospect theory for telling a new client that s/he has earned a gain of $10,000 in her/his accounts? Draw a prospect theory diagram in support of your answer. 4. For each of the “Smartest/Dumbest Investments” descriptions below, which course concepts can help explain what happened?
a ) Around seven years ago, my financial planner persuaded me to invest $10,000 in a telecommunications venture with which he was affiliated. The company filed for bankruptcy within two years, leaving the original investors with a 100% loss.
b) My worst investment move was not investing in any more stocks or mutual funds when I was in my 20s, or in any retirement plan.
c) The dumbest investment decision I ever made was to take some friends’ advice and staring to buy momentum stocks. MSN Moneycentral has a portfolio that suggests three momentum stocks monthly. At the beginning of each year, $10,000 in play money is equally divided and put into the top three momentum stocks according to a particular model. At the end of each month, all three stocks are sold. At the start of he next month, the proceeds are evenly divided and invested in the top three momentum stocks according to the model. In 1999, this approach turned a 1068% profit. I decided to blindly invest in 2000. I lost about 30% in three months. The portfolio is down 54% as of yesterday morning.
d) The smartest investment decision I ever made was to take my father’s advice to never second guess a sell decision. I used to monitor stocks and funds very closely after I sold them to see if I got out at the right time. Invariably, the stock would go up and I would berate myself for selling early and leaving money on the table. My dad observed this and helped me to see that it is counterproductive. Self doubt is a very negative thing which can effect future investment strategies. It’s a wasted emotion.
e) My smartest decision was to really begin to put money aside before I got my hands on it. At age 30, I began to have money deducted or payroll deducted to go directly to my investment accounts.
f) The worst investment move I have made is not participating in the stock market. I have substantial savings which are just sitting in a passbook savings account.

56
g) My worst decision was trying to be a day trader and timing the market. I opened an
online trading account and have been trading for a while. Overall, I am still trying to recover my loss from a panic sellout of stocks when they were acting like a roller coaster. Looking back, I should have left many of those stocks alone for the long term. I would have made a handsome profit by now. Thinking that I could make a short term profit caused only grief and wasteful time spent watching the market constantly.
h) I bought a stock, Tiphook, solely based on eyeballing its recent performance in the Wall Street Journal. I made no other due diligence actions. The company got bought out two weeks after I bought the stock. I lost $1400 over night.
i) In March, 1999, I bought into a little known company called FiNET.com. Within hours of buying 300 shares at $2.18 each, the stock began to climb. Over the next month, I continued adding to my position. This was the next Yahoo. In mid-April, the stock peaked at $18. Wow. I was on top of the world but not for long. Since April, I have held my position and watched the stock fall to $1.50. I am currently down 85%. I will never sell the stock–wouldn’t want to forget the costly learning experience.

57
The Winner's Curse
In an auction setting, the bidders will have a variety of estimates concerning the worth of the item being offered. The mean of their estimates may approximate the true value of the offered item (as posited by the rational model of decision making). However, it is the person with the highest estimate of value who will win the auction. Thus, this person will pay too much. The winner has won the auction with the highest bid but is cursed in that she/he paid too much. The winner's curse decreases as bidders gain experience. The leverage points are the number of bidders (more bidders produce more winner’s curse) and ambiguity in valuation of the item being offered for auction (more ambiguity produces more winner’s curse).

58
Nonrational Escalation of Commitment
Background: Attitude a) components i) affect: favorable or unfavorable feelings ii) cognition: beliefs, knowledge, understanding iii) behavioral intention: what a person plans to do b) common belief: "Attitude causes behavior" c) commitment theory shows that in addition, "Behavior causes attitudes" Step One: Commitment to an initial decision a) Defn of commitment: binding of an individual to behavioral acts.
b) The degree of commitment derives from the extent to which a person's behavior occurs under the following five conditions:
i) explicitness: affected by the observability and unequivocality of the act ii) irrevocability: reversibility of the action; some actions are permanent and having occurred cannot be undone iii) volition: degree of perceived choice in a situation; people are simultaneously free and constrained in their actions; factors affecting volition are (1) choice, (2) presence of external demands, (3) presence of extrinsic bases to action, (4) presence of other contributors to action iv) publicity: extent to which others know of the action and the kinds of persons who know (e.g., friends vs. strangers) v) opportunity for reflection: person thinks about behavior; if the other four conditions are present, the person tends to attribute the causality for the behavior to him/hers If the act is consistent with the attitude, the attitude will be strengthened. If the act is inconsistent with the attitude, the attitude will be weakened. Step Two: Factors which facilitate further commitment of resources to the decision
a) perceptual biases: filter information; attending more to information which is consistent with initial decision b) judgmental biases: loss of initial investment (sunk cost) will bias one to continue commitment c) external image management (KYAC): selectively provide information in support of initial decision and seek to appear consistent d) competitive irrationality: two parties engage in an activity that is clearly
irrational in terms of outcomes to both sides; yet it is hard to specify irrational actions by each party
Step 3: Nonrational escalation of commitment to a decision. Definition: the
degree to which an individual escalates commitment to a previously selected course of action to a point beyond that which a rational model of decision making would prescribe.

59
Ways to avoid nonrational escalation of commitment a) Set limits on your involvement and commitment in advance b) Avoid looking to other people to see what you should do c) Actively determine why you are continuing d) Remind yourself of the costs involved e) Remain vigilant (escalation is often a passive response; must constantly reassess the costs and benefits of continuing)
Problems 1. At semester's end, as Richard thought about the final exam for this class, he concluded that it would be very difficult. Each of the heuristics (availability, representativeness, and anchoring & adjustment) could have been used by Richard in arriving at his conclusion. Explain how each of the three heuristics could have been used by Richard to arrive at the conclusion he did. 2. Present a plan for structuring the MBA program (admissions, course work, expenses, etc.) to maximize student commitment to the University of Houston and the Bauer College. 3. Early in August, 1990, Iraq invaded Kuwait. As events unfolded in the days and weeks following the invasion, the Bush administration focused on sending troops and military aid to Saudi Arabia in order to prevent an Iraqi invasion of Saudi Arabia. Then, during a televised news conference, Bush shocked his cabinet and advisors by unexpectedly announcing that Iraq would be expelled from Kuwait. From this point on, Bush focused on liberating Kuwait and would accept no other alternative. Apply all three steps of escalation of commitment theory to explain how this statement might have altered the course of the conflict with Iraq. 4. How could you facilitate a client's commitment to his/her investments? 5. How can you avoid nonrational escalation of commitment to your investments?

60
Expertise: Analysis and Intuition Dreyfus and Dreyfus (1986) identify five stages in the development of expertise:
novice, advanced beginner, competence, proficiency, and expertise (see below). The novice often has limited knowledge and practice. During the first stage of the acquisition of a new skill through instruction, the novice learns to recognize various objective facts and features relevant to the skill and acquires rules for determining actions based upon those facts and features. Elements of the situation to be tested as relevant are so clearly and objectively defined for the novice that they can be recognized without reference to the overall situation in which they occur. Through practice, the novice develops skills with the rules and internalizes them. With much practice they modify and develop their own knowledge structures with the rules having served as a useful beginning and base.
Novice: learning of rules in a context free manner (without reference to overall
situation) Advanced beginner: situation is now incorporated in many decisions Competence: rules organized into a hierarchy Proficiency: intuition develops Expertise: holistic; intuitive, deep situational understanding
Intuition-definition a) Behling and Eckel have identified over 87 attempts to define intuition. b) They have grouped the definitions into six clusters which are i) A sixth sense--akin to extra-sensory perception. ii) Personality trait (Carl Jung). iii) Unconscious process during which factors are sorted out at unconscious level
but this process cannot be verbalized. iv) Set of actions or observable behavior--intuitive managers actively seek persons
from whom to get information regardless of formal hierarchy. v) Distilled experience which has accumulated over many years. Intuition is
learnable but not teachable. Acquiring it is a process of shaping habits through experience. vi) Residual category
61
Hammond's types of cognition a) Intuition-thinking that is implicit, nonsequential and nonrecoverable. Usually, the
thinker can do no more than report the outcome of thought processes. b) Quasirationality-a form of cognition which has some properties of both analysis and
intuition. c) Analysis-step by step, largely conscious, logically defensible, and retraceable process.
It is a series of steps that transform information according to certain rules. These rules can be reported by the thinker.
Simon (1986) concludes that achieving a world class level of expertise in a new field (e.g.,
research methods) requires 10 years of intensive study. Simon says that intuition consists of analyses that are frozen into habit and into the capacity for rapid response through recognition. (Hammond responds that this is fast analysis not intuition.)
Problems 1. Assume that you will be interviewing Warren Buffet, the legendary investor. What kinds of questions will you ask him? What percentage of his expertise do you expect to capture?


