46
Finance & Accounting Training: Prudential Planning, Budgeting & Forecasting August 2, 2012 9:30 – 12:00 PM
Finance & Accounting Training: Prudential
Planning, Budgeting & Forecasting
August 2, 2012 9:30 – 12:00 PM
Pru
Bud
getin
g Fo
reca
stin
g Tr
aini
ng F
inal
08-
02-2
012.
ppt
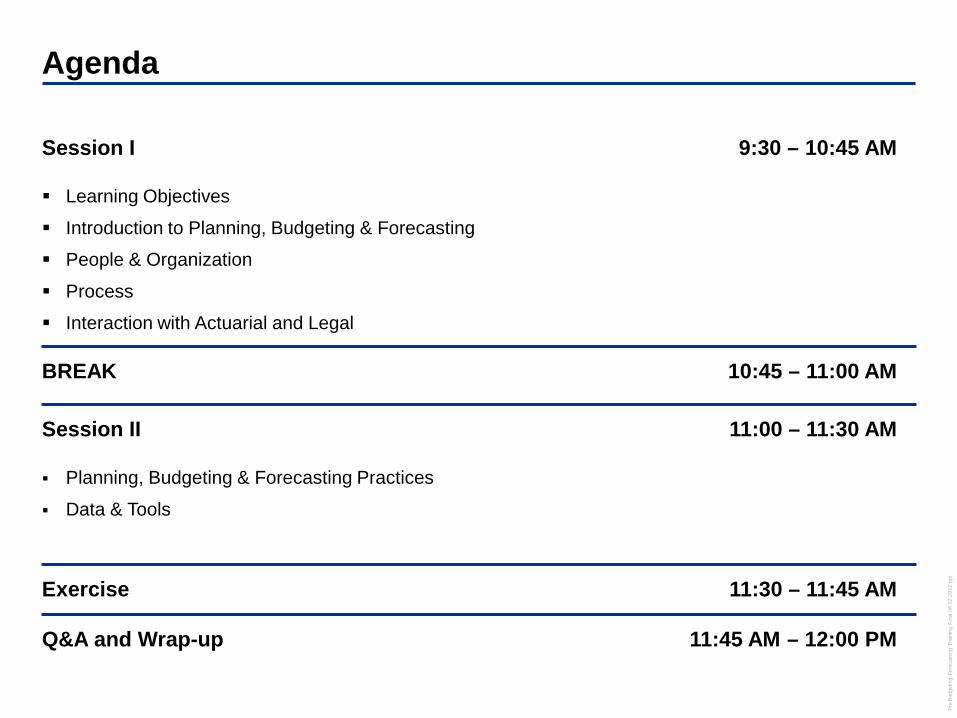
Agenda
Session I 9:30 – 10:45 AM
Learning Objectives
Introduction to Planning, Budgeting & Forecasting
People & Organization
Process
Interaction with Actuarial and Legal
BREAK 10:45 – 11:00 AM
Session II 11:00 – 11:30 AM
Planning, Budgeting & Forecasting Practices
Data & Tools
Exercise 11:30 – 11:45 AM
Q&A and Wrap-up 11:45 AM – 12:00 PM

Pru
Bud
getin
g Fo
reca
stin
g Tr
aini
ng F
inal
08-
02-2
012.
ppt
Learning Objectives
1. Understand planning, budgeting and forecasting processes and their importance
2. Understand how planning, budgeting, and forecasting fit within the broader corporate strategy of an organization
3. Understand the typical planning, budgeting and forecasting process, people and tools used in the planning, budgeting and forecasting processes
4. Understand the role of actuarial and legal in this process
5. Understand data structure and tools used in planning, budgeting, and forecasting
Learning Objectives
By the end of this module, you will have a firm foundation of planning, budgeting, and forecasting (PBF) processes, an exposure to the typical issues organizations experience around planning, budgeting and forecasting

Introduction to Planning, Budgeting & Forecasting
- 5 - Pru
Bud
getin
g Fo
reca
stin
g Tr
aini
ng F
inal
08-
02-2
012.
ppt
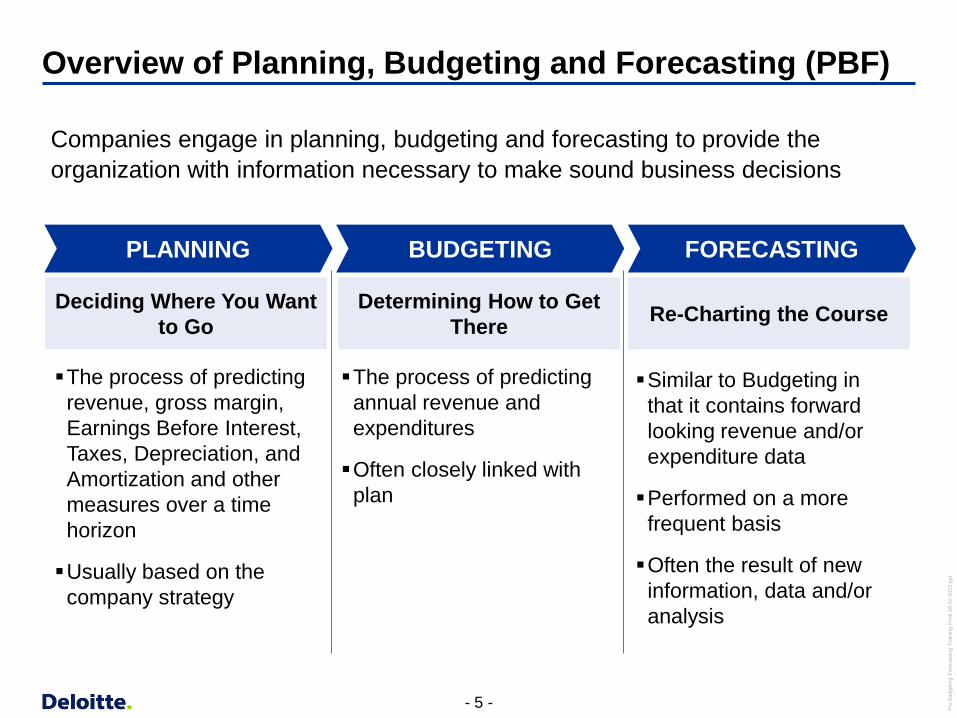
Overview of Planning, Budgeting and Forecasting (PBF)
PLANNING BUDGETING FORECASTING
Deciding Where You Want to Go
The process of predicting revenue, gross margin, Earnings Before Interest, Taxes, Depreciation, and Amortization and other measures over a time horizon
Usually based on the company strategy
Re-Charting the Course Determining How to Get There
The process of predicting annual revenue and expenditures
Often closely linked with plan
Similar to Budgeting in that it contains forward looking revenue and/or expenditure data
Performed on a more frequent basis
Often the result of new information, data and/or analysis
Companies engage in planning, budgeting and forecasting to provide the organization with information necessary to make sound business decisions
- 6 - Pru
Bud
getin
g Fo
reca
stin
g Tr
aini
ng F
inal
08-
02-2
012.
ppt
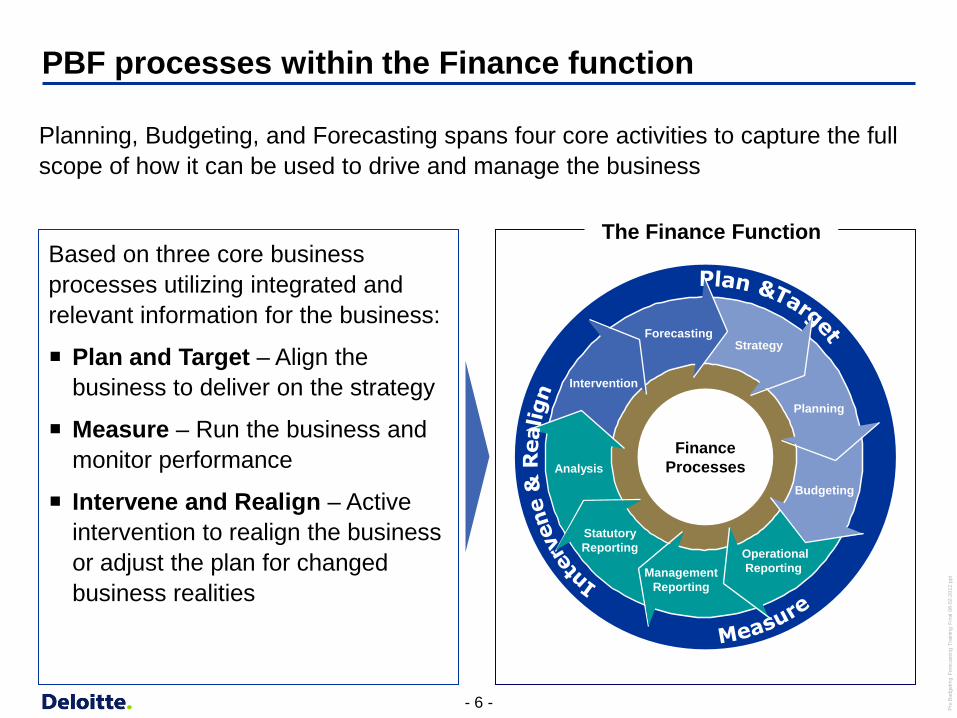
Based on three core business processes utilizing integrated and relevant information for the business:
Plan and Target – Align the business to deliver on the strategy
Measure – Run the business and monitor performance
Intervene and Realign – Active intervention to realign the business or adjust the plan for changed business realities
PBF processes within the Finance function
Planning, Budgeting, and Forecasting spans four core activities to capture the full scope of how it can be used to drive and manage the business
Strategy
Planning
Budgeting
Operational Reporting Management
Reporting
Statutory Reporting
Analysis
Intervention
Finance Processes
Forecasting
The Finance Function

- 7 - Pru
Bud
getin
g Fo
reca
stin
g Tr
aini
ng F
inal
08-
02-2
012.
ppt
PBF and company Strategy and Performance Management
Business Strategy
Strategic Plan
Action Results
Change
Operating Plans
Budgets
Forecast
Performance Management
Individual performance measures and metrics (KPIs)
Actuals from ERP, business systems, or other sources
Reporting and analysis of KPIs and intervention process
High-level strategic targets
Business unit performance targets
Devise strategy
Implement strategy
Measures
Execute strategy
Performance
Strategic direction is established
cascade down
cascade down
cascade down

- 8 - Pru
Bud
getin
g Fo
reca
stin
g Tr
aini
ng F
inal
08-
02-2
012.
ppt
PBF begins with the Strategic Plan…
The strategic plan provides direction with objectives and strategies. A company sets a long-term vision and works backwards to translate this into tangible strategies and initiatives that can be used to drive alignment of efforts and resources
Goa
l
Regional dominance? Geographic expansion? Product innovation? Etc.
Time
Company X Today
Translating Backward
Where do we need to be in the future?
Company X Today
Action Plans
How are we going to get there?
Goa
l
Time
Strategic Direction Strategies

- 9 - Pru
Bud
getin
g Fo
reca
stin
g Tr
aini
ng F
inal
08-
02-2
012.
ppt
… and drives Business Planning
Vision and Mission
Goal
Strategic Plan
Strategic initiatives Targets Communication
Business Planning, Budgeting and forecasting
Actual results
Strategic levers of long term shareholder
value
Internal analysis External analysis
Feedback loop – Results tailored to strategic input
requirement specifications
The planned investment, savings, costs and incremental revenues associated with strategic initiatives are included in the budget and forecasts and are tracked and disclosed in a manner that allows for separate identification of benefits and costs
• The targets set by Client Strategic planning drive the budgeting, and hence the forecasting, process. These targets should include the effect of strategic initiatives
• A mechanism is in place for the communication of and consideration in of strategic imperatives in the planning and budget process
- 10 - Pru
Bud
getin
g Fo
reca
stin
g Tr
aini
ng F
inal
08-
02-2
012.
ppt
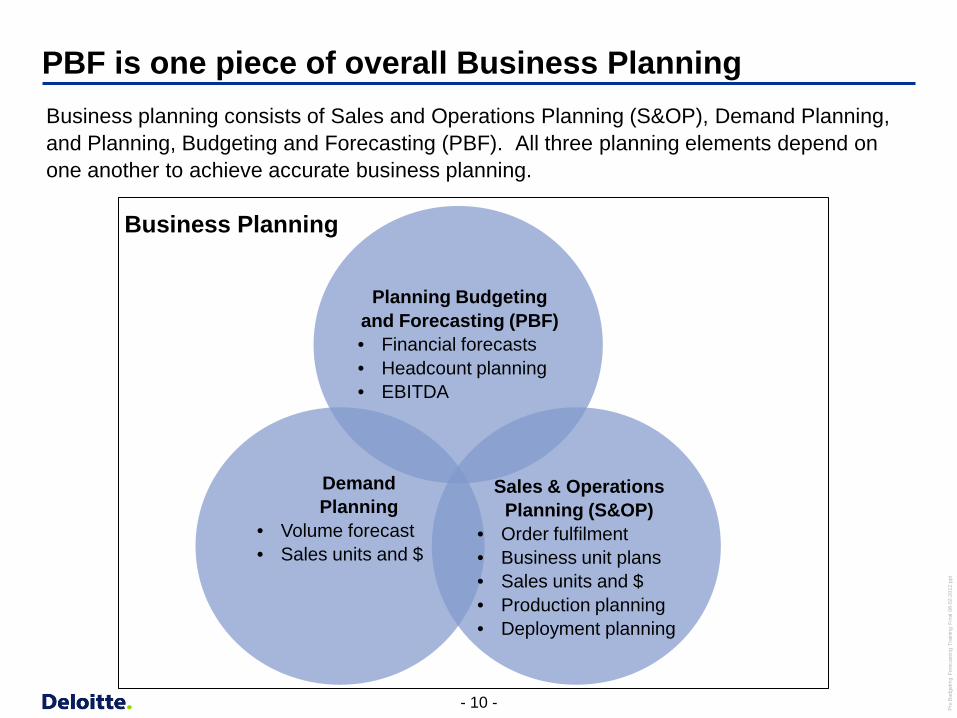
PBF is one piece of overall Business Planning Business planning consists of Sales and Operations Planning (S&OP), Demand Planning, and Planning, Budgeting and Forecasting (PBF). All three planning elements depend on one another to achieve accurate business planning.
Demand Planning
• Volume forecast • Sales units and $
Sales & Operations
Planning (S&OP) • Order fulfilment • Business unit plans • Sales units and $ • Production planning • Deployment planning
Planning Budgeting and Forecasting (PBF) • Financial forecasts • Headcount planning • EBITDA
Business Planning
- 11 - Pru
Bud
getin
g Fo
reca
stin
g Tr
aini
ng F
inal
08-
02-2
012.
ppt
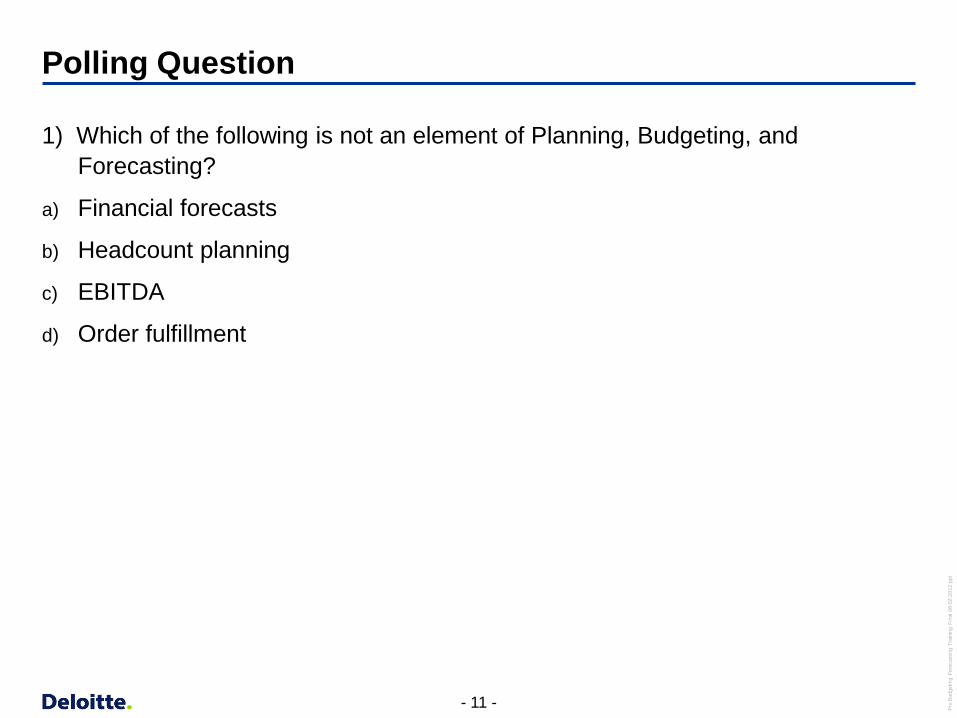
Polling Question
1) Which of the following is not an element of Planning, Budgeting, and Forecasting?
a) Financial forecasts
b) Headcount planning
c) EBITDA
d) Order fulfillment

People and Organization
- 13 - Pru
Bud
getin
g Fo
reca
stin
g Tr
aini
ng F
inal
08-
02-2
012.
ppt
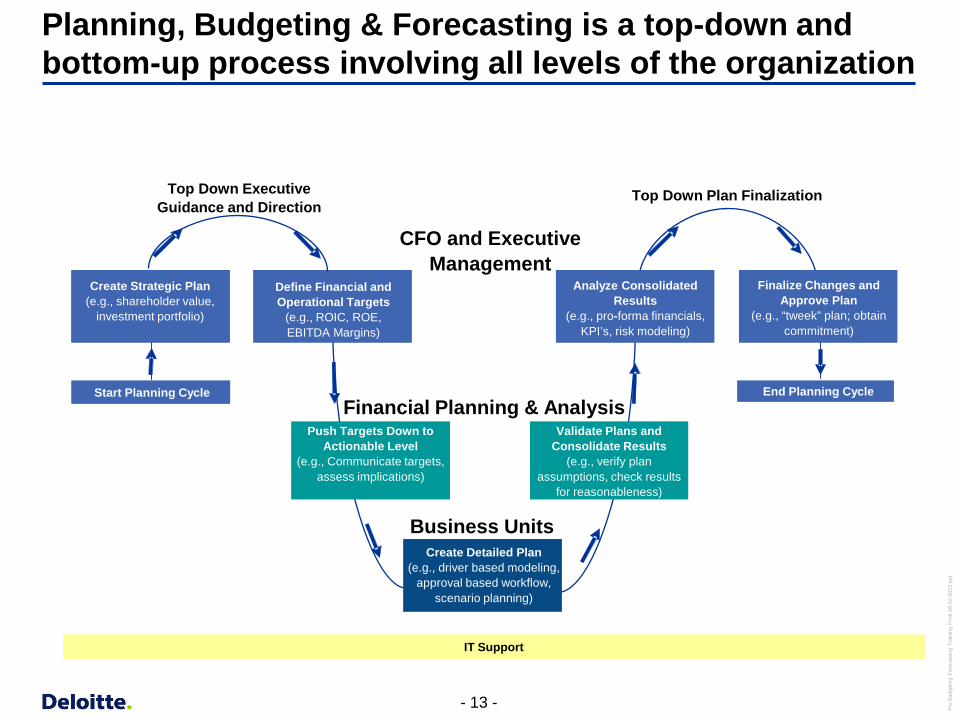
Planning, Budgeting & Forecasting is a top-down and bottom-up process involving all levels of the organization
Start Planning Cycle
Push Targets Down to Actionable Level
(e.g., Communicate targets, assess implications)
Create Detailed Plan (e.g., driver based modeling,
approval based workflow, scenario planning)
Validate Plans and Consolidate Results
(e.g., verify plan assumptions, check results
for reasonableness)
Analyze Consolidated Results
(e.g., pro-forma financials, KPI’s, risk modeling)
End Planning Cycle
Finalize Changes and Approve Plan
(e.g., “tweek” plan; obtain commitment)
Financial Planning & Analysis
CFO and Executive Management
Top Down Executive Guidance and Direction
Top Down Plan Finalization
Define Financial and Operational Targets
(e.g., ROIC, ROE, EBITDA Margins)
Create Strategic Plan (e.g., shareholder value,
investment portfolio)
Business Units
IT Support

- 14 - Pru
Bud
getin
g Fo
reca
stin
g Tr
aini
ng F
inal
08-
02-2
012.
ppt
The process includes many stakeholders
Stakeholders Role/Responsibilities How Information is Used
CFO and Executive Management
Define strategy and strategic goals Approve targets from FP&A, and budget,
plan or forecast from business units
Communicate forecasted performance to the investor community
Corporate FP&A (Financial Planning
and Analysis)
Translate strategy into measurable targets
Monitor progress against those targets Ensure that the company manages risks
associated with achieving the strategic objectives
Understand the company’s forecasted performance
Business Units Execute the process Construct the budget based on spending
needs Responsible for corporate strategy
development and integration with the operational planning process
Understand their revenue targets and spend for the fiscal year
Information Technology and
Accounting
Support the company-wide budgeting process enabled by network software that shares assumptions and captures targets
Enable availability, processing, analysis and accuracy of information
Process
- 16 - Pru
Bud
getin
g Fo
reca
stin
g Tr
aini
ng F
inal
08-
02-2
012.
ppt
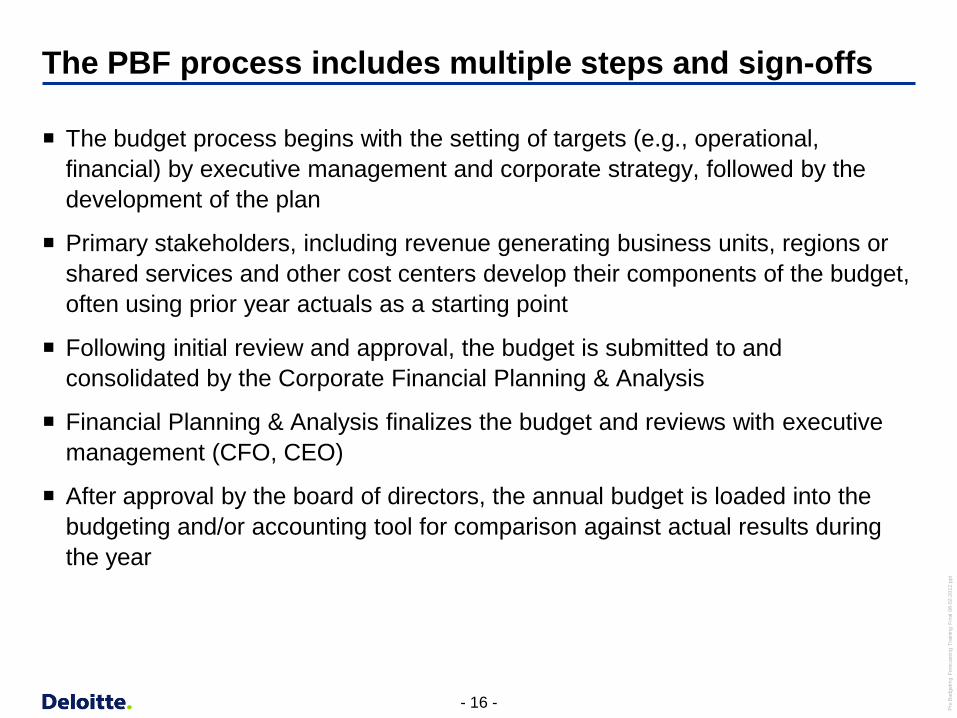
The PBF process includes multiple steps and sign-offs
The budget process begins with the setting of targets (e.g., operational, financial) by executive management and corporate strategy, followed by the development of the plan
Primary stakeholders, including revenue generating business units, regions or shared services and other cost centers develop their components of the budget, often using prior year actuals as a starting point
Following initial review and approval, the budget is submitted to and consolidated by the Corporate Financial Planning & Analysis
Financial Planning & Analysis finalizes the budget and reviews with executive management (CFO, CEO)
After approval by the board of directors, the annual budget is loaded into the budgeting and/or accounting tool for comparison against actual results during the year
- 17 - Pru
Bud
getin
g Fo
reca
stin
g Tr
aini
ng F
inal
08-
02-2
012.
ppt
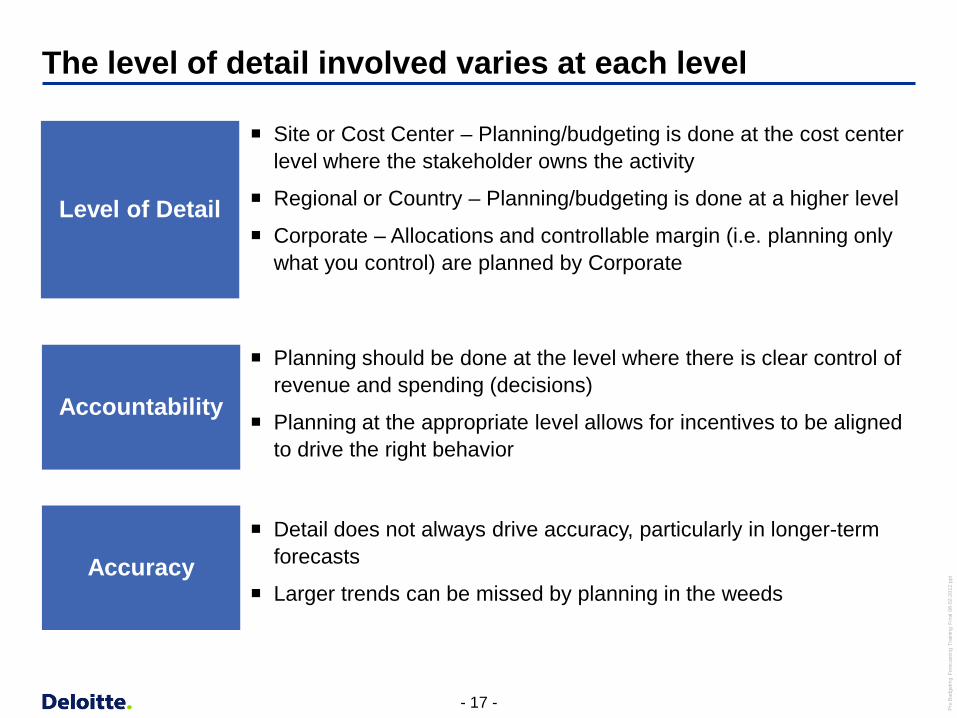
The level of detail involved varies at each level
Level of Detail
Accuracy
Accountability
Site or Cost Center – Planning/budgeting is done at the cost center level where the stakeholder owns the activity
Regional or Country – Planning/budgeting is done at a higher level
Corporate – Allocations and controllable margin (i.e. planning only what you control) are planned by Corporate
Detail does not always drive accuracy, particularly in longer-term forecasts
Larger trends can be missed by planning in the weeds
Planning should be done at the level where there is clear control of revenue and spending (decisions)
Planning at the appropriate level allows for incentives to be aligned to drive the right behavior

- 18 - Pru
Bud
getin
g Fo
reca
stin
g Tr
aini
ng F
inal
08-
02-2
012.
ppt
The resulting information can take many forms
The reporting generated from the budgeting, planning, and forecasting process varies by organization. Some typical reports include:
Budgeting and Planning Reports – Financial Statements – Total Revenue – Revenue by product – Expenses
Forecasting Reports – Budget to Actual Variance Analysis – Actual Expense Analysis
- 19 - Pru
Bud
getin
g Fo
reca
stin
g Tr
aini
ng F
inal
08-
02-2
012.
ppt
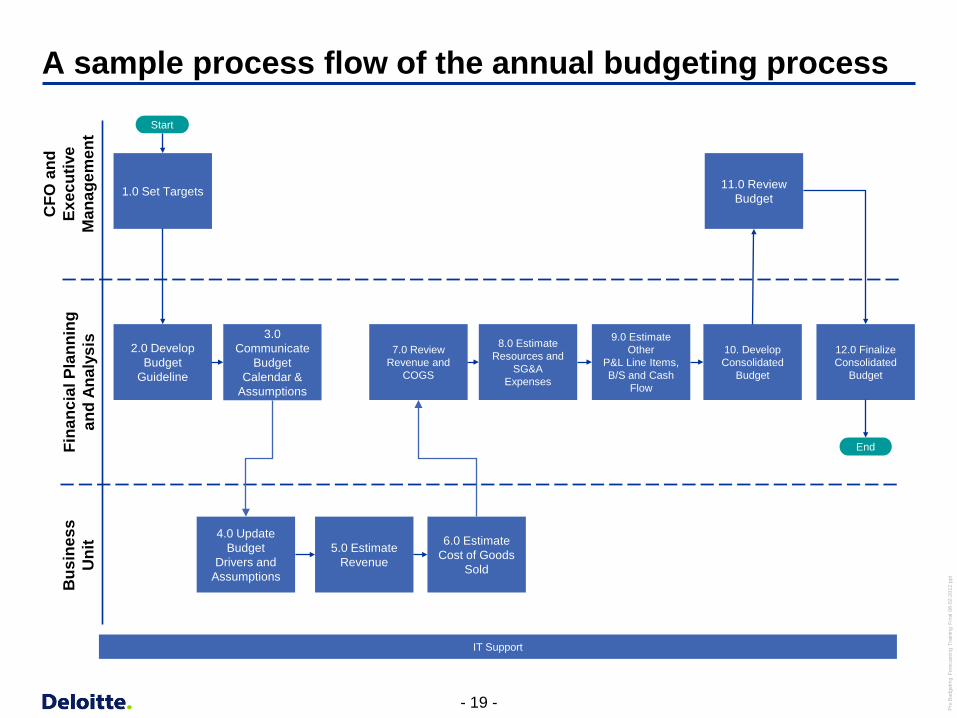
A sample process flow of the annual budgeting process C
FO a
nd
Exec
utiv
e M
anag
emen
t Fi
nanc
ial P
lann
ing
and
Anal
ysis
Start
11.0 Review Budget
End
3.0 Communicate
Budget Calendar &
Assumptions
2.0 Develop Budget
Guideline
4.0 Update Budget
Drivers and Assumptions
5.0 Estimate Revenue
6.0 Estimate Cost of Goods
Sold
Bus
ines
s U
nit
1.0 Set Targets
9.0 Estimate Other
P&L Line Items, B/S and Cash
Flow
8.0 Estimate Resources and
SG&A Expenses
10. Develop Consolidated
Budget
7.0 Review Revenue and
COGS
12.0 Finalize Consolidated
Budget
IT Support

Interaction with Actuarial and Legal

- 21 - Pru
Bud
getin
g Fo
reca
stin
g Tr
aini
ng F
inal
08-
02-2
012.
ppt
Planning Budgeting Forecasting
Interaction of Actuarial and Legal with Finance
Strategic Planning Gather Data Prepare Budget Consolidate and Sign-Off
Periodic Forecasting
Updates
• Actuarial provides input into the Reinsurance and Insurance strategic planning process including loss reserve and IBNR
• Legal provides guidance to the strategic planning process on the impact of current and projected statutory, regulatory and compliance requirements
• Actuarial and Legal receive standard budget template from Corporate
• Actuarial gathers data and Actuarial department budget
• Legal gathers data for Legal department budget
• Actuarial provides guidance in Reinsurance and Insurance UW budget preparation on loss reserves and IBNR
• Legal provides guidance in Insurance and Reinsurance budget preparation on areas such as regulatory, compliance and capital reserves
• Actuarial prepares budget for the department using data gathered
• Legal prepares budget for the department using data gathered
• Actuarial reviews the consolidated Insurance and Reinsurance UW budget for accuracy and provides sign-off
• Legal reviews the consolidated Insurance and Reinsurance budgets to ensure compliance and provides sign-off
• Actuarial performs valuation and analysis on loss reserves and IBNR and prepares projections for Insurance and Reinsurance forecasts
• Actuarial reviews and signs-off on Insurance and Reinsurance forecasts
• Legal analyzes impact of legal and regulatory and provides input to the forecasting process
• Actuarial and Legal prepare departmental forecasts

- 22 - Pru
Bud
getin
g Fo
reca
stin
g Tr
aini
ng F
inal
08-
02-2
012.
ppt
Actuarial and Legal Roles in Finance
Key Activities:
Actuarial Reviews and provides sign-off on the budgets on insurance and reinsurance sections of planning,
budgeting & forecasting
Performs valuation and projection work for forecasting and close processes (e.g., IBNR)
Produces management reports (e.g. Global Premium Report for Actuarial)
Creates of supporting schedules (e.g. Schedule P for Statutory Reporting)
Legal Reviews and communicates loss reserves to Finance as part of the forecasting process
Provides advice on and ensures compliance with regulatory requirements (e.g., Solvency II)
, Impact on the Planning, Budgeting and Forecasting Process Actuarial valuation and projection work may be performed using a combination of vendor systems, in-
house systems and spreadsheets which may lead to a long financial forecasting and close
Changes in regulatory and compliance environments, particularly around capital and reserve requirements can have a major impact in the planning, budgeting and forecasting process, making Legal a critical partner in the planning, budgeting and forecasting process

BREAK

PBF Practices
- 25 - Pru
Bud
getin
g Fo
reca
stin
g Tr
aini
ng F
inal
08-
02-2
012.
ppt
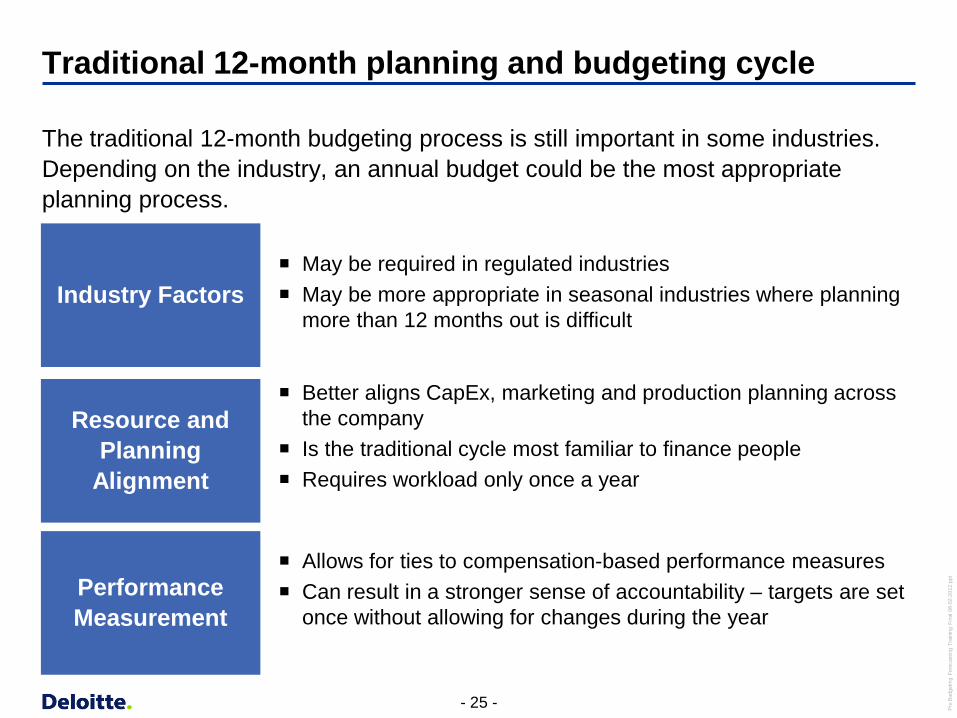
Traditional 12-month planning and budgeting cycle
The traditional 12-month budgeting process is still important in some industries. Depending on the industry, an annual budget could be the most appropriate planning process.
Industry Factors
Performance Measurement
Resource and Planning
Alignment
May be required in regulated industries May be more appropriate in seasonal industries where planning
more than 12 months out is difficult
Allows for ties to compensation-based performance measures Can result in a stronger sense of accountability – targets are set
once without allowing for changes during the year
Better aligns CapEx, marketing and production planning across the company
Is the traditional cycle most familiar to finance people Requires workload only once a year

- 26 - Pru
Bud
getin
g Fo
reca
stin
g Tr
aini
ng F
inal
08-
02-2
012.
ppt
Issues with traditional 12-month planning and budgeting
Jack Welch, former Chief Executive Officer (CEO) of General Electric, has called the annual budgeting process the “bane of corporate America” and Bob Lutz, Vice Chairman of Chrysler, has referred to it as a “tool of repression”
Too Historically
Focused
Treated as an Isolated Event
Provides Limited Visibility
Issues with a Typical 12-Month Planning Cycle
Annual budgets have a very short shelf life and are overly focused on the past
Rolling forecasts focus on creating a realistic view of the future, allowing leadership to quickly react to changing environments
Annual budgets create an artificial barrier at year-end, and there is little insight gained beyond the current year. This limited view can lead to unproductive actions management to hit numbers or spend budget
Rolling forecasts continually provide an updated assessment of progress the against medium term goals that drive firm value
Traditional budget processes consume significant leadership headspace in the 3rd quarter, but are rarely evaluated more than once per year
Rolling forecasts are typically refreshed at least once per quarter, allowing managers to learn from their forecast record, and to refine forecasting techniques and assumptions

- 27 - Pru
Bud
getin
g Fo
reca
stin
g Tr
aini
ng F
inal
08-
02-2
012.
ppt
Other planning, budgeting & forecasting practices
PBF Practice Key Feature Benefits
1 Rolling Forecasts
Expansion of forecast horizon beyond current fiscal year
Better insights into market conditions and expected performance
2 Driver Based Planning
Development of planning models based on major internal and external drivers that impact performance
More accurate plans and better insight into performance drivers
3 Capital Budgeting
Focuses capital spend on projects or initiatives that drive value
Better return on investment for key initiatives
4 Scenario Analysis
Using various assumptions to gauge bottom line impact
Better decision-making that includes consideration of all business scenarios
- 28 - Pru
Bud
getin
g Fo
reca
stin
g Tr
aini
ng F
inal
08-
02-2
012.
ppt
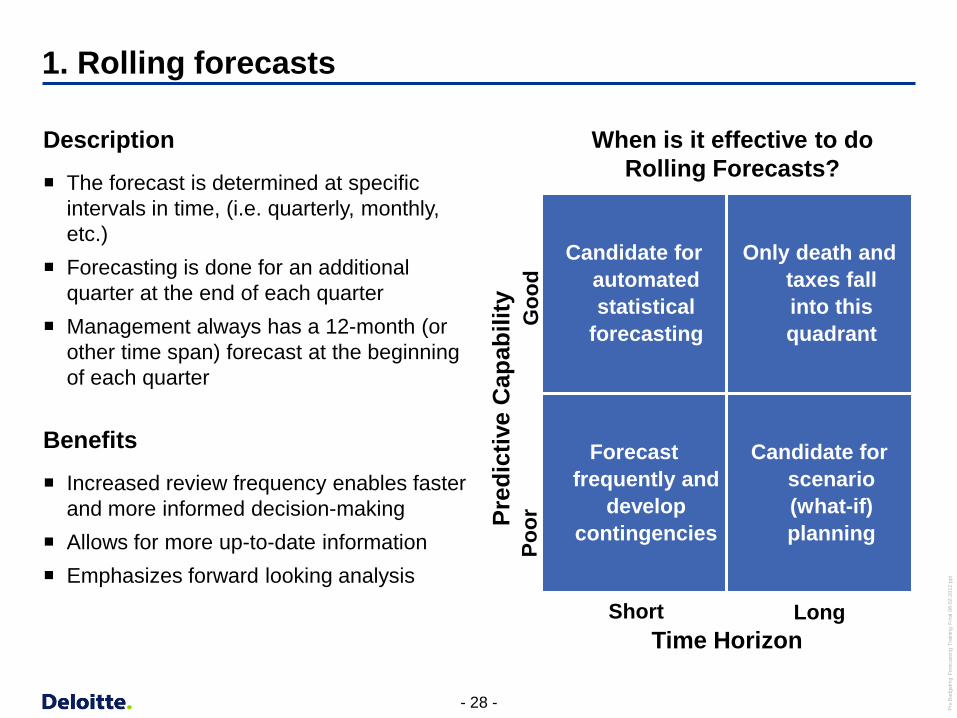
1. Rolling forecasts
Description
The forecast is determined at specific intervals in time, (i.e. quarterly, monthly, etc.)
Forecasting is done for an additional quarter at the end of each quarter
Management always has a 12-month (or other time span) forecast at the beginning of each quarter
Benefits
Increased review frequency enables faster and more informed decision-making
Allows for more up-to-date information Emphasizes forward looking analysis
Candidate for automated statistical
forecasting
Only death and taxes fall into this quadrant
Forecast frequently and
develop contingencies
Candidate for scenario (what-if) planning
When is it effective to do Rolling Forecasts?
Pred
ictiv
e C
apab
ility
Time Horizon Short Long
Goo
d Po
or
- 29 - Pru
Bud
getin
g Fo
reca
stin
g Tr
aini
ng F
inal
08-
02-2
012.
ppt
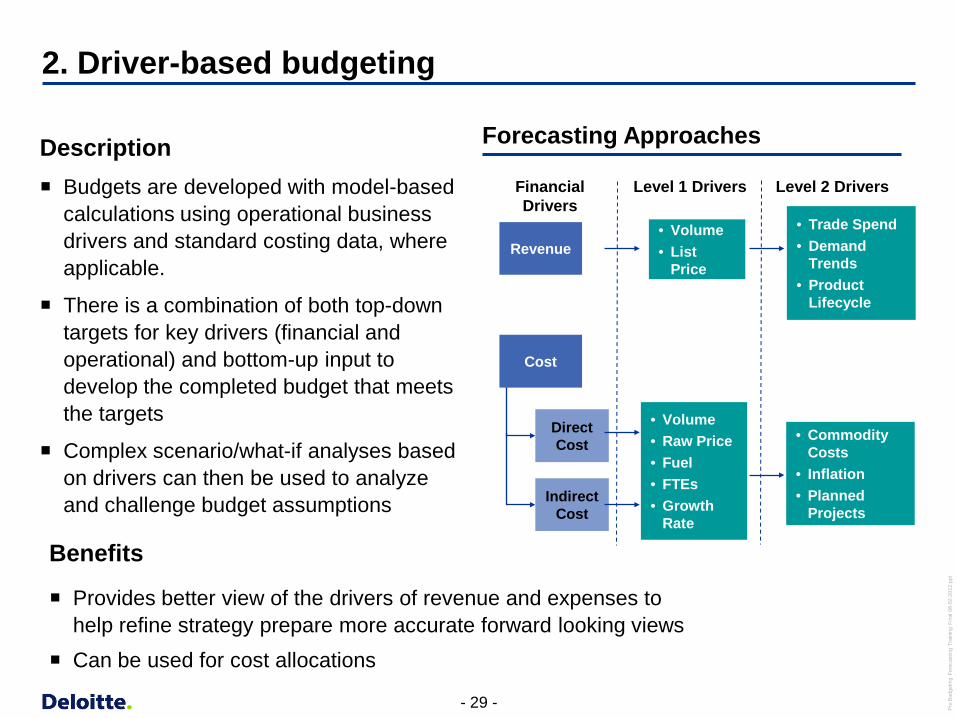
2. Driver-based budgeting
Revenue
Direct Cost
Indirect Cost
Financial Drivers
Level 1 Drivers Level 2 Drivers
• Volume • List
Price
• Volume • Raw Price • Fuel • FTEs • Growth
Rate
• Trade Spend • Demand
Trends • Product
Lifecycle
• Commodity Costs
• Inflation • Planned
Projects
Cost
Description Budgets are developed with model-based
calculations using operational business drivers and standard costing data, where applicable.
There is a combination of both top-down targets for key drivers (financial and operational) and bottom-up input to develop the completed budget that meets the targets
Complex scenario/what-if analyses based on drivers can then be used to analyze and challenge budget assumptions
Forecasting Approaches
Benefits
Provides better view of the drivers of revenue and expenses to help refine strategy prepare more accurate forward looking views
Can be used for cost allocations

- 30 - Pru
Bud
getin
g Fo
reca
stin
g Tr
aini
ng F
inal
08-
02-2
012.
ppt
2. Driver-based budgeting (contd.)
Cost Driver Cost Category
Total Subscribers
Gross Adds Deactivations
Handset Exchanges
Minutes of Use (MOUs)
Handset Upgrades
Calls to Care (Internal)
Service Plan Revenue
Long Distance MOUs
Cell Sites Calls to Care (Outsourced)
Equi
pmen
t Pro
gram
s (L
aker
u)
Cos
t: 50
%
Rev
enue
: 49%
Bad
Deb
t Exp
ense
(Kirk
patri
ck)
Cos
t of L
D &
Tol
l (R
ay)
CC
Out
sour
cing
(Nok
es)
Cre
dit C
ard
Fees
(Kirk
patri
ck)
Bank
Fee
s (K
irkpa
trick
)
Nat
iona
l Net
wor
k (R
ay)
Usa
ge –
Var
iabl
e (R
ay)
Usa
ge R
ecip
roca
l Com
p (R
ay)
Dire
ctor
y As
sist
ance
(Ray
)
Upg
rade
Pro
gram
s (B
utle
r)
Dat
a C
onte
nt E
xpen
se (B
rodm
an)
Varia
ble
Equi
pmen
t Los
s R
etai
l: 91
%
Dea
ler/V
AR: 8
09%
C
onsu
mer
Dire
ct: 6
4%
Nat
iona
l Ret
ail:
75%
Bu
sine
ss: 7
0%
Ret
entio
n C
omm
issi
ons
(Inza
)
Line
Ser
vice
Fix
ed (R
ay)
Util
ities
(Ray
)
Leas
es &
Ren
t (R
ay)
Parts
, Sup
plie
s, L
abor
& M
aint
(Ray
)
Mis
cella
neou
s C
ust S
uppo
rt (N
okes
)
Cus
tom
er C
are
Telc
o (S
trick
land
)
Billi
ng S
ervi
ces
(Stri
ckla
nd)
Dire
ct C
omm
issi
ons
(Nok
es)
Coo
p/M
DF
Expe
nse
(Nok
es)
Agen
t Com
mis
sion
s (N
okes
)
Mis
cella
neou
s –
Activ
atio
ns (N
okes
)
Dire
ct A
ct F
ees
(Nok
es)
CC
/FS
Payr
oll (
Nok
es)
Call Center FTEs
Handsets Sold
Example:
- 31 - Pru
Bud
getin
g Fo
reca
stin
g Tr
aini
ng F
inal
08-
02-2
012.
ppt
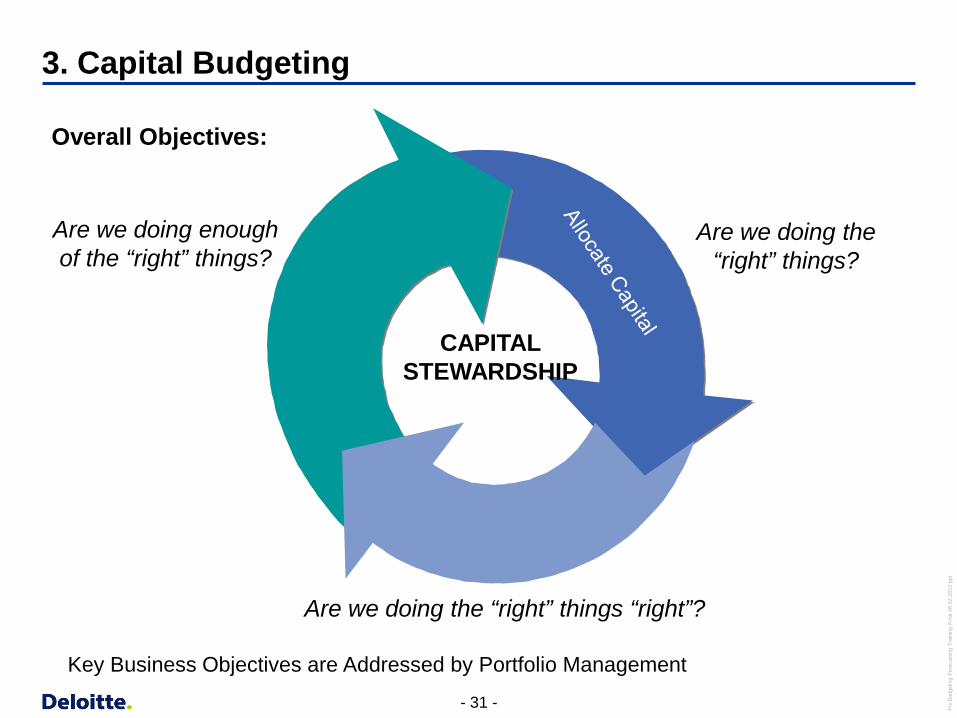
Are we doing the “right” things?
Are we doing the “right” things “right”?
Are we doing enough of the “right” things?
3. Capital Budgeting
Manage Capital
Outlay
CAPITAL STEWARDSHIP
Overall Objectives:
Key Business Objectives are Addressed by Portfolio Management

- 32 - Pru
Bud
getin
g Fo
reca
stin
g Tr
aini
ng F
inal
08-
02-2
012.
ppt
With finite resources, capital, and time, how can an organization better manage the capital allocation and alignment of work with strategic imperatives?
Manage Capital Outlay • Gain visibility to project portfolio • Manage project execution
2
Allocate Capital • Align your investments with
business strategy • Make the right choices when
prioritizing investments
1
Optimize Capital Outlay • Review and reprioritize projects • Reallocate and redistribute
resources and capital
3
3. Capital Budgeting (contd.)
- 33 - Pru
Bud
getin
g Fo
reca
stin
g Tr
aini
ng F
inal
08-
02-2
012.
ppt
4. Scenario Analysis
Description
Involves the ability to adjust the budget or forecast based on different assumptions and drivers
Executive management or Financial Planning and Analysis will request additional versions of the budget or forecast
Drivers and assumptions are updated and the resulting budget/forecast is analyzed
Benefits
Automated budgeting and planning tools allow for quickly consolidating results. Many applications are built to support this need with multiple versions and associated naming convention
Multiple scenarios allow management to see the bottom line impact of different assumptions and drivers, allowing them to make better decisions and set priorities
Data and Tools

- 35 - Pru
Bud
getin
g Fo
reca
stin
g Tr
aini
ng F
inal
08-
02-2
012.
ppt
A data structure exists to support PBF
Chart of Accounts
The accounts used for budgeting, planning, and forecasting can be at a summarized level (i.e. 75 accounts)
The accounts can also be the entire chart of accounts from the ERP ledger
Dimensions
Various dimensions can be used to build data calculations at many levels of detail.
Dimensions can support robust and transparent reporting of data
Roll-ups and Hierarchies
The entity structure of an organization (i.e. cost centers and departments) shapes the structure of the entity hierarchy used in budgeting, planning, and forecasting
The components that make up the data structure of planning, budgeting, and forecasting are:
Attributes
An attribute is a ‘flag’ on a dimension that allows for additional information to be captured
The use of attributes greatly increases the robustness of reporting

- 36 - Pru
Bud
getin
g Fo
reca
stin
g Tr
aini
ng F
inal
08-
02-2
012.
ppt
The chart of accounts is dictated by several factors
The chart of accounts from the ERP system is often used as a starting point for the chart of accounts in the budgeting/forecasting tool
Below is a high-level example of an online travel services firm:
Business Unit
20000 – Online Hotel
20001 – Online Flight Reservations
20002 – Hotel Reservations Network
Department
400 – Customer Care
401 – Hotel Processing
402 – Corporate Travel Account
50001 – Salaries
50002 – Commissions
50003 – Bonus
- 37 - Pru
Bud
getin
g Fo
reca
stin
g Tr
aini
ng F
inal
08-
02-2
012.
ppt
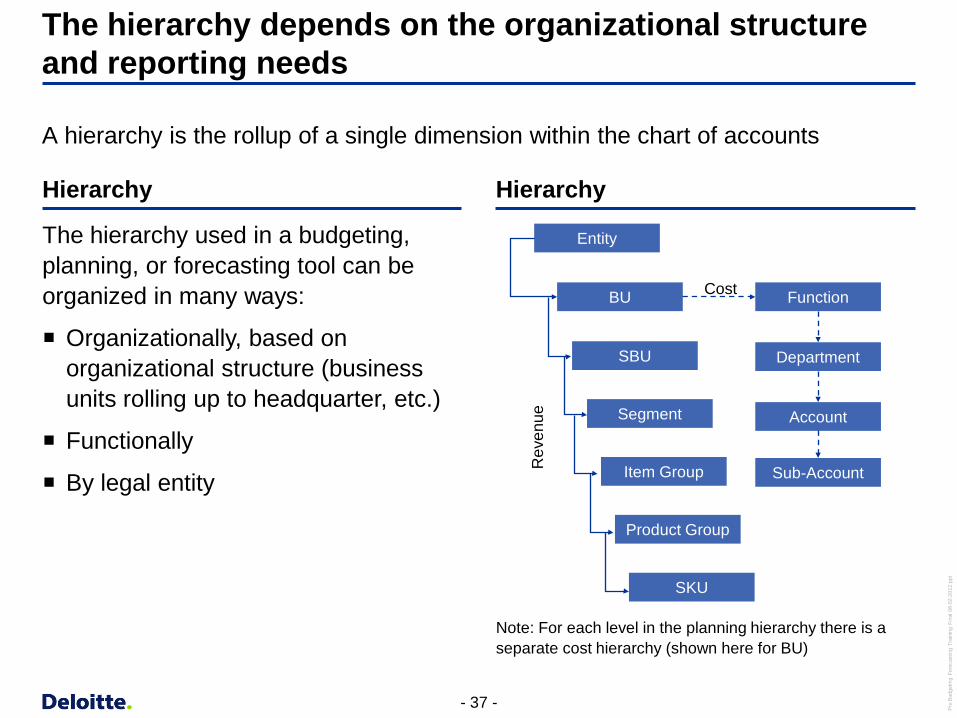
The hierarchy depends on the organizational structure and reporting needs
Hierarchy
The hierarchy used in a budgeting, planning, or forecasting tool can be organized in many ways:
Organizationally, based on organizational structure (business units rolling up to headquarter, etc.)
Functionally
By legal entity
A hierarchy is the rollup of a single dimension within the chart of accounts
Entity
BU
SBU
Segment
Item Group
Product Group
SKU
Function
Department
Account
Sub-Account
Cost
Rev
enue
Note: For each level in the planning hierarchy there is a separate cost hierarchy (shown here for BU)
Hierarchy
- 38 - Pru
Bud
getin
g Fo
reca
stin
g Tr
aini
ng F
inal
08-
02-2
012.
ppt
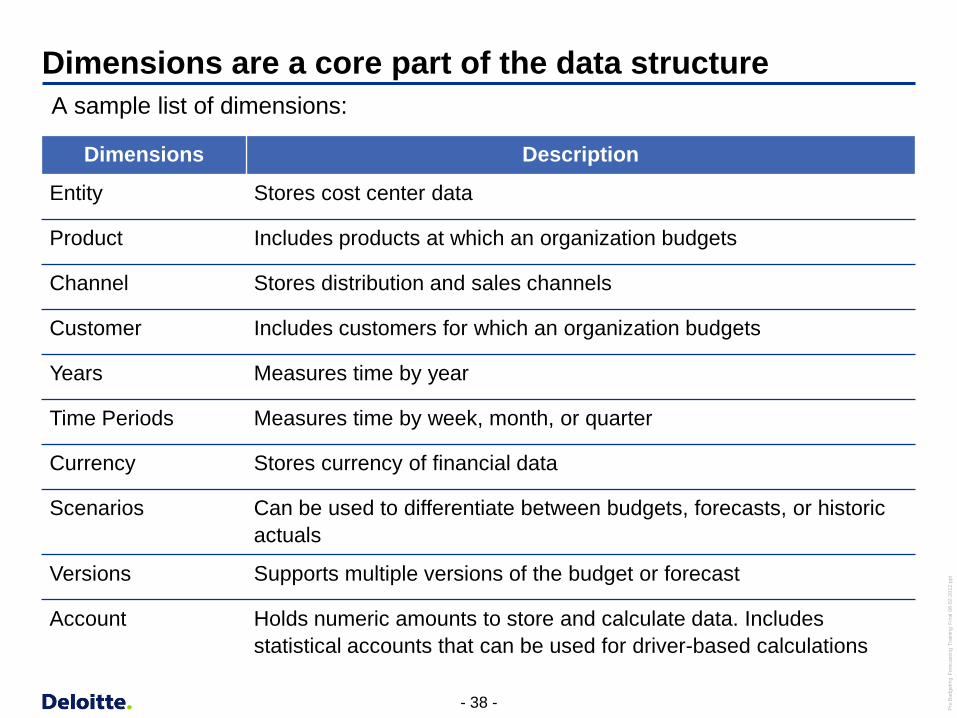
Dimensions are a core part of the data structure
Dimensions Description
Entity Stores cost center data
Product Includes products at which an organization budgets
Channel Stores distribution and sales channels
Customer Includes customers for which an organization budgets
Years Measures time by year
Time Periods Measures time by week, month, or quarter
Currency Stores currency of financial data
Scenarios Can be used to differentiate between budgets, forecasts, or historic actuals
Versions Supports multiple versions of the budget or forecast
Account Holds numeric amounts to store and calculate data. Includes statistical accounts that can be used for driver-based calculations
A sample list of dimensions:

- 39 - Pru
Bud
getin
g Fo
reca
stin
g Tr
aini
ng F
inal
08-
02-2
012.
ppt
The dimensions intersect to provide meaningful data
The intersection of all dimensions is where data is stored and calculated. For example, viewing the combination of the following dimensions gives the Budget version 2 January sale in US dollars for the Music Download Service sold to Jane Smith through the Direct Online channel
Entity: Premium Services
Product: Music Download Service
Channel: Direct Online
Customer: Jane Smith
Year: FY08
Time Period: January
Currency: USD
Scenario: BUD08
Version: v2
Account: Subscription Revenue
Other Performance Equipment
Sports Apparel Foot ware
base
ball
Hoc
key
Run
ning
Bas
ketb
all
Gol
f
Cha
nnel
s
Other Voice Services
Data Services Music Download
Com
pany
Sto
res
Ret
ail P
artn
ers
Kio
sks
Onl
ine
Part
ners
Dire
ct O
nlin
e
- 40 - Pru
Bud
getin
g Fo
reca
stin
g Tr
aini
ng F
inal
08-
02-2
012.
ppt
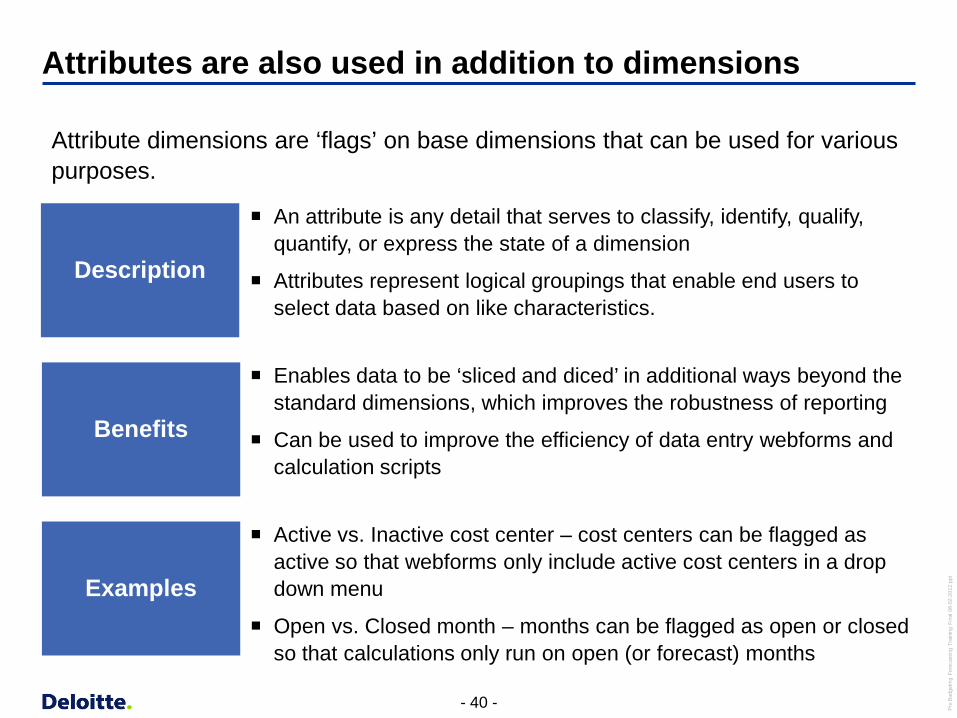
Attributes are also used in addition to dimensions
Description
An attribute is any detail that serves to classify, identify, qualify, quantify, or express the state of a dimension
Attributes represent logical groupings that enable end users to select data based on like characteristics.
Examples
Active vs. Inactive cost center – cost centers can be flagged as active so that webforms only include active cost centers in a drop down menu
Open vs. Closed month – months can be flagged as open or closed so that calculations only run on open (or forecast) months
Benefits
Enables data to be ‘sliced and diced’ in additional ways beyond the standard dimensions, which improves the robustness of reporting
Can be used to improve the efficiency of data entry webforms and calculation scripts
Attribute dimensions are ‘flags’ on base dimensions that can be used for various purposes.
- 41 - Pru
Bud
getin
g Fo
reca
stin
g Tr
aini
ng F
inal
08-
02-2
012.
ppt
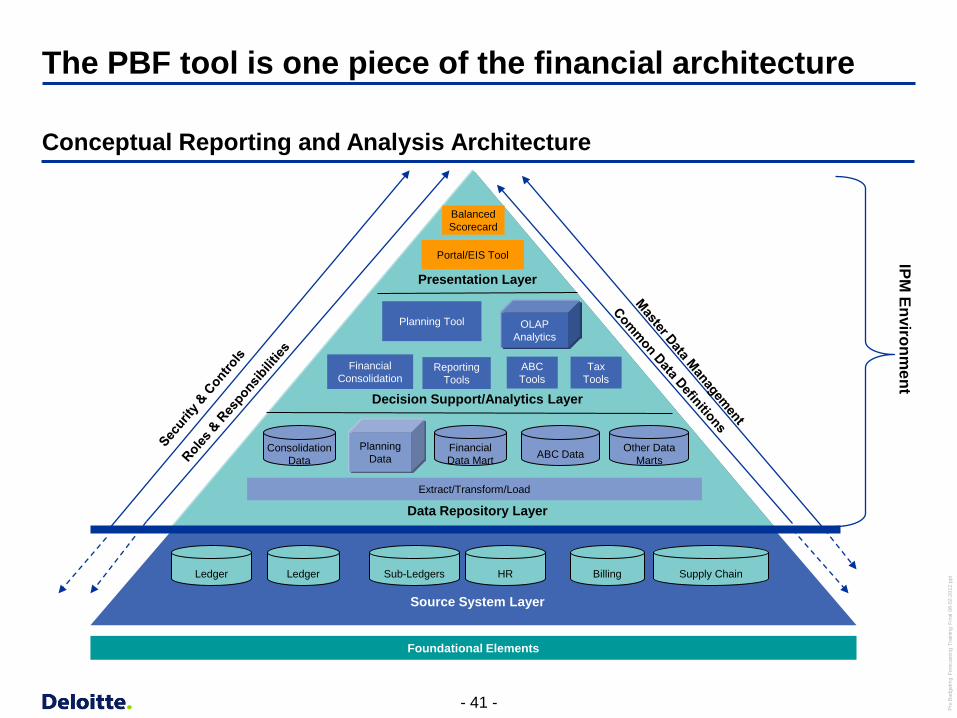
The PBF tool is one piece of the financial architecture
OLAP Analytics
Ledger Sub-Ledgers Billing Supply Chain Ledger
Planning Tool
Portal/EIS Tool
Financial Consolidation
Reporting Tools
Presentation Layer
Source System Layer
Data Repository Layer
Decision Support/Analytics Layer
HR
Extract/Transform/Load
Balanced Scorecard
Financial Data Mart
Other Data Marts ABC Data Consolidation
Data Planning
Data
ABC Tools
Foundational Elements
Tax Tools
IPM Environm
ent
Conceptual Reporting and Analysis Architecture
- 42 - Pru
Bud
getin
g Fo
reca
stin
g Tr
aini
ng F
inal
08-
02-2
012.
ppt
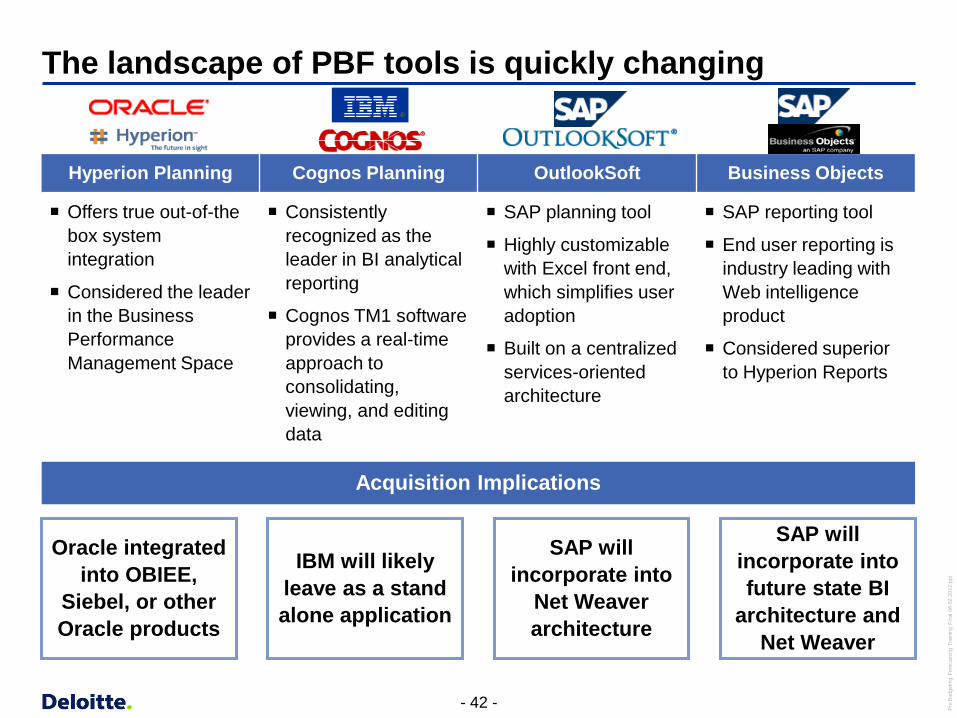
The landscape of PBF tools is quickly changing
Hyperion Planning Cognos Planning OutlookSoft Business Objects
Offers true out-of-the box system integration
Considered the leader in the Business Performance Management Space
Consistently recognized as the leader in BI analytical reporting
Cognos TM1 software provides a real-time approach to consolidating, viewing, and editing data
SAP planning tool
Highly customizable with Excel front end, which simplifies user adoption
Built on a centralized services-oriented architecture
SAP reporting tool
End user reporting is industry leading with Web intelligence product
Considered superior to Hyperion Reports
IBM will likely leave as a stand alone application
SAP will incorporate into
Net Weaver architecture
Oracle integrated into OBIEE,
Siebel, or other Oracle products
SAP will incorporate into future state BI
architecture and Net Weaver
Acquisition Implications

- 43 - Pru
Bud
getin
g Fo
reca
stin
g Tr
aini
ng F
inal
08-
02-2
012.
ppt
Exercise
- 44 - Pru
Bud
getin
g Fo
reca
stin
g Tr
aini
ng F
inal
08-
02-2
012.
ppt
Budget to Actuals Analysis
Instructions
Now that you understand the fundamentals of the PBF process, think about the information generated from the process.
Review the budget to actual variance handout. This is a sample variance analysis from a telecom company
Review the three highlighted variances
Consider the causes of the variances between budgeted and actual amounts. Consider all factors (internal and external), including the underlying driver of the revenue/cost
After five minutes, discuss your thoughts on the variances with the class
- 45 - Pru
Bud
getin
g Fo
reca
stin
g Tr
aini
ng F
inal
08-
02-2
012.
ppt
Q&A

Copyright © 2008 Deloitte Development LLC. All rights reserved.


