46
FINANCE & BIODIVERSITY UNDERSTANDING AND ACTING
FINANCE & BIODIVERSITYUNDERSTANDING AND ACTING

2 FINANCE & BIODIVERSITY
CONTENTS
INTRODUCTION � � � � � � � � � � � � � � � � � � � � � � � � � � � � � � � � � � � � � � � � � � � � � � � � � � � � � � � � � � � � � � � � � � � � � � � � � � � � � � � 3
A WORD FROM THE MINISTER � � � � � � � � � � � � � � � � � � � � � � � � � � � � � � � � � � � � � � � � � � � � � � � � � � � � � � � � � � � � � � � � � � 4
BIODIVERSITY AND ITS CHALLENGES � � � � � � � � � � � � � � � � � � � � � � � � � � � � � � � � � � � � � � � � � � � � � � � � � � � � � � � � � � � 5
Key concepts � � � � � � � � � � � � � � � � � � � � � � � � � � � � � � � � � � � � � � � � � � � � � � � � � � � � � � � � � � � � � � � � � � � � � � � � � � � � � � � � � � � � � � � � � � � �5Box 1 : The social value of biodiversity
The sixth mass extinction � � � � � � � � � � � � � � � � � � � � � � � � � � � � � � � � � � � � � � � � � � � � � � � � � � � � � � � � � � � � � � � � � � � � � � � � � � � � � � � �7 The global decline in biodiversity
Box 2: The sixth mass extinction in figures The development of the concept of conservation The degradation of ecosystem services
Box 3: Biodiversity and the emergence of pandemicsBox 4: Beyond an anthropocentric approach to the value of biodiversity
The spillover effects of the biodiversity crisis on the climate
Direct causes of biodiversity loss � � � � � � � � � � � � � � � � � � � � � � � � � � � � � � � � � � � � � � � � � � � � � � � � � � � � � � � � � � � � � � � � � � � � � � � 13 Habitat destruction and disturbance Climate change Overexploitation of resources Pollution
Box 5: Nitrate pollution from agricultural sources The proliferation of invasive species
Box 6: Vulnerability of island systems
Business-related issues in biodiversity loss � � � � � � � � � � � � � � � � � � � � � � � � � � � � � � � � � � � � � � � � � � � � � � � � � � � � � � � � � � � � � � 18 Companies’ responsibility in the biodiversity crisis
The international biodiversity conservation agenda � � � � � � � � � � � � � � � � � � � � � � � � � � � � � � � � � � � � � � � � � � � � � � � � � � � � � � 21
THE ROLE OF INVESTORS IN BIODIVERSITY CONSERVATION � � � � � � � � � � � � � � � � � � � � � � � � � � � � � � � � � � � � � � 23
Conservation finance � � � � � � � � � � � � � � � � � � � � � � � � � � � � � � � � � � � � � � � � � � � � � � � � � � � � � � � � � � � � � � � � � � � � � � � � � � � � � � � � � � � 23 Biodiversity has a very significant economic value
Box 7: Academic focus: the value of ecosystem services "Conservation and Restoration Finance" actors Financial flows well below requirements
The increasing mobilisation of investors � � � � � � � � � � � � � � � � � � � � � � � � � � � � � � � � � � � � � � � � � � � � � � � � � � � � � � � � � � � � � � � � � 27 The rise in initiatives A rapidly evolving regulatory framework
Biodiversity investment approaches � � � � � � � � � � � � � � � � � � � � � � � � � � � � � � � � � � � � � � � � � � � � � � � � � � � � � � � � � � � � � � � � � � � � 31 Investing in projects with sustainable agricultural or forestry production
Box 8: A benchmark case for investing in ecosystem restoration Investing in certificate systems that value environmental or climate conservation
Box 9: Investing in natural capital: two example strategies
Perspectives for the development of biodiversity investments � � � � � � � � � � � � � � � � � � � � � � � � � � � � � � � � � � � � � � � � � � � 34
QUANTITATIVE MEASURES OF BIODIVERSITY � � � � � � � � � � � � � � � � � � � � � � � � � � � � � � � � � � � � � � � � � � � � � � � � � � � 35
Why biodiversity measurement is needed � � � � � � � � � � � � � � � � � � � � � � � � � � � � � � � � � � � � � � � � � � � � � � � � � � � � � � � � � � � � � � � � 35
Which metrics should we use to measure biodiversity? � � � � � � � � � � � � � � � � � � � � � � � � � � � � � � � � � � � � � � � � � � � � � � � � � � 36 Review of existing metrics in the scientific literature What do investors need?
Review of existing methods for measuring the biodiversity footprint � � � � � � � � � � � � � � � � � � � � � � � � � � � � � � � � � � � � � � 38
Limitations of a single quantitative measure � � � � � � � � � � � � � � � � � � � � � � � � � � � � � � � � � � � � � � � � � � � � � � � � � � � � � � � � � � � � 39
Setting a benchmark trajectory as a shared objective � � � � � � � � � � � � � � � � � � � � � � � � � � � � � � � � � � � � � � � � � � � � � � � � � � � 39
Box 10: Assessing the biodiversity footprint of an investment portfolio � � � � � � � � � � � � � � � � � � � � � � � � � � � � � � � � � � � � � � � � 40
GLOSSARY � � � � � � � � � � � � � � � � � � � � � � � � � � � � � � � � � � � � � � � � � � � � � � � � � � � � � � � � � � � � � � � � � � � � � � � � � � � � � � � � � � 42
REFERENCES � � � � � � � � � � � � � � � � � � � � � � � � � � � � � � � � � � � � � � � � � � � � � � � � � � � � � � � � � � � � � � � � � � � � � � � � � � � � � � � � 43
ACKNOWLEDGEMENTS � � � � � � � � � � � � � � � � � � � � � � � � � � � � � � � � � � � � � � � � � � � � � � � � � � � � � � � � � � � � � � � � � � � � � � 45

FINANCE & BIODIVERSITY 3
The publication of this handbook comes between two important international meetings, the IUCN Congress, which has just closed in Marseille, and the COP 15, which will conclude in China in the spring of 2022.
The agendas of these conferences reflect a global awareness of the impact of biodiversity loss, described as the sixth mass extinction of species. This collapse is accelerating as a result of human activities, which has led the international community to react and to amend the regulatory framework, taking into account the specific responsibility of investors.
In France, Article 29 of the Energy-Climate Law, which has just come into force, extends the “climate” framework of Article 173 of the Energy Transition for Green Growth Law to biodiversity conservation. The European regulatory framework, for its part, encourages investors to integrate the impact and dependence of their investments on environmental dimensions, which is now naturally extended to the preservation of biodiversity.
Managing this impact is nevertheless complex and the financial sector is at the beginning of its learning curve on this issue. Academic partnerships, training and the development of innovative tools will be necessary to enable investors to play their role of prompting responsible behaviour.
The lessons learned over the past five years in addressing climate issues, which have seen dramatic developments, will be useful and give us reason to be confident about the role that the financial sector can play.
The French SIF and the Iceberg Data Lab have therefore prepared this handbook, which aims to provide the public with an informative presentation of the state of knowledge and practices on this new topic.
It is an invitation to view the conservation of natural capital, not as a cost but as a source of investment in a more sustainable future, allowing the harmonious coexistence of human civilisation and the natural world.
INTRODUCTION
Alexis MassePresident of the French SIF
Matthieu MaurinCEO of Iceberg Data Lab
4 FINANCE & BIODIVERSITY
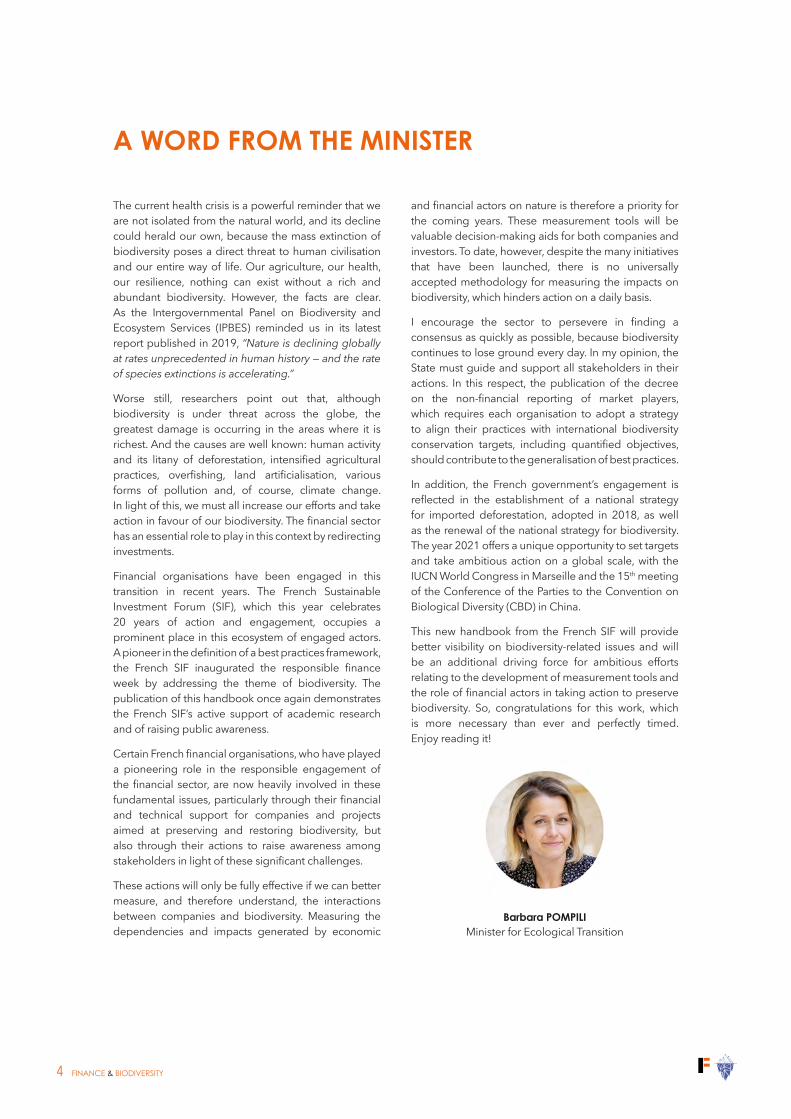
The current health crisis is a powerful reminder that we are not isolated from the natural world, and its decline could herald our own, because the mass extinction of biodiversity poses a direct threat to human civilisation and our entire way of life. Our agriculture, our health, our resilience, nothing can exist without a rich and abundant biodiversity. However, the facts are clear. As the Intergovernmental Panel on Biodiversity and Ecosystem Services (IPBES) reminded us in its latest report published in 2019, “Nature is declining globally at rates unprecedented in human history — and the rate of species extinctions is accelerating.”
Worse still, researchers point out that, although biodiversity is under threat across the globe, the greatest damage is occurring in the areas where it is richest. And the causes are well known: human activity and its litany of deforestation, intensified agricultural practices, overfishing, land artificialisation, various forms of pollution and, of course, climate change. In light of this, we must all increase our efforts and take action in favour of our biodiversity. The financial sector has an essential role to play in this context by redirecting investments.
Financial organisations have been engaged in this transition in recent years. The French Sustainable Investment Forum (SIF), which this year celebrates 20 years of action and engagement, occupies a prominent place in this ecosystem of engaged actors. A pioneer in the definition of a best practices framework, the French SIF inaugurated the responsible finance week by addressing the theme of biodiversity. The publication of this handbook once again demonstrates the French SIF’s active support of academic research and of raising public awareness.
Certain French financial organisations, who have played a pioneering role in the responsible engagement of the financial sector, are now heavily involved in these fundamental issues, particularly through their financial and technical support for companies and projects aimed at preserving and restoring biodiversity, but also through their actions to raise awareness among stakeholders in light of these significant challenges.
These actions will only be fully effective if we can better measure, and therefore understand, the interactions between companies and biodiversity. Measuring the dependencies and impacts generated by economic
and financial actors on nature is therefore a priority for the coming years. These measurement tools will be valuable decision-making aids for both companies and investors. To date, however, despite the many initiatives that have been launched, there is no universally accepted methodology for measuring the impacts on biodiversity, which hinders action on a daily basis.
I encourage the sector to persevere in finding a consensus as quickly as possible, because biodiversity continues to lose ground every day. In my opinion, the State must guide and support all stakeholders in their actions. In this respect, the publication of the decree on the non-financial reporting of market players, which requires each organisation to adopt a strategy to align their practices with international biodiversity conservation targets, including quantified objectives, should contribute to the generalisation of best practices.
In addition, the French government’s engagement is reflected in the establishment of a national strategy for imported deforestation, adopted in 2018, as well as the renewal of the national strategy for biodiversity. The year 2021 offers a unique opportunity to set targets and take ambitious action on a global scale, with the IUCN World Congress in Marseille and the 15th meeting of the Conference of the Parties to the Convention on Biological Diversity (CBD) in China.
This new handbook from the French SIF will provide better visibility on biodiversity-related issues and will be an additional driving force for ambitious efforts relating to the development of measurement tools and the role of financial actors in taking action to preserve biodiversity. So, congratulations for this work, which is more necessary than ever and perfectly timed. Enjoy reading it!
Barbara POMPILI Minister for Ecological Transition
A WORD FROM THE MINISTER
FINANCE & BIODIVERSITY 5
BIODIVERSITY AND ITS CHALLENGES
KEY CONCEPTS
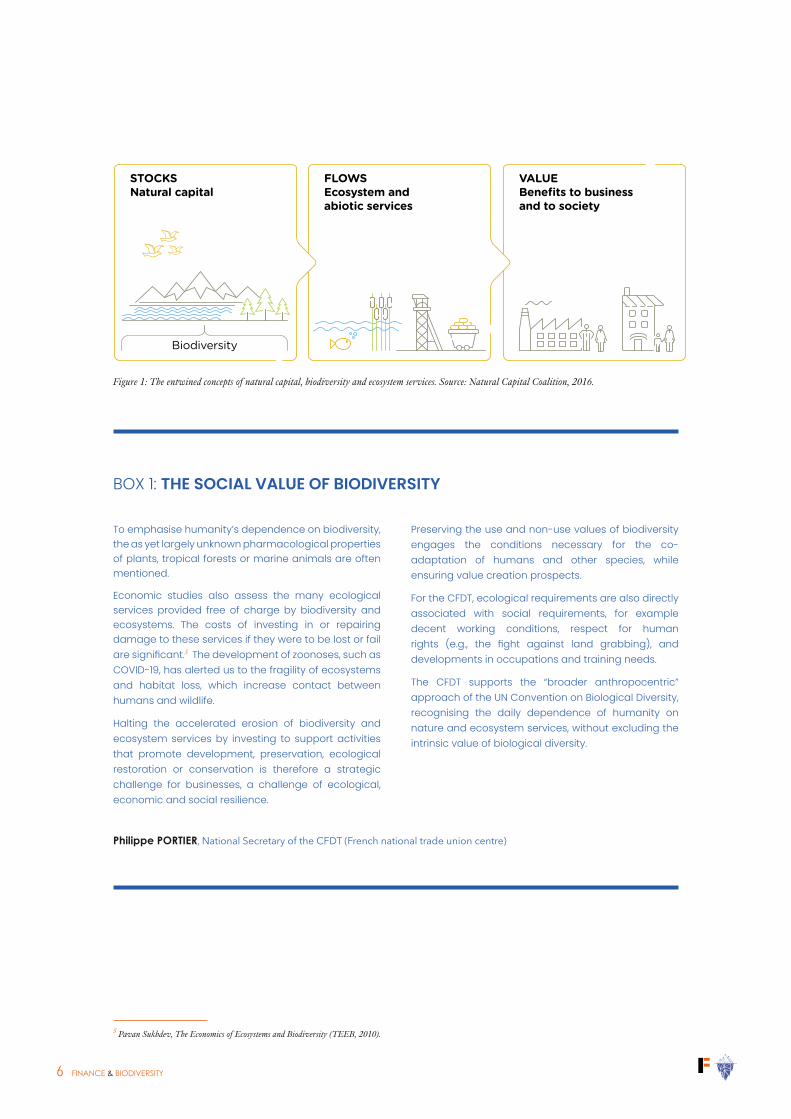
According to the United Nations Convention on Biological Diversity,1 biodiversity is defined as “the variability among living organisms from all sources including, inter alia, terrestrial, marine and other aquatic ecosystems and the ecological complexes of which they are part: this includes diversity within species, between species and of ecosystems.” Different concepts revolve around this notion of biodiversity and its benefits for society, including natural capital and ecosystem services (see Figure 1).
1 (United Nations 1992).2 (Natural Capital Coalition 2016).3 (Millennium Ecosystem Assessment 2005).4 https://www.ecologie.gouv.fr/sites/default/files/Th%C3%A9ma%20-%20Efese%20-%20Rapport%20interm%C3%A9diaire.pdf (in French).
• The Natural Capital Coalition defines natural capital as, “The stock of renewable and non-renewable natural resources (e.g., plants, animals, air, water, soils, minerals) that combine to yield a flow of benefits to people”.2
• Ecosystem and abiotic services are the benefits created by natural capital that people profit from. They were defined in 2005 by the Millennium Ecosystem Assessment.3
• They are divided into four sub-sets of services:
- supply (fresh water, natural fibres, agricultural products, genetic resources, etc.);
- regulation (of climate, air, water, erosion, disease);
- culture (recreational, spiritual, aesthetic, etc.); and
- support or self-maintenance (natural processes necessary for the production of other services, such as nutrient and water cycles, soil formation, etc.).
In France, the programme for valuing ecosystems and ecosystem services defines them as “the socio-economic benefits derived by humans from their sustainable use of the ecological functions of ecosystems”.4
The degradation of biodiversity therefore depletes the stock of natural capital, leading to a degradation of ecosystem services. This has serious consequences for human societies, including the loss of regulating services provided by ecosystems: climate regulation, diseases, pollination, erosion control, production of biomass or fibres, etc.
6 FINANCE & BIODIVERSITY
To emphasise humanity’s dependence on biodiversity, the as yet largely unknown pharmacological properties of plants, tropical forests or marine animals are often mentioned.
Economic studies also assess the many ecological services provided free of charge by biodiversity and ecosystems. The costs of investing in or repairing damage to these services if they were to be lost or fail are significant.5 The development of zoonoses, such as COVID-19, has alerted us to the fragility of ecosystems and habitat loss, which increase contact between humans and wildlife.
Halting the accelerated erosion of biodiversity and ecosystem services by investing to support activities that promote development, preservation, ecological restoration or conservation is therefore a strategic challenge for businesses, a challenge of ecological, economic and social resilience.
5 Pavan Sukhdev, The Economics of Ecosystems and Biodiversity (TEEB, 2010).
Preserving the use and non-use values of biodiversity engages the conditions necessary for the co-adaptation of humans and other species, while ensuring value creation prospects.
For the CFDT, ecological requirements are also directly associated with social requirements, for example decent working conditions, respect for human rights (e.g., the fight against land grabbing), and developments in occupations and training needs.
The CFDT supports the “broader anthropocentric” approach of the UN Convention on Biological Diversity, recognising the daily dependence of humanity on nature and ecosystem services, without excluding the intrinsic value of biological diversity.
12
1.2.1 Familiarize yourself with the basic concepts of natural capital This action introduces the basic concepts and definitions that you will need to advance through the Steps of the Protocol.
a. The foundational concepts of natural capital stocks and flows
Natural capital is another term for the stock of renewable and non-renewable natural resources on earth (e.g., plants, animals, air, water, soils, minerals) that combine to yield a flow of benefits or “services” to people (adapted from Atkinson and Pearce 1995; Jansson et al. 1994).
These flows can be ecosystem services or abiotic services, which provide value to business and to society (see figure 1.1).
Ecosystem services are the benefits to people from ecosystems, such as timber, fiber, pollination, water regulation, climate regulation, recreation, mental health, and others.
Abiotic services are benefits to people that do not depend on ecological processes but arise from fundamental geological processes and include the supply of minerals, metals, and oil and gas, as well as geothermal heat, wind, tides, and the annual seasons.
Biodiversity is critical to the health and stability of natural capital as it provides resilience to shocks like floods and droughts, and it supports fundamental processes such as the carbon and water cycles as well as soil formation. Therefore biodiversity is both a part of natural capital and also underpins ecosystem services.
Figure 1.1 Natural capital stocks, flows, and values
For the purposes of a natural capital assessment, the Protocol distinguishes between value to business and value to society. Clearly, this simplification does not reflect the reality that business is, in fact, wholly part of society.
Glossary Natural capital The stock of renewable and non- renewable natural resources (e.g., plants, animals, air, water, soils, minerals) that combine to yield a flow of benefits to people (adapted from Atkinson and Pearce 1995, Jansson et al. 1994).
Natural resourcesNatural resources encompass a range of materials occurring in nature that can be used for production and/or consumption.
• Renewable resources: These may be exploited indefinitely, provided the rate of exploitation does not exceed the rate of replacement, allowing stocks to rebuild (assuming no other significant disturbances). Renewable resources exploited faster than they can renew themselves may effectively become non-renewable, such as when over-harvesting drives species extinct (UN 1997).
• Non-renewable resources: These will not regenerate after exploitation within any useful time period. Non-renewable resources are sub-divided into reusable (e.g., most metals) and non-reusable (e.g., thermal coal).
VALUEBenefits to business and to society
FLOWSEcosystem and abiotic services
Biodiversity
STOCKSNatural capital
NATURAL CAPITAL PROTOCOL01 Get started
Figure 1: The entwined concepts of natural capital, biodiversity and ecosystem services. Source: Natural Capital Coalition, 2016.
BOX 1: THE SOCIAL VALUE OF BIODIVERSITY
Philippe PORTIER, National Secretary of the CFDT (French national trade union centre)

FINANCE & BIODIVERSITY 7
THE SIXTH MASS EXTINCTION
The global decline in biodiversity
Often called the sixth mass extinction, the current collapse of global biodiversity is one of the most significant threats to society.6 The alarming explosion in the rate of species extinction since the industrial revolution, as well as the continuing decline in survival rates seen in the IUCN Red List Index7 of threatened species across five major taxonomic groups, illustrated in Figure 2, measure the scale of this global phenomenon.8
6 (OECD 2019).7 https://www.iucnredlist.org/8 IPBES, ”Global assessment report on biodiversity and ecosystem services of the Intergovernmental Science-Policy Platform on Biodiversity and Ecosystem Services. E. S. Brondizio, J. Settele, S. Díaz, and H. T. Ngo (editors)”, 2019.9 A class of vascular plants.
For example, human activities have already caused the disappearance of about 680 vertebrate species since the 16th century and the different forms of life are now greatly threatened. The situation illustrated in Figure 3 is apocalyptic: on average, 63% of recorded cycad species,9 41% of amphibians, 36% of dicots, 35% of reptiles, 35% of conifers, and 33% of corals, sharks, rays and chimaera species are threatened with extinction, to name only the most affected groups.
THE GLOBAL ASSESSMENT REPORT ON BIODIVERSITY AND ECOSYSTEM SERVICES
26
SU
MM
AR
Y F
OR
PO
LIC
YM
AK
ER
S
Figure SPM 3 A substantial proportion of assessed species are threatened with extinction andoverall trends are deteriorating, with extinction rates increasing sharply in thepast century.
A Percentage of species threatened with extinction in taxonomic groups that have been assessed comprehensively, or through a ‘sampled’ approach, or for which selected subsets have been assessed, by the International Union for Conservation of Nature (IUCN) Red List of Threatened Species. Groups are ordered according to the best estimate for the percentage of extant species considered threatened (shown by the vertical blue lines), assuming that data deficient species are as threatened as non-data deficient species. B Extinctions since 1500 for vertebrate groups. Rates for reptiles and fishes have not been assessed for all species. C Red List
Index of species survival for taxonomic groups that have been assessed for the IUCN Red List at least twice. A value of 1 is equivalent to all species being categorized as Least Concern; a value of zero is equivalent to all species being classified as Extinct. Data for all panels derive from www.iucnredlist.org (see Chapter 3 Figure 3.4 and Chapter 2 Figure 2.7).
indigenous peoples and local communities, including farmers, pastoralists and herders, are often important areas for in situ conservation of the remaining varieties andbreeds (well established) {2.2.5.3.1}. Available data
suggest that genetic diversity within wild species globally has been declining by about 1 per cent per decade since the mid-19th century; and genetic diversity within wild mammals and amphibians tends to be lower in areas
Mammals
Birds
Fishes
Amphibians
Reptiles
Current global extinction risk in different species groups
0 10 20 30 40 50 60 70 80 90 100
Cycads*
Amphibians*
Dicots***
Reptiles**
Conifers*
Corals (reef-forming)*
Sharks and rays*
Crustaceans***
Mammals*
Birds*
Gastropods***
Bony fishes*** 2,390
633
972
1,026
10,966
5,593
2,872
1,500
1,520
845
607
1,091
1,781
PERCENTAGE OF SPECIES IN EACH CATEGORY
6,576
307
Total number of extantassessed species
Estimate of percentage threatened
*** Selected** Sampled* Comprehensive
Extinct in the Wild
Critically Endangered
Endangered
Vulnerable
Near Threatened
Least Concern
Data Deficient
Threatened
Non-threatened
2.5
2.0
1.5
1.0
0.5
0
Red
list
ind
ex o
f sp
ecie
s su
rviv
al
Cum
ulat
ive
% o
f sp
ecie
s d
riven
ext
inct
Cycads
Amphibians
Corals
Mammals
Birds
Declines in species survival since 1980(Red List Index)
Extinctions since 1500
YEAR YEAR
0.5
0.6
0.7
0.8
0.9
1.0
19801500 1600 1700 1800 1900 2018 1985 1990 1995 2000 2005 2010 2015
Cumulative % of species based on on background rate of 0.1-2 extinctions per million species per year
Monocots**
Ferns and relatives**
Dragonflies**
Better
BetterWorse
Worse
A
C
IUCN Red List categories
Greater extinction risk
A B
Figure 2: (A) Extinctions since 1500 for vertebrate groups. Rates for Reptiles and Fishes have not been assessed for all species. (B) Red List Index of species survival for taxonomic groups that have been assessed for the IUCN Red List at least twice. A value of 1 is equivalent to all species being categorised as Least Concern; a value of zero is equivalent to all species being classified as Extinct. Data for all panels derive from the IUCN Red List. www.iucnredlist.org.

8 FINANCE & BIODIVERSITY
THE GLOBAL ASSESSMENT REPORT ON BIODIVERSITY AND ECOSYSTEM SERVICES
26
SU
MM
AR
Y F
OR
PO
LIC
YM
AK
ER
S
Figure SPM 3 A substantial proportion of assessed species are threatened with extinction and overall trends are deteriorating, with extinction rates increasing sharply in the past century.
A Percentage of species threatened with extinction in taxonomic groups that have been assessed comprehensively, or through a ‘sampled’ approach, or for which selected subsets have been assessed, by the International Union for Conservation of Nature (IUCN) Red List of Threatened Species. Groups are ordered according to the best estimate for the percentage of extant species considered threatened (shown by the vertical blue lines), assuming that data deficient species are as threatened as non-data deficient species. B Extinctions since 1500 for vertebrate groups. Rates for reptiles and fishes have not been assessed for all species. C Red List
Index of species survival for taxonomic groups that have been assessed for the IUCN Red List at least twice. A value of 1 is equivalent to all species being categorized as Least Concern; a value of zero is equivalent to all species being classified as Extinct. Data for all panels derive from www.iucnredlist.org (see Chapter 3 Figure 3.4 and Chapter 2 Figure 2.7).
indigenous peoples and local communities, including farmers, pastoralists and herders, are often important areas for in situ conservation of the remaining varieties and breeds (well established) {2.2.5.3.1}. Available data
suggest that genetic diversity within wild species globally has been declining by about 1 per cent per decade since the mid-19th century; and genetic diversity within wild mammals and amphibians tends to be lower in areas
Mammals
Birds
Fishes
Amphibians
Reptiles
Current global extinction risk in different species groups
0 10 20 30 40 50 60 70 80 90 100
Cycads*
Amphibians*
Dicots***
Reptiles**
Conifers*
Corals (reef-forming)*
Sharks and rays*
Crustaceans***
Mammals*
Birds*
Gastropods***
Bony fishes*** 2,390
633
972
1,026
10,966
5,593
2,872
1,500
1,520
845
607
1,091
1,781
PERCENTAGE OF SPECIES IN EACH CATEGORY
6,576
307
Total number of extantassessed species
Estimate of percentage threatened
*** Selected** Sampled* Comprehensive
Extinct in the Wild
Critically Endangered
Endangered
Vulnerable
Near Threatened
Least Concern
Data Deficient
Threatened
Non-threatened
2.5
2.0
1.5
1.0
0.5
0
Red
list
ind
ex o
f sp
ecie
s su
rviv
al
Cum
ulat
ive
% o
f sp
ecie
s d
riven
ext
inct
Cycads
Amphibians
Corals
Mammals
Birds
Declines in species survival since 1980(Red List Index)
Extinctions since 1500
YEAR YEAR
0.5
0.6
0.7
0.8
0.9
1.0
19801500 1600 1700 1800 1900 2018 1985 1990 1995 2000 2005 2010 2015
Cumulative % of species based on on background rate of 0.1-2 extinctions per million species per year
Monocots**
Ferns and relatives**
Dragonflies**
Better
BetterWorse
Worse
A
B C
IUCN Red List categories
Greater extinction risk
Figure 3: Percentage of species threatened with extinction in taxonomic groups that have been assessed comprehensively, or through a "sampled" approach, or for which selected subsets have been assessed by the International Union for Conservation of Nature (IUCN) Red List of Threatened Species. Groups are ordered according to the best estimate for the percentage of extant species considered threatened (shown by the vertical blue lines), assuming that data deficient species are as threatened as non-data deficient species. Data for all panels derive from the IUCN Red List. www.iucnredlist.org Source of figure and caption: (IPBES, 2019).
According to the IUCN, human activities have caused the extinction of 882 species over the last five centuries.
The 2019 IPBES report10 shows that since 1870, 85% of the world’s wetlands have disappeared, 75% of the terrestrial environment and 66% of the marine environment have been severely degraded by humans, and 50% of corals have disappeared, with accelerating losses in recent years. In addition, a quarter of the plant and animal groups identified are threatened with extinction, i.e., more than one million species in total. Species extinction rates are 10 to 100 times higher today than they were during the last 10 million years.
The WWF’s Living Planet report11 notes a 68% loss of vertebrate species populations between 1970 and 2016, and an 84% loss of freshwater species over the same period. The number of known plant extinctions is twice that of mammals, birds and amphibians combined.12
Marine plastic pollution in particular has increased tenfold since 1980, affecting at least 267 species
10 IPBES, ”Global assessment report on biodiversity and ecosystem services of the Intergovernmental Science - Policy Platform on Biodiversity and Ecosystem Services. E. S. Brondizio, J. Settele, S. Díaz, and H. T. Ngo (editors)”, 2019. 11 WWF, ”Living Planet Report”.12 Humphreys et al., ”Global Dataset Shows Geography and Life Form Predict Modern Plant Extinction and Rediscovery”.
through bioaccumulation along the food chain, a phenomenon affecting 86% of sea turtles, 44% of seabirds and 43% of marine mammals.
Sadly, for the first time in modern history, a marine fish species has been officially declared extinct. The marine fish Sympterichthys unipennis, native to southern Tasmania, is one of 17 species classified as extinct by the IUCN in 2020 (as of 30/09/2020). The extinction of this species was caused by overfishing, water pollution and the loss and degradation of its natural habitat (loss of spawning habitat and siltation of the seabed).
The only specimen of Sympterichthys unipennis ever observed. Source: Australian National Fish Collection, CSIRO.
BOX 2: THE SIXTH MASS EXTINCTION IN FIGURES
FINANCE & BIODIVERSITY 9
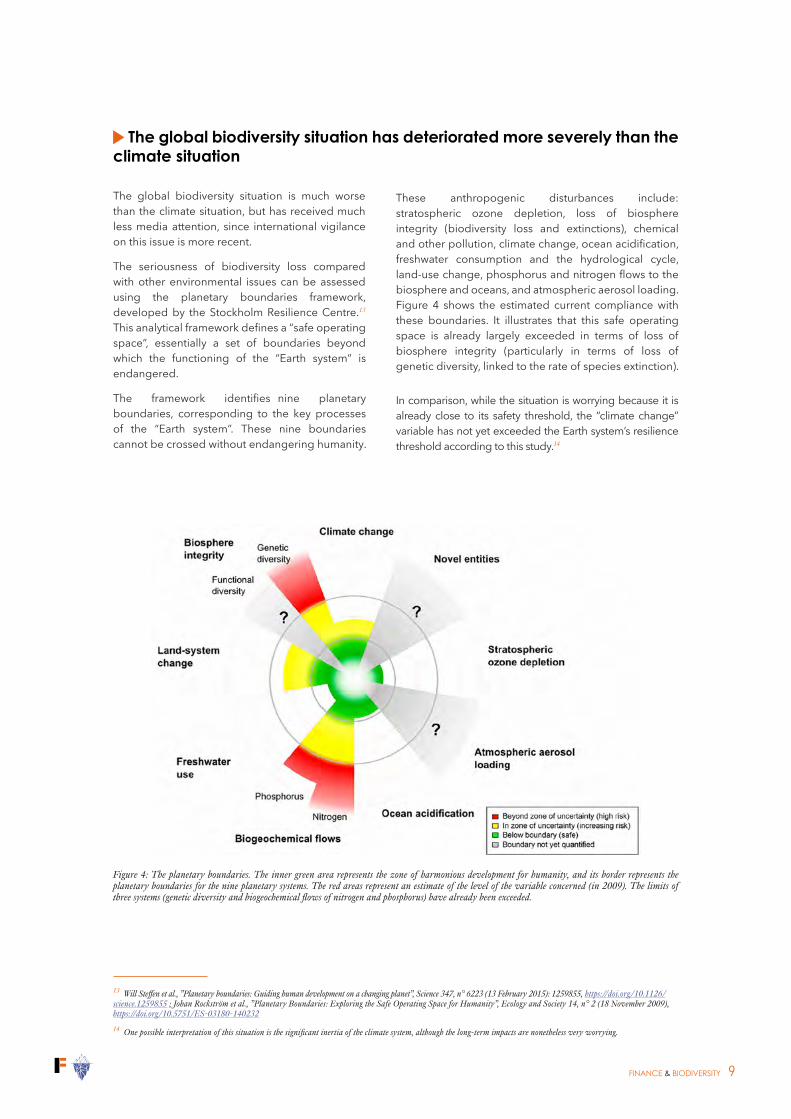
The global biodiversity situation is much worse than the climate situation, but has received much less media attention, since international vigilance on this issue is more recent.
The seriousness of biodiversity loss compared with other environmental issues can be assessed using the planetary boundaries framework, developed by the Stockholm Resilience Centre.13 This analytical framework defines a “safe operating space”, essentially a set of boundaries beyond which the functioning of the “Earth system” is endangered.
The framework identifies nine planetary boundaries, corresponding to the key processes of the “Earth system”. These nine boundaries cannot be crossed without endangering humanity.
13 Will Steffen et al., ”Planetary boundaries: Guiding human development on a changing planet”, Science 347, n° 6223 (13 February 2015): 1259855, https://doi.org/10.1126/science.1259855 ; Johan Rockström et al., ”Planetary Boundaries: Exploring the Safe Operating Space for Humanity”, Ecology and Society 14, n° 2 (18 November 2009), https://doi.org/10.5751/ES-03180-14023214 One possible interpretation of this situation is the significant inertia of the climate system, although the long-term impacts are nonetheless very worrying.
These anthropogenic disturbances include: stratospheric ozone depletion, loss of biosphere integrity (biodiversity loss and extinctions), chemical and other pollution, climate change, ocean acidification, freshwater consumption and the hydrological cycle, land-use change, phosphorus and nitrogen flows to the biosphere and oceans, and atmospheric aerosol loading. Figure 4 shows the estimated current compliance with these boundaries. It illustrates that this safe operating space is already largely exceeded in terms of loss of biosphere integrity (particularly in terms of loss of genetic diversity, linked to the rate of species extinction).
In comparison, while the situation is worrying because it is already close to its safety threshold, the “climate change” variable has not yet exceeded the Earth system’s resilience threshold according to this study.14
The global biodiversity situation has deteriorated more severely than the climate situation
Figure 4: The planetary boundaries. The inner green area represents the zone of harmonious development for humanity, and its border represents the planetary boundaries for the nine planetary systems. The red areas represent an estimate of the level of the variable concerned (in 2009). The limits of three systems (genetic diversity and biogeochemical flows of nitrogen and phosphorus) have already been exceeded.

10 FINANCE & BIODIVERSITY
Two main schools of thought have emerged: traditional conservation, which aims to pursue concepts defined in the 20th century, and “new conservation”, which proposes alternative approaches for the 21st century.15 New conservation is linked to human well-being through the services provided by ecosystems (ecosystem services) and not only to the “intrinsic value” of each non-human species.
The concept of ecosystem resilience developed in the late 1990s includes the idea of maintaining ecosystem structures and functionalities despite pressures, changes or disturbances, as formulated by Griffon and
15 Peter Kareiva et Michelle Marvier, What is conservation science? , Bioscience, 2012.
16 Doctoral thesis of Ciprian Ionescu on biodiversity and organisational strategy, « Biodiversité et stratégie des organisations : construire des outils pour gérer des relations multiples et inter-temporelles » supervised by Michel Trometter, 2016: https://tel.archives-ouvertes.fr/tel-01680282/document (in French).17 IPBES, ”Global assessment report on biodiversity and ecosystem services of the Intergovernmental Science- Policy Platform on Biodiversity and Ecosystem Services. E. S. Brondizio, J. Settele, S. Díaz, and H. T. Ngo (editors)”.
18 Ludovic Suttor-Sorel, ”Making Finance Serve Nature. From the niche of Conservation finance to the mainstreaming of Natural Capital approaches in financial systems.”, 2019; OECD, ”Biodiversity: Finance and the Economic and Business Case for Action. A report prepared by the OECD for the French G7 Presidency and the G7 Environment Ministers’ Meeting, 5-6 May 2019”.
19 IPBES, ”Global assessment report on biodiversity and ecosystem services of the Intergovernmental Science- Policy Platform on Biodiversity and Ecosystem Services. E. S. Brondizio, J. Settele, S. Díaz, and H. T. Ngo (editors)”.
Weber (1996). For some, ecosystem resilience is the essential condition for the viability – in other words, the sustainable functioning – of living systems.16 These actors propose implementing the conditions necessary for the adaptive management of socio-ecological systems (SES). Environmental accounting is a lever for such management.
The “Biosphere Ethics Initiative”, which was the subject of a broad consensus at UNESCO, thus refers to the co-evolution of humans and different species and stresses the need to build the conditions for this by making it an ethical responsibility for humanity.
The development of the concept of conservation
Biodiversity erosion therefore leads to an overall deterioration in ecosystem services, i.e., services used by humans and their economic system.17 The extinction of global biodiversity thus directly threatens human existence and the quality of life. Crises such as COVID-19, whose origin is probably environmental, clearly illustrate this point (see Box 3), even if the pandemic itself is due to globalisation: the interconnection of humans and the massive movement of goods and services are so intense that our ecosystems are all intrinsically intertwined and any resulting threats endanger us all.
IPBES, the Intergovernmental Science-Policy Platform on Biodiversity and Ecosystem Services, the “IPCC of biodiversity”, has published an assessment of the evolution of the quality of ecosystem services over the
last 50 years, based on the analysis of more than 2,000 scientific studies. The results highlight a decline in 14 of the 18 categories assessed. Among the categories most severely affected are nature’s ability to create and maintain natural habitats; to provide pollination services; to regulate harmful biological organisms and processes; to provide resources for human food (fishery resources), as well as medicinal, biochemical and genetic resources; to provide services for learning and inspiration; and to preserve options for the future of humanity.
The sustainability of economic models and of the financial system is also threatened.18 For example, pollinator loss threatens to cause crop failures estimated at between 5-8% of world agricultural production, or between US$235-577 billion.19
The degradation of ecosystem services

FINANCE & BIODIVERSITY 11
The COVID-19 pandemic has shown the general public the links between biodiversity and human health, in particular the links between the conversion of natural areas and the risk of transmission of infectious diseases (zoonoses or vector-borne diseases).
A 2015 report by the World Health Organization details these risks by documenting the way that anthropogenic changes in natural environments may increase the risk of transmission of infectious diseases.20 The increase in contact at the human / animal / environmental interface facilitates the spread of diseases via diverse vectors (composition, abundance, distribution). Most of the infectious agents affecting humans (61%) are of animal origin (notably AIDS).21
A link can therefore be made between global biodiversity loss and the COVID-19 pandemic.22 In its 2019 report, the IPBES underlines the risk of zoonoses: the emergence of infectious diseases in wildlife, domestic animals, plants or humans can be amplified by certain human activities such as the destruction and/or fragmentation of habitats.23
20 World Health Organization, Convention on Biological Diversity (Organization), et United Nations Environment Programme, Connecting Global Priorities: Biodiversity and Human Health: A State of Knowledge Review., 2015, http://apps.who.int/iris/bitstream/10665/174012/1/9789241508537_eng.pdf?ua=121 Louise H. Taylor et al., ”Risk factors for human disease emergence”, Philosophical Transactions of the Royal Society of London. Series B: Biological Sciences 356, n° 1411 (29 July 2001): 983-89, https://doi.org/10.1098/rstb.2001.088822 Jean-François Silvain, Robin Goffaux and Hélène Soubelet, article on the mobilisation of the French Foundation for Biodiversity Research to examine the links between COVID-19 and biodiversity: « Mobilisation de la FRB par les pouvoirs publics français sur les liens entre Covid-19 et biodiversité », 15 May 2020, 57 (in French).23 (IPBES, 2019).24 Kate E. Jones et al., ”Global Trends in Emerging Infectious Diseases”, Nature 451, n° 7181 (21 February 2008): 990-93, https://doi.org/10.1038/nature06536 ; Elizabeth H. Loh et al., ”Targeting Transmission Pathways for Emerging Zoonotic Disease Surveillance and Control”, Vector Borne and Zoonotic Diseases (Larchmont, N.Y.) 15, n° 7 ( July 2015): 432-37, https://doi.org/10.1089/vbz.2013.1563 ; J. A. Patz et al., ”Effects of Environmental Change on Emerging Parasitic Diseases”, International Journal for Parasitology 30, n° 12-13 (November 2000): 1395-1405, https://doi.org/10.1016/s0020-7519(00)00141-7
25 Loh et al., ”Targeting Transmission Pathways for Emerging Zoonotic Disease Surveillance and Control”.26 Dasgupta, P. 2021, ”The Economics of Biodiversity: The Dasgupta Review”.
Land-use change is thus a predominant factor in the emergence of infectious diseases, through various practices: degradation of natural forests, logging, mining, plantation, illegal wildlife trade, etc.24 Figure 5 below shows the number of emerging infectious diseases (EID) by primary factor.25 As highlighted in the 2021 Dasgupta review,26 increased contact between humans and wild biodiversity carrying zoonotic diseases can result in pathogens being transmitted from animals to humans.
Although they have not yet been accurately assessed, it is certain that the societal consequences of the COVID-19 crisis are and will be major, beginning with the one million deaths recorded as a result of the pandemic. The abrupt lifestyle changes, and the economic and social disasters will permeate the world for years to come.
The COVID-19 crisis is therefore further evidence that failing to protect biodiversity and to address the resulting issues can have an unacceptable human and financial cost.
BOX 3: BIODIVERSITY AND THE EMERGENCE OF PANDEMICS
Drivers of Disease Emergence in Humans
E. Loh et al. 2015. Vector-borne and Zoonotic Diseases 15(7)Figure 5: Number of emerging infectious disease (EID) events by primary onset factor. Source: Loh et al, 2015.

12 FINANCE & BIODIVERSITY
BOX 4: BEYOND AN ANTHROPOCENTRIC APPROACH TO THE VALUE OF BIODIVERSITY
The notion of biodiversity, a concept that emerged in the 1980s, refers to human interactions with nature, and therefore to the values that people place on nature. We can identify three categories of values (FRB, 2015):27 instrumental values (biodiversity is considered as a means for serving ends other than itself, in particular, it provides services for human societies); relational values linked, for example, to the regulatory, cultural or aesthetic importance of biodiversity for humans; and, finally, intrinsic values (biodiversity is considered to be an end in itself, independent of the use that can be made of it).
Instrumental values of biodiversity are now at the forefront of management decision-making. They have led to the development of the concept of ecosystem services: biodiversity must be protected because humans depend on it. Instrumental values also underlie a notion of sustainable development based on a very economic interpretation of biodiversity conservation.
27 https://www.fondationbiodiversite.fr/wp-content/uploads/2019/10/FRB-Rapport-valeurs-biodiversite-1.pdf (in French).
28 Sarrazin and Leconte, 2016.29 ( Jambeck et al. 2015).30 Pörtner, Hans-Otto et al., "IPBES-IPCC Co-Sponsored Workshop Report on Biodiversity and Climate Change" (Zenodo, 24 June 2021), https://doi.org/10.5281/ZENODO.478253831 IPBES, ”Global assessment report on biodiversity and ecosystem services of the Intergovernmental Science- Policy Platform on Biodiversity and Ecosystem Services. E. S. Brondizio, J. Settele, S. Díaz, and H. T. Ngo (editors)”.32 P.R. Shukla et al., ”IPCC Climate Change and Land: Foreword Technical and Preface”, Climate Change and Land: an IPCC special report on climate change, desertification, land degradation, sustainable land management, food security, and greenhouse gas fluxes in terrestrial ecosystems, 2019, 35-74.
Environmental ethics have emerged and disciplines such as philosophy and anthropology have debated the notion of anthropocentrism, which places humans at the centre of the universe; the moral responsibility of humans to protect biodiversity, even if it does not “benefit” them; the relationship between humans and non-humans; and the profound separation of humans and nature in Western thought.
Recognising the intrinsic value of biodiversity may be one of the best ways to enable it to maintain an evolutionary trajectory that is not imposed by immediate or future human interests.28 This approach, described as “evocentric”, should help to respect the evolutionary potential and the processes that allow living organisms to adapt while reducing the human footprint on biodiversity.
Hélène Soubelet, Director, French Foundation for Biodiversity Research
The spillover effects of the biodiversity crisis on the climate
The conservation and sustainable management of biodiversity is critical in the fight against climate change. Nature plays an important role in storing carbon29 – half of the carbon emissions in the atmosphere are absorbed by natural sinks such as the oceans (surface and deep waters), vegetation and soils. The recent joint report published by the IPBES and IPCC30 highlights these interactions, indicating that each of the crises we are facing (climate change and biodiversity loss) is closely linked to the other, and that solutions must be designed for both issues.
The destruction of marine and terrestrial ecosystems therefore actively contributes to the increase in the concentration of greenhouse gases in the atmosphere, in particular by releasing previously stored carbon.31 This contributes to climate disruption. For example, 5-14% of global GHG emissions are due to land use and land transformation (including deforestation and peatland degradation).32

FINANCE & BIODIVERSITY 13
DIRECT CAUSES OF BIODIVERSITY LOSS
The IPBES 2019 report explains the direct and indirect drivers of this dramatic biodiversity loss, as shown in Figure 6. We will now detail the main direct factors contributing to biodiversity loss.
THE GLOBAL ASSESSMENT REPORT ON BIODIVERSITY AND ECOSYSTEM SERVICES
25
SU
MM
AR
Y F
OR
PO
LIC
YM
AK
ER
S
Figure SPM 2 Examples of global declines in nature, emphasizing declines in biodiversity, that have been and are being caused by direct and indirect drivers of change.
The direct drivers (land-/sea-use change; direct exploitation of organisms; climate change; pollution; and invasive alien species)6 result from an array of underlying societal causes7. These causes can be demographic (e.g., human population dynamics), sociocultural (e.g., consumption patterns), economic (e.g., trade), technological, or relating to institutions, governance, conflicts and epidemics. They are called indirect drivers8 and are underpinned by societal values and behaviours. The colour bands represent the relative global impact of direct drivers, from top to bottom, on terrestrial, freshwater and marine nature, as estimated from a global systematic review of studies published since 2005. Land- and sea-use change and direct exploitation account for more than 50 per cent of the global impact on land, in fresh water and in the sea, but each driver is dominant in certain contexts {2.2.6}. The circles illustrate the magnitude of the negative human impacts on a diverse selection of aspects of nature over a range of different time scales based on a global synthesis of indicators {2.2.5, 2.2.7}.
incomplete) {2.2.5.2.4}. Local declines of insect populations such as wild bees and butterflies have often been reported, and insect abundance has declined very rapidly in some places even without large-scale land-use change, but the global extent of such declines is not known (established but incomplete) {2.2.5.2.4}. On land, wild species that are endemic (narrowly distributed) have typically seen larger-than-average changes to their habitats and shown faster-than-average declines (established but incomplete) {2.2.5.2.3, 2.2.5.2.4}.6 7 8
7 The number of local varieties and breeds of domesticated plants and animals and their wild relatives has been reduced sharply as a result of land
6. The classification of direct drivers used throughout this assessment is in {2.1.12 - 2.1.17}.
7. The interactions among indirect and direct drivers are addressed in {2.1.11, 2.1.18}.
8. The classification of indirect drivers used throughout this assessment is in {2.1.3 - 2.1.10}.
use change, knowledge loss, market preferences and large-scale trade (well established) {2.2.5.2.6, 2.2.5.3.1}. Domestic varieties of plants and animals are the result of natural and human-managed selection, sometimes over centuries or millennia, and tend to show a high degree of adaptation (genotypic and phenotypic) to local conditions (well established) {2.2.4.4}. As a result, the pool of genetic variation which underpins food security has declined (well established) {2.2.5.2.6}. Ten per cent of domesticated breeds of mammals were recorded as extinct, as well as some 3.5 per cent of domesticated breeds of birds (well established) {2.2.5.2.6}. Many hotspots of agrobiodiversity and crop wild relatives are also under threat or not formally protected. The conservation status of wild relatives of domesticated livestock has also deteriorated. These wild relatives represent critical reservoirs of genes and traits that may provide resilience against future climate change, pests and pathogens and may improve current heavily depleted gene pools of many crops and domestic animals {2.2.3.4.3}. The lands of
EXAMPLES OF DECLINES IN NATUREDRIVERS
DIRECT DRIVERSINDIRECT DRIVERS
Terrestrial
Freshwater
Marine
Land/sea use changeDirect exploitationClimate changePollutionInvasive alien speciesOthers
0 20 40 60 80 100%
Demographic and
sociocultural
Economicand
technological
Institutions and
governance
Conflicts and
epidemics
82%
47%
23%
25%
72%
SPECIES EXTINCTION RISK
The global biomass of wild mammals has fallen by 82 per cent.* Indicators of vertebrate abundance have declined rapidly since 1970
BIOMASS AND SPECIES ABUNDANCE
ECOLOGICAL COMMUNITIES
Approximately 25 per cent of species are already threatened with extinction in most animal and plant groups studied.
Biotic integrity—the abundance of naturally- present species—has declined by 23 per cent on average in terrestrial communities.*
Natural ecosystems have declined by 47 per cent on average, relative to their earliest estimated states.
ECOSYSTEM EXTENT AND CONDITION
72 per cent of indicators developed by indigenous peoples and local communities show ongoing deterioration of elements of nature important to them
NATURE FOR INDIGENOUS PEOPLES AND LOCAL COMMUNITIES
* Since prehistory
Va
lue
s a
nd
be
ha
vio
urs
Figure 6: Examples of global declines in nature, emphasising declines in biodiversity, that have been and are being caused by direct and indirect drivers of change. Source: (IPBES, 2019).
Habitat destruction and disturbance
The primary direct cause of biodiversity loss is habitat degradation, primarily terrestrial. A habitat refers to the living spaces suitable for animal or plant species. It includes living beings as well as the physical and chemical elements interacting with them.
Today, 75% of the terrestrial environment and 40% of the marine environment are severely degraded,33 according to the 2019 IPBES report. Half of the Earth’s surface is used by humans (agricultural land, grasslands, pastureland, cities, transport and other infrastructure). This is primarily due to the expansion of agriculture and this pressure has been mainly to the detriment of tropical forests. The 2019 IPBES report indicates that, from 1980 to 2000, half of agricultural expansion (100 million hectares) was at the expense of intact tropical forests, including 42 million hectares for cattle breeding in Latin
33 (IPBES, 2019).
America and an additional 7 million hectares in South-East Asia for plantations, 80% of which were for oil palm.
Although they only occupy 3% of the total land area, the development of cities also exerts a harmful pressure, particularly at the expense of tropical and subtropical grasslands and savannahs (urbanised areas doubled between 1992 and 2015 according to the same IPBES report).34 The increasing fragmentation of remaining natural areas further contributes to the erosion of biodiversity.

14 FINANCE & BIODIVERSITY
The United Nations Framework Convention on Climate Change (UNFCCC) defines climate change as “a change of climate which is attributed directly or indirectly to human activity that alters the composition of the global atmosphere and which is in addition to natural climate variability observed over comparable time periods”. These changes affect biodiversity in complex ways, directly or indirectly, and often in interaction with other factors: temperature increase, increase in the frequency of extreme weather events, sea-level rise, ocean surface temperature variations, ocean acidification, UV radiation, etc.
For example, rising temperatures (+1°C, +/- 0.2°C since pre-industrial times)35 and structural changes in precipitation patterns eradicate or weaken sensitive plant species (i.e., those with very specific soil and climatic requirements), making them more vulnerable to competition, which can prove fatal for most of them. Animals are also greatly affected by temperature change, which, for example, forces some species to migrate to areas more suitable for their needs. This phenomenon is called species distribution change.
Other direct effects of climate change are seen in changes in the morphology, physiology and behaviour of some species. Some turtle species, for example, reach sexual maturity earlier in warmer years. The IPCC’s 2002 report on Climate Change and Biodiversity36 mentions the case of a deer species that was observed to grow faster in warmer springs, leading to increases in adult body size. Climate change also has indirect effects on animal populations: changes in their diets due to the disappearance of plants that form food webs, or an increase in the frequency and intensity of epidemics.
34 David Potere et Annemarie Schneider, ”A Critical Look at Representations of Urban Areas in Global Maps”, GeoJournal 69, n° 1-2 (10 October 2007): 55-80, https://doi.org/10.1007/s10708-007-9102-z ; Nancy B. Grimm et al., ”Global Change and the Ecology of Cities”, Science (New York, N.Y.) 319, n° 5864 (8 February 2008): 756-60, https://doi.org/10.1126/science.1150195 ; Gordon Mcgranahan et al., ”Urban Systems”, 1 June 2005. 35 Allen, M.R. et al., ”Framing and Context. In: Global Warming of 1.5°C. An IPCC Special Report on the impacts of global warming of 1.5°C above pre-industrial levels and related global greenhouse gas emission pathways, in the context of strengthening the global response to the threat of climate change, sustainable development, and efforts to eradicate poverty” (IPCC, 2018), https://www.ipcc.ch/site/assets/uploads/sites/2/2019/05/SR15_Chapter1_Low_Res.pdf
36 IPCC, ”Climate change and biodiversity”, 2002, https://doi.org/10.1007/978-981-10-3573-9_537 (IPCC 2002 ; Alkemade et al. 2009).38 NWS Government, ”NSW Fire and the Environment 2019-20 Summary. Biodiversity and landscape data and analyses to understand the effects of the fire events.” (Sydney, 2019).
39 Chris Dickman, ”A statement about the 480 million animals killed in NSW bushfires since September - The University of Sydney”, 2020, https://www.sydney.edu.au/news-opinion/news/2020/01/03/a-statement-about-the-480-million-animals-killed-in-nsw-bushfire.html
40 With the exception of bats.
The PBL Netherlands Environmental Assessment Agency and the IPCC37 point out that all of these plant and animal communities are likely to be severely affected by the increased frequency of extreme weather events (droughts, floods, forest fires, etc.). The Australian fires in 2020 illustrate the impact of these disasters on biodiversity. In New South Wales, the most affected state, the government38 estimated that the fires covered 5.4 million hectares (including 2.7 million hectares of national parks), affecting more than one billion animals across Australia.39
These phenomena are already being observed and the IPBES estimates that half of all terrestrial mammals40 and a quarter of all threatened birds will be affected by the consequences of climate change.
Climate change

FINANCE & BIODIVERSITY 15
The overexploitation of natural resources by humans is a third major factor in the loss of global biodiversity, affecting both living biomass and inert matter. It is also the main factor in the loss of biodiversity in the oceans (via fishing). Between 1980 and 2010, global demand for renewable and non-renewable raw materials increased threefold, with the largest increase coming from the demand for construction materials.41 The exploitation of biomass from agriculture, forestry, fishing, hunting and other activities has doubled, especially in upper-middle-income countries. This massive exploitation is leading to the erosion of biodiversity and is accelerating climate change, especially in tropical forests and marine, coastal and Arctic ecosystems. Extracting resources beyond
41 (IPBES, 2019).42 (IPBES, 2019).
the capacity for renewal of ecosystems and species leads to substantial changes in the functioning of ecosystems and contributes to the erosion of biodiversity.
The same is true for freshwater abstraction. According to the IPBES, 21 of the 37 aquifers have exceeded their “sustainability tipping points”. This is mainly due to agriculture (69%), industrial uses (19%) and direct consumption (12%). The consequences for biodiversity are significant, especially in arid and semi-arid regions: coupled with climate change, freshwater withdrawals reduce run-off across river basins, impair water quality, alter hydrological regimes and degrade land.
Overexploitation of resources
Pollution
Global population growth, economic activities, energy consumption and industry are at the origin of various types of pollution through the release of wastewater (treated or not) into the natural environment, nutrient-laden agricultural runoff, industrial accidents (oil spills in particular), etc. The IPBES42 estimates that pollution has increased at least as fast as population growth. Pollution can be characterised according to the natural environment in which it occurs (air, soil, freshwater and marine pollution). Pollution can also be categorised according to the phenomena it causes:
• eutrophication (nitrogen and phosphorus) through the use of fertilisers and the release of untreated waste water;
• acidification (mainly linked to sulphur and nitrogen emissions), in particular as a result of coal combustion and fertiliser use;
• bioaccumulation (entry of metals, plastics, hydrocarbons or other substances into food chains, and the concentrated accumulation of these substances in living beings);
16 FINANCE & BIODIVERSITY
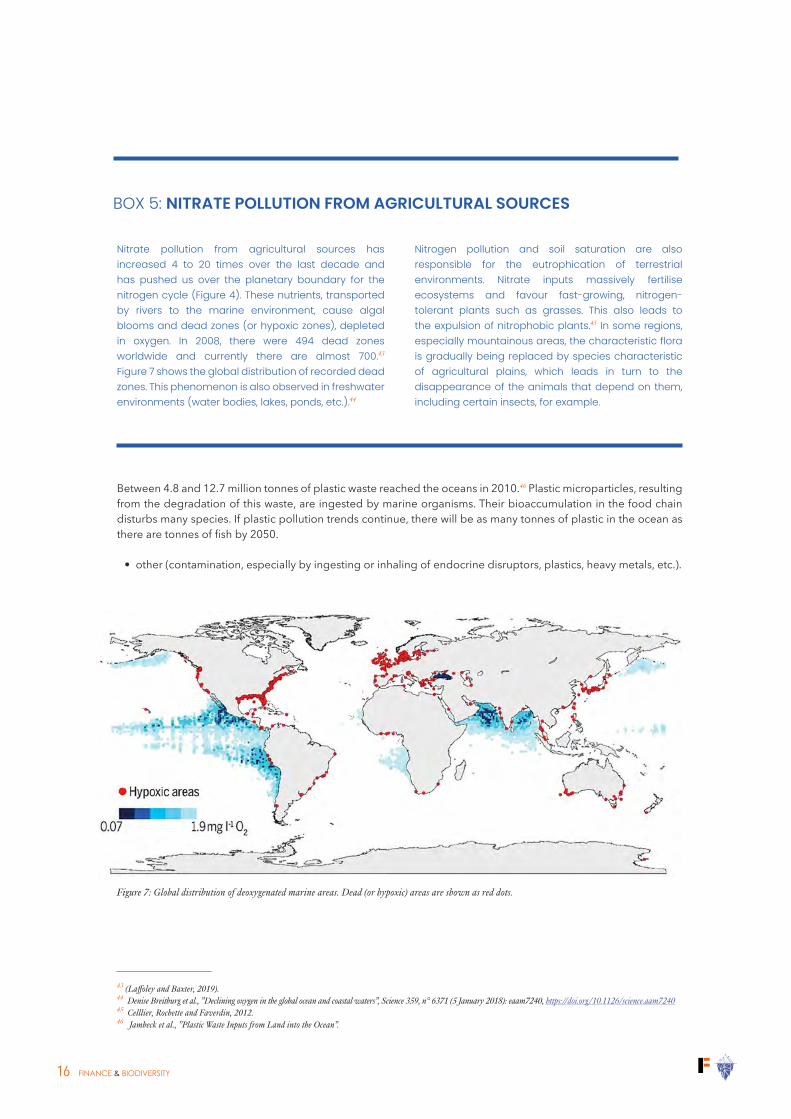
Nitrate pollution from agricultural sources has increased 4 to 20 times over the last decade and has pushed us over the planetary boundary for the nitrogen cycle (Figure 4). These nutrients, transported by rivers to the marine environment, cause algal blooms and dead zones (or hypoxic zones), depleted in oxygen. In 2008, there were 494 dead zones worldwide and currently there are almost 700.43 Figure 7 shows the global distribution of recorded dead zones. This phenomenon is also observed in freshwater environments (water bodies, lakes, ponds, etc.).44
43 (Laffoley and Baxter, 2019). 44 Denise Breitburg et al., ”Declining oxygen in the global ocean and coastal waters”, Science 359, n° 6371 (5 January 2018): eaam7240, https://doi.org/10.1126/science.aam724045 Celllier, Rochette and Faverdin, 2012.46 Jambeck et al., ”Plastic Waste Inputs from Land into the Ocean”.
Nitrogen pollution and soil saturation are also responsible for the eutrophication of terrestrial environments. Nitrate inputs massively fertilise ecosystems and favour fast-growing, nitrogen-tolerant plants such as grasses. This also leads to the expulsion of nitrophobic plants.45 In some regions, especially mountainous areas, the characteristic flora is gradually being replaced by species characteristic of agricultural plains, which leads in turn to the disappearance of the animals that depend on them, including certain insects, for example.
BOX 5: NITRATE POLLUTION FROM AGRICULTURAL SOURCES
Between 4.8 and 12.7 million tonnes of plastic waste reached the oceans in 2010.46 Plastic microparticles, resulting from the degradation of this waste, are ingested by marine organisms. Their bioaccumulation in the food chain disturbs many species. If plastic pollution trends continue, there will be as many tonnes of plastic in the ocean as there are tonnes of fish by 2050.
• other (contamination, especially by ingesting or inhaling of endocrine disruptors, plastics, heavy metals, etc.).
Figure 7: Global distribution of deoxygenated marine areas. Dead (or hypoxic) areas are shown as red dots.
FINANCE & BIODIVERSITY 17
Invasive species are species that are accidentally or intentionally introduced outside their original territory and proliferate, eventually crowding out native species because of diminishing resources or because they become predators of native species.
The globalisation of trade, the expansion of trade networks, the increase in human mobility, the continued degradation of natural habitats and climate change are the main factors driving the introduction of invasive species into intact ecosystems (via ballast water, packaging, unprocessed commodities such as wood, plants, etc.). Increased tourism and international trade (and therefore increased transport) also increase the risk
47 Anna J Turbelin, Bruce D Malamud, and Robert A Francis, ”Mapping the global state of invasive alien species: patterns of invasion and policy responses”, Global Ecology and Biogeography 26, n° 1 (1 January 2017): 78-92, https://doi.org/10.1111/geb.1251748 (IPBES, 2019).49 James C. Russell et al., ”Invasive Alien Species on Islands: Impacts, Distribution, Interactions and Management”, Environmental Conservation 44, n° 4 (December 2017): 359-70, https://doi.org/10.1017/S0376892917000297
of introducing these species. Among the most rampant invasive species are the black rat (Rattus rattus, present in 23% of countries worldwide), the water hyacinth (Eichhornia crassipes, 30% of countries), the mosquito fish (Gambusia holbrooki, 30% of countries), the round nutsedge (Cyperus rotundus, 37%) and the Australian mealybug (Icerya purchasi, 42% of countries).47
About one-fifth of the Earth’s surface, encompassing many rich ecosystems, is threatened by the invasion of plants and animals. Across 21 countries that have prepared detailed data, the number of invasive alien species per country has increased by an average of 70% since 1970.48
BOX 6: VULNERABILITY OF ISLAND SYSTEMS
Island ecosystems are particularly susceptible to invasion by invasive alien species because endemic species have generally evolved in the absence of competition from other species, predation or exposure to pathogens. Geographic isolation limits the immigration of new species and allows endemic species to thrive due to reduced exposure to predators and reduced competition for resources.
In this context, the introduction of invasive alien species to island ecosystems has negative consequences for their biodiversity, and it can become the major factor behind species extinction in these ecosystems. However, the most frequent invasive alien species in these ecosystems can be documented and controlled.49 The historical example of the introduction of rabbits to Australia illustrates the specificity of island ecosystems.
The proliferation of invasive species

18 FINANCE & BIODIVERSITY
Companies of all sizes contribute directly or indirectly to each of the pressures on biodiversity presented above, notably through their supply chains, their direct activities and the downstream part of their value chain. Sourcing choices (location, type of sourcing, timing of sourcing) can, for example, influence deforestation, overexploitation of resources, pollution, etc.
Companies’ impact on biodiversity varies greatly depending on their sector of activity. Studies conducted by the PBL Netherlands Environmental Assessment Agency, CDC Biodiversité and a consortium composed of the United Nations Environment Programme and the
50 (Kok et al. 2017 ; Berger et al. 2018, UNEP et Global Canopy 2020) .51 IPBES, ”Global assessment report on biodiversity and ecosystem services of the Intergovernmental Science- Policy Platform on Biodiversity and Ecosystem Services. E. S. Brondizio, J. Settele, S. Díaz, and H. T. Ngo (editors)”.52 NA: Insufficient information.
Global Canopy NGO50 have proposed a classification of business sectors according to their level of dependence and the extent of their impacts on biodiversity. The IPBES, meanwhile, cites fisheries, agriculture, forestry (for timber and wood energy), non-timber forest products, mining, urbanisation and infrastructure development, tourism and transport.51
On the basis of this work and Iceberg Data Lab’s assessments, the following table provides a summary of the sectors with the highest probability and level of impact. These cover a large share of overall economic activities.
BUSINESS-RELATED ISSUES IN BIODIVERSITY LOSS
Companies’ responsibility in the biodiversity crisis
Table 1 - Level of biodiversity dependencies and impact by sector of activity. Source: ICEBERG DATA LAB, 2020. Inspired by PBL 2017, CDC Biodiversité 2018 and UNEP-WCMC 2020.
Sector (NACE Sector) Sector (NACE Division) Risk Level Biodiversity Impact52
AGRICULTURE, FORESTRY AND FISHING
Crop and animal production, hunting and related service activitiesForestry and loggingFishing and aquaculture
SIGNIFICANT SIGNIFICANT
ELECTRICITY, GAS, STEAM AND AIR CONDITIONING SUPPLY
Production and distribution of electricity, gas, steam and air conditioning SIGNIFICANT SIGNIFICANT
MINING AND QUARRYING
Mining of coal and ligniteExtraction of crude petroleum and natural gasMining of metal oresOther mining and quarrying
SIGNIFICANT SIGNIFICANT
MANUFACTURING Manufacture of food productsManufacture of furniture SIGNIFICANT SIGNIFICANT
ARTS, ENTERTAINMENT AND RECREATION
Sports activities and amusement and recreation activities SIGNIFICANT NA
WHOLESALE AND RETAIL TRADE; REPAIR OF MOTOR VEHICLES AND MOTORCYCLES
Retail trade, except of motor vehicles and motorcycles (food) SIGNIFICANT SIGNIFICANT
TRANSPORTATION AND STOR-AGE Land transport and transport via pipelines Water transport MEDIUM SIGNIFICANT

FINANCE & BIODIVERSITY 19
Economic actors must consider biodiversity issues and place them at the heart of their strategy for many reasons. In 2020, the World Economic Forum53 identified biodiversity loss as the “second most impactful and third most likely risk for the next decade”.
Companies exploit natural capital directly or indirectly as part of their operations and they are reliant on the provision of ecosystem services to function properly. All economic activities in their supply chains are at least indirectly threatened.
From agriculture and construction through to new technologies, tourism and the pharmaceutical industry, economic activities use nature, either by exploiting natural resources (renewable or not), or by exploiting ecosystem services (regulating services, cultural services, etc., see above).
53 (World Economic Forum 2020b).
Economic actors are therefore exposed to the degradation of natural capital, biodiversity and ecosystem services in many ways:
• Risks related to companies’ dependence on nature: companies’ dependence on ecosystem services, especially in terms of regulating the climate and weather events. The pollination service (supply service) is a classic example of the dependence of certain economic actors and value chains on the provision of ecosystem services.
• Risks related to biodiversity loss: companies that exploit natural resources (renewable and non-renewable) are dependent on these stocks of resources. Biodiversity provides so-called “provisioning” services, i.e., nature’s capacity to provide the food, raw materials (such as wood), fresh water and medicinal resources on which some economic actors depend to maintain their activity.
• Transition risks: companies must comply with an increasingly demanding environment with regard to biodiversity conservation (regulatory, technical and operational constraints, customer preferences). This involves capital or operational expenditure to reorient supply chains; to adapt production processes to reduce their impacts; or to install ecosystem monitoring, preservation or restoration systems.
• Reputational risks: companies with a high impact on biodiversity (see Table 1) are likely to be singled out by public, private or civil society actors as being partly responsible for the erosion of biodiversity and this may negatively affect their image, potentially damaging the smooth running of their business. Moreover, the younger generations are increasingly aware of the need to protect biodiversity and companies that are not taking a genuinely virtuous approach may find it difficult to recruit.
What are the consequences for companies?
20 FINANCE & BIODIVERSITY
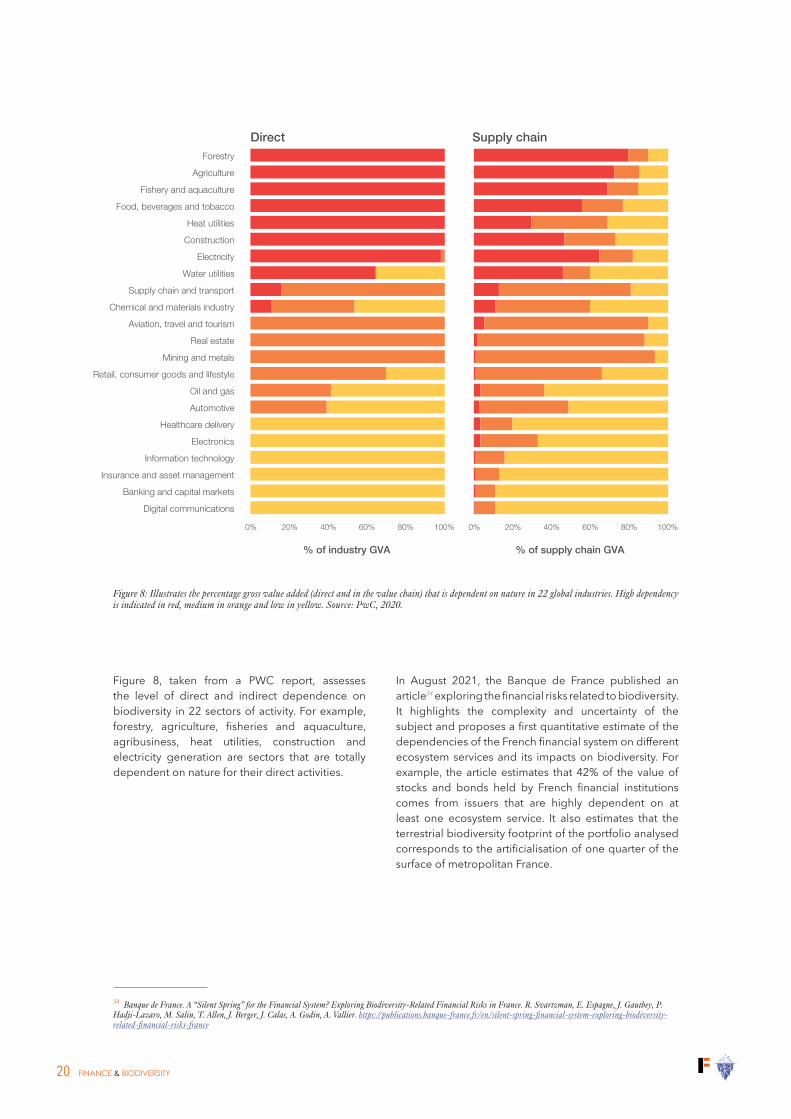
Figure 8, taken from a PWC report, assesses the level of direct and indirect dependence on biodiversity in 22 sectors of activity. For example, forestry, agriculture, fisheries and aquaculture, agribusiness, heat utilities, construction and electricity generation are sectors that are totally dependent on nature for their direct activities.
54 Banque de France. A “Silent Spring” for the Financial System? Exploring Biodiversity-Related Financial Risks in France. R. Svartzman, E. Espagne, J. Gauthey, P. Hadji-Lazaro, M. Salin, T. Allen, J. Berger, J. Calas, A. Godin, A. Vallier. https://publications.banque-france.fr/en/silent-spring-financial-system-exploring-biodiversity-related-financial-risks-france
In August 2021, the Banque de France published an article54 exploring the financial risks related to biodiversity. It highlights the complexity and uncertainty of the subject and proposes a first quantitative estimate of the dependencies of the French financial system on different ecosystem services and its impacts on biodiversity. For example, the article estimates that 42% of the value of stocks and bonds held by French financial institutions comes from issuers that are highly dependent on at least one ecosystem service. It also estimates that the terrestrial biodiversity footprint of the portfolio analysed corresponds to the artificialisation of one quarter of the surface of metropolitan France.
14 Nature Risk Rising
For example, 60% of coffee varieties are in danger of extinction due to climate change, disease and deforestation.44 If this were to happen, global coffee markets – a sector with retail sales of $83 billion in 201745 – would be significantly destabilized, affecting the livelihoods of many smallholder farmers.
Similarly, outbreaks of invasive pests and diseases are a common cause of nature loss that threatens the survival of commercially important crop species with low genetic diversity. More than half of the world’s food comes from just three staples – rice, wheat and maize – which already suffer annual losses of up to 16% of total production (valued at $96 billion) due to invasive species.46 Agricultural crop diversification can improve resilience to pest and disease outbreaks, as well as buffer crop production against the effects of greater climate
change.47 However, monocultures, induced mostly by economic incentives, are still the dominant form of industrial agriculture.48,49
Dependency on nature can vary considerably between different industries and sectors. While the risk to primary industries is straightforward to grasp, the consequences for secondary and tertiary industries can also be significant. For example, six industries – chemicals and materials; aviation, travel and tourism; real estate; mining and metals; supply chain and transport; retail, consumer goods and lifestyle – with less than 15% of their direct GVA highly dependent on nature still have “hidden dependencies” through their supply chains. More than 50% of the GVA of their supply chains is highly or moderately dependent on nature. Figure 4 illustrates in more detail the proportion of GVA exposed to nature loss in 22 global industries.
FIGURE 4: Percentage of direct and supply chain GVA with high, medium and low nature dependency, by industry
Forestry
Agriculture
Fishery and aquaculture
Food, beverages and tobacco
Heat utilities
Construction
Electricity
Water utilities
Supply chain and transport
Chemical and materials industry
Aviation, travel and tourism
Real estate
Mining and metals
Retail, consumer goods and lifestyle
Oil and gas
Automotive
Healthcare delivery
Electronics
Information technology
Insurance and asset management
Banking and capital markets
Digital communications
■ High ■ Medium ■ Low
% of industry GVA
Direct Supply chain
% of supply chain GVA
0% 0%20% 20%40% 40%60% 60%80% 80%100% 100%
Source: PwCFigure 8: Illustrates the percentage gross value added (direct and in the value chain) that is dependent on nature in 22 global industries. High dependency is indicated in red, medium in orange and low in yellow. Source: PwC, 2020.
FINANCE & BIODIVERSITY 21
A global political reflection on biodiversity conservation was launched in 1980 with the “World Conservation Strategy: Living Resource Conservation for Sustainable Development” commissioned by the United Nations Environment Programme (UNEP) and the IUCN. This reflection really took off after the Earth Summit in Rio de Janeiro in 1992 and the establishment of the Convention on Biological Diversity (CBD).
The CBD is the first international convention dealing with biodiversity issues. It is not especially binding on the signatory states, giving them a wide scope for interpreting their commitments. The 6th Conference of the Parties (COP 6) in 2002 was notable for the stronger commitments made by the Heads of State and Government of the Convention, who committed to significantly reduce the rate of global biodiversity loss by 2010. The year 2002 was also marked by the World Summit on Sustainable Development in Johannesburg, which resulted in a similar objective of significantly reducing the current rate of biodiversity loss at global, regional and national levels.
In 2008, the 9th Conference of the Parties (COP 9) agreed to establish the Intergovernmental Science-Policy Platform on Biodiversity and Ecosystem Services (IPBES), which is to biodiversity what the IPCC is to climate.
In 2010, the COP 10 delegates adopted a strategic plan for the period 2011-2020, comprising the Aichi Targets: 20 ambitious targets to halt global biodiversity loss. These include making all people aware of the value of biodiversity and the actions they can take to conserve it and use it sustainably; halving the rate of loss of all natural habitats; preventing the extinction of known threatened species and improving their conservation status; etc.
Despite this succession of international events and commitments to biodiversity conservation since 1990, the decline in biodiversity has continually worsened.
55 (Secretariat of the Convention on Biological Diversity, 2020).
An examination of the results of the 20 Aichi Targets, set for 2020, reveals failure. According to the 5th
Global Biodiversity Outlook Report,55 the CBD member states have failed to achieve any of the 20 targets (although six are in the process of being achieved according to the UN).
For example, the 5th Aichi Target is defined as follows, “By 2020, the rate of loss of all natural habitats, including forests, is at least halved and where feasible brought close to zero, and degradation and fragmentation is significantly reduced.”
In 2020, the Secretariat of the Convention on Biological Diversity considered this target to be unmet. According to the report “Global Biodiversity Outlook 5”, “The recent rate of deforestation is lower than that of the previous decade, but only by about one third, and deforestation may be accelerating again in some areas. Loss, degradation and fragmentation of habitats remains high in forest and other biomes, especially in the most biodiversity-rich ecosystems in tropical regions. Wilderness areas and global wetlands continue to decline. Fragmentation of rivers remains a critical threat to freshwater biodiversity. The target has not been achieved.”
Progress has been limited or non-existent for a third of the targets set out in these conventions, and it is even negative in some cases. As explained above (see Figure 7), these various initiatives have so far failed to halt biodiversity loss.
Biodiversity should have been on the international policy agenda in 2020, but the COVID-19 crisis has pushed these deadlines to 2021.
The COP 15, whose objective is to update the Aichi Targets to produce new ones for the period 2020-2030, with a vision for 2050, is expected be held in China in April 2022 at best (instead of autumn 2020). The World Conservation Congress, organised by the IUCN, which was supposed to take place in Marseille in June 2020, was held in September 2021.
THE INTERNATIONAL BIODIVERSITY CONSERVATION AGENDA
22 FINANCE & BIODIVERSITY
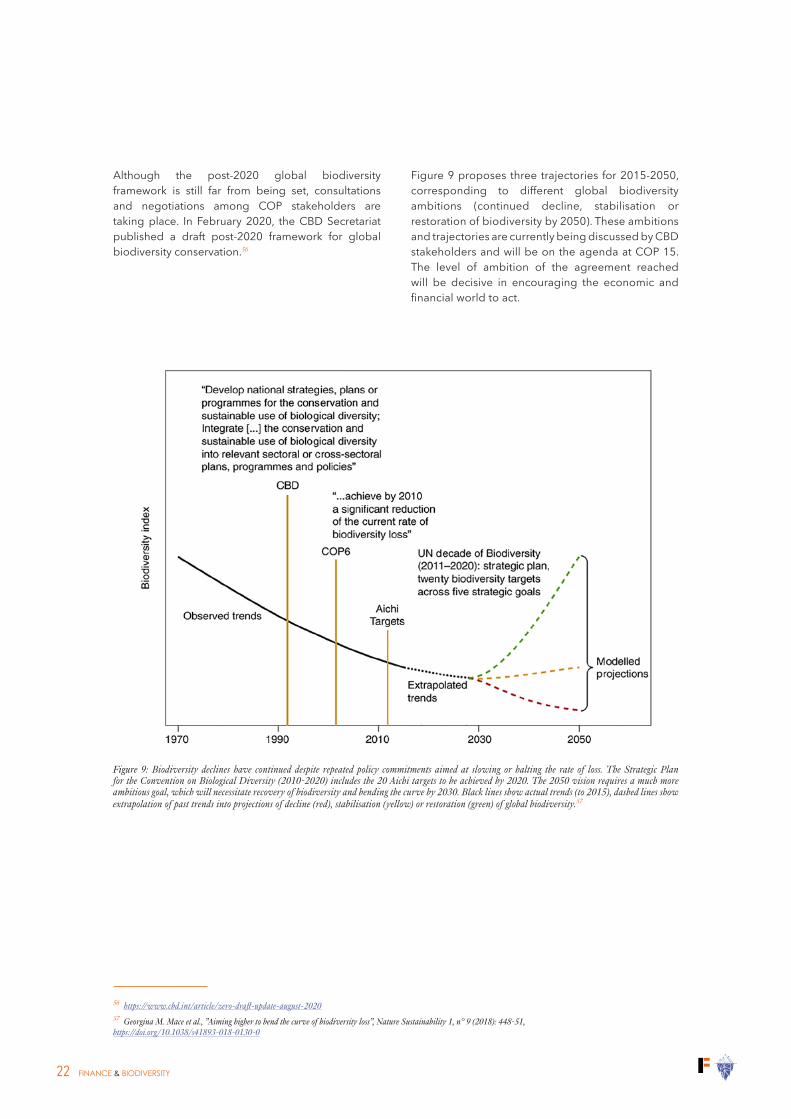
Although the post-2020 global biodiversity framework is still far from being set, consultations and negotiations among COP stakeholders are taking place. In February 2020, the CBD Secretariat published a draft post-2020 framework for global biodiversity conservation.56
56 https://www.cbd.int/article/zero-draft-update-august-202057 Georgina M. Mace et al., ”Aiming higher to bend the curve of biodiversity loss”, Nature Sustainability 1, n° 9 (2018): 448-51, https://doi.org/10.1038/s41893-018-0130-0
Figure 9 proposes three trajectories for 2015-2050, corresponding to different global biodiversity ambitions (continued decline, stabilisation or restoration of biodiversity by 2050). These ambitions and trajectories are currently being discussed by CBD stakeholders and will be on the agenda at COP 15. The level of ambition of the agreement reached will be decisive in encouraging the economic and financial world to act.
Figure 9: Biodiversity declines have continued despite repeated policy commitments aimed at slowing or halting the rate of loss. The Strategic Plan for the Convention on Biological Diversity (2010-2020) includes the 20 Aichi targets to be achieved by 2020. The 2050 vision requires a much more ambitious goal, which will necessitate recovery of biodiversity and bending the curve by 2030. Black lines show actual trends (to 2015), dashed lines show extrapolation of past trends into projections of decline (red), stabilisation (yellow) or restoration (green) of global biodiversity.57
FINANCE & BIODIVERSITY 23
THE ROLE OF INVESTORS IN BIODIVERSITY CONSERVATION
CONSERVATION FINANCE
Biodiversity has a very significant economic value
Valuing nature’s contribution to global wealth in economic terms is a problem that continues to mobilise significant research efforts. This raises the question of valuing nature, but also of the economic evaluation of ecosystem services. This requires a detailed and exhaustive understanding of the functioning of natural systems, which researchers are still far from having achieved.
Nevertheless, there have been several attempts to quantify the value of nature. An authoritative study by the Crawford School of Public Policy58 defines the value of ecosystem services as the relative contribution of ecosystems to the goal of sustainable human well-being. Although it examines the monetary value of ecosystem services, the report is careful not to refer to the market value
58 (Costanza et al, 2014).59 World Economic Forum, ”Nature Risk Rising: Why the Crisis Engulfing Nature Matters for Business and the Economy”, 2020, http://www3.weforum.org/docs/WEF_New_Nature_Economy_Report_2020.pdf60 Jon Strand et al., ”Spatially Explicit Valuation of the Brazilian Amazon Forest’s Ecosystem Services”, Nature Sustainability 1, n° 11 (November 2018): 657-64, https://doi.org/10.1038/s41893-018-0175-0 et A. M. Makarieva et al., ”Why Does Air Passage over Forest Yield More Rain? Examining the Coupling between Rainfall, Pressure, and Atmospheric Moisture Content*”, Journal of Hydrometeorology 15, n° 1 (1 February 2014): 411-26, https://doi.org/10.1175/JHM-D-12-0190.1
of nature. In 2011, global ecosystem services were estimated to be worth between US$125-145 trillion per year and the loss of ecosystem services, due to land-use change alone, were estimated at between US$4.3-20.2 trillion per year (depending on the unit values used).
In a 2020 report, the World Economic Forum59 estimated that US$44 trillion of economic value generation is highly or moderately dependent on nature, namely half of global GDP. Other studies60 show that if deforestation continues in Latin America and if 20-25% of the forest area existing in 1990 disappears (we were at about -17% in 2020), droughts will increase significantly in the region, leading to agricultural production losses in the order of US$422 million for Brazil alone.
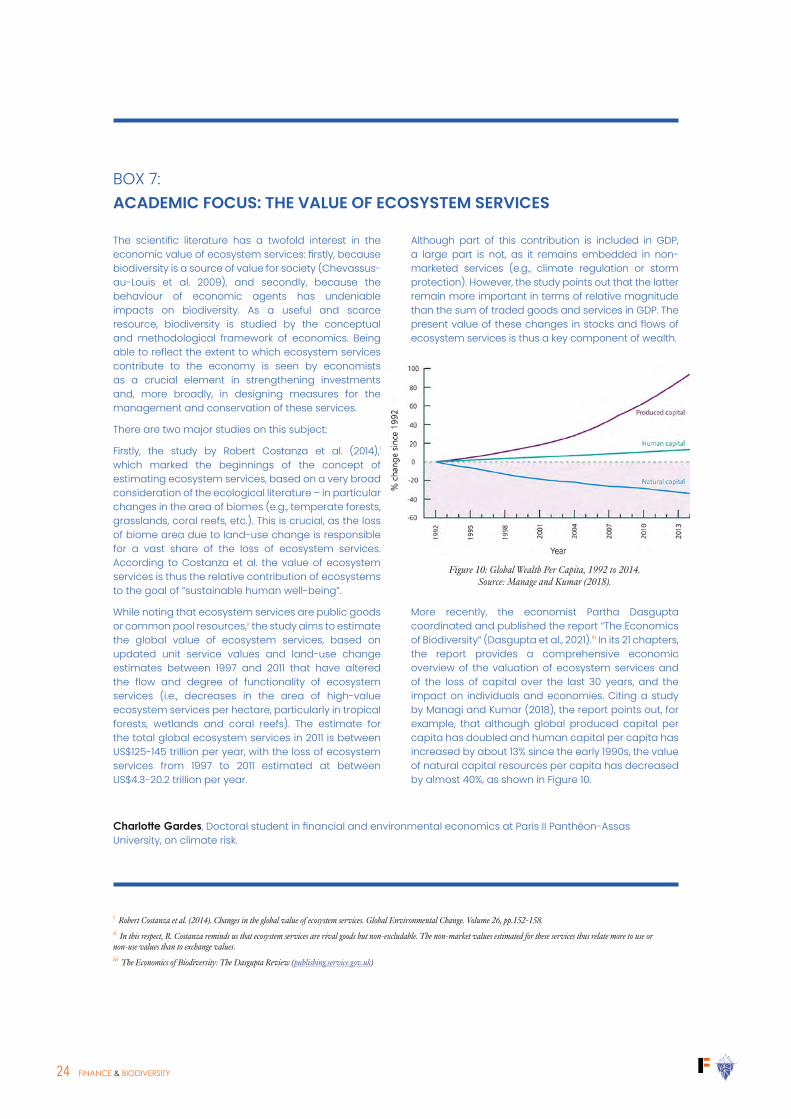
24 FINANCE & BIODIVERSITY
The scientific literature has a twofold interest in the economic value of ecosystem services: firstly, because biodiversity is a source of value for society (Chevassus-au-Louis et al. 2009), and secondly, because the behaviour of economic agents has undeniable impacts on biodiversity. As a useful and scarce resource, biodiversity is studied by the conceptual and methodological framework of economics. Being able to reflect the extent to which ecosystem services contribute to the economy is seen by economists as a crucial element in strengthening investments and, more broadly, in designing measures for the management and conservation of these services.
There are two major studies on this subject:
Firstly, the study by Robert Costanza et al. (2014),i which marked the beginnings of the concept of estimating ecosystem services, based on a very broad consideration of the ecological literature – in particular changes in the area of biomes (e.g., temperate forests, grasslands, coral reefs, etc.). This is crucial, as the loss of biome area due to land-use change is responsible for a vast share of the loss of ecosystem services. According to Costanza et al. the value of ecosystem services is thus the relative contribution of ecosystems to the goal of “sustainable human well-being”.
While noting that ecosystem services are public goods or common pool resources,ii the study aims to estimate the global value of ecosystem services, based on updated unit service values and land-use change estimates between 1997 and 2011 that have altered the flow and degree of functionality of ecosystem services (i.e., decreases in the area of high-value ecosystem services per hectare, particularly in tropical forests, wetlands and coral reefs). The estimate for the total global ecosystem services in 2011 is between US$125-145 trillion per year, with the loss of ecosystem services from 1997 to 2011 estimated at between US$4.3-20.2 trillion per year.
Although part of this contribution is included in GDP, a large part is not, as it remains embedded in non-marketed services (e.g., climate regulation or storm protection). However, the study points out that the latter remain more important in terms of relative magnitude than the sum of traded goods and services in GDP. The present value of these changes in stocks and flows of ecosystem services is thus a key component of wealth.
Figure 10: Global Wealth Per Capita, 1992 to 2014. Source: Manage and Kumar (2018).
More recently, the economist Partha Dasgupta coordinated and published the report “The Economics of Biodiversity” (Dasgupta et al., 2021).iii In its 21 chapters, the report provides a comprehensive economic overview of the valuation of ecosystem services and of the loss of capital over the last 30 years, and the impact on individuals and economies. Citing a study by Managi and Kumar (2018), the report points out, for example, that although global produced capital per capita has doubled and human capital per capita has increased by about 13% since the early 1990s, the value of natural capital resources per capita has decreased by almost 40%, as shown in Figure 10.
BOX 7: ACADEMIC FOCUS: THE VALUE OF ECOSYSTEM SERVICES
Charlotte Gardes, Doctoral student in financial and environmental economics at Paris II Panthéon-Assas University, on climate risk.
i Robert Costanza et al. (2014). Changes in the global value of ecosystem services. Global Environmental Change. Volume 26, pp.152-158.ii In this respect, R. Costanza reminds us that ecosystem services are rival goods but non-excludable. The non-market values estimated for these services thus relate more to use or non-use values than to exchange values.iii The Economics of Biodiversity: The Dasgupta Review (publishing.service.gov.uk)
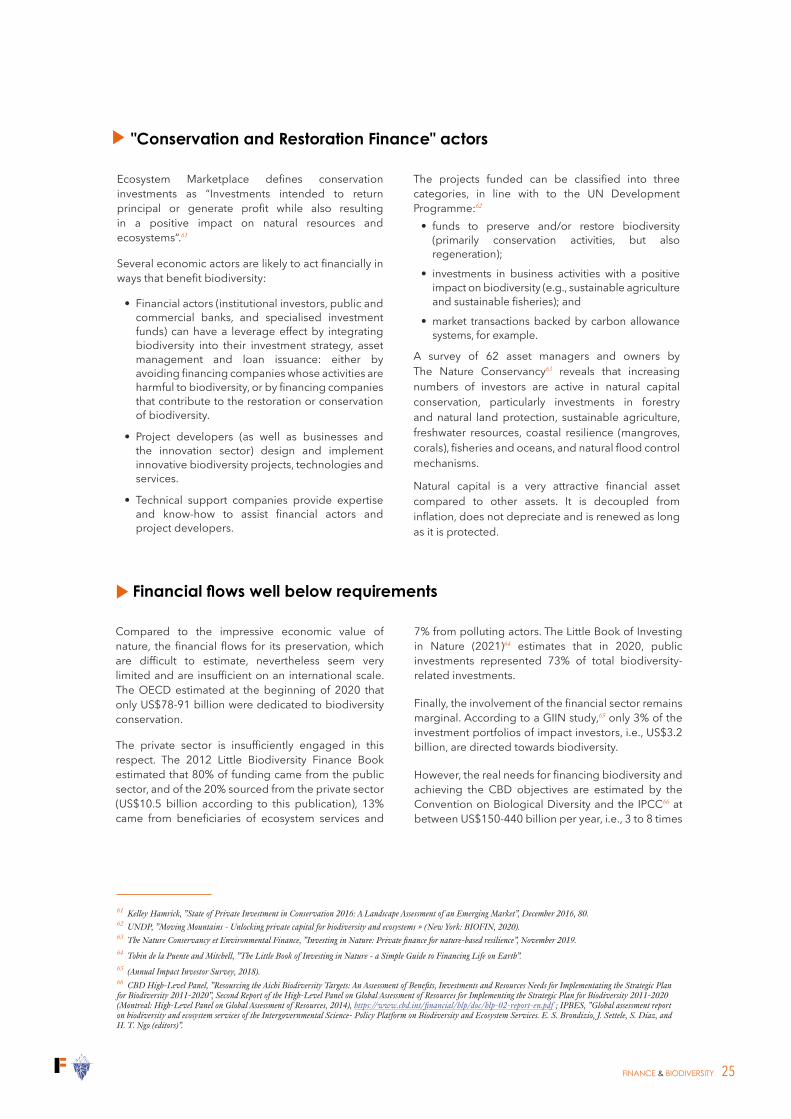
FINANCE & BIODIVERSITY 25
"Conservation and Restoration Finance" actors
Ecosystem Marketplace defines conservation investments as “Investments intended to return principal or generate profit while also resulting in a positive impact on natural resources and ecosystems“.61
Several economic actors are likely to act financially in ways that benefit biodiversity:
• Financial actors (institutional investors, public and commercial banks, and specialised investment funds) can have a leverage effect by integrating biodiversity into their investment strategy, asset management and loan issuance: either by avoiding financing companies whose activities are harmful to biodiversity, or by financing companies that contribute to the restoration or conservation of biodiversity.
• Project developers (as well as businesses and the innovation sector) design and implement innovative biodiversity projects, technologies and services.
• Technical support companies provide expertise and know-how to assist financial actors and project developers.
61 Kelley Hamrick, ”State of Private Investment in Conservation 2016: A Landscape Assessment of an Emerging Market”, December 2016, 80.62 UNDP, ”Moving Mountains - Unlocking private capital for biodiversity and ecosystems » (New York: BIOFIN, 2020).63 The Nature Conservancy et Environmental Finance, ”Investing in Nature: Private finance for nature-based resilience”, November 2019. 64 Tobin de la Puente and Mitchell, ”The Little Book of Investing in Nature - a Simple Guide to Financing Life on Earth”.65 (Annual Impact Investor Survey, 2018). 66 CBD High-Level Panel, ”Resourcing the Aichi Biodiversity Targets: An Assessment of Benefits, Investments and Resources Needs for Implementating the Strategic Plan for Biodiversity 2011-2020”, Second Report of the High-Level Panel on Global Assessment of Resources for Implementing the Strategic Plan for Biodiversity 2011-2020 (Montreal: High-Level Panel on Global Assessment of Resources, 2014), https://www.cbd.int/financial/hlp/doc/hlp-02-report-en.pdf ; IPBES, ”Global assessment report on biodiversity and ecosystem services of the Intergovernmental Science- Policy Platform on Biodiversity and Ecosystem Services. E. S. Brondizio, J. Settele, S. Díaz, and H. T. Ngo (editors)”.
The projects funded can be classified into three categories, in line with to the UN Development Programme:62
• funds to preserve and/or restore biodiversity (primarily conservation activities, but also regeneration);
• investments in business activities with a positive impact on biodiversity (e.g., sustainable agriculture and sustainable fisheries); and
• market transactions backed by carbon allowance systems, for example.
A survey of 62 asset managers and owners by The Nature Conservancy63 reveals that increasing numbers of investors are active in natural capital conservation, particularly investments in forestry and natural land protection, sustainable agriculture, freshwater resources, coastal resilience (mangroves, corals), fisheries and oceans, and natural flood control mechanisms.
Natural capital is a very attractive financial asset compared to other assets. It is decoupled from inflation, does not depreciate and is renewed as long as it is protected.
Financial flows well below requirements
Compared to the impressive economic value of nature, the financial flows for its preservation, which are difficult to estimate, nevertheless seem very limited and are insufficient on an international scale. The OECD estimated at the beginning of 2020 that only US$78-91 billion were dedicated to biodiversity conservation.
The private sector is insufficiently engaged in this respect. The 2012 Little Biodiversity Finance Book estimated that 80% of funding came from the public sector, and of the 20% sourced from the private sector (US$10.5 billion according to this publication), 13% came from beneficiaries of ecosystem services and
7% from polluting actors. The Little Book of Investing in Nature (2021)64 estimates that in 2020, public investments represented 73% of total biodiversity-related investments.
Finally, the involvement of the financial sector remains marginal. According to a GIIN study,65 only 3% of the investment portfolios of impact investors, i.e., US$3.2 billion, are directed towards biodiversity.
However, the real needs for financing biodiversity and achieving the CBD objectives are estimated by the Convention on Biological Diversity and the IPCC66 at between US$150-440 billion per year, i.e., 3 to 8 times
26 FINANCE & BIODIVERSITY
the funds mobilised in 2010. Credit Suisse and WWF Switzerland67 estimate that conservation investment needs are in the order of US$200-300 billion per year. A study published in 202068 following a collaboration between the Paulson Institute, The Nature Conservancy and the Cornell Atkinson Center for Sustainability gave higher figures: an estimated US$722-967 billion are required to protect biodiversity. The financing gap to ensure the conservation of natural capital may be in the order of 80-85% of this amount, representing between US$600-850 billion.
Soil conservation is the most capital-intensive area. It is also the major cause of biodiversity loss (see Part 1), with half of the world’s arable land currently dedicated to agriculture. By 2050, around 45% of global capital needs will relate to supporting the transition to sustainable agriculture (reduction of nitrogen fertiliser and pesticide use), according to a joint study by the Paulson Institute, The Nature Conservancy and the Cornell Atkinson Center for Sustainability.69
Another funding need is the fight against invasive species, including research and development, control and eradication. The funds required are expected to amount to US$36 billion by 2050.70
The market is therefore far from being sufficiently mobilised, which can be explained by the lack of tools for valuing natural assets. The financial markets calculate the value of these assets in terms of future cash flows or their market value. The value of nature itself, the services it provides and the cost of using natural capital are not accounted for, so this value is not currently captured by the market.
67 Crédit Suisse and WWF Switzerland, ”Conservation Finance Moving beyond Donor Funding toward an Investor-Driven Approach”, 2014, https://www.cbd.int/financial/privatesector/g-private-wwf.pdf68 (The Paulson Institute, The Nature Conservancy and Cornell Atkinson Center for Sustainability, 2020).69 Ibid. 70 Ibid. 71 (Deutz et al. 2020).
Biodiversity, and more broadly natural capital, are subject to the “tragedy of the commons” (as theorised by Garrett Hardin in 1968), and in particular to the free rider problem (Olson, 1965). Individuals and societies can overexploit natural services beyond their sustainability limits without bearing the cost of this destruction. In addition to this problem, there is the issue of the mobility of animal species, since while a forest is a real estate asset that can be valued, the life that inhabits it is not. It is also mobile and sensitive to potentially external pollution.
Finally, the financial flows dedicated to activities that have a negative impact on biodiversity (see Table 1) represent two to four times those currently dedicated to conservation, with a study by Deutz et al. 2020 estimating that these “brown” flows represent around US$275-540 billion per year.71
In this global context where financial flows have not yet risen to the challenge, spending on biodiversity nevertheless more than doubled in France between 2000 and 2015. In 2017, EUR 2,226 million were mobilised for the conservation of biodiversity and landscapes (National Biodiversity Observatory) and the objective of the Grenelle 1 law of 2009 to increase State spending to EUR 300 million per year by 2013 has been achieved. France has also made an international commitment to fund biodiversity initiatives as part of its official development assistance and to maintain a level of aid of at least EUR 212 million per year until 2020.

FINANCE & BIODIVERSITY 27
• The “Business for Nature” coalition: this coalition of 60 organisations encourages businesses to take action against biodiversity loss, and calls for ambitious policy measures on this issue, including the adoption of a global framework for biodiversity following the 2020 UN Convention on Biological Diversity (CBD COP 15);
• The “Act4Nature” alliance: a biodiversity initiative for French businesses with international activities, launched by the Entreprises pour l’Environnement (EpE) association in 2018. Its aim is to mobilise companies on the issue of their direct and indirect impacts, their dependencies and their possible actions to support nature;
• The Natural Capital Finance Alliance (NCFA): a collaboration between the UNEP-FI, the Global Canopy NGO and engaged financial institutions (Actiam, ASN Bank, Caisse des Dépôts, City Group, IFC, Robeco, UniCredit, etc.). It aims to mobilise the financial sector and explore avenues for action. In particular, the NCFA has worked with the Natural Capital Coalition to publish a supplement to the natural capital protocol for investors;
72 Roundtable on Sustainable Palm Oil.73 https://ec.europa.eu/environment/biodiversity/business/about-us/mission-statement/index_en.htm
• The Principles for Responsible Banking and the Principles for Responsible Investments: coalitions of financial actors carrying out a range of work on responsible investment in the forestry industry (2019) and on sustainable palm oil, in accordance with RSPO criteria (2019);72
• Development of the natural capital risk assessment tool ENCORE (Exploring Natural Capital Opportunities, Risks and Exposure) by a UNEP-FI coalition;
• The EU Business and Biodiversity platform (since 2016, March 2020 call):73 11 commitments, including measuring the footprint of listed stocks and bond portfolios; the public reporting of impacts; and shifting investments away from high-impact sectors to more virtuous investments.
These multilateral initiatives are complemented by individual company commitments (e.g., Solvay, Schneider Electric, Séché Environnement and Veolia).
THE INCREASING MOBILISATION OF INVESTORS
The rise in initiatives
Financial institutions are among the actors with the greatest potential to preserve biodiversity. They can encourage the financing of businesses that are working towards the ecological transition, in particular by integrating the biodiversity criterion into their decision-making chains and investment strategies.
Private sector momentum, marked by the signing of the “Business and Biodiversity Pledge” at COP 13 in Cancun (2016), is evidenced in several significant initiatives to increase the funds available for biodiversity. However, at this stage, the private sector is more focused on impact than on risk management.
Notable initiatives include the following:

28 FINANCE & BIODIVERSITY
A rapidly evolving regulatory framework
At the global level, the creation in 2015 of the 17 UN Sustainable Development Goals and the adoption of the Paris Climate Agreement are important steps forward in international environmental policy.
The European and national regulatory frameworks are also evolving to incorporate new environmental requirements, particularly relating to biodiversity.
In Europe, work on sustainable finance encompasses biodiversity issues
On 7 March 2018, the European Commission published an action plan on financing sustainable growth.78
These actions include:
1. Establishing a sustainable taxonomy: the Taxonomy Regulation (EU/2020/852) aims to establish a classification of economic activities in the European Union according to their sustainability, by harmonising assessment criteria and establishing transparency requirements for companies and market actors. The sustainability of activities is validated by achieving the technical screening criteria set out in delegated acts that cover all EU climate and environmental objectives.
2. Based on this Taxonomy, creating standards and labels for financial products and instruments (such as the Ecolabel for retail financial products (investments, insurance, savings) and the European Green Bond Standard). This will help investors to easily identify investments that meet environmental criteria.
3. Fostering investment in sustainable projects, including by establishing a single investment fund bringing together all EU market-based instruments to further improve the effectiveness of EU support for investment.
4. Incorporating sustainability into financial advice. On 21 April 2021, the European Commission adopted delegated acts supplementing the AIFMD, UCITS and MiFID II directives on sustainable finance. Portfolio managers are required to consider sustainability risks and factors in their internal processes and the scope of financial instruments that can be offered to any client expressing sustainability preferences, subject to the performance of a suitability assessment.
74 https://www.cdc-biodiversite.fr/laction-volontaire/en-savoir-plus-sur-le-club-b4b/ (in French).75 https://www.financeforbiodiversity.org/76 The PBAF partners cooperate in the development of harmonized principles underlying biodiversity impact assessment | PBAF - Partnership for Biodiversity Accounting Financials (pbafglobal.com)77 https://www.mirova.com/en/news/iceberg-data-lab-icare-consult-selected-first-biodiversity-impact-measurement-tool78 https://ec.europa.eu/info/publications/sustainable-finance-renewed-strategy_fr
• The B4B+ Club, led by CDC Biodiversité, brings together companies and financial institutions to develop and test the Global Biodiversity Score (GBS), a tool for measuring the biodiversity footprint of companies and financial institutions, officially launched in May 2020;74
• The Finance for Biodiversity Pledge: in 2020, 26 financial institutions pledged to contribute to the protection of biodiversity through their investments and called on world leaders, on the eve of COP 15, to take ambitious steps in this direction;75
• The Partnership for Biodiversity Accounting Financials (PBAF): a partnership between several financial institutions, close to the Partnership for
Carbon Accounting Financials, which is working on the development of a set of harmonised principles for measuring the impact of investments on biodiversity;76
• The Corporate Biodiversity Footprint (CBF) Steering Committee has been led since September 2020 by Iceberg Data Lab and I Care, following a call from a group of asset managers to develop the provision of biodiversity impact metrics77 (see illustration in the portfolio study on p.39).
Widely reported commitments have also been made by some financial institutions, for example:

FINANCE & BIODIVERSITY 29
5. Developing sustainability benchmarks (low-carbon and Paris Agreement-aligned benchmarks) that provide investors with better information on the carbon footprint of their investments; and require non-financial transparency from all index administrators. These texts were published in November 2020.
6. Better integrating sustainability into ratings and market research: ESMA published guidelines on this in 2019.
7. The EU Regulation of 27 November 2019 on sustainability-related disclosures aims to clarify asset managers’ and institutional investors’ duties regarding the use of sustainability criteria in their investment decisions, and to strengthen their transparency obligations.
8. Integrating sustainability into EU prudential rules: banks and insurance companies are an important source of external finance for the European economy. The Commission is examining whether it is possible to recalibrate capital requirements for banks in line with climate change risks, while ensuring that financial stability is preserved. The EBA has been mandated to carry out this work on the three Basel pillars (capital requirements; supervisory review process; disclosure requirements), in accordance with the CRR / CRD (Capital Requirements Regulation and Capital Requirements Directive).
9. Strengthening sustainability disclosure and accounting rule-making: the guidelines on non-financial reporting were revised in June 2019 and the CSRD (Corporate Sustainability Reporting Directive), currently under negotiation, will revise the rules for European companies in 2021-2022. This revision will also be accompanied by the standardisation of non-financial information, based on the work of EFRAG.79
10. Fostering sustainable corporate governance and attenuating short-termism in capital markets: the European Green Deal, presented by the Commission on 11 December 2019, takes up several of these proposals, with an emphasis on the following:
- Strengthening the corporate governance framework;
- Improving transparency on the climate and environment by revising the NFRD (with the Commission’s proposal in April 2021 of a CSRD – Corporate Sustainability Reporting Directive – which builds on the proposals from the report submitted by Patrick de Cambourg to the Minister of Economy and Finance in June 2019);80
- Developing standardised natural capital accounting practices;
- Adopting an Ecolabel for financial products and a green bond standard;
- The management and integration of climate and environmental risks into the financial system (through the prudential framework); and
- Improving the assessment of physical and transition risks.
These proposals were also included in the new sustainable finance strategy published by the European Commission on 6 July 2021, which follows on from the 2018 Action Plan (not yet fully finalised).81
The European Taxonomy is the technical foundation of this action plan on financing sustainable growth. For example, the future European label for green bonds (proposed by the European Commission in a dedicated regulation in July 2021) will be based on this Taxonomy in order to align the allocation of funds with the activities referenced in the taxonomy.
79 See: News - EFRAG 80 https://www.anc.gouv.fr/files/live/sites/anc/files/contributed/ANC/4_Qui_sommes_nous/Communique_de_presse/Communique_FR_Remise-rapport-Patrick-de-CAMBOURG.pdf (in French).81 https://ec.europa.eu/info/publications/210706-sustainable-finance-strategy_en
The Taxonomy aims to promote six climate and environmental objectives by formalising specific and ambitious technical criteria to determine whether an economic activity contributes significantly to at least one of the objectives without significantly harming any of the other objectives (“do no significant harm”). The robustness of the Taxonomy lies in the fact that, in addition to an eligibility list, it provides a technical analysis of all economic activities, including those in transition. At this stage, the analysis focuses on climate impact and covers about 95% of GHG emissions in the EU (i.e., reduction in greenhouse gas emissions and preservation/enhancement of carbon sinks).

30 FINANCE & BIODIVERSITY
The Taxonomy takes biodiversity into account at two levels:
• One of its objectives is the protection of ecosystems and another is the protection of water and marine resources;
• Together, the objectives cover the main pressures on biodiversity. Achieving these objectives and complying with the “do no significant harm” criterion will therefore help to reduce the impact on biodiversity;
• The technical criteria for contributing to biodiversity targets (i.e., assessing the alignment of turnover, capital expenditure and current operations with the technical criteria of the Taxonomy) should be adopted by the first half of 2022, to come into effect (i.e., publication by financial and non-financial companies of their eligibility and alignment) 12 months after their publication. These criteria were first proposed by the Platform on Sustainable Finance in August 2021, through a dedicated public consultation.
82 https://ec.europa.eu/info/business-economy-euro/banking-and-finance/sustainable-finance/eu-taxonomy-sustainable-activities_en83 Regulation (EU) 2019/2088 of the European Parliament and of the Council of 27 November 2019 on sustainability-related disclosures in the financial services sector.84 Available (in French) at: https://www.legifrance.gouv.fr/jorf/article_jo/JORFARTI00003935599285 See two webinars (in French) here: https://www.tresor.economie.gouv.fr/Evenements/2021/07/07/decret-d-application-de-l-article-29-de-la-loi-energie-climat-quelles-avancees and here: https://www.youtube.com/watch?v=5r9e5CWr37c&feature=youtu.be
In France, strict reporting requirements that include biodiversity
In France, Article 173-VI of the French Energy Transition for Green Growth Law was the first legal obligation in the world to require investors to report on how they considered climate risks in their investment strategy and risk management. This legislation, which significantly influenced the European Commission in its adoption of European disclosure regulation, has led to a significant awareness among financial players in the Paris market of the crucial nature of climate issues in their investment activities. A report on the application of the regulation was published in June 2019 by the French Treasury and the General Commission for Sustainable Development.
In light of the adoption of the EU disclosure regulation in November 201983 (direct application in national law), the French legislator has amended the applicable law (from Article 173-VI) in order to align the scope of market participants concerned by French law with European provisions (adding credit institutions’ portfolio management activities, for example) and to go further than European law in terms of reporting requirements – in particular, with regard to biodiversity issues. Article 29 of the French Energy-Climate Law of November 2019 amended the applicable article of the French Monetary and Financial Code (L. 533-22-1)84 accordingly. More specifically, its implementing decree, published on 27 May 2021, provides for mandatory substantive reporting (an improved “comply or explain”) on (i) investors’ biodiversity alignment strategies, with targets and a plan for continuous improvement; and (ii) the identification, measurement and management of risks arising from biodiversity loss and their integration into investors’ risk management frameworks. In this sense, French legislation goes beyond European law, aiming for a strong commitment to biodiversity from the Paris market.85
Figure 11: The Taxonomy Regulation published on 22 June 2020 establishes four additional environmental objectives to be fully implemented by the end of 2022.82

FINANCE & BIODIVERSITY 31
BIODIVERSITY INVESTMENT APPROACHES
To date, few investors are dedicated to investing in natural capital, but this topic is currently gaining momentum.86 The most popular investment vehicles are likely to remain similar: green bonds, green private equity or green debt, projects directly targeting natural capital and its physical assets (land, forests) and sustainable agriculture. These can be supported by two main mechanisms: direct income from agricultural production or income derived from the resale of certificates quantifying a positive impact, often climate-related.
Investing in projects with sustainable agricultural or forestry production
Sustainable agricultural activities, such as forestry, farmland management or aquaculture are obvious targets for natural capital investment. Revenues from these activities are usually above market prices and conditional on certifications that validate the sustainable nature of the operation.
BOX 8: A BENCHMARK CASE FOR INVESTING IN ECOSYSTEM RESTORATION
86 The Nature Conservancy et Environmental Finance, ”Investing in Nature: Private finance for nature-based resilience”.87 (Appleton, 2002).
A well-studied example of the cost savings that can be made by restoring fragile ecosystems is the restoration of the freshwater chain in the Catskill Mountains, north of New York City.
In the 1990s, New York’s water quality was declining. As a result, the EPA warned that if water quality did not improve, an estimated US$8 billion water treatment plant would be needed. Analyses showed that the decline in water quality was due to pollution affecting the headwater chain in the Catskill Mountains. This pollution was caused by the spread of fertilisers and pesticides as well as leaking sewer pipes, which
saturated the natural filtering capacity of the soil. Studies showed that it would be cheaper to restore the natural treatment and filtration capacity of the soil and re-establish a healthy water chain by encouraging farmers to switch to organic farming and by renovating local wastewater systems. In addition, unused land was purchased to preserve natural areas.
These various investments made it possible to restore water quality with a budget of US$1.5 billion, well below the estimated budget for the water purification plant (not to mention the recurrent operating costs that would have been incurred).87
32 FINANCE & BIODIVERSITY
This type of investment includes voluntary or mandatory offset certificates. Carbon offsets are the most popular instrument to financially value afforestation or reforestation projects.
Established carbon storage standards such as Verra or the Gold Standard have started to address the issue of biodiversity. The Gold Standard, for example, has developed an approach to “Nature-based Solutions” and land-use change. This allows certification of land use activities that sequester carbon or avoid GHG emissions.
A project developed by, among others, the Forest Finance Group was one of the first projects to be certified by the Gold Standard for Land Use & Forests. The project contributes to the restoration of degraded pastures in Panama88 by combining sustainable timber and cocoa production with biodiversity protection and ecosystem restoration measures. This results in carbon sequestration, which is valued through certificates. The project, which covers an area of 13,242 hectares, contributes to a reduction of 3.4 MtCO2eq. The project therefore promotes biodiversity conservation as well as generating revenue from the sale of carbon certificates, the sale of sustainable and certified wood, and the sale of sustainable and certified cocoa.
Another example is the project implemented by Natura, a Brazilian cosmetics company. In order to combat deforestation in the Amazon region and to encourage the preservation of local vegetation, Natura has implemented a “Circular Carbon” project in its production chain. The project remunerates its farmer-suppliers with additional income when they implement nature-based solutions, such as carbon offsets or farming methods that promote biodiversity conservation. The company therefore seeks to reconcile production and conservation while strengthening the resilience of its supply chain. This project is currently being implemented in one of the regions of Brazil most affected by deforestation and the aim is to replicate it in other areas. In addition to
88 https://registry.goldstandard.org/projects/details/1796 and https://www.co2ol.de/en/co2ol-tropical-mix/
carbon credits, water quality credits have also been created. In 2019, the Electric Power Research Institute and First Climate created certificates generated by their Ohio River Basin Water Quality Trading Project. These credits were subsequently transferred to international credit trading markets. This approach achieves water quality objectives by allowing permitted dischargers to sell or buy pollution reduction credits from another source. One credit is equal to one pound of total nitrogen or one pound of total phosphorus and can be purchased online for about US$13. If the demand for water quality credits grows in the same way as the demand for carbon credits, there could be a future profit opportunity stemming from the sale of credits.
Investing in certificate systems that value environmental or climate conservation

FINANCE & BIODIVERSITY 33
HSBC
In 2020, HSBC Asset Management, in partnership with Pollination, a climate change advisory and investment firm, created HSBC Pollination Climate Asset Management. In line with the objectives of the Paris Agreement, the ambition is to fund new approaches to large-scale nature conservation that help tackle climate change and promote biodiversity.
The natural capital asset management company will be active in both emerging and developed markets. By establishing a series of natural capital funds, it will invest in a wide range of long-term nature conservation, protection and enhancement projects including sustainable forestry, sustainable and regenerative agriculture, water supply, blue carbon (from oceans and coastal ecosystems), natural biofuels, or initiatives that contribute to reducing greenhouse gas emissions.
HSBC Pollination Climate Asset Management will manage and value the investments, measuring their impact quantitatively. It will also conduct research to determine appropriate methods for valuing natural capital.
Mirova
Mirova is developing a comprehensive biodiversity strategy. Firstly, it has prioritised biodiversity impact analysis in all its investment strategies, in particular green bonds and environmental equity funds. It has also launched a subsidiary specifically dedicated to natural capital investments, which includes the Land Degradation Neutrality Fund (LDN Fund), the Althelia Climate Fund (ACF) and the Sustainable Ocean Fund (SOF), dedicated to sustainable agriculture, sustainable forestry and coastal ecosystem restoration projects. These funds provide technical assistance to support project promoters, while blended finance mechanisms mobilise institutional investors.
In addition, Mirova, in partnership with AXA IM, BNP Paribas AM and Sycomore AM, has launched a call for expressions of interest for the development of a data tool to assess the aggregate biodiversity footprint of listed equity portfolios. The tool, which will be delivered from the end of 2021, is based on the life cycle assessment of companies’ products and on an analysis of the pressures placed on biodiversity. It should help companies to optimise their portfolios. Mirova participates in the Task Force on Nature-related Financial Disclosures (TNFD), an international policy platform to standardise reporting on biodiversity risks and dependencies for companies and financial institutions. It is also working with the investment community to fill the data gap for measuring biodiversity impacts through its involvement in the Finance for Biodiversity Pledge, a knowledge exchange platform for investors.
BOX 9: INVESTING IN NATURAL CAPITAL: TWO EXAMPLE STRATEGIES

34 FINANCE & BIODIVERSITY
• Searching for eligible projects offering a good risk/return balance is a first cost element for investors in a market where supply remains scarce, although this situation should evolve favourably in the coming years, following the example of carbon projects.
• One of the major obstacles encountered is the size of the projects. A minimum project size, an appropriate legal structure and cash flow are required to amortise the various research, legal and financial costs. To convince investors, projects also need a business model, accounting documents and a track record, which effectively eliminates many small projects that are more focused on measuring their environmental impact. These small projects are generally dependent on finding business angels willing to take a significant risk.
• Another obstacle is the availability of blended finance, i.e., solutions combining public and private funding that aim to finance economic development projects and that also contribute to the SDGs. This type of finance can reduce project risks and thus attract private capital. However, according to an OECD study, the biodiversity-related SDGs (14 & 15) are those for which blended finance mechanisms are least available.
• A final problem is the lack of mechanisms to support investment in natural capital. Public, regulatory and fiscal policies to encourage investment, similar to existing energy and climate mechanisms, would be a powerful support for natural capital development.
• Finally, the lack of knowledge and understanding of the benefits of ecosystem conservation is also an obstacle to the development of this class of investment, underlining the need to increase efforts relating to the issue of biodiversity impact assessment.
PERSPECTIVES FOR THE DEVELOPMENT OF BIODIVERSITY INVESTMENTS
The biodiversity financing gap is very large, but some projects demonstrate that biodiversity restoration or conservation projects can be profitable, as the previous chapter has shown, for example through income from market-based credits, income from sustainable agriculture or savings from biodiversity restoration. However, some obstacles remain to be overcome to ensure the rapid development of this market:

FINANCE & BIODIVERSITY 35
QUANTITATIVE MEASURES OF BIODIVERSITY
WHY BIODIVERSITY MEASUREMENT IS NEEDED
As highlighted in the previous sections, the consideration of natural capital is a major issue for the financial sector and some companies and financial institutions are therefore increasingly interested in natural capital accounting.
This is part of a more general trend where traditional financial performance indicators are gradually being supplemented by a series of indicators providing information on entities’ non-financial performance.89
As a result, there is a strong need for shared natural capital metrics and robust methodologies, similar to those used for climate issues. However, such approaches remain few and far between, especially for financial institutions.90 The Taskforce on Nature-related Financial Disclosures (TNFD), officially launched in spring 2021 and endorsed by the G7 in June 2021, is an informal working group initiated
89 Johan Lammerant, Lars Müller, et Jerome Kisielewicz, ”Critical Assessment of Biodiversity Accounting Approaches for Businesses and Financial Institutions”, 2018.90 (OECD 2019).91 TNFD, ”TNFD - Proposed technical scope - Recommendations for the TNFD”, June 2021, https://tnfd.info/wp-content/uploads/2021/07/TNFD-%E2%80%93-Technical-Scope-3.pdf ; TNFD, ”TNFD - Nature in Scope - A summary of the proposed scope, governance, work plan, communication and resourcing plan of the TNFD”, June 2021, https://tnfd.info/wp-content/uploads/2021/07/TNFD-Nature-in-Scope-2.pdf
by Global Canopy, WWF, the UN Development Programme (UNDP) and the UN Environment Programme Finance Initiative (UNEP-FI). This group, following the results obtained by the Task Force on Climate-related Financial Disclosures (TCFD) in 2017, should issue recommendations by 2023 on measuring the biodiversity impact of companies and portfolios, and on how companies (financial and non-financial) should report on natural capital.
Two initial position papers and recommendations were published in 2021.91
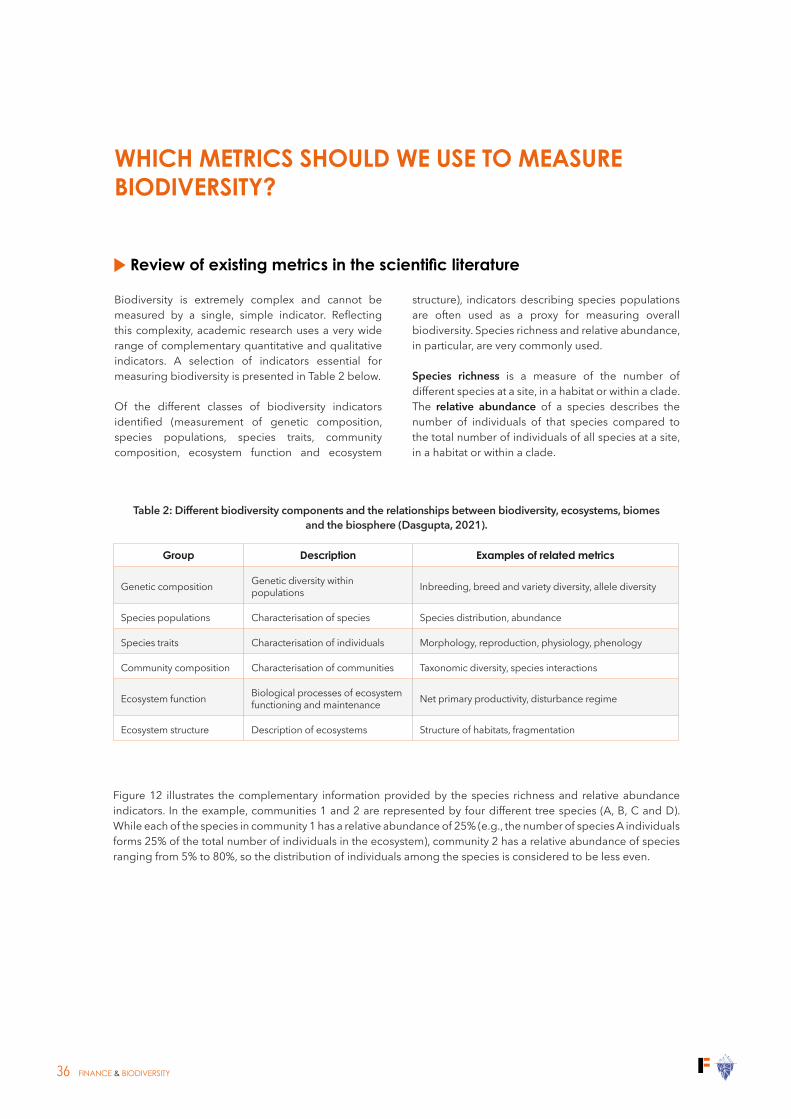
36 FINANCE & BIODIVERSITY
WHICH METRICS SHOULD WE USE TO MEASURE BIODIVERSITY?
Review of existing metrics in the scientific literature
Biodiversity is extremely complex and cannot be measured by a single, simple indicator. Reflecting this complexity, academic research uses a very wide range of complementary quantitative and qualitative indicators. A selection of indicators essential for measuring biodiversity is presented in Table 2 below.
Of the different classes of biodiversity indicators identified (measurement of genetic composition, species populations, species traits, community composition, ecosystem function and ecosystem
structure), indicators describing species populations are often used as a proxy for measuring overall biodiversity. Species richness and relative abundance, in particular, are very commonly used.
Species richness is a measure of the number of different species at a site, in a habitat or within a clade. The relative abundance of a species describes the number of individuals of that species compared to the total number of individuals of all species at a site, in a habitat or within a clade.
Table 2: Different biodiversity components and the relationships between biodiversity, ecosystems, biomes and the biosphere (Dasgupta, 2021).
Group Description Examples of related metrics
Genetic composition Genetic diversity within populations Inbreeding, breed and variety diversity, allele diversity
Species populations Characterisation of species Species distribution, abundance
Species traits Characterisation of individuals Morphology, reproduction, physiology, phenology
Community composition Characterisation of communities Taxonomic diversity, species interactions
Ecosystem function Biological processes of ecosystem functioning and maintenance Net primary productivity, disturbance regime
Ecosystem structure Description of ecosystems Structure of habitats, fragmentation
Figure 12 illustrates the complementary information provided by the species richness and relative abundance indicators. In the example, communities 1 and 2 are represented by four different tree species (A, B, C and D). While each of the species in community 1 has a relative abundance of 25% (e.g., the number of species A individuals forms 25% of the total number of individuals in the ecosystem), community 2 has a relative abundance of species ranging from 5% to 80%, so the distribution of individuals among the species is considered to be less even.

FINANCE & BIODIVERSITY 37
These indicators of richness and abundance therefore provide complementary information for measuring the biodiversity of an ecosystem.
A series of measurement units can be used to approximate the actual state of biodiversity by measuring one or more of the components (presented in Figure 6). They also meet all the necessary criteria for encouraging the private sector to promote the biodiversity footprint measure.
Figure 12: Two tree communities illustrating the complementary information provided by the species richness and relative abundance indicators.
92 Rob Alkemade et al., ”GLOBIO3: A framework to investigate options for reducing global terrestrial biodiversity loss”, Ecosystems 12, n° 3 (2009): 374-90, https://doi.org/10.1007/s10021-009-9229-593 M.J. Goedkoop et al., ”ReCiPe 2008. A life cycle impact assessment method which comprises harmonised category indicators at the midpoint and the endpoint level. First edition (version 1.08). Report I: Characterisation.”, 2013, http://www.lcia-recipe.net94 T Koellner et RW Scholz, ”Assessment of land use impacts on the natural environment. Part 2: Generic characterization factors for local species diversity in Central Europe”, Int J LCA 1 (1 January 2008): 32-48.95 R. J. Scholes and R. Biggs, ”A Biodiversity Intactness Index.”, Nature 434 (2005): 45-50.96 Tim Newbold et al., ”Has land use pushed terrestrial biodiversity beyond the planetary boundary? A global assessment”, Science 353, n° 6296 (15 July 2016): 288 LP - 291, https://doi.org/10.1126/science.aaf220197 Lawrence N. Hudson et al., ”The database of the PREDICTS (Projecting Responses of Ecological Diversity In Changing Terrestrial Systems) project”, Ecology and Evolution 7, n° 1 (2017): 145-88, https://doi.org/10.1002/ece3.257998 RIVM, ”Biodiversity: How much is left? The Natural Capital Index framework (NCI)”, 2002.
These measurement units include (but are not limited to):
• The Mean Species Abundance (MSA) is a biodiversity indicator expressing the average relative abundance of original species compared to their abundance in undisturbed ecosystems. It was proposed as part of the development of the GLOBIO3 model,92 the objective of which is to simulate the impact of different human pressure scenarios on biodiversity.
• The Potentially Disappeared Fraction (PDF) of species is a species richness indicator developed as part of the ReCiPe method.93 It uses the results of life cycle assessment databases to translate environmental pressures into damage to biodiversity (local and regional), human health and natural resources.
• The Ecological Damage Potential (EDP)94 is an impact factor measuring the effects of land use and its intensity on species richness, expressed by number of species.
• The Local Biodiversity Intactness Index (LBII) estimates the remaining proportion of terrestrial biodiversity on a site after human-induced land use dynamics. The Biodiversity Intactness Index95 was developed as part of the PREDICTS96 project, which contains one of the largest and most geographically and taxonomically representative databases of spatial comparisons of biodiversity to date.97
• The Natural Capital Index (NCI) is an indicator proposed by the Dutch National Institute for Public Health and the Environment (RIVM)98 to measure the level of biodiversity conservation at the ecosystem level, compared to a benchmark situation. For a given ecosystem, it is a combination of the quantity (percentage of area remaining compared to the original state) and the quality of the ecosystem studied compared to the original state (expressed as relative abundance).

38 FINANCE & BIODIVERSITY
As yet, no reliable system of biodiversity metrics is universally recognised for assessing the biodiversity footprint of businesses and financial institutions. There is currently no simple unit (similar to the tonnes of CO2 equivalent for carbon footprint measurement) encompassing all facets of biodiversity that can be used to comprehensively measure the biodiversity footprint.
In addition, to fully meet the needs of the financial sector, an indicator must meet the series of criteria presented in Table 3. Among the most important are its quantitative aspect, its ability to be aggregated (at the project, company or investment portfolio level) and its responsiveness to changes in the practices of the companies being evaluated.
What do investors need?
Table 3: Criteria for selecting an indicator for the quantitative measurement of a company’s biodiversity footprint
Selection criteria Description
Quantitative The indicator should enable the company’s impact on biodiversity to be assessed quantitatively.
Aggregatable It should be possible to aggregate the indicator from the smallest assessment scale (site or product / service) to the highest (portfolio and/or country).
Material The indicator should cover the main impacts on biodiversity.
Discriminant The indicator should make it possible to distinguish the performance of companies according to their practices.
Accessible It should be possible to calculate the indicator using publicly available information.
REVIEW OF EXISTING METHODS FOR MEASURING THE BIODIVERSITY FOOTPRINT
In response to the different requirements of the financial world, and based on the biodiversity impact measurement metrics presented above, several methods exist for the financial sector.
The most elaborate of these methods are constructed using a common approach:
1. Define the scope of the assessment: Company-wide, product, site or portfolio assessment.
2. Calculate environmental pressures: environmental pressures are calculated on the basis of the company’s sector, reporting or activity (greenhouse gas emissions, nitrogen oxides, discharge of toxic products into the environment, etc.).
3. Quantify the impacts on biodiversity: these pressures are converted into qualified impacts or scores via damage functions, mathematical functions linking a type of pressure to its quantified impact on biodiversity.
99 https://ec.europa.eu/environment/biodiversity/business/assets/pdf/EU%20B@B%20Platform%20Update%20Report%203_FINAL_1March2021.pdf
For the most part, these methodologies focus exclusively on evaluating negative impacts on biodiversity, with the aim of encouraging the companies assessed to avoid and minimise their impacts.
On the other hand, although taking positive impacts into account might also appear essential for valuing management decisions, it remains a largely under-investigated field that requires further work in order to avoid the risk of “greenwashing”.
The EU Business@Biodiversity Platform provides a review of the different approaches used today as well as case studies shared by the developers of these methods, providing a basis for comparison for investors looking for tools tailored to their needs. The latest review of existing methods was published in March 2021.99

FINANCE & BIODIVERSITY 39
LIMITATIONS OF A SINGLE QUANTITATIVE MEASURE
Biodiversity footprint measurement is evolving and emerging. It is attracting growing interest from companies and investors. With a growing volume of practical applications and feedback, existing methodologies should be significantly improved in the future.
Biodiversity is extremely complex to measure. Quantitative measurement using a single metric or an aggregate score results in a significant loss of information. The existing approaches are therefore useful for measuring the biodiversity footprint (reporting, investment strategies) and for accelerating the consideration of biodiversity issues, but they are only an imitation of reality. Indeed, non-financial accounting is about more than trying to accurately measure an exact footprint. It must be used to order
priorities and to measure the effects of a policy to exclude actors / products with the most aggressive impacts on biodiversity or to promote the most virtuous.
In the future, it is therefore possible that a diverse range of metrics will be added to those currently available in order to provide a complementary level of information (genetic composition, specific traits, community composition, ecosystem structure, ecosystem function, etc.).
However, the complexity of the task should not be an excuse for inaction, as existing footprint measures can be used to establish an initial diagnosis of a portfolio’s impact and to prioritise selection, advocacy or exclusion actions.
SETTING A BENCHMARK TRAJECTORY AS A SHARED OBJECTIVE
Beyond impact measurement, a major challenge in reducing the impact of financial actors on the erosion of biodiversity is to define a global and sectoral trajectory, in line with the 2°C climate trajectory.
The recent publication of the “Zero Draft of the post-2020 Global Biodiversity Framework” by the Convention on Biological Diversity100 marks a new stage in the definition of Science Based Targets (SBTs). The SBT initiative (SBTi) enables companies to align their greenhouse gas reduction targets with a 2°C trajectory in their respective sectors. The preliminary draft published by the CBD feeds into the SBTi’s research work by providing a global trajectory characterised by precise indicators, to be broken down by sector and geography.
100 CBD, ”PREPARATION OF THE POST-2020 GLOBAL BIODIVERSITY FRAMEWORK. Draft recommendation submitted by the Co-Chairs.”, 2020, https://doi.org/10.1017/CBO9781107415324.004
This project includes:
• Targets for maintaining freshwater, marine and terrestrial ecosystems: no net loss by 2030, then increases of 20% by 2050.
• Restoration of 50% of degraded ecosystem areas.
• Reductions in the percentage of threatened species and increases in species abundance by 2030 and 2050 (quantitative thresholds are being defined by the CBD).
• Genetic diversity is maintained or enhanced on average by 2030, and maintained or enhanced for 90% of species by 2050.
The 2021 meetings and the work of the various multilateral and private initiatives will be critical for defining these sectoral trajectories, which provide a basis for establishing a shared vision for action by redirecting funding flows to stabilise and then restore the richness of biodiversity and the ecosystem services essential to the people who depend on them.

40 FINANCE & BIODIVERSITY
Investors have taken on the task of managing their climate impact through carbon footprint assessments, which have become standard practice. Assessing their impact on biodiversity loss can reproduce this type of approach, and circulating these measures will help to redeploy financial capital towards the conservation of natural capital.
To illustrate this approach in concrete terms, we estimated the footprint of an equally weighted portfolio of around 350 sectorally diversified European stocks. Its biodiversity footprint was estimated using the Corporate Biodiversity Footprint (CBF) and the results are expressed in MSA.km2 (mean species abundance per square kilometre).
The results show a concentration of impact in the food, metals and chemical sectors, across their value chain (scope 3). The main sources of pressure are
land-use change in the food sector and the release of greenhouse gases and pollutants in the metals and chemicals sectors.
Companies’ impact on biodiversity depends on their production process, products and supply chain. In order to compare companies with their sector peers, an intensity indicator is calculated as a ratio between the absolute footprint and physical or financial indicators (physical or financial CBF ratio - e.g., MSA.km2/MWh in the power generation sector).
The distribution of results is wide, showing significant differences in impact between different actors within the same sector.
Investors can use this type of exercise to implement policies to reduce the impact of their portfolios. It can also be used to set priorities in terms of shareholder engagement.
BOX 10: ASSESSING THE BIODIVERSITY FOOTPRINT OF AN INVESTMENT PORTFOLIOExample using the Corporate Biodiversity Footprint methodology
Source: Iceberg Data Lab, CBF Database

FINANCE & BIODIVERSITY 41
Distribution of biodiversity intensity results for 34 companies in the agri-food sector.
By way of illustration, adjusting the allocation towards lower-impact actors in higher-stake sectors would lead to a reduction in portfolio impact of around 50%.

42 FINANCE & BIODIVERSITY
Abundance: the number of individuals per unit area for a given species.
Aquifers: geological formations that temporarily or permanently contain water. They consist of permeable rocks and are capable of releasing water naturally and/or by exploitation.
Biodiversity (ou Biological Diversity): the “variability among living organisms from all sources including, inter alia, terrestrial, marine and other aquatic ecosystems and the ecological complexes of which they are part: this includes diversity within species, between species and of ecosystems”.101
Chimeras: an order of cartilaginous fish, cousins of rays and sharks. Chimeras live very deep in the abyss.
Clade: a grouping of several phyla of plants or animals having a common organisation and origin.
Climate change: “a change of climate which is attributed directly or indirectly to human activity that alters the composition of the global atmosphere and which is in addition to natural climate variability observed over comparable time periods.102
Cycad: a tropical plant of the Cycadales order with unbranched stems and a crown of fern-like leaves.
Dicot: a plant whose seed has two cotyledons, usually equal.
Ecosystem services: the goods and services that humans can obtain from ecosystems, directly or indirectly, to ensure their well-being (food, water quality, landscape, etc.).
EPA (Environmental Protection Agency): an independent agency of the US government.
ESG: Environment, Social and (Corporate) Governance.
Food web: represents all the food interactions between living beings in an ecosystem. These interactions include, for example, predation, parasitism, the decomposition of organic matter and the consumption of plants.
Hypoxic zone: dead zones, or hypoxic zones, are areas in aquatic (marine or freshwater) ecosystems where oxygen levels are at their lowest, causing asphyxiation of the local fauna and flora.
IPBES (Intergovernmental Science-Policy Platform on Biodiversity and Ecosystem Services): an international group of experts on biodiversity.
101 United Nations, ”CONVENTION ON BIOLOGICAL DIVERSITY”, 1992.102 UNITED NATIONS FRAMEWORK CONVENTION ON CLIMATE CHANGE: https://unfccc.int/resource/ccsites/haiti/ccweb/conven/text/textcomplet.html
IUCN: the International Union for Conservation of Nature is one of the world’s leading non-governmental organisations dedicated to nature conservation.
Millenium Ecosystem Assessment: a study commissioned in 2000 by UN Secretary General Kofi Annan and conducted between 2001 and 2005 with over 1,300 scientists from around the world. Its objective was to assess the consequences of ecosystem change on human well-being in order to establish the scientific basis for implementing the actions needed to improve the conservation and sustainable use of these systems and their contribution to human well-being.
MSA (Mean Species Abundance): a biodiversity indicator calculated as the average relative abundance of individual species under influence of a given pressure compared to their abundance in undisturbed ecosystems, within a given area or ecosystem.
Natural capital: as defined by the Natural Capital Coalition, “The stock of renewable and non-renewable natural resources (e.g., plants, animals, air, water, soils, minerals) that combine to yield a flow of benefits to people.”
Natural Capital Coalition: a global open-source multi-stakeholder platform to support the development of corporate natural capital assessment methods.
PBL (Netherlands Environmental Assessment Agency): national institute for strategic policy analysis in the fields of the environment, nature and spatial planning.
PDF (Potentially Disappeared Fraction): a metric for measuring biodiversity. It represents a fraction of species richness that may potentially be lost due to an environmental mechanism.
Prudential standards: regulations imposed on credit institutions by regulators in order to avoid excessive and risky commitments and thus ensure financial stability.
Richness: refers to the number of species present in a given environment.
Soil and climatic requirements: the range of climatic conditions (rainfall, temperature, etc.) and chemical and physical conditions of a soil in which a plant can thrive (pH, texture, availability of mineral elements).
GLOSSARY

FINANCE & BIODIVERSITY 43
Alkemade, Rob, Mark Van Oorschot, Lera Miles, Christian Nellemann, Michel Bakkenes, et Ben Ten Brink. 2009. "GLOBIO3: A framework to investigate options for reducing global terrestrial biodiversity loss". Ecosystems 12 (3): 374-90. https://doi.org/10.1007/s10021-009-9229-5
Allen, M.R., R. Perez, O.P. Dube, W. Solecki, F. Aragón-Durand, W. Cramer, S. Humphreys, et al. 2018. ”Framing and Context. In: Global Warming of 1.5°C. An IPCC Special Report on the impacts of global warming of 1.5°C above pre-industrial levels and related global greenhouse gas emission pathways, in the context of strengthening the global response to the threat of climate change, sustainable development, and efforts to eradicate poverty”. IPCC. https://www.ipcc.ch/site/assets/uploads/sites/2/2019/05/SR15_Chapter1_Low_Res.pdf
Appleton, Albert F. 2002. How New York City Used an Ecosystem Services Strategy Carried out Through an Urban-Rural Partnership to Preserve the Pristine Quality of Its Drinking Water and Save Billions of Dollars and What Lessons It Teaches about Using Ecosystem Services. New York. https://www.cbd.int/financial/pes/usa-pesnewyork.pdf
Banque de France. A “Silent Spring” for the Financial System? Exploring Biodiversity-Related Financial Risks in France. R. Svartzman, E. Espagne, J. Gauthey, P. Hadji-Lazaro, M. Salin, T. Allen, J. Berger, J. Calas, A. Godin, A. Vallier. https://publications.banque-france.fr/en/silent-spring-financial-system-exploring-biodiversity-related-financial-risks-france
Breitburg, Denise, Lisa A Levin, Andreas Oschlies, Marilaure Grégoire, Francisco P Chavez, Daniel J Conley, Véronique Garçon, et al. 2018. ”Declining oxygen in the global ocean and coastal waters”. Science 359 (6371): eaam7240. https://doi.org/10.1126/science.aam7240
CBD. 2020a. « Perspectives mondiales de la diversité biologique 5 ». Montréal. https://www.cbd.int/gbo/gbo5/publication/gbo-5-fr.pdf
———. 2020b. ”PREPARATION OF THE POST-2020 GLOBAL BIODIVERSITY FRAMEWORK. Draft recommendation submitted by the Co-Chairs.” https://doi.org/10.1017/CBO9781107415324.004
CBD High-Level Panel. 2014. ”Resourcing the Aichi Biodiversity Targets: An Assessment of Benefits, Investments and Resources Needs for Implementating the Strategic Plan for Biodiversity 2011-2020”. Second Report of the High-Level Panel on Global Assessment of Resources for Implementing the Strategic Plan for Biodiversity 2011-2020. Montreal: High-Level Panel on Global Assessment of Resources. https://www.cbd.int/financial/hlp/doc/hlp-02-report-en.pdf
Ceballos, Gerardo, Paul R. Ehrlich, Anthony D. Barnosky, Andrés Garcia, Robert M. Pringle, et Todd M. Palmer. 2015. ”Accelerated modern human-induced species losses: Entering the sixth mass extinction”. Environmental Sciences, 5.
Crédit Suisse, et WWF Switzerland. 2014. ”Conservation Finance Moving beyond Donor Funding toward an Investor-Driven Approach”. https://www.cbd.int/financial/privatesector/g-private-wwf.pdf
Dasgupta, P. 2021. ”The Economics of Biodiversity: The Dasgupta Review”. London: UK government. https://assets.publishing.service.gov.uk/government/uploads/system/uploads/attachment_data/file/882222/The_Economics_of_Biodiversity_The_Dasgupta_Review_Interim_Report.pdf
Deutz, Heal, Niu, Swanson, Townshend, Zhu, Delmar, Meghji, Sethi, et Tobin de la Puente. 2020. ”Financing Nature: Closing the Global Biodiversity Financing Gap”. Paulson Institute; the Nature Conservancy; the Cornell Atkinson Center for Sustainability.
Dickman, Chris. 2020. ”A statement about the 480 million animals killed in NSW bushfires since September - The University of Sydney”. 2020. https://www.sydney.edu.au/news-opinion/news/2020/01/03/a-statement-about-the-480-million-animals-killed-in-nsw-bushfire.html
Goedkoop, M.J., R. Heijungs, M. Huijbregts, A. De Schryver, J. Struijs, et Van Zelm R. 2013. ”ReCiPe 2008. A life cycle impact assessment method which comprises harmonised category indicators at the midpoint and the endpoint level. First edition (version 1.08). Report I: Characterisation.” http://www.lcia-recipe.net
Grimm, Nancy B., Stanley H. Faeth, Nancy E. Golubiewski, Charles L. Redman, Jianguo Wu, Xuemei Bai, et John M. Briggs. 2008. ”Global Change and the Ecology of Cities”. Science (New York, N.Y.) 319 (5864): 756-60. https://doi.org/10.1126/science.1150195
Hamrick, Kelley. 2016. ”State of Private Investment in Conservation 2016: A Landscape Assessment of an Emerging Market”, décembre, 80.
Hudson, Lawrence N., Tim Newbold, Sara Contu, Samantha L.L. Hill, Igor Lysenko, Adriana De Palma, Helen R.P. Phillips, et al. 2017. ”The database of the PREDICTS (Projecting Responses of Ecological Diversity In Changing Terrestrial Systems) project”. Ecology and Evolution 7 (1): 145-88. https://doi.org/10.1002/ece3.2579
IPBES. 2019. ”Global assessment report on biodiversity and ecosystem services of the Intergovernmental Science- Policy Platform on Biodiversity and Ecosystem Services. E. S. Brondizio, J. Settele, S. Díaz, and H. T. Ngo (editors)”.
IPCC. 2002. ”Climate change and biodiversity”. https://doi.org/10.1007/978-981-10-3573-9_5
Jambeck, Jenna R., Roland Geyer, Chris Wilcox, Theodore R. Siegler, Miriam Perryman, Anthony Andrady, Ramani Narayan, et Kara Lavender Law. 2015. ”Plastic Waste Inputs from Land into the Ocean”. Science 347 (6223): 768-71. https://doi.org/10.1126/science.1260352
Jones, Kate E., Nikkita G. Patel, Marc A. Levy, Adam Storeygard, Deborah Balk, John L. Gittleman, et Peter Daszak. 2008. ”Global Trends in Emerging Infectious Diseases”. Nature 451 (7181): 990-93. https://doi.org/10.1038/nature06536
Koellner, T, et RW Scholz. 2008. ”Assessment of land use impacts on the natural environment. Part 2: Generic characterization factors for local species diversity in Central Europe”. Int J LCA 1 (January): 32-48.
REFERENCES
44 FINANCE & BIODIVERSITY
Laffoley, D., et J.M. Baxter. 2019. ”Ocean deoxygenation: Everyone’s problem - Causes, impacts, consequences and solutions. Full report.” Ocean deoxygenation: everyone’s problem. Causes, impacts, consequences and solutions. Gland, Switzerland. https://doi.org/10.2305/iucn.ch.2019.13.en
Lammerant, Johan, Lars Müller, et Jerome Kisielewicz. 2018. ”Critical Assessment of Biodiversity Accounting Approaches for Businesses and Financial Institutions”.
Loh, Elizabeth H., Carlos Zambrana-Torrelio, Kevin J. Olival, Tiffany L. Bogich, Christine K. Johnson, Jonna A. K. Mazet, William Karesh, et Peter Daszak. 2015. ”Targeting Transmission Pathways for Emerging Zoonotic Disease Surveillance and Control”. Vector Borne and Zoonotic Diseases (Larchmont, N.Y.) 15 (7): 432-37. https://doi.org/10.1089/vbz.2013.1563
Makarieva, A. M., V. G. Gorshkov, D. Sheil, A. D. Nobre, P. Bunyard, et B.-L. Li. 2014. ”Why Does Air Passage over Forest Yield More Rain? Examining the Coupling between Rainfall, Pressure, and Atmospheric Moisture Content*”. Journal of Hydrometeorology 15 (1): 411-26. https://doi.org/10.1175/JHM-D-12-0190.1
Mcgranahan, Gordon, Peter Marcotullio, Xuemei Bai, Deborah Balk, Tania Braga, Ian Douglas, Thomas Elmqvist, et al. 2005. ”Urban Systems”, June.
Millennium Ecosystem Assessment. 2005. ”Millenium Ecosystem Assessment: ecosystems and human well-being: Synthesis.” Washington, DC.
Natural Capital Coalition. 2016. ”Natural Capital Protocol”.
Newbold, Tim, Lawrence N Hudson, Andrew P Arnell, Sara Contu, Adriana De Palma, Simon Ferrier, Samantha L L Hill, et al. 2016. ”Has land use pushed terrestrial biodiversity beyond the planetary boundary? A global assessment”. Science 353 (6296): 288 LP - 291. https://doi.org/10.1126/science.aaf2201
NWS Government. 2019. « NSW Fire and the Environment 2019-20 Summary. Biodiversity and landscape data and analyses to understand the effects of the fire events. » Sydney.
OECD. 2019. ”Biodiversity: Finance and the Economic and Business Case for Action. A report prepared by the OECD for the French G7 Presidency and the G7 Environment Ministers’ Meeting, 5-6 May 2019.” Biodiversity: Finance and the Economic and Business Case for Action. https://doi.org/10.1787/a3147942-en
Parker, Charlie, Matthew Cranford, Nick Oakes, et Matt Leggett. 2012. ”The Little Biodiversity Finance Book”. Global Canopy Program, 101.
Patz, J. A., T. K. Graczyk, N. Geller, et A. Y. Vittor. 2000. ”Effects of Environmental Change on Emerging Parasitic Diseases”. International Journal for Parasitology 30 (12-13): 1395-1405. https://doi.org/10.1016/s0020-7519(00)00141-7
Potere, David, et Annemarie Schneider. 2007. ”A Critical Look at Representations of Urban Areas in Global Maps”. GeoJournal 69 (1-2): 55-80. https://doi.org/10.1007/s10708-007-9102-z
PRI. 2020. ”Investor Action on Biodiversity: Discussion Paper”. PRI.
Purvis, Andy, et Andy Hector. 2000. ”Getting the measure of biodiversity”. Nature. https://doi.org/10.1038/35012221
RIVM. 2002. ”Biodiversity: How much is left? The Natural Capital Index framework (NCI)”.
Rockström, Johan, Will Steffen, Kevin Noone, Åsa Persson, F. Stuart III Chapin, Eric Lambin, Timothy Lenton, et al. 2009. ”Planetary Boundaries: Exploring the Safe Operating Space for Humanity”. Ecology and Society 14 (2). https://doi.org/10.5751/ES-03180-140232
Scholes, R. J., et R. Biggs. 2005. ”A Biodiversity Intactness Index.” Nature 434: 45-50.
Shukla, P.R., J. Skea, R. Slade, R. van Diemen, E. Haughey, J. Malley, M. Pathak, et J. Portugal Pereira. 2019. ”IPCC Climate Change and Land: Foreword Technical and Preface”. Climate Change and Land: an IPCC special report on climate change, desertification, land degradation, sustainable land management, food security, and greenhouse gas fluxes in terrestrial ecosystems, 35-74.
Silvain, Jean-François, Robin Goffaux, et Hélène Soubelet. 2020. ”Mobilisation de la FRB par les pouvoirs publics français sur les liens entre Covid-19 et biodiversité”, mai, 57.
Steffen, Will, Katherine Richardson, Johan Rockström, Sarah E Cornell, Ingo Fetzer, Elena M Bennett, Reinette Biggs, et al. 2015. ”Planetary boundaries: Guiding human development on a changing planet”. Science 347 (6223): 1259855. https://doi.org/10.1126/science.1259855
Strand, Jon, Britaldo Soares-Filho, Marcos Heil Costa, Ubirajara Oliveira, Sonia Carvalho Ribeiro, Gabrielle Ferreira Pires, Aline Oliveira, et al. 2018. ”Spatially Explicit Valuation of the Brazilian Amazon Forest’s Ecosystem Services”. Nature Sustainability 1 (11): 657-64. https://doi.org/10.1038/s41893-018-0175-0
Suttor-Sorel, Ludovic. 2019. ”Making Finance Serve Nature. From the niche of Conservation finance to the mainstreaming of Natural Capital approaches in financial systems.”
The Nature Conservancy, et Environmental Finance. 2019. ”Investing in Nature: Private finance for nature-based resilience”.
Toor, Joris van, Danijela Piljic, Guan Schellekens, Mark van Oorschot, et Marcel Kok. 2020. ”Indebted to nature. Exploring biodiversity risks for the Dutch financial sector.”
Turbelin, Anna J, Bruce D Malamud, et Robert A Francis. 2017. ”Mapping the global state of invasive alien species: patterns of invasion and policy responses”. Global Ecology and Biogeography 26 (1): 78-92. https://doi.org/10.1111/geb.12517
UNDP. 2020. ”Moving Mountains - Unlocking private capital for biodiversity and ecosystems”. New York: BIOFIN.
United Nations. 1992. ”CONVENTION ON BIOLOGICAL DIVERSITY”.
World Economic Forum. 2020a. ”Nature Risk Rising: Why the Crisis Engulfing Nature Matters for Business and the Economy”. http://www3.weforum.org/docs/WEF_New_Nature_Economy_Report_2020.pdf
———. 2020b. ”The Global Risks Report 2020”. http://www3.weforum.org/docs/WEF_Global_Risk_Report_2020.pdf
WWF. 2018. Living Planet Report - 2018: Aiming Higher. Gland, Switzerland: WWF.
FINANCE & BIODIVERSITY 45
Anne-Claire Abadie, Sycomore AM
Hugo Bluet, WWF
Grégoire Cousté, FIR
Vivian Eisfeller, Iceberg Data Lab
Capucine Flandre, Iceberg Data Lab
Julien Foll, Amundi
Alicia Fouletier, AG2R La Mondiale
Benoit Galaup, Iceberg Data Lab
Charlotte Gardes, Doctoral student Paris II Panthéon-Assas
Sophie Gaudeul, CFDT
Hadrien Gaudin-Hamama, Mirova
Ciprian Ionescu, WWF
Sarah Maillard, Mirova
Lise Moret, Banque Hottinguer
Guillaume Neveux, I-Care & Consult
Jean-Guillaume Peladan, Sycomore AM
Thiên-Minh Polodna, FIR
Philippe Portier, CFDT
Robert-Alexandre Poujade, BNP Paribas AM
Jean-François Silvain, French Foundation for Biodiversity Research
Ladislas Smia, Mirova
Hélène Soubelet, French Foundation for Biodiversity Research
Liudmila Strakodonskaya, AXA IM
ACKNOWLEDGEMENTS
We thank the following people for participating in the preparation of this handbook and in the reading committee:


