26
FINANCE DEPARTMENT MONTHLY REPORT NOVEMBER 2019

FINANCE DEPARTMENT
MONTHLY REPORT
NOVEMBER 2019

Finance Monthly Report- November 2019
TABLE OF CONTENTS
Organization Chart 1
Department Overview 2
Key Activities 2
Key Performance Indicators (KPIs) 3
KPI 1- Reserve Balance Policy 3
KPI 2- Debt Service Obligation 4
KPI 3- Procurement Process 5
KPI 4- Ratio of Expenses to Budget 5
KPI 5- Budget Deviations 6
KPI 6- Prompt Payment of Invoices 7
Financial Results 8
Analysis of Key Revenues 12
Additional Information 23

1
Finance Monthly Report- November 2019
ORGANIZATION CHART
Customer Service Clerks (2)
PT Customer Service Clerk (1)
Purchasing Coordinator (1)
Buyer (1)
Purchasing Clerks (2)
Senior Accountant (1)
Accountant (1)
Payroll Coordinator (1)
Customer Service Clerk (1)
Director Lisa Petersen
Purchasing Manager
Assistant Director
Accounting Manager
Revenue Manager
Secretary (1)
PT Intern (1)
20 FTE 5 PTE
Customer Support Supervisor
Water Billing Clerks (3)
PT Water Billing Clerks (3)

2
Finance Monthly Report- November 2019
DEPARTMENT OVERVIEW The Finance Department is responsible for all financial operations of the village including budgeting, forecasting, investing, and reporting compliance, and is comprised of three primary divisions, purchasing, revenue management and accounting. The mission of the Finance Department is to provide responsible fiscal leadership through transparent reporting; accurate, balanced and accessible customer service; and proactive oversight of village resources. There are three divisions within the Finance Department:
The Purchasing Division oversees the expenditure of village funds and provides departments with the processes necessary to ensure that village departments procure the items and services they need to operate efficiently and effectively, while maintaining control and accountability over the village’s budget.
The Revenue Management Division is responsible for billing, collecting and reporting all village revenue. This division generates, collects and accounts for the monthly utility bills sent to all Schaumburg residents and businesses; it is also responsible for issuing business, liquor, chauffer, raffle, rental licenses, and commuter parking passes.
The Accounting Division is responsible for all financial reporting requirements and reconciling the general ledger on a monthly basis. This division writes the annual Comprehensive Annual Financial Report (CAFR), processes payroll for the entire organization, and provides reports and analyses to the pension boards, Cook and DuPage Counties, the State of Illinois, and other federal agencies as required.
KEY ACTIVITIES - The Finance Director presented the 2019 CAFR to the Board for approval. - The budget process for FY21 was initiated. - Gaming and cannabis licenses process was developed. - Accounting Manager Interviews were conducted and an offer was extended and accepted.

3
Finance Monthly Report- November 2019
KEY PERFORMANCE INDICATORS KPI 1: Provide responsible fiscal leadership. Bond rating companies examine several aspects of a municipality to determine its credit rating such as the current economy, management practices, and the institutional framework of the municipality. Factors that the Finance department can influence include: budgetary performance/flexibility and liquidity, as such, we use two measures to demonstrate responsible fiscal leadership: compliance with the village’s reserve balance policy, and a positive operating ratio (ongoing operating revenues/ongoing operating expenditures). Ensure compliance with the village’s Reserve Balance Policy by maintaining at least 40% in reserves in the General Fund.
Status: Ahead of Target FY 20 YTD: 43.1% FY 19 Total: 49.3% FY 18 Total: 51.3% FY 17 Total: 54.8% Source: Department Monthly Reports
Maintain an operating ratio (Revenues/Expenses) greater than 1.
Status: Ahead of Target FY 20 YTD: 1.21 FY 19 Total: 1.12 FY 18 Total: 1.12 FY 17 Total: 1.11 Source: Department Monthly Reports

4
Finance Monthly Report- November 2019
KPI 2: GO Debt Funding General Obligation (GO) debt is backed by the full faith and credit of the village, and this is accomplished by incorporating into the issuing ordinance the right to levy property taxes to pay the principal and interest on all GO debt. The village is committed to keeping the property tax levy as low as possible, as such, each year the village allocates other streams of revenue to pay the principal and interest due on outstanding bonds. The finance department maintains separate funds to accumulate revenues for the purpose of making these payments. This KPI is intended to track the designated revenues to ensure that there will be proper and available funding when the payments are due. Accumulate sufficient revenue funds to meet General Obligation debt funding obligations.
Status: Ahead of Target FY 20 YTD: 78% FY 20 YTD Target: 50% FY 20 Target: 100% *Source: Revenue Division

5
Finance Monthly Report- November 2019
KPI 3: Provide proactive oversight of village resources. Per VOS Policy Statement 2.20 Title: Purchasing Policy, item 2, “All purchases to be made from one vendor for a particular item or like items, with an annual cost in excess of $20,000 must be accomplished through: (a) formal competitive purchasing (bids or RFPs) or (b) by a request to waive competitive purchasing that has been reviewed by the Village Manager and approved by the Village Board.” The village recognizes it is best practice to bid large purchasing projects competitively. The proposed benchmark for this KPI is 85% of applicable purchases moving through the competitive bid process, while 15% or fewer utilizing sole source or waiving competitive bidding.
Ensure at least 85% of applicable projects bid through competitive process.
Status: Ahead of Target FY 20 YTD: 95% FY 19 Total: 89% FY 18 Total: 88% FY 17 Total: 89% *Source: Village Board Meetings
KPI 4: Ensure that expenditures are within budget. A budget is a detailed financial plan used to carry out organizational goals. The process ensures that resources are available and that Village of Schaumburg operations are carried out within available resources. Finance's oversight of this process ensures that budget plans are shared and that managers are kept accountable for their plans. The purpose of this KPI is to confirm that budgeting is realistic.
Maintain a ratio of budgeted amount to actuals of less than 1.
Status: Ahead of Target FY 20 YTD: .965 FY 19 Total: .98 FY 18 Total: .99 FY 17 Total: .97 FY 16 Total: .99 *Source: Finance Department Monthly Reports
89% 88% 86%
85%
94%87%
82%
92%98%
92%
70%75%80%85%90%95%
100%
FY18Q1
FY18Q2
FY18Q3
FY18Q4
FY19Q1
FY19Q2
FY19Q3
FY19Q4
FY20Q1
FY20Q2
FY20Q3
FY20Q4
Percentage Target

6
Finance Monthly Report- November 2019
KPI 5: Ensure the financial health of the General Fund by addressing budget deviations. This KPI measures the number of unanticipated expenditures affecting the general fund that result in budget deviations, and whether budget transfers or amendments could be completed to allow funding with budgeted monies. Finance’s responsibility here is to ensure that: Spending follows the plan outlined by the budget by staying within preset limits (small
differences between actual and budget figures are normal and expected). If expenditures greatly exceed budgeted amounts, or an unanticipated need arises, the
department should submit an explanation, via an unbudgeted form, why actual results are off target.
It is expected that other previously planned expenditures will be reduced or eliminated and funds re-allocated (either via budget transfer or mid-year amendment) to represent the new reality and make every attempt to ensure that actuals do not exceed the budget at year end.
Fund at least 80% of variances by transfers or amendments.
Status: Ahead of Target FY 20 YTD: 97% FY 19 Total: 85% FY 18 Total: 85% *Source: Review of unbudgeted/over budget purchase requests
FY20 Q1 - There were a significant amount of unanticipated FY 20 capital improvement projects that were not completed due to poor weather conditions in the spring. All of these unanticipated projects were covered either through budget transfers or the rebudgeting of funds as part of a planned mid-year amendment. These were the main cause of the spike in unbudgeted purchases (40) for the first quarter of FY20.
92%
98%
89%
33%
90%
100%
87%
56%
100%93%
0
10
20
30
40
50
60
70
0%
10%
20%
30%
40%
50%
60%
70%
80%
90%
100%
FY18Q1
FY18Q2
FY18Q3
FY18Q4
FY19Q1
FY19Q2
FY19Q3
FY19Q4
FY20Q1
FY20Q2
FY20Q3
FY20Q4
Nu
mb
er o
f V
aria
nce
s
Per
cen
t F
un
ded
Number of Variances Percent Target

7
Finance Monthly Report- November 2019
KPI 6: Ensure the prompt payment of invoices in compliance with State law. The village complies with the Illinois Local Government Prompt Payment Act, which states that payments are considered late if they are paid more than 60 days after receipt of a proper invoice. (50 ILCS 505/5) Our process is widely recognized as a best practice and requires a three-way match of approved purchase order, receiving report, and proper invoice before payment can be made. If any of the three pieces is incorrect or missing, the inaccuracy must be resolved before payment can be processed. Our on-time payment benchmark is 95% of proper invoices paid in accordance with the Illinois Local Government Prompt Payment Act; this allows for special circumstances which may justify a withheld payment despite the Prompt Payment Act guidelines. Pay at least 95% of invoices within 60 days of invoice date.
Status: Ahead of Target FY 20 YTD: 99.96 % FY 19 Total: 99.97% FY 18 Total: 99.0% *Source: Village Board Bills List Reports
97.11%
99.96%
99.96%
99.96%
99.98%
99.98%
99.96%
99.96%
99.97%
99.95%
94%
95%
96%
97%
98%
99%
100%
FY18Q1
FY18Q2
FY18Q3
FY18Q4
FY19Q1
FY19Q2
FY19Q3
FY19Q4
FY20Q1
FY20Q2
FY20Q3
FY20Q4
Percentage Target

8
Finance Monthly Report- November 2019
FINANCIAL RESULTS HOTEL AND CONVENTION CENTER OPERATING RESULTS Hotel/Convention Center Fund: The Hotel and Convention Center Fund accounts for the receipt of various revenues earmarked for payment of debt service on the bonds issued to fund construction of the property. A total of $763,188 was deposited into the Hotel and Convention Center Fund in November, which was below the projection of $976,092. The hotel tax receipts for November were $155,813 which was below the projected amount of $324,758 primarily due to the tax payment of $146,652 from the Renaissance received in December. Food and beverage tax receipts for November were $217,021, which was below the projected amount of $237,211 also due to the tax payment of $38,597 from the Renaissance received in December. Renaissance Hotel & Convention Center Fund: The Renaissance Hotel and Convention Center Fund accounts for the day-to-day operations of the hotel and convention center. Revenues recorded in November totaled $2,456,450 which was 25.9% below the $3,315,196 projected by the Renaissance. Expenditures for the period totaled $2,730,220. Year to date revenues exceed expenses by $1,568,114. BASEBALL OPERATING RESULTS Baseball Fund: The Village of Schaumburg co-owns the baseball stadium with the Schaumburg Park District. All revenues and costs associated with the stadium are shared equally between the co-owners, unless otherwise agreed to. The Schaumburg Boomers baseball team continues to occupy the stadium. There is no debt outstanding for the stadium. YTD expenses exceed revenues by $455,123, including a non-cash charge for depreciation of $420,551.

9
Finance Monthly Report- November 2019
GENERAL FUND
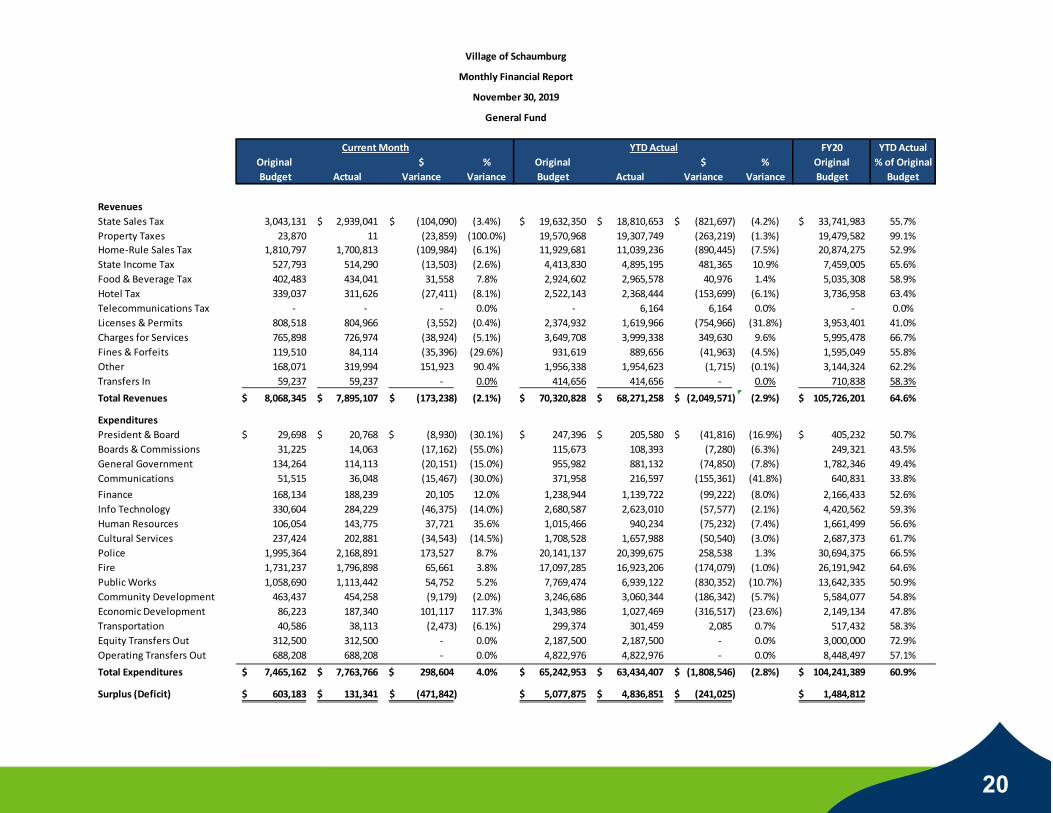
For the month of November, General fund revenues totaled $7,895,107 and expenditures totaled $7,763,766 resulting in an operating surplus of $131,341. From a budget perspective, we expected revenues to exceed expenditures by $603,183 in November. Further detail of revenues and expenditures is provided below.
Revenues in the General Fund in November totaled $7,895,107 which was 2.1% below projections of $8,068,345. The table below presents a summary of General Fund revenues by type:
Original MTD Budget MTD Actual
Original YTD Budget YTD Actual
Revenues 8,068,345$ 7,895,107$ 70,320,828$ 68,271,259$
Expenditures 7,465,162$ 7,763,766$ 65,242,953$ 63,434,407$
Excess (Deficiency) 603,183$ 131,341$ 5,077,875$ 4,836,851$
General Fund Revenue Type
Original MTD Budget MTD Actual
$ Variance % Variance
Original YTD Budget YTD Actual
$ Variance % Variance
Taxes 2,587,343$ 2,463,883$ (123,459)$ (4.8%) 37,148,562$ 35,892,913$ (1,255,648)$ (3.4%)
Licenses & Permits 808,518 804,966 (3,552) (0.4%) 2,374,932 1,619,966 (754,966) (31.8%)
Intergovernmental 3,574,965 3,453,332 (121,633) (3.4%) 24,319,349 23,997,851 (321,499) (1.3%)
Charges for Services 765,898 726,974 (38,924) (5.1%) 3,649,708 3,999,338 349,630 9.6%
Fines & Forfeits 119,510 84,114 (35,395) (29.6%) 931,619 889,656 (41,963) (4.5%)
Investment Income 54,167 84,555 30,388 56.1% 379,167 571,872 192,705 50.8%
Miscellaneous 98,708 218,047 119,339 120.9% 1,102,835 885,006 (217,829) (19.8%)
Operating Transfers 59,237 59,237 ‐ 0.0% 414,656 414,656 (1) (0.0%)
Total Revenue 8,068,345$ 7,895,107$ (173,238)$ (2.1%) 70,320,828$ 68,271,259$ (2,049,571)$ (2.9%)

10
Finance Monthly Report- November 2019
Expenditures in the General Fund in November totaled $7,763,766 which was 4.0% above projections of $7,465,162. The table below presents a summary of General Fund expenditures by type:
General Fund Expense Type
Original MTD Budget MTD Actual
$ Variance % Variance
Original YTD Budget YTD Actual
$ Variance % Variance
Salaries & Wages 3,618,717$ 3,985,699$ 366,982$ 10.1% 27,273,437$ 27,739,239$ 465,802$ 1.7%
Insurance 758,809 757,881$ (927) (0.1%) 5,311,662 5,306,191$ (5,471) (0.1%)
Employment Taxes 146,426 145,973$ (453) (0.3%) 1,098,163 1,075,942$ (22,221) (2.0%)
Pensions 158,224 148,693$ (9,532) (6.0%) 10,900,242 10,729,260$ (170,982) (1.6%)
Other Payroll 50,739 11,782$ (38,957) (76.8%) 525,026 224,057$ (300,970) (57.3%)
Supplies 208,578 223,811$ 15,233 7.3% 1,460,489 1,202,043$ (258,446) (17.7%)
Services & Charges 1,410,812 1,461,709$ 50,896 3.6% 10,875,921 9,786,126$ (1,089,794) (10.0%)
Capital Outlay 105,244 26,193$ (79,051) (75.1%) 736,708 349,681$ (387,027) (52.5%)
Miscellaneous 6,904 1,315$ (5,589) (80.9%) 50,829 11,393$ (39,437) (77.6%)
Transfers Out 1,000,708 1,000,708$ 0 0.0% 7,010,476 7,010,476$ (0) (0.0%)
Total Expenditures 7,465,162$ 7,763,766$ 298,604$ 4.0% 65,242,953$ 63,434,407$ (1,808,546)$ (2.8%)

11
Finance Monthly Report- November 2019
November 30, 2019
Above
State Sales TaxHotel Tax
Licenses & PermitsMiscellaneous Revenues
State Income TaxFood & Beverage Tax
Transfers InBelow
President & BoardGeneral Government
FinanceHuman ResourcesCultural Services
Economic Development
BelowProperty Taxes
Home‐Rule Sales TaxFines & Forfeits
Charges for Services AbovePolice
Transportation
Boards & CommissionsCommunicationsInfo Technology
FirePublic Works
Community DevelopmentEquity Transfers Out
Operating Transfers Out
Below Above Above Below
Year‐to‐Date Expenses
FY19
YTD
Exp
enses
FY20 YTD Original Budget TargetFY20 YTD Original Budget Target
Year‐to‐Date Revenues
FY19
YTD
Receipts

Finance Monthly Report- November 2019
12
ANALYSIS OF KEY REVENUES
November State Sales tax receipts, which were for August 2019 sales, total $2,953,417 a 0.8% increase compared to the same month last year. From a budget perspective, November collections were below monthly budget expectations by 3.4% or $105,382. YTD receipts are $817,440 or 4.1% below budget.

Finance Monthly Report- November 2019
13
November Home Rule Sales tax receipts, which are for August sales, totaled $1,715,189, a 1.1% decrease compared to the same month last year. From a budget perspective, November collections were below the monthly budget target by 6.1% or $111,275. YTD receipts are $886,188 or 7.4% below budget expectations.

Finance Monthly Report- November 2019
14
November Use tax receipts, which are for August sales, totaled $193,974, November collections were above the monthly budget target by 8.3% or $14,823. YTD receipts are $105,463 or 8.4% above budget expectations. Current year-to-date revenue is $203,984 or 17.6% higher than last year. In addition to traditional Use Tax, sales taxes generated from Internet sales are distributed as Use Tax. The rise in Internet sales over the past few years is having an impact on sales tax revenue. According to articles from the Illinois Municipal League earlier this year, Use Tax revenues are performing higher than usual Use Tax growth. With the Wayfair decision, which went into effect October 2018, Illinois has received Use Tax from remote sellers without a physical presence in Illinois. Since this time, Use Tax collections have grown significantly. Payments arising from the Wayfair decision, as well as ever-growing online purchases are the two largest drivers of increased Use Tax revenues. Use tax receipts for fiscal year 2018/19 were 13.98% higher than fiscal year 2017/18 compared to sales tax which increased slightly by 0.9%. Due to this relationship, Use Tax results will now be included in the monthly reports. Use Tax is distributed on a per capita basis compared to sales tax which is 1% of sales in the village. Use Tax receipts are currently allocated to the Capital Improvement Project (CIP) Fund.

Finance Monthly Report- November 2019
15
November State Income tax receipt of $514,290 was 0.9% or $4,355 higher than the same month last year and 2.6% below monthly budget expectations. YTD receipts are $481,365 or 10.9% above budget.

Finance Monthly Report- November 2019
16
Food and Beverage November tax receipts which reflect October sales totaled $906,702 an increase of 7.6% compared to the same month last year. Food and Beverage taxes were above monthly budget projections by 8.5% or $70,943 in November. There were 39 businesses delinquent with their payment. One larger business, Chicago Prime Steakhouse, was past due with the November tax payment. Based on average receipts, if all payments had been received by the end of the month we would have expected an increase of $25,465. YTD receipts are $72,033 or 1.2% above budget expectations.
Telecommunications tax receipts in November totaled $225,610 a 10.7% decrease compared to the same month last year and were below the monthly budget projections by 6.9% or $16,786. YTD receipts are $55,891 or 3.2% below budget.

Finance Monthly Report- November 2019
17
Hotel tax receipts totaled $769,905 a decrease of 0.9% compared to the same month last year. Hotel taxes are below monthly budget projections by 7.6% or $63,408. YTD revenues are below budget expectations by $280,157 or 4.7%. There was one delinquent taxpayer, Wyndham Garden. If their payment was received by the end of the month, receipts would have increased by $11,716 to approximately $781,621 or 4.5% below YTD budget projections. Sonesta ES had the largest increase at 60%; followed by Extended Stay located at 1200 American Lane at 55%; and Extended Stay located at 2000 N Roselle Rd at 21%. The largest decreases were reported by Homestead Suites at 67%; followed by AmericInn at 44%; and Hawthorne Suites at 29%. AirBnB receipts in November totaled $1,043 an increase of 72% compared to the same month last year

Finance Monthly Report- November 2019
18
Amusement tax receipts are used to support the Hotel and Convention Center and, therefore, are reported on a calendar year basis to be consistent with the facility’s budget. November 2019 revenues totaled $81,257 which is 0.7% higher than November 2018. YTD Amusement tax receipts are below budget expectations by 0.7% or $9,016. There were three delinquent taxpayers, LegoLand, MT Barrels, and Yu Kids. If their payments were received by the end of the month, receipts would have increased by approximately $10,600. Drink saw an increase of 79% while Laugh Out Loud saw a decrease of 23% compared to the same month last year.
Real Estate Transfer tax receipts totaled $28,614 during November 2019; 73.3% lower than the same month last year. YTD collections are $129,616 or 28.8% below budget. Receipts from commercial sales totaled $13,763 this month. The remainder was collected on the sale of existing single-family homes and townhomes.
Local Motor Fuel Tax of $0.03 per gallon went into effect October 1, 2017. There are 13 gas stations remitting the local motor fuel tax. Receipts for the liability month October totaled $81,887.

Finance Monthly Report- November 2019
19
Water Billing Activity
Description Number Amount Number Amount Number AmountBills Sent 26,162 2,854,601$ 26,253 1,876,755$ 183,478 15,547,123$ Shut Off Notices Sent 935 131,165$ 941 145,739$ 6,092 799,664$ Services Shut Off 96 N/A 49 N/A 404 N/APenalties 3,622 34,248$ 3,628 27,750$ 23,238 179,668$ New Direct Debit Accounts 61 N/A 64 N/A 404 N/A
November 2018 November 2019 YTD FY20
20
FY20 YTD ActualOriginal $ % Original $ % Original % of Original Budget Actual Variance Variance Budget Actual Variance Variance Budget Budget
RevenuesState Sales Tax 3,043,131 2,939,041$ (104,090)$ (3.4%) 19,632,350$ 18,810,653$ (821,697)$ (4.2%) 33,741,983$ 55.7%
Property Taxes 23,870 11 (23,859) (100.0%) 19,570,968 19,307,749 (263,219) (1.3%) 19,479,582 99.1%
Home‐Rule Sales Tax 1,810,797 1,700,813 (109,984) (6.1%) 11,929,681 11,039,236 (890,445) (7.5%) 20,874,275 52.9%
State Income Tax 527,793 514,290 (13,503) (2.6%) 4,413,830 4,895,195 481,365 10.9% 7,459,005 65.6%
Food & Beverage Tax 402,483 434,041 31,558 7.8% 2,924,602 2,965,578 40,976 1.4% 5,035,308 58.9%
Hotel Tax 339,037 311,626 (27,411) (8.1%) 2,522,143 2,368,444 (153,699) (6.1%) 3,736,958 63.4%
Telecommunications Tax ‐ ‐ ‐ 0.0% ‐ 6,164 6,164 0.0% ‐ 0.0%
Licenses & Permits 808,518 804,966 (3,552) (0.4%) 2,374,932 1,619,966 (754,966) (31.8%) 3,953,401 41.0%
Charges for Services 765,898 726,974 (38,924) (5.1%) 3,649,708 3,999,338 349,630 9.6% 5,995,478 66.7%
Fines & Forfeits 119,510 84,114 (35,396) (29.6%) 931,619 889,656 (41,963) (4.5%) 1,595,049 55.8%
Other 168,071 319,994 151,923 90.4% 1,956,338 1,954,623 (1,715) (0.1%) 3,144,324 62.2%
Transfers In 59,237 59,237 ‐ 0.0% 414,656 414,656 ‐ 0.0% 710,838 58.3%
Total Revenues 8,068,345$ 7,895,107$ (173,238)$ (2.1%) 70,320,828$ 68,271,258$ (2,049,571)$ (2.9%) 105,726,201$ 64.6%
ExpendituresPresident & Board 29,698$ 20,768$ (8,930)$ (30.1%) 247,396$ 205,580$ (41,816)$ (16.9%) 405,232$ 50.7%
Boards & Commissions 31,225 14,063 (17,162) (55.0%) 115,673 108,393 (7,280) (6.3%) 249,321 43.5%
General Government 134,264 114,113 (20,151) (15.0%) 955,982 881,132 (74,850) (7.8%) 1,782,346 49.4%
Communications 51,515 36,048 (15,467) (30.0%) 371,958 216,597 (155,361) (41.8%) 640,831 33.8%
Finance 168,134 188,239 20,105 12.0% 1,238,944 1,139,722 (99,222) (8.0%) 2,166,433 52.6%
Info Technology 330,604 284,229 (46,375) (14.0%) 2,680,587 2,623,010 (57,577) (2.1%) 4,420,562 59.3%
Human Resources 106,054 143,775 37,721 35.6% 1,015,466 940,234 (75,232) (7.4%) 1,661,499 56.6%
Cultural Services 237,424 202,881 (34,543) (14.5%) 1,708,528 1,657,988 (50,540) (3.0%) 2,687,373 61.7%
Police 1,995,364 2,168,891 173,527 8.7% 20,141,137 20,399,675 258,538 1.3% 30,694,375 66.5%
Fire 1,731,237 1,796,898 65,661 3.8% 17,097,285 16,923,206 (174,079) (1.0%) 26,191,942 64.6%
Public Works 1,058,690 1,113,442 54,752 5.2% 7,769,474 6,939,122 (830,352) (10.7%) 13,642,335 50.9%
Community Development 463,437 454,258 (9,179) (2.0%) 3,246,686 3,060,344 (186,342) (5.7%) 5,584,077 54.8%
Economic Development 86,223 187,340 101,117 117.3% 1,343,986 1,027,469 (316,517) (23.6%) 2,149,134 47.8%
Transportation 40,586 38,113 (2,473) (6.1%) 299,374 301,459 2,085 0.7% 517,432 58.3%
Equity Transfers Out 312,500 312,500 ‐ 0.0% 2,187,500 2,187,500 ‐ 0.0% 3,000,000 72.9%
Operating Transfers Out 688,208 688,208 ‐ 0.0% 4,822,976 4,822,976 ‐ 0.0% 8,448,497 57.1%
Total Expenditures 7,465,162$ 7,763,766$ 298,604$ 4.0% 65,242,953$ 63,434,407$ (1,808,546)$ (2.8%) 104,241,389$ 60.9%
Surplus (Deficit) 603,183$ 131,341$ (471,842)$ 5,077,875$ 4,836,851$ (241,025)$ 1,484,812$
Village of Schaumburg
Monthly Financial Report
November 30, 2019
General Fund
Current Month YTD Actual

21
FY20 YTD ActualOriginal $ % Original $ % Original % of Original Budget Actual Variance Variance Budget Actual Variance Variance Budget Budget
RevenuesW & S Charges 3,155,756$ 2,671,998$ (483,758)$ (15.3%) 21,721,292$ 19,977,579$ (1,743,713)$ (8.0%) 34,544,352$ 57.8%
Tap On Fees 1,667 ‐ (1,667) (100.0%) 11,667 4,255 (7,412) (63.5%) 20,000 21.3%
Other Revenue 22,536 11,557 (10,979) (48.7%) 157,750 113,309 (44,442) (28.2%) 270,429 41.9%
Total Revenues 3,179,959$ 2,683,555$ (496,404)$ (15.6%) 21,890,709$ 20,095,143$ (1,795,566)$ (8.2%) 34,834,781$ 57.7%
ExpendituresSalaries & Wages 253,651$ 249,071$ (4,581)$ (1.8%) 1,902,385$ 1,754,918$ (147,467)$ (7.8%) 3,297,468$ 53.2%
Employee Insurance 60,547 60,547 0 0.0% 423,827 423,827 0 0.0% 726,561 58.3%
Employment Taxes 19,147 18,714 (433) (2.3%) 143,603 134,809 (8,794) (6.1%) 248,911 54.2%
Pensions 23,877 23,371 (506) (2.1%) 179,076 164,604 (14,472) (8.1%) 310,398 53.0%
Other Payroll Expenses 2,523 604 (1,920) (76.1%) 36,026 20,651 (15,375) (42.7%) 49,905 41.4%
Supplies 43,383 48,296 4,913 11.3% 303,680 272,043 (31,637) (10.4%) 520,595 52.3%
Services and Charges 370,406 228,471 (141,935) (38.3%) 1,577,769 1,254,170 (323,599) (20.5%) 2,941,343 42.6%
JAWA 1,302,823 1,289,416 (13,407) (1.0%) 9,751,749 9,223,480 (528,269) (5.4%) 15,792,000 58.4%
Capital Expenditures 704,006 178,245 (525,761) (74.7%) 4,928,041 1,504,716 (3,423,325) (69.5%) 8,448,070 17.8%
Misc 11,405 11,405 0 ‐ 165,311 22,810 (142,501) (86.2%) 190,535 12.0%
Depreciation/Bad Debt 180,790 180,816 26 0.0% 1,265,530 1,265,260 (270) (0.0%) 2,169,480 58.3%
Operating Transfers Out 201,842 201,842 ‐ 0.0% 1,412,894 1,412,894 ‐ 0.0% 2,422,104 58.3%
Total Expenditures 3,174,400$ 2,490,797$ (683,603)$ (21.5%) 22,089,891$ 17,454,183$ (4,635,708)$ (21.0%) 37,117,370$ 47.0%
Surplus (Deficit) 5,559$ 192,758$ 187,199$ (199,182)$ 2,640,960$ 2,840,142$ (2,282,589)$
Village of SchaumburgMonthly Financial Report
November 30, 2019Water Utility Fund
Current Month YTD Actual

22
2019 YTD Actual$ % $ % Annual % of Annual
Budget Actual Variance Variance Budget Actual Variance Variance Budget Budget
Convention Center Fund (590)Revenues (590)
Hotel Tax 324,758$ 155,813$ (168,945)$ (52.0%) 2,998,709$ 2,826,617$ (172,092)$ (5.7%) 3,259,942$ 86.7%
Telecommunications Tax 625 ‐ (625) (100.0%) 6,875 4,500 (2,375) (34.5%) 7,500 60.0%
Amusement Tax 70,164 53,313 (16,851) (24.0%) 1,272,342 1,353,917 81,575 6.4% 1,375,000 98.5%
H. R. Sales Tax ‐ Renaissance 15,667 14,375 (1,292) (8.2%) 172,337 183,966 11,629 6.7% 188,000 97.9%
Food & Beverage Tax 237,211 217,021 (20,190) (8.5%) 2,626,573 2,655,462 28,889 1.1% 2,877,121 92.3%
State Sales Tax ‐ Renaissance 15,667 14,375 (1,292) (8.2%) 172,337 183,966 11,629 6.7% 188,000 97.9%
Other 82,000 78,291 (3,709) (4.5%) 902,000 1,037,757 135,757 15.1% 984,000 105.5%
Transfer from General Fund 42,500 42,500 ‐ 0.0% 297,500 297,500 ‐ 0.0% 340,000 87.5%
Transfer from Renaissance Fund ‐ ‐ ‐ 0.0% 5,366,507 5,388,427 21,920 0.4% 6,324,151 85.2%
Equity Transfer from General Fund 187,500 187,500 ‐ 0.0% 1,312,500 1,312,500 ‐ 0.0% 1,500,000 87.5%
Total Revenues (590) 976,092$ 763,188$ (212,904)$ (21.8%) 15,127,680$ 15,244,612$ 116,932$ 0.8% 17,043,714$ 89.4%
Expenditures (590)Tax Exempt Bond Interest 4,599,390$ 4,599,390$ ‐$ 0.0% 9,198,781$ 9,198,780$ (1)$ (0.0%) 9,198,781$ 100.0%
Depreciation and Amortization 463,367 463,367 ‐ 0.0% 5,097,037 5,097,035 (2) (0.0%) 5,560,402 91.7%Other 933 1,932 999 107.0% 10,263 6,218 (4,045) (39.4%) 11,200 55.5%
Total Expenditures (590) 5,063,690$ 5,064,689$ 999$ 0.0% 14,306,081$ 14,302,033$ (4,048)$ (0.0%) 14,770,383$ 96.8%
Surplus/ (Deficit) (590) (4,087,598)$ (4,301,501)$ (213,903)$ 821,599$ 942,579$ 120,980$ 2,273,331$
Renaissance Hotel/CC Fund (591)Revenues (591)
Hotel Room Revenue 1,235,922$ 1,020,339$ (215,583)$ (17.4%) 17,241,937$ 17,203,644$ (38,293)$ (0.2%) 18,091,498$ 95.1%
Banquet Revenue 998,828 675,609 (323,219) (32.4%) 11,855,425 12,113,111 257,686 2.2% 13,212,611 91.7%
Exhibit Space Rental 427,689 262,773 (164,916) (38.6%) 6,447,350 5,821,125 (626,225) (9.7%) 6,652,000 87.5%
Restaurant Revenue 217,542 147,357 (70,185) (32.3%) 2,879,839 2,877,910 (1,929) (0.1%) 3,032,588 94.9%
Other Hotel/CC Revenue 435,215 350,372 (84,843) (19.5%) 5,414,362 5,544,528 130,166 2.4% 5,694,778 97.4%
Total Revenues (591) 3,315,196$ 2,456,450$ (858,746)$ (25.9%) 43,838,913$ 43,560,318$ (278,595)$ (0.6%) 46,683,475$ 93.3%
Expenditures (591)Hotel Room Expenses 375,301$ 382,450$ 7,149$ 1.9% 5,235,703$ 5,184,309$ (51,394)$ (1.0%) 5,493,682$ 94.4%
Kitchen Expenses 466,635 413,450 (53,185) (11.4%) 6,177,363 5,866,954 (310,409) (5.0%) 6,505,015 90.2%
Banquet Expenses 443,108 388,094 (55,014) (12.4%) 6,181,652 5,370,715 (810,937) (13.1%) 6,486,240 82.8%
Restaurant Expenses 135,282 136,951 1,669 1.2% 1,790,878 1,790,351 (527) (0.0%) 1,885,867 94.9%
Capital Outlay 297,000 161,263 (135,737) (45.7%) 3,267,000 2,494,618 (772,382) (23.6%) 3,564,000 70.0%
Other Expenses 1,394,804 1,248,011 (146,793) (10.5%) 15,348,750 15,896,831 548,081 3.6% 16,694,345 95.2%
Transfer to Convention Center ‐ 1 1 0.0% 5,435,591 5,388,426 (47,165) (0.9%) 6,324,151 85.2%
Total Expenditures (591) 3,112,130$ 2,730,220$ (381,910)$ (12.3%) 43,436,937$ 41,992,204$ (1,444,733)$ (3.3%) 46,953,300$ 89.4%
Surplus/ (Deficit) (591) 203,066$ (273,771)$ (476,837)$ 401,976$ 1,568,114$ 1,166,138$ (269,825)$
Net Surplus/ (Deficit) (3,884,532)$ (4,575,272)$ (690,739)$ 1,223,575$ 2,510,693$ 1,287,118$ 2,003,506$
Current Month YTD Actual
Village of SchaumburgMonthly Financial Report
November 30, 2019Hotel and Convention Center Funds

23
ADDITIONAL INFORMATION
Village Manager Approved Bids, RFP's and Contracts (from $20,000 to $50,000) FY 19-20 YTD
Date Project Vendor Amount
6/13/19 Tasers & Taser Camera System Axon Enterprise $28,176
6/20/19 2019 Street Light Gap Program Utility Dynamics $26,920
6/20/19 Airport Management Services Northwest Flyers $22,047
6/20/19 FS #53 LED Lighting Upgrade US Communities Graybar Electrical $27,012
6/24/19 PCA Arts Stage Floor Replacement Mr. David’s Flooring $40,380
6/24/19 Mobile RMS Maintenance ID Networks $21,070
7/2/19 Sewer Line Rapid Assessment Tool Infosense Inc. $26,320
7/10/19 Heritage Park Improvements Landscape Concepts $47,488
7/11/19 Fire Hydrant Cleaning & Painting GO Painters $40,000
7/11/19 PCA Audio Equipment TC Furlong $38,786
7/12/19 Athena Tank Grouting & Concrete repair Era Valdivia $48,360
7/16/19 Water Main Improvements/Phase II Eng. Strand Associates $47,300
8/5/19 Baseball Stadium Nitrogen System Fox Valley Fire & Safety
$25,500
8/19/19 Audit Services FY20 Sikich LLP $45,020
10/1/19 Video Camera Security Stem at Baseball Stadium Pentegra Systems $35,507
11/4/19 Water & Sewer Systems Rate Study Refresh Engineering Enterprises
$24,800
11/20/19 Fleet Management & Safety Recognition Software LYTX $34,286
11/30/2019 Fiscal YTD Total $578,972

24
Current Percent ofPar Book Market Total
Value Value Value Book ValueSUMMARY BY TYPE OF INVESTMENT:Cash - Schaumburg Bank & Trust 6,466,582$ 6,466,582$ 6,466,582$ 4.1%Cash - Fifth Third - Internal 40,030,374 40,030,374 40,030,374 25.6%Cash - Fifth Third Securities 207,184 207,184 207,184 0.1%Money Market - Illinois Funds 32,733,555 32,733,555 32,733,555 20.9%Money Market - IMET 1,014 1,014 1,014 0.0%Money Market - IMET Convenience 587 587 587 0.0%Money Market - MaxSafe 3,362,821 3,362,821 3,362,821 2.1%CD's - Heritage Bank of Schaumbu 3,775,233 3,775,233 3,775,233 2.4%CD's - Parkway Bank of Schaumbu 10,820,174 10,820,174 10,820,174 6.9%CD's - Fifth Third Securities 20,882,000 20,882,000 20,882,000 13.3%CD's -Schaumburg Bank & Trust 1,822,902 1,822,902 1,822,902 1.2%US Treasury Notes - - - 0.0%Government Agencies 15,200,000 15,160,870 15,249,116 9.7%Municipal Bonds 12,020,000 12,051,693 12,082,244 7.7%Cash - Held by Renaissance 9,128,303 9,128,303 9,128,303 5.8%
Total 156,450,730$ 156,443,292$ 156,562,090$ 100.0%
November 30, 2019
VILLAGE OF SCHAUMBURGSTATEMENT OF CASH AND INVESTMENTS


