68
FINANCIAL STATEMENTS 2016

FINANCIAL STATEMENTS
2016

CONTENT
Board of Directors’ Report 3 Consolidated Statement of Comprehensive Income, IFRS 7 Consolidated Statement of Financial Position, IFRS 8 Consolidated Statement of Changes in Equity, IFRS 9 Consolidated Statement of Cash Flows, IFRS 10 Notes to the Consolidated Financial Statements 11 1. Corporate Information 11 2. Accounting Principles 11 3. Segment Information 17 4. Joint Operations 19 5. Non-Current Assets held for Sale 19 6. Acquired Non-Controlling Interests 19 7. Revenue 19 8. Other Income from Operations 20 9. Materials and Services 20 10. Personnel expenses 20 11. Depreciation, Amortisation and Impairment Losses 20 12. Other Operating Expenses 21 13. Financial Income and Expenses 21 14. Income Taxes 22 15. Earnings per Share 22 16. Dividends 22 17. Property, Plant and Equipment 23 18. Goodwill and Other Intangible Assets 25 19. Subsidiaries 27 20. Investments in Associated Companies 27 21. Other Financial Assets 27 22. Non-Current Receivables 27 23. Deferred Tax Assets and Liabilities 27 24. Inventories 29 25. Current Receivables 29 26. Cash and Cash Equivalents 30 27. Share Capital and Other Reserves 30 28. Provisions 31 29. Interest-Bearing Liabilities 32 30. Accounts Payable and Other Liabilities 34 31. Adjustments to Cash Flow from Operations 34 32. Pension Liabilities 35 33. Financial Risk Management 39 34. Contingencies and Commitments 41
35. Transactions with Related Parties 43 36. Subsidiaries on 31 December 2016 45 37. Shares and Shareholders 45 38. Events after the Reporting Period 46 Five-Year Key Figures 47 Calculation of Key Ratios, IFRS 48 Quarterly Data, IFRS 49 Profit and Loss Account, Parent Company, FAS 50 Balance Sheet, Parent Company, FAS 51 Cash Flow Statement, Parent Company, FAS 52 Parent Company Accounting Principles 2016 53 Notes to the Financial Statements, Parent Company 54 1. Revenue 54 2. Other Income from Operations 54 3. Materials and Services 54 4. Personnel and Personnel Expenses 54 5. Depreciation, Amortisation and Write-Offs 55 6. Other Operating Expenses 55 7. Financial Income and Expenses 55 8. Extraordinary Items 56 9. Other Taxes 56 10. Change in Deferred Tax Liabilities 56 11. Intangible Assets 56 12. Tangible Assets 57 13. Investments 57 14. Inventories 57 15. Long-Term Receivables 58 16. Short-Term Receivables 58 17. Shareholders’ Equity 59 18. Statutory Provisions 59 19. Deferred Tax Liability 59 20. Long-Term Liabilities 60 21. Current Liabilities 61 Contingencies and Commitments 62 Shares and Holdings of Parent Company 63 Board’s Proposal for the Use of The Distributable Funds and Signatures to the Board of Directors’ Report and to the Financial Statements 64 Parent Company’s Accounting Books, Voucher Categories and Archiving 65 Auditor’s Report 66
FINNLINES PLC Financial Statements 2016 (figures in EUR thousand, if not stated otherwise)
3
BOARD OF DIRECTORS’ REPORT
FINNLINES’ BUSINESS Finnlines is the largest shipping company in the Baltic Sea based on both ro-ro and ro-pax volumes (source: Baltic Transportation Journal). The Company's passenger-freight vessels offer services from Finland to Germany and via the Åland Islands to Sweden, as well as from Sweden to Germany. Finnlines’ ro-ro vessels operate in the Baltic Sea and the North Sea. The Company has subsidiaries in Germany, Belgium, Great Britain, Sweden, Denmark and Poland, which all are also sales offices. In addition to sea transportation, the Company provides port services in Helsinki and Turku. GROUP STRUCTURE Finnlines Plc is a Finnish public limited company, which operates under Finnish jurisdiction and legislation. At the end of the reporting period, the Group consisted of the parent company and 21 subsidiaries. Finnlines is part of the Italian Grimaldi Group, which is a global logistics group specialising in maritime transport of cars, rolling cargo, containers and passengers. The Grimaldi Group comprises seven shipping companies, including Finnlines, Atlantic Container Line (ACL), Malta Motorways of the Sea (MMS) and Minoan Lines. With an owned fleet of about 120 vessels, the Group provides maritime transport services for rolling cargo and containers between Northern Europe, the Mediterranean, the Baltic Sea, West Africa, North and South America. It also offers passenger services within the Mediterranean and the Baltic Sea. On 25 August 2016, Grimaldi Group S.p.A. gained title to all the shares in Finnlines Plc and the shares were thus delisted. GENERAL MARKET DEVELOPMENT Based on the statistics by the Finnish Transport Agency for January–December, the Finnish seaborne imports carried in container, lorry and trailer units increased by 4 per cent, whereas exports increased by 4 per cent (measured in tons) compared to the same period in 2015. Private and commercial passenger traffic between Finland and Sweden remained on the same level as in 2015. The corresponding traffic between Finland and Germany increased by 4 per cent (Finnish Transport Agency). FINNLINES’ TRAFFIC At the beginning of 2016, the frequency of the Poland service increased and Hanko became at new port of call in Finland. Finnlines also made a major improvement in its weekly liner services between West Finland and Germany, and offered two direct sailings from Turku to Travemünde and back. The line was operated by Finnlines' newest ro-ro vessels with a capacity of 3,260 lane metres. In January 2016, the charter agreement of MS Misida expired and the vessel was redelivered in Tilbury on 4 January 2016. Finnlines also acquired two ro-ro vessels in accordance with the purchase agreement signed earlier. The vessels were put into Finnlines’ liner services in February 2016. Starting from July 2016, MS Finneagle was transferred from the FinnLink service and chartered out to the Grimaldi Group. The vessel returned to the Finnlink service in October, and at the
same time, MS Finnfellow was docked for the installation of the exhaust gas cleaning system. During the reporting period, Finnlines operated on average 21 (22) vessels in its own traffic. The cargo volumes transported during January–December totalled approximately 629 (624 in 2015) thousand cargo units, 119 (156) thousand cars (not including passengers’ cars) and 1,611 (2,032) thousand tons of freight not possible to measure in units. In addition, some 602 (575) thousand private and commercial passengers were transported. FINANCIAL RESULTS The Finnlines Group recorded revenue totalling EUR 473.7 (511.2) million in 2016, a decrease of 7.3 per cent compared to the same period in the previous year. Shipping and Sea Transport Services generated revenue amounting to EUR 453.6 (492.9) million and Port Operations EUR 38.4 (35.9) million. The Shipping and Sea Transport Services segment’s revenue decreased mainly due to the lower bunker surcharge as compensation passed to our clients. In Port Operations the revenue grew due to increased external and internal cargo handling activities. The internal revenue between the segments was EUR 18.2 (17.6) million. Result before interest, taxes, depreciation and amortisation (EBITDA) was EUR 139.1 (126.9) million, an increase of 9.6 per cent. Result before interest and taxes (EBIT) was EUR 81.5 (70.3) million. In 2016, most of the vessels were operated using less expensive fuel oil, which had a positive impact on the result even though bunker prices started to increase globally during the fourth quarter. The result includes a gain on sale of EUR 4.4 million for MS Finnsailor. As a result of the improved financial position, net financial expenses decreased and were EUR -14.6 (-17.1) million. Financial income was EUR 0.4 (0.9) million and financial expenses EUR -15.0 (-18.1) million. Result before taxes (EBT) improved by EUR 13.8 million and was EUR 67.0 (53.2) million. The result for the reporting period was EUR 68.1 (56.8) million). The most important business and share related key indicators are presented in the Five-Year Key Figures on page 47. STATEMENT OF FINANCIAL POSITION, FINANCING AND CASH-FLOW Even though the Company has an ongoing Environmental Technology Investment Programme and paid dividends of EUR 41.3 million, interest-bearing debt decreased by EUR 42.6 million and amounted to EUR 491.1 (533.7) million excluding leasing liabilities of EUR 3.7 (17.9) million. The equity ratio calculated from the balance sheet improved to 48.9 (45.7) per cent and gearing dropped to 83.8 (97.1) per cent. Due to the expired charter agreements and redelivery of the remaining chartered tonnage in the first quarter 2016, vessel lease commitments decreased by EUR 0.1 million to EUR 0.0 million compared to the end of December 2015.

4 FINNLINES PLC Financial Statements 2016 (figures in EUR thousand, if not stated otherwise)
The Group’s liquidity position is strong and at the end of the period, cash and cash equivalents together with unused committed credit facilities amounted to EUR 130.5 (114.5) million. Net cash generated from operating activities improved considerably and was EUR 124.8 (105.8) million. CAPITAL EXPENDITURE The Finnlines Group’s gross capital expenditure in the reporting period totalled EUR 46.3 (64.1) million, including tangible and intangible assets. Total depreciation and amortisation amounted to EUR 57.6 (56.6) million. The investments consist of the final payments related to the purchase and delivery of MS Finncarrier and MS Finnmaster, normal replacement expenditure of fixed assets, scrubber and reblading projects, improvement of passenger areas and dry-dockings of ships. In 2015, Finnlines launched the second phase of the EUR 100 million Environmental Technology Investment Programme which covered scrubber orders for its remaining ro-ro vessels and a further three of its ro-pax vessels. Moreover, additional energy efficiency investment was initiated by extending the propulsion upgrading programme. The first of three ro-pax vessels to be rebladed and equipped with scrubbers, MS Finnclipper, received her new IAPP Certificate on 18 August 2016 upon completion of scrubber system commissioning. The second ro-pax vessel to be rebladed and equipped with scrubbers, MS Finnfellow, was under retrofit during the fourth quarter 2016. The last of the three ro-pax vessels to undergo the same environmental upgrade, MS Finneagle, will receive her scrubbers and new blades onboard in the first quarter 2017. After this, the whole Programme will be completed. As part of the Connecting Europe Facility (CEF), the European Union awarded Finnlines a funding of EUR 14.5 million for environmental technology investments on vessels in liner services. The funding is recognised as adjustment of investment costs. Interim payments of EUR 12.5 million had been received until the end of 2016. Furthermore in June 2016, Finnlines signed a loan from EIB with guarantees from Nordea and Finnvera to finance part of the EUR 100 million Environmental Technology Investment Programme. During spring 2016, Finnlines initiated an extensive refurbishment programme of the passenger areas on six of its ro-pax vessels. The vessels deployed on the FinnLink route were all upgraded before the summer season. On the HansaLink vessels, the programme was divided into two phases. The first phase was completed by midsummer and the second, more extensive phase, which included refurbishment of shops, cafeterias and restaurants, started in September 2016. All passenger service area improvements were completed during the fourth quarter 2016. PERSONNEL The Group employed an average of 1,653 (1,597) persons during the reporting period, consisting of 957 (899) persons at sea and 696 (698) persons on shore. The number of persons employed at the end of the period was 1,627 (1,588) in total, of which 934 (889) at sea and 693 (699) on shore. The number of sea personnel increased due to the acquisition of the new vessels MS Finnmaster and MS Finncarrier, which joined the Group´s fleet at the beginning of 2016. The personnel expenses (including social costs) for the reporting period were EUR 89.8 (84.2) million.
RESEARCH AND DEVELOPMENT The aim of Finnlines’ research and development work is to find and introduce new practical models and operating methods, which enable the Company to meet customer requirements in a more sustainable and cost-efficient way. In 2016, the focus continued to be on environmental investments and energy efficiency of the vessels. In 2016, the project for installation of scrubbers on vessels was continued. Further, improvements for enabling a lower resistance were made to some of the vessels. These measures will considerably reduce energy consumption and impacts on the environment. The Company has initiated a study on lengthening a ro-ro vessel series by approximately 30 metres each. The technical specification (i.e. concept study) was prepared during autumn 2016. The objective is to enable profitable growth by increasing vessel capacity and improving transporting efficiency by utilising bigger transport units. During 2016, the harmonisation of the systems within the Finnlines Group and in the framework of the entire Grimaldi Group network were continued. Over the year, the new operative IT system for the cargo traffic, which was implemented in 2015, was developed further by adding new functionalities and improving the usability of the system. For instance, a new mobile user interface for cargo booking enables a more flexible and faster interaction with customers. In 2016, the design of the new operative systems in the ports was continued. The development and implementation of the new systems will still continue in 2017 and 2018. THE FINNLINES SHARE The Company’s paid-up and registered share capital on 31 December 2016 totalled EUR 103,006,282. The capital stock consisted of 51,503,141 shares. On 25 August 2016, Grimaldi Group S.p.A. gained title to all the shares in Finnlines Plc and the shares were thus delisted from the official list of Nasdaq Helsinki Oy. The shares and shareholders are dealt with in more detail in the Notes to the Consolidated Financial Statements, in Note 37. Shares and shareholders. DECISIONS TAKEN BY THE ANNUAL GENERAL MEETING Finnlines Plc’s Annual General Meeting was held in Helsinki on 12 April 2016. The Annual General Meeting of Finnlines Plc approved the Financial Statements, the Board of Directors’ Report and the Auditor’s Report, and discharged the members of the Board of Directors and the President and CEO from liability for the financial year 2015. It was decided to accept the proposal of the Board of Directors that no dividend be paid for 2015. The meeting decided that the number of Board Members be seven. All of the current Board Members were re-elected; Mr Christer Backman, Ms Tiina Bäckman, Mr Emanuele Grimaldi, Mr Gianluca Grimaldi, Mr Diego Pacella, Mr Olav K. Rakkenes and Mr Jon-Aksel Torgersen. It was decided to pay annual compensation to the members of the Board as follows: EUR 50,000 for the Chairman, EUR 40,000 for the Vice Chairman, and EUR 30,000 for each of the other members of the Board. The Annual General Meeting elected APA KPMG Oy Ab as the Company’s auditor for the fiscal year 2016. It was decided that the external auditors be reimbursed according to invoice. It was decided to authorise the Board of Directors to resolve on the issuance of shares in one or several tranches. The Board of
FINNLINES PLC Financial Statements 2016 (figures in EUR thousand, if not stated otherwise)
5
Directors may, on the basis of the authorisation, resolve on the issuance of shares in one or several tranches, so that the aggregate number of shares to be issued shall not exceed 10,000,000 shares. The Board of Directors decides on all the conditions of the issuance of shares. The issuance of shares may be carried out in deviation from the shareholders’ pre-emptive rights (directed issue). The authorisation is valid until the next Annual General Meeting. The authorisation replaces the Annual General Meeting’s authorisation to decide on a share issue of 14 April 2015. DECISIONS TAKEN BY THE EXTRAORDINARY GENERAL MEETING Finnlines Plc’s Extraordinary General Meeting was held on 20 December 2016. The Extraordinary General Meeting decided, in accordance with the proposal of the Board of Directors, to distribute a dividend of EUR 0.80 per share. The dividend was paid to shareholders on 30 December 2016. RISKS AND RISK MANAGEMENT Finnlines is exposed to business risks that arise from the capacity of the fleet existing in the market, counterparties, prospects for export and import of goods, and changes in the operating environment. The risk of overcapacity is reduced through scrapping of aging vessels, on the one hand, and the more stringent Sulphur Directive requirements, on the other. Finnlines operates mainly in the Emissions Control Areas where the emission limits are stricter than globally. The sulphur content limit for heavy fuel oil was reduced to 0.10 per cent as from 1 January 2015 in accordance with the MARPOL Convention. This has increased costs of sea transportation. However, with one of the youngest and largest fleets in Northern Europe and with investments in engine systems and energy efficiency, Finnlines is in a strong position to greatly mitigate this risk. The effect of fluctuations in the foreign trade is reduced by the fact that the Company operates in several geographical areas. This means that slow growth in one country is compensated by faster recovery in another. Finnlines continuously monitors the solidity and payment schedules of its customers and suppliers. Currently, there are no indications of imminent risks related to counterparties but the Company continues to monitor the financial position of its counterparties. Finnlines holds adequate credit lines to maintain liquidity in the current business environment. More detailed information on Finnlines’ financial risks and risk management can be found in the Notes to the Consolidated Financial Statements, in Note 33. Financial Risk Management. The risk management procedures of the Company are presented in more detail on the Company’s website under Corporate Governance. LEGAL PROCEEDINGS The District Court of Helsinki rendered in February 2015 its decision on the dispute between Finnlines Plc and the State of Finland. According to Finnlines Plc, the Finnish Act on Fairway Dues in force until 1 January 2006 contained provisions which, according to EU law, were discriminatory. The Company has been charged excessive fairway dues during 2001–2004. In its decision, the District Court of Helsinki ordered the State of Finland to refund to Finnlines Plc, as plaintiffs, the fairway dues, charged in excessive extent in 2001–2004 totalling about EUR 17.0 million, including interest. The Finnish State appealed to the Helsinki Court of Appeal. The Court of Appeal rendered its decision in August 2016 by dismissing the judgment rendered by
the District Court of Helsinki. The Court of Appeal considers that the claims of Finnlines have expired. The Company has submitted the leave to appeal at the Supreme Court. The case is pending. The Company has summoned OMB Ostsee Mineralöl-Bunker GmbH (’OMB’) Rostock, Germany, to the District Court and demanded compensation for the damage that has occurred to the Company for the price difference between the paid amount for the supplied fuel and the market price. The Company's basis for the demand is that OMB has abused its dominant position in the relevant market and the Company was forced to buy fuel from OMB, OMB being the sole supplier. The total claimed amount is EUR 2.76 million. In its decision the District Court of Rostock dismissed the Company's claims in full. The Company has decided to appeal the District Court's decision to the Court of Appeal. The case is pending. The Company’s port operations subsidiaries have received a summons from 18 former employees. All employees claim compensation based on groundless termination of their employment contracts and compensation according to the Non-Discrimination Act. The total amount of the claims is EUR 2.2 million. The subsidiaries consider the basis of the claims to be groundless. The case is pending. TONNAGE TAXATION Finnlines Plc entered into the Finnish tonnage taxation regime as from 1 January 2013. In tonnage taxation, the shipping operations transferred from taxation of business income to tonnage-based taxation. Finnlines Deutschland GmbH exited from the German tonnage tax scheme and transferred to business taxation on 1 February 2014. ENVIRONMENT AND SAFETY Operating in ecologically sensitive areas, the objective of Finnlines’ safety and environmental policy is to provide safe, top-quality services while making efforts to minimise the environmental impacts in every aspect of operations. In 2016, Finnlines continued to implement its Environmental Technology Investment Programme, which will amount to EUR 100 million. The programme includes the installation of exhaust gas scrubbers, investments in propulsion and reblading, and silicone anti-fouling. The IMO Ballast Water Management Convention will become effective on 8 September 2017, which means that ships must be fitted with treatment equipment by the first renewal survey. Furthermore, exchange of ballast water will be mandatory after the entry-into-force date. Finnlines has investigated different technologies and contacted equipment suppliers. In 2016, Finnlines’ vessel traffic consumed 310,662 tons of heavy fuel oil and diesel oil, representing an increase of 2.9 per cent compared with 2015. In 2015, fuel consumption of vessels was exceptionally low due to a large number of dockings. In 2016, the fuel consumption of the port operations totalled some 810 tons, which includes the operations in Helsinki, Turku and Naantali, an increase of nearly 8 per cent compared with 2015.

6 FINNLINES PLC Financial Statements 2016 (figures in EUR thousand, if not stated otherwise)
CORPORATE GOVERNANCE The Corporate Governance Statement can be reviewed on the corporate website: www.finnlines.com. EVENTS AFTER THE REPORTING PERIOD There are no significant events to report. OUTLOOK AND OPERATING ENVIRONMENT Finnlines is starting a new capital expenditure project on its fleet. We are in the process of lengthening several of our vessels for greater efficiency and better fuel economy. Finnlines Group’s result before taxes is expected to improve over the previous year’s high level.
DIVIDEND DISTRIBUTION PROPOSAL The parent company Finnlines Plc’s result for the reporting period was EUR 56.0 million. The Board of Directors proposes to the General Meeting that the General Meeting authorise the Board of Directors to decide, at its discretion, on the payment of dividend up to Finnlines Plc’s result for the reporting period in 2016. According to the consolidated statement of financial position, the equity attributable to parent company shareholders equals EUR 587.9 (561.1) million at the end of the reporting period. Naples, 23 February 2017 Finnlines Plc, The Board of Directors

FINNLINES PLC Financial Statements 2016 (figures in EUR thousand, if not stated otherwise)
7
CONSOLIDATED STATEMENT OF COMPREHENSIVE INCOME, IFRS
EUR 1,000 Note 1 Jan–31 Dec 2016 1 Jan–31 Dec 2015 Revenue 3, 7 473,711 511,167
Other income from operations 8 6,652 1,810 Materials and services 9 -126,486 -161,264 Personnel expenses 10 -89,753 -84,186 Depreciation, amortisation and impairment losses 11 -57,587 -56,590 Other operating expenses 12 -125,009 -140,654
Total operating expenses
-398,835 -442,694 Result before interest and taxes (EBIT)
81,528 70,284
Financial income 13 412 934 Financial expenses 13 -14,978 -18,064 Result before taxes (EBT)
66,961 53,153
Income taxes 14 1,162 3,675 Result for the reporting period
68,124 56,829
Other comprehensive income:
Other comprehensive income to be reclassified to profit and loss in
subsequent periods:
Exchange differences on translating foreign operations
-74 32
Tax effect, net
0 0 Other comprehensive income to be reclassified to profit and loss in subsequent periods, total
-74 32
Other comprehensive income not being reclassified to profit and loss in subsequent periods:
Remeasurement of defined benefit plans
20 632 Tax effect, net
-29 -36
Other comprehensive income not being reclassified to profit and loss in subsequent periods, total
-8 596
Total comprehensive income for the reporting period
68,041 57,457
Result for the reporting period attributable to:
Parent company shareholders
68,133 56,841
Non-controlling interests
-10 -12
68,124 56,829
Total comprehensive income for the reporting period attributable to:
Parent company shareholders
68,051 57,469
Non-controlling interests
-10 -12
68,041 57,457
Result for the reporting period attributable to parent company shareholders calculated as earnings per share (EUR/share) 15
Undiluted / diluted earnings per share
1.32 1.10 Most of the items recognised in the Consolidated Statement of Comprehensive Income fall under the tonnage tax scheme. See Notes, which are an integral part the Financial Statements, starting on page 11.
8 FINNLINES PLC Financial Statements 2016 (figures in EUR thousand, if not stated otherwise)
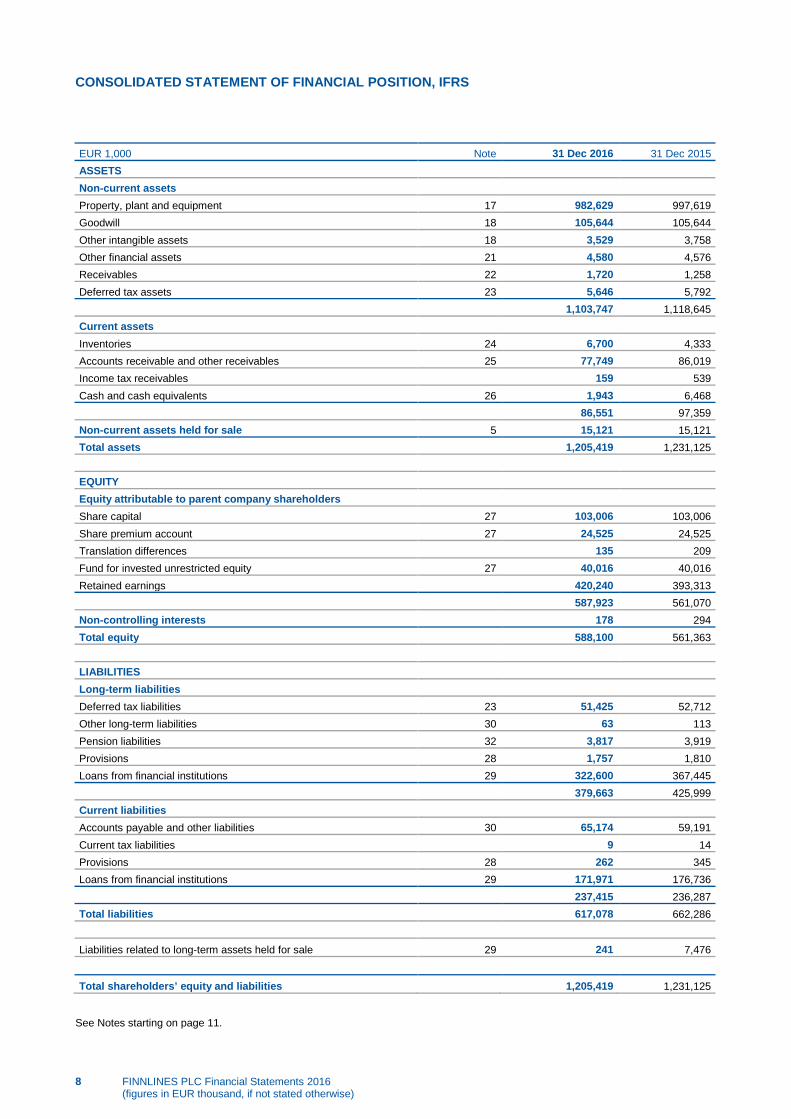
CONSOLIDATED STATEMENT OF FINANCIAL POSITION, IFRS
EUR 1,000 Note 31 Dec 2016 31 Dec 2015 ASSETS
Non-current assets
Property, plant and equipment 17 982,629 997,619
Goodwill 18 105,644 105,644 Other intangible assets 18 3,529 3,758 Other financial assets 21 4,580 4,576 Receivables 22 1,720 1,258 Deferred tax assets 23 5,646 5,792
1,103,747 1,118,645
Current assets
Inventories 24 6,700 4,333
Accounts receivable and other receivables 25 77,749 86,019 Income tax receivables
159 539
Cash and cash equivalents 26 1,943 6,468
86,551 97,359
Non-current assets held for sale 5 15,121 15,121 Total assets
1,205,419 1,231,125
EQUITY
Equity attributable to parent company shareholders
Share capital 27 103,006 103,006 Share premium account 27 24,525 24,525 Translation differences
135 209
Fund for invested unrestricted equity 27 40,016 40,016 Retained earnings
420,240 393,313
587,923 561,070
Non-controlling interests
178 294 Total equity
588,100 561,363
LIABILITIES
Long-term liabilities
Deferred tax liabilities 23 51,425 52,712 Other long-term liabilities 30 63 113 Pension liabilities 32 3,817 3,919 Provisions 28 1,757 1,810 Loans from financial institutions 29 322,600 367,445
379,663 425,999
Current liabilities
Accounts payable and other liabilities 30 65,174 59,191
Current tax liabilities
9 14 Provisions 28 262 345 Loans from financial institutions 29 171,971 176,736
237,415 236,287
Total liabilities
617,078 662,286
Liabilities related to long-term assets held for sale 29 241 7,476
Total shareholders’ equity and liabilities 1,205,419 1,231,125 See Notes starting on page 11.

FINNLINES PLC Financial Statements 2016 (figures in EUR thousand, if not stated otherwise)
9
CONSOLIDATED STATEMENT OF CHANGES IN EQUITY, IFRS
EUR 1,000 Equity attributable to parent company shareholders
Share capital
Share issue
premium Translation differences
Fund for invested
unrestricted equity
Retained earnings Total
Non-controlling
interests Total equity Reported equity 1 January 2015 103,006 24,525 178 40,016 335,876 503,601 306 503,907 Comprehensive income for the year:
Result for the reporting period
56,841 56,841 -12 56,829
Exchange differences on translating foreign operations
32
32
32
Remeasurement of defined benefit plans
632 632
632
Tax effect, net
-36 -36
-36 Total comprehensive income for the year
32
57,437 57,469 -12 57,457
Dividend Equity 31 December 2015 103,006 24,525 209 40,016 393,313 561,070 294 561,363
EUR 1,000 Equity attributable to parent company shareholders
Share capital
Share issue
premium Translation differences
Fund for invested
unrestricted equity
Retained earnings Total
Non-controlling
interests Total equity Reported equity 1 January 2016 103,006 24,525 209 40,016 393,313 561,070 294 561,363 Comprehensive income for the year:
Result for the reporting period
68,133 68,133 -10 68,124
Exchange differences on translating foreign operations
-74
5 -69
-69
Remeasurement of defined benefit plans
20 20
20
Tax effect, net
-29 -29
-29 Total comprehensive income for the year
-74
68,129 68,056 -10 68,046
Dividend
-41,203 -41,203 -106 -41,309
Equity 31 December 2016 103,006 24,525 135 40,016 420,240 587,923 178 588,100

10 FINNLINES PLC Financial Statements 2016 (figures in EUR thousand, if not stated otherwise)
CONSOLIDATED STATEMENT OF CASH FLOWS, IFRS
EUR 1,000 Note 1 Jan–31 Dec 2016 1 Jan–31 Dec 2015 Cash flows from operating activities
Result for reporting period
68,124 56,829 Adjustments:
Non-cash transactions 31 52,461 56,192 Unrealised foreign exchange gains (-) / losses (+) 31 -11 -57 Financial income and expenses
14,577 17,187
Taxes
-1,162 -3,675 Changes in working capital:
Change in accounts receivable and other receivables
1,565 -2,009 Change in inventories
-2,367 1,592
Change in accounts payable and other liabilities
6,471 -2,515 Change in provisions
-155 -238
Interest paid
-11,394 -14,240 Interest received
299 442
Taxes paid
280 -81 Other financing items
-3,842 -3,632
Net cash generated from operating activities 124,845 105,794
Cash flows from investing activities
Investments in tangible and intangible assets *
-38,450 -78,897
Sale of tangible assets ** 8,810 799 Proceeds from sale of investments
-5
Dividends received
13 12 Net cash used in investing activities
-29,632 -78,085
Cash flows from financing activities
Loan withdrawals
205,000 282,000
Net increase (+) / decrease (-) in current interest-bearing liabilities
8,035 32,447 Repayment of loans
-271,662 -338,550
Loans granted
Increase / decrease in non-current receivables
200 180
Dividends paid
-41,309 Net cash used in financing activities -99,736 -23,922
Change in cash and cash equivalents -4,523 3,787 Cash and cash equivalents 1 January
6,468 2,680
Effect of foreign exchange rate changes
-3 1 Cash and cash equivalents 31 December 1,943 6,468
* Investments include environmental aid granted by the European Union, of which the Group has received EUR 6.7 (5.8) million during the reporting period 2016. ** Includes sale of one vessel. See Notes starting on page 11.
FINNLINES PLC Financial Statements 2016 (figures in EUR thousand, if not stated otherwise)
11
NOTES TO THE CONSOLIDATED FINANCIAL STATEMENTS
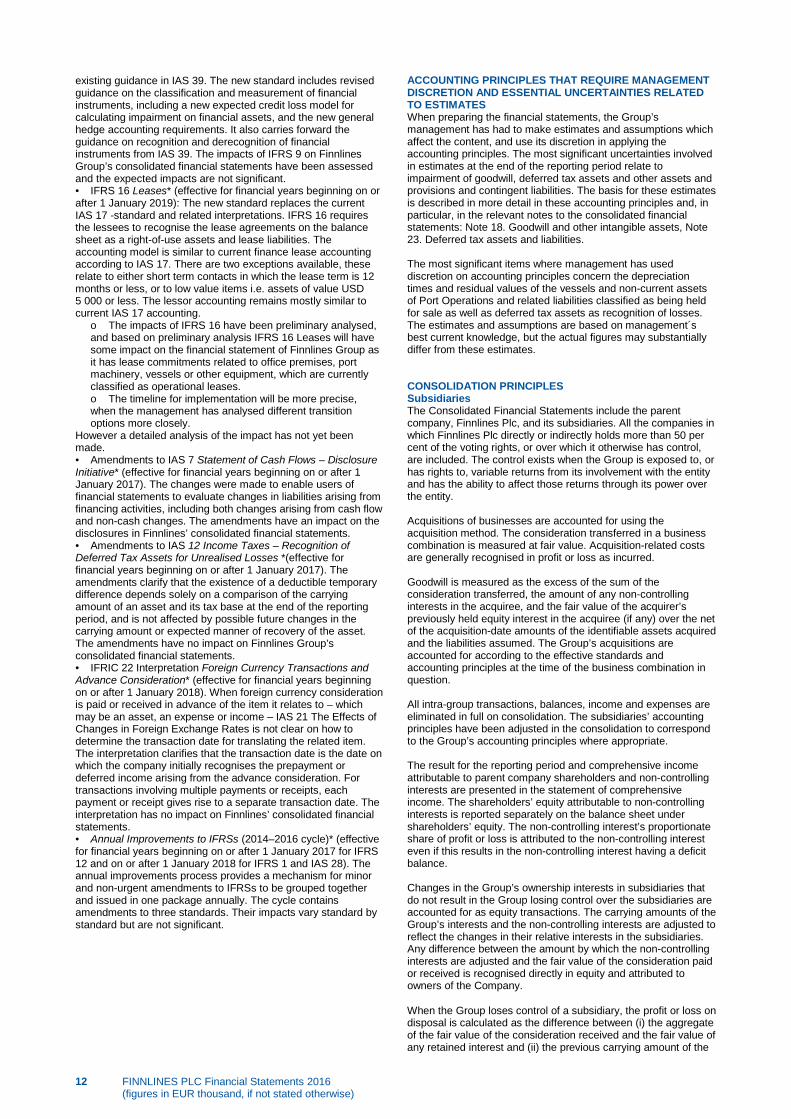
1. CORPORATE INFORMATION Finnlines is the largest shipping company in the Baltic Sea based on both ro-ro and ro-pax volumes (source: Baltic Transportation Journal). The Company’s passenger-freight vessels offer services from Finland to Germany and via the Åland Islands to Sweden, as well as from Sweden to Germany. Finnlines’ ro-ro vessels operate in the Baltic Sea and the North Sea. The Company has subsidiaries in Germany, Belgium, Great Britain, Sweden, Denmark and Poland which all are also sales offices. In addition to sea transportation, the Company provides port services in Helsinki and Turku. Finnlines Plc is a Finnish public limited company. At the end of the financial period, the Group consisted of the parent company and 21 subsidiaries. Finnlines is part of the Italian Grimaldi Group, which is a global logistics group specialising in maritime transport of cars, rolling cargo, containers and passengers. The Grimaldi Group comprises seven shipping companies, including Finnlines, Atlantic Container Line (ACL), Malta Motorways of the Sea (MMS) and Minoan Lines. With an owned fleet of about 120 vessels, the Group provides maritime transport services for rolling cargo and containers between Northern Europe, the Mediterranean, the Baltic Sea, West Africa, North and South America. It also offers passenger services within the Mediterranean and the Baltic Sea. On 25 August 2016, Grimaldi Group S.p.A. gained title to all the shares in Finnlines Plc and the shares were thus delisted. The Group’s parent company, Finnlines Plc, is a Finnish public limited company, which operates under Finnish jurisdiction and legislation. The parent company is registered in Helsinki at Komentosilta 1, 00980 Helsinki. Copies of the financial statements can be obtained from www.finnlines.com or the Company’s headquarters. These financial statements were authorised for issue by the Board of Directors of Finnlines Plc on 23 February 2017. In accordance with the Finnish Companies Act, the financial statements are presented for approval to the Annual General Meeting. 2. ACCOUNTING PRINCIPLES BASIS OF PREPARATION OF THE FINANCIAL STATEMENTS The consolidated financial statements are prepared in accordance with the International Financial Reporting Standards (IFRS), using the IAS and IFRS standards and SIC and IFRIC interpretations valid on 31 December 2016. The International Financial Reporting Standards mean the standards implemented in the EU by Regulation (EC) 1606/2002, and the related interpretations. The notes to the Consolidated Financial Statements also comply with Finnish accounting and corporate legislation. The Consolidated Financial Statements are primarily prepared using the acquisition cost method. Exceptions to this principle are financial assets and liabilities recognised at fair value through profit or loss. The financial statements have been compiled in EUR. All figures in the accounts have been rounded and, consequently, the sum of individual figures may deviate from the presented sum figure. IMPLEMENTATION OF STANDARDS New and amended standards applied in the reporting period ended Finnlines Group has applied as from 1 January 2016 the following new and amended standards that have come into effect. • Annual Improvements to IFRSs (2012–2014 cycle) (effective for financial years beginning on or after 1 January 2016): The annual improvements process provides a mechanism for minor and non-urgent amendments to IFRSs to be grouped together and issued in one package annually. The cycle contains amendments to four standards. Their impacts vary standard by standard but are not significant.
• Amendment to IAS 1 Presentation of Financial Statements: Disclosure Initiative (effective for financial years beginning on or after 1 January 2016). The amendments clarify the guidance in IAS 1 in relation to applying the materiality concept, disaggregating line items in the balance sheet and in the statement of profit or loss, presenting subtotals and to the structure and accounting policies in the financial statement. The amendments have had a minor impact on presentation in Finnlines’ consolidated financial statements. • Amendments to IAS 16 Property, Plant and Equipment and IAS 38 Intangible Assets – Clarification of Acceptable Methods of Depreciation and Amortisation (effective for financial years beginning on or after 1 January 2016): The amendments state that revenue-based methods of depreciation cannot be used for property, plant and equipment and may only be used in limited circumstances to amortise intangible assets if revenue and the consumption of the economic benefits of the intangible assets are highly correlated. The amendments have had no impact on Finnlines’ consolidated financial statements. • Amendments to IFRS 11 Joint Arrangements – Accounting for Acquisitions of Interests in Joint Operations (effective for financial years beginning on or after 1 January 2016): The amendments require business combination accounting to be applied to acquisitions of interests in a joint operation that constitutes a business. The amendments have had no impact on Finnlines’ consolidated financial statements. Adoption of new and amended standards and interpretations applicable in future financial years Finnlines has not yet adopted the following new and amended standards and interpretations already issued by the IASB. The Group will adopt them as of the effective date or, if the date is other than the first day of the financial year, from the beginning of the subsequent financial year. * = not yet endorsed for use by the European Union as of 31 December 2016. • IFRS 15 Revenue from Contracts with Customers (effective for financial years beginning on or after 1 January 2018): The new standard replaces current IAS 18 and IAS 11 standards and related interpretations. In IFRS 15 a five-step model is applied to determine when to recognise revenue, and at what amount. Revenue is recognised when (or as) a company transfers control of goods or services to a customer either over time or at a point in time. The standard introduces also extensive new disclosure requirements. The impacts of IFRS 15 on Finnlines Group’s consolidated financial statements have been preliminary assessed, but the assessment may change when more specific analysis is done.
o Key concepts of IFRS 15 have been preliminary analysed for different revenue streams. Based on the preliminary analysis the revenue arising from the frequent liner cargo transportation services and port operations is recognized over time as these services are being provided to the customer. Regarding transportation of cargo the rate of fulfilment is determined based on transportation days. The revenue arising from liner passenger transportation and related services is recognized at a point of time when the voyage has ended. The standard may have an effect on the time of recognition, if the sale includes several performance obligations or variable consideration, but the management estimates that the new standard will not have a significant impact on the financial statement of Finnlines group. o Timeline for implementation will be more precise, when the management has analysed different transition options more closely.
• Amendments to IFRS 15 – Clarifications to IFRS 15 Revenue from Contracts with Customers* (effective for financial years beginning on or after 1 January 2018). The amendments include clarifications and further examples on how to apply certain aspects of the five-step recognition model. The impact assessment of the clarifications has been included in the IFRS 15 impact assessment described above. • IFRS 9 Financial Instruments* (effective for financial years beginning on or after 1 January 2018): IFRS 9 replaces the
12 FINNLINES PLC Financial Statements 2016 (figures in EUR thousand, if not stated otherwise)
existing guidance in IAS 39. The new standard includes revised guidance on the classification and measurement of financial instruments, including a new expected credit loss model for calculating impairment on financial assets, and the new general hedge accounting requirements. It also carries forward the guidance on recognition and derecognition of financial instruments from IAS 39. The impacts of IFRS 9 on Finnlines Group’s consolidated financial statements have been assessed and the expected impacts are not significant. • IFRS 16 Leases* (effective for financial years beginning on or after 1 January 2019): The new standard replaces the current IAS 17 -standard and related interpretations. IFRS 16 requires the lessees to recognise the lease agreements on the balance sheet as a right-of-use assets and lease liabilities. The accounting model is similar to current finance lease accounting according to IAS 17. There are two exceptions available, these relate to either short term contacts in which the lease term is 12 months or less, or to low value items i.e. assets of value USD 5 000 or less. The lessor accounting remains mostly similar to current IAS 17 accounting.
o The impacts of IFRS 16 have been preliminary analysed, and based on preliminary analysis IFRS 16 Leases will have some impact on the financial statement of Finnlines Group as it has lease commitments related to office premises, port machinery, vessels or other equipment, which are currently classified as operational leases. o The timeline for implementation will be more precise, when the management has analysed different transition options more closely.
However a detailed analysis of the impact has not yet been made. • Amendments to IAS 7 Statement of Cash Flows – Disclosure Initiative* (effective for financial years beginning on or after 1 January 2017). The changes were made to enable users of financial statements to evaluate changes in liabilities arising from financing activities, including both changes arising from cash flow and non-cash changes. The amendments have an impact on the disclosures in Finnlines’ consolidated financial statements. • Amendments to IAS 12 Income Taxes – Recognition of Deferred Tax Assets for Unrealised Losses *(effective for financial years beginning on or after 1 January 2017). The amendments clarify that the existence of a deductible temporary difference depends solely on a comparison of the carrying amount of an asset and its tax base at the end of the reporting period, and is not affected by possible future changes in the carrying amount or expected manner of recovery of the asset. The amendments have no impact on Finnlines Group’s consolidated financial statements. • IFRIC 22 Interpretation Foreign Currency Transactions and Advance Consideration* (effective for financial years beginning on or after 1 January 2018). When foreign currency consideration is paid or received in advance of the item it relates to – which may be an asset, an expense or income – IAS 21 The Effects of Changes in Foreign Exchange Rates is not clear on how to determine the transaction date for translating the related item. The interpretation clarifies that the transaction date is the date on which the company initially recognises the prepayment or deferred income arising from the advance consideration. For transactions involving multiple payments or receipts, each payment or receipt gives rise to a separate transaction date. The interpretation has no impact on Finnlines’ consolidated financial statements. • Annual Improvements to IFRSs (2014–2016 cycle)* (effective for financial years beginning on or after 1 January 2017 for IFRS 12 and on or after 1 January 2018 for IFRS 1 and IAS 28). The annual improvements process provides a mechanism for minor and non-urgent amendments to IFRSs to be grouped together and issued in one package annually. The cycle contains amendments to three standards. Their impacts vary standard by standard but are not significant.
ACCOUNTING PRINCIPLES THAT REQUIRE MANAGEMENT DISCRETION AND ESSENTIAL UNCERTAINTIES RELATED TO ESTIMATES When preparing the financial statements, the Group’s management has had to make estimates and assumptions which affect the content, and use its discretion in applying the accounting principles. The most significant uncertainties involved in estimates at the end of the reporting period relate to impairment of goodwill, deferred tax assets and other assets and provisions and contingent liabilities. The basis for these estimates is described in more detail in these accounting principles and, in particular, in the relevant notes to the consolidated financial statements: Note 18. Goodwill and other intangible assets, Note 23. Deferred tax assets and liabilities. The most significant items where management has used discretion on accounting principles concern the depreciation times and residual values of the vessels and non-current assets of Port Operations and related liabilities classified as being held for sale as well as deferred tax assets as recognition of losses. The estimates and assumptions are based on management´s best current knowledge, but the actual figures may substantially differ from these estimates. CONSOLIDATION PRINCIPLES Subsidiaries The Consolidated Financial Statements include the parent company, Finnlines Plc, and its subsidiaries. All the companies in which Finnlines Plc directly or indirectly holds more than 50 per cent of the voting rights, or over which it otherwise has control, are included. The control exists when the Group is exposed to, or has rights to, variable returns from its involvement with the entity and has the ability to affect those returns through its power over the entity. Acquisitions of businesses are accounted for using the acquisition method. The consideration transferred in a business combination is measured at fair value. Acquisition-related costs are generally recognised in profit or loss as incurred. Goodwill is measured as the excess of the sum of the consideration transferred, the amount of any non-controlling interests in the acquiree, and the fair value of the acquirer’s previously held equity interest in the acquiree (if any) over the net of the acquisition-date amounts of the identifiable assets acquired and the liabilities assumed. The Group’s acquisitions are accounted for according to the effective standards and accounting principles at the time of the business combination in question. All intra-group transactions, balances, income and expenses are eliminated in full on consolidation. The subsidiaries’ accounting principles have been adjusted in the consolidation to correspond to the Group’s accounting principles where appropriate. The result for the reporting period and comprehensive income attributable to parent company shareholders and non-controlling interests are presented in the statement of comprehensive income. The shareholders’ equity attributable to non-controlling interests is reported separately on the balance sheet under shareholders’ equity. The non-controlling interest’s proportionate share of profit or loss is attributed to the non-controlling interest even if this results in the non-controlling interest having a deficit balance. Changes in the Group’s ownership interests in subsidiaries that do not result in the Group losing control over the subsidiaries are accounted for as equity transactions. The carrying amounts of the Group’s interests and the non-controlling interests are adjusted to reflect the changes in their relative interests in the subsidiaries. Any difference between the amount by which the non-controlling interests are adjusted and the fair value of the consideration paid or received is recognised directly in equity and attributed to owners of the Company. When the Group loses control of a subsidiary, the profit or loss on disposal is calculated as the difference between (i) the aggregate of the fair value of the consideration received and the fair value of any retained interest and (ii) the previous carrying amount of the
FINNLINES PLC Financial Statements 2016 (figures in EUR thousand, if not stated otherwise)
13
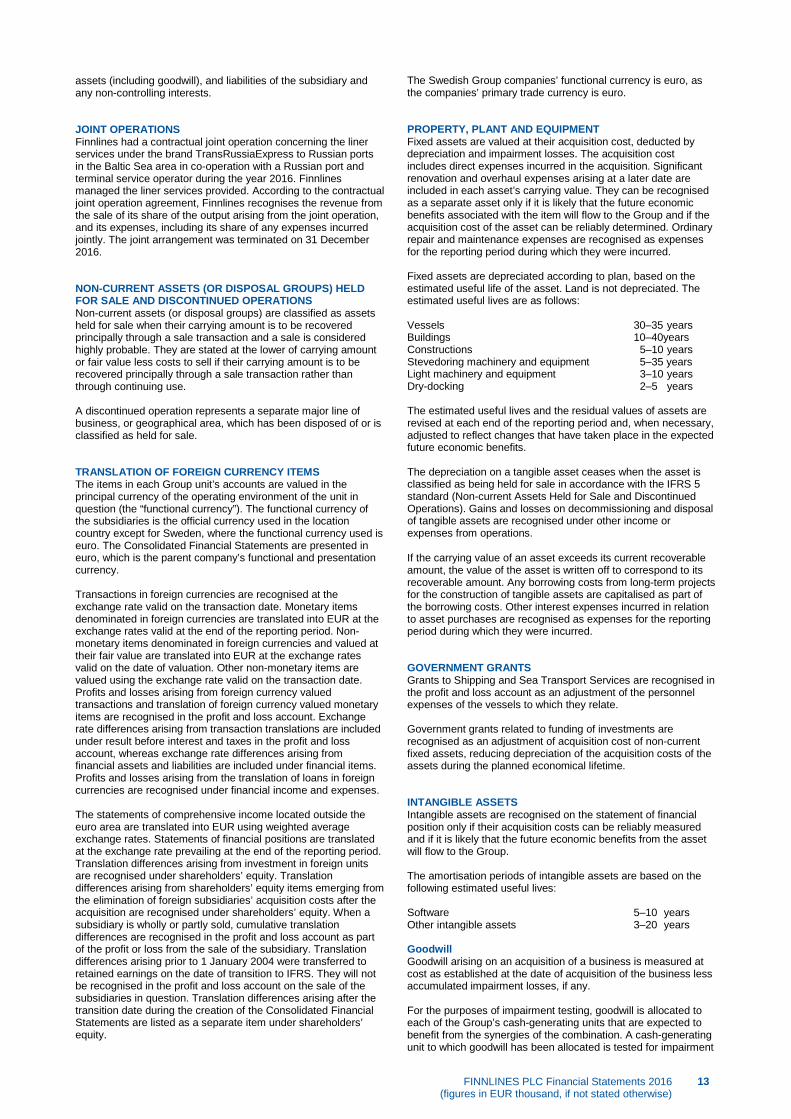
assets (including goodwill), and liabilities of the subsidiary and any non-controlling interests. JOINT OPERATIONS Finnlines had a contractual joint operation concerning the liner services under the brand TransRussiaExpress to Russian ports in the Baltic Sea area in co-operation with a Russian port and terminal service operator during the year 2016. Finnlines managed the liner services provided. According to the contractual joint operation agreement, Finnlines recognises the revenue from the sale of its share of the output arising from the joint operation, and its expenses, including its share of any expenses incurred jointly. The joint arrangement was terminated on 31 December 2016. NON-CURRENT ASSETS (OR DISPOSAL GROUPS) HELD FOR SALE AND DISCONTINUED OPERATIONS Non-current assets (or disposal groups) are classified as assets held for sale when their carrying amount is to be recovered principally through a sale transaction and a sale is considered highly probable. They are stated at the lower of carrying amount or fair value less costs to sell if their carrying amount is to be recovered principally through a sale transaction rather than through continuing use. A discontinued operation represents a separate major line of business, or geographical area, which has been disposed of or is classified as held for sale. TRANSLATION OF FOREIGN CURRENCY ITEMS The items in each Group unit’s accounts are valued in the principal currency of the operating environment of the unit in question (the “functional currency”). The functional currency of the subsidiaries is the official currency used in the location country except for Sweden, where the functional currency used is euro. The Consolidated Financial Statements are presented in euro, which is the parent company’s functional and presentation currency. Transactions in foreign currencies are recognised at the exchange rate valid on the transaction date. Monetary items denominated in foreign currencies are translated into EUR at the exchange rates valid at the end of the reporting period. Non-monetary items denominated in foreign currencies and valued at their fair value are translated into EUR at the exchange rates valid on the date of valuation. Other non-monetary items are valued using the exchange rate valid on the transaction date. Profits and losses arising from foreign currency valued transactions and translation of foreign currency valued monetary items are recognised in the profit and loss account. Exchange rate differences arising from transaction translations are included under result before interest and taxes in the profit and loss account, whereas exchange rate differences arising from financial assets and liabilities are included under financial items. Profits and losses arising from the translation of loans in foreign currencies are recognised under financial income and expenses. The statements of comprehensive income located outside the euro area are translated into EUR using weighted average exchange rates. Statements of financial positions are translated at the exchange rate prevailing at the end of the reporting period. Translation differences arising from investment in foreign units are recognised under shareholders’ equity. Translation differences arising from shareholders’ equity items emerging from the elimination of foreign subsidiaries’ acquisition costs after the acquisition are recognised under shareholders’ equity. When a subsidiary is wholly or partly sold, cumulative translation differences are recognised in the profit and loss account as part of the profit or loss from the sale of the subsidiary. Translation differences arising prior to 1 January 2004 were transferred to retained earnings on the date of transition to IFRS. They will not be recognised in the profit and loss account on the sale of the subsidiaries in question. Translation differences arising after the transition date during the creation of the Consolidated Financial Statements are listed as a separate item under shareholders’ equity.
The Swedish Group companies’ functional currency is euro, as the companies’ primary trade currency is euro. PROPERTY, PLANT AND EQUIPMENT Fixed assets are valued at their acquisition cost, deducted by depreciation and impairment losses. The acquisition cost includes direct expenses incurred in the acquisition. Significant renovation and overhaul expenses arising at a later date are included in each asset’s carrying value. They can be recognised as a separate asset only if it is likely that the future economic benefits associated with the item will flow to the Group and if the acquisition cost of the asset can be reliably determined. Ordinary repair and maintenance expenses are recognised as expenses for the reporting period during which they were incurred. Fixed assets are depreciated according to plan, based on the estimated useful life of the asset. Land is not depreciated. The estimated useful lives are as follows: Vessels 30‒35 years Buildings 10‒40years Constructions 5‒10 years Stevedoring machinery and equipment 5‒35 years Light machinery and equipment 3‒10 years Dry-docking 2‒5 years The estimated useful lives and the residual values of assets are revised at each end of the reporting period and, when necessary, adjusted to reflect changes that have taken place in the expected future economic benefits. The depreciation on a tangible asset ceases when the asset is classified as being held for sale in accordance with the IFRS 5 standard (Non-current Assets Held for Sale and Discontinued Operations). Gains and losses on decommissioning and disposal of tangible assets are recognised under other income or expenses from operations. If the carrying value of an asset exceeds its current recoverable amount, the value of the asset is written off to correspond to its recoverable amount. Any borrowing costs from long-term projects for the construction of tangible assets are capitalised as part of the borrowing costs. Other interest expenses incurred in relation to asset purchases are recognised as expenses for the reporting period during which they were incurred. GOVERNMENT GRANTS Grants to Shipping and Sea Transport Services are recognised in the profit and loss account as an adjustment of the personnel expenses of the vessels to which they relate. Government grants related to funding of investments are recognised as an adjustment of acquisition cost of non-current fixed assets, reducing depreciation of the acquisition costs of the assets during the planned economical lifetime. INTANGIBLE ASSETS Intangible assets are recognised on the statement of financial position only if their acquisition costs can be reliably measured and if it is likely that the future economic benefits from the asset will flow to the Group. The amortisation periods of intangible assets are based on the following estimated useful lives: Software 5‒10 years Other intangible assets 3‒20 years Goodwill Goodwill arising on an acquisition of a business is measured at cost as established at the date of acquisition of the business less accumulated impairment losses, if any. For the purposes of impairment testing, goodwill is allocated to each of the Group’s cash-generating units that are expected to benefit from the synergies of the combination. A cash-generating unit to which goodwill has been allocated is tested for impairment

14 FINNLINES PLC Financial Statements 2016 (figures in EUR thousand, if not stated otherwise)
annually, or more frequently when there is indication that the unit may be impaired. If the recoverable amount of the cash-generating unit is less than its carrying amount, the impairment loss is allocated first to reduce the carrying amount of any goodwill allocated to the unit and then to the other assets of the unit pro rata based on the carrying amount of each asset in the unit. Any impairment loss for goodwill is recognised directly in profit or loss. An impairment loss recognised for goodwill is not reversed in subsequent periods. Research and development expenses Research expenses are recognised as expenses in the reporting period in which they arise. Development expenses are capitalised when the Company is able to determine the technical feasibility and commercial usability of the product under development and when the acquisition cost can be reliably calculated. Other development expenses are recognised as expenses. Development expenses that have previously been recognised as expenses are not capitalised later. Research and development expenses that have been recognised as expenses are included in the consolidated profit and loss account as other operating expenses. Other intangible assets Other intangible assets are valued at their acquisition cost excluding depreciation and impairments. They are amortised according to plan and recognised as expenses during their estimated useful lives. Intangible assets with unlimited useful lives are not amortised but are tested annually for impairment. IMPAIRMENT Assets are reviewed for indications of impairment. If there are indications of impairment, the current recoverable amount of the asset in question is estimated using the higher of its current net selling price or its value in use. Goodwill is tested for impairment annually and always if there is an indication of impairment. If the carrying value exceeds the current recoverable amount, the difference is recognised in the profit and loss account as an impairment loss. Impairment losses recognised previously are reversed if the assumptions used in the calculation of the current recoverable amount change. Impairment losses are reversed only up to the amount corresponding to what the carrying value would have been without the impairment loss. Impairment losses recognised for goodwill are not reversed. In accordance with IAS 39, all financial assets are evaluated on each end of the reporting period to see whether there is objective evidence of impairment of an item or a group of items under the financial assets. A credit loss is recognised for accounts receivable when there is a reliable indication that it will not be possible to collect the receivable in accordance with the original terms. The amount of the credit loss is the difference between the receivables’ carrying value and realisable present value. Impairment losses recognised through profit or loss for investments in equity instruments classified as available-for-sale are not reversed in subsequent years’ profit and loss accounts. FINANCIAL ASSETS AND LIABILITIES Financial assets The Group’s financial assets are classified as follows: financial assets at fair value through profit or loss, held-to-maturity investments, loans and other receivables and available-for-sale financial assets. The classification is dependent on the original purpose of the acquisition of the financial assets. The classification is determined at the time of the acquisition of the financial assets. Transaction costs are included in the original carrying value of financial assets for assets that are not recognised at fair value through profit or loss. All financial asset acquisitions and sales are recognised at the transaction date. Financial assets are derecognised from the statement of financial position when the Group loses its contractual right to their cash flow or when the Group has transferred a significant amount of the risks and profits outside the Group.
The “Financial assets at fair value through profit or loss” category includes assets held for trading as well as assets that were originally recognised at fair value through profit or loss. The aim of financial assets held for trading is to produce profits in the short term (less than 12 months), and they are recognised under current assets. Derivatives for which hedge accounting according to IAS 39 is not applied are classified as assets held for trading. The assets in this category are valued at their fair value. Unrealised and realised profits and losses arising from changes in fair value are recognised in the profit and loss account in the reporting period during which they arise. The Group has no outstanding derivative contracts at balance sheet date 2015 or 2016. Held-to-maturity investments are valued at amortised cost. During 2016, the Group had no financial assets to be classified into this category. Subsequent to initial recognition available-for-sale financial assets are valued at fair value. Generally the fair value of investments in this category is determined based on quoted prices published on the active market, i.e. bid quotations at the balance sheet date. Unrealised gains and losses arising from valuation at fair value are recognised in the fair value reserve under shareholders’ equity. If financial assets available-for-sale are sold or permanently impaired, the cumulative gains and losses are recognised in the profit and loss account under financial income and expenses. Available-for-sale financial assets are included in non-current assets unless the Company intends to sell them within the 12 months following the end of the reporting period, in which case they are included under current assets. The majority of financial assets available for sale consists of unlisted shares which are valued at the lower of acquisition cost or probable value, as their fair value cannot be reliably measured. Loans and other receivables are assets whose payments are fixed or can be reliably determined, and which are not quoted on the active market or held for trading. This category includes financial assets that have been acquired by transferring money, goods or services to a debtor. These items are valued at amortised cost using the effective interest method. Within the Finnlines Group, these items include accounts receivable and other receivables, granted loans and fixed-term deposits with a maturity longer than three months. Cash and cash equivalents include cash in hand and at bank as well as other highly liquid assets with a low risk of change of value and with original maturity at acquisition date of less than three months. Financial liabilities Financial liabilities are initially recognised at the value of the original loan amount less any attributable transaction costs incurred in relation to the acquisition or issuing of the financial liability item in question. Subsequent, all financial liabilities are valued at amortised cost using the effective interest method. Financial liabilities are included in both non-current and current liabilities and they can be either interest-bearing or non-interest-bearing. Derivatives that do not meet the conditions of hedge accounting or for which hedge accounting is not applied are classified as assets held for trading and are valued at fair value. Negative derivative fair values are recognised under short-term liabilities on the statement of financial position. Borrowing costs Borrowing costs are recognised as expenses for the accounting period during which they have arisen, except for the borrowing costs that are directly attributable to the acquisition or construction of a qualifying asset. The total of the capitalised costs and the items to which they have been capitalised as acquisition cost are shown in Note 17. Property, plant and equipment. DERIVATIVES AND HEDGE ACCOUNTING Derivative contracts are recognised at an acquisition cost that corresponds to their fair value at the date of acquisition. After

FINNLINES PLC Financial Statements 2016 (figures in EUR thousand, if not stated otherwise)
15
acquisition, derivative contracts are measured at fair value, which is determined on the basis of bid and sales quotations published in the active market. Gains and losses arising from fair value measurement are recognised based on the purpose of derivative contracts. Hedge accounting The Group may hedge against risks arising from changes in foreign currency rates. Such risks include acquisitions of vessels made partly or fully in a foreign currency. At the inception of a hedge relationship, the Group documents the relationship between the hedging instruments and hedged item, as well as its risk management objectives and its strategy for undertaking various hedge transactions. Furthermore, at the inception of the hedge and on an ongoing basis, the Group documents and evaluates whether the hedging instrument that is used in a hedging relationship is highly effective in offsetting changes in cash flows of the hedged item. The effective portion of changes in the fair value of derivatives that are designated and qualify as cash flow hedges is presented in other comprehensive income and is recorded in the fair value reserve under shareholders’ equity. The gains and losses recognised in shareholders’ equity are transferred to the profit and loss account for the accounting period in which the hedged item is recognised in the income statement. The ineffective portion of the hedge relationship is recognised in financial income or expenses. When the forecast transaction that is hedged results in the recognition of a non-financial asset or a non-financial liability, the gains and losses previously deferred in shareholders’ equity are transferred from equity and included in the acquisition cost of the asset. The fair values of the derivative instruments used for hedging purposes are presented in the notes. When the hedging instrument for a cash flow item expires or is sold or no longer qualifies for hedge accounting, any cumulative gain or loss deferred in shareholders’ equity at that time remains in shareholders’ equity until the forecast transaction occurs. However, if the forecast transaction is no longer expected to occur, the cumulative gain or loss that was deferred in shareholders’ equity is recognised immediately in the profit and loss account. Even though some hedging relationships may fulfil the requirements set by the Group’s risk management on effective hedging, hedge accounting in accordance with IAS 39 is not applied to them. Such instruments include any derivatives hedging against foreign currency risk related to operations, and interest rate derivatives hedging against interest rate risk of debt portfolio, whose fair value changes are recognised in financial income and expenses. In the statement of financial position these items are shown, according to their nature, under either short- or long-term receivables or payables. LEASES The Group as a lessee Leases with the Group as leaseholder, where a significant proportion of the risks and benefits associated with ownership remain with the lessor, are classified as operating leases, and the leases paid in relation to them are recognised as expenses in the profit and loss account on a straight-line basis over the period of the lease. Leases in which the Company has assumed a significant proportion of the risks and benefits associated with ownership are classified as finance leases. Finance leases are recognised on the statement of financial position as assets and liabilities on the start date of the lease period at a value equivalent to the lower of the fair value of the leased goods or the present value of the minimum lease, which are determined on the date of contract. Minimum leases are divided into financial expenses and loan repayments. Financial expenses are recognised as expenses in the profit and loss account and allocated over the reporting periods within the lease contract period to the extent that the outstanding loan in each period has an equal interest rate. Depreciation of the leased assets subject to depreciation is calculated according to the same principles as depreciation of
owned assets. If there is reasonable certainty that the Group will obtain ownership of an asset before the end of its lease period, the asset’s estimated useful life is the same as its economic life. Otherwise, the asset is depreciated within the shorter of the lease period or the useful life. The Group as a lessor Leases where the Group retains substantially all the risks and benefits of ownership of the asset are classified as operating leases. Leases where the Group acts as a lessee of vessels under operating leases but where the Group generates income through subleasing these, are also classified as operating leases. Lease income from operating leases is recognised in income on a straight-line basis over the lease term, and in case of vessels, normally adjusted with the non-usable days for the lessee. INVENTORIES Inventories include the fuel, lubricant, bulk and food supplies of the Group’s vessels, as well as goods for sale on the vessels. Inventories are valued at the lower of their acquisition cost or their net realisation value. Acquisition costs are determined using the FIFO (first in, first out) method. The net realisation value is the estimated sale price in ordinary business transactions, from which the cost of sale has been deducted. EQUITY Instruments issued by the Group, which do not contain contractual obligation to transfer cash or financial assets or to exchange financial assets or financial liabilities with other entities under potentially unfavourable terms, and which evidence a residual interest in the assets of the Group after deducting all of its liabilities, are classified as equity. The share capital consists of ordinary shares. Costs arising from issues or acquisitions of equity instruments are accounted for as a deduction from equity. If the Group reacquires its own equity instruments, those instruments are deducted from equity. INCOME TAXES Current tax expenses recognised on the profit and loss consist of income tax payable on taxable profit and of deferred taxes. Income tax on taxable profit for the reporting period is calculated using the valid tax rate of each country. Taxes are adjusted by possible taxes relating to previous periods. Deferred taxes are recognised in respect of temporary differences between the carrying amount of assets and liabilities for financial reporting purposes and the amounts used for taxation purposes. Deferred taxes are calculated using the tax rates valid at the end of the reporting period or rates enacted by the balance sheet date for the following financial year. Deferred tax assets are recognised to the extent that it is likely that future taxable profit will be available, against which the tax receivables can be used. In the Group, the most significant temporary differences relate to unused tax losses and depreciation of tangible fixed assets. No deferred taxes are recognised for subsidiaries’ undistributed earnings. Finnlines Plc entered into the Finnish tonnage tax system on 1 January 2013. In the tonnage tax system, the shipping operations shifted from taxation of business income to tonnage-based taxation. Finnlines Deutschland GmbH transferred from tonnage-based taxation to business taxation at the end of January 2014. EMPLOYEE BENEFITS Pension liabilities The Group has various pension plans in accordance with the local regulations of each country in which it operates. The Group’s pension plans are classified as defined contribution plans and defined benefit plans. The Group’s employee pension plans are mainly administered by external pension insurance companies. The Finnish TyEL

16 FINNLINES PLC Financial Statements 2016 (figures in EUR thousand, if not stated otherwise)
pension insurance administered by external pension insurance companies is treated as defined contribution plan. In defined contribution plans, the Company makes fixed payments into the plan. The Company has no legal or actual obligation to make additional payments if the pension insurance company is unable to pay out the benefits earned by employees in the current period or in previous periods. Payments made into defined contribution plans are recognised in the profit and loss in the reporting period to which the payment applies. In defined benefit plans, the employer’s pension liability is based on the present value of the obligation defined in the plan and on the fair value of the assets included in the plan, which are calculated using actuarial calculations determined in the IAS 19 standard. The Group’s obligations in relation to defined benefit plans are calculated separately for each plan using the projected unit credit method. Pension costs are recognised as expenses during each employee’s employment term on the basis of calculations made by authorised actuaries. In calculating the present value of a pension liability, the Group uses the market rate of return of high-quality debenture bonds issued by the companies or the interest rate of government debt obligations as the discount rate. The maturity of debenture bonds and debt obligations corresponds in all essential aspects to the maturity of the pension obligation being considered. The pension cost together with the net interest cost is recognised in personnel expenses in profit or loss. Remeasurements of the net defined liability (actuarial gains and losses together with the return on plan assets) are recognised in other comprehensive income as incurred. Past service costs are recognised in profit or loss at the period earliest: when the change or curtailment of the plan has been due or the Group has recognised the costs arising from reorganisation or benefits related to post employment. Share-based payments At the end of the reporting period, the Group had no share schemes in force.
PROVISIONS AND CONTINGENT LIABILITIES Provisions are recognised when the Company, as a consequence of previous events, has a legal or actual obligation whose monetary value can be reliably determined and whose realisation is probable. The amount recognised as provisions is equivalent to the best estimate of the expenses that will be incurred by fulfilling the obligations existing at the end of the reporting period. Contingent liability is a possible obligation that arises from past events and whose existence will be confirmed only by the occurrence or non-occurrence of one or more uncertain future events not wholly within the control of the Group. An existing obligation that probably does not require a settlement or the amount of which cannot be reliably measured is also a contingent liability. REVENUE RECOGNITION The Group’s revenue is mainly generated through sales of services which are principally port operations and transports of cargo and passengers. Revenue is recognised as the services are rendered in proportion to the stage of completion. Revenue is recognised at the fair value of the consideration received or receivable, adjusted by indirect taxes, revenue adjustments and exchange rate differences. Revenue from time chartered vessels is recognised based on chartered days. INTERESTS AND DIVIDENDS Interests are recorded using the effective interest method and the dividends when the right to receive dividend is established. SEGMENT REPORTING The Group presents segment reporting in accordance with IFRS 8 based on its internal reporting structure.

FINNLINES PLC Financial Statements 2016 (figures in EUR thousand, if not stated otherwise)
17
3. SEGMENT INFORMATION The Group’s segment reporting is based on two strategic business segments which provide different services requiring different resources and which are managed as separate businesses. The Group has two business segments: Shipping and Sea Transport Services, and Port Operations. The Group’s segment results and decisions concerning assets to be allocated to the segments are evaluated based on the segments’ results before interest and taxes. The Group management considers this to be the most appropriate indicator when comparing segment results against other companies in the industry. Segment results are used to evaluate performance and allocate resources by the Executive Committee in its role as Chief operating decision maker.
SHIPPING AND SEA TRANSPORT SERVICES Finnlines’ Shipping and Sea Transport Services segment includes Finnlines’ traffic in the Baltic Sea, the North Sea and the Bay of Biscay, as well as FinnLink, NordöLink and TransRussiaExpress traffic. PORT OPERATIONS During the reporting period, Finnlines engaged in port operations under the name Finnsteve in the ports of Helsinki and Turku in Finland. Finnsteve specialises in providing the following services to operators of regular unitised cargo traffic: stevedoring, terminal services, ship clearance, warehousing and container depot services.
Intra-group transfers and transactions are carried out using normal commercial conditions, equivalent to those used with external parties.
EUR 1,000 Shipping and Sea
Transport Services Port
Operations Eliminations Group Result per segment for reporting period ending 31 Dec 2016:
Total revenue from segment 453,587 38,352
491,939 Intra-group revenue -70 18,299 -18,228 -18,228 External revenue 453,657 20,053
473,711
Result before interest and taxes (EBIT) 82,791 -1,264
81,528
Financial items
-14,566 Income taxes
1,162
Result for reporting period
68,124 Result per segment for reporting period ending 31 Dec 2015:
Total revenue from segment 492,870 35,932 528,803 Intra-group revenue -150 17,785 -17,635 -17,635 External revenue 493,021 18,147 511,167
Result before interest and taxes (EBIT) 72,212 -1,929 70,284 Financial items -17,130 Income taxes 3,675 Result for reporting period 56,829

18 FINNLINES PLC Financial Statements 2016 (figures in EUR thousand, if not stated otherwise)
SEGMENT ASSETS, LIABILITIES AND CAPITAL EXPENDITURE FOR 2016 AND 2015
EUR 1,000 Shipping and Sea
Transport Services Port
Operations Eliminations Group Non-cash expenses in the profit and loss account
2016 Depreciation -55,156 -2,431
-57,587
Impairment losses in accounts receivable -78 -1
-79
2015 Depreciation -53,871 -2,719
-56,590
Impairment losses in accounts receivable -155 -48
-203
Assets, liabilities and capital expenditure by segment 2016 Segment assets 1,116,198 82,281 -385 1,198,093
Unallocated assets
7,326 Total assets
1,205,419
Segment liabilities 61,629 7,649 -385 68,892
Unallocated liabilities
548 426 Total liabilities
617 319
Capital expenditure 45,937 319
46,256
Assets, liabilities and capital expenditure by segment 2015 Segment assets 1,137,844 81,849 -965 1,218,727
Unallocated assets 12,398 Total assets 1,231,125
Segment liabilities 55,603 7,377 -542 62,438 Unallocated liabilities 607,324 Total liabilities 669,762
Capital expenditure 63,874 234 64,107
Segment assets mainly consist of tangible and intangible assets, inventories and receivables. They do not include tax or financial items (incl. cash and cash equivalents) or assets shared by the entire Group. Segment liabilities mainly consist of business-related liabilities such as accounts payable and other liabilities, accrued liabilities and received advances. They do not include taxes or loans.
Capital expenditure includes additions to tangible assets (Note 17. Property, Plant and Equipment) and to intangible assets (Note 18. Goodwill and Other Intangible Assets).
The assets of the Port Operations segment contain EUR 15.1 million classified as assets held for sale, including EUR 0.2 million debts.

FINNLINES PLC Financial Statements 2016 (figures in EUR thousand, if not stated otherwise)
19
INFORMATION ABOUT GEOGRAPHICAL AREAS The revenue from the geographical areas is reported according to the location of the customers. Assets are reported according to the geographical location of the Group. The revenue related to non-freight related passengers is shown for the country of departure. The Group’s vessels are also included in the reported assets even though they are by nature mobile and their location can be easily changed. EUR 1,000 2016 2015 Revenue
Finland 189,472 237,254 Sweden 79,664 84,630 Germany 70,557 59,141 Other EU countries 118,246 114,257 Russia 7,950 7,333 Other 7,822 8,554
473,711 511,167
Assets *
Finland 765,979 741,132 Sweden 333,299 340,194 Germany 9,505 41,037 Other EU countries -1,860 -222
1,106,923 1,122,141 * Non-current assets of the Group excluding financial instruments, deferred tax assets and post-employment benefit assets. The Group has no customers whose revenue would exceed 10 per cent of the Group total revenues. 4. JOINT OPERATIONS Finnlines offered liner shipping services under the brand TransRussiaExpress to Russian ports in the Baltic Sea area in co-operation with a Russian port and terminal service provider. Finnlines’ vessels were used in the liner traffic and Finnlines managed the liner services provided. Finnlines’ interest in the business was 75 per cent and the Russian terminal service provider held a 25 per cent interest. Finnlines combined 75 per cent of the income and expenses from the joint operations. The joint arrangement was terminated on 31 December 2016. Finnlines has a receivable of EUR 0.8 million from the terminal service provider relating to the joint operations. Finnlines has no other financial commitments on 31 December 2016. 5. NON-CURRENT ASSETS HELD FOR SALE Port Operations are negotiating a sale of port assets with the carrying value of around EUR 15.1 million. The assets related to Port Operations include liabilities of EUR 0.2 million. No impairment losses have been recognised on the carrying amount of the assets. 6. ACQUIRED NON-CONTROLLING INTERESTS No acquisitions were made in 2016 or in 2015. 7. REVENUE EUR 1,000 2016 2015 Revenue
Sale of goods 13,242 12,012 Rendering of services 454,604 495,668 Vessel hires 5,865 3,487
473,711 511,167
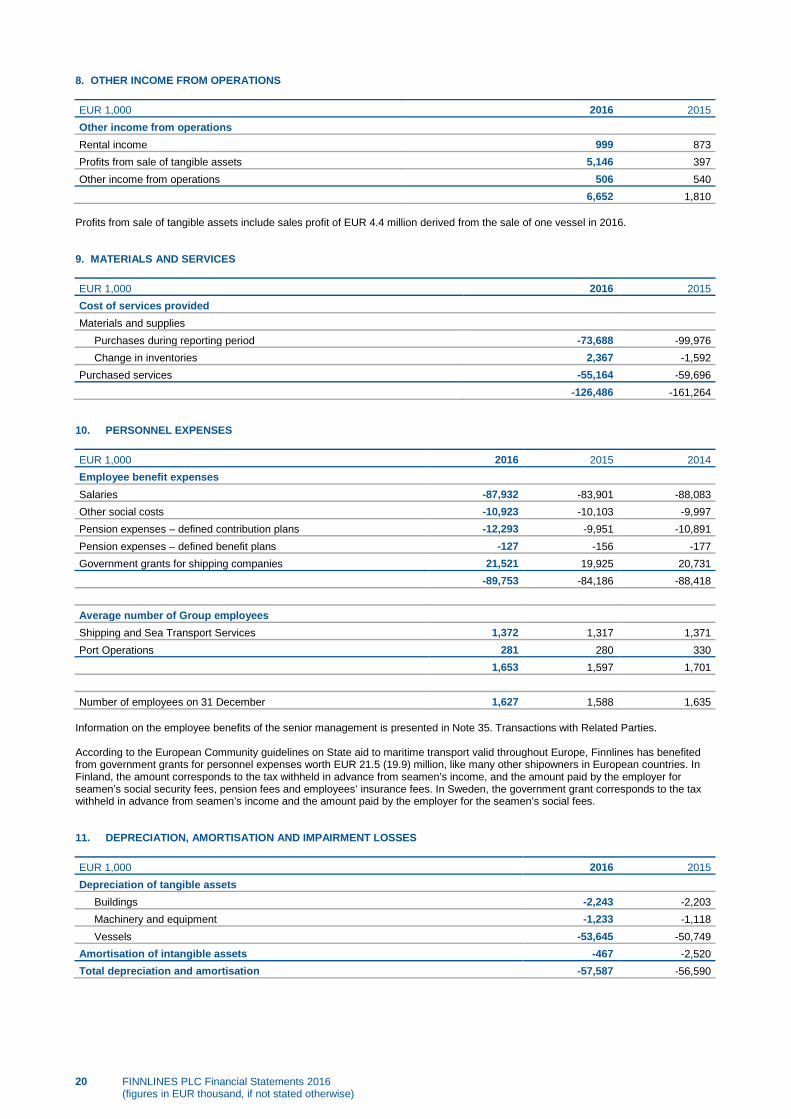
20 FINNLINES PLC Financial Statements 2016 (figures in EUR thousand, if not stated otherwise)
8. OTHER INCOME FROM OPERATIONS EUR 1,000 2016 2015 Other income from operations
Rental income 999 873 Profits from sale of tangible assets 5,146 397 Other income from operations 506 540 6,652 1,810
Profits from sale of tangible assets include sales profit of EUR 4.4 million derived from the sale of one vessel in 2016. 9. MATERIALS AND SERVICES EUR 1,000 2016 2015 Cost of services provided
Materials and supplies
Purchases during reporting period -73,688 -99,976 Change in inventories 2,367 -1,592
Purchased services -55,164 -59,696 -126,486 -161,264
10. PERSONNEL EXPENSES EUR 1,000 2016 2015 2014 Employee benefit expenses
Salaries -87,932 -83,901 -88,083 Other social costs -10,923 -10,103 -9,997 Pension expenses – defined contribution plans -12,293 -9,951 -10,891 Pension expenses – defined benefit plans -127 -156 -177 Government grants for shipping companies 21,521 19,925 20,731
-89,753 -84,186 -88,418
Average number of Group employees Shipping and Sea Transport Services 1,372 1,317 1,371
Port Operations 281 280 330
1,653 1,597 1,701
Number of employees on 31 December 1,627 1,588 1,635 Information on the employee benefits of the senior management is presented in Note 35. Transactions with Related Parties. According to the European Community guidelines on State aid to maritime transport valid throughout Europe, Finnlines has benefited from government grants for personnel expenses worth EUR 21.5 (19.9) million, like many other shipowners in European countries. In Finland, the amount corresponds to the tax withheld in advance from seamen’s income, and the amount paid by the employer for seamen’s social security fees, pension fees and employees’ insurance fees. In Sweden, the government grant corresponds to the tax withheld in advance from seamen’s income and the amount paid by the employer for the seamen’s social fees. 11. DEPRECIATION, AMORTISATION AND IMPAIRMENT LOSSES EUR 1,000 2016 2015 Depreciation of tangible assets
Buildings -2,243 -2,203 Machinery and equipment -1,233 -1,118 Vessels -53,645 -50,749
Amortisation of intangible assets -467 -2,520 Total depreciation and amortisation -57,587 -56,590

FINNLINES PLC Financial Statements 2016 (figures in EUR thousand, if not stated otherwise)
21
12. OTHER OPERATING EXPENSES EUR 1,000 2016 2015 Port expenses, equipment and other voyage related costs -49,345 -50,511 Leases -12,752 -28,449 Manning service costs and other non-obligatory personnel costs -1,782 -760 Vessel insurances, repairs and maintenance costs -33,484 -30,227 Catering costs -12,396 -11,696 IT costs -2,940 -2,369 Sales and marketing costs -3,684 -3,944 Real estate costs excluding rents and leases -3,024 -2,956 Other costs -5,603 -9,742
-125,009 -140,654
AUDITOR’S REMUNERATION The Group’s principal auditor was KPMG Oy Ab in 2016. EUR 1,000 2016 2015 Audit fees
KPMG 150 171 Other 21 26
Tax consultancy and other fees KPMG 58 115
Other 8 5
237 317
13. FINANCIAL INCOME AND EXPENSES EUR 1,000 2016 2015 Dividend income, available-for-sale assets 13 12 Interest income
Bank deposits 1 0 Loans and accounts receivable 83 154 Other receivables 61 455
Exchange rate gains Other exchange rate gains 251 311
Other financial income 4 1 Total financial income 412 934
Interest expenses Borrowings measured at amortised cost -11,072 -14,122
Other interest expenses -78 -3 Exchange rate losses
Other exchange rate losses -218 -208 Other financial expenses -3,611 -3,731
Total financial expenses -14,978 -18,064
Net financial expenses -14,566 -17,130 The Group’s financial income and expenses include exchange rate gains and losses, most of which are related to valuation of foreign currency accounts. The main part of the other financial expenses is composed of guarantee fees and other expenses related to borrowings.

22 FINNLINES PLC Financial Statements 2016 (figures in EUR thousand, if not stated otherwise)
14. INCOME TAXES EUR 1,000 2016 2015 Tax on taxable income of the reporting period -135 -221 Tax from previous periods 127 32 Change in deferred taxes 1,170 3,865 Income taxes in profit and loss, expense (-) 1,162 3,675
Reconciliation of differences between tax on the profit and loss and taxes calculated using Finnish tax rates EUR 1,000 2016 2015 Result before taxes 66,950 53,153
Tax calculated using Finnish tax rate -13,390 -10,631 Foreign subsidiaries’ differing tax rates * -372 -252 Tax-exempt income and non-deductible expenses -48 -13 Losses for which no deferred tax asset was recognised -25 -75 Impact of tonnage tax ** 14,870 14,614 Tax from previous periods 127 32 Change in deferred taxes of re-investment provision
Income taxes in profit and loss, expense (-) 1,162 3,675 * As of 1 January 2014, the applicable tax rate has been 20.0 per cent in Finland. ** The Finnish parent company Finnlines Plc entered into the Finnish tonnage taxation regime as from 1 January 2013. The adoption is binding at least until 31 December 2022. Current tax includes EUR 83 (92) thousand of tonnage tax to be paid in Finland. Income tax on other comprehensive income EUR 1,000 2016 2015 Remeasurement of defined benefit liability -29 -36
-29 -36
15. EARNINGS PER SHARE Earnings per share are calculated by dividing the result for the reporting period attributable to the parent company’s shareholders by the weighted average number of outstanding shares during the reporting period, minus the treasury shares purchased by the Company. EUR 1,000 2016 2015 Result for the reporting period attributable to parent company shareholders, EUR 1,000 68,133 56,841 Weighted average no. of shares, 1,000 51,503 51,503 Undiluted earnings per share, EUR/share 1.32 1.10
16. DIVIDENDS Finnlines paid EUR 41.3 million in dividend in 2016. The parent company Finnlines Plc’s result for the reporting period was EUR 56.0 million. The Board of Directors proposes to the General Meeting that the General Meeting authorise the Board of Directors to decide, at its discretion, on the payment of dividend up to Finnlines Plc’s result for the reporting period in 2016.

FINNLINES PLC Financial Statements 2016 (figures in EUR thousand, if not stated otherwise)
23
17. PROPERTY, PLANT AND EQUIPMENT
EUR 1,000 Land Buildings Vessels * Machinery and
equipment
Advance payments and
acquisitions under
construction * Total ** Reporting period ending 31 Dec 2016
Acquisition cost 1 Jan 2016 72 72,773 1,352,785 65,430 23,459 1,514,518 Exchange rate differences
8
-90
-82
Increases
361 36,536 2,091 7,031 46,018 Disposals ***
-22,781 -675
-23,456
Reclassifications between items
20,373
-20,373 0 Transfer to non-current assets held for sale ****
-4,369
-22,395
-26,763
Acquisition cost 31 Dec 2016 72 68,773 1,386,912 44,361 10,117 1,510,234
Accumulated depreciation and impairment losses 1 Jan 2016
-19,544 -439,791 -42,444
-501,779
Exchange rate differences
-7
83
76 Cumulative depreciation on reclassifications and disposals
18,903 671
19,575
Depreciation for the reporting period
-2,243 -53,645 -1,233
-57,120
Accumulated depreciation and impairment losses 31 Dec 2016
-21,793 -474,532 -42,923
-539,248
Transfer to non-current assets held for sale ****
1,132
10,510
11,642
Carrying value 31 Dec 2016 72 48,111 912,380 11,948 10,117 982,629
Assets classified as held for sale 31 Dec 2016
Acquisition cost Transfer to non-current assets
held for sale 1 Jan 2016
4,369
22,395
26,763 Reclassification between items
Accumulated depreciation Transfer to non-current assets
held for sale 1 Jan 2016
-1,132
-10,510
-11,642 Reclassification between items
Carrying value 31 Dec 2016
3,237
11,885
15,121 * During 2016, EUR 14,5 million environmental aid granted by the European Union was allocated to environmental investments in vessels. ** The carrying value of property, plant and equipment includes EUR 21.3 (22.3) million of capitalised borrowing costs during construction. *** Includes sale of one vessel. **** Finnlines is negotiating a sale of port operations’ assets with carrying value of EUR 15.1 million. No impairment losses were recognised on the carrying values of these assets in 2015 or 2016, as according to management’s estimate, the fair value of the assets classified as held for sale was higher than the carrying value at the balance sheet date 31 December 2015 and 31 December 2016. The Company’s management has reassessed and changed the economic depreciation and amortisation plan of four Kalmar STS container cranes in the Vuosaari Harbour from 25 to 35 years as of 1 January 2016.
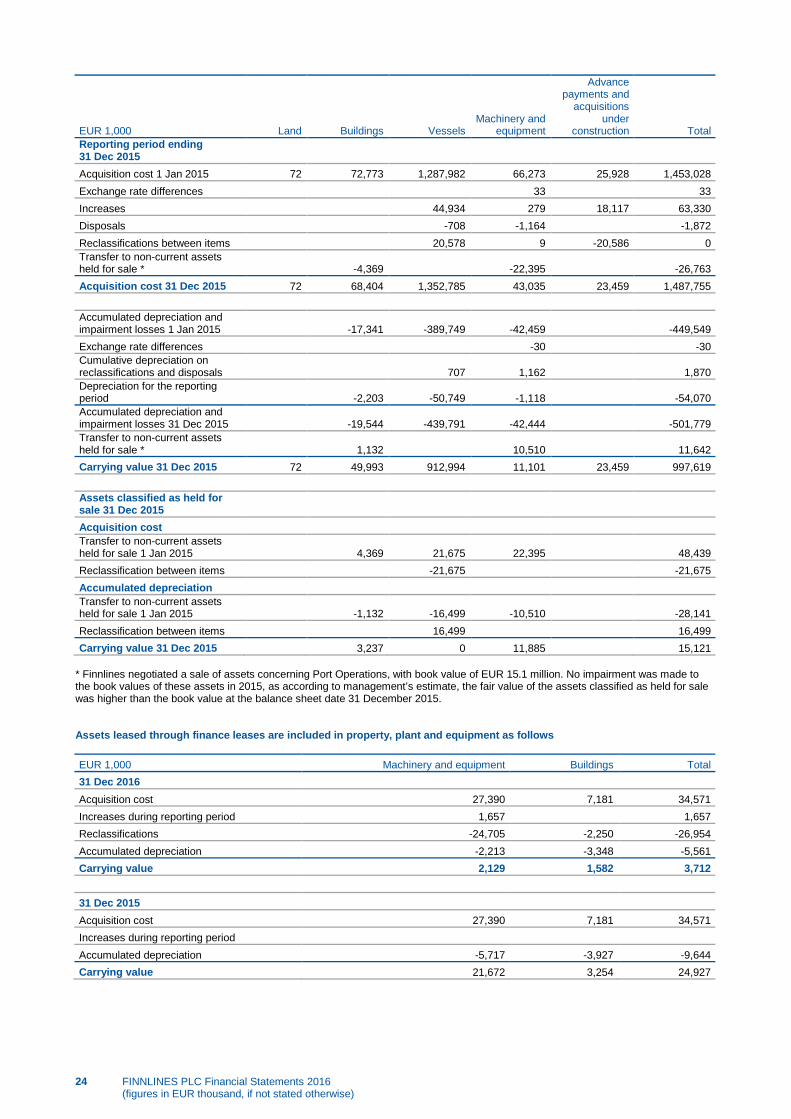
24 FINNLINES PLC Financial Statements 2016 (figures in EUR thousand, if not stated otherwise)
EUR 1,000 Land Buildings Vessels Machinery and
equipment
Advance payments and
acquisitions under
construction Total Reporting period ending 31 Dec 2015
Acquisition cost 1 Jan 2015 72 72,773 1,287,982 66,273 25,928 1,453,028 Exchange rate differences
33
33
Increases
44,934 279 18,117 63,330 Disposals
-708 -1,164
-1,872
Reclassifications between items
20,578 9 -20,586 0 Transfer to non-current assets held for sale *
-4,369
-22,395
-26,763
Acquisition cost 31 Dec 2015 72 68,404 1,352,785 43,035 23,459 1,487,755
Accumulated depreciation and impairment losses 1 Jan 2015
-17,341 -389,749 -42,459
-449,549
Exchange rate differences
-30
-30 Cumulative depreciation on reclassifications and disposals
707 1,162
1,870
Depreciation for the reporting period
-2,203 -50,749 -1,118
-54,070
Accumulated depreciation and impairment losses 31 Dec 2015
-19,544 -439,791 -42,444
-501,779
Transfer to non-current assets held for sale *
1,132
10,510
11,642
Carrying value 31 Dec 2015 72 49,993 912,994 11,101 23,459 997,619
Assets classified as held for sale 31 Dec 2015
Acquisition cost Transfer to non-current assets
held for sale 1 Jan 2015
4,369 21,675 22,395
48,439 Reclassification between items
-21,675
-21,675
Accumulated depreciation Transfer to non-current assets
held for sale 1 Jan 2015
-1,132 -16,499 -10,510
-28,141 Reclassification between items
16,499
16,499
Carrying value 31 Dec 2015
3,237 0 11,885
15,121 * Finnlines negotiated a sale of assets concerning Port Operations, with book value of EUR 15.1 million. No impairment was made to the book values of these assets in 2015, as according to management’s estimate, the fair value of the assets classified as held for sale was higher than the book value at the balance sheet date 31 December 2015. Assets leased through finance leases are included in property, plant and equipment as follows EUR 1,000 Machinery and equipment Buildings Total 31 Dec 2016
Acquisition cost 27,390 7,181 34,571 Increases during reporting period 1,657 1,657 Reclassifications -24,705 -2,250 -26,954 Accumulated depreciation -2,213 -3,348 -5,561 Carrying value 2,129 1,582 3,712
31 Dec 2015 Acquisition cost 27,390 7,181 34,571 Increases during reporting period
Accumulated depreciation -5,717 -3,927 -9,644 Carrying value 21,672 3,254 24,927

FINNLINES PLC Financial Statements 2016 (figures in EUR thousand, if not stated otherwise)
25
During the reporting year Finnlines terminated the financial leasing contracts of four Kalmar STS container cranes in Vuosaari harbour and the office building in Germany by paying the residual values to the leasing companies. The office building in Germany and two container cranes are continuing tangible assets and two container cranes are classified as held for sale at 31 December 2016. The early termination of financial lease contracts did not cause extra one-off costs. 18. GOODWILL AND OTHER INTANGIBLE ASSETS
EUR 1,000 Goodwill
Advance payments for intangible
assets Other intangible
assets * Total intangible
assets Reporting period ending 31 Dec 2016
Acquisition cost 1 Jan 2016 105,644 261 24,993 130,897 Increases
89 150 238
Disposals Reclassifications
-88 88 0 Acquisition costs 31 Dec 2016 105,644 261 25,232 131,136
Accumulated amortisation and impairment losses 1 Jan 2016
-21,496 -21,496
Cumulative amortisation on reclassifications and disposals
Depreciation for the reporting period
-467 -467 Accumulated amortisation and impairment losses 31 Dec 2016
-21,963 -21,963
Carrying value 31 Dec 2016 105,644 261 3,269 109,173 Reporting period ending 31 Dec 2015
Acquisition cost 1 Jan 2015 105,644 1,471 29,750 136,865 Increases
261 517 778
Disposals
-6,745 -6,745 Reclassifications
-1,471 1,471 0
Acquisition costs 31 Dec 2015 105,644 261 24,993 130,897
Accumulated amortisation and impairment losses 1 Jan 2015
-25,722 -25,722
Cumulative amortisation on reclassifications and disposals
6,745 6,745
Depreciation for the reporting period
-2,520 -2,520 Accumulated amortisation and impairment losses 31 Dec 2015
-21,496 -21,496
Carrying value 31 Dec 2015 105,644 261 3,497 109,401 * Other intangible assets consist mainly of capitalised ERP system implementation projects and ERP licences. The Company expects these systems and licences to generate economic benefits over a time span longer than the reporting period.

26 FINNLINES PLC Financial Statements 2016 (figures in EUR thousand, if not stated otherwise)
GOODWILL IMPAIRMENT TESTING For the purpose of impairment testing, goodwill is allocated to cash-generating units. The allocation principle has remained unchanged since 2015, although minor changes were made to the vessel set-up due to the fleet re-organisation during 2016. The goodwill related to Finland–Germany traffic is allocated to the HansaLink service, which is operated with a vessel system between Finland, Germany, and Poland. Goodwill related to the South Sweden–Germany traffic is allocated to the NordöLink service. EUR 1,000 2016 2015 Allocation of goodwill to the cash-generating units
NordöLink 68,972 68,972 HansaLink (incl. Finland–Germany–Poland traffic) 36,671 36,671 Total 105,644 105,644
NordöLink and HansaLink are included in the Shipping and Sea Transport Services segment. The current recoverable amount is determined based on their value in use. The cash flow forecasts for the tested units are based on the next year’s budget and the forecasts for the subsequent four years (five-year business plans) approved by the management. The projections of cash flow for the five-year period are based on the management’s experience and assumed future development of markets, and are in line with the external market forecasts. During 2016, minor alterations were made to the traffic patterns between Finland, Germany, and Poland. Three Star-class vessels continued to ply between Helsinki and Travemünde, and a ro-ro vessel was sailing on the direct route between Hanko and Rostock. As from January 2016, the direct route to Gdynia ran from Hanko instead of Helsinki. As from January 2017 the route between Hanko and Rostock is operated with two ro-ro vessels, thus increasing the amount of weekly sailings. NordöLink traffic continued with a large Star-class vessel and two smaller ro-pax vessels. Both of these services operate in one of the Emissions Control Areas, i.e. the Baltic Sea, where the sulphur content limits are stricter than globally. The sulphur limit for heavy fuel oil was reduced to 0.10 per cent in 2015 in accordance with the MARPOL Convention. Finnlines has invested in exhaust gas scrubbers to meet the new environmental regulations, and the effects of these investments on both the costs and sea freight rates have been taken into account in the tests. The main assumptions in the five-year business plans relate to market growth, market share, price level and development of passenger services. The market growth rates used are derived from recent external economic forecasts adjusted to the relevant market. The cash flows after the forecast period of five years are extrapolated using the growth factors listed below. The growth factors used do not exceed the actual long-term growth rate in the sector in question. The weighted average pre-tax cost of capital (WACC) is used as a discount rate. The components used to calculate the WACC are risk free interest rate, market risk premium, industry beta-coefficient, target capital structure and the cost of debt. The same common components to calculate the discount rates for all cash generating units are used, adjusted with the relevant tax rates. The usage of the same common components in discount rates is justified as the risks related to the different businesses are interlinked and relate to the general economic development in the Baltic Sea area. MAIN ASSUMPTIONS USED IN CALCULATING VALUE IN USE IN 2016 Cash-generating unit HansaLink NordöLink Discount rate (pre-tax) 4.6% 4.6% LTP period 2017–2021 2017–2021 Growth rate after LTP period 2.0% 2.0% The resulting share of terminal value of the calculated discounted cash flow 89.3% 87.7%
MAIN ASSUMPTIONS USED IN CALCULATING VALUE IN USE IN 2015 Cash-generating unit HansaLink NordöLink Discount rate (pre-tax) 4.9% 4.9% LTP period 2016–2020 2016–2020 Growth rate after LTP period 2.0% 2.0% The resulting share of terminal value of the calculated discounted cash flow 88.1% 86.6%
Based on the forecasts, the current recoverable amounts of the Finland–Germany–Poland service (HansaLink) and NordöLink clearly exceed the carrying value at the end of 2016. Sensitivity tests were conducted for all the key assumptions and parameters in the business plans and in the future extrapolation. The tested parameters were market growth, market share, price level development, passenger business contribution, discount rate and growth rate after a period of five years, which were tested based on their relevance in the cash generating unit. The management views that no reasonably possible change in any of the key parameters would lead to impairment as the recoverable amounts exceed the carrying amounts considerably. The goodwill of the Company is related to the lines and corresponding traffic flows, which can be handled with various vessel systems as the vessels are relatively easily movable assets. For both cash generating units, the assumption of infinite cash flow (the Gordon model) is applied. As the goodwill is not dependent of the system of certain vessels and their deterioration due to passage of time, the infinity assumption is a reasonable approach to measure the future cash flows. The shares of terminal values (cash flows after a five-year period) are listed above. When preparing cash flow forecasts, the Company also reviews the differences between the previous forecast and actual outcomes of the key variables.
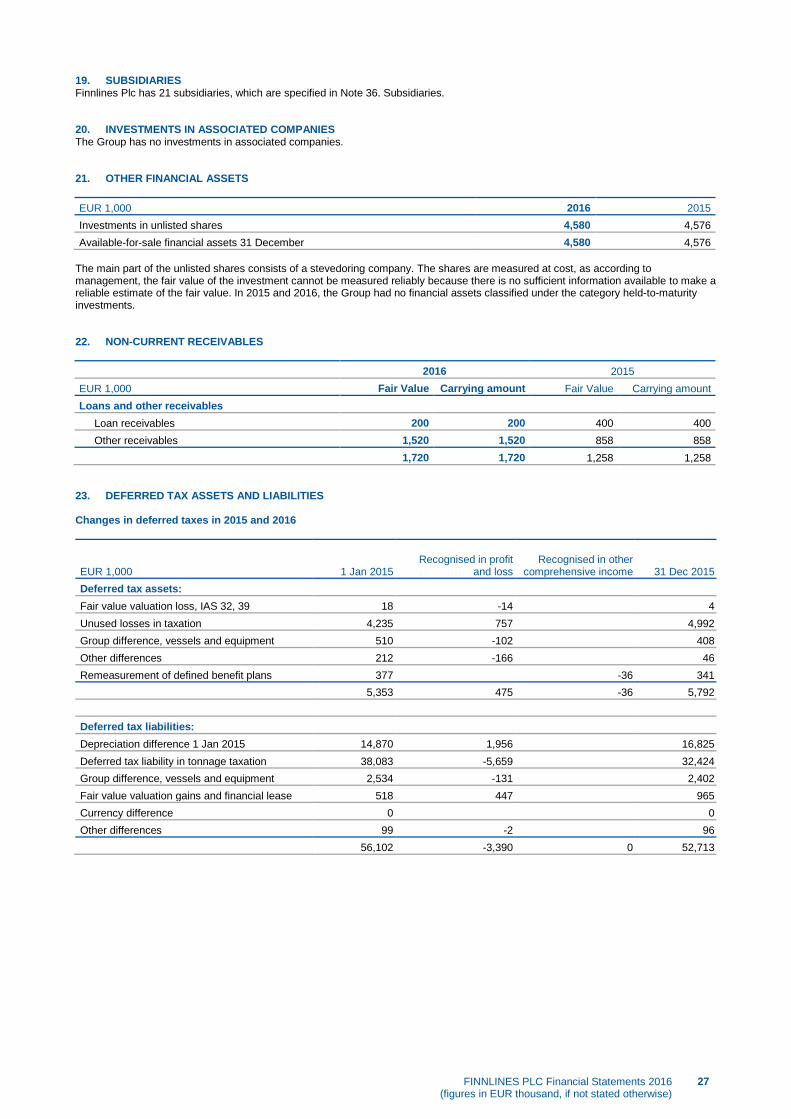
FINNLINES PLC Financial Statements 2016 (figures in EUR thousand, if not stated otherwise)
27
19. SUBSIDIARIES Finnlines Plc has 21 subsidiaries, which are specified in Note 36. Subsidiaries. 20. INVESTMENTS IN ASSOCIATED COMPANIES The Group has no investments in associated companies. 21. OTHER FINANCIAL ASSETS EUR 1,000 2016 2015 Investments in unlisted shares 4,580 4,576 Available-for-sale financial assets 31 December 4,580 4,576
The main part of the unlisted shares consists of a stevedoring company. The shares are measured at cost, as according to management, the fair value of the investment cannot be measured reliably because there is no sufficient information available to make a reliable estimate of the fair value. In 2015 and 2016, the Group had no financial assets classified under the category held-to-maturity investments. 22. NON-CURRENT RECEIVABLES
2016 2015
EUR 1,000 Fair Value Carrying amount Fair Value Carrying amount Loans and other receivables
Loan receivables 200 200 400 400 Other receivables 1,520 1,520 858 858
1,720 1,720 1,258 1,258
23. DEFERRED TAX ASSETS AND LIABILITIES Changes in deferred taxes in 2015 and 2016
EUR 1,000 1 Jan 2015 Recognised in profit
and loss Recognised in other
comprehensive income 31 Dec 2015 Deferred tax assets:
Fair value valuation loss, IAS 32, 39 18 -14
4 Unused losses in taxation 4,235 757
4,992
Group difference, vessels and equipment 510 -102
408 Other differences 212 -166
46
Remeasurement of defined benefit plans 377
-36 341 5,353 475 -36 5,792
Deferred tax liabilities: Depreciation difference 1 Jan 2015 14,870 1,956
16,825
Deferred tax liability in tonnage taxation 38,083 -5,659
32,424 Group difference, vessels and equipment 2,534 -131
2,402
Fair value valuation gains and financial lease 518 447
965 Currency difference 0
0
Other differences 99 -2
96 56,102 -3,390 0 52,713
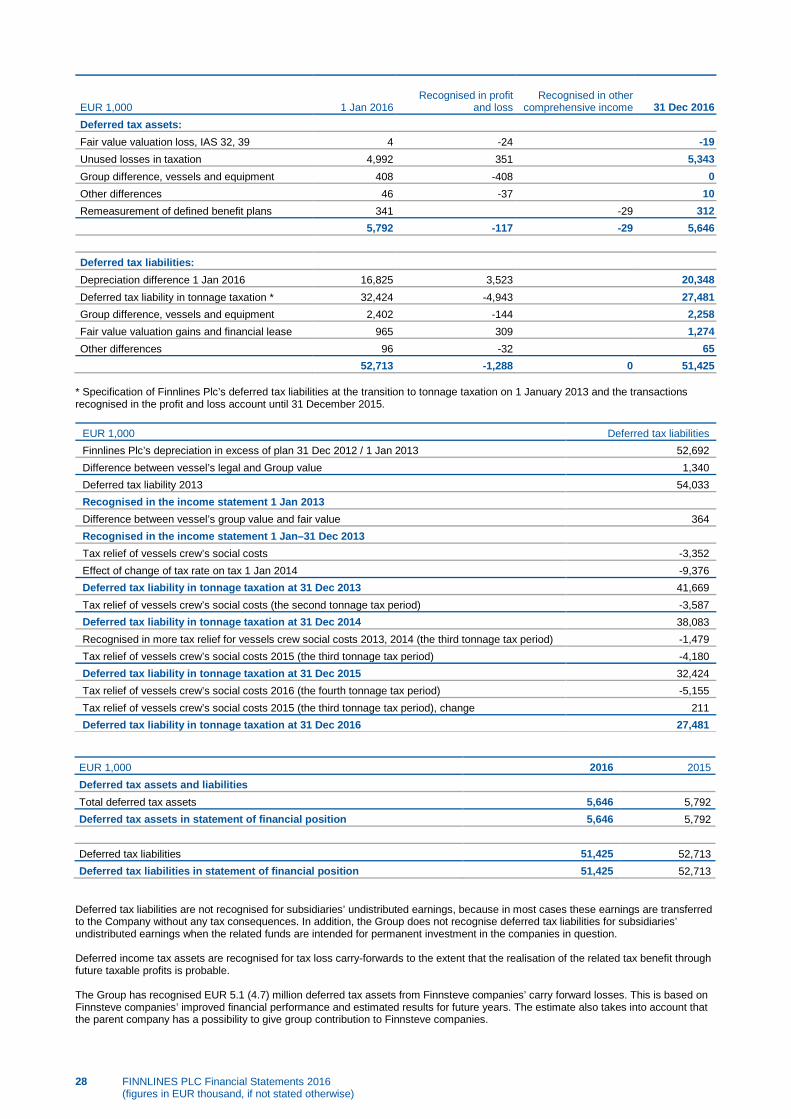
28 FINNLINES PLC Financial Statements 2016 (figures in EUR thousand, if not stated otherwise)
EUR 1,000 1 Jan 2016 Recognised in profit
and loss Recognised in other
comprehensive income 31 Dec 2016 Deferred tax assets:
Fair value valuation loss, IAS 32, 39 4 -24
-19 Unused losses in taxation 4,992 351
5,343
Group difference, vessels and equipment 408 -408
0 Other differences 46 -37
10
Remeasurement of defined benefit plans 341
-29 312 5,792 -117 -29 5,646
Deferred tax liabilities: Depreciation difference 1 Jan 2016 16,825 3,523
20,348
Deferred tax liability in tonnage taxation * 32,424 -4,943
27,481 Group difference, vessels and equipment 2,402 -144
2,258
Fair value valuation gains and financial lease 965 309
1,274 Other differences 96 -32
65
52,713 -1,288 0 51,425 * Specification of Finnlines Plc’s deferred tax liabilities at the transition to tonnage taxation on 1 January 2013 and the transactions recognised in the profit and loss account until 31 December 2015.
EUR 1,000 Deferred tax liabilities Finnlines Plc’s depreciation in excess of plan 31 Dec 2012 / 1 Jan 2013 52,692 Difference between vessel’s legal and Group value 1,340 Deferred tax liability 2013 54,033 Recognised in the income statement 1 Jan 2013 Difference between vessel’s group value and fair value 364 Recognised in the income statement 1 Jan–31 Dec 2013 Tax relief of vessels crew’s social costs -3,352 Effect of change of tax rate on tax 1 Jan 2014 -9,376 Deferred tax liability in tonnage taxation at 31 Dec 2013 41,669 Tax relief of vessels crew’s social costs (the second tonnage tax period) -3,587 Deferred tax liability in tonnage taxation at 31 Dec 2014 38,083 Recognised in more tax relief for vessels crew social costs 2013, 2014 (the third tonnage tax period) -1,479 Tax relief of vessels crew’s social costs 2015 (the third tonnage tax period) -4,180 Deferred tax liability in tonnage taxation at 31 Dec 2015 32,424 Tax relief of vessels crew’s social costs 2016 (the fourth tonnage tax period) -5,155 Tax relief of vessels crew’s social costs 2015 (the third tonnage tax period), change 211 Deferred tax liability in tonnage taxation at 31 Dec 2016 27,481
EUR 1,000 2016 2015 Deferred tax assets and liabilities
Total deferred tax assets 5,646 5,792 Deferred tax assets in statement of financial position 5,646 5,792
Deferred tax liabilities 51,425 52,713 Deferred tax liabilities in statement of financial position 51,425 52,713
Deferred tax liabilities are not recognised for subsidiaries’ undistributed earnings, because in most cases these earnings are transferred to the Company without any tax consequences. In addition, the Group does not recognise deferred tax liabilities for subsidiaries’ undistributed earnings when the related funds are intended for permanent investment in the companies in question. Deferred income tax assets are recognised for tax loss carry-forwards to the extent that the realisation of the related tax benefit through future taxable profits is probable. The Group has recognised EUR 5.1 (4.7) million deferred tax assets from Finnsteve companies’ carry forward losses. This is based on Finnsteve companies’ improved financial performance and estimated results for future years. The estimate also takes into account that the parent company has a possibility to give group contribution to Finnsteve companies.

FINNLINES PLC Financial Statements 2016 (figures in EUR thousand, if not stated otherwise)
29
The Group did not recognise deferred income tax assets of EUR 0.7 (0.5) million because, according to management’s view, utilisation of losses involves considerable uncertainty. The Group has recognised deferred tax assets for unutilised losses in taxation EUR 5.3 (5.0) million. The tax losses will expire in 2020–2024. 24. INVENTORIES EUR 1,000 2016 2015 Material and equipment 5,893 3,644 Inventory for resale 807 689 6,700 4,333
No write-downs of inventories were recognised during the reporting period. 25. CURRENT RECEIVABLES
2016 2015
EUR 1,000 Fair Value Carrying amount Fair Value Carrying amount Accounts receivable and other receivables
Loans and other receivables Accounts receivable 55,937 55,937 55,206 55,206
Accrued income and prepaid expenses 14,119 14,119 18,151 18,151 Other receivables 7,493 7,493 12,461 12,461 Loan receivables 200 200 200 200
77,749 77,749 86,019 86,019
The tables below show the analysis of accounts receivable by age and currency. Significant items of accrued receivables are specified in the following table. EUR 1,000 2016 2015 Significant items of accrued income and prepaid expenses
Government grants for shipping companies 9,247 8,788 Personnel costs 74 1,018 Port expenses, cargo handling and other voyage-related costs 1,379 1,550 Docking costs 1,426 600 Reimbursement of average repairs, vessels 1,005 1,547 Other accrued receivables 988 4,648 14,119 18,151
EUR 1,000 2016 Impaired
receivables Net 2016 Aging of accounts receivable 2016
Undue 46,147
46,147 Overdue
1–30 days 8,056
8,056 31–60 days 57 1 56 61–90 days 308 1 307 91–360 days 620 35 584 over 360 days 1,602 814 787
Total overdue 10,643 852 9,790 56,789 852 55,937

30 FINNLINES PLC Financial Statements 2016 (figures in EUR thousand, if not stated otherwise)
EUR 1,000 2015 Impaired
receivables Net 2015 Aging of accounts receivable 2015
Undue 45,068 1 45,067 Overdue
1–30 days 7,223 2 7,221 31–60 days 246
246
61–90 days 424 8 416 91–360 days 2,504 105 2,399 over 360 days 527 670 -143
Total overdue 10,924 785 10,139 55,992 786 55,206
EUR 1,000 2016 2015 Accounts receivable by currency
EUR 55,641 54,856 SEK 9 14 GBP 264 297 USD 18 32 DKK 5 6
55,937 55,206
The carrying values of accounts receivable and other receivables are reasonable estimates of their fair values. In 2016, the Group has recognised impairment losses of EUR -79 (-203) thousand in profit or loss. The maximum credit risk related to accounts receivable and other receivables is their carrying amount. 26. CASH AND CASH EQUIVALENTS EUR 1,000 2016 2015 Cash in hand and cash equivalent 1,943 6,468
1,943 6,468
The cash and cash equivalents item does not include any bank overdrafts to be paid on demand. 27. SHARE CAPITAL AND OTHER RESERVES
No. of shares outstanding (1,000)
Share capital EUR 1,000
31 Dec 2015 51,503 103,006 31 Dec 2016 51,503 103,006
Share Capital The share capital (ordinary shares) consists of shares in one series. Each share has a nominal value of EUR 2.00 and carries one vote in the Annual General Meeting. According to the Articles of Association, the maximum share capital was EUR 200 million on 31 December 2016 (the maximum share capital was EUR 200 million on 31 December 2015). All issued shares have been fully paid. The number of Finnlines Plc’s shares amounted to 51,503,141 shares and share capital to EUR 103,006,282. Share premium account
EUR 1,000 2016 2015 Share premium account 24,525 24,525
Share premium account generated under the former Finnish Companies’ Act.
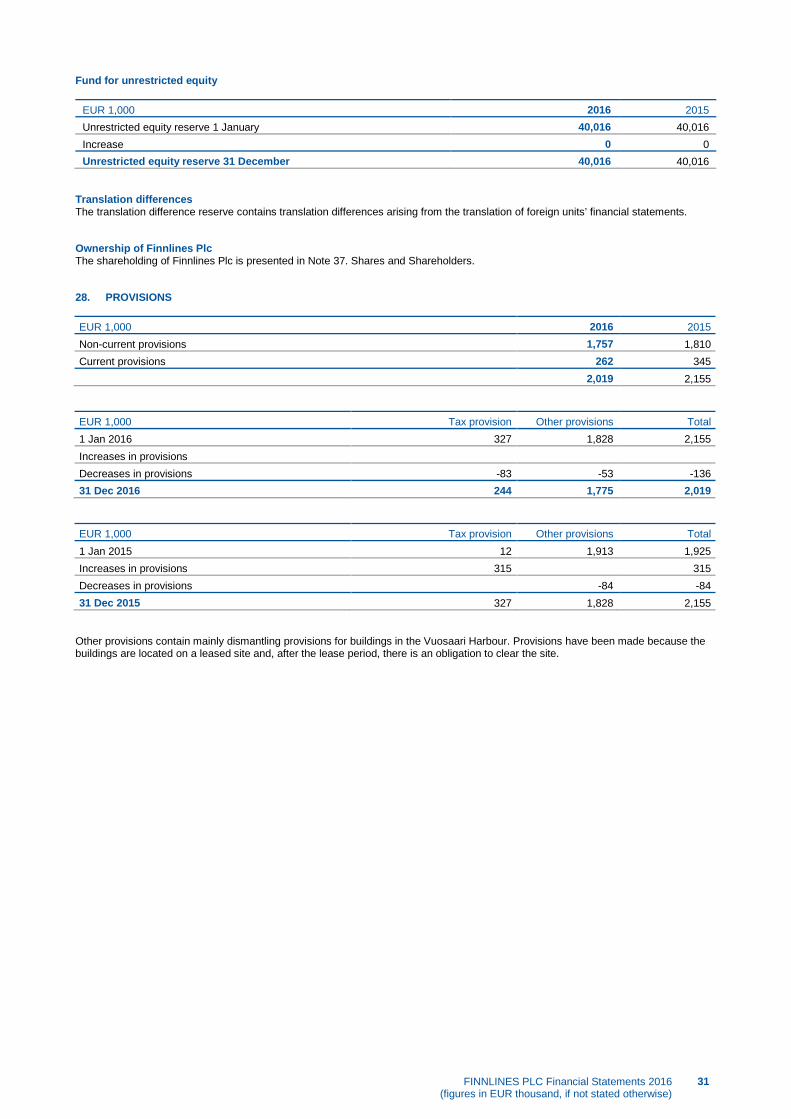
FINNLINES PLC Financial Statements 2016 (figures in EUR thousand, if not stated otherwise)
31
Fund for unrestricted equity
EUR 1,000 2016 2015 Unrestricted equity reserve 1 January 40,016 40,016 Increase 0 0 Unrestricted equity reserve 31 December 40,016 40,016
Translation differences The translation difference reserve contains translation differences arising from the translation of foreign units’ financial statements. Ownership of Finnlines Plc The shareholding of Finnlines Plc is presented in Note 37. Shares and Shareholders. 28. PROVISIONS EUR 1,000 2016 2015 Non-current provisions 1,757 1,810 Current provisions 262 345 2,019 2,155
EUR 1,000 Tax provision Other provisions Total 1 Jan 2016 327 1,828 2,155 Increases in provisions
Decreases in provisions -83 -53 -136 31 Dec 2016 244 1,775 2,019
EUR 1,000 Tax provision Other provisions Total 1 Jan 2015 12 1,913 1,925 Increases in provisions 315
315
Decreases in provisions
-84 -84 31 Dec 2015 327 1,828 2,155
Other provisions contain mainly dismantling provisions for buildings in the Vuosaari Harbour. Provisions have been made because the buildings are located on a leased site and, after the lease period, there is an obligation to clear the site.

32 FINNLINES PLC Financial Statements 2016 (figures in EUR thousand, if not stated otherwise)
29. INTEREST-BEARING LIABILITIES
2016 2015
EUR 1,000 Fair Value Carrying amount Fair Value Carrying amount Non-current liabilities measured at amortised cost
Loans from financial institutions 303,656 300,295 346,457 339,647 Bank overdraft facilities
Re-borrowing of pension funds' 20,040 19,899 18,369 18,153 Finance lease liabilities 2,407 2,407 16,049 16,049
326,102 322,600 380,875 373,849
Current liabilities measured at amortised cost Loans from financial institutions 67,509 67,509 75,509 75,509
Bank overdraft facilities 1,420 1,420 Re-borrowing of pension funds' 8,255 8,255 8,327 8,327
Finance lease liabilities 1,315 1,315 1,874 1,874 Commercial paper programme 93,713 93,713 92,098 92,098 Financial liabilities 172,211 172,211 177,807 177,807
Loans from financial institutions 498,313 494,812 558,682 551,657 The carrying amounts of interest-bearing loans from financial institutions and pension loans have been calculated using the effective interest rate method and the fair values have been determined by discounting future cash flows of loans at the interest rate at which the Group would obtain a similar loan from external parties at the end of reporting period. The total interest comprises risk-free interest of -0.2–0.7 per cent (0.0–0.9 per cent) and a company-specific risk premium. The effective interest rate of finance lease liabilities is assumed to correspond to the valid interest rate of similar contracts to be made at the end of the reporting period. In practice, fair values of loans do not materially differ from carrying amounts. FAIR VALUE HIERARCHY OF FINANCIAL INSTRUMENTS Level 1 - Quoted prices (unadjusted) in active markets for identical assets or liabilities. Level 2 - Inputs other than quoted prices included within Level 1 that are observable for the asset or liability, either directly (i.e., as prices) or indirectly (i.e., derived from prices). The Group has loans from financial institutions and pension loans, which are presented in the table above, Note 29. Interest-bearing liabilities. Level 3 - Inputs for the asset or liability that are not based on observable market data (unobservable inputs). Level 3 includes unlisted shares amounting to EUR 4.6 million (4.6 in 2015), which are valued at the lower of acquisition cost or probable value, as their fair value cannot be reliably measured. EUR 1,000 2016 2015 Maturity of long-term financial liabilities (not including finance lease liabilities)
Within 12 months 77,183 83,835 1‒5 years 256,770 294,162 After five years 64,552 64,923 398,505 442,921
2016 2015
Weighted average interest rates of the financial debts Loans from financial institutions 2.04% 2.53%
Bank overdraft facilities 2.50% 0.00% Commercial paper programme 0.77% 0.89% Re-borrowing of pension funds' 1.25% 1.88% Finance lease liabilities 4.67% 3.66%

FINNLINES PLC Financial Statements 2016 (figures in EUR thousand, if not stated otherwise)
33
EUR 1,000 Within 1 year 1‒5 years Total Floating rate financial liabilities, timing of re-pricing 31 Dec 2016
Financial liabilities Loans from financial institutions 264,846
264,846
Bank overdraft facilities 1,420
1,420 Re-borrowing of pension funds' 18,700
18,700
Finance lease liabilities 1,252
1,252
286,217 0 286,217
EUR 1,000 Within 1 year 1‒5 years Total Floating rate financial liabilities, timing of re-pricing 31 Dec 2015
Financial liabilities Loans from financial institutions 282,077
282,077
Bank overdraft facilities 0
0 Re-borrowing of pension funds' 11,100
11,100
Finance lease liabilities 15,116
15,116
308,293 0 308,293
All of the Group’s financial liabilities were in EUR on 31 December 2016 and on 31 December 2015. Financial liabilities include secured liabilities. The pledge value of the related pledged assets is EUR 940 (973) million. This is detailed in Note 34. Contingencies and Commitments. Finance lease liabilities EUR 1,000 2016 2015 Finance lease liabilities future minimum lease payments due
Within 12 months 1,454 2,554 1‒5 years 2,143 15,385 After five years 533 1,979
4,130 19,918
Future interest expenses from finance lease agreements 409 1,995
Finance lease liabilities current value of minimum lease payments Within 12 months 1,526 2,030
1‒5 years 1,806 14,529 After five years 391 1,364
3,722 17,923
During the reporting year Finnlines terminated the financial leasing contracts of four Kalmar STS container cranes in Vuosaari harbour and the office building in Germany by paying the residual values to the leasing companies. The office building in Germany and two container cranes are continuing tangible assets and two container cranes are classified as held for sale at 31 December 2016. The early termination of financial lease contracts did not cause extra one-off costs.

34 FINNLINES PLC Financial Statements 2016 (figures in EUR thousand, if not stated otherwise)
30. ACCOUNTS PAYABLE AND OTHER LIABILITIES
2016 2015
EUR 1,000 Fair Value Carrying amount Fair Value Carrying amount Liabilities, non-current
Other non-current accrued liabilities 63 63 113 113 Other non-current liabilities
63 63 113 113
2016 2015
EUR 1,000 Fair Value Carrying amount Fair Value Carrying amount Accounts payable and other liabilities
Liabilities measured at cost Accounts payable 15,580 15,580 18,003 18,003
Accrued personnel costs 11,844 11,844 11,447 11,447 Accrued interest 1,937 1,937 2,613 2,613 Other accrued expenses and deferred income 17,985 17,985 11,786 11,786 Other liabilities 15,138 15,138 13,563 13,563 Current advances received 2,690 2,690 1,779 1,779
65,174 65,174 59,191 59,191 The carrying value of accounts payable and other liabilities is the reasonable estimate of their fair values. The tables below show the significant items in accrued liabilities and the distribution of accounts payable by currency. EUR 1,000 2016 2015 Significant items in accrued expenses and deferred income
Discounts given 7,160 5,615 Bunker costs 2,288 697 Cargo handling costs 2,502 1,376 Port expenses and voyage-related costs 2,336 1,684 Repairs, vessels 883 507 Other accrued liabilities 2,816 1,907 17,985 11,786
EUR 1,000 2016 2015 Distribution of accounts payable by currency EUR 12,183 14,581 SEK 752 1,304 USD 1,987 1,546 GBP 417 490 NOK 36 2 DKK 204 68 CHF 0 8 PLN 0 3
15,580 18,003
31. ADJUSTMENTS TO CASH FLOW FROM OPERATIONS EUR 1,000 2016 2015 Non-cash transactions
Depreciation 57,607 56,590 Profits/losses from the sale of assets -5,146 -397
52,461 56,192
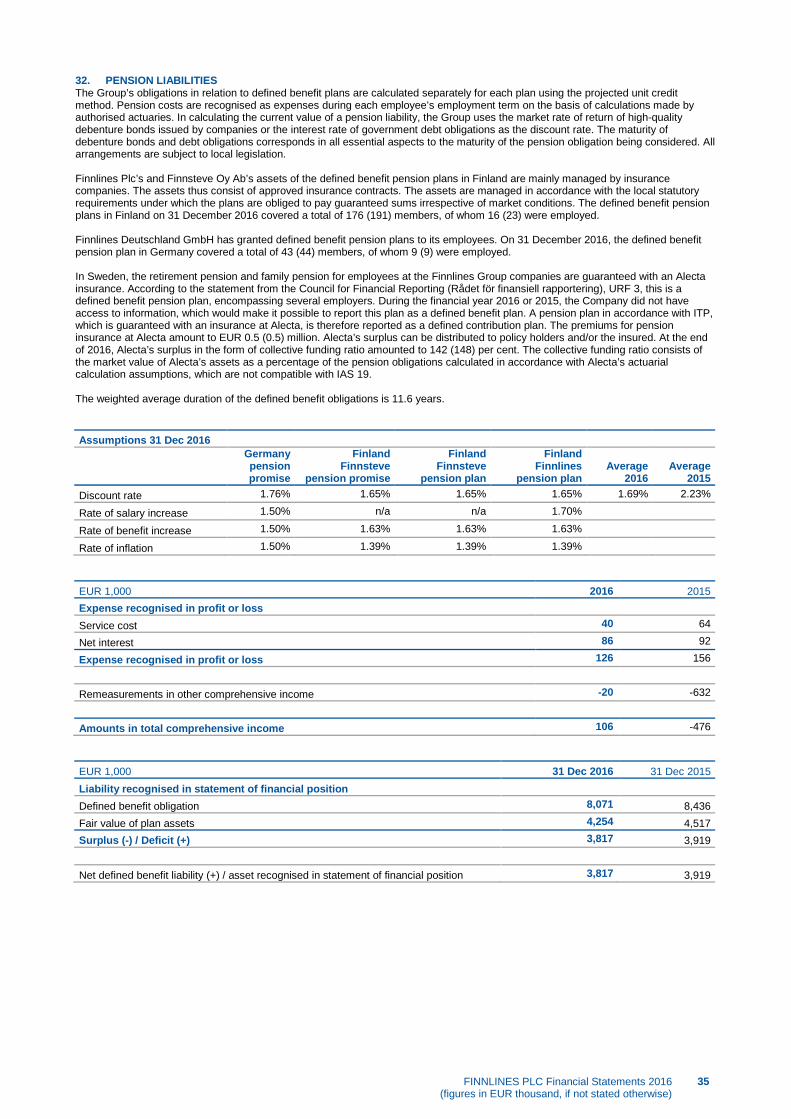
FINNLINES PLC Financial Statements 2016 (figures in EUR thousand, if not stated otherwise)
35
32. PENSION LIABILITIES The Group’s obligations in relation to defined benefit plans are calculated separately for each plan using the projected unit credit method. Pension costs are recognised as expenses during each employee’s employment term on the basis of calculations made by authorised actuaries. In calculating the current value of a pension liability, the Group uses the market rate of return of high-quality debenture bonds issued by companies or the interest rate of government debt obligations as the discount rate. The maturity of debenture bonds and debt obligations corresponds in all essential aspects to the maturity of the pension obligation being considered. All arrangements are subject to local legislation. Finnlines Plc’s and Finnsteve Oy Ab’s assets of the defined benefit pension plans in Finland are mainly managed by insurance companies. The assets thus consist of approved insurance contracts. The assets are managed in accordance with the local statutory requirements under which the plans are obliged to pay guaranteed sums irrespective of market conditions. The defined benefit pension plans in Finland on 31 December 2016 covered a total of 176 (191) members, of whom 16 (23) were employed. Finnlines Deutschland GmbH has granted defined benefit pension plans to its employees. On 31 December 2016, the defined benefit pension plan in Germany covered a total of 43 (44) members, of whom 9 (9) were employed. In Sweden, the retirement pension and family pension for employees at the Finnlines Group companies are guaranteed with an Alecta insurance. According to the statement from the Council for Financial Reporting (Rådet för finansiell rapportering), URF 3, this is a defined benefit pension plan, encompassing several employers. During the financial year 2016 or 2015, the Company did not have access to information, which would make it possible to report this plan as a defined benefit plan. A pension plan in accordance with ITP, which is guaranteed with an insurance at Alecta, is therefore reported as a defined contribution plan. The premiums for pension insurance at Alecta amount to EUR 0.5 (0.5) million. Alecta’s surplus can be distributed to policy holders and/or the insured. At the end of 2016, Alecta’s surplus in the form of collective funding ratio amounted to 142 (148) per cent. The collective funding ratio consists of the market value of Alecta’s assets as a percentage of the pension obligations calculated in accordance with Alecta’s actuarial calculation assumptions, which are not compatible with IAS 19. The weighted average duration of the defined benefit obligations is 11.6 years. Assumptions 31 Dec 2016
Germany pension promise
Finland Finnsteve
pension promise
Finland Finnsteve
pension plan
Finland Finnlines
pension plan Average
2016 Average
2015 Discount rate 1.76% 1.65% 1.65% 1.65% 1.69% 2.23%
Rate of salary increase 1.50% n/a n/a 1.70% Rate of benefit increase 1.50% 1.63% 1.63% 1.63% Rate of inflation 1.50% 1.39% 1.39% 1.39%
EUR 1,000 2016 2015 Expense recognised in profit or loss
Service cost 40 64
Net interest 86 92
Expense recognised in profit or loss 126 156
Remeasurements in other comprehensive income -20 -632
Amounts in total comprehensive income 106 -476 EUR 1,000 31 Dec 2016 31 Dec 2015 Liability recognised in statement of financial position
Defined benefit obligation 8,071 8,436 Fair value of plan assets 4,254 4,517 Surplus (-) / Deficit (+) 3,817 3,919
Net defined benefit liability (+) / asset recognised in statement of financial position 3,817 3,919

36 FINNLINES PLC Financial Statements 2016 (figures in EUR thousand, if not stated otherwise)
EUR 1,000 31 Dec 2016 31 Dec 2015 Changes in net defined benefit liability during the period
Net defined benefit liability recognised in statement of financial position at beginning of period 3,919 4,705 Contributions during the period -208 -310 Expense during the period 126 156 Remeasurements recognised in other comprehensive income -20 -632 Net defined benefit liability recognised in statement of financial position at the end of period 3,817 3,919
EUR 1,000 2016 2015 Remeasurements components in other comprehensive income
Actuarial gains (-) / losses (+) on defined benefit obligation arising from changes in demographic assumptions 0 -633 Actuarial gains (-) / losses (+) on defined benefit obligation arising from changes in financial assumptions 277 -711 Actuarial gains (-) / losses (+) on defined benefit obligation arising from experience adjustments -290 -134 Actuarial gains (-) / losses (+) on plan assets and return on plan assets excluding interest income -7 846 Remeasurement in other comprehensive income -20 -632
EUR 1,000 2016 2015 Change in defined benefit obligation
Opening defined benefit obligation 8,436 10,210 Current service cost 40 64 Interest expense 182 184 Actuarial gains (-) / losses (+) on obligation -13 -1,478 Benefits paid -574 -544 Defined benefit obligation at the end of the period 8,071 8,436
EUR 1,000 2016 2015 Change in the fair value of plan assets
Opening fair value of plan assets 4,517 5,505 Interest income 96 92 Gain on plan assets excl. item included in net interest 7 -846 Employer contributions 208 310 Benefits paid -574 -544 Fair value of plan assets at the end of the period 4,254 4,517

FINNLINES PLC Financial Statements 2016 (figures in EUR thousand, if not stated otherwise)
37
31 Dec 2016
EUR 1,000
Germany pension promise
Finland Finnsteve
pension promise
Finland Finnsteve
pension plan
Finland Finnlines
pension plan Total Sensitivity analysis on net defined benefit liability Discount rate change +0.5% Defined benefit obligation 2,595 360 300 4,430 7,685 Fair value of plan assets 0 0 300 3,755 4,055 Net Liability 2,595 360 0 675 3,630 Change in EUR -129 -15 1 -44 -187 Change in % -4.74% -4.00% -100.00% -6.12% -4.90%
Discount rate change -0.5% Defined benefit obligation 2,865 392 338 4,922 8,517 Fair value of plan assets 0 0 337 4,135 4,472 Net Liability 2,865 392 1 787 4,045 Change in EUR 140 17 2 68 227 Change in % 5.15% 4.53% -200.00% 9.46% 5.95%
Benefit increase rate change +0.5% Defined benefit obligation 2,862 391 338 4,875 8,466 Fair value of plan assets 0 0 318 3,936 4,254 Net Liability 2,862 391 20 939 4,212 Change in EUR 137 16 21 220 394 Change in % 5.05% 4.27% -2,100.00% 30.60% 10.33%
Benefit increase rate change -0.5% Defined benefit obligation 2,597 360 301 4,452 7,710 Fair value of plan assets 0 0 318 3,936 4,254 Net Liability 2,597 360 -17 516 3,456 Change in EUR -128 -15 -16 -203 -362 Change in % -4.69% -4.00% 1,600.00% -28.23% -9.48%
The Group estimates the costs for the defined benefit plans valid on 31 December 2016 at EUR 0.1 million in 2017.

38 FINNLINES PLC Financial Statements 2016 (figures in EUR thousand, if not stated otherwise)
31 Dec 2015
1,000 EUR
Germany pension promise
Finland Finnsteve
pension promise
Finland Finnsteve
pension plan
Finland Finnlines
pension plan Total Sensitivity analysis on net defined benefit liability
Discount rate change +0.5%
Defined benefit obligation 2,791 363 301 4,546 8,001
Fair value of plan assets 0 0 317 3,979 4,296 Net Liability 2,791 363 -16 567 3,705 Change in EUR -149 -15 0 -50 -214 Change in % -5.07% -3.97% 0.00% -8.10% -5.46%
Discount rate change -0.5%
Defined benefit obligation 3,103 395 338 5,077 8,913
Fair value of plan assets 0 0 355 4,403 4,758 Net Liability 3,103 395 -17 674 4,155 Change in EUR 162 17 -1 57 235 Change in % 5.53% 4.50% 6.25% 9.24% 6.01%
Benefit increase rate change +0.5%
Defined benefit obligation 3,099 395 338 5,051 8,883
Fair value of plan assets 0 0 335 4,182 4,517 Net Liability 3,099 395 3 869 4,366 Change in EUR 159 17 19 252 447 Change in % 5.39% 4.50% -118.75% 40.84% 11.39%
Benefit increase rate change -0.5%
Defined benefit obligation 2,793 362 301 4,566 8,022
Fair value of plan assets 0 0 335 4,182 4,517 Net Liability 2,793 362 -34 384 3,505 Change in EUR -147 -16 -18 -233 -414 Change in % -4.99% -4.23% 112.50% -37.76% -10.56%

FINNLINES PLC Financial Statements 2016 (figures in EUR thousand, if not stated otherwise)
39
33. FINANCIAL RISK MANAGEMENT The management of financial risks aims to reduce the volatility in earnings, the statement of financial position and cash flow, while securing effective and competitive financing for the Group. The main financial risks are currency risk, interest rate risk, credit risk, liquidity risk, funding risk and fuel price risk. For risk management the Group may use currency forwards, currency loans, interest rate swaps and fuel price clauses included in customer contracts. The Group’s risk management principles are approved by the Board of Directors, and the responsibility for their implementation lies with the Group Finance, with the exception of the fuel price clauses, which are the responsibility of the business units. The Group has no derivative instruments. CURRENCY RISK The Group operates internationally and is therefore exposed to transaction risks through different currency positions. The main foreign currencies used by the Group are USD and SEK. Currency risks arise from commercial transactions, monetary items in the statement of financial position and net investments in foreign subsidiaries. Transaction risk In 2016, over 90 per cent of sales were invoiced in EUR, and the rest in SEK, DKK, PLN, USD and GBP. Bunker purchases are made in USD. Other purchases are mainly paid in EUR. Bunker price clauses included in customer contracts cover to a large extent this USD risk. Currency positions are reviewed on a net basis for each currency every 12 months in connection with annual budgeting. The Group’s business units may make internal derivative contracts with the Group Finance to hedge a specific activity. In such cases too, the Group Finance decides, according to the principles approved by the Board of Directors, on any hedging to be made with an external counterpart based on the whole Group’s net currency position. All of the Group’s interest-bearing liabilities at the end of the reporting period were in EUR. The Group had no outstanding hedging instruments in 2016 or 2015. Translation risk The Group has net investments abroad and is thus exposed to risks which arise when investments in GBP, DKK and PLN are converted into the parent company’s functional currency. The Group’s principle is to hedge significant net investments made in foreign subsidiaries through foreign currency loans. In 2016 and 2015, the Group had no such significant investments in foreign currencies. The tables below show the translation position at the end of 2016 and 2015. EUR 1,000 Investment Group translation exposure 2016
GBP 396 DKK 51 PLN 60 507
EUR 1,000 Investment Group translation exposure 2015
GBP 466 DKK 180 PLN 80 726
Sensitivity to exchange rate fluctuations The following table describes the Group’s sensitivity to changes in the EUR/USD exchange rate. The impacts of exchange rate changes of other currencies are not significant. Assumptions in estimating sensitivity: • The variation in the EUR/USD exchange rate is assumed to be +/-10 per cent. • The position, 31 December, includes USD-denominated cash equivalents, accounts receivable and accounts payable.
EUR 1,000 Change in
Profit & Loss Change in Equity Sensitivity at closing date 2016, change in USD, weakening/strengthening 10% against EUR +171/-209 +0/-0 Sensitivity at closing date 2015, change in USD, weakening / strengthening 10% against EUR +135/-165 +0/-0
Change before tax effect.

40 FINNLINES PLC Financial Statements 2016 (figures in EUR thousand, if not stated otherwise)
INTEREST RATE RISK Interest-bearing debt exposes the Group to interest risk, i.e. re-pricing and price risk caused by interest rate movements. Management of interest rate risk is centralised to the Group Finance. The objective of the interest rate risk management is to reduce interest rate fluctuation impact on the results in different accounting periods, enabling a more stable net income. The Group may manage interest rate risk by selection of debt interest periods and by using interest rate forwards and interest rate swaps. The level of hedging against interest rate risks and the duration of the debt portfolio are reviewed annually by the Board of Directors when making the budget. At the balance sheet date, 60 per cent of the Group’s borrowings were floating-rate and the rest were fixed-rate borrowings (including loans from financial institutions, pension loans and commercial papers). The duration (average interest rate period) of the debt portfolio was approximately 11 months. At the balance sheet date, the Group had no open interest rate swaps. Table in Note 29. Interest-bearing liabilities, shows the dates of interest rate changes of the Group’s variable-rate liabilities and the effective interest rates of liabilities. The following table shows the Group’s sensitivity to variations in market interest rates. The following assumptions were made when calculating the sensitivity:
• The interest rate change is assumed to be +/-0.50 percentage points from the interest rate of individual instruments at the end of
the reporting period. • The analysis includes the instruments with an interest adjustment date within the following 12 months. • The position includes variable-rate loans from financial institutions and commercial papers. • The position excludes finance lease obligations and instalment debts, because the change in finance costs caused by the interest
rate change is not relevant to these. • When calculating the sensitivity, it is assumed that the variable-rate debt portfolio remains unchanged for the whole year (no
instalments, no new debt) and that the interest rate changes as stated above on the next interest change date of the debt instrument.
• It is assumed that if a variable-rate instrument is fully amortised within the next 12 months, this instrument would be reacquired if the above mentioned interest rate is quoted.
EUR 1,000 Change in profit & loss Sensitivity at closing date 2016, change in interest rates, increasing / decreasing 0.5% from valid rate of the instrument at 31 Dec 2016
Debt portfolio -1,501 / +1,501 -1,501 / +1,501
Change before tax effect. EUR 1,000 Change in profit & loss Sensitivity at closing date 2015, change in interest rates, increasing / decreasing 0.5% from valid rate of the instrument at 31 Dec 2015
Debt portfolio -1,549/+1,549 -1,549/+1,549
Change before tax effect. The Group has no significant interest-bearing assets, and therefore the Group’s result for the reporting period, generated from the assets and cash flows, is not substantially exposed to fluctuations in market interest rates. CREDIT RISK The Group is exposed to credit risk from its commercial receivables. The Group policy sets out the credit rating requirements and investment principles related to customers, investment transactions and derivative contract counterparts. The Group has no significant concentrations of credit risk, since it has a broad clientele distributed across various sectors. The Group makes derivative contracts and investment transactions only with counterparts with high credit ratings. The credit ratings and credit limits of credit customers are constantly monitored. Credit losses in the reporting period 2016 were on a low level (0.02 per cent of revenue). Note 25. Current Receivables, shows the analysis of accounts receivable by age. LIQUIDITY RISK The Group continuously strives to evaluate and monitor the amount of financing required for its operations to ensure that it will have sufficient liquid assets to finance its business activities and investments, and to repay loans. The Group seeks to finance vessel investments with credit agreements with the longest possible terms. The Group aims to guarantee the availability and flexibility of financing with unutilised credit facilities and by employing several banks and methods for funding. On 31 December 2016, the granted but unused credit facilities totalled EUR 128.6 (108.0) million. Loans include normal equity ratio related covenants. The cash-flows in the tables below include both repayments and expected interests.
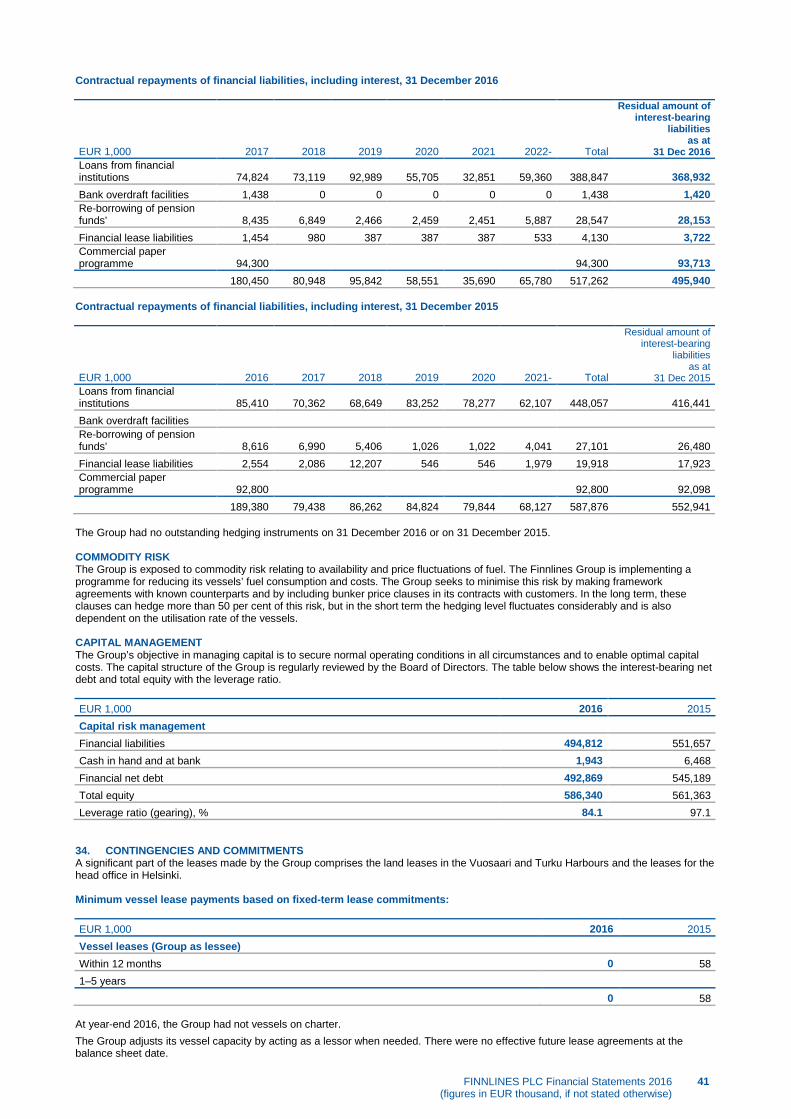
FINNLINES PLC Financial Statements 2016 (figures in EUR thousand, if not stated otherwise)
41
Contractual repayments of financial liabilities, including interest, 31 December 2016
EUR 1,000 2017 2018 2019 2020 2021 2022- Total
Residual amount of interest-bearing
liabilities as at
31 Dec 2016 Loans from financial institutions 74,824 73,119 92,989 55,705 32,851 59,360 388,847 368,932 Bank overdraft facilities 1,438 0 0 0 0 0 1,438 1,420 Re-borrowing of pension funds' 8,435 6,849 2,466 2,459 2,451 5,887 28,547 28,153 Financial lease liabilities 1,454 980 387 387 387 533 4,130 3,722 Commercial paper programme 94,300
94,300 93,713
180,450 80,948 95,842 58,551 35,690 65,780 517,262 495,940 Contractual repayments of financial liabilities, including interest, 31 December 2015
EUR 1,000 2016 2017 2018 2019 2020 2021- Total
Residual amount of interest-bearing
liabilities as at
31 Dec 2015 Loans from financial institutions 85,410 70,362 68,649 83,252 78,277 62,107 448,057 416,441 Bank overdraft facilities
Re-borrowing of pension funds' 8,616 6,990 5,406 1,026 1,022 4,041 27,101 26,480 Financial lease liabilities 2,554 2,086 12,207 546 546 1,979 19,918 17,923 Commercial paper programme 92,800
92,800 92,098
189,380 79,438 86,262 84,824 79,844 68,127 587,876 552,941 The Group had no outstanding hedging instruments on 31 December 2016 or on 31 December 2015. COMMODITY RISK The Group is exposed to commodity risk relating to availability and price fluctuations of fuel. The Finnlines Group is implementing a programme for reducing its vessels’ fuel consumption and costs. The Group seeks to minimise this risk by making framework agreements with known counterparts and by including bunker price clauses in its contracts with customers. In the long term, these clauses can hedge more than 50 per cent of this risk, but in the short term the hedging level fluctuates considerably and is also dependent on the utilisation rate of the vessels. CAPITAL MANAGEMENT The Group’s objective in managing capital is to secure normal operating conditions in all circumstances and to enable optimal capital costs. The capital structure of the Group is regularly reviewed by the Board of Directors. The table below shows the interest-bearing net debt and total equity with the leverage ratio. EUR 1,000 2016 2015 Capital risk management
Financial liabilities 494,812 551,657 Cash in hand and at bank 1,943 6,468 Financial net debt 492,869 545,189 Total equity 586,340 561,363 Leverage ratio (gearing), % 84.1 97.1
34. CONTINGENCIES AND COMMITMENTS A significant part of the leases made by the Group comprises the land leases in the Vuosaari and Turku Harbours and the leases for the head office in Helsinki. Minimum vessel lease payments based on fixed-term lease commitments: EUR 1,000 2016 2015 Vessel leases (Group as lessee)
Within 12 months 0 58 1‒5 years
0 58 At year-end 2016, the Group had not vessels on charter.
The Group adjusts its vessel capacity by acting as a lessor when needed. There were no effective future lease agreements at the balance sheet date.
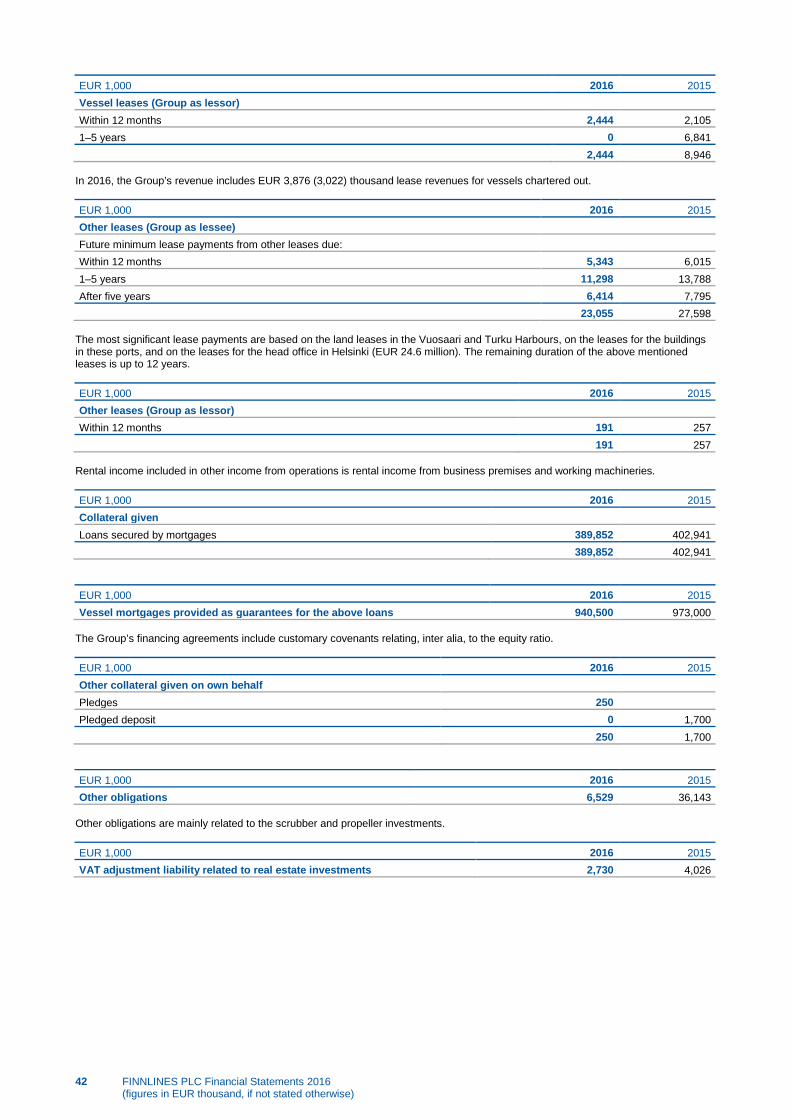
42 FINNLINES PLC Financial Statements 2016 (figures in EUR thousand, if not stated otherwise)
EUR 1,000 2016 2015 Vessel leases (Group as lessor)
Within 12 months 2,444 2,105 1‒5 years 0 6,841 2,444 8,946
In 2016, the Group’s revenue includes EUR 3,876 (3,022) thousand lease revenues for vessels chartered out. EUR 1,000 2016 2015 Other leases (Group as lessee)
Future minimum lease payments from other leases due: Within 12 months 5,343 6,015
1‒5 years 11,298 13,788 After five years 6,414 7,795 23,055 27,598
The most significant lease payments are based on the land leases in the Vuosaari and Turku Harbours, on the leases for the buildings in these ports, and on the leases for the head office in Helsinki (EUR 24.6 million). The remaining duration of the above mentioned leases is up to 12 years. EUR 1,000 2016 2015 Other leases (Group as lessor)
Within 12 months 191 257 191 257
Rental income included in other income from operations is rental income from business premises and working machineries. EUR 1,000 2016 2015 Collateral given
Loans secured by mortgages 389,852 402,941 389,852 402,941
EUR 1,000 2016 2015 Vessel mortgages provided as guarantees for the above loans 940,500 973,000
The Group’s financing agreements include customary covenants relating, inter alia, to the equity ratio. EUR 1,000 2016 2015 Other collateral given on own behalf
Pledges 250 Pledged deposit 0 1,700
250 1,700 EUR 1,000 2016 2015 Other obligations 6,529 36,143
Other obligations are mainly related to the scrubber and propeller investments. EUR 1,000 2016 2015 VAT adjustment liability related to real estate investments 2,730 4,026

FINNLINES PLC Financial Statements 2016 (figures in EUR thousand, if not stated otherwise)
43
Legal proceedings The District Court of Helsinki rendered in February 2015 its decision on the dispute between Finnlines Plc and the State of Finland. According to Finnlines Plc, the Finnish Act on Fairway Dues in force until 1 January 2006 contained provisions which, according to EU law, were discriminatory. The Company has been charged excessive fairway dues during 2001–2004. In its decision, the District Court of Helsinki ordered the State of Finland to refund to Finnlines Plc, as plaintiffs, the fairway dues, charged in excessive extent in 2001–2004 totalling about EUR 17.0 million, including interest. The Finnish State appealed to the Helsinki Court of Appeal. The Court of Appeal rendered its decision in August 2016 by dismissing the judgment rendered by the District Court of Helsinki. The Court of Appeal considers that the claims of Finnlines have expired. The Company has submitted the leave to appeal at the Supreme Court. The case is pending. The Company has summoned OMB Ostsee Mineralöl-Bunker GmbH (’OMB’) Rostock, Germany, to the District Court and demanded compensation for the damage that has occurred to the Company for the price difference between the paid amount for the supplied fuel and the market price. The Company's basis for the demand is that OMB has abused its dominant position in the relevant market and the Company was forced to buy fuel from OMB, OMB being the sole supplier. The total claimed amount is EUR 2.76 million. In its decision the District Court of Rostock dismissed the Company's claims in full. The Company has decided to appeal the District Court's decision to the Court of Appeal. The case is pending. The Company’s port operations subsidiaries have received a summons from 18 former employees. All employees claim compensation based on groundless termination of their employment contracts and compensation according to the Non-Discrimination Act. The total amount of the claims is EUR 2.2 million. The subsidiaries consider the basis of the claims to be groundless. The case is pending. 35. TRANSACTIONS WITH RELATED PARTIES Finnlines applies the legal provisions applying to the management of insiders. In addition, the Finnlines Group’s related parties include the parent company, subsidiaries and joint arrangement as well as the companies of the Grimaldi Group. Related parties also include the members of the Board of Directors and the Executive Committee, and their immediate family members. The Grimaldi Group is the ultimate controlling party at Finnlines. Employee benefits granted to key management EUR 1,000 2016 2015 Salaries and other short-term benefits 1,445 1,406 Post-employment benefits 248 240 1,693 1,646
In 2016, the key management consisted of the members of the Board of Directors and the Executive Committee. The Executive Committee comprised the President and CEO, the CFO, the Group General Counsel and the Operating Officers, a total of eight members. Finnlines Plc’s Annual General Meeting held on 12 April 2016 confirmed the following compensation to the Board of Directors in 2016 EUR 1,000 2016 2015 Salaries and fees
President and CEO Board of Directors: 240 240
Chairman 50 50 Vice Chairman 40 40 Board members (each) 30 30
Compensation to the Board Members for 2015 was paid in April 2016.
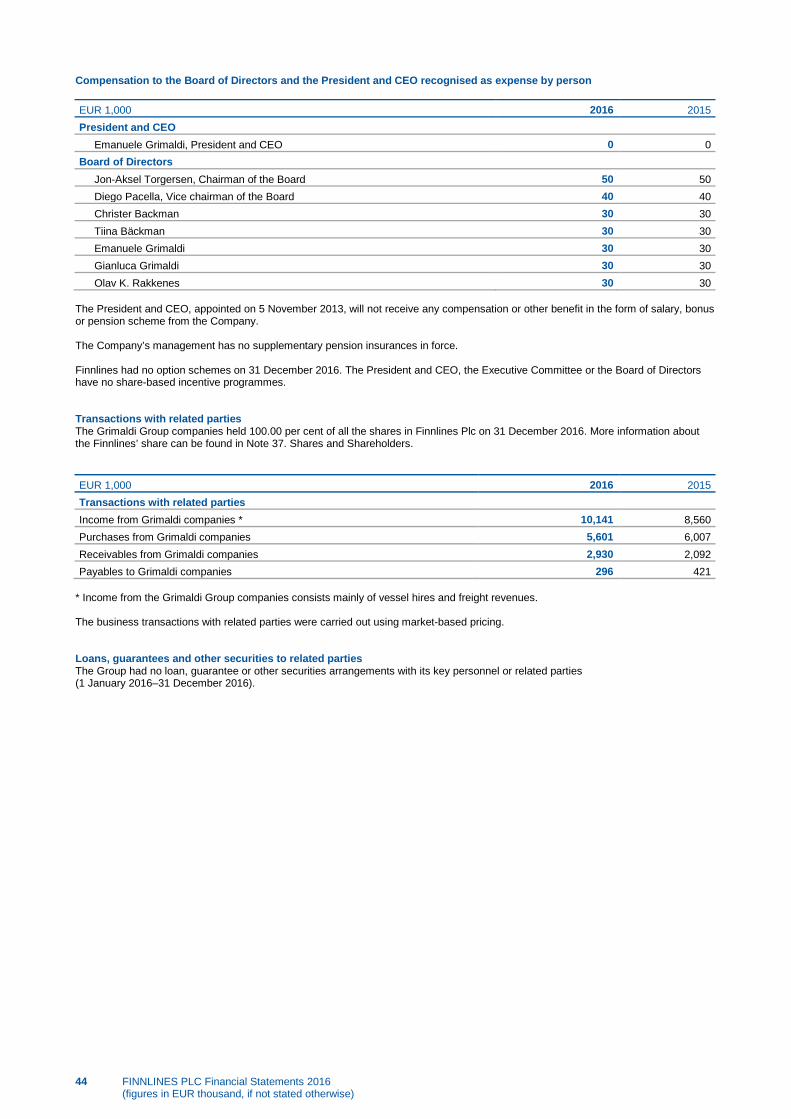
44 FINNLINES PLC Financial Statements 2016 (figures in EUR thousand, if not stated otherwise)
Compensation to the Board of Directors and the President and CEO recognised as expense by person EUR 1,000 2016 2015 President and CEO
Emanuele Grimaldi, President and CEO 0 0 Board of Directors
Jon-Aksel Torgersen, Chairman of the Board 50 50 Diego Pacella, Vice chairman of the Board 40 40 Christer Backman 30 30 Tiina Bäckman 30 30 Emanuele Grimaldi 30 30 Gianluca Grimaldi 30 30 Olav K. Rakkenes 30 30
The President and CEO, appointed on 5 November 2013, will not receive any compensation or other benefit in the form of salary, bonus or pension scheme from the Company. The Company’s management has no supplementary pension insurances in force. Finnlines had no option schemes on 31 December 2016. The President and CEO, the Executive Committee or the Board of Directors have no share-based incentive programmes. Transactions with related parties The Grimaldi Group companies held 100.00 per cent of all the shares in Finnlines Plc on 31 December 2016. More information about the Finnlines’ share can be found in Note 37. Shares and Shareholders. EUR 1,000 2016 2015 Transactions with related parties
Income from Grimaldi companies * 10,141 8,560 Purchases from Grimaldi companies 5,601 6,007 Receivables from Grimaldi companies 2,930 2,092 Payables to Grimaldi companies 296 421
* Income from the Grimaldi Group companies consists mainly of vessel hires and freight revenues. The business transactions with related parties were carried out using market-based pricing. Loans, guarantees and other securities to related parties The Group had no loan, guarantee or other securities arrangements with its key personnel or related parties (1 January 2016–31 December 2016).

FINNLINES PLC Financial Statements 2016 (figures in EUR thousand, if not stated otherwise)
45
36. SUBSIDIARIES ON 31 DECEMBER 2016 Name of subsidiary Holding (%) Registered in Domestic
Containersteve Oy Ab 100 Helsinki Cranesteve Oy Ab 100 Helsinki Finnsteve Oy Ab 100 Helsinki FS-Terminals Oy Ab 100 Helsinki Oy Intercarriers Ltd 78.5 Helsinki
Foreign Finnlines Belgium N.V. 100 Belgium
Finnlines Danmark A/S 100 Denmark Finnlines Deutschland GmbH 100 Germany Finnlines Polska Sp.z.o.o 100 Poland AB Finnlines Scandinavia Ltd 100 Sweden Finnlines Schiffahrt GmbH 100 Germany Finnlines Ship Management AB 100 Sweden Finnlines UK Limited 100 Great Britain Finnlink AB 100 Sweden Rederi AB Nordö-Link 100 Sweden Ropax I Aktiebolaget Clipper 100 Sweden Ropax II EuropaLink AB 100 Sweden Ropax III NordLink AB 100 Sweden Ropax IV Arrow AB 100 Sweden Roro I Mill AB 100 Sweden Roro II Pulp AB 100 Sweden
37. SHARES AND SHAREHOLDERS Finnlines Plc has one share series. Each share carries one vote at general shareholder meetings and confers identical dividend rights. As outlined in Finnlines’ Articles of Association, the Company’s minimum share capital is EUR 50 million and the maximum is EUR 200 million. The share capital can be increased or decreased within these limits. The Company’s paid-up and registered share capital on 31 December 2016 totalled EUR 103,006,282. The capital stock consisted of 51,503,141 shares. Shareholders on 31 December 2016 On 25 August 2016, Grimaldi Group S.p.A. gained title to all the shares in Finnlines Plc and the shares were thus delisted from the official list of Nasdaq Helsinki Oy. According to the arbitral award, the redemption price of a Finnlines share was EUR 18.00 per share. On 17 November 2016, Grimaldi Group S.p.A. paid the redemption price and interest accrued thereon to the account operators maintaining the book-entry accounts and completed the redemption proceedings concerning the shares held by minority shareholders in Finnlines Plc. Shareholders on 25 August 2016 On 25 August 2016, Finnlines had 1,121 shareholders. The ten largest shareholders owned 98.84 per cent of the Company’s shares. 0.06 per cent of the shareholders were nominee registered. On 25 August 2016, the Italian Grimaldi Group had a holding of 98.33 per cent of Finnlines’ shares and voting rights. Share trading and share price development 1 January 2016–25 August 2016 * A total of 2.8 million shares were traded during 1 January 2016–25 August 2016 as in 2015, a total of 7.1 million shares were traded. No treasury shares were held by the Company. The highest quotation for the Finnlines share during 1 January 2016–25 August 2016 was EUR 18.68 (18.00 in 2015) and the lowest was EUR 17.15 (14.34). At 24 August 2016, the shares’ market capitalisation value was EUR 923.9 (911.6 at 31.12.2015) million. Finnlines’ share ownership structure on 25 August 2016 ** % of shares Non-financial corporations 0.08 Financial and insurance corporations 0.00 General government 0.15 Households 1.21 Non-profit associations 0.14 Nominee registered 0.06 Other foreign 98.33 Total 100.00
* Nasdaq Helsinki Ltd ** Source: Euroclear Finland Ltd
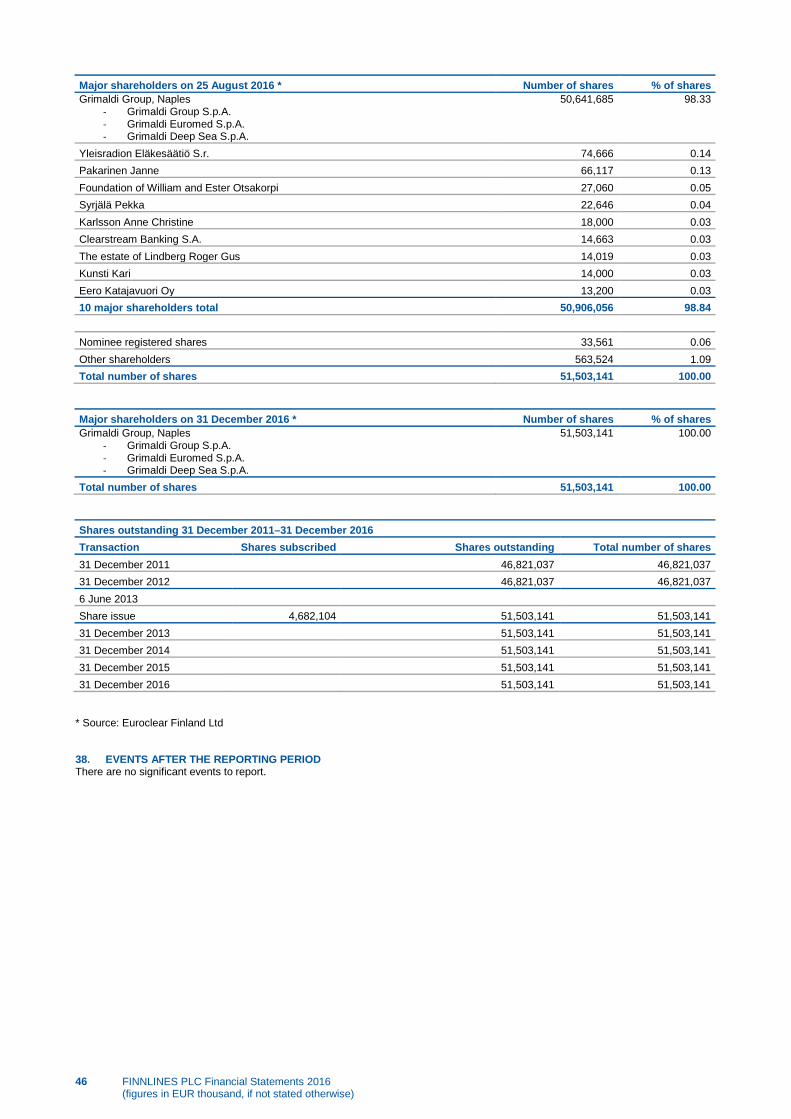
46 FINNLINES PLC Financial Statements 2016 (figures in EUR thousand, if not stated otherwise)
Major shareholders on 25 August 2016 * Number of shares % of shares Grimaldi Group, Naples
- Grimaldi Group S.p.A. - Grimaldi Euromed S.p.A. - Grimaldi Deep Sea S.p.A.
50,641,685 98.33
Yleisradion Eläkesäätiö S.r. 74,666 0.14 Pakarinen Janne 66,117 0.13 Foundation of William and Ester Otsakorpi 27,060 0.05 Syrjälä Pekka 22,646 0.04 Karlsson Anne Christine 18,000 0.03 Clearstream Banking S.A. 14,663 0.03 The estate of Lindberg Roger Gus 14,019 0.03 Kunsti Kari 14,000 0.03 Eero Katajavuori Oy 13,200 0.03 10 major shareholders total 50,906,056 98.84
Nominee registered shares 33,561 0.06 Other shareholders 563,524 1.09 Total number of shares 51,503,141 100.00
Major shareholders on 31 December 2016 * Number of shares % of shares Grimaldi Group, Naples
- Grimaldi Group S.p.A. - Grimaldi Euromed S.p.A. - Grimaldi Deep Sea S.p.A.
51,503,141 100.00
Total number of shares 51,503,141 100.00 Shares outstanding 31 December 2011–31 December 2016 Transaction Shares subscribed Shares outstanding Total number of shares 31 December 2011
46,821,037 46,821,037
31 December 2012
46,821,037 46,821,037 6 June 2013
Share issue 4,682,104 51,503,141 51,503,141 31 December 2013
51,503,141 51,503,141
31 December 2014
51,503,141 51,503,141 31 December 2015
51,503,141 51,503,141
31 December 2016
51,503,141 51,503,141 * Source: Euroclear Finland Ltd 38. EVENTS AFTER THE REPORTING PERIOD There are no significant events to report.

FINNLINES PLC Financial Statements 2016 (figures in EUR thousand, if not stated otherwise)
47
FIVE-YEAR KEY FIGURES EUR million 2016 2015 2014 2013 2012
IFRS IFRS IFRS IFRS IFRS
Revenue 473.7 511.2 532.9 563.6 609.3 Other income from operations 6.7 1.8 6.8 5.3 5.7 Result before interest, taxes, depreciation and amortisation (EBITDA) 139.1 126.9 115.4 83.7 89.8
% of revenue 29.4 24.8 21.7 14.8 14.7 Result before interest and taxes (EBIT) 81.5 70.3 58.6 18.1 23.7
% of revenue 17.2 13.8 11.0 3.2 3.9 Associated companies
Result before taxes (EBT) 67.0 53.2 36.6 -6.7 -1.6 % of revenue 14.1 10.4 6.9 -1.2 -0.3
Result for reporting period, continuing operations 68.1 56.8 41.7 6.0 -0.1 % of revenue 14.4 11.1 7.8 1.1 0.0
Result for reporting period, discontinuing operations
Result for reporting period 68.1 56.8 41.7 6.0 -0.1
% of revenue 14.4 11.1 7.8 1.1 0.0 Total investments * 46.3 64.1 36.6 10.1 67.1
% of revenue 9.8 12.5 6.9 1.8 11.0 Return on equity (ROE), % 11.9 10.7 8.6 1.3 0.0 Return on investment (ROI), % 7.4 6.5 5.3 1.5 1.8 Assets total 1,205.4 1,231.1 1,210.5 1,298.5 1,479.9 Equity ratio, % 48.9 45.7 41.7 35.7 29.0 Gearing, % 83.8 97.1 113.0 149.1 204.9 Average no. of employees 1,653 1,597 1,701 1,861 2,023
2016 2015 2014 2013 2012
IFRS IFRS IFRS IFRS IFRS
Earnings per share (EPS), EUR 1.32 1.10 0.81 0.12 0.00 Earnings per share (EPS) less warrant dilution, EUR 1.32 1.10 0.81 0.12 0.00 Shareholders’ equity per share, EUR 11.42 10.89 9.78 8.98 9.14 Payout ratio, % n/a 0.0 0.0 0.0 0.0 Effective dividend yield, % n/a 0.0 0.0 0.0 0.0 Price/earnings ratio (P/E) n/a 16.0 19.8 62.5 n/a Adjusted average number of outstanding shares (1,000) 51,503 51,503 51,503 49,782 47,344 Adjusted number of outstanding shares 31 Dec (1,000) 51,503 51,503 51,503 51,503 47,344 Number of outstanding shares at year-end (1,000) 51,503 51,503 51,503 51,503 46,821
* Includes continuing and discontinuing operations. Calculation of key ratios is presented on page 48.

48 FINNLINES PLC Financial Statements 2016 (figures in EUR thousand, if not stated otherwise)
CALCULATION OF KEY RATIOS, IFRS
Earnings per share (EPS), EUR = Result attributable to parent company shareholders Weighted average number of outstanding shares
Shareholders’ equity per share, EUR = Shareholders’ equity attributable to parent company shareholders
Undiluted number of shares at the end of period
Payout ratio, % =
Dividend paid for the year x 100 Result before tax +/– non-controlling interests of Group result +/–
change in deferred tax liabilities – taxes for the period
Effective dividend yield, % = Dividend per share x 100
Share price on stock exchange at the end of period
P/E ratio = Share price on stock exchange at the end of period Earnings per share
Return on equity (ROE), % = Result for the reporting period x 100
Total equity (average)
Result before tax + interest expense
Return on investment (ROI), % = + other liability expenses x 100
Assets total – interest-free liabilities (average)
Gearing, % = Interest-bearing liabilities – cash and bank equivalents x 100 Total equity
Equity ratio, % = Total equity x 100
Assets total – received advances The recognised income taxes are based on the year’s estimated average income tax rate which is expected to realise during the entire reporting period. Finnlines Plc’s Shipping and Sea Transport Services transferred to tonnage-based taxation in January 2013.

FINNLINES PLC Financial Statements 2016 (figures in EUR thousand, if not stated otherwise)
49
QUARTERLY DATA, IFRS EUR million Q1/2016 Q1/2015 Q2/2016 Q2/2015 Q3/2016 Q3/2015 Q4/2016 Q4/2015 Revenue by segment
Shipping and Sea Transport Services total 100.4 112.9 120.3 130.2 125.1 133.4 107.9 116.4 Sales to third parties 100.4 112.9 120.3 130.2 125.1 133.5 107.9 116.4 Sales to Port Operations 0.0 0.0 0.0 0.0 0.0 0.0 0.0 0.0
Port Operations total 9.3 8.3 10.2 9.7 9.7 8.9 9.2 9.0 Sales to third parties 4.8 3.9 5.3 5.0 5.3 4.8 4.7 4.5 Sales to Port Operations 4.5 4.4 4.8 4.7 4.4 4.2 4.6 4.5
Group internal revenue -4.4 -4.4 -4.9 -4.6 -4.4 -4.1 -4.6 -4.5 Revenue total 105.2 116.8 125.6 135.2 130.4 138.2 112.6 120.9
Result before interest and taxes per segment
Shipping and Sea Transport Services 12.1 5.0 25.1 20.2 34.7 29.0 10.9 18.1 Port Operations -0.8 -1.1 0.2 -0.1 0.1 0.1 -0,8 -0.8 Result before interest and taxes (EBIT) total 11.4 3.9 25.3 20.1 34.8 29.0 10.1 17.3
Financial income and expenses -3.9 -4.3 -3.6 -4.8 -3.7 -4.4 -3.4 -3.7 Result before tax (EBT) 7.4 -0.4 21.7 15.3 31.1 24.7 6.7 13.6 Income taxes 0.9 1.0 0.5 0.5 -0.8 0.0 0.6 2.1 Result for the reporting period 8.3 0.6 22.2 15.8 30.3 24.7 7.3 15.7
Quarterly consolidated key figures
Result before interest and taxes, (% of revenue) 10.8 3.3 20.1 14.8 26.7 21.0 8.9 14.3
Earnings per share, EUR 0.16 0.01 0.43 0.31 0.59 0.48 0.14 0.31 Average number of outstanding shares (1,000) 51,503 51,503 51,503 51,503 51,503 51,503 51,503 51,503

50 FINNLINES PLC Financial Statements 2016 (figures in EUR thousand, if not stated otherwise)
PROFIT AND LOSS ACCOUNT, PARENT COMPANY, FAS
EUR Note 1 Jan–31 Dec 2016 1 Jan–31 Dec 2015 Revenue 1 365,578,003.15 399,551,256.21
Other income from operations 2 3,975,912.60 3,725,094.27
Materials and services 3 -119,963,149.79 -146,434,213.23 Personnel expenses 4 -45,630,895.70 -40,143,206.84 Depreciation, amortisation and other write-offs 5 -30,971,035.52 -30,459,737.88 Other operating expenses 6 -110,190,579.93 -127,048,262.92 Operating profit
62,798,254.81 59,190,929.61
Financial income and expenses 7 -9,231,814.83 -11,159,462.11
Result before appropriations and taxes
53,566,439.98 48,031,467.50
Appropriations
Group contributions 8 -2,410,300.00 -800,000.00
Profit before tax
51,156,139.98 47,231,467.50
Other income taxes
Tonnagetax 9 -82,136.74 -91,640.81
Deferred taxes 10 4,943,192.54 5,658,883.85
Result for the reporting period
56,017,195.78 52,798,710.54 See Notes starting on page 54.
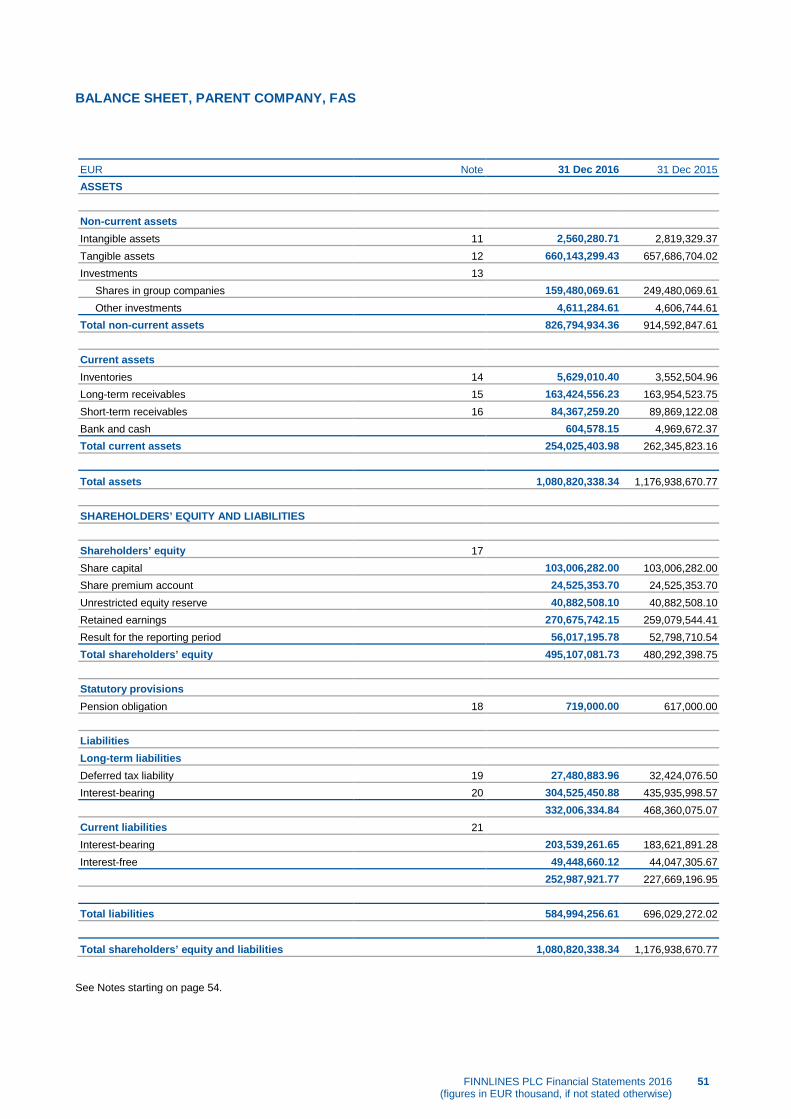
FINNLINES PLC Financial Statements 2016 (figures in EUR thousand, if not stated otherwise)
51
BALANCE SHEET, PARENT COMPANY, FAS
EUR Note 31 Dec 2016 31 Dec 2015 ASSETS
Non-current assets
Intangible assets 11 2,560,280.71 2,819,329.37 Tangible assets 12 660,143,299.43 657,686,704.02 Investments 13
Shares in group companies
159,480,069.61 249,480,069.61 Other investments
4,611,284.61 4,606,744.61
Total non-current assets
826,794,934.36 914,592,847.61
Current assets
Inventories 14 5,629,010.40 3,552,504.96
Long-term receivables 15 163,424,556.23 163,954,523.75 Short-term receivables 16 84,367,259.20 89,869,122.08 Bank and cash
604,578.15 4,969,672.37
Total current assets
254,025,403.98 262,345,823.16
Total assets
1,080,820,338.34 1,176,938,670.77
SHAREHOLDERS’ EQUITY AND LIABILITIES
Shareholders’ equity 17 Share capital
103,006,282.00 103,006,282.00
Share premium account
24,525,353.70 24,525,353.70 Unrestricted equity reserve
40,882,508.10 40,882,508.10
Retained earnings
270,675,742.15 259,079,544.41 Result for the reporting period
56,017,195.78 52,798,710.54
Total shareholders’ equity
495,107,081.73 480,292,398.75
Statutory provisions
Pension obligation 18 719,000.00 617,000.00
Liabilities
Long-term liabilities
Deferred tax liability 19 27,480,883.96 32,424,076.50 Interest-bearing 20 304,525,450.88 435,935,998.57
332,006,334.84 468,360,075.07
Current liabilities 21 Interest-bearing
203,539,261.65 183,621,891.28
Interest-free
49,448,660.12 44,047,305.67
252,987,921.77 227,669,196.95
Total liabilities
584,994,256.61 696,029,272.02
Total shareholders’ equity and liabilities
1,080,820,338.34 1,176,938,670.77 See Notes starting on page 54.

52 FINNLINES PLC Financial Statements 2016 (figures in EUR thousand, if not stated otherwise)
CASH FLOW STATEMENT, PARENT COMPANY, FAS
EUR 1 Jan–31 Dec 2016 1 Jan–31 Dec 2015 Cash flows from operating activities
Result for the reporting period 56,017,195.78 52,798,710.54
Adjustments for: Depreciation, amortisation & impairment loss 30,971,035.52 30,459,737.88
Gains (-) and Losses (+) of disposals of fixed assets and other non-current assets -624,254.14 -213,011.25 Financial income and expenses 9,231,814.83 11,159,462.11 Income taxes -4,861,055.80 -5,567,243.04 Other adjustments 2,410,300.00 800,000.00
93,145,036.19 89,437,656.24
Changes in working capital: Change in inventories, addition (-) and decrease (+) -2,076,505.44 1,362,952.94
Change in accounts receivable, addition (-) and decrease (+) 4,185,793.71 -7,337,715.55 Change in accounts payable, addition (+) and decrease (-) 6,340,240.35 -1,874,403.58 Change in provisions 102,000.00 -520,000.00
101,696,564.81 81,068,490.05
Interest paid -10,493,863.70 -13,062,957.89 Dividends received 90,387,600.00
Interest received 4,076,079.45 4,704,721.07 Other financing items -3,321,972.45 -2,867,949.21 Income taxes paid -89,165.00 -79,863.97
80,558,678.30 -11,306,050.00
Net cash generated from operating activities 182,255,243.11 69,762,440.05
Cash flows from investing activities Investments in tangible and intangible assets -27,339,869.06 -55,993,336.25
Proceeds from sale of tangible and intangible assets 559,854.14 308,453.31 Investment in subsidiary -6,685,566.00 Investments in other shares -231,540.00
Change in internal loans (net) -4,502,792.29 12,210,720.34 Net cash used in investing activities -31,514,347.21 -50,159,728.60
Net cash before financing activities 150,740,895.90 19,602,711.45
Cash flows from financing activities Proceeds from short-term borrowings 33,717,370.37 Repayment of short-term borrowings -1,243,951.16
Proceeds of long-term borrowings 195,000,000.00 298,400,000.00 Repayment of long-term borrowings -340,210,547.69 -311,815,042.57 Dividends paid -41,202,512.80
Group contributions -2,410,300.00 -800,000.00 Net cash used in financing activities -155,105,990.12 -15,458,993.73
Change in cash and cash equivalents -4,365,094.22 4,143,717.72 Cash and cash equivalents on 1 January 4,969,672.37 825,954.65 Cash and cash equivalents on 31 December 604,578.15 4,969,672.37
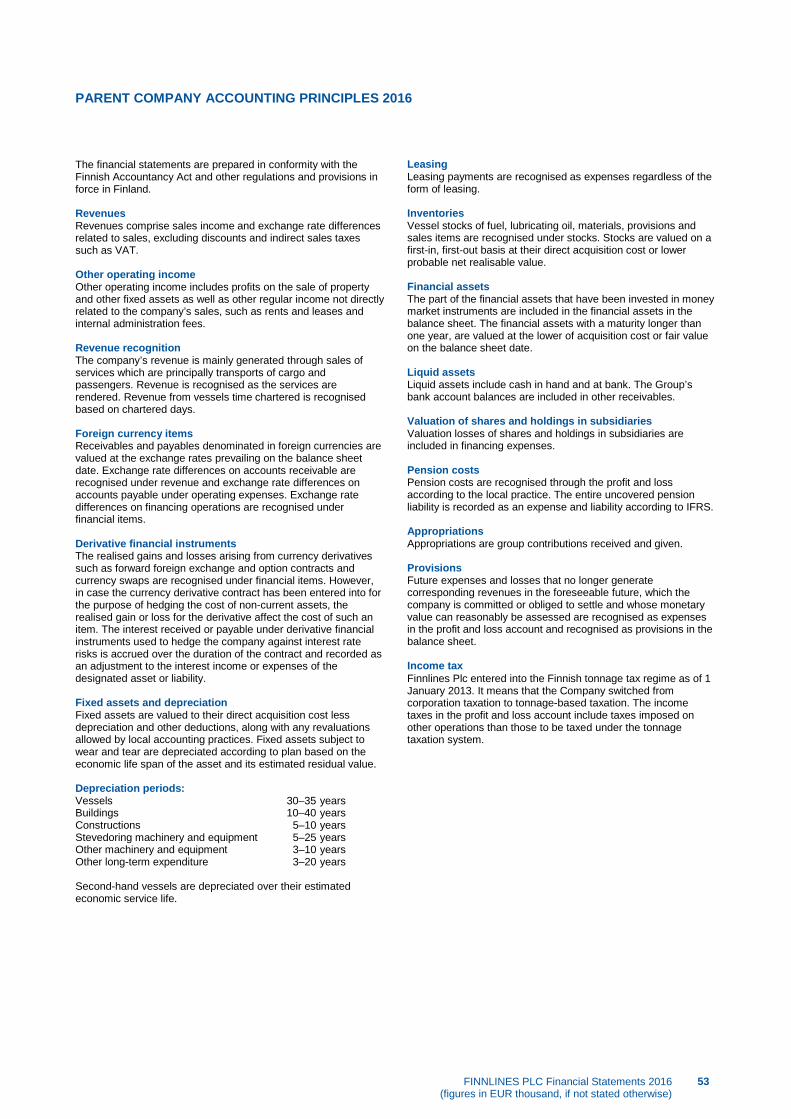
FINNLINES PLC Financial Statements 2016 (figures in EUR thousand, if not stated otherwise)
53
PARENT COMPANY ACCOUNTING PRINCIPLES 2016
The financial statements are prepared in conformity with the Finnish Accountancy Act and other regulations and provisions in force in Finland. Revenues Revenues comprise sales income and exchange rate differences related to sales, excluding discounts and indirect sales taxes such as VAT. Other operating income Other operating income includes profits on the sale of property and other fixed assets as well as other regular income not directly related to the company’s sales, such as rents and leases and internal administration fees. Revenue recognition The company’s revenue is mainly generated through sales of services which are principally transports of cargo and passengers. Revenue is recognised as the services are rendered. Revenue from vessels time chartered is recognised based on chartered days. Foreign currency items Receivables and payables denominated in foreign currencies are valued at the exchange rates prevailing on the balance sheet date. Exchange rate differences on accounts receivable are recognised under revenue and exchange rate differences on accounts payable under operating expenses. Exchange rate differences on financing operations are recognised under financial items. Derivative financial instruments The realised gains and losses arising from currency derivatives such as forward foreign exchange and option contracts and currency swaps are recognised under financial items. However, in case the currency derivative contract has been entered into for the purpose of hedging the cost of non-current assets, the realised gain or loss for the derivative affect the cost of such an item. The interest received or payable under derivative financial instruments used to hedge the company against interest rate risks is accrued over the duration of the contract and recorded as an adjustment to the interest income or expenses of the designated asset or liability. Fixed assets and depreciation Fixed assets are valued to their direct acquisition cost less depreciation and other deductions, along with any revaluations allowed by local accounting practices. Fixed assets subject to wear and tear are depreciated according to plan based on the economic life span of the asset and its estimated residual value. Depreciation periods: Vessels 30–35 years Buildings 10–40 years Constructions 5–10 years Stevedoring machinery and equipment 5–25 years Other machinery and equipment 3–10 years Other long-term expenditure 3–20 years Second-hand vessels are depreciated over their estimated economic service life.
Leasing Leasing payments are recognised as expenses regardless of the form of leasing. Inventories Vessel stocks of fuel, lubricating oil, materials, provisions and sales items are recognised under stocks. Stocks are valued on a first-in, first-out basis at their direct acquisition cost or lower probable net realisable value. Financial assets The part of the financial assets that have been invested in money market instruments are included in the financial assets in the balance sheet. The financial assets with a maturity longer than one year, are valued at the lower of acquisition cost or fair value on the balance sheet date. Liquid assets Liquid assets include cash in hand and at bank. The Group’s bank account balances are included in other receivables. Valuation of shares and holdings in subsidiaries Valuation losses of shares and holdings in subsidiaries are included in financing expenses. Pension costs Pension costs are recognised through the profit and loss according to the local practice. The entire uncovered pension liability is recorded as an expense and liability according to IFRS. Appropriations Appropriations are group contributions received and given. Provisions Future expenses and losses that no longer generate corresponding revenues in the foreseeable future, which the company is committed or obliged to settle and whose monetary value can reasonably be assessed are recognised as expenses in the profit and loss account and recognised as provisions in the balance sheet. Income tax Finnlines Plc entered into the Finnish tonnage tax regime as of 1 January 2013. It means that the Company switched from corporation taxation to tonnage-based taxation. The income taxes in the profit and loss account include taxes imposed on other operations than those to be taxed under the tonnage taxation system.

54 FINNLINES PLC Financial Statements 2016 (figures in EUR thousand, if not stated otherwise)
NOTES TO THE FINANCIAL STATEMENTS, PARENT COMPANY
1. REVENUE EUR 2016 2015 By segment
Shipping and Sea Transport Services 365,578,003.15 399,551,256.21 Total 365,578,003.15 399,551,256.21
Intra-group revenue 183,886.11 553,576.07 2. OTHER INCOME FROM OPERATIONS EUR 2016 2015 Gain on disposals 624,254.14 307,876.02 Rental income 311,216.89 128,274.56 Internal administration fees 2,761,263.02 2,823,975.94 Other 279,178.55 464,967.75 Total 3,975,912.60 3,725,094.27
3. MATERIALS AND SERVICES EUR 2016 2015 Purchases during the reporting period
Bunker -54,147,724.00 -75,360,080.91 Other -5,647,893.48 -5,157,760.02
Change in inventories 2,076,505.44 -1,362,952.94 Total -57,719,112.04 -81,880,793.87
External services -62,244,037.75 -64,553,419.36
Materials and services total -119,963,149.79 -146,434,213.23 4. PERSONNEL AND PERSONNEL EXPENSES EUR 2016 2015 Employees
Average number of employees Shore-based personnel 222 219
Sea personnel 640 583
862 802
Personnel expenses Wages and salaries -48,257,275.44 -44,674,148.62
Social costs Pension costs -7,603,351.99 -4,748,264.13
Other social costs -3,499,749.17 -3,163,304.46 State subsidies 13,729,480.90 12,442,510.37
Total -45,630,895.70 -40,143,206.84
Salaries and remunerations to President and CEO Board of Directors -240,000.00 -240,000.00

FINNLINES PLC Financial Statements 2016 (figures in EUR thousand, if not stated otherwise)
55
5. DEPRECIATION, AMORTISATION AND WRITE-OFFS EUR 2016 2015 Depreciation and amortisation according to plan
Other long term expenditure -408,875.38 -2,454,126.82 Vessels -29,999,282.07 -27,252,267.45 Cargo handling equipment -398,371.11 -603,017.65 Machinery and equipment -164,506.96 -150,325.96
Total -30,971,035.52 -30,459,737.88 6. OTHER OPERATING EXPENSES
EUR 2016 2015 Vessel hires, internal -8,592,919.44 -8,848,951.68 Vessel hires, external -5,854,990.08 -22,048,870.04 Other leases -3,063,410.68 -2,782,414.77 Port expenses and fairway dues -29,929,868.90 -31,846,008.53 Commissions -9,476,973.16 -9,771,727.02 Cargo handling equipment related costs -3,605,668.19 -3,355,969.79 Vessel insurances, repairs and maintenance -30,455,609.98 -26,510,489.37 Marketing costs -2,851,602.86 -3,069,659.55 Auditors’ fees
KPMG Oy Ab -78,096.48 -93,433.67 Tax consultancy and other fees
KPMG Oy Ab -14,210.39 -41,007.60 Other -16,267,229.77 -18,679,730.90 Total -110,190,579.93 -127,048,262.92
7. FINANCIAL INCOME AND EXPENSES
EUR 2016 2015 Dividends
From group companies 90,387,600.00 Dividends total 90,387,600.00
Other interest and financial income From group companies 3,881,701.06 4,600,224.77
From others 34,198.35 272,342.41 Other interest and financial income total 3,915,899.41 4,872,567.18 of which interest income total 3,915,899.41 4,872,567.18 Dividends and interest income total 94,303,499.41 4,872,567.18
Exchange gains and losses From others Gains 147,840.10 185,490.71
Losses -68,716.26 -80,844.48 Exchange rate differences total 79,123.84 104,646.23
Impairment losses on investments under non-current assets * -90,000,000.00 Impairment losses total -90,000,000.00
Interest and other financial expenses To group companies -171,566.66 -170,223.95
To others -13,442,871.42 -15,966,451.57 Interest and other financial expenses total -13,614,438.08 -16,136,675.52 of which interest expenses total -10,256,635.90 -13,142,536.20 Financial income and expenses total -9,231,814.83 -11,159,462.11
* Shares in group companies.

56 FINNLINES PLC Financial Statements 2016 (figures in EUR thousand, if not stated otherwise)
8. APPROPRIATIONS EUR 2016 2015 Group contribution -2,410,300.00 -800,000.00 Total -2,410,300.00 -800,000.00
9. OTHER TAXES EUR 2016 2015 Tonnage tax -82,136.74 -91,640.81 Total -82,136.74 -91,640.81
10. DEFERRED TAX LIABILITIES EUR 2016 2015 Change in deferred taxes 4,943,192.54 5,658,883.85 Total 4,943,192.54 5,658,883.85
11. INTANGIBLE ASSETS EUR Other capitalised expenditures Advance payments Total Acquisition cost on 1 Jan 2016 21,814,555.67 88,406.97 21,902,962.64 Increases 149,826.72 0.00 149,826.72 Disposals 0.00
0.00
Reclassifications between items 88,406.97 -88,406.97 0.00 Acquisition cost on 31 Dec 2016 22,052,789.36 0.00 22,052,789.36
Accumulated depreciation and impairments on 1 Jan 2016 -19,083,633.27 0.00 -19,083,633.27 Accumulated depreciation on disposals and reclassifications 0.00
0.00
Depreciation for the reporting period -408,875.38
-408,875.38 Accumulated depreciation on 31 Dec 2016 -19,492,508.65 0.00 -19,492,508.65
Carrying value on 31 Dec 2016 2,560,280.71 0.00 2,560,280.71
Carrying value on 31 Dec 2015 2,730,922.40 88,406.97 2,819,329.37
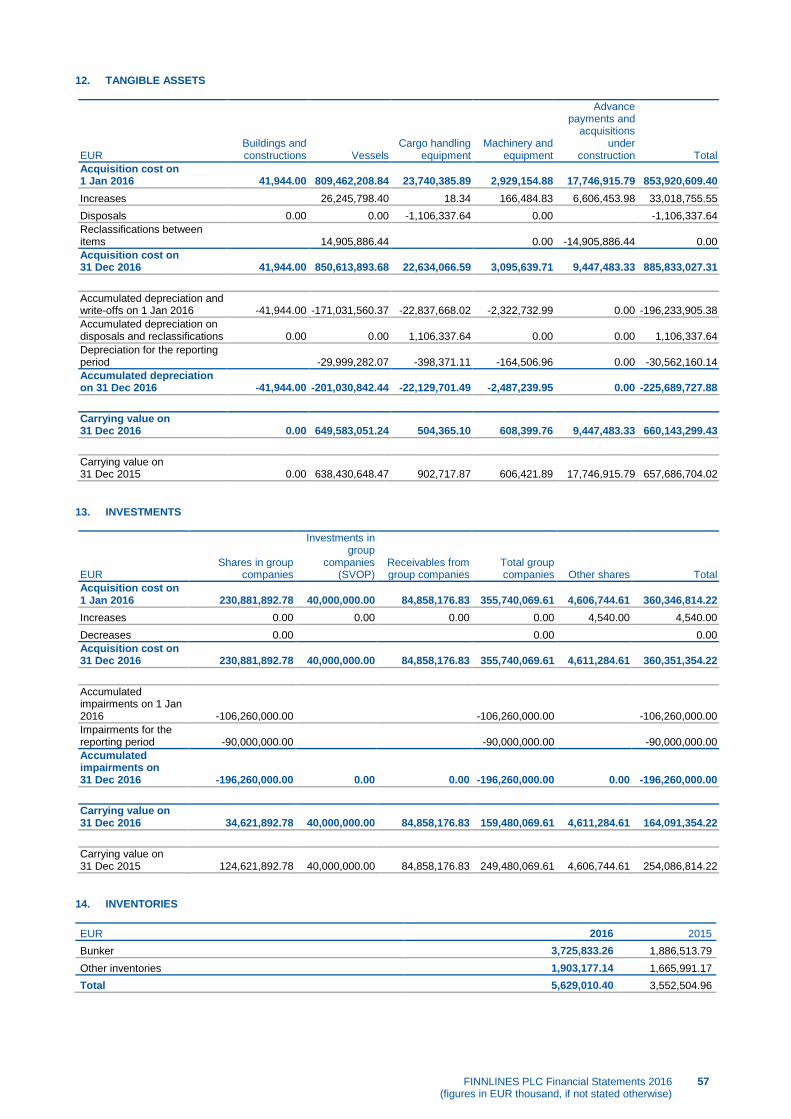
FINNLINES PLC Financial Statements 2016 (figures in EUR thousand, if not stated otherwise)
57
12. TANGIBLE ASSETS
EUR Buildings and constructions Vessels
Cargo handling equipment
Machinery and equipment
Advance payments and
acquisitions under
construction Total Acquisition cost on 1 Jan 2016 41,944.00 809,462,208.84 23,740,385.89 2,929,154.88 17,746,915.79 853,920,609.40 Increases
26,245,798.40 18.34 166,484.83 6,606,453.98 33,018,755.55
Disposals 0.00 0.00 -1,106,337.64 0.00
-1,106,337.64 Reclassifications between items
14,905,886.44 0.00 -14,905,886.44 0.00
Acquisition cost on 31 Dec 2016 41,944.00 850,613,893.68 22,634,066.59 3,095,639.71 9,447,483.33 885,833,027.31
Accumulated depreciation and write-offs on 1 Jan 2016 -41,944.00 -171,031,560.37 -22,837,668.02 -2,322,732.99 0.00 -196,233,905.38 Accumulated depreciation on disposals and reclassifications 0.00 0.00 1,106,337.64 0.00 0.00 1,106,337.64 Depreciation for the reporting period
-29,999,282.07 -398,371.11 -164,506.96 0.00 -30,562,160.14
Accumulated depreciation on 31 Dec 2016 -41,944.00 -201,030,842.44 -22,129,701.49 -2,487,239.95 0.00 -225,689,727.88
Carrying value on 31 Dec 2016 0.00 649,583,051.24 504,365.10 608,399.76 9,447,483.33 660,143,299.43
Carrying value on 31 Dec 2015 0.00 638,430,648.47 902,717.87 606,421.89 17,746,915.79 657,686,704.02
13. INVESTMENTS
EUR Shares in group
companies
Investments in group
companies (SVOP)
Receivables from group companies
Total group companies Other shares Total
Acquisition cost on 1 Jan 2016 230,881,892.78 40,000,000.00 84,858,176.83 355,740,069.61 4,606,744.61 360,346,814.22 Increases 0.00 0.00 0.00 0.00 4,540.00 4,540.00 Decreases 0.00 0.00
0.00
Acquisition cost on 31 Dec 2016 230,881,892.78 40,000,000.00 84,858,176.83 355,740,069.61 4,611,284.61 360,351,354.22
Accumulated impairments on 1 Jan 2016 -106,260,000.00 -106,260,000.00
-106,260,000.00
Impairments for the reporting period -90,000,000.00 -90,000,000.00
-90,000,000.00
Accumulated impairments on 31 Dec 2016 -196,260,000.00 0.00 0.00 -196,260,000.00 0.00 -196,260,000.00
Carrying value on 31 Dec 2016 34,621,892.78 40,000,000.00 84,858,176.83 159,480,069.61 4,611,284.61 164,091,354.22
Carrying value on 31 Dec 2015 124,621,892.78 40,000,000.00 84,858,176.83 249,480,069.61 4,606,744.61 254,086,814.22
14. INVENTORIES EUR 2016 2015 Bunker 3,725,833.26 1,886,513.79 Other inventories 1,903,177.14 1,665,991.17 Total 5,629,010.40 3,552,504.96

58 FINNLINES PLC Financial Statements 2016 (figures in EUR thousand, if not stated otherwise)
15. LONG-TERM RECEIVABLES EUR 2016 2015 Loan receivables
Loan receivables from group companies 161,399,961.00 161,812,642.10 Total 161,399,961.00 161,812,642.10
Other receivables 1,090,909.21 814,829.99 Accrued income and prepaid expenses 933,686.02 1,327,051.66
Total long-term receivables 163,424,556.23 163,954,523.75 16. SHORT-TERM RECEIVABLES EUR 2016 2015 Accounts receivable
From group companies 130,683.42 168,680.84 From others 45,148,966.75 43,550,013.89 Total 45,279,650.17 43,718,694.73
Loan receivables From group companies 20,449,393.93 15,533,920.54
Total 20,449,393.93 15,533,920.54
Other receivables 3,183,682.83 10,412,757.75
Accrued income and prepaid expenses From group companies 408,170.99 429,962.33
From others 15,046,361.28 19,773,786.73 Total 15,454,532.27 20,203,749.06
Total short-term receivables 84,367,259.20 89,869,122.08
Significant items of accrued income and prepaid expenses Sea freight revenue 248,172.79 970,474.87
State subsidies 7,312,263.33 6,903,865.37 Vessel hires -11,970.00 351,350.00 Docking costs 4,959,050.23 6,950,766.97 Passenger income 400,102.66 497,587.36 Insurances 398,188.71 932,641.61 Port expenses 527,766.49 687,732.43 Legal expenses 0.00 36,334.31 Reimbursement of average repairs, vessels 833,015.44 1,270,873.92 Other 787,942.62 1,602,122.22 Total 15,454,532.27 20,203,749.06

FINNLINES PLC Financial Statements 2016 (figures in EUR thousand, if not stated otherwise)
59
17. SHAREHOLDERS’ EQUITY EUR 2016 2015 Restricted equity
Share capital on 1 January 103,006,282.00 103,006,282.00 Share capital on 31 December 103,006,282.00 103,006,282.00
Share issue premium on 1 January 24,525,353.70 24,525,353.70 Share issue premium on 31 December 24,525,353.70 24,525,353.70
Non-restricted equity Unrestricted equity reserve 1 January 40,882,508.10 40,882,508.10
Unrestricted equity reserve 31 December 40,882,508.10 40,882,508.10
Retained earnings on 1 January 311,878,254.95 259,079,544.41 Retained earnings on 31 December 311,878,254.95 259,079,544.41
Dividend paid -41,202,512.80 0.00
Result for the reporting period 56,017,195.78 52,798,710.54
Total shareholders’ equity 495,107,081.73 480,292,398.75
Calculation of distributable funds Retained earnings 270,675,742.15 259,079,544.41
Unrestricted equity reserve 40,882,508.10 40,882,508.10 Result for the reporting period 56,017,195.78 52,798,710.54 Parent company’s distributable funds on 31 December 367,575,446.03 352,760,763.05
18. STATUTORY PROVISIONS EUR 2016 2015 Pension obligation 719,000.00 617,000.00 Total 719,000.00 617,000.00
Pension costs are recognised in the profit and loss account according to the established practice in Finland. 19. DEFERRED TAX LIABILITY EUR 2016 2015 Deferred tax liability of excess depreciations, tonnage taxation 1 January 32,424,076.50 38,082,960.35 Recognised in profit and loss account 1 January–31 December
Tonnage tax relief -4,943,192.54 -5,658,883.85 Deferred tax liability, tonnage taxation 31 December 27,480,883.96 32,424,076.50
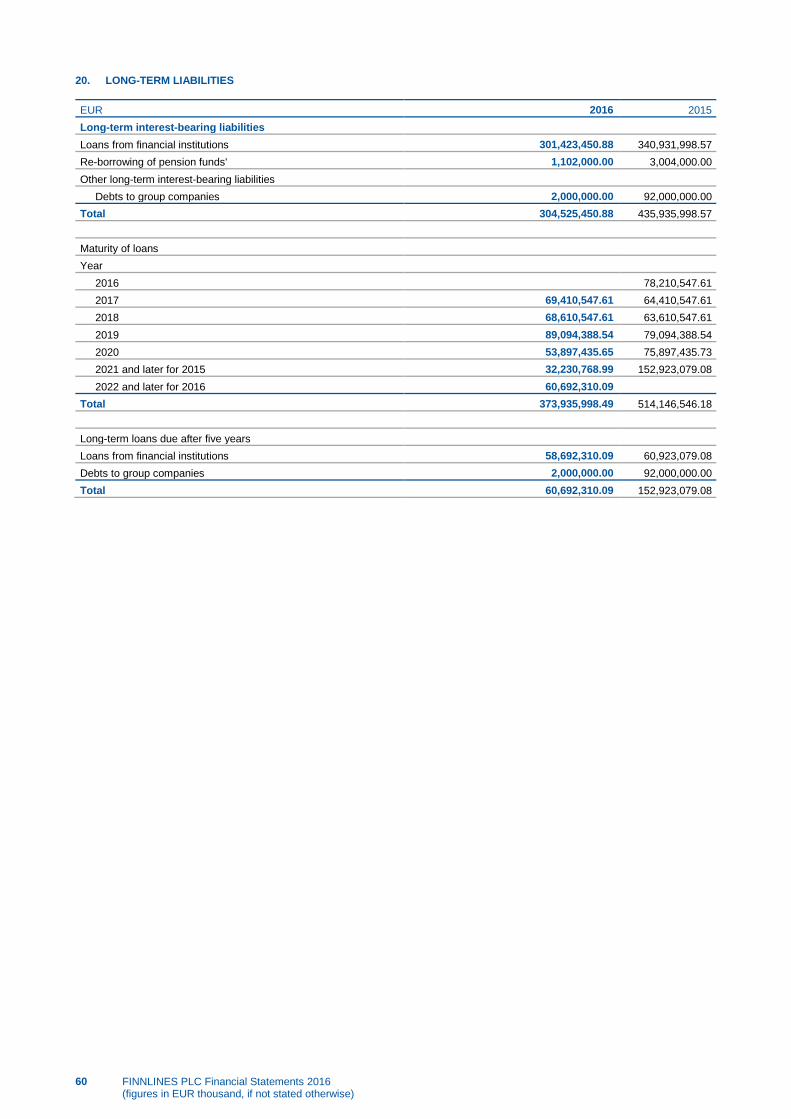
60 FINNLINES PLC Financial Statements 2016 (figures in EUR thousand, if not stated otherwise)
20. LONG-TERM LIABILITIES EUR 2016 2015 Long-term interest-bearing liabilities
Loans from financial institutions 301,423,450.88 340,931,998.57 Re-borrowing of pension funds' 1,102,000.00 3,004,000.00 Other long-term interest-bearing liabilities
Debts to group companies 2,000,000.00 92,000,000.00 Total 304,525,450.88 435,935,998.57
Maturity of loans Year 2016 78,210,547.61
2017 69,410,547.61 64,410,547.61 2018 68,610,547.61 63,610,547.61 2019 89,094,388.54 79,094,388.54 2020 53,897,435.65 75,897,435.73 2021 and later for 2015 32,230,768.99 152,923,079.08 2022 and later for 2016 60,692,310.09
Total 373,935,998.49 514,146,546.18
Long-term loans due after five years Loans from financial institutions 58,692,310.09 60,923,079.08
Debts to group companies 2,000,000.00 92,000,000.00 Total 60,692,310.09 152,923,079.08

FINNLINES PLC Financial Statements 2016 (figures in EUR thousand, if not stated otherwise)
61
21. CURRENT LIABILITIES EUR 2016 2015 Interest-bearing current liabilities
Loans from financial institutions 67,508,547.61 75,508,547.61 Bank overdraft facilities 1,419,698.82 0.00 Re-borrowing of pension funds' 1,902,000.00 2,702,000.00 Commercial papers 93,713,049.09 92,097,768.95 Other interest-bearing current liabilities
To group companies 38,995,966.13 13,313,574.72 Total interest-bearing liabilities 203,539,261.65 183,621,891.28
Interest-free current liabilities Accounts payable To group companies 1,308,964.31 907,395.80
To others 12,123,035.36 13,580,080.48 Total 13,431,999.67 14,487,476.28
Other interest-free liabilities to others To others 12,951,814.50 11,743,571.70
Total 12,951,814.50 11,743,571.70
Accrued expenses and deferred income To group companies 1,643,418.53 1,132,916.05
To others 21,421,427.42 16,683,341.64 Total 23,064,845.95 17,816,257.69
Total interest-free current liabilities 49,448,660.12 44,047,305.67
Total current liabilities 252,987,921.77 227,669,196.95
Significant items of accrued expenses and deferred income Agent commissions paid, internal 361,200.18 678,135.37
Purchased services, internal 132,076.47 194,603.72 Annual rebates 5,361,464.29 4,229,438.30 Personnel expenses 4,892,208.54 4,497,728.32 External services / cargo handling costs 1,227,566.76 927,946.63 Port expenses and voyage related costs 1,741,841.00 1,399,151.78 Interest expenses 1,903,544.36 2,534,138.10 Bunker costs 2,288,375.12 696,872.39 Other 5,156,569.23 2,658,243.08 Total 23,064,845.95 17,816,257.69

62 FINNLINES PLC Financial Statements 2016 (figures in EUR thousand, if not stated otherwise)
CONTINGENCIES AND COMMITMENTS
2016 2015
EUR 1,000 Debt
Value of collateral Debt
Value of collateral
Pledges and commitments given on own account
Vessel mortgages provided as guarantees for loans Loans from financial institutions 320,493 698,000 301,809 748,000
Vessel mortgages provided by subsidiaries as guarantees for loans Loans from financial institutions 69,358 217,500 90,031 217,500
389,851 915,500 391,840 965,500
Pledged deposit 0 60 0 1,700
Other contingent liabilities 0 5,466 0 29,654
Leasing liabilities Due within 12 months 0 246 0 669
Due between one and five years 0 337 0 240 Leasing liabilities total 0 583 0 909
Vessel leases (Group as a lessee) Due within 12 months 0 0 0 58
Vessel leases (Group as a lessee) total 0 0 0 58
Other leases Due within 12 months 0 719 0 715
Due between one and five years 0 2,503 0 2,702 Due after five years 0 0 0 450 Other leases total 0 3,222 0 3,867
Guarantees given on behalf of subsidiaries Guarantees given on behalf of the subsidiaries 0 6,709 0 10,164
Guarantees for rental contracts 0 1,765 0 2,193 Guarantees given on behalf of subsidiaries total 0 8,474 0 12,357
DERIVATIVE CONTRACTS The Company has no valid derivative contracts in 2016 or 2015.

FINNLINES PLC Financial Statements 2016 (figures in EUR thousand, if not stated otherwise)
63
SHARES AND HOLDINGS OF PARENT COMPANY SHARES AND HOLDINGS Name of subsidiary Registered in Holding (%) Domestic
Finnsteve Oy Ab Helsinki 100 Oy Intercarriers Ltd Helsinki 78.5
Foreign Finnlines Danmark A/S Denmark 100
Finnlines Deutschland GmbH Germany 100 Finnlines Polska Sp. z.o.o Poland 100 AB Finnlines Scandinavia Ltd Sweden 100 Finnlines Ship Management AB Sweden 100 Finnlines UK Limited Great Britain 100 Finnlines Belgium N.V. Belgium 100
Other shares and holdings Domestic Steveco Oy Kotka 19.1
Asunto Oy Laurinkivi Espoo - Other companies (4)

64 FINNLINES PLC Financial Statements 2016 (figures in EUR thousand, if not stated otherwise)
BOARD’S PROPOSAL FOR THE USE OF THE DISTRIBUTABLE FUNDS AND SIGNATURES TO THE BOARD OF DIRECTORS’ REPORT AND TO THE FINANCIAL STATEMENTS
Distributable funds included in the parent company’s shareholders’ equity on 31 December 2016: Retained earnings EUR 270,675,742.15 Unrestricted equity reserve EUR 40,882,508.10 Result for the reporting period EUR 56,017,195.78 Distributable funds total EUR 367,575,446.03
The Board of Directors proposes to the General Meeting that the General Meeting authorise the Board of Directors to decide, at its discretion, on the payment of dividend up to Finnlines Plc’s result for the reporting period in 2016.
Naples, 23 February 2017
Jon-Aksel Torgersen Chairman of the Board
Christer Backman Tiina Bäckman
Gianluca Grimaldi
Diego Pacella
Olav K. Rakkenes
Emanuele Grimaldi President and CEO
THE AUDITOR’S NOTE Our auditor’s report has been issued today. Helsinki, 23 February 2017 KPMG Oy Ab Kimmo Antonen Authorized Public Accountant
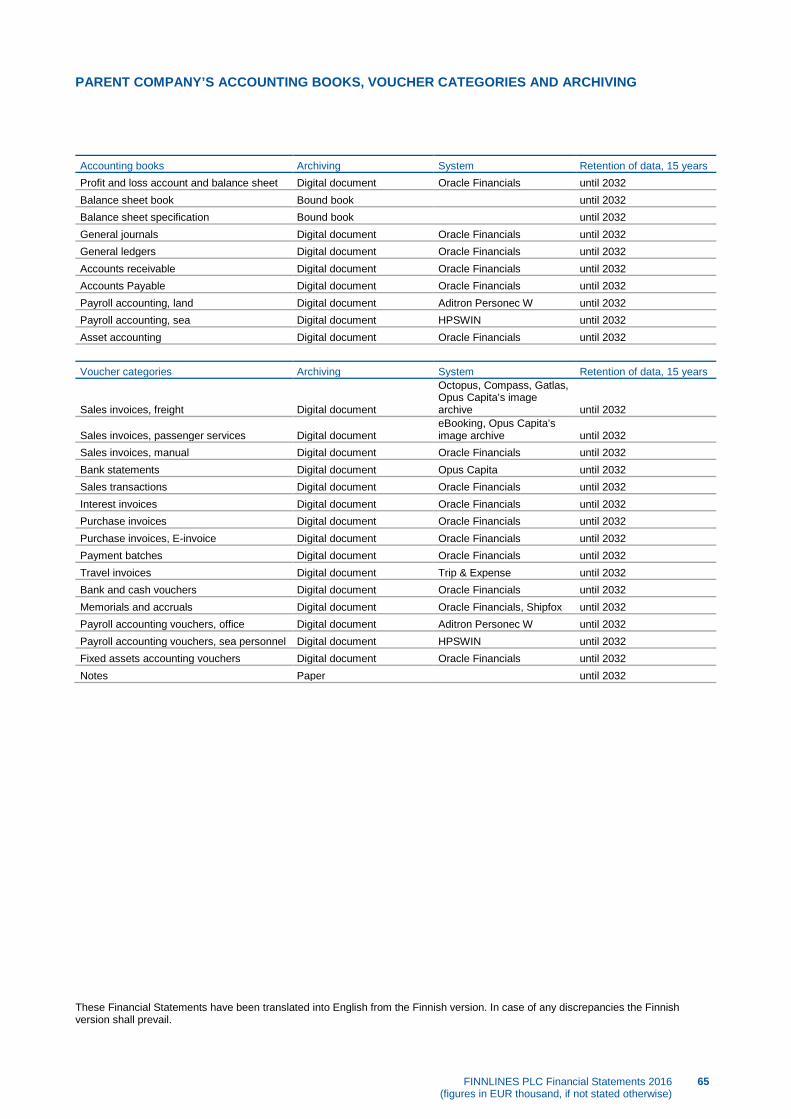
FINNLINES PLC Financial Statements 2016 (figures in EUR thousand, if not stated otherwise)
65
PARENT COMPANY’S ACCOUNTING BOOKS, VOUCHER CATEGORIES AND ARCHIVING
Accounting books Archiving System Retention of data, 15 years Profit and loss account and balance sheet Digital document Oracle Financials until 2032 Balance sheet book Bound book until 2032 Balance sheet specification Bound book until 2032 General journals Digital document Oracle Financials until 2032 General ledgers Digital document Oracle Financials until 2032 Accounts receivable Digital document Oracle Financials until 2032 Accounts Payable Digital document Oracle Financials until 2032 Payroll accounting, land Digital document Aditron Personec W until 2032 Payroll accounting, sea Digital document HPSWIN until 2032 Asset accounting Digital document Oracle Financials until 2032
Voucher categories Archiving System Retention of data, 15 years
Sales invoices, freight Digital document
Octopus, Compass, Gatlas, Opus Capita’s image archive until 2032
Sales invoices, passenger services Digital document eBooking, Opus Capita’s image archive until 2032
Sales invoices, manual Digital document Oracle Financials until 2032 Bank statements Digital document Opus Capita until 2032 Sales transactions Digital document Oracle Financials until 2032 Interest invoices Digital document Oracle Financials until 2032 Purchase invoices Digital document Oracle Financials until 2032 Purchase invoices, E-invoice Digital document Oracle Financials until 2032 Payment batches Digital document Oracle Financials until 2032 Travel invoices Digital document Trip & Expense until 2032 Bank and cash vouchers Digital document Oracle Financials until 2032 Memorials and accruals Digital document Oracle Financials, Shipfox until 2032 Payroll accounting vouchers, office Digital document Aditron Personec W until 2032 Payroll accounting vouchers, sea personnel Digital document HPSWIN until 2032 Fixed assets accounting vouchers Digital document Oracle Financials until 2032 Notes Paper until 2032
These Financial Statements have been translated into English from the Finnish version. In case of any discrepancies the Finnish version shall prevail.

AUDITOR’S REPORT
This document is an English translation of the Finnish auditor’s report. Only the Finnish version of the report is legally binding. TO THE ANNUAL GENERAL MEETING OF FINNLINES OYJ REPORT ON THE AUDIT OF THE FINANCIAL STATEMENTS OPINION We have audited the financial statements of Finnlines Oyj (business identity code 0201153-9) for the year ended 31 December, 2016. The financial statements comprise the consolidated balance sheet, statement of comprehensive income, statement of changes in equity, statement of cash flows and notes, including a summary of significant accounting policies, as well as the parent company’s balance sheet, income statement, statement of cash flows and notes. In our opinion - the consolidated financial statements give a true and fair view of the group’s financial performance, financial position and cash flows
in accordance with International Financial Reporting Standards (IFRS) as adopted by the EU - the financial statements give a true and fair view of the parent company’s financial performance and financial position in accordance
with the laws and regulations governing the preparation of financial statements in Finland and comply with statutory requirements. BASIS FOR OPINION We conducted our audit in accordance with good auditing practice in Finland. Our responsibilities under good auditing practice are further described in the Auditor’s Responsibilities for the Audit of the Financial Statements section of our report. We are independent of the parent company and of the group companies in accordance with the ethical requirements that are applicable in Finland and are relevant to our audit, and we have fulfilled our other ethical responsibilities in accordance with these requirements. We believe that the audit evidence we have obtained is sufficient and appropriate to provide a basis for our opinion. RESPONSIBILITIES OF THE BOARD OF DIRECTORS AND THE MANAGING DIRECTOR FOR THE FINANCIAL STATEMENTS The Board of Directors and the Managing Director are responsible for the preparation of consolidated financial statements that give a true and fair view in accordance with International Financial Reporting Standards (IFRS) as adopted by the EU, and of financial statements that give a true and fair view in accordance with the laws and regulations governing the preparation of financial statements in Finland and comply with statutory requirements. The Board of Directors and the Managing Director are also responsible for such internal control as they determine is necessary to enable the preparation of financial statements that are free from material misstatement, whether due to fraud or error. In preparing the financial statements, the Board of Directors and the Managing Director are responsible for assessing the parent company’s and the group’s ability to continue as a going concern, disclosing, as applicable, matters relating to going concern and using the going concern basis of accounting. The financial statements are prepared using the going concern basis of accounting unless there is an intention to liquidate the parent company or the group or cease operations, or there is no realistic alternative but to do so. AUDITOR’S RESPONSIBILITIES FOR THE AUDIT OF THE FINANCIAL STATEMENTS Our objectives are to obtain reasonable assurance on whether the financial statements as a whole are free from material misstatement, whether due to fraud or error, and to issue an auditor’s report that includes our opinion. Reasonable assurance is a high level of assurance, but is not a guarantee that an audit conducted in accordance with good auditing practice will always detect a material misstatement when it exists. Misstatements can arise from fraud or error and are considered material if, individually or in aggregate, they could reasonably be expected to influence the economic decisions of users taken on the basis of the financial statements. As part of an audit in accordance with good auditing practice, we exercise professional judgment and maintain professional skepticism throughout the audit. We also: - Identify and assess the risks of material misstatement of the financial statements, whether due to fraud or error, design and perform
audit procedures responsive to those risks, and obtain audit evidence that is sufficient and appropriate to provide a basis for our opinion. The risk of not detecting a material misstatement resulting from fraud is higher than for one resulting from error, as fraud may involve collusion, forgery, intentional omissions, misrepresentations, or the override of internal control.
- Obtain an understanding of internal control relevant to the audit in order to design audit procedures that are appropriate in the circumstances, but not for the purpose of expressing an opinion on the effectiveness of the parent company’s or the group’s internal control.
- Evaluate the appropriateness of accounting policies used and the reasonableness of accounting estimates and related disclosures made by management.
- Conclude on the appropriateness of the Board of Directors’ and the Managing Director’s use of the going concern basis of accounting and based on the audit evidence obtained, whether a material uncertainty exists related to events or conditions that may cast significant doubt on the parent company’s or the group’s ability to continue as a going concern. If we conclude that a material uncertainty exists, we are required to draw attention in our auditor’s report to the related disclosures in the financial statements or, if such disclosures are inadequate, to modify our opinion. Our conclusions are based on the audit evidence obtained up to the date of our auditor’s report. However, future events or conditions may cause the parent company or the group to cease to continue as a going concern.
- Evaluate the overall presentation, structure and content of the financial statements, including the disclosures, and whether the financial statements represent the underlying transactions and events so that the financial statements give a true and fair view.
- Obtain sufficient appropriate audit evidence regarding the financial information of the entities or business activities within the group to express an opinion on the consolidated financial statements. We are responsible for the direction, supervision and performance of the group audit. We remain solely responsible for our audit opinion.
- We communicate with those charged with governance regarding, among other matters, the planned scope and timing of the audit and significant audit findings, including any significant deficiencies in internal control that we identify during our audit.

OTHER REPORTING REQUIREMENTS OTHER INFORMATION The Board of Directors and the Managing Director are responsible for the other information. The other information comprises information included in the report of the Board of Directors. Our opinion on the financial statements does not cover the other information. In connection with our audit of the financial statements, our responsibility is to read the information included in the report of the Board of Directors and, in doing so, consider whether the information included in the report of the Board of Directors is materially inconsistent with the financial statements or our knowledge obtained in the audit, or otherwise appears to be materially misstated. Our responsibility also includes considering whether the report of the Board of Directors has been prepared in accordance with the applicable laws and regulations. In our opinion, the information in the report of the Board of Directors is consistent with the information in the financial statements and the report of the Board of Directors has been prepared in accordance with the applicable laws and regulations. If, based on the work we have performed, we conclude that there is a material misstatement in the information included in the report of the Board of Directors, we are required to report this fact. We have nothing to report in this regard. OTHER OPINIONS We support that the financial statements should be adopted. The proposal by the Board of Directors regarding the use of the profit shown in the balance sheet is in compliance with the Limited Liability Companies Act. We support that the Members of the Board of Directors and the Managing Director should be discharged from liability for the financial period audited by us. Helsinki, 23 February 2017 KPMG Oy Ab Kimmo Antonen Authorized Public Accountant

Finnlines Plc
Komentosilta 1, 00980 Helsinki, Finland
PL 197, 00181 HELSINKI, Finland
Phone +358 10 343 50
www.finnlines.com


