42
Report on Financial Statements
| Date post: | 09-Dec-2015 |
| Category: |
Documents |
| Upload: | blaahkugan-kun |
| View: | 50 times |
| Download: | 5 times |

Report on Financial Statements and financial position of Reliance Industries Ltd.

Prepared by : Sumeet BaidJonny PaulSamyak JainPranav Garg
Batch: PGP Mumbai2014-2016
Report on Financial Statements and financial position of Reliance Industries Ltd.
Sumeet Baid 55Jonny Paul 22Samyak Jain 43Pranav Garg 40
PGP Mumbai2014-2016
Reliance Industries Ltd.

Company >> Finance >> Balance SheetReliance Industries Ltd
Industry :Refineries(Rs in Crs)
3,232.00 1.13 3,229.00 1.28193,842.00 67.53 176,766.00 70.02
0 0.00 0 0.0017 0.01 25 0.01
197,091.00 68.66 180,020.00 71.3111,203.00 3.90 6,626.00 2.6278,765.00 27.44 65,801.00 26.0789,968.00 31.34 72,427.00 28.69
0 0.00 0 0.00287,059.00 100.00 252,447.00 100.00287,059.00222,565.00 77.53 213,154.00 84.44113,159.00 39.42 103,406.00 40.96
0 0.00 0 0.00109,406.00 38.11 109,748.00 43.47
0 0.00 0 0.0041,716.00 14.53 19,116.00 7.5786,062.00 29.98 52,509.00 20.80
0.00 0.0042,932.00 14.96 42,729.00 16.9310,664.00 3.71 11,880.00 4.7136,624.00 12.76 49,547.00 19.6311,743.00 4.09 11,454.00 4.54
101,963.00 35.52 115,610.00 45.800.00 0.00
64,142.00 22.34 49,523.00 19.624,167.00 1.45 4,348.00 1.72
68,309.00 23.80 53,871.00 21.3433,654.00 11.72 61,739.00 24.46
0 0.00 0 0.00161 0.06 100 0.04
12,376.00 4.31 12,293.00 4.87-12,215.00 -4.26 -12,193.00 -4.8328,436.00 9.91 21,528.00 8.53
287,059.00 100.00 252,447.00 100.0050,645.00 17.64 47,403.00 18.78
Year Mar 14 Mar 13 SOURCES OF FUNDS : Share Capital Reserves Total Equity Share Warrants Equity Application Money Total Shareholders Funds Secured Loans Unsecured Loans Total Debt Other Liabilities Total Liabilities APPLICATION OF FUNDS : Gross Block Less : Accumulated Depreciation Less:Impairment of Assets Net Block Lease Adjustment Capital Work in Progress Investments Current Assets, Loans & Advances Inventories Sundry Debtors Cash and Bank Loans and Advances Total Current Assets Less : Current Liabilities and Provisions Current Liabilities Provisions Total Current Liabilities Net Current Assets Miscellaneous Expenses not written off Deferred Tax Assets Deferred Tax Liability Net Deferred Tax Other Assets Total Assets Contingent Liabilities http://www.capitaline.com

3,271.00 1.39 3,273.00 1.49 3,270.37 1.64 1,642.78 0.82162,825.00 69.42 148,267.00 67.65 133,900.24 67.06 124,730.19 62.28
0 0.00 0 0.00 0 0.00 0 0.001 0.00 10 0.00 1.36 0.00 1.42 0.00
166,097.00 70.82 151,550.00 69.15 137,171.97 68.70 126,374.39 63.1010,013.00 4.27 10,104.00 4.61 11,670.50 5.84 10,697.92 5.3458,434.00 24.91 57,499.00 26.24 50,824.19 25.45 63,206.56 31.5668,447.00 29.18 67,603.00 30.85 62,494.69 31.30 73,904.48 36.90
0 0.00 0 0.00 0 0.00 0 0.00234,544.00 100.00 219,153.00 100.00 199,666.66 100.00 200,278.87 100.00
205,493.00 87.61 221,253.00 100.96 215,864.71 108.11 149,628.70 74.7191,770.00 39.13 78,546.00 35.84 62,604.82 31.35 49,285.64 24.61
0 0.00 0 0.00 0 0.00 0 0.00113,723.00 48.49 142,707.00 65.12 153,259.89 76.76 100,343.06 50.10
0 0.00 0 0.00 0 0.00 0 0.007,754.00 3.31 12,228.00 5.58 12,138.82 6.08 69,043.83 34.47
54,008.00 23.03 37,652.00 17.18 23,228.62 11.63 21,606.49 10.790.00 0.00 0.00 0.00
35,955.00 15.33 29,825.00 13.61 26,981.62 13.51 14,836.72 7.4118,424.00 7.86 17,442.00 7.96 11,660.21 5.84 4,571.38 2.2839,598.00 16.88 27,135.00 12.38 13,462.65 6.74 22,176.53 11.0711,338.00 4.83 7,032.00 3.21 10,274.62 5.15 13,127.64 6.55
105,315.00 44.90 81,434.00 37.16 62,379.10 31.24 54,712.27 27.320.00 0.00 0.00 0.00
44,216.00 18.85 49,403.00 22.54 36,848.04 18.45 32,689.58 16.324,258.00 1.82 4,601.00 2.10 3,565.43 1.79 3,010.90 1.50
48,474.00 20.67 54,004.00 24.64 40,413.47 20.24 35,700.48 17.8356,841.00 24.23 27,430.00 12.52 21,965.63 11.00 19,011.79 9.49
0 0.00 0 0.00 0 0.00 0 0.0085 0.04 181 0.08 242.95 0.12 247.51 0.12
12,207.00 5.20 11,743.00 5.36 11,169.25 5.59 9,973.81 4.98-12,122.00 -5.17 -11,562.00 -5.28 -10,926.30 -5.47 -9,726.30 -4.8614,340.00 6.11 10,698.00 4.88 0 0.00 0 0.00
234,544.00 100.00 219,153.00 100.00 199,666.66 100.00 200,278.87 100.0045,104.00 19.23 48,700.68 22.22 17,650.06 8.84 19,278.00 9.63
Mar 12 Mar 11 Mar 10 Mar 09

1,453.39 1.23 1,453.35 1.58 1,393.17 1.94 1,393.09 2.3578,312.81 66.41 62,513.78 68.10 48,411.09 67.55 39,010.23 65.91
1,682.40 1.43 0 0.00 0 0.00 0 0.000 0.00 0 0.00 0 0.00 0 0.00
81,448.60 69.07 63,967.13 69.69 49,804.26 69.49 40,403.32 68.266,600.17 5.60 9,569.12 10.42 7,664.90 10.69 7,972.90 13.47
29,879.51 25.34 18,256.61 19.89 14,200.71 19.81 10,811.69 18.2736,479.68 30.93 27,825.73 30.31 21,865.61 30.51 18,784.59 31.74
0 0.00 0 0.00 0 0.00 0 0.00117,928.28 100.00 91,792.86 100.00 71,669.87 100.00 59,187.91 100.00
104,229.10 88.38 99,532.77 108.43 84,970.13 118.56 55,125.82 93.1442,345.47 35.91 35,872.31 39.08 29,253.38 40.82 24,872.83 42.02
0 0.00 0 0.00 0 0.00 0 0.0061,883.63 52.48 63,660.46 69.35 55,716.75 77.74 30,252.99 51.11
0 0.00 0 0.00 0 0.00 0 0.0023,005.84 19.51 7,528.13 8.20 6,957.79 9.71 4,829.29 8.1622,063.60 18.71 16,251.34 17.70 5,846.18 8.16 17,051.46 28.81
0.00 0.00 0.00 0.0014,247.54 12.08 12,136.51 13.22 10,119.82 14.12 7,412.88 12.52
6,227.58 5.28 3,732.42 4.07 4,163.62 5.81 3,927.81 6.644,280.05 3.63 1,835.35 2.00 2,146.16 2.99 3,608.79 6.10
18,130.67 15.37 12,209.07 13.30 8,144.85 11.36 13,503.03 22.8142,885.84 36.37 29,913.35 32.59 24,574.45 34.29 28,452.51 48.07
0.00 0.00 0.00 0.0021,045.47 17.85 16,865.53 18.37 12,563.50 17.53 13,659.72 23.08
2,992.62 2.54 1,712.87 1.87 3,890.98 5.43 3,471.80 5.8724,038.09 20.38 18,578.40 20.24 16,454.48 22.96 17,131.52 28.9418,847.75 15.98 11,334.95 12.35 8,119.97 11.33 11,320.99 19.13
0 0.00 0 0.00 0 0.00 0 0.00310.53 0.26 297.64 0.32 121.7 0.17 366.64 0.62
8,183.07 6.94 7,279.66 7.93 5,092.52 7.11 4,633.46 7.83-7,872.54 -6.68 -6,982.02 -7.61 -4,970.82 -6.94 -4,266.82 -7.21
0 0.00 0 0.00 0 0.00 0 0.00117,928.28 100.00 91,792.86 100.00 71,669.87 100.00 59,187.91 100.00
24,308.69 20.61 28,356.90 30.89 18,339.06 25.59 9,153.89 15.47
Mar 08 Mar 07 Mar 06 Mar 05

Company >> Finance >> Profit & LossReliance Industries Ltd
Industry :Refineries(Rs in Crs)
401,302.00 100.67 371,119.00 99.8711,185.00 2.81 10,822.00 2.91
390,117.00 97.86 360,297.00 96.968,936.00 2.24 7,998.00 2.15
-412 -0.10 3,317.00 0.89398,641.00 100.00 371,612.00 100.00
0.00329,837.00 91.92 306,629.00 82.51
10,153.00 2.83 7,166.00 1.933,370.00 0.94 3,354.00 0.906,778.00 1.89 6,359.00 1.718,548.00 2.38 8,755.00 2.36
857 0.24 662 0.18715 0.20 98 0.03
358,828.00 100.00 332,827.00 89.5639,813.00 11.10 38,785.00 10.44
3,206.00 0.89 3,036.00 0.8236,607.00 10.20 35,749.00 9.62
8,789.00 2.45 9,465.00 2.5527,818.00 7.75 26,284.00 7.07
5,812.00 1.62 5,244.00 1.410 0.00 0 0.00
22 0.01 37 0.0121,984.00 6.13 21,003.00 5.65
1,810.53 0.50 1,286.52 0.3520,173.47 5.62 19,716.48 5.31
0 0.00 1,116.00 0.308,610.00 2.40 7,609.00 2.05
0 0.00 0 0.0021,268.00 5.93 21,118.00 5.68
9,326.00 2.60 8,610.00 2.322,793.00 0.78 2,628.00 0.71
0 0.00 0 0.0095 0.03 90 0.02
66.55 0.02 63.66 0.020.00 0.00
609.76 0.17 554.17 0.15
Year Mar 14(12) Mar 13(12) INCOME : Sales Turnover Excise Duty Net Sales Other Income Stock Adjustments Total Income EXPENDITURE : Raw Materials Power & Fuel Cost Employee Cost Other Manufacturing Expenses Selling and Administration Expenses Miscellaneous Expenses Less: Pre-operative Expenses Capitalised Total Expenditure Operating Profit Interest Gross Profit Depreciation Profit Before Tax Tax Fringe Benefit tax Deferred Tax Reported Net Profit Extraordinary Items Adjusted Net Profit Adjst. below Net Profit P & L Balance brought forward Statutory Appropriations Appropriations P & L Balance carried down Dividend Preference Dividend Equity Dividend % Earnings Per Share-Unit Curr Earnings Per Share(Adj)-Unit Curr Book Value-Unit Curr http://www.capitaline.com

339,792.00 100.84 258,651.00 101.65 200,399.79 100.77 146,328.07 101.249,888.00 2.93 10,481.00 4.12 7,938.77 3.99 4,369.07 3.02
329,904.00 97.90 248,170.00 97.53 192,461.02 96.78 141,959.00 98.226,192.00 1.84 3,052.00 1.20 2,460.32 1.24 2,148.40 1.49
872 0.26 3,243.00 1.27 3,947.89 1.99 427.56 0.30336,968.00 100.00 254,465.00 100.00 198,869.23 100.00 144,534.96 100.00
0.00 0.00 0.00 0.00276,255.00 81.98 194,698.00 76.51 150,915.03 75.89 107,010.32 74.04
4,094.00 1.21 2,255.00 0.89 2,706.71 1.36 3,355.98 2.322,862.00 0.85 2,624.00 1.03 2,307.73 1.16 2,357.40 1.636,309.00 1.87 6,600.00 2.59 5,578.24 2.80 3,704.00 2.566,925.00 2.06 6,807.00 2.68 5,549.74 2.79 4,619.24 3.20
749 0.22 333 0.13 -11.48 -0.01 1,379.92 0.9537 0.01 30 0.01 1,217.92 0.61 3,265.65 2.26
297,157.00 88.19 213,287.00 83.82 165,828.05 83.39 119,161.21 82.4439,811.00 11.81 41,178.00 16.18 33,041.18 16.61 25,373.75 17.56
2,667.00 0.79 2,328.00 0.91 1,997.21 1.00 1,745.23 1.2137,144.00 11.02 38,850.00 15.27 31,043.97 15.61 23,628.52 16.3511,394.00 3.38 13,608.00 5.35 10,496.53 5.28 5,195.29 3.5925,750.00 7.64 25,242.00 9.92 20,547.44 10.33 18,433.23 12.75
5,150.00 1.53 4,320.00 1.70 3,111.77 1.56 1,206.50 0.830 0.00 0 0.00 0 0.00 56.87 0.04
560 0.17 636 0.25 1,200.00 0.60 1,860.54 1.2920,040.00 5.95 20,286.00 7.97 16,235.67 8.16 15,309.32 10.59
1,233.53 0.37 224.22 0.09 187.8 0.09 40.61 0.0318,806.47 5.58 20,061.78 7.88 16,047.87 8.07 15,268.71 10.56
0 0.00 0.55 0.00 0 0.00 0 0.006,514.00 1.93 4,999.45 1.96 5,384.19 2.71 4,363.29 3.02
0 0.00 0 0.00 0 0.00 0 0.0018,945.00 5.62 18,772.00 7.38 16,620.41 8.36 14,288.42 9.89
7,609.00 2.26 6,514.00 2.56 4,999.45 2.51 5,384.19 3.732,531.00 0.75 2,385.00 0.94 2,084.67 1.05 1,897.05 1.31
0 0.00 0 0.00 0 0.00 0 0.0085 0.03 80 0.03 70 0.04 130 0.09
60.01 0.02 60.8 0.02 48.59 0.02 95.24 0.070.00 0.00 0.00 0.00
498.22 0.15 446.3 0.18 392.51 0.20 727.78 0.50
Mar 12(12) Mar 11(12) Mar 10(12) Mar 09(12)
139,269.46 100.52 118,353.71 104.89 89,124.46 106.49 73,164.10 109.20365,463.68 3.94 6,654.68 5.90 8,246.67 9.85 7,245.27 10.81418
133,805.78 96.57 111,699.03 99.00 80,877.79 96.64 65,918.83 98.389466,615.62 4.77 478.28 0.42 682.92 0.82 1,603.38 2.393181
-1,867.16 -1.35 654.6 0.58 2,131.19 2.55 -524.35 -0.782637138,554.24 100.00 112,831.91 100.00 83,691.90 100.00 66,997.86 100
0.00 0.00 0.00 096,311.56 69.51 78,692.94 69.74 58,342.31 69.71 45,931.87 68.55722
2,052.84 1.48 2,261.69 2.00 1,146.26 1.37 907.94 1.3551782,049.95 1.48 2,045.95 1.81 932.09 1.11 791.21 1.1809483,951.40 2.85 3,486.87 3.09 2,217.72 2.65 1,937.13 2.8913314,882.01 3.52 5,342.31 4.73 5,765.46 6.89 2,826.38 4.218612
547.3 0.40 588.85 0.52 461.19 0.55 352.09 0.525524175.46 0.13 111.21 0.10 155.14 0.19 9.6 0.014329
109,619.60 79.12 92,307.40 81.81 68,709.89 82.10 52,737.02 78.7144828,934.64 20.88 20,524.51 18.19 14,982.01 17.90 14,260.84 21.28552
1,077.36 0.78 1,188.89 1.05 877.04 1.05 1,468.66 2.192127,857.28 20.11 19,335.62 17.14 14,104.97 16.85 12,792.18 19.09342
4,847.14 3.50 4,815.15 4.27 3,400.91 4.06 3,723.50 5.5576423,010.14 16.61 14,520.47 12.87 10,704.06 12.79 9,068.68 13.53578
2,604.96 1.88 1,617.10 1.43 900 1.08 705 1.05227247 0.03 40.34 0.04 30.72 0.04 0 0
899.89 0.65 919.63 0.82 704 0.84 792 1.18212719,458.29 14.04 11,943.40 10.59 9,069.34 10.84 7,571.68 11.30138
4,111.75 2.97 -312.17 -0.28 74.91 0.09 31.94 0.04767315,346.54 11.08 12,255.57 10.86 8,994.43 10.75 7,539.74 11.2537
48.1 0.03 0.51 0.00 0 0.00 -4.17 -0.0062242,765.37 2.00 3,029.09 2.68 8,967.86 10.72 5,592.06 8.346625
0 0.00 0 0.00 0 0.00 0 017,908.47 12.93 12,207.63 10.82 15,008.11 17.93 4,191.71 6.256483
4,363.29 3.15 2,765.37 2.45 3,029.09 3.62 8,967.86 13.385291,631.24 1.18 1,440.44 1.28 1,393.51 1.67 1,045.13 1.559945
0 0.00 0 0.00 0 0.00 0 0130 0.09 110 0.10 100 0.12 75 0.111944
131.97 0.10 84.28 0.07 63.7 0.08 53.3 0.0795550.00 0.00 0.00 0
542.83 0.39 439.67 0.39 324.11 0.39 270.43 0.40364
Mar 08(12) Mar 07(12) Mar 06(12) Mar 05(12)

Solvency position
Interest Coverage Ratio
Comment
Debt equity Ratio
Comment
Capital Gearing Ratio
Comment
Solvency position of a company is measured by the solvency ratios such as Interest Coverage Ratio, Debt-Equity Ratio, Total Solvency position of a company is measured by the solvency ratios such as Interest Coverage Ratio, Debt-Equity Ratio, Total Assets to Debt Ratio etc. These ratios are used by money lenders and investors to check whether the company will be able to repay the loan or not
Interst Coverage Ratio = EBIT / Interest Expenses
Interest Coverage Ratio measures the number of times a company could make the interest
payments on its debt with its EBIT. It determines how easily a company can pay interest expenses on outstanding debt. RIL has a good Interest Coverage Ratio which
means that it is solvent enough to pay off its interest expenses on its outstanding
debtSince the current ratio of Reliance Industries Limited is very close to Rs. 1.5, we
can say that the company is in a good position to pay off its short term liabilities
Debt Equity Ratio = Long term Debt / Shareholders funds
As the value of the acid-test ratio is less than but close to 1, the company is stable in paying
off its short term obligations in time
Capital geraring ratio = Long term debt+ Preference share holders/ Equity Share
holders Fund
Since deployment of debt is cheaper than equity as interst on debt is tax deductable,
unlike dividend on equity shares which attract corporate dividend tax. Deployment of debt in
the capital structure of the company incereases EPS. RIL has don e the same thing
by deploying more of debt and thereby increasing EPS. It is visible in increse of
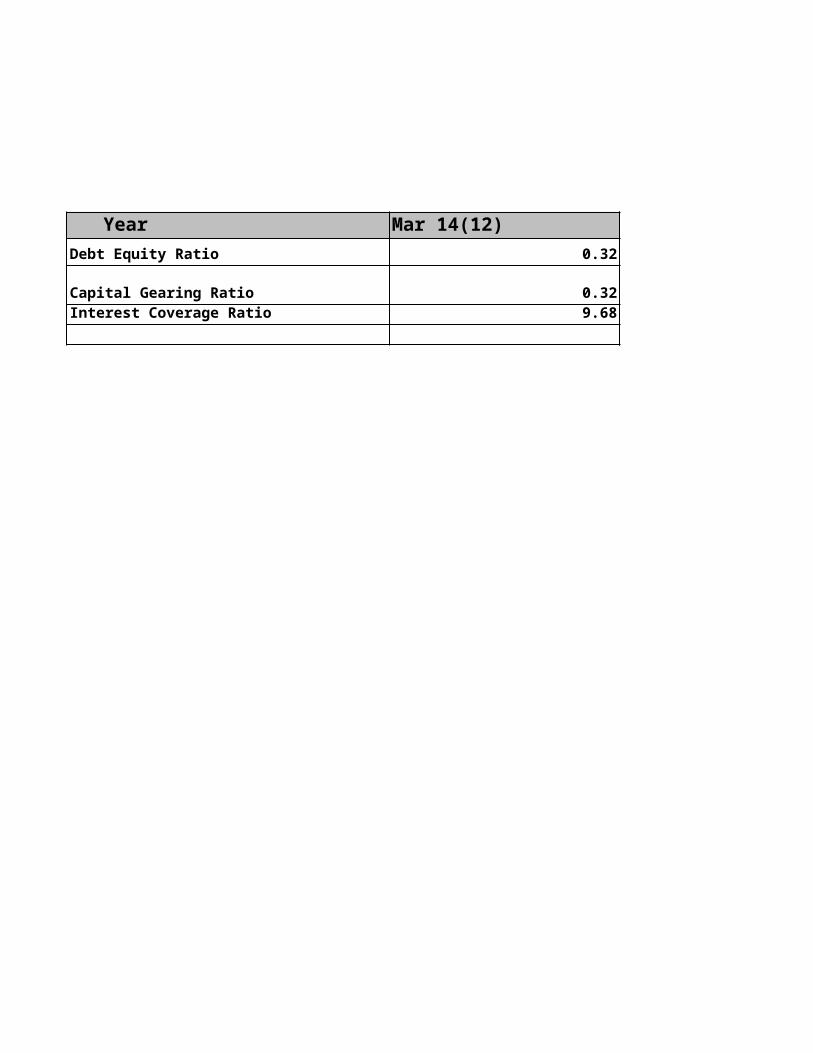
Capital Gearing Ratio from 0.24 to 0.32

Interest Coverage Ratio
Comment
Interst Coverage Ratio= EBIT/Interest expense
It measures the number of times by which interest expense of the company is covered by
the earnings of the company. In RIL, interst coverage ratio is 9.68 which signifies that the earnings are 9.68 times the interest obligatipn
which in turn implieas that the company is financially fit to serve its interest obligations.

Debt Equity Ratio
Capital Gearing RatioInterest Coverage Ratio
Year

0.32 0.24
0.32 0.249.68 9.66
Mar 14(12) Mar 13(12)

Liquidity position
Quick Ratio
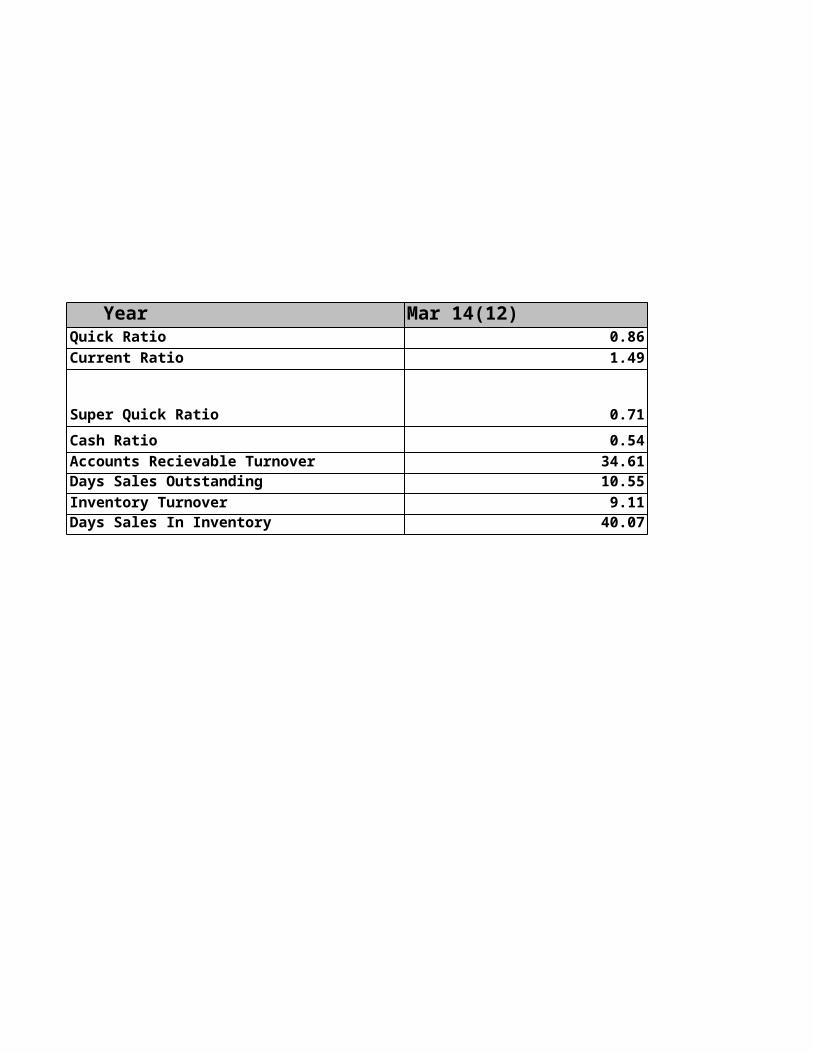
Acid-Test Ratio = 0.86
Comment
Current Ratio
Current Ratio = Current Assets / Current Liabilities
Comment
Super Quick Ratio
Comment
Cash Ratio
Comment
Liquidity ratios are the ratios that measure the ability of a company to meet its short term debt obligations. These ratios measure the ability of a company to pay off its short-term liabilities when they fall due. The liquidity ratios are a result of dividing cash and other liquid assets by the short term borrowings and current liabilities. They show the number of times the short term debt obligations are covered by the cash and liquid assets. If the value is greater than 1, it means the short term obligations are fully covered. Generally, the higher the liquidity ratios are, the higher the margin of safety that the company poses to meet its current liabilities. Liquidity ratios greater than 1 indicate that the company is in good financial health and it is less likely fall into financial difficulties.
Acid-Test Ratio = (Current Assets - Inventory) / Current Liabilities
As the value of the acid-test ratio is less than but close to 1, the company is stable in paying off its short term
obligations in time
Ideally, Current ratio should be 2, while Current Ratio value of 1.5 is also acceptable. It implies that to pay off a current liability of Re. 1, the company has a current asset of Rs. 1.5. Since the current ratio of Reliance Industries Limited is very close to Rs. 1.5, we can say that the company is in a good
position to pay off its short term liabilities
Super Quick Ratio= (Current Assets- Inventory - Receivables)/Current Liabilities
While the super quick ratio has decreased from 1.13 to 0.71, so the ability to pay off highly liquid assets for current
liabilities has decreased which is not a favourable sign.
Cash Ratio= Cash + Marketable Securities/Current Liabilities
Accounts Recievable urnover
Comment
Days Sales Outstanding
Comment
Inventory Turnover
Inventory Turnover= Net sales/Average Inventory
Comment
Days Sales In InventoryDays Sales In Inventory=365/Inventory Turnover
Comment
Since the Cash Ratio is applicable to very high liquid assets, the fall in its value to almost half has been phenomenal
and thus hampering cash flow for the company.
Accounts Recievable Turnover=Net Credit Sales/Average Debtors
As the Accounts Receivable turnover has increased from 23.78 to 34.61 which shows that the debtors have paid
more debt compared to last year and is a positive sign for the company.
Days Sales Outstanding= 365/Accounts Recievable Turnover
As the Days Sales Outstanding has decreased from the past year, so it shows that at the end of the day, the amount which remains to be sold has decreased by almost one
third;again a good sign for the company.
The inventory turnover is almost the same with a very slight decrease in it value which is not very significant. A high
Inventory Turnover is favourable as it shows inventories are getting converted to sales faster.
Likewise, the day sales in inventory doesn’t show appreciable changes apart from the fact that it shows a
slight increase in the inventory that is left at the end of the day. It is suppose to be as low as possible.

Quick RatioCurrent Ratio
Super Quick Ratio
Cash RatioAccounts Recievable TurnoverDays Sales OutstandingInventory TurnoverDays Sales In Inventory
Year

0.86 1.351.49 2.15
0.71 1.13
0.54 0.9234.61 23.7810.55 15.35
9.11 9.1640.07 39.86
Mar 14(12) Mar 13(12)

ROE 10.70 11.39ROA(%) 7.48 8.10Profit 30795.00 30505.00Capital Employed 287059.00 252447.00ROI(%) 10.73 12.08
ROI
ROI = Net Profit after Interest and Tax / Total Investment
Comment
Year Mar 14(12) Mar 13(12)
Return on Investment(ROI) is performane measure used to evaluate the efficiency of investment. It is one of the most commonly used appoaches for evaluating the feasibility and viability of investment.
RIL has an ROI of 10.73 % which means that on every 100 Rupees of investment, it is earning Rs. 10.73. But ROI has fallen from 12.08% in the previous year to 10.73% in the current year which shows worse utilisation of invested funds
Profitability Position
Net Profit Ratio Return On Capital Employed
Comment Comment
Gross Profit Ratio Price Earning Ratio
Comment Comment
Operating Profit Ratio Return On Equity(ROE)
ROE=PAT/Shareholders' Equity
Comment
Return On Total Assets
Profitability position of a company is measured by the profitability ratios such as Net Profit Ratio, Return on Capital Employed etc.
Net Profit Ratio = (Net profit after tax * 100/ Net
Sales)
Return On Capital Employed =(EBIT * 100 / Total Capital)
Net Profit Ratio of 5.03% is higher than other firms in petrochemicals industry
which varies from 0.83% to 3.45%. It means that the company is earning good profit as a percentage of
sales revenue
Net Profit Ratio of 5.03% is higher than other firms in petrochemicals industry which varies from 0.83%
to 3.45%. It means that the company is earning good profit as a
percentage of sales revenue
GrossProfit Ratio = (Gross Profit * 100/ Net
Sales)
Price Earning Ratio= Market Price/Earning per Share
Net Profit Ratio of 5.03% is higher than other firms in petrochemicals industry
which varies from 0.83% to 3.45%. It means that the company is earning good profit as a percentage of
sales revenue
The P/E ratio is a valuation ratio of a company's current price per
share compared to its earnings per share.A higher P/E ratio means that the market is more willing to pay for the earnings of the company
which is the case here.
Operating Profit Ratio = EBIT*100/Sales
Operating Ratio indicates how much profit a company
makes after paying for variable cost of production
such as wages, raw materials etc. Since it has fallen as compared to the
previous year, it means the profitability of the company
has come down
It measures the efficiency of utilisation of shareholder's fund. There hasn’t been a significant
change in it but it has decreased slightly and a decrease in ROE is
not favourable s it shows that shareholder's equity is not getting
properly utilised.

Return On Total Assets=EBIT*100/Total
Assets
Return on Assets (ROA) is a financial ratio that shows the
percentage ofprofit that a company earns in relation to its overall resources. It has decreased from last
year.

Net Profit Ratio 5.03 5.31Return On Capital Employed 11.94 20.36
Gross profit Ratio 11.111794666728 11.1416414791Price Earning RatioOperating Ratio 7.9524860490571 8.13773081652
Return on Equity 10.235611976194 10.9523830685Return on Total Assets 8.7301051304563 9.57175223134
Year Mar 14(12) Mar 13(12)
Price to Sales Ratio
Comment
Price to Book Value
Comment
Price to Earnings
Comment
Price To Sales ratio= Market Capitalisation/ Net Sales
This ratio implies the amount whiich investor has to invest for unit of sales
revenue. Aratio lower than 1 is cosidered one. Since RIL s Price to Sales ratio
is .64, the investor has to invest Rs. 64 per unit of sales revenue
Price to Book Value=Market Price/Book Value Price
This is the ratio between market value and intrinsic value of a share.a ratio
more than one implies that investors are optimistic abut the growth of the
company in the future. Price to Book Value of RIL is 1.52, which shows the
optimism of the investors and positive sentiments in the market about the
company
Price to Earnings=Market Price per share/Earnings per share
It is the ratio between market value of a share and the earning per share. Hogher the PE ratio, better it is. RILs PE ratio of
13.97 again signifies the positive sentiment in the market.

Price to sales 0.64 0.70
Price to Book Value 1.52 1.40Price to Earning 13.97 12.22
No of shares in current year 3231901858
No of shares in previous year 3228663382Book Value/Share 609.83 557.57Market Price 929.50 778.15
Year Mar 14 Mar 13

Economic Value Added = NOPAT-Cost of Capital Mar-14 Mar-13
NOPAT (Net Operating Profit After Tax)+ Profit After Tax + Finance Cost 23,379.47 22,752.48Cost of Capital Assumed to be 12%
Capital employed = Shareholders Funds + Long term Borrowings 259,802.00 242,731.00EVA -7,796.77 -6,375.24

Market Value Added= Market Capitalisation-Book Value of Capital Employed
Mar-14 Mar-131033142777011 7.1218E+11

Comment on overall performance of the company
Solvency position of Reliance Industries Limited is good because of low share of debt funds in the capital structure and high interest coverage ratio which in turn signifies that the company is financially stable to pay of its interest obligation as and when they fall due. But as far as the liquidity is concerned, a quick ratio less than one impies that the liquid assets are not sufficient to satisfy the current liabilities. An analysis of debtors turnover ratio tells us that the average collection period has fallen down from 15.35 in the previous
year to 10.55 in the current year. Which means the company is now able to convert its debtors into cash with a greater efficiency. ROI has fallen from 12.08% in the previous year to 10.73% in the current year which shows worse utilisation of invested funds.
Return on Equity as well as Return on assets has fallen down significantly, which in turn shows the worse utilisation of funds. But still the market sentiments are positive toward the company and investors are optimistic about the growth of the company. It can be
observed from price to book value ratio of 1.52 as well as price to earning ratio at 13.97. As the CFO of the company, I would advice the company to concentrate on the operational efficiency of the company by putting more efforts to increase the sales revenue or
increase profitability by pairing some indirect expenses.


