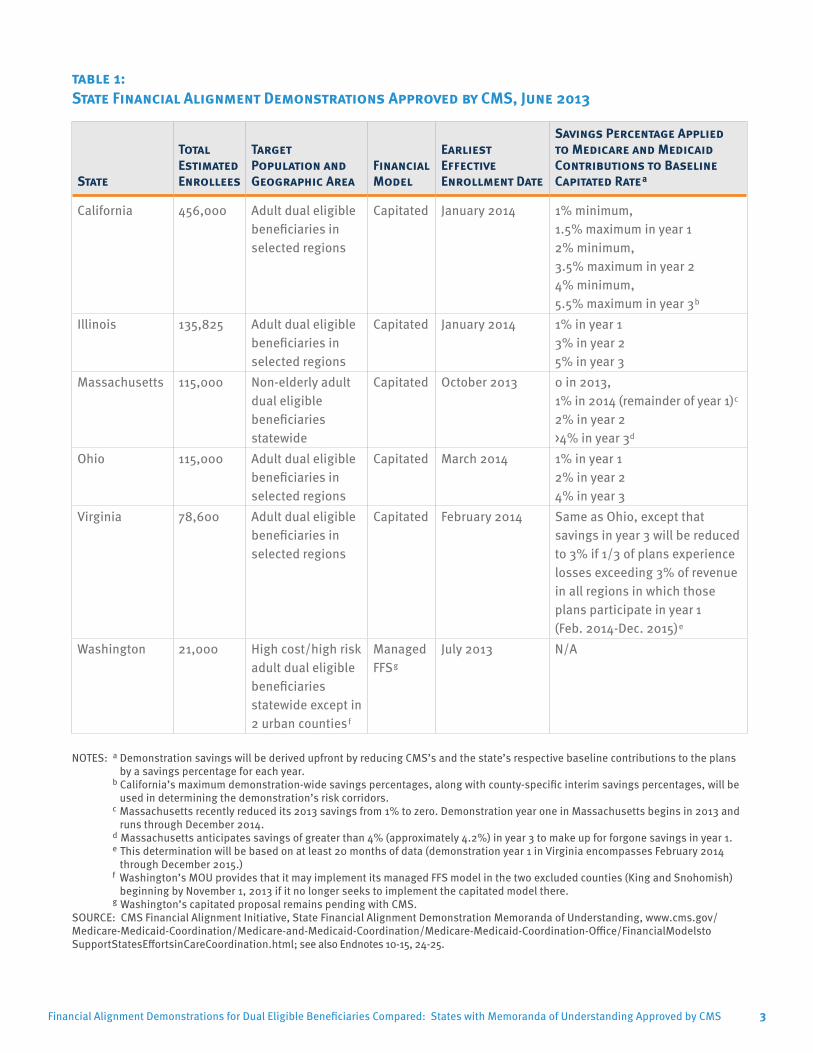
issue brief Financial Alignment Demonstrations for Dual Eligible Beneficiaries Compared: States with Memoranda of Understanding Approved by CMS July 2013 The Centers for Medicare and Medicaid Services (CMS) has finalized memoranda of understanding (MOUs) with California, Illinois, Massachusetts, Ohio, and Virginia to test a capitated model and with Washington to test a managed fee-for-service (FFS) model to integrate care and align financing for people who are dually eligible for Medicare and Medicaid. 1 Washington’s proposal to test a capitated model, along with proposals from 15 other states, is pending with CMS (Figure 1). These three year demonstrations, to be implemented beginning in 2013, will introduce changes in the care delivery systems through which beneficiaries presently receive services. The demon- strations also change the payment approach and financing arrangements among CMS, the state, and providers. This issue brief compares key provi- sions of the approved demonstrations. Dual eligible beneficiaries include seniors and non-elderly people with significant disabilities, some of whom are among the poorest and sick- est beneficiaries covered by either Medicare or Medicaid. The predomi- nant existing service delivery models for these beneficiaries typically involve Figure 1 State demonstration proposals to integrate care and align financing for dual eligible beneficiaries, June 2013 Proposal pending with CMS (15 states and WA’s capitated proposal) WA* OR WY UT TX SD OK* ND NM NV NE MT LA KS ID HI* CO* CA AR AZ AK WI WV VA TN SC OH NC* MO* MS MN MI KY IA* IN IL GA FL AL VT PA NY* NJ NH MA ME CT* DE RI MD DC MOU signed with CMS to implement demonstration (6 states) Proposal submitted, will not pursue financial alignment but may pursue other administrative or programmatic alignment (2 states) Proposal withdrawn (3 states) Not participating in demonstration (24 states and DC) NOTES: *CO, CT, IA, MO, and NC proposed managed FFS models. NY, OK, and WA proposed both capitated and managed FFS models; however, NY has withdrawn its managed FFS proposal. All other states proposed capitated models. WA’s MOU is for its managed FFS model only; its capitated proposal remains pending with CMS. HI’s proposal remains pending, but it does not anticipate implementation in 2014. SOURCE: CMS Financial Alignment Initiative, State Financial Alignment Proposals, www.cms.gov/ Medicare-Medicaid-Coordination/Medicare-and-Medicaid-Coordination/Medicare-Medicaid- Coordination-Office/FinancialModelstoSupportStatesEffortsinCareCoordination.html, and state websites.
Transcript
issue brief
Financial Alignment Demonstrations for Dual Eligible Beneficiaries Compared:States with Memoranda of Understanding Approved by CMS
July 2013
The Centers for Medicare and Medicaid Services (CMS) has finalized memoranda of understanding (MOUs) with California, Illinois, Massachusetts, Ohio, and Virginia to test a capitated model and with Washington to test a managed fee-for-service (FFS) model to integrate care and align financing for people who are dually eligible for Medicare and Medicaid.1 Washington’s proposal to test a capitated model, along with proposals from 15 other states, is pending with CMS (Figure 1). These three year demonstrations, to be implemented beginning in 2013, will introduce changes in the care delivery systems through which beneficiaries presently receive services. The demon-strations also change the payment approach and financing arrangements among CMS, the state, and providers. This issue brief compares key provi-sions of the approved demonstrations.
Dual eligible beneficiaries include seniors and non-elderly people with significant disabilities, some of whom are among the poorest and sick-est beneficiaries covered by either Medicare or Medicaid. The predomi-nant existing service delivery models for these beneficiaries typically involve
Figure 1
State demonstration proposals to integrate care and align financing for dual eligible beneficiaries, June 2013
Proposal pending with CMS (15 states and WA’s capitated proposal)
WA*
OR
WY
UT
TX
SD
OK*
ND
NM
NV NE
MT
LA
KS
ID
HI*
CO*
CA
AR AZ
AK
WI
WV VA
TN SC
OH
NC* MO*
MS
MN
MI
KY
IA* IN IL
GA
FL
AL
VT
PA
NY*
NJ
NH MA
ME
CT*
DE
RI
MD DC
MOU signed with CMS to implement demonstration (6 states)
Proposal submitted, will not pursue financial alignment but may pursue other administrative or programmatic alignment (2 states)
Proposal withdrawn (3 states)
Not participating in demonstration (24 states and DC)
NOTES: *CO, CT, IA, MO, and NC proposed managed FFS models. NY, OK, and WA proposed both capitated and managed FFS models; however, NY has withdrawn its managed FFS proposal. All other states proposed capitated models. WA’s MOU is for its managed FFS model only; its capitated proposal remains pending with CMS. HI’s proposal remains pending, but it does not anticipate implementation in 2014. SOURCE: CMS Financial Alignment Initiative, State Financial Alignment Proposals, www.cms.gov/ Medicare-Medicaid-Coordination/Medicare-and-Medicaid-Coordination/Medicare-Medicaid-Coordination-Office/FinancialModelstoSupportStatesEffortsinCareCoordination.html, and state websites.
2Financial Alignment Demonstrations for Dual Eligible Beneficiaries Compared: States with Memoranda of Understanding Approved by CMS
little to no coordination among the two programs. Dual eligible beneficiaries account for a disproportionate share of spending in the Medicare and Medicaid programs.2 In the case of Medicare, this is mainly due to their poorer health status, which requires higher use of medical services compared to other program beneficiaries. In the case of Medicaid, dual eligible beneficiaries’ relatively high spending is generally attributable to their greater need for long-term services and supports (LTSS).
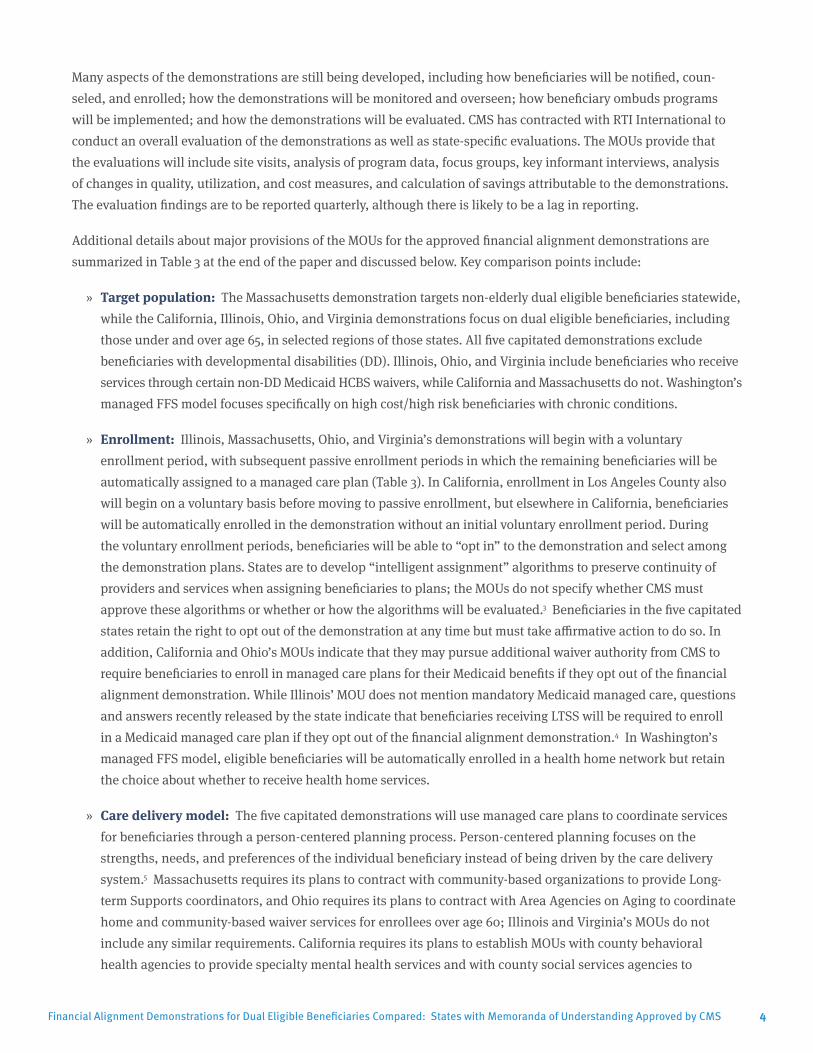
Based on new authority in the Affordable Care Act, CMS is testing capitated and managed FFS financial alignment models and seeking to improve care and control costs for the dual eligible population. Key features of the approved demonstrations are summarized in Table 1 on the next page.
CMS has stated that it plans to limit enrollment in the demonstrations to no more than two million dual eligible beneficiaries nationally. As of June 2013, CMS has approved demonstra-tions in six states that are estimated to encompass nearly one million benefi-ciaries (Figure 2). The states’ target populations vary, with Massachusetts focusing on non-elderly people with disabilities statewide, Washington targeting high cost/high risk beneficia-ries, and California, Illinois, Ohio, and Virginia focusing on both elderly and non-elderly beneficiaries in selected regions of the states. Demonstration enrollment in California is projected to account for nearly half of all enrollment in the demonstrations and exceed the enrollment in the other states with approved demonstrations. Enrollment in Los Angeles County alone, capped at 200,000 beneficiaries, will be greater than enrollment in any of the other states participating in the demonstration (Figure 2).
The six demonstrations approved to date will be implemented over the coming months, although CMS recently announced that the earliest effective enrollment dates in California, Illinois, Massachusetts, and Ohio will be delayed from the dates initially anticipated in their MOUs. Currently, two states’ demonstrations will begin in 2013: enrollment in Washington’s managed FFS demonstration begins taking effect in July 2013, and enrollment in Massachusetts’ capitated demonstration begins taking effect in October 2013. The earliest effective enrollment dates in the other capitated states are in 2014: January 2014 in California and Illinois, February 2014 in Virginia, and March 2014 in Ohio (Table 1). Anticipated program savings, from increased care coordination and use of home and community-based services (HCBS) over institutional care and decreased emergency room visits and avoidable hospi-talizations, will be deducted up-front from the Medicare and Medicaid contributions to health plans in the capitated model. (See Tables 1 and 3 and the discussion below for further information on demonstration financing.) Savings will be determined retrospectively in the managed FFS model.
Figure 2
Washington 21,000
Illinois 135,825
Ohio 115,000
Total across 6 states = 921,425 beneficiaries
Los Angeles County
200,000*
All California demonstration
counties 456,000
Virginia 78,600
NOTE: *Enrollment in Los Angeles County is capped at 200,000 beneficiaries. SOURCE: CMS/State Memoranda of Understanding, available at http://www.cms.gov/Medicare-Medicaid-Coordination/Medicare-and-Medicaid-Coordination/Medicare-Medicaid-Coordination-Office/FinancialModelstoSupportStatesEffortsinCareCoordination.html
CMS Has Approved Financial Alignment Demonstrations in Six States That Will Affect Nearly One Million Dual Eligible Beneficiaries, as of June 2013
California counties
other than L.A. 256,000
Massachusetts
115,000
3Financial Alignment Demonstrations for Dual Eligible Beneficiaries Compared: States with Memoranda of Understanding Approved by CMS
table 1: State Financial Alignment Demonstrations Approved by CMS, June 2013
State
Total Estimated Enrollees
Target Population and Geographic Area
Financial Model
Earliest Effective Enrollment Date
Savings Percentage Applied to Medicare and Medicaid Contributions to Baseline Capitated Ratea
California 456,000 Adult dual eligible beneficiaries in selected regions
Capitated January 2014 1% minimum, 1.5% maximum in year 12% minimum, 3.5% maximum in year 24% minimum, 5.5% maximum in year 3b
Illinois 135,825 Adult dual eligible beneficiaries in selected regions
Capitated January 2014 1% in year 13% in year 25% in year 3
Capitated October 2013 0 in 2013, 1% in 2014 (remainder of year 1)c
2% in year 2>4% in year 3d
Ohio 115,000 Adult dual eligible beneficiaries in selected regions
Capitated March 2014 1% in year 12% in year 24% in year 3
Virginia 78,600 Adult dual eligible beneficiaries in selected regions
Capitated February 2014 Same as Ohio, except that savings in year 3 will be reduced to 3% if 1/3 of plans experience losses exceeding 3% of revenue in all regions in which those plans participate in year 1 (Feb. 2014-Dec. 2015)e
Washington 21,000 High cost/high risk adult dual eligible beneficiaries statewide except in 2 urban countiesf
Managed FFSg
July 2013 N/A
NOTES: a Demonstration savings will be derived upfront by reducing CMS’s and the state’s respective baseline contributions to the plans by a savings percentage for each year.
b California’s maximum demonstration-wide savings percentages, along with county-specific interim savings percentages, will be used in determining the demonstration’s risk corridors.
c Massachusetts recently reduced its 2013 savings from 1% to zero. Demonstration year one in Massachusetts begins in 2013 and runs through December 2014.
d Massachusetts anticipates savings of greater than 4% (approximately 4.2%) in year 3 to make up for forgone savings in year 1. e This determination will be based on at least 20 months of data (demonstration year 1 in Virginia encompasses February 2014
through December 2015.) f Washington’s MOU provides that it may implement its managed FFS model in the two excluded counties (King and Snohomish)
beginning by November 1, 2013 if it no longer seeks to implement the capitated model there. g Washington’s capitated proposal remains pending with CMS.
SOURCE: CMS Financial Alignment Initiative, State Financial Alignment Demonstration Memoranda of Understanding, www.cms.gov/ Medicare-Medicaid-Coordination/Medicare-and-Medicaid-Coordination/Medicare-Medicaid-Coordination-Office/FinancialModelsto SupportStatesEffortsinCareCoordination.html; see also Endnotes 10-15, 24-25.
4Financial Alignment Demonstrations for Dual Eligible Beneficiaries Compared: States with Memoranda of Understanding Approved by CMS
Many aspects of the demonstrations are still being developed, including how beneficiaries will be notified, coun-seled, and enrolled; how the demonstrations will be monitored and overseen; how beneficiary ombuds programs will be implemented; and how the demonstrations will be evaluated. CMS has contracted with RTI International to conduct an overall evaluation of the demonstrations as well as state-specific evaluations. The MOUs provide that the evaluations will include site visits, analysis of program data, focus groups, key informant interviews, analysis of changes in quality, utilization, and cost measures, and calculation of savings attributable to the demonstrations. The evaluation findings are to be reported quarterly, although there is likely to be a lag in reporting.
Additional details about major provisions of the MOUs for the approved financial alignment demonstrations are summarized in Table 3 at the end of the paper and discussed below. Key comparison points include:
» Target population: The Massachusetts demonstration targets non-elderly dual eligible beneficiaries statewide, while the California, Illinois, Ohio, and Virginia demonstrations focus on dual eligible beneficiaries, including those under and over age 65, in selected regions of those states. All five capitated demonstrations exclude beneficiaries with developmental disabilities (DD). Illinois, Ohio, and Virginia include beneficiaries who receive services through certain non-DD Medicaid HCBS waivers, while California and Massachusetts do not. Washington’s managed FFS model focuses specifically on high cost/high risk beneficiaries with chronic conditions.
» Enrollment: Illinois, Massachusetts, Ohio, and Virginia’s demonstrations will begin with a voluntary enrollment period, with subsequent passive enrollment periods in which the remaining beneficiaries will be automatically assigned to a managed care plan (Table 3). In California, enrollment in Los Angeles County also will begin on a voluntary basis before moving to passive enrollment, but elsewhere in California, beneficiaries will be automatically enrolled in the demonstration without an initial voluntary enrollment period. During the voluntary enrollment periods, beneficiaries will be able to “opt in” to the demonstration and select among the demonstration plans. States are to develop “intelligent assignment” algorithms to preserve continuity of providers and services when assigning beneficiaries to plans; the MOUs do not specify whether CMS must approve these algorithms or whether or how the algorithms will be evaluated.3 Beneficiaries in the five capitated states retain the right to opt out of the demonstration at any time but must take affirmative action to do so. In addition, California and Ohio’s MOUs indicate that they may pursue additional waiver authority from CMS to require beneficiaries to enroll in managed care plans for their Medicaid benefits if they opt out of the financial alignment demonstration. While Illinois’ MOU does not mention mandatory Medicaid managed care, questions and answers recently released by the state indicate that beneficiaries receiving LTSS will be required to enroll in a Medicaid managed care plan if they opt out of the financial alignment demonstration.4 In Washington’s managed FFS model, eligible beneficiaries will be automatically enrolled in a health home network but retain the choice about whether to receive health home services.
» Care delivery model: The five capitated demonstrations will use managed care plans to coordinate services for beneficiaries through a person-centered planning process. Person-centered planning focuses on the strengths, needs, and preferences of the individual beneficiary instead of being driven by the care delivery system.5 Massachusetts requires its plans to contract with community-based organizations to provide Long-term Supports coordinators, and Ohio requires its plans to contract with Area Agencies on Aging to coordinate home and community-based waiver services for enrollees over age 60; Illinois and Virginia’s MOUs do not include any similar requirements. California requires its plans to establish MOUs with county behavioral health agencies to provide specialty mental health services and with county social services agencies to
5Financial Alignment Demonstrations for Dual Eligible Beneficiaries Compared: States with Memoranda of Understanding Approved by CMS
table 2: Health Plans Participating in CMS Approved Financial Alignment Demonstrationsa
California Illinois Massachusettsb Ohio Virginia Washingtonc
San Diego County:d
1. Care First2. Community Health Group3. Health Net4. Molina
Alameda County:e
1. Alameda Alliance for Health
2. Anthem Blue Cross
Los Angeles County:e
1. Health Net; Partner plan:a. Molina
2. L.A. Care; Partner plans: a. Care Moreb. Care Firstc. Kaiser Permanented. SCAN
Riverside County:e
1. Inland Empire Health Plan2. Molina Healthcare
San Bernardino County:e
1. Inland Empire Health Plan2. Molina Healthcare
Santa Clara County:e
1. Anthem Blue Cross2. Santa Clara Family
Health Plan
Orange County: f
1. CalOptima
San Mateo County: f
1. Health Plan of San Mateo
Greater Chicago Region:1. Aetna2. HealthSpring 3. Healthcare
Service Company
4. Humana5. IlliniCare 6. Meridian
Central Illinois Region:1. Health Alliance
Medical Plan2. Molina
1. Commonwealth Care Alliance
2. Fallon Total Care3. Network Health
Northwest Region:1. Aetna2. Buckeye
Southwest and Central Regions:1. Aetna2. Molina
West Central Region:1. Buckeye 2. Molina
East Central and Northeast Central Regions: 1. CareSource 2. United
Northeast Region:1. Buckeye 2. CareSource3. United
Health plans have not yet been selected
Coverage Areas 4g and 5:h 1. Community
Health Plan of Washington
2. Coordinated Care Corporation
3. Optum Regional Support Network
4. UnitedHealthcare of Washington
Coverage Area 7: i
1. Community Health Plan of Washington
2. Coordinated Care Corporation
3. Optum Regional Support Network
4. UnitedHealthCare of Washington
5. Southeast Washington Aging and Long-Term Care
NOTES: a Demonstration participation is subject to plans satisfying readiness review criteria. Plan subcontractors are noted as partner plans in California.
b Blue Cross Blue Shield, Boston Medical Center HealthNet, and Neighborhood Health Plan also were selected but will not be participating in Massachusetts’ demonstration.
c Health home care coordination organizations for other Washington demonstration counties will be announced beginning October 1, 2013. d San Diego is a geographic managed care county. e Alameda, Los Angeles, Riverside, San Bernardino, and Santa Clara are two plan model counties. f Orange and San Mateo are county-organized health systems. g Coverage area 4 includes Pierce County. h Coverage area 5 includes Clark, Cowlitz, Klickitat, Skamania, and Wahkiakum Counties. i Coverage area 7 includes Asotin, Benton, Columbia, Franklin, Garfield, Kittitas, Walla Walla, and Yakima Counties.
SOURCES: See Endnotes 37-42.
6Financial Alignment Demonstrations for Dual Eligible Beneficiaries Compared: States with Memoranda of Understanding Approved by CMS
coordinate In Home Supportive Services. California also permits its plans to subcontract with other Medicare Advantage Prescription Drug Plans to offer a variety of benefits packages to enrollees. The demonstration health plans (and subcontractors in Los Angeles County) are listed in Table 2. Washington’s managed FFS demonstration will use health home care coordination organizations to manage services among existing Medicare and Medicaid providers. While the five capitated states’ managed care plans will coordinate all Medicare and Medicaid benefits included in the demonstrations and financed through their capitated payments, Washington’s health home networks will coordinate Medicare and Medicaid services, which will continue to be financed on a FFS basis.
» Benefits: The five capitated demonstrations include nearly all Medicare and Medicaid services in the plans’ benefits package and capitated payment (see Table 3 for benefit exclusions) and allow plans to offer additional benefits as appropriate to beneficiary needs. In addition, Massachusetts’ demonstration offers certain diversionary behavioral health and community support services that are not otherwise covered as well as expanded Medicaid state plan benefits. Ohio’s MOU indicates that its anticipated § 1915(b)/(c) waiver application is expected to include expanded Medicaid state plan benefits and additional HCBS. California’s demonstration includes dental, vision, and non-emergency medical transportation benefits, and its plans may offer additional HCBS. Washington’s managed FFS demonstration adds Medicaid health home services but does not otherwise change the existing Medicare and Medicaid benefits packages.
» Financing: California, Illinois, Massachusetts, Ohio, and Virginia will test CMS’s capitated financial alignment model, in which managed care plans will receive capitated payments from CMS for Medicare services and the state for Medicaid services. The baseline capitation payment for Medicare Parts A and B services will be determined using a blend of the Medicare Advantage benchmarks and the Medicare FFS standardized county rates weighted by whether eligible beneficiaries who are expected to transition into the demonstration are enrolled in a Medicare Advantage plan or Medicare FFS in the prior year. Plans will not submit bids, as they would in Medicare Advantage, but rather will be paid the full benchmark amount. Medicare Advantage baseline spending will include costs that would have occurred absent the demonstration, such as quality bonus payments for applicable Medicare Advantage plans. The baseline capitation payment for Medicare Part D services will be the national average monthly bid amount as well as the average projected low-income cost sharing subsidy and the average projected federal reinsurance amounts. The baseline Medicaid capitation payment will be based on historic state spending in Illinois, Massachusetts, and Virginia and on the managed care waiver capitation rate that would apply to eligible beneficiaries if they were not enrolled in the demonstration in California and Ohio.
The baseline Medicare payment will be risk-adjusted using CMS’s existing Medicare Advantage Hierarchical Condition Categories model. Because most demonstration enrollees are expected to come from the FFS Medicare system, CMS will not apply the coding intensity adjustment factor to Medicare Advantage risk scores initially (in calendar year 2013 in California, Massachusetts, Ohio, and Virginia and in calendar year 2014 in Illinois6) but will do so in future years. The baseline Medicaid payment will be risk adjusted in California and Illinois by using rating categories with financial incentives for HCBS over institutional care (see Table 3 for more details); in Massachusetts by using rating categories and high cost risk pools for certain LTSS; and in Ohio and Virginia by using rating categories with financial incentives for HCBS over institutional care and member enroll-ment mix adjustment to account for plans with a greater proportion of high cost/high risk beneficiaries. Illinois,
7Financial Alignment Demonstrations for Dual Eligible Beneficiaries Compared: States with Memoranda of Understanding Approved by CMS
Ohio, and Virginia require plans to meet a minimum medical loss ratio, while Massachusetts will use risk corridors in the first year of the demonstration only, and California will use limited risk corridors in all years. Massachusetts recently announced revisions to its rating categories and risk corridors.
Demonstration savings will be derived upfront by reducing CMS’s and the state’s respective baseline contri-butions to the plans by a savings percentage for each year. Sources of federal savings include the Medicare program and the federal contribution to the state’s Medicaid program; the source of state savings is the state’s contribution to the Medicaid program.7 None of the MOUs explicitly states the basis for the savings percentages, although Illinois’ MOU does note that it currently has one of the highest rates of potentially avoidable hospital admissions among dual eligible beneficiaries nationally and one of the highest proportions of spending on institutional services compared to HCBS.
While California’s MOU specifies minimum savings percentages of 1% in year one, 2% in year two, and 4% in year three, it also includes maximum savings percentages of 1.5% in year one, 3.5% in year two, and 5.5% in year three, making the maximum savings percentages in California the highest of the approved demonstrations to date. (California’s maximum demonstration-wide savings percentages, along with county-specific interim savings percentages, will be used in determining the demonstration’s risk corridors.)
All five capitated demonstrations also include provisions to withhold a portion of the capitated rate that plans can earn back if specified quality measures are met. California also requires its plans to provide incen-tive payments from the quality withhold funds to county behavioral health agencies based on achievement of service coordination measures.
By contrast, Washington will test CMS’s managed FFS model in which providers will continue to receive FFS reimbursement for both Medicare and Medicaid-covered services. Any demonstration savings in Washington will be determined retrospectively, with the state eligible to share in savings with CMS if savings targets and quality standards are met.
» Ombuds program: California and Ohio’s MOUs indicate that existing state ombuds offices will offer individual advocacy and independent systemic oversight in the demonstrations. Illinois and Virginia’s MOUs indicate that they intend to support an independent ombuds program for their demonstrations, and Massachusetts plans to release an RFR for an ombudsman in June 2013. Washington’s MOU does not mention an ombuds program. CMS recently announced a funding opportunity for states with MOUs to support the planning, development, and provision of independent ombudsman services in the demonstrations.8
Looking AheadThe approved MOUs provide additional information about how CMS and the states envision the demonstrations working and insight into the framework and policy decisions that CMS may apply when developing MOUs with other states that submitted proposals. Additional details remain to be specified in the three-way contracts between CMS, the state, and demonstration plans in the capitated model and in Washington’s managed FFS final demonstration agreement with CMS, such as:
» how beneficiaries will be notified about these new models; » what assistance will be available for beneficiaries to obtain options counseling from independent sources as
they make this important choice; » what the sources of program savings will be;
8Financial Alignment Demonstrations for Dual Eligible Beneficiaries Compared: States with Memoranda of Understanding Approved by CMS
» how beneficiaries’ access to medically necessary services and supports will be ensured; » what grievance and appeals process will be available to beneficiaries and how easy it will be to navigate; » how plans and providers will accommodate the needs of beneficiaries with disabilities; and » how the demonstrations will be overseen and evaluated.
While the demonstrations offer the potential opportunity to improve care coordination, lower program costs, and achieve outcomes such as better health and the increased use of HCBS instead of institutional care, at the same time the high care needs of many dual eligible beneficiaries increases their vulnerability when care delivery systems are changed.
This issue brief was prepared by MaryBeth Musumeci of the Kaiser Family Foundation’s Commission on Medicaid and the Uninsured.
9Financial Alignment Demonstrations for Dual Eligible Beneficiaries Compared: States with Memoranda of Understanding Approved by CMS 9Financial Alignment Demonstrations for Dual Eligible Beneficiaries Compared: States with Memoranda of Understanding Approved by CMS
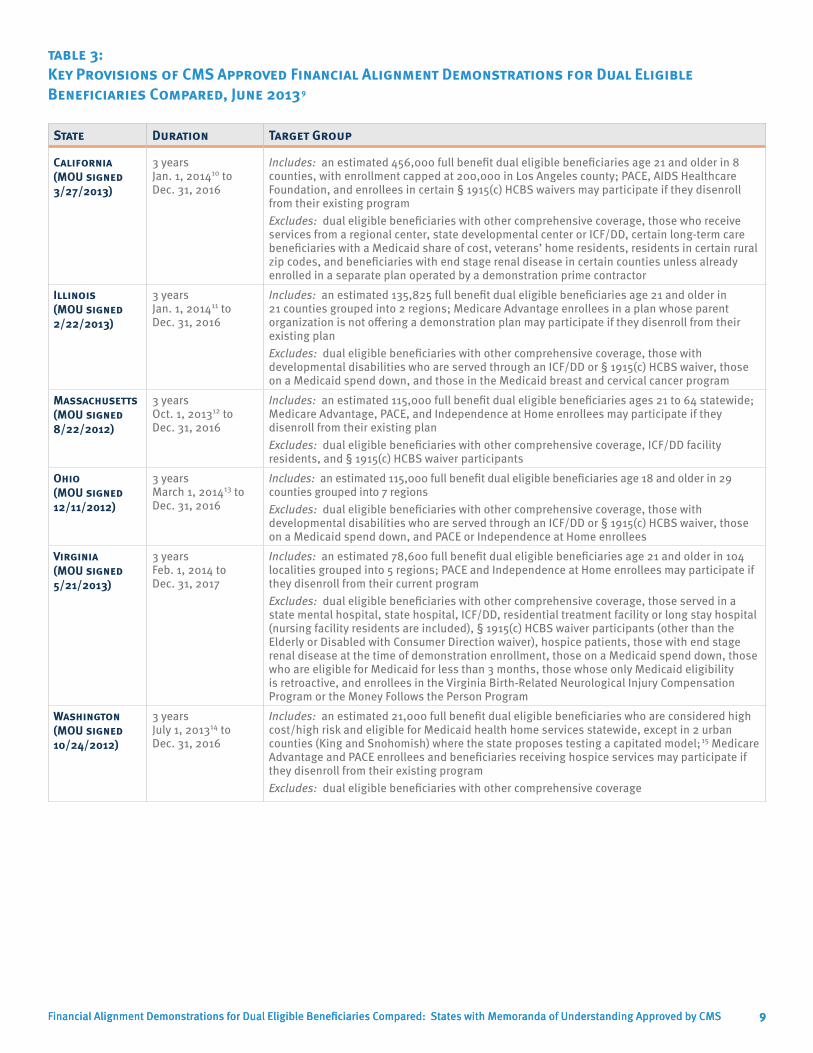
table 3: Key Provisions of CMS Approved Financial Alignment Demonstrations for Dual Eligible Beneficiaries Compared, June 20139
State Duration Target Group
California (MOU signed 3/27/2013)
3 years Jan. 1, 201410 to Dec. 31, 2016
Includes: an estimated 456,000 full benefit dual eligible beneficiaries age 21 and older in 8 counties, with enrollment capped at 200,000 in Los Angeles county; PACE, AIDS Healthcare Foundation, and enrollees in certain § 1915(c) HCBS waivers may participate if they disenroll from their existing programExcludes: dual eligible beneficiaries with other comprehensive coverage, those who receive services from a regional center, state developmental center or ICF/DD, certain long-term care beneficiaries with a Medicaid share of cost, veterans’ home residents, residents in certain rural zip codes, and beneficiaries with end stage renal disease in certain counties unless already enrolled in a separate plan operated by a demonstration prime contractor
Illinois (MOU signed 2/22/2013)
3 years Jan. 1, 201411 to Dec. 31, 2016
Includes: an estimated 135,825 full benefit dual eligible beneficiaries age 21 and older in 21 counties grouped into 2 regions; Medicare Advantage enrollees in a plan whose parent organization is not offering a demonstration plan may participate if they disenroll from their existing planExcludes: dual eligible beneficiaries with other comprehensive coverage, those with developmental disabilities who are served through an ICF/DD or § 1915(c) HCBS waiver, those on a Medicaid spend down, and those in the Medicaid breast and cervical cancer program
Massachusetts (MOU signed 8/22/2012)
3 years Oct. 1, 201312 to Dec. 31, 2016
Includes: an estimated 115,000 full benefit dual eligible beneficiaries ages 21 to 64 statewide; Medicare Advantage, PACE, and Independence at Home enrollees may participate if they disenroll from their existing planExcludes: dual eligible beneficiaries with other comprehensive coverage, ICF/DD facility residents, and § 1915(c) HCBS waiver participants
Ohio (MOU signed 12/11/2012)
3 years March 1, 201413 to Dec. 31, 2016
Includes: an estimated 115,000 full benefit dual eligible beneficiaries age 18 and older in 29 counties grouped into 7 regionsExcludes: dual eligible beneficiaries with other comprehensive coverage, those with developmental disabilities who are served through an ICF/DD or § 1915(c) HCBS waiver, those on a Medicaid spend down, and PACE or Independence at Home enrollees
Virginia (MOU signed 5/21/2013)
3 years Feb. 1, 2014 to Dec. 31, 2017
Includes: an estimated 78,600 full benefit dual eligible beneficiaries age 21 and older in 104 localities grouped into 5 regions; PACE and Independence at Home enrollees may participate if they disenroll from their current programExcludes: dual eligible beneficiaries with other comprehensive coverage, those served in a state mental hospital, state hospital, ICF/DD, residential treatment facility or long stay hospital (nursing facility residents are included), § 1915(c) HCBS waiver participants (other than the Elderly or Disabled with Consumer Direction waiver), hospice patients, those with end stage renal disease at the time of demonstration enrollment, those on a Medicaid spend down, those who are eligible for Medicaid for less than 3 months, those whose only Medicaid eligibility is retroactive, and enrollees in the Virginia Birth-Related Neurological Injury Compensation Program or the Money Follows the Person Program
Washington (MOU signed 10/24/2012)
3 years July 1, 201314 to Dec. 31, 2016
Includes: an estimated 21,000 full benefit dual eligible beneficiaries who are considered high cost/high risk and eligible for Medicaid health home services statewide, except in 2 urban counties (King and Snohomish) where the state proposes testing a capitated model;15 Medicare Advantage and PACE enrollees and beneficiaries receiving hospice services may participate if they disenroll from their existing programExcludes: dual eligible beneficiaries with other comprehensive coverage
10Financial Alignment Demonstrations for Dual Eligible Beneficiaries Compared: States with Memoranda of Understanding Approved by CMS 10Financial Alignment Demonstrations for Dual Eligible Beneficiaries Compared: States with Memoranda of Understanding Approved by CMS
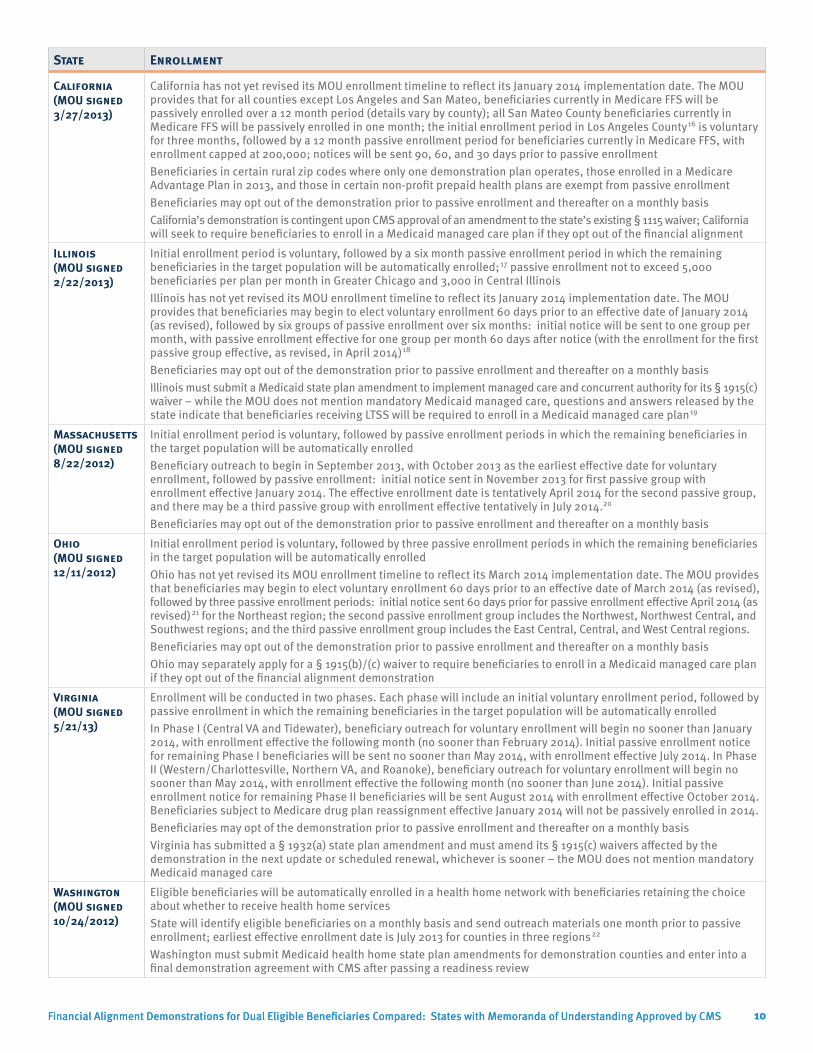
State Enrollment
California (MOU signed 3/27/2013)
California has not yet revised its MOU enrollment timeline to reflect its January 2014 implementation date. The MOU provides that for all counties except Los Angeles and San Mateo, beneficiaries currently in Medicare FFS will be passively enrolled over a 12 month period (details vary by county); all San Mateo County beneficiaries currently in Medicare FFS will be passively enrolled in one month; the initial enrollment period in Los Angeles County16 is voluntary for three months, followed by a 12 month passive enrollment period for beneficiaries currently in Medicare FFS, with enrollment capped at 200,000; notices will be sent 90, 60, and 30 days prior to passive enrollment Beneficiaries in certain rural zip codes where only one demonstration plan operates, those enrolled in a Medicare Advantage Plan in 2013, and those in certain non-profit prepaid health plans are exempt from passive enrollmentBeneficiaries may opt out of the demonstration prior to passive enrollment and thereafter on a monthly basis California’s demonstration is contingent upon CMS approval of an amendment to the state’s existing § 1115 waiver; California will seek to require beneficiaries to enroll in a Medicaid managed care plan if they opt out of the financial alignment
Illinois (MOU signed 2/22/2013)
Initial enrollment period is voluntary, followed by a six month passive enrollment period in which the remaining beneficiaries in the target population will be automatically enrolled;17 passive enrollment not to exceed 5,000 beneficiaries per plan per month in Greater Chicago and 3,000 in Central IllinoisIllinois has not yet revised its MOU enrollment timeline to reflect its January 2014 implementation date. The MOU provides that beneficiaries may begin to elect voluntary enrollment 60 days prior to an effective date of January 2014 (as revised), followed by six groups of passive enrollment over six months: initial notice will be sent to one group per month, with passive enrollment effective for one group per month 60 days after notice (with the enrollment for the first passive group effective, as revised, in April 2014)18
Beneficiaries may opt out of the demonstration prior to passive enrollment and thereafter on a monthly basis Illinois must submit a Medicaid state plan amendment to implement managed care and concurrent authority for its § 1915(c) waiver – while the MOU does not mention mandatory Medicaid managed care, questions and answers released by the state indicate that beneficiaries receiving LTSS will be required to enroll in a Medicaid managed care plan19
Massachusetts (MOU signed 8/22/2012)
Initial enrollment period is voluntary, followed by passive enrollment periods in which the remaining beneficiaries in the target population will be automatically enrolledBeneficiary outreach to begin in September 2013, with October 2013 as the earliest effective date for voluntary enrollment, followed by passive enrollment: initial notice sent in November 2013 for first passive group with enrollment effective January 2014. The effective enrollment date is tentatively April 2014 for the second passive group, and there may be a third passive group with enrollment effective tentatively in July 2014.20 Beneficiaries may opt out of the demonstration prior to passive enrollment and thereafter on a monthly basis
Ohio (MOU signed 12/11/2012)
Initial enrollment period is voluntary, followed by three passive enrollment periods in which the remaining beneficiaries in the target population will be automatically enrolledOhio has not yet revised its MOU enrollment timeline to reflect its March 2014 implementation date. The MOU provides that beneficiaries may begin to elect voluntary enrollment 60 days prior to an effective date of March 2014 (as revised), followed by three passive enrollment periods: initial notice sent 60 days prior for passive enrollment effective April 2014 (as revised)21 for the Northeast region; the second passive enrollment group includes the Northwest, Northwest Central, and Southwest regions; and the third passive enrollment group includes the East Central, Central, and West Central regions. Beneficiaries may opt out of the demonstration prior to passive enrollment and thereafter on a monthly basis Ohio may separately apply for a § 1915(b)/(c) waiver to require beneficiaries to enroll in a Medicaid managed care plan if they opt out of the financial alignment demonstration
Virginia (MOU signed 5/21/13)
Enrollment will be conducted in two phases. Each phase will include an initial voluntary enrollment period, followed by passive enrollment in which the remaining beneficiaries in the target population will be automatically enrolled In Phase I (Central VA and Tidewater), beneficiary outreach for voluntary enrollment will begin no sooner than January 2014, with enrollment effective the following month (no sooner than February 2014). Initial passive enrollment notice for remaining Phase I beneficiaries will be sent no sooner than May 2014, with enrollment effective July 2014. In Phase II (Western/Charlottesville, Northern VA, and Roanoke), beneficiary outreach for voluntary enrollment will begin no sooner than May 2014, with enrollment effective the following month (no sooner than June 2014). Initial passive enrollment notice for remaining Phase II beneficiaries will be sent August 2014 with enrollment effective October 2014. Beneficiaries subject to Medicare drug plan reassignment effective January 2014 will not be passively enrolled in 2014. Beneficiaries may opt of the demonstration prior to passive enrollment and thereafter on a monthly basisVirginia has submitted a § 1932(a) state plan amendment and must amend its § 1915(c) waivers affected by the demonstration in the next update or scheduled renewal, whichever is sooner – the MOU does not mention mandatory Medicaid managed care
Washington (MOU signed 10/24/2012)
Eligible beneficiaries will be automatically enrolled in a health home network with beneficiaries retaining the choice about whether to receive health home servicesState will identify eligible beneficiaries on a monthly basis and send outreach materials one month prior to passive enrollment; earliest effective enrollment date is July 2013 for counties in three regions22
Washington must submit Medicaid health home state plan amendments for demonstration counties and enter into a final demonstration agreement with CMS after passing a readiness review
11Financial Alignment Demonstrations for Dual Eligible Beneficiaries Compared: States with Memoranda of Understanding Approved by CMS 11Financial Alignment Demonstrations for Dual Eligible Beneficiaries Compared: States with Memoranda of Understanding Approved by CMS
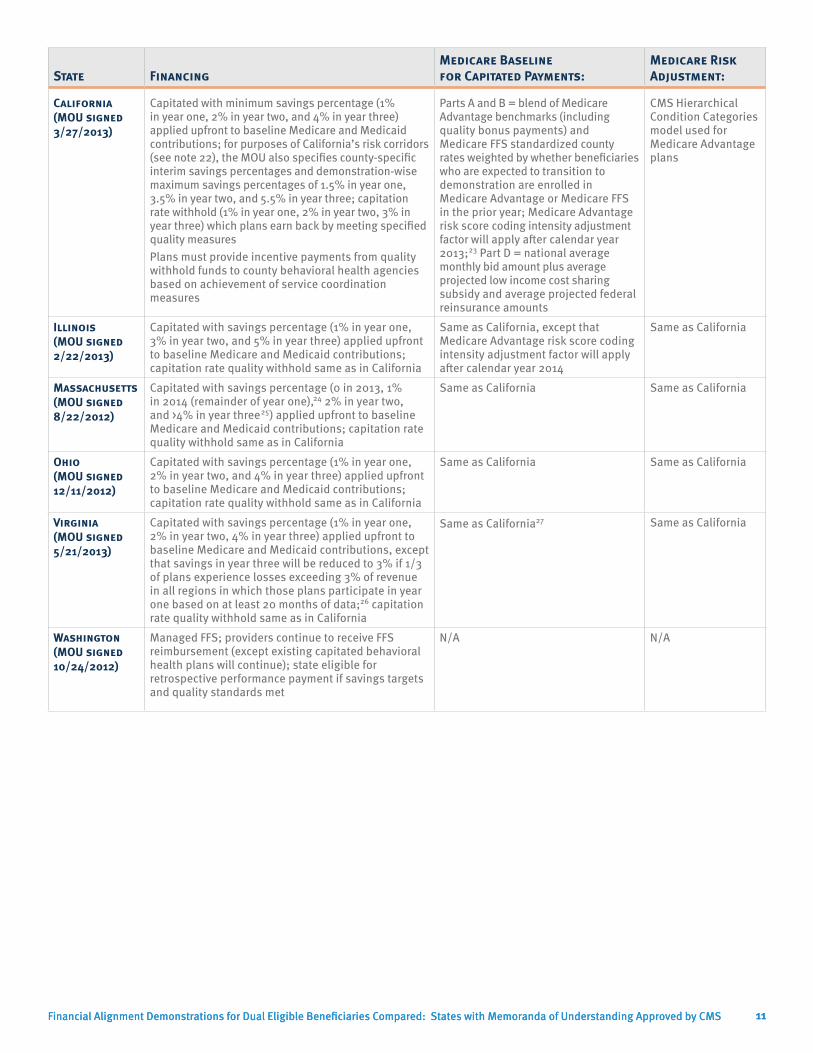
State FinancingMedicare Baseline for Capitated Payments:
Medicare Risk Adjustment:
California (MOU signed 3/27/2013)
Capitated with minimum savings percentage (1% in year one, 2% in year two, and 4% in year three) applied upfront to baseline Medicare and Medicaid contributions; for purposes of California’s risk corridors (see note 22), the MOU also specifies county-specific interim savings percentages and demonstration-wise maximum savings percentages of 1.5% in year one, 3.5% in year two, and 5.5% in year three; capitation rate withhold (1% in year one, 2% in year two, 3% in year three) which plans earn back by meeting specified quality measuresPlans must provide incentive payments from quality withhold funds to county behavioral health agencies based on achievement of service coordination measures
Parts A and B = blend of Medicare Advantage benchmarks (including quality bonus payments) and Medicare FFS standardized county rates weighted by whether beneficiaries who are expected to transition to demonstration are enrolled in Medicare Advantage or Medicare FFS in the prior year; Medicare Advantage risk score coding intensity adjustment factor will apply after calendar year 2013;23 Part D = national average monthly bid amount plus average projected low income cost sharing subsidy and average projected federal reinsurance amounts
CMS Hierarchical Condition Categories model used for Medicare Advantage plans
Illinois (MOU signed 2/22/2013)
Capitated with savings percentage (1% in year one, 3% in year two, and 5% in year three) applied upfront to baseline Medicare and Medicaid contributions; capitation rate quality withhold same as in California
Same as California, except that Medicare Advantage risk score coding intensity adjustment factor will apply after calendar year 2014
Same as California
Massachusetts (MOU signed 8/22/2012)
Capitated with savings percentage (0 in 2013, 1% in 2014 (remainder of year one),24 2% in year two, and >4% in year three25) applied upfront to baseline Medicare and Medicaid contributions; capitation rate quality withhold same as in California
Same as California Same as California
Ohio (MOU signed 12/11/2012)
Capitated with savings percentage (1% in year one, 2% in year two, and 4% in year three) applied upfront to baseline Medicare and Medicaid contributions; capitation rate quality withhold same as in California
Same as California Same as California
Virginia (MOU signed 5/21/2013)
Capitated with savings percentage (1% in year one, 2% in year two, 4% in year three) applied upfront to baseline Medicare and Medicaid contributions, except that savings in year three will be reduced to 3% if 1/3 of plans experience losses exceeding 3% of revenue in all regions in which those plans participate in year one based on at least 20 months of data;26 capitation rate quality withhold same as in California
Same as California27 Same as California
Washington (MOU signed 10/24/2012)
Managed FFS; providers continue to receive FFS reimbursement (except existing capitated behavioral health plans will continue); state eligible for retrospective performance payment if savings targets and quality standards met
N/A N/A
12Financial Alignment Demonstrations for Dual Eligible Beneficiaries Compared: States with Memoranda of Understanding Approved by CMS 12Financial Alignment Demonstrations for Dual Eligible Beneficiaries Compared: States with Memoranda of Understanding Approved by CMS
StateMedicaid Baseline for Capitated Payments: Medicaid Risk Adjustment: Risk Sharing:
California (MOU signed 3/27/2013)
Medicaid capitation rates under § 1115 waiver that would apply to beneficiaries who are in target population but not enrolled in this demonstration (excluding specialty behavioral health services financed and managed by county behavioral health agencies and costs for county activities to administer In Home Supportive Services)
Rating categories with financial incentives for HCBS over institutional care28 to be implemented in each county in 3 phases29
Limited risk corridors in all years30
Illinois (MOU signed 2/22/2013)
Historical state spending for state plan and HCBS waiver services trended forward
Rating categories with financial incentives for HCBS over nursing facility care31
Required minimum medical loss ratio of 85%
Massachusetts (MOU signed 8/22/2012)
Historical state spending data trended forward
Rating categories32 and high cost risk pools for certain Medicaid LTSS 33
Risk corridors in first year only34
Ohio (MOU signed 12/11/2012)
Medicaid capitation rates under § 1915(b) waiver that would apply to beneficiaries who are in target population but not enrolled in demonstration
Rating categories with financial incentives for HCBS over institutional care35 and member enrollment mix adjustment to account for plans with greater proportion of high risk/high cost beneficiaries
Required minimum medical loss ratio of 90%
Virginia (MOU signed 5/21/2013)
Historical state spending for state plan and HCBS waiver services trended forward
Rating categories with financial incentives for HCBS over institutional care36 and member enrollment mix adjustment to account for plans with greater proportion of high risk/high cost beneficiaries and to account for the relative risk/cost differences of major sub-populations (e.g. nursing facility residents and beneficiaries receiving HCBS)
Required minimum medical loss ratio of 90%
Washington (MOU signed 10/24/2012)
N/A N/A N/A
13Financial Alignment Demonstrations for Dual Eligible Beneficiaries Compared: States with Memoranda of Understanding Approved by CMS 13Financial Alignment Demonstrations for Dual Eligible Beneficiaries Compared: States with Memoranda of Understanding Approved by CMS
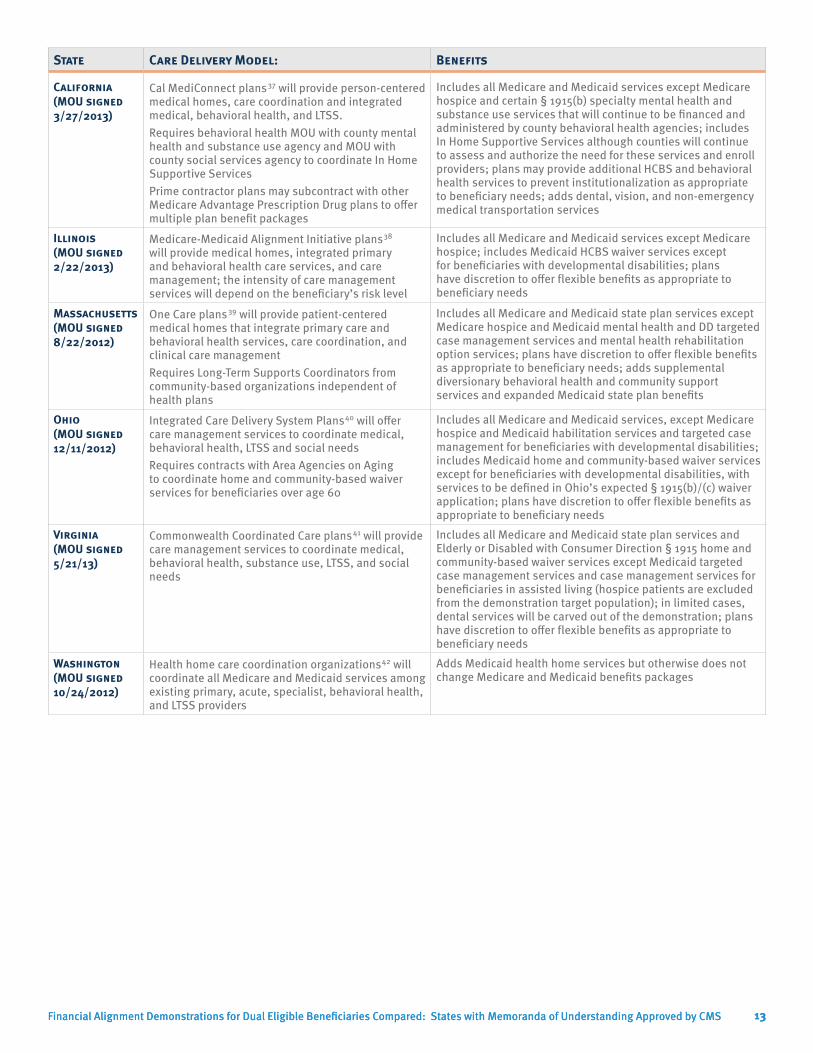
State Care Delivery Model: Benefits
California (MOU signed 3/27/2013)
Cal MediConnect plans37 will provide person-centered medical homes, care coordination and integrated medical, behavioral health, and LTSS. Requires behavioral health MOU with county mental health and substance use agency and MOU with county social services agency to coordinate In Home Supportive ServicesPrime contractor plans may subcontract with other Medicare Advantage Prescription Drug plans to offer multiple plan benefit packages
Includes all Medicare and Medicaid services except Medicare hospice and certain § 1915(b) specialty mental health and substance use services that will continue to be financed and administered by county behavioral health agencies; includes In Home Supportive Services although counties will continue to assess and authorize the need for these services and enroll providers; plans may provide additional HCBS and behavioral health services to prevent institutionalization as appropriate to beneficiary needs; adds dental, vision, and non-emergency medical transportation services
Illinois (MOU signed 2/22/2013)
Medicare-Medicaid Alignment Initiative plans38 will provide medical homes, integrated primary and behavioral health care services, and care management; the intensity of care management services will depend on the beneficiary’s risk level
Includes all Medicare and Medicaid services except Medicare hospice; includes Medicaid HCBS waiver services except for beneficiaries with developmental disabilities; plans have discretion to offer flexible benefits as appropriate to beneficiary needs
Massachusetts (MOU signed 8/22/2012)
One Care plans39 will provide patient-centered medical homes that integrate primary care and behavioral health services, care coordination, and clinical care managementRequires Long-Term Supports Coordinators from community-based organizations independent of health plans
Includes all Medicare and Medicaid state plan services except Medicare hospice and Medicaid mental health and DD targeted case management services and mental health rehabilitation option services; plans have discretion to offer flexible benefits as appropriate to beneficiary needs; adds supplemental diversionary behavioral health and community support services and expanded Medicaid state plan benefits
Ohio (MOU signed 12/11/2012)
Integrated Care Delivery System Plans40 will offer care management services to coordinate medical, behavioral health, LTSS and social needsRequires contracts with Area Agencies on Aging to coordinate home and community-based waiver services for beneficiaries over age 60
Includes all Medicare and Medicaid services, except Medicare hospice and Medicaid habilitation services and targeted case management for beneficiaries with developmental disabilities; includes Medicaid home and community-based waiver services except for beneficiaries with developmental disabilities, with services to be defined in Ohio’s expected § 1915(b)/(c) waiver application; plans have discretion to offer flexible benefits as appropriate to beneficiary needs
Virginia (MOU signed 5/21/13)
Commonwealth Coordinated Care plans41 will provide care management services to coordinate medical, behavioral health, substance use, LTSS, and social needs
Includes all Medicare and Medicaid state plan services and Elderly or Disabled with Consumer Direction § 1915 home and community-based waiver services except Medicaid targeted case management services and case management services for beneficiaries in assisted living (hospice patients are excluded from the demonstration target population); in limited cases, dental services will be carved out of the demonstration; plans have discretion to offer flexible benefits as appropriate to beneficiary needs
Washington (MOU signed 10/24/2012)
Health home care coordination organizations42 will coordinate all Medicare and Medicaid services among existing primary, acute, specialist, behavioral health, and LTSS providers
Adds Medicaid health home services but otherwise does not change Medicare and Medicaid benefits packages
14Financial Alignment Demonstrations for Dual Eligible Beneficiaries Compared: States with Memoranda of Understanding Approved by CMS 14Financial Alignment Demonstrations for Dual Eligible Beneficiaries Compared: States with Memoranda of Understanding Approved by CMS
State Continuity of Care: Ombuds Program: Stakeholder Engagement:
California (MOU signed 3/27/2013)
Beneficiaries must maintain current providers and service authorizations for up to 6 months for Medicare services and up to 12 months for Medicaid services except for IHSS providers, DME, medical supplies, transportation, and other ancillary services
California’s state Medicaid managed care ombuds office will support individual advocacy and independent systemic oversight for the demonstration with an emphasis on community integration, independent living and person-centered care
Plans must establish at least one consumer advisory committee that provides input to the governing board and include beneficiaries with disabilities in the plan governance structure
Illinois (MOU signed 2/22/2013)
Beneficiaries have a 180 day transition period for continuing a current course of treatment with out-of-network providers including behavioral health and LTSS
Illinois’s MOU indicates that it intends to support an independent ombuds program for the demonstration
Plans must establish an independent beneficiary advisory committee that meets quarterly
Massachusetts (MOU signed 8/22/2012)
Beneficiaries must be allowed to maintain their current providers and service authorizations for 90 days or until the plan completes an initial assessment, whichever is longer
Massachusetts plans to release an RFR for a demonstration ombudsman in June 2013;43 not addressed in MOU
Same as California
Ohio (MOU signed 12/11/2012)
Beneficiaries identified for high risk care management have a 90 day transition period for maintaining current physician services; other beneficiaries have one year. HCBS waiver enrollees maintain current waiver service levels for one year and providers for either one year or 90 days, depending on the type of service
Ohio’s existing Office of the State Long-term Care Ombudsman will offer individual advocacy and independent systemic oversight in the demonstration
Same as California
Virginia (MOU signed 5/21/13)
Beneficiaries retain access to current providers for 180 days from demonstration enrollment; beneficiaries retain access to services in existing plans of care and prior authorizations until authorizations expire or 180 days from demonstration enrollment, whichever is sooner, except that beneficiaries in nursing facilities at the time of demonstration implementation may remain as long as they continue to meet level of care criteria, unless they prefer to move to another facility or the community
Virginia intends to support an independent ombuds outside of the state Medicaid agency to advocate and investigate on behalf of demonstration enrollees, safeguard due process, identify systemic problems, and gather and report data
Plans must establish an independent beneficiary advisory committee that provides input to the governing board and includes beneficiaries with disabilities in the plan governance structure
Washington (MOU signed 10/24/2012)
Beneficiaries will retain access to their current choice of Medicare and Medicaid providers
Not addressed in MOU Health home networks must ensure meaningful beneficiary input, with specifics to be determined in the state’s health home network qualification process. State will include beneficiaries on its advisory team.
15Financial Alignment Demonstrations for Dual Eligible Beneficiaries Compared: States with Memoranda of Understanding Approved by CMS
Endnotes
1 For more information, see Kaiser Commission on Medicaid and the Uninsured, Explaining the State Integrated Care and Financial Alignment Demonstrations for Dual Eligible Beneficiaries (Oct. 2012), available at www.kff.org/Medicaid/8368.cfm.
2 See Kaiser Commission on Medicaid and the Uninsured, Medicaid’s Role for Dual Eligible Beneficiaries (April 2012), available at www.kff.org/medicaid/7846.cfm; Kaiser Family Foundation, Medicare’s Role for Dual Eligible Beneficiaries (April 2012), available at www.kff.org/medicare/8138.cfm.
3 Virginia’s MOU (at p. 59) states that “[f]urther details will be agreed to and provided by CMS and the Commonwealth in future technical guidance.”
4 MMAI April 18, 2013, Stakeholders Meeting, Questions and Answers, items 61 and 62, available at www2.illinois.gov/hfs/SiteCollectionDocuments/MMAI_QA_041813.pdf.
5 See, e.g., Virginia Commonwealth University Partnership for People with Disabilities, A Closer Look at the Centers’ for Medicare and Medicaid Services’ Definition of Person-Centered Planning, available at www.medicaid.gov/mltss/docs/PCP-CMSdefinition04-04.pdf.
6 These dates are from the MOUs but may be updated given most states’ recent announcements to postpone their enrollment dates.
7 State Medicaid spending qualifies for federal matching funds based upon the state’s Federal Medical Assistance Percentage (FMAP). For more information about the FMAP, see Kaiser Commission on Medicaid and the Uninsured, Medicaid Financing: An Overview of the Federal Medicaid Matching Rate (FMAP) (Sept. 2012), available at www.kff.org/medicaid/8352.cfm.
8 CMS, Funding Opportunity: Support for Demonstration Ombudsman Programs Serving Medicare-Medicaid Enrollees (June 27, 2013), available at www.cms.gov/Newsroom/MediaReleaseDatabase/Fact-Sheets/2013-Fact-Sheets-Items/2013-06-27.html.
9 The states’ MOUs with CMS are available at www.cms.gov/Medicare-Medicaid-Coordination/Medicare-and-Medicaid-Coordination/Medicare-Medicaid-Coordination-Office/FinancialModelstoSupportStatesEffortsinCareCoordination.html. All information in Table 3 is from the states’ MOUs unless otherwise indicated.
10 California recently revised its start date from October 2013 to January 2014. CalDuals, News & Updates, “Demo to start January 2014,” posted May 6, 2013, available at www.calduals.org/news-and-updates/.
11 CMS recently announced that Illinois’ demonstration start date has been revised from October 2013 to January 2014. Email from Daniel Farmer, Special Assistant to the Director, Medicare-Medicaid Coordination Office (May 31, 2013) (on file with author).
12 Although Massachusetts’ MOU with CMS provided for an April 1, 2013 start date, the state and CMS subsequently agreed to delay implementation until July 1, 2013, and again until October 1, 2013. Massachusetts Executive Office of Health and Human Services, One Care Timeline Update, accessed June 6, 2013, available at www.mass.gov/eohhs/provider/guidelines-resources/services-planning/national-health-care-reform-plan/federal-health-care-reform-initiatives/integrating-medicare-and-medicaid/related-information.html.
13 Ohio recently revised its demonstration start date from September 2013 to March 2014. Email from Daniel Farmer, Special Assistant to the Director, Medicare-Medicaid Coordination Office (May 31, 2013) (on file with author).
14 Although Washington’s MOU with CMS provided for an April 1, 2013 start date, the state and CMS subsequently agreed to delay implementation until July 1, 2013. Washington Health Care Authority Stakeholder Notice (Feb. 4, 2013), available at www.communitycatalyst.org/doc_store/publications/StakeholdernoticeHealth%20Homes.pdf.
15 See, e.g., State of Washington, Washington State Health Care Authority, Request for Application No. 2013-003, available at www.adsa.dshs.wa.gov/duals/documents/RFA/RFA%20-%202013-003%20-%20HPW%20S2_Final.pdf; see also Washington’s MOU, which provides that Washington may implement its managed FFS model in the excluded counties beginning by November 1, 2013 if it no longer seeks to implement the capitated model there; Washington Health Care Authority news release, “Health Care Authority, DSHS to launch Health Homes for better service delivery, integration on July 1” (June 28, 2013).
16 California’s MOU indicates that it will propose an enrollment approach for Los Angeles County within 30 days of signing its MOU, which will be posted for a 30 day public comment period and must be approved by CMS.
16Financial Alignment Demonstrations for Dual Eligible Beneficiaries Compared: States with Memoranda of Understanding Approved by CMS
17 Illinois beneficiaries enrolled in a Medicare Advantage plan operated by the same parent organization as a demonstration plan will be passively enrolled into that demonstration plan.
18 Email from Daniel Farmer, Special Assistant to the Director, Medicare-Medicaid Coordination Office (May 31, 2013) (on file with author).
19 MMAI April 18, 2013, Stakeholders Meeting, Questions and Answers, items 61 and 62, available at www2.illinois.gov/hfs/SiteCollectionDocuments/MMAI_QA_041813.pdf. Beneficiaries required to enroll in a Medicaid managed care plan will be locked in for one year, after an initial 90 day change period, with an annual open enrollment period.
20 Massachusetts Executive Office of Health and Human Services, One Care Timeline Update, accessed June 6, 2013, available at www.mass.gov/eohhs/provider/guidelines-resources/services-planning/national-health-care-reform-plan/federal-health-care-reform-initiatives/integrating-medicare-and-medicaid/related-information.html. Prior to announcing its revised enrollment effective dates, Massachusetts had decided to delay passive enrollment of beneficiaries in the high community need and community high behavioral health need categories until calendar year 2014. MassHealth presentation at slide 7, Open Meeting, May 17, 2013, available at www.mass.gov/eohhs/provider/guidelines-resources/services-planning/national-health-care-reform-plan/federal-health-care-reform-initiatives/integrating-medicare-and-medicaid/materials-from-previous-meetings.html.
21 Email from Daniel Farmer, Special Assistant to the Director, Medicare-Medicaid Coordination Office (May 31, 2013) (on file with author).
22 The first phase of Washington’s health homes includes Asotin, Benton, Clark, Cowlitz, Columbia, Franklin, Garfield, Kittitas, Klickitat, Pierce, Skamania, Wahkiakum, Walla Walla, and Yakima Counties.
23 In California’s demonstration, in calendar year 2014, CMS will apply “an appropriate Medicare Advantage coding intensity adjustment reflective of all prime contractor plan enrollees.” In 2015 and 2016, CMS will apply “the prevailing Medicare Advantage coding intensity adjustment factor.”
24 Massachusetts recently revised its 2013 savings to zero. MassHealth presentation at slide 5, Open Meeting, May 17, 2013, available at www.mass.gov/eohhs/provider/guidelines-resources/services-planning/national-health-care-reform-plan/federal-health-care-reform-initiatives/integrating-medicare-and-medicaid/materials-from-previous-meetings.html. Demonstration year one in Massachusetts lasts from 2013 through December 2014.
25 Massachusetts anticipates savings of greater than 4% in year 3 (approximately 4.2%) to make up for foregone savings in year one. Massachusetts Demonstration to Integrate Care for Dual Eligible Individuals, Updated Rate Report, May 15, 2013 at 18, available at www.mass.gov/eohhs/docs/eohhs/healthcare-reform/state-fed-comm/duals-demo-cy2013-payment-rates.pdf.
26 Demonstration year one in Virginia encompasses February 2014 through December 2015. 27 In Virginia’s demonstration, in calendar year 2014, CMS will apply “an appropriate coding intensity adjustment based on the
proportion of the target population with prior Medicare Advantage experience on a county-specific basis.” After calendar year 2014, CMS will apply “the prevailing Medicare Advantage coding intensity adjustment for all [e]nrollees.”
28 California’s Medicaid rating categories include institutionalized (90 or more days), HCBS High (high utilizers), HCBS Low (low utilizers), and Community Well (no HCBS).
29 In Phase I, California’s risk adjustment methodology will be applied monthly and retroactively to match actual plan enrollment, continuing through each county’s enrollment phase-in period (except San Mateo) for a minimum of one year, ending at the start of the next fiscal quarter. Phase II will last for one fiscal quarter (except two quarters in San Mateo) in which the risk adjustment methodology will be applied prospectively at the start of the quarter and risk category weighting will be based on enrollment in the month preceding the quarter and applied retroactively. In Phase III, plan rates will be based on a targeted relative mix of the population (based on plan enrollment leading up to the start of Phase III and including an assumed shift in population mix based on assumptions about the plan’s ability to promote community services and prevent or delay institutional placement) and will not be adjusted during the year (however, if the population mix results in greater than 2.5% impact on the Medicaid rate paid as compared to the rate that would have been paid based on the actual mix, then the plan and Medicaid will share equally in any cost increases or decreases beyond 2.5%, regardless of actual plan gain or loss).
30 California’s limited down-side risk corridor applies county-specific interim savings percentages to establish initial capitation rates; if plan costs exceed the initial capitation rates (excluding Part D), Medicare and Medicaid will reimburse the plan 67% of the costs above the initial capitation rates, provided that total federal and state payments to the plan cannot exceed the demonstration minimum savings percentage for the applicable year. California’s limited up-side risk corridor is as follows: difference between demonstration minimum savings percentage and county specific savings percentage, plans retain 100% (if county savings percentage is the same as the demonstration minimum savings percentage, this band is based on the difference between the minimum savings percentage and maximum demonstration savings percentages of 1.5% in year one, 3.5% in year two, and 5.5% in year three); from upper limit of first band applying the same number of percentage points, Medicare and Medicaid share in 50% of plan savings and plan shares in the other 50%; for all amounts above the upper limit of the second band, plans retain 100%.
17Financial Alignment Demonstrations for Dual Eligible Beneficiaries Compared: States with Memoranda of Understanding Approved by CMS
31 Illinois’ Medicaid rating categories will be stratified by age (21-64 and 65+), geographic region, and care setting, including nursing facility (except that the HCBS waiver rate applies for the first three months after transition from waiver to nursing facility), HCBS waiver, waiver plus (for the first three months for beneficiaries moving from a nursing facility to a HCBS waiver), and community (do not meet nursing home level of care, reside in a nursing facility or qualify for an HCBS waiver).
32 Massachusetts’ Medicaid rating categories include facility-based care (long-term stay of more than 90 days), high community needs (skilled need seven days a week; 2 or more ADL limitations and need for skilled nursing 3 or more days a week; or 4 or more ADL limitations), community high behavioral health (based on specific diagnosis of ongoing chronic condition), and community other. Massachusetts subsequently refined its rating categories so that the high community needs and community high behavioral health categories each will be split to separate beneficiaries with certain chronic diagnoses that lead to costs considerably above average for the overall rating category. MassHealth presentation at slide 7, Open Meeting, May 17, 2013, available at www.mass.gov/eohhs/provider/guidelines-resources/services-planning/national-health-care-reform-plan/federal-health-care-reform-initiatives/integrating-medicare-and-medicaid/materials-from-previous-meetings.html.
33 Massachusetts’ high cost risk pools apply to the facility-based care and high community needs rating categories. A portion of the base Medicaid capitation rate for each of these rating categories will be withheld from all ICOs and placed into a risk pool that will be divided among ICOs based on their percent of total costs above a threshold amount for select Medicaid LTSS.
34 Massachusetts’ risk corridor tiers have been revised as follows: greater than 20% gain or loss, plans bear entire risk/reward; 3-20% gain or loss, plans bear 50% of risk/reward and state and CMS share in other 50%; up to 3% gain or loss, plans bear entire risk/reward. MassHealth presentation at slide 9, Open Meeting, May 17, 2013, available at www.mass.gov/eohhs/provider/guidelines-resources/services-planning/national-health-care-reform-plan/federal-health-care-reform-initiatives/integrating-medicare-and-medicaid/materials-from-previous-meetings.html.
35 Ohio’s rating categories include community well (varies by age group (18-44, 45-64, 65+) and geographic region) and nursing facility level of care (waiver enrollment or 100 or more days in nursing facility, single rate for each region, plan continues to receive nursing facility rate for three months after a beneficiary is determined to no longer meet this level of care).
36 Virginia’s rating categories include community well ages 21-64, community well age 65+, nursing facility level of care ages 21-64, and nursing facility age 65+. Beneficiaries are eligible for the nursing facility categories if they are enrolled in an HCBS waiver or spend 20 or more consecutive days in a nursing facility. Plans will continue to receive the nursing facility rate for two months after a beneficiary is determined to no longer meet that level of care. Rates within each category will vary by region.
37 Four plans will operate in San Diego County (Care 1st, Community Health Group, Health Net, and Molina) (geographic managed care). Two plans will operate in Alameda County (Alameda Alliance for Health and Anthem Blue Cross), Los Angeles County (Health Net (partner plan Molina) and L.A. Care (partner plans CareMore (Anthem Blue Cross), Care 1st, Kaiser, SCAN)); Riverside County (Inland Empire Health Plan and Molina Healthcare), San Bernardino County (Inland Empire Health Plan and Molina Healthcare), and Santa Clara County (Anthem Blue Cross and Santa Clara Family Health Plan) (two-plan model counties). One plan will operate in Orange County (CalOptima) and San Mateo County (Health Plan of San Mateo) (county organized health system). Participation is subject to plans satisfying the demonstration readiness review criteria. Coordinated Care Initiative Passage (July 3, 2012), available at www.calduals.org/2012/07/03/coordinated-care-initiative-passage/#more-1852
38 Six plans will be offered in the Greater Chicago region (Aetna, IlliniCare/Centene, Meridian, HealthSpring, Humana, Healthcare Service Company/Blue Cross Blue Shield), and two plans will be offered in the Central Illinois region (Molina and Health Alliance). Participation is subject to plans satisfying the demonstration readiness review criteria. “Illinois Names Eight Healthcare Plans to Care for Medicaid and Medicare Clients” (Nov. 9, 2012), available at www3.illinois.gov/PressReleases/ShowPressRelease.cfm?SubjectID=2&RecNum=10692.
39 The three plans in Massachusetts are Commonwealth Care Alliance, Fallon Total Care, and Network Health. Email from Catherine Harrison, Senior Policy Manager, Executive Office of Health and Human Services to One Care stakeholders (June 21, 2013) (on file with author). Three more plans, Blue Cross Blue Shield, Boston Medical Center HealthNet, and Neighborhood Health Plan, were originally selected but will not participate in the demonstration. Participation is subject to plans satisfying the demonstration readiness review criteria. Massachusetts Executive Office of Health and Human Services, Related Information, ICO Selection Announcement, available at www.mass.gov/eohhs/provider/guidelines-resources/services-planning/national-health-care-reform-plan/federal-health-care-reform-initiatives/integrating-medicare-and-medicaid/related-information.html.
40 Two plans will operate in the following regions: Northwest (Aetna, Buckeye/Centene), Southwest (Aetna, Molina), West Central (Buckeye/Centene, Molina), Central (Aetna, Molina), East Central (CareSource, United), and Northeast Central (CareSource, United). Three plans will operate in the Northeast region (Buckeye/Centene, CareSource, United). Participation is subject to plans satisfying the demonstration readiness review criteria. Ohio’s Integrated Care Delivery System Update: Aug. 27, 2012, available at www.healthtransformation.ohio.gov/LinkClick.aspx?fileticket=CEnFHbwxoYg%3d&tabid=105.
41 Virginia has not yet selected its demonstration plans. Plan responses to Virginia’s Request for Proposals were due on May 15, 2013. See www.dmas.virginia.gov/Content_pgs/altc-enrl.aspx.
18Financial Alignment Demonstrations for Dual Eligible Beneficiaries Compared: States with Memoranda of Understanding Approved by CMS
42 Washington’s health home care coordination organizations in coverage area 4 (Pierce County) and coverage area 5 (Clark, Cowlitz, Klickitat, Skamania, and Wahkiakum Counties) include Community Health Plan of Washington, Coordinated Care Corporation, Optum Regional Support Network, and UnitedHealthCare of Washington. Coverage area 7 (Asotin, Benton, Columbia, Franklin, Garfield, Kittitas, Walla Walla, and Yakima Counties) includes the same organizations as coverage areas 4 and 5 plus Southeast Washington Aging and Long-Term Care. Health home care coordination organizations for other regions will be announced beginning October 1, 2013. Washington Health Care Authority news release, “Health Care Authority, DSHS to launch Health Homes for better service delivery, integration on July 1” (June 28, 2013).
43 MassHealth presentation at slide 21, Open Meeting, May 17, 2013, available at www.mass.gov/eohhs/provider/guidelines-resources/services-planning/national-health-care-reform-plan/federal-health-care-reform-initiatives/integrating-medicare-and-medicaid/materials-from-previous-meetings.html.
the henry j. kaiser family foundation
Headquarters2400 Sand Hill RoadMenlo Park, CA 94025Phone 650-854-9400 Fax 650-854-4800
Washington Offices and Barbara Jordan Conference Center1330 G Street, NW Washington, DC 20005 Phone 202-347-5270 Fax 202-347-5274
www.kff.org
This publication (#8426-03) is available on the Kaiser Family Foundation’s website at www.kff.org.
The Kaiser Family Foundation, a leader in health policy analysis, health journalism and communication, is dedicated to filling the need for trusted, independent information on the major health issues facing our nation and its people. The Foundation is a non-profit private operating foundation, based in Menlo Park, California.