Financial Analysis and Planning Authors: Richard A. Jackson, PhD Mercer University, Southern School of Pharmacy Atlanta, Georgia D.C. Huffman, Jr., PhD American College of Apothecaries Memphis, Tennessee
Transcript
Financial Analysis and Planning
Authors:Richard A. Jackson, PhD
Mercer University, Southern School of PharmacyAtlanta, Georgia
D.C. Huffman, Jr., PhDAmerican College of Apothecaries
Memphis, Tennessee
Learning Objectives• Define and explain solvency, undertrading,
overtrading, funded debt, inventory turn-over, networking capital, networking capital turnover, capital turnover, return on investment
• Define, calculate from the appropriate financial statement and state the acceptable value for the following ratios: acid test, current ration, NP/NS, NP/NW, INV turnover, A.R.C.P. and A.P.C.P.
• Given a financial ratio state, know whether it is indicative of solvency, efficiency or profitability
Learning Objectives• Given a financial ratio that is outside the acceptable
range, state the possible reason(s) and offer appropriate remedial action
• Given an income statement and/or balance sheet, compare the components with the appropriate NCPA Pharmacia Digest
• Describe and conduct a trend analysis• Given the results of a financial analysis, develop a pro
forma income statement and balance sheet based upon recommendations developed from the analysis
Financial Analysis
• Fiscal exam• Physical exam• (See Figure 1)
Financial Analysis
• Comparative analysis• Ratio analysis
Comparative Analysis• Express each financial statement
component as a percent of sales• Compare with Digest data
The NCPA Pharmacia Digest• Income statement data (see Figure 2)
- Sales volume- Prescription volume
• Balance sheet data (see Figure 3)
Financial Ratio AnalysisConsists of:• Completing a financial ratio analysis• Properly segmenting the ratios compiled• Comparing these ratios with ratios for the
same enterprise during recent years
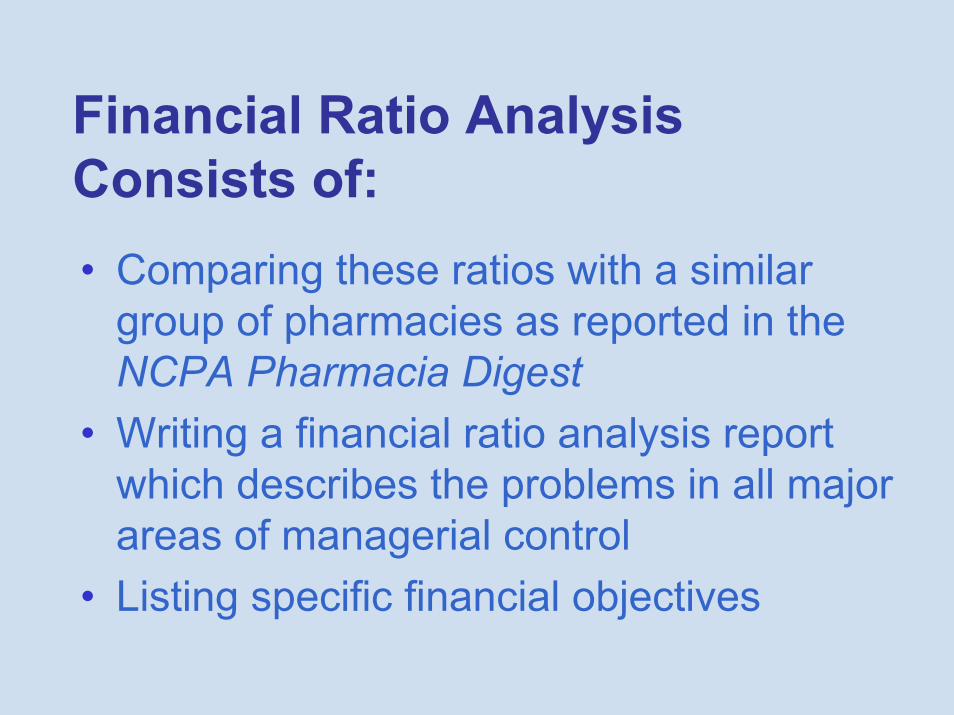
Financial Ratio AnalysisConsists of:• Comparing these ratios with a similar
group of pharmacies as reported in the NCPA Pharmacia Digest
• Writing a financial ratio analysis report which describes the problems in all major areas of managerial control
• Listing specific financial objectives
Major Areas of Ratio Analysis• Solvency• Efficiency• Profitability
SolvencyThe overall ability of the firm to pay its legal debts
EfficiencyHow well the manager is using available capital
Profitability• The proverbial “bottom line” • An important, but not only, measure of business success
Definition and Usual Range of Solvency Ratios
Usual RangeCurrent Ratio = Current Assets
Current Liabilities ≥ 2:1
Acid Test Ratio: Cash + ARCurrent Liabilities ≥ 1:1
Definition and Usual Range of Solvency RatiosCurrent Liabilities Usual RangeAverage Inventory x 100 (≤ 50%)
Total LiabilitiesNet Worth x 100 (≤ 100%)
Definition and Usual Range of Solvency Ratios
Usual RangeFixed Assets x 100 (25-25%)Net Worth
Long Term Debt (Funded Debt) x 100Net working capital (≤ 50%)
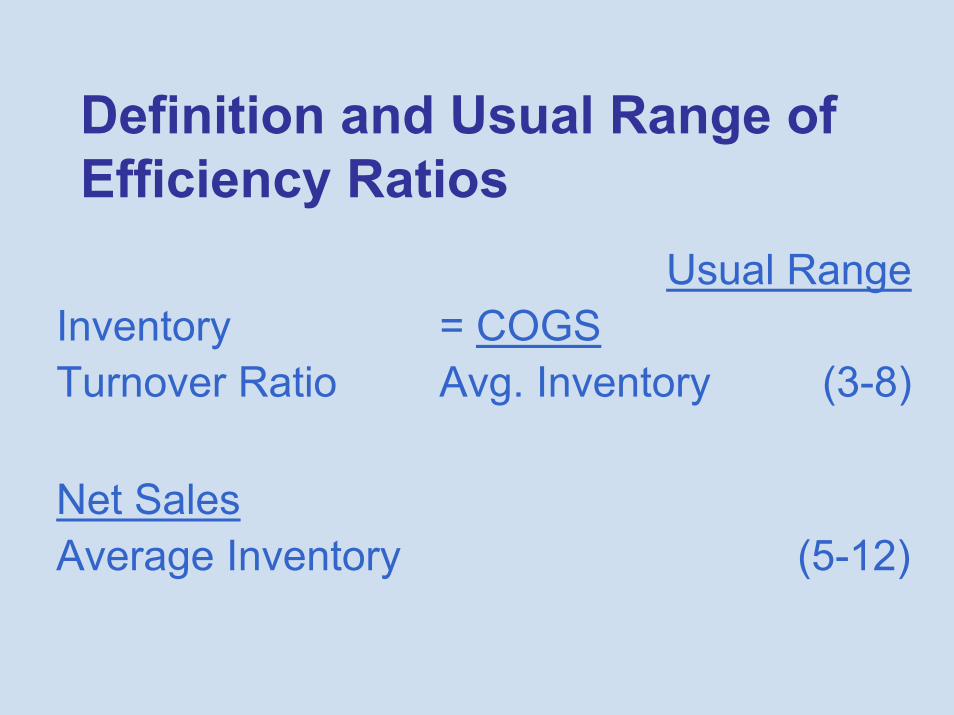
Definition and Usual Range of Efficiency Ratios
Usual RangeInventory = COGSTurnover Ratio Avg. Inventory (3-8)
Net Sales Average Inventory (5-12)
Definition and Usual Range of Efficiency Ratios
Usual RangeNWC Turnover = Net Sales
NWC (3-8)
Degree of newness of fixed assets >50%
Definition and Usual Range of Efficiency Ratios
Usual Range
APCP = Ending AR Outstanding (30-40 days)Annual Credit Sales/365
APCP = Ending AP Outstanding (15-25 days)Annual Purchases/365
Definition and Usual Range of Profitability Ratios
Usual RangeNet Profit x 100 (3-8%)Net Sales
Return on = Net Profit x100 (20-30%)Net Worth Net Worth
Definition and Usual Range of Profitability Ratios
Usual RangeNet Profit x 100 (10-25%)Total assets
Net Profit x 100 (>20%)Inventory
Net Profit x 100 (20-30%)NWC
Financial Planning for Independent Pharmacies:A Case StudySee Figures 4 and 5
Health Care PharmacyAnytown, USAIncome and Expense Statement (for 8th fiscal year)(See Figure 4)
Cost of Goods Sold:Beginning Inventory $140,000Purchases 770,000Ending Inventory 160,000
Total COGS Sold $750,000 71.4% (75%)Gross Margin $300,000 28.6% (25%)
3. Net Profit x 100 9.6% 7.8% 5.5% >10%Total Assets
Profitability RatiosProfitability Ratios 6th 7th 8th Usual Range4. Net Profit x 100 15% 13% 10% >20%
Inventory
5. Net Profit x 100 15% 14% 10% 20-30%N.W.C.
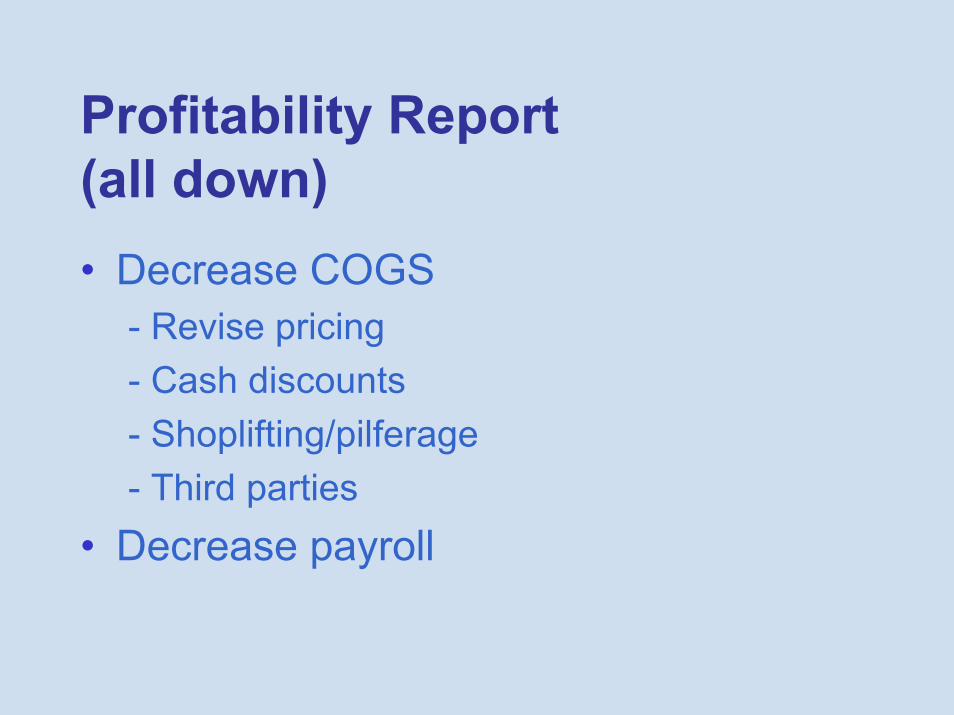
Profitability Report(all down)• Decrease COGS
- Revise pricing- Cash discounts- Shoplifting/pilferage- Third parties
• Decrease payroll
Financial Objectives for the 9th Year1. Project sales of $1,100,000 (NCPA
Pharmacia Digest increase was 5.6%)2. Make cost of goods sold 70% of sales3. Make a net profit of 3% of sales and
increase owner’s salary to 5.7% of sales
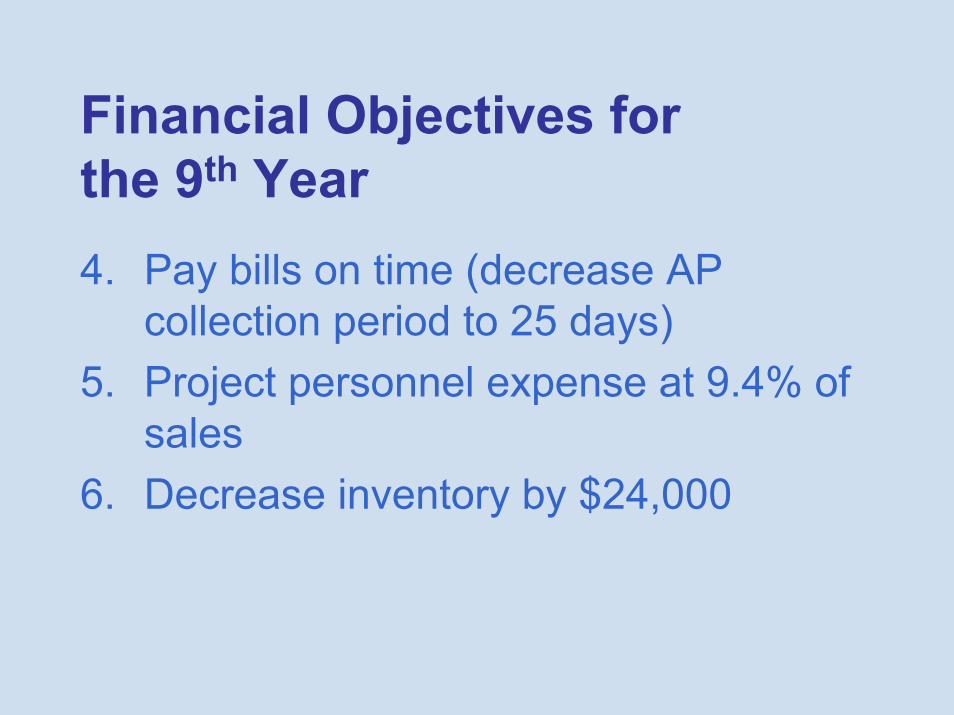
Financial Objectives for the 9th Year4. Pay bills on time (decrease AP
collection period to 25 days)5. Project personnel expense at 9.4% of
sales6. Decrease inventory by $24,000
Financial Objectives for the 9th Year7. Decrease accounts receivable $7,2008. Don’t purchase new fixtures until the
tenth year9. Reinvest one-half of net profit in
pharmacy
Development of Pro Forma Income StatementStep 1: Total Sales $1,100,000.00 (100%)(see figure 6)
Development of Pro Forma Income StatementStep 2: Cost of Goods Sold $770,000 (70%)(see figure 6)
Development of Pro Forma Income StatementStep 3:Gross Margin $330,000 (30%)(see figure 6)
Development of Pro Forma Income StatementStep 4:Proprietor’s/Manager’s Salary $62,700(see figure 6)
Development of Pro Forma Income StatementStep 5:Employee’s Wages $103,400(see figure 6)
Development of Pro Forma Income StatementStep 6:Rent $30,000Utilities $11,000Accounting & Legal Fees $ 4,400Taxes & Licenses $14,000Insurance $11,500(see figure 6)
Development of Pro Forma Income StatementStep 6 (continued):Interest Paid $ 5,000Computer $ 3,000Depreciation $ 5,000Miscellaneous $47,000(see figure 6)
Development of Pro Forma Income StatementStep 7:Net Profit Before Taxes $33,000 (3%)(see figure 6)
Development of Pro Forma Income StatementStep 8:Total Expenses $297,000 (27%)(see figure 6)
Development of Pro Forma Income StatementStep 9:Beginning Inventory $160,000(see figure 6)
Development of Pro Forma Income StatementStep 10:Ending Inventory $136,000(see figure 6)
Development of Pro Forma Income StatementStep 11:Purchases $746,000(see figure 6)
Development of Pro Forma Income StatementBeginning Inventory $160,000+ Purchases 746,000COGAS 906,000- EI -136,000COGS $770,000(see figure 6)
Development of Pro Forma Income StatementStep 12:Prescription Sales $880,000 (80%)(see figure 6)
Development of Pro Forma Income StatementStep 13:Other Sales $220,000 (20%)(see figure 6)
Development of Pro Forma Income StatementStep 14:Add proprietor’s withdrawals
(Salary) 62,700 (5.7%)(see figure 6)
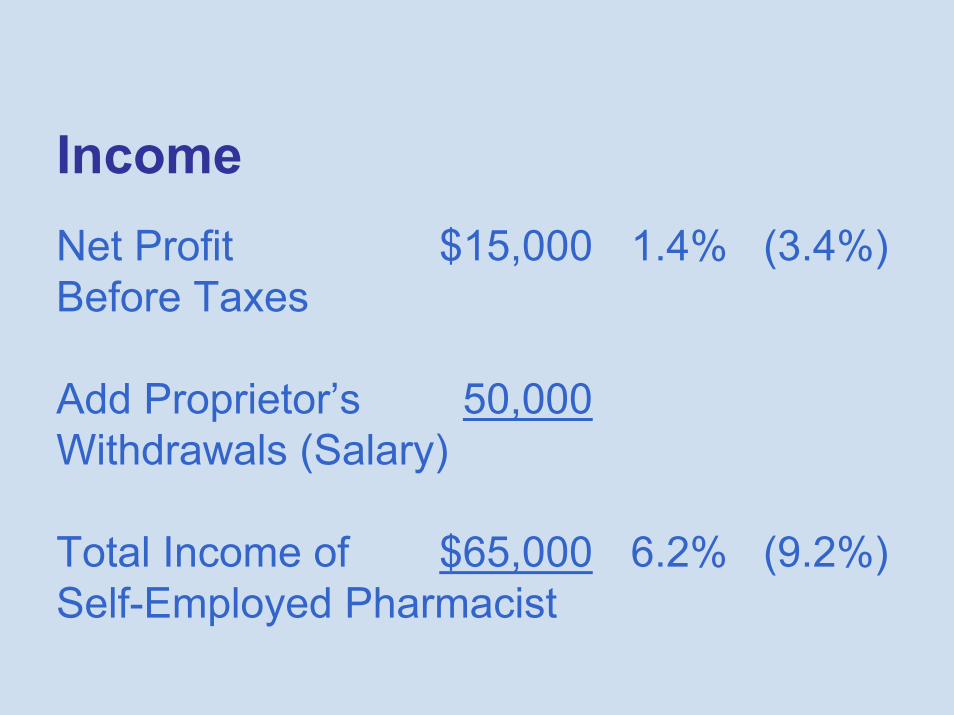
Development of Pro Forma Income StatementStep 15:Total Income of $95,700 (8.7%)Self-Employed Pharmacist(see figure 6)
Development of Pro Forma Balance SheetStep 1:Accounts Receivable $67,800(see figure 7)
Development of Pro Forma Balance SheetStep 2:Inventory $136,000(see figure 7)
Development of Pro Forma Balance SheetStep 3:Original Fixtures $45,000& Equipment Cost(see figure 7)
Development of Pro Forma Balance SheetStep 4:Less: Accumulated Depreciation $35,000(see figure 7)
Development of Pro Forma Balance SheetStep 5:Net Fixed Assets $10,000(see figure 7)
Development of Pro Forma Balance SheetStep 6:Prepaid Expenses $10,000(see figure 7)
Development of Pro Forma Balance SheetStep 7:Accounts Payable $51,000(see figure 7)
Development of Pro Forma Balance SheetTo Decrease APCP to 25 Days• APTO = 365/25 = 14.6• APTO = Purchases/AP• 14.6 = $746,000/AP• AP = $51,000(see figure 7)
Development of Pro Forma Balance SheetStep 8:Notes Payable (1 year) $30,000(see figure 7)
Development of Pro Forma Balance SheetStep 9:Accrued Expenses $10,000(see figure 7)
Development of Pro Forma Balance SheetStep 10:Total Current Liabilities $91,000(see figure 7)
Development of Pro Forma Balance SheetStep 11:Notes Payable $45,000(see figure 7)
Development of Pro Forma Balance SheetStep 12:Net Worth $141,500(Old NW + ½ NP)($125,000 + ½ [$33,000])(see figure 7)
Development of Pro Forma Balance SheetStep 13:Total Liabilities and Net Worth $277,500(see figure 7)
Development of Pro Forma Balance SheetStep 14:Total Assets $277,500A – L = NWA = NW + L(see figure 7)
Development of Pro Forma Balance SheetStep 15:Total Current Assets $257,500(see figure 7)
Development of Pro Forma Balance SheetStep 16:Cash $53,700(see figure 7)
Summary• Conducted a complete and thorough
financial analysis of a community pharmacy.
• Identified real and potential problems along with ways to solve or ameliorate those problems and plan for the future.
• Developed budgets and pro forma financial statements.