FINANCIAL ANALYSIS OF BANKS IN BANGLADESH By Aruna Srinivasan and Richard L. Meyer Department of Agricultural Economics and Rural Sociology The Ohio State University 2120 Fyffe Road Columbus, Ohio 43210 April 1987
Transcript
FINANCIAL ANALYSIS OF BANKS IN BANGLADESH
By
Aruna Srinivasan
and
Richard L. Meyer
Department of Agricultural Economics
and Rural Sociology
The Ohio State University
2120 Fyffe Road
Columbus, Ohio 43210
April 1987
ACKNOWLEDGEMENT
This paper represents the initial analysis conducted by the senior
author at OSU on the issue of bank viability in Bangladesh. This study is
part of the research being conducted through the USAID Rural Finance
Project. We wish to acknowledge with appreciation the support and
assistance provided by USAID, Robert R. Nathan Associates, and the
Bangladesh Bank in conducting this research, and the comments provided by
Arthur O'Donnell on an earlier draft of this paper. The views expressed in
this paper are our own and may not necessarily be shared by any of these
organizations.
Bank Financial Analysis
I. Introduction
This paper presents financial analysis of a sample of 71 rural branches
of three nationalized commercial banks (NCBs) - Agrani, Janata, Rupali - and
Bangladesh Krishi Bank (BKB). These branches form part of the sample of 101
rural bank branches that were selected for study under the Rural Finance
Project. Data for 30 branches of Sonali Bank are incomplete; that bank will
be incorporated into the study when the data become available. The purpose
of the analysis summarized in this paper is four-fold:
1. It is intended to supplement O'Donnell's analysis of financial statements
and memos on related subjects [4,5,6,7,8,9,10,11] based on the consolidated
statements of individual banks. The intent is to compare the performance of
a sample of rural branches with that of the entire bank of which they are a
part. It has been alleged that the rural branch network in Bangladesh is
subsidized by the relatively more profitable urban branches [13]. This
analysis of financial statements is expected to shed light on the cross
subsidization hypothesis.
2. One of the Rural Finance Project's goals is to help develop a viable
rural banking system in Bangladesh. O'Donnell [11) contends that the concept
of viability has three possible interpretations in Bangladesh. They are, in
order of importance, meeting national objectives, liquidity, and
profitability. Relatively little work has been done to study bank
profitability and efficiency in Bangladesh. This paper represents a
preliminary attempt to understand the viability of rural bank branches from
2
the profitability standpoint. The data used consist of balance sheets and
income statements obtained directly from the sample branches. Although these
sources are expected to be more reliable than some of the published data, a
caveat is appropriate. Unrealistic accounting procedures, especially for
overdue loans, make income and, hence, profitability estimates somewhat
suspect. For this reason, a more comprehensive analysis of the viability of
the Bangladeshi banking system is being conducted via estimation of a cost
function, using expense data, and the results will be available in a few
months.
3. Another aspect of financial analysis that requires further study relates
to margins or spreads in banking. Some studies on bank margins in Bangladesh
have been carried out using published data [3,12). They have addressed the
issue of whether the income that accrues to banks from various sources is
sufficient to cover cost of funds, administrative costs, loan losses, and
allow them to break even. Estimating spreads is also expected to aid in
studying the effects of regulatory policies on deposit mobilization and on
the operations of financial intermediaries. For instance ceilings on
deposit rates coupled with reserye requirements have affected branch margins
by raising the real cost of mobilizing deposits relative to refinancing from
the Bangladesh Bank.
4. Finally, examination and quantification of relationships among elements
of cost and revenue may shed some light on observed patterns of portfolio
behavior which are believed to be the result of cost-minimizing activities
of individual banks given the highly regulated environment prevalent in
Bangladesh.
3
This paper is organized as follows. A brief description of the data and
defirition of relevant variables follows in Sections I.1 and 1.2. Section II
deals with banking performance in Bangladesh and is divided into two sub
sections. Section II.1 analyzes three different measures of bank expense.
Financial ratios constructed from the balance sheets and income-expense
statements are studied in Section 11.2. Finally, Section III delineates the
limitaticns of the study and presents some conclusions.
1.1. Data
The data used in this study consisted of the following:
1. Income-expense statements for 71 bank branches for a period of two years,
1983 and 1984. The financiql year for the three NCBs corresponds to the
calendar year, while that for BKB is from July through June. Availability of
data for just two years limits the analysis to two types of comparisons: a)
interbank comparisons of the sample branches and b) comparisons between the
rural branches and the consolidated statements for the entire bank of which
the branches are a part.
2. Balance sheets for the same branches for the same period. Again lack of
data implied that only end of the year data were used rather than average
balance sheets.
3. Branch manager survey data collected from the 71 branches by R.R.Nathan
Associates during 1985.
4. Advances and deposit data for approximately 4,000 branches of the four
NCBs and BKB for 1983 and 1984, obtained directly from the Bangladesh Bank.
5. Staff strength for the sample of branches for the two years.
6. The age distribution of the sample branches.
4
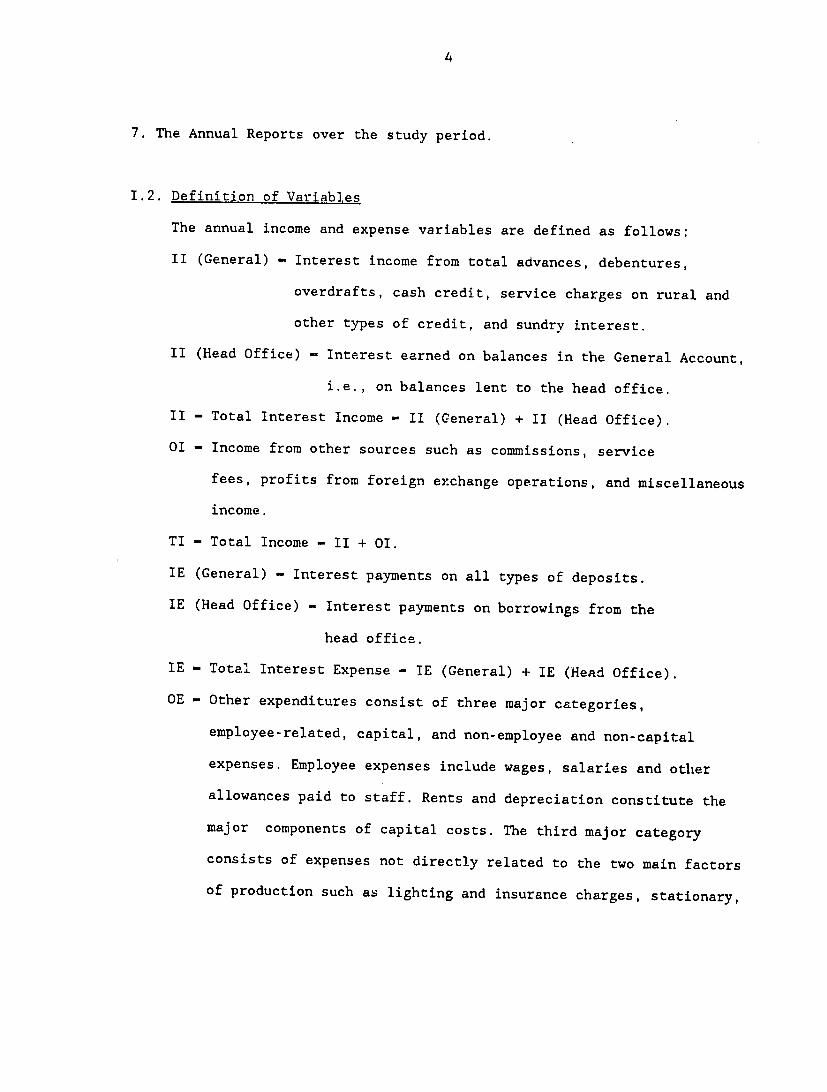
7. The Annual Reports over the study period.
1.2. Definition of Variables
The annual income and expense variables are defined as follows:
II (General) - Interest income from total advances, debentures,
overdrafts, cash credit, service charges on rural and
other types of credit, and sundry interest.
II (Head Office) - Interest earned on balances in the General Account,
i.e., on balances lent to the head office.
II - Total Interest Income - II (General) + II (Head Office).
01 - Income from other sources such as commissions, service
fees, profits from foreign exchange operations, and miscellaneous
income.
TI - Total Income - II + 01.
IE (General) - Interest payments on all types of deposits.
IE (Head Office) - Interest payments on borrowings from the
OE - Other expenditures consist of three major categories,
employee-related, capital, and non-employee and non-capital
expenses. Employee expenses include wages, salaries and other
allowances paid to staff. Rents and depreciation constitute the
major components of capital costs. The third major category
consists of expenses not directly related to the two main factors
of production such as lighting and insurance charges, stationary,
5
telephone, postage, repairs and maintenance, business development
expenses, remittance charges, and miscellaneous expenses.
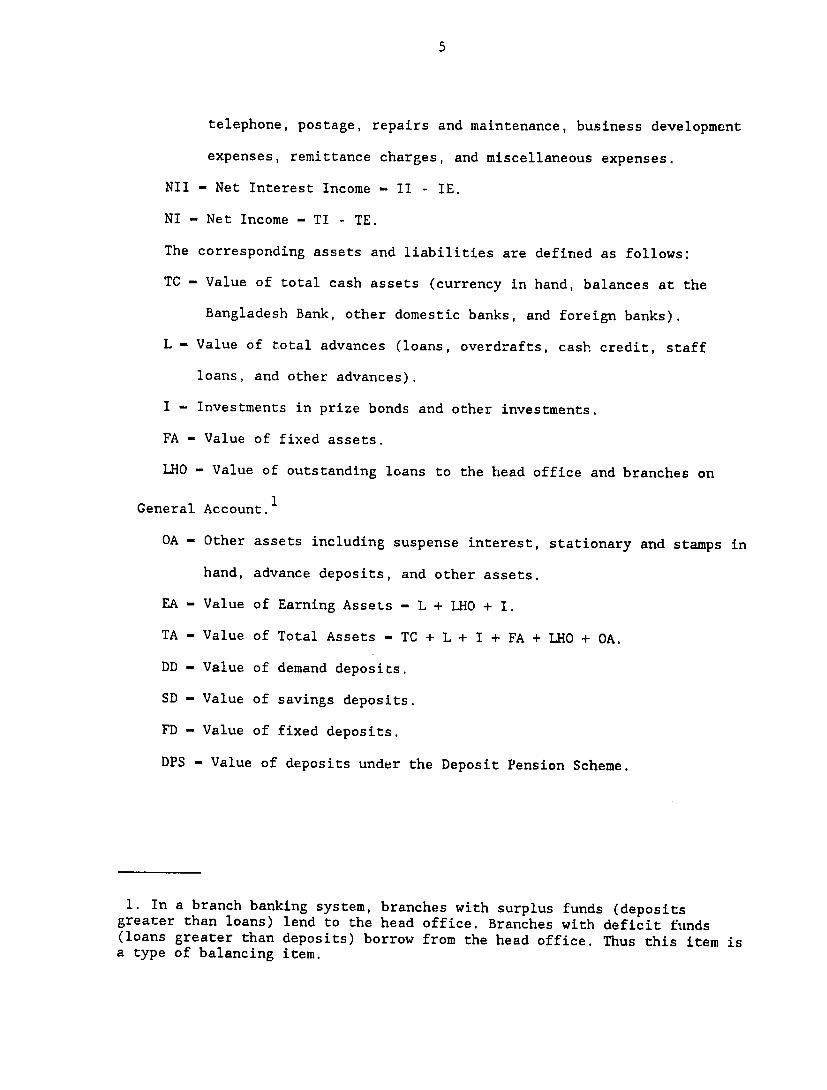
Nil - Net Interest Income - II - IE.
NI - Net Income - TI - TE.
The corresponding assets and liabilities are defined as follows:
TC - Value of total cash assets (currency in hand, balances at the
Bangladesh Bank, other domestic banks, and foreign banks).
L - Value of total advances (loans, overdrafts, cash credit, staff
loans, and other advances).
I - Investments in prize bonds and other investments.
FA - Value of fixed assets.
LHO - Value of outstanding loans to the head office and branches on
General Account.1
OA - Other assets including suspense interest, stationary and stamps in
hand, advance deposits, and other assets.
EA - Value of Earning Assets - L + LHO + I.
TA - Value of Total Assets - TO + L + I + FA + LHO + OA.
DD - Value of demand deposits.
SD - Value of savings deposits.
FD - Value of fixed deposits.
DPS - Value of deposits under the Deposit Pension Scheme.
1. In a branch banking system, branches with surplus funds (depositsgreater than loans) lend to the head office. Branches with deficit finds (loans greater than deposits) borrow from the head office. Thus this item is a type of balancing item.
6
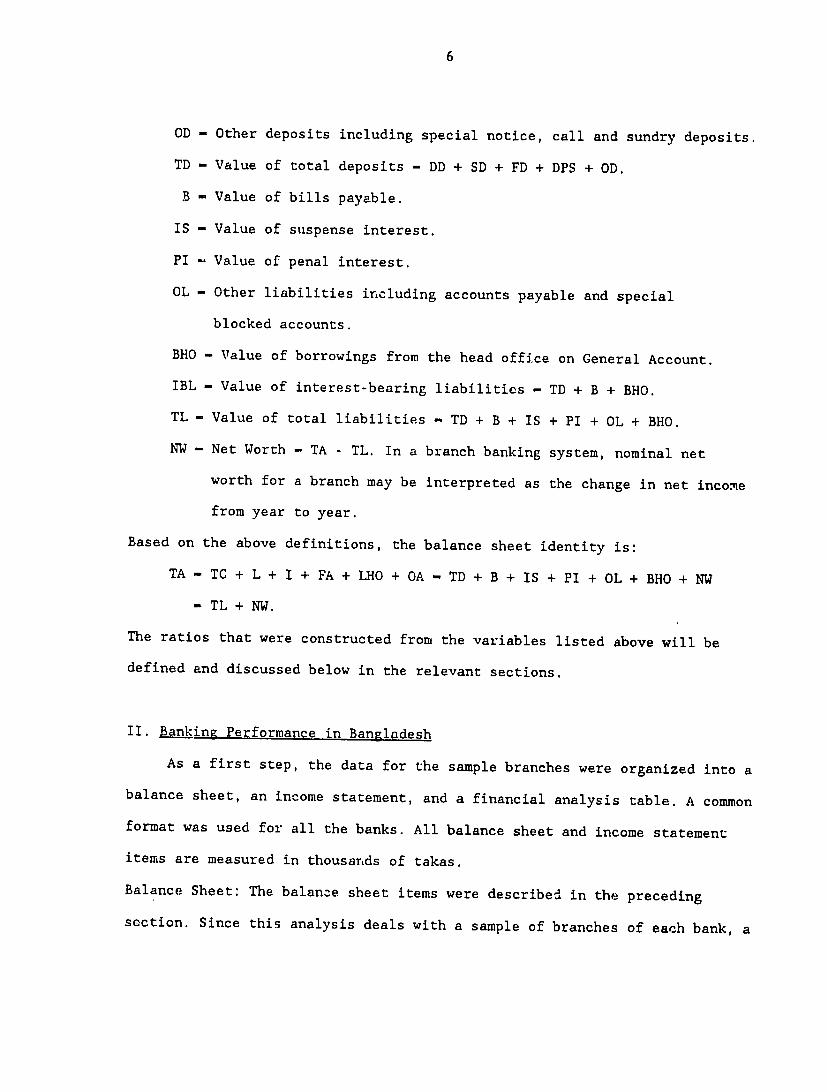
OD - Other deposits including special notice, call and sundry deposits.
TD - Value of total deposits - DD + SD + FD + DPS + OD.
B - Value of bills payable.
IS - Value of suspense interest.
PI -. Value of penal interest.
OL - Other liabilities including accounts payable and special
blocked accounts.
BHO - Value of borrowings from the head office on General Account.
IBL - Value of interest-bearing liabilities - TD + B + BHO.
TL - Value of total liabilities -TD + B + IS + PI + OL + BHO.
NW - Net Worth - TA - TL. In a branch banking system, nominal net
worth for a branch may be interpreted as the change in net income
from year to year.
Based on the above definitions, the balance sheet identity is:
TA - TC + L + I + FA + LHO + OA - TD + B + IS + PI + OL + BHO + NW
- TL + NW.
The ratios that were constructed from the variables listed above will be
defined and discussed below in the relevant sections.
II. Banking Performance in Bangladesh
As a first step, the data for the sample branches were organized into a
balance sheet, an income statement, and a financial analysis table. A common
format was used for all the banks. All balance sheet and income statement
items are measured in thousands of takas.
Balance Sheet: The balance sheet items were described in the preceding
section. Since this analysis deals with a sample of branches of each bank, a
7
couple of clarifications are necessary. First, because each branch is
regarded as a self-contained accounting unit, regional office expenses have
not been allocated to the individual branches. Second, the item "Borrowings
from the head office" includes both refinance and intra-bank flow of funds,
such as urban deposits from the head office to the branches. Although a
detailed breakdown is not available, a priori it seems reasonable to
conclude that in the case of BKB, and to a lesser extent for the NCBs,
refinance constitutes a major portion of branch borrowings from the head
office (See Section 11.2).
Income-expense statements: The items from the branch-level statements were
aggregated to obtain tho measures defined in Section 1.2. It should be noted
that in all banks, Other Expense exceeded Other Income, but overall Net
Income was positive as Net Interest Income outweighed Net Other Income.
The Net Income values obtained from the branch income statements were
not significantly different from the Net Worth values reported in the
balance sheet data for Rupali and BKB. Janata Bank however, showed
significant disparities between the two measures. Agrani Bank appeared to
follow a different accounting system as the item "Due to head office" was
apparently adjusted for remittances of Net Income to the head office. As a
result, all Agrani branches recorded zero Net Worth.
II.1. Bank Expense Measures
The first set of magnitudes that are of interest in the financial
analysis statements are the three bank expense measures. Other Expenses
represent payments to primary factor inputs and raw materials used to
produce banking services such as loans and deposits. One of the factors
8
determining bank viability is the consideration of how well Other Expenses
are controlled and whether or not banks are becoming more efficient over
time. Given the limited time series available, however, the analysis can
only be conducted across banks rather than on a time-series basis.
Three measures of bank efficiency are of interest. All three measures
compute a ratio with the common numerator, the amount of Other Expense,
relative to three different denominators, namely Total Expense, Total
Assets, and total number of employees. The first measure i.e., OE/TE
provides an idea about the relative importance of Interest Expense and Other
(non-inturest) Expense in the total. Because labor costs constitute the
major portion of Other Expenses, the second ratio represents an
approximation of the unit cost per employee of the bank. The third measure
uses Total Assets as a proxy for overall banking output; OE/TA measures the
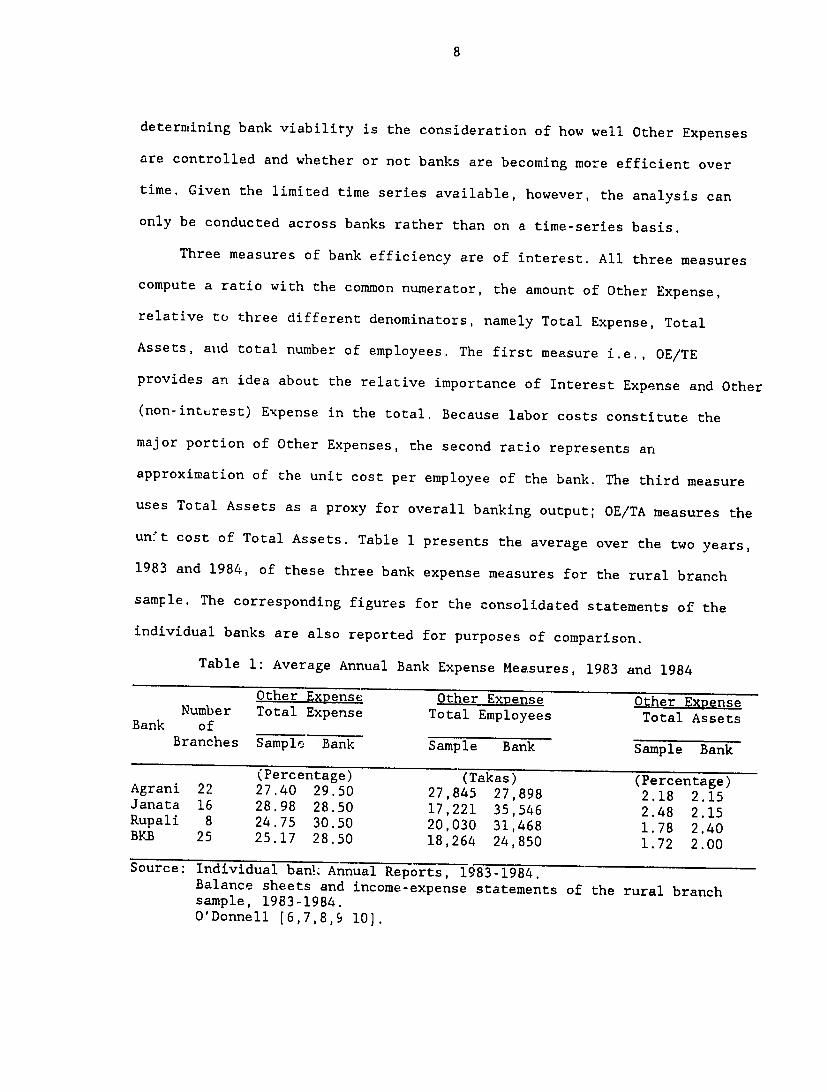
unt cost of Total Assets. Table 1 presents the average over the two years,
1983 and 1984, of these three bank expense measures for the rural branch
sample. The corresponding figures for the consolidated statements of the
individual banks are also reported for purposes of comparison.
Table 1: Average Annual Bank Expense Measures, 1983 and 1984
Number Other Expense Total Expense
Other Expense Total Employees
Other Expense Total Assets
Bank of Branches Sample Bank Sample Bank Sample Bank
Source: Individual ban!. Annual Reports, 1983-1984. Balance sheets and income-expense statements of the rural branch sample, 1983-1984. O'Donnell [6,7,8,9 10].
9
The data in Table 1 reveal that, by and large, the rural branches of
all four banks demonstrate lower or similar ratios for two of the measures
of bank expense, i.e., the ratios of Other Expense to Total Expense and
total employees, relative to the entire bank. The pattern for the ratio of
Other Expense to Total Assets is rather mixed, with the rural branches of
Agrani and Janata seemingly "less efficient" than the overall bank, while
the opposite is true for Rupali and BKB. A comparison of the measures across
banks for the sample branches suggests that BKB is relatively more efficient
than the other banks because it has the lowest OE/TA ratio and next to
lowest OE/TE and OE/Employees ratios. With the expanding role played by BKB
in rural finance in the recent past and its increased participation in
program lending, it is surprising to observe BKB's position relative to the
NCBs. The effects of loan targeting on increasing intermediation costs have
been documented in other studies [2]. Special credit programs have been
shown to increase lenders' costs in other countries due to the additional
personnel and materials necessary to comply with the reporting requirements
of these programs.
From the data presented in Table 1, two conclusions may be drawn.
First, the rural branch sample appears to be relatively more efficient than
the entire bank.2 This may be attributed to the fact that the size of the
typical rural branch of an NCB as measured by Total Assets or total number
2. This observation must be qualified because costs incurred by the headoffice and regional offices were not allocated to the sample branches. It is likely that the gap in expense measures between the sample branches and thebank will narrow if these allocations are made.
10
of employees is smaller than that of a typical urban branch. The size
difference is not as marked for BKB. Further, if banks have U-shaped cost
curves, the rural branches may be experiencing economies of scale, while the
average branch may be in the region of diseconomies. Estimation of the cost
function is expected to yield insights into this issue.
Another interesting feature of Table 1 is the seemingly higher
efficiency of BKB sample branches vis-a-vis the NCBs. This finding is
consistent with those of the World Bank Agricultural Credit Review [3] and
with Smith's study [12]. Again, a plausible explanation may be the
existence of a U-shaped cost curve. The argument runs as follows: although
the average age of the BKB sample branches is almost half that of the NCBs,
their asset portfolios are substantially larger. As a result, BKB branches
may be operating in the "minimum cost" region of the cost curve while the
rural branches of the NCBs are scattered in the downward sloping region of
the cost curve. Higher costs incurred by the NCB branches may also be
warranted by the wide range of financial services they offer relative to
BKB. The unusually low costs of BKB branches are also consistent with
Smith's evidence of minimum loan screening by the rural branches [12].
11.2. Selected Financial Ratios
This section presents a number of ratios analyzing the various
components of income and expense against a standard for each bank. A
relevant and typical standard is the value of earning assets (EA) [8].
Information on incomes and expense is conceptually allocated to output
proxied by EA. The rural branches' earning assets were defined in Section
1.2. as consisting of advances, bills, investments, and lending to the head
11
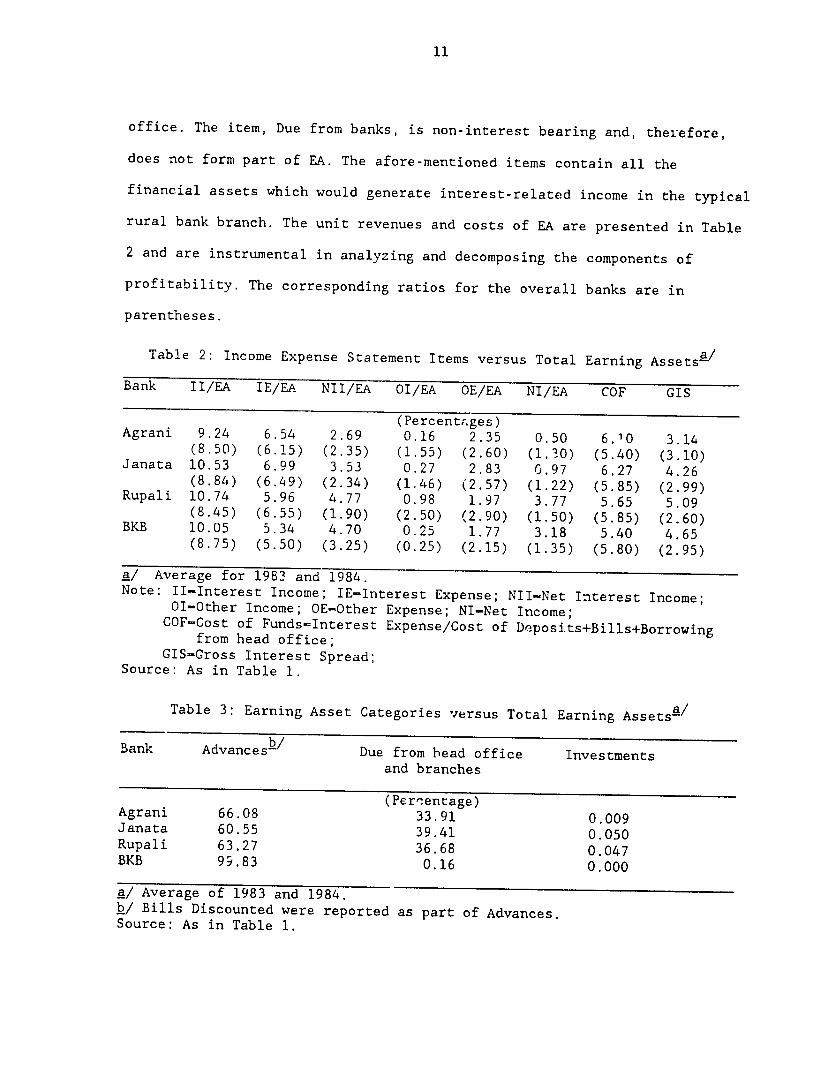
office. The item, Due from banks, is non-interest bearing and, therefore,
does not form part of EA. The afore-mentioned items contain all the
financial assets which would generate interest-related income in the typical
rural bank branch. The unit revenues and costs of EA are presented in Table
2 and are instrumental in analyzing and decomposing the components of
profitability. The corresponding ratios for the overall banks are in
parentheses.
Table 2: Income Expense Statement Items versus Total Earning Assets a /
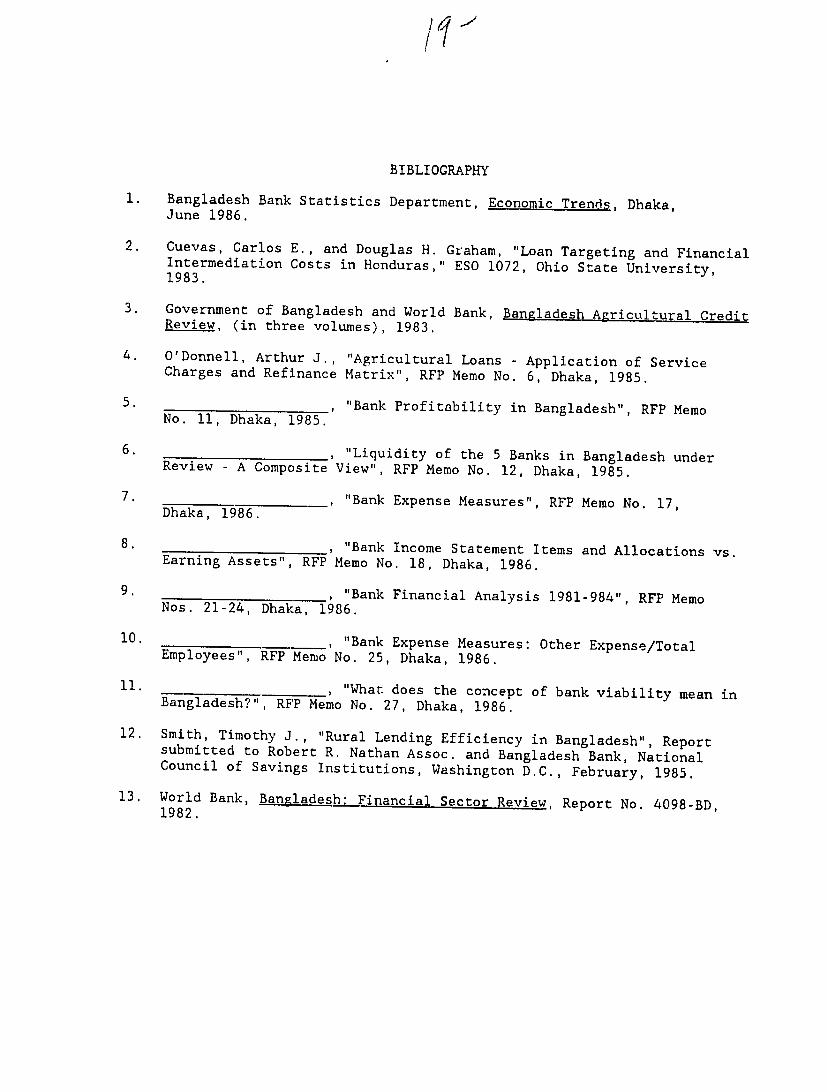
11. , "What does the concept of bank viability mean in Bangladesh?", RFP Memo No. 27, Dhaka, 1986.
12. Smith, Timothy J., "Rural Lending Efficiency in Bangladesh", Reportsubmitted to Robert R. Nathan Assoc. and Bangladesh Bank, National Council of Savings Institutions, Washington D.C., February, 1985.
13. World Bank, Bangladesh: Financial Sector Review, Report No. 4098-BD, 1982.