34
Financial Analysis of Fertiliser Use L. Connolly, B. Moran
| Date post: | 03-Jan-2016 |
| Category: |
Documents |
| Upload: | alisha-newton |
| View: | 215 times |
| Download: | 0 times |

Financial Analysis of Fertiliser Use
L. Connolly, B. Moran
OUTLINE
Farm Numbers : Current & 2015 Trend & Distribution Farm Incomes Trend In Fertiliser Usage Fertiliser Cost By Farm System Fertiliser Usage Full Time/REPS/NON REPS Farms Fertiliser Usage By Region Fertiliser Cost By Level Of Enterprise Performance Summary
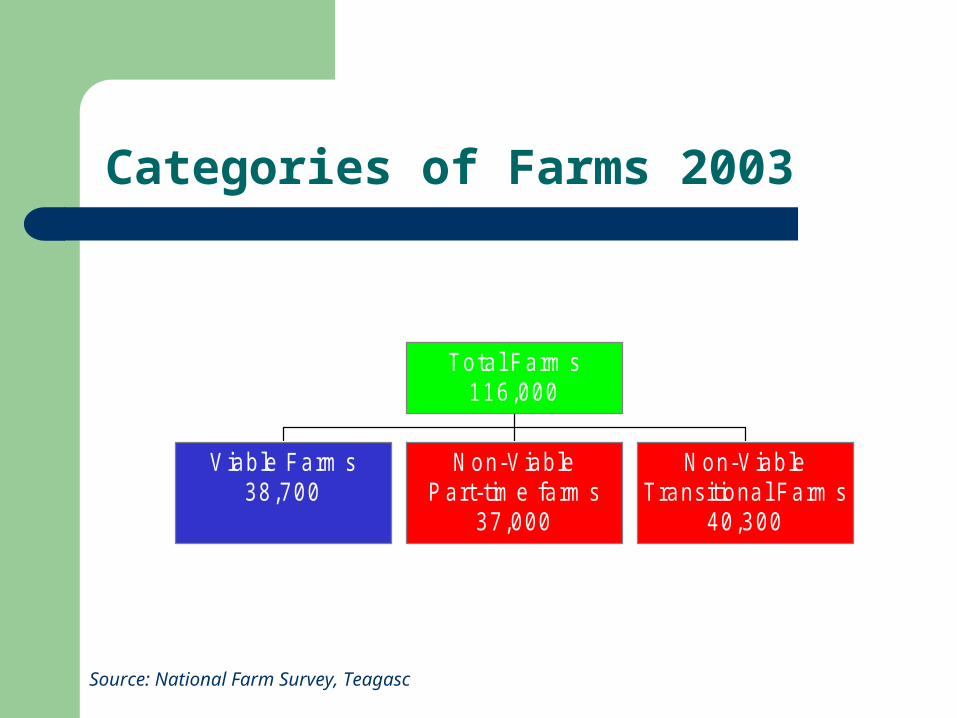
Categories of Farms 2003
Source: National Farm Survey, Teagasc
Viable Farm s38,700
Non-V iablePart-tim e farm s
37,000
Non-V iableTransitional Farm s
40,300
Total Farm s116,000

Categories of Farms 2015
Source: 2015 Committee Report
Viable Farm s40,000
Non-V iablePart-tim e farm s
45,000
Non-viableTransitional Farm s
14,000
Total Farm s99,000

Family Farm Income (FFI)
Source: National Farm Survey, Teagasc
Year €/Farm
1995 14,200
2000 13,500
2001 15,800
2003 14,800
2004 15,600

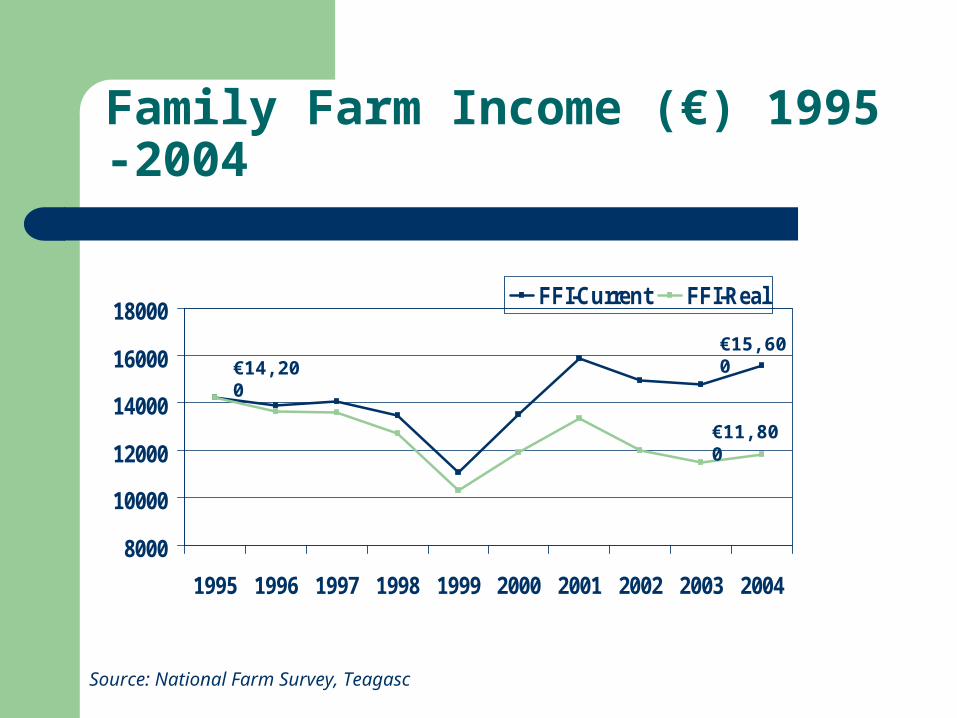
Family Farm Income (€) 1995 -2004
€14,200€15,600
Source: National Farm Survey, Teagasc
8000
10000
12000
14000
16000
18000
1995 1996 1997 1998 1999 2000 2001 2002 2003 2004
FFI-Current FFI-Real
Family Farm Income (€) 1995 -2004
€14,200€15,600
Source: National Farm Survey, Teagasc
8000
10000
12000
14000
16000
18000
1995 1996 1997 1998 1999 2000 2001 2002 2003 2004
FFI-Current FFI-Real
€11,800
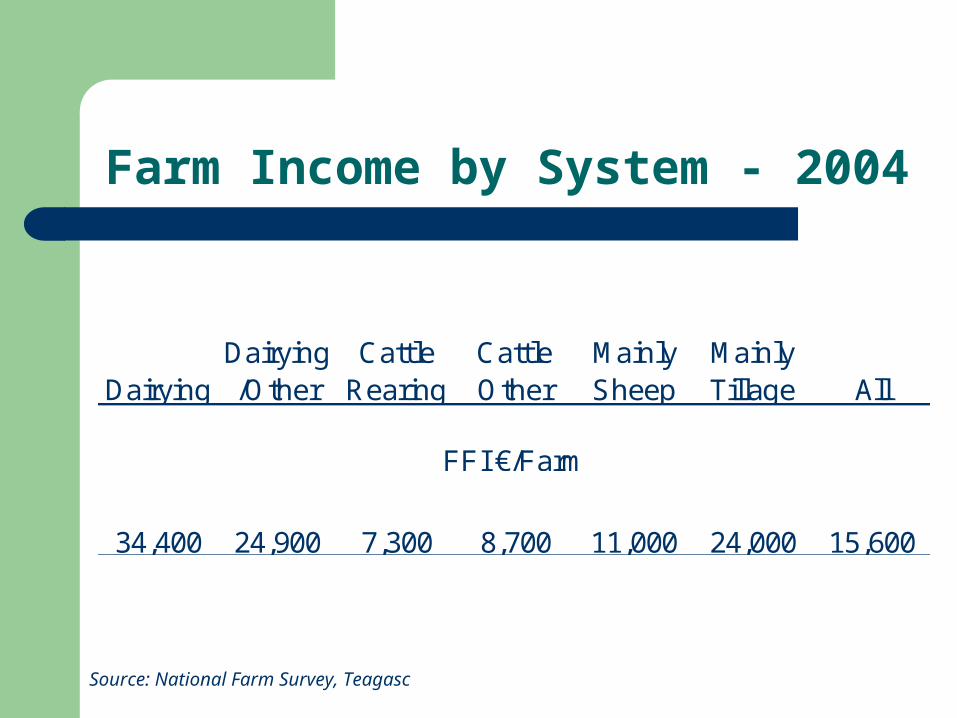
Farm Income by System - 2004
Source: National Farm Survey, Teagasc
DairyingDairying/Other
Cattle Rearing
Cattle Other
Mainly Sheep
Mainly Tillage All
34,400 24,900 7,300 8,700 11,000 24,000 15,600
FFI €/Farm
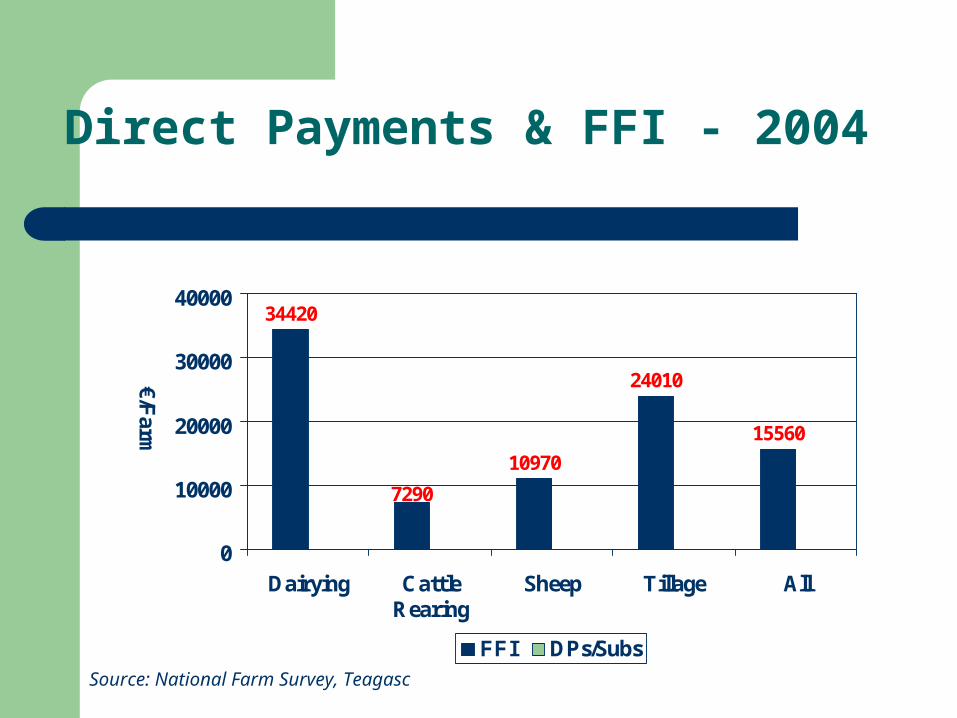
Direct Payments & FFI - 2004
34420
10970
24010
15560
7290
0
10000
20000
30000
40000
Dairying CattleRearing
Sheep Tillage All
€/Farm
FFI DPs/SubsSource: National Farm Survey, Teagasc
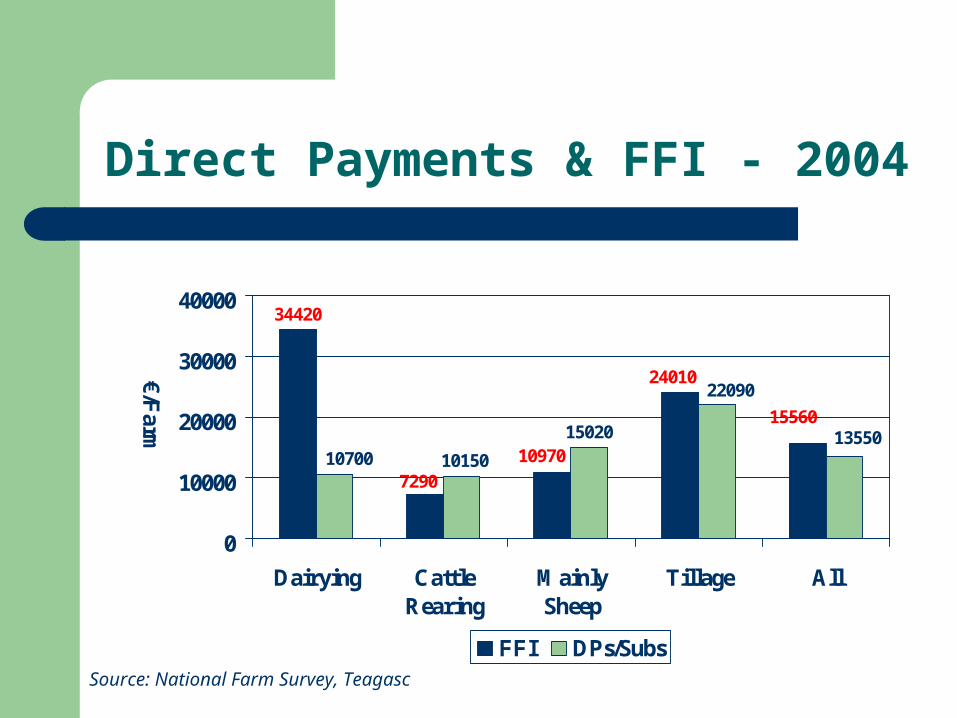
Direct Payments & FFI - 2004
34420
1502010970
24010
15560
7290
1355010700
22090
10150
0
10000
20000
30000
40000
Dairying CattleRearing
MainlySheep
Tillage All
€/Farm
FFI DPs/SubsSource: National Farm Survey, Teagasc

0100200300400500600700800900
€/H
A
Dairying
Dairying/Other
Cattle Rearing
Cattle Other
Mainly Sheep
Mainly Tillage
Farm Income by Enterprise - 2004
Source: National Farm Survey, Teagasc

Trend In Fertiliser Cost/Farm
€/Farm1990 1,9951995 2,3802000 2,6202001 3,0802002 3,0202003 3,0752004 2,940
Source: National Farm Survey, Teagasc

Trend In Fertiliser Cost/Farm
Year Fertiliser Fertiliser€/Farm % Direct Costs
1990 1,995 211995 2,380 192000 2,620 192001 3,080 212002 3,020 192003 3,075 202004 2,940 19
Source: National Farm Survey, Teagasc

Trend In Fertiliser Cost/Farm
Year Fertiliser Fertiliser Fertiliser€/Farm % Direct Costs % Farm Income
1995 2,380 19 192000 2,620 19 182001 3,080 21 192002 3,020 19 202003 3,075 20 202004 2,940 19 19
Source: National Farm Survey, Teagasc

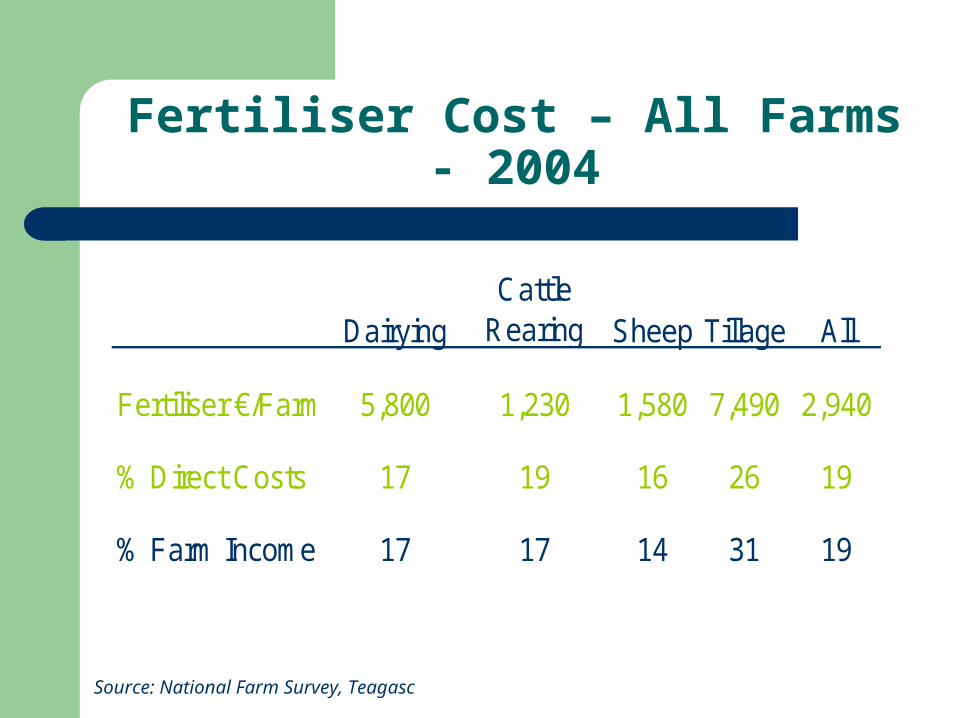
Fertiliser Cost – All Farms - 2004
DairyingCattle
Rearing Sheep Tillage All
Fertiliser €/Farm 5,800 1,230 1,580 7,490 2,940
Source: National Farm Survey, Teagasc

Fertiliser Cost – All Farms - 2004
DairyingCattle
Rearing Sheep Tillage All
Fertiliser €/Farm 5,800 1,230 1,580 7,490 2,940
% Direct Costs 17 19 16 26 19
Source: National Farm Survey, Teagasc
Fertiliser Cost – All Farms - 2004
DairyingCattle
Rearing Sheep Tillage All
Fertiliser €/Farm 5,800 1,230 1,580 7,490 2,940
% Direct Costs 17 19 16 26 19
% Farm Income 17 17 14 31 19
Source: National Farm Survey, Teagasc
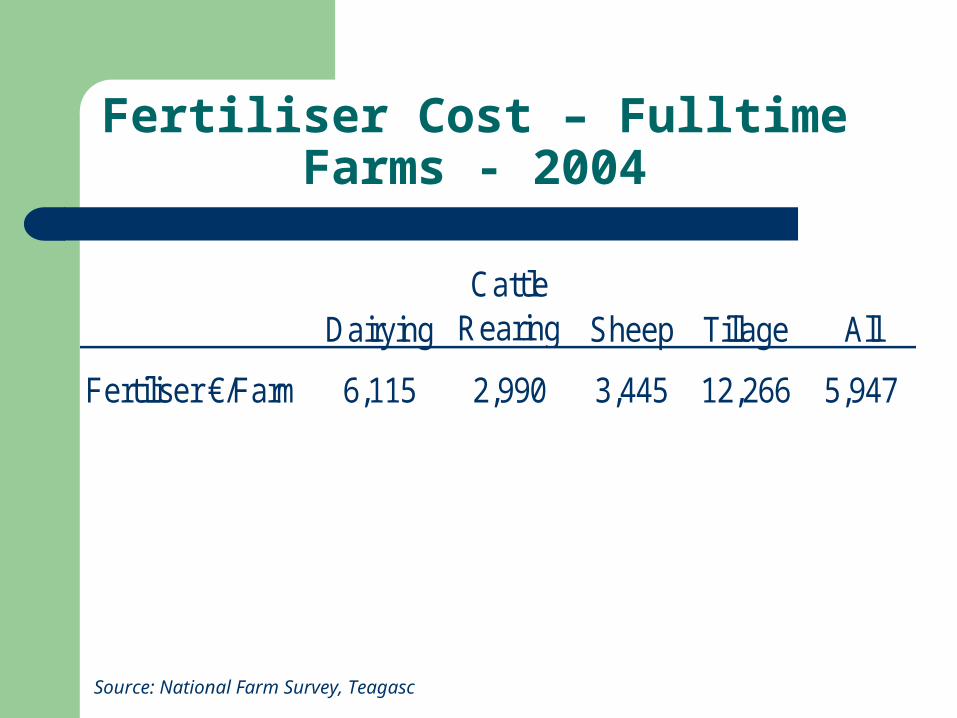
Fertiliser Cost – Fulltime Farms -
2004
DairyingCattle
Rearing Sheep Tillage All
Fertiliser €/Farm 6,115 2,990 3,445 12,266 5,947
Source: National Farm Survey, Teagasc

Fertiliser Cost – Fulltime Farms -
2004
DairyingCattle
Rearing Sheep Tillage All
Fertiliser €/Farm 6,115 2,990 3,445 12,266 5,947
% Direct Costs 17 20 18 26 19
Source: National Farm Survey, Teagasc

Fertiliser Cost – Fulltime Farms -
2004
DairyingCattle
Rearing Sheep Tillage All
Fertiliser €/Farm 6,115 2,990 3,445 12,266 5,947
% Direct Costs 17 20 18 26 19
% Farm Income 17 19 17 32 19
Source: National Farm Survey, Teagasc

0
2000
4000
6000
8000
10000
12000
14000
Dairying CattleRearing
Sheep Tillage All
€/F
arm
Full time farm All farms
Fertiliser Cost Fulltime v All Farms 2004
Source: National Farm Survey, Teagasc
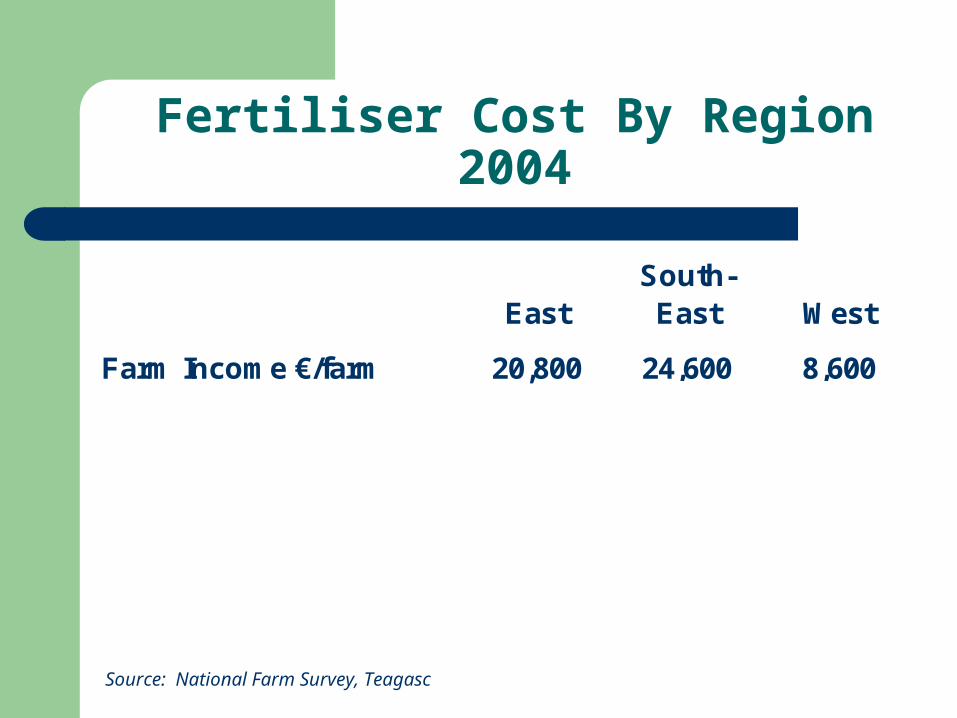
Fertiliser Cost By Region 2004
EastSouth-East West
Farm Income €/farm 20,800 24,600 8,600
Source: National Farm Survey, Teagasc

Fertiliser Cost By Region 2004
EastSouth-
east West
Farm Income €/farm 20,800 24,600 8,600
Fertiliser €/farm 4,480 5,390 1,250
Source: National Farm Survey, Teagasc

Fertiliser Cost By Region 2004
EastSouth-East West
Farm Income €/farm 20,800 24,600 8,600
Fertiliser €/farm 4,480 5,390 1,250
Fertiliser % direct cost 21 20 16
Source: National Farm Survey, Teagasc

Fertiliser Cost By Region 2004
EastSouth-East West
Farm Income €/farm 20,800 24,600 8,600
Fertiliser €/farm 4,480 5,390 1,250
Fertiliser % direct cost 21 20 16
Fertiliser % Farm Income 22 22 14
Source: National Farm Survey, Teagasc
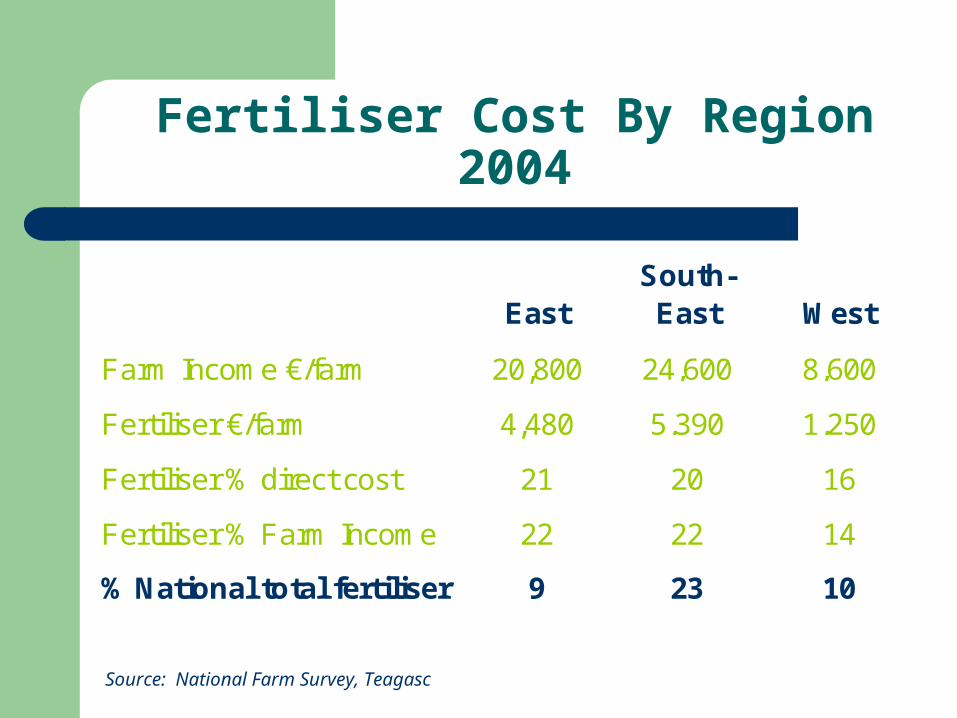
Fertiliser Cost By Region 2004
EastSouth-East West
Farm Income €/farm 20,800 24,600 8,600
Fertiliser €/farm 4,480 5,390 1,250
Fertiliser % direct cost 21 20 16
Fertiliser % Farm Income 22 22 14
% National total fertiliser 9 23 10
Source: National Farm Survey, Teagasc
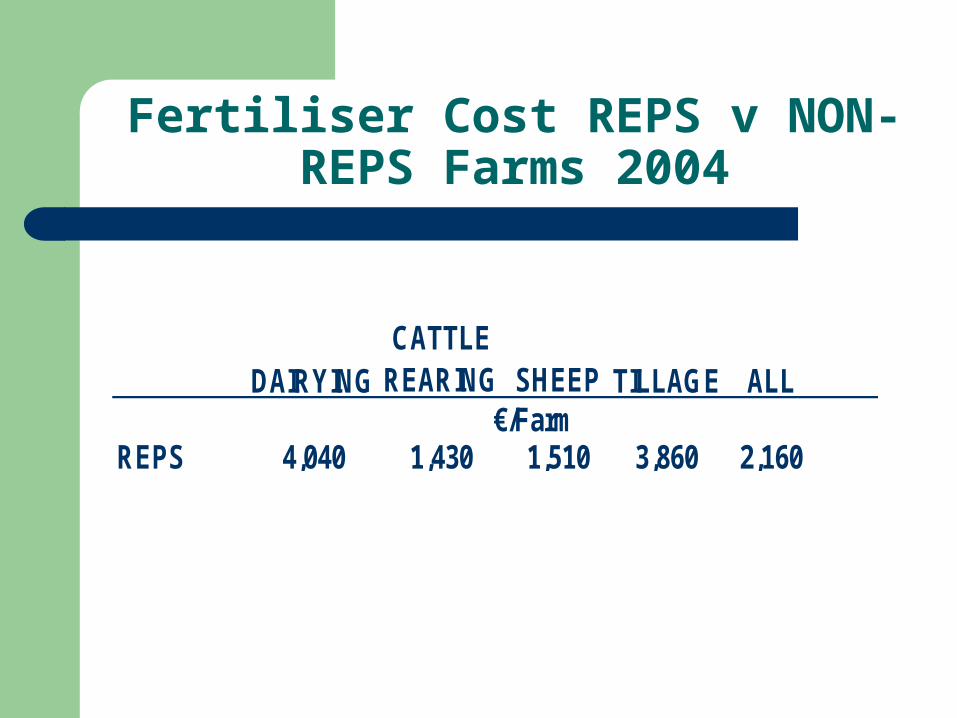
Fertiliser Cost REPS v NON-REPS Farms 2004
DAIRYINGCATTLE
REARING SHEEP TILLAGE ALL
REPS 4,040 1,430 1,510 3,860 2,160€/Farm

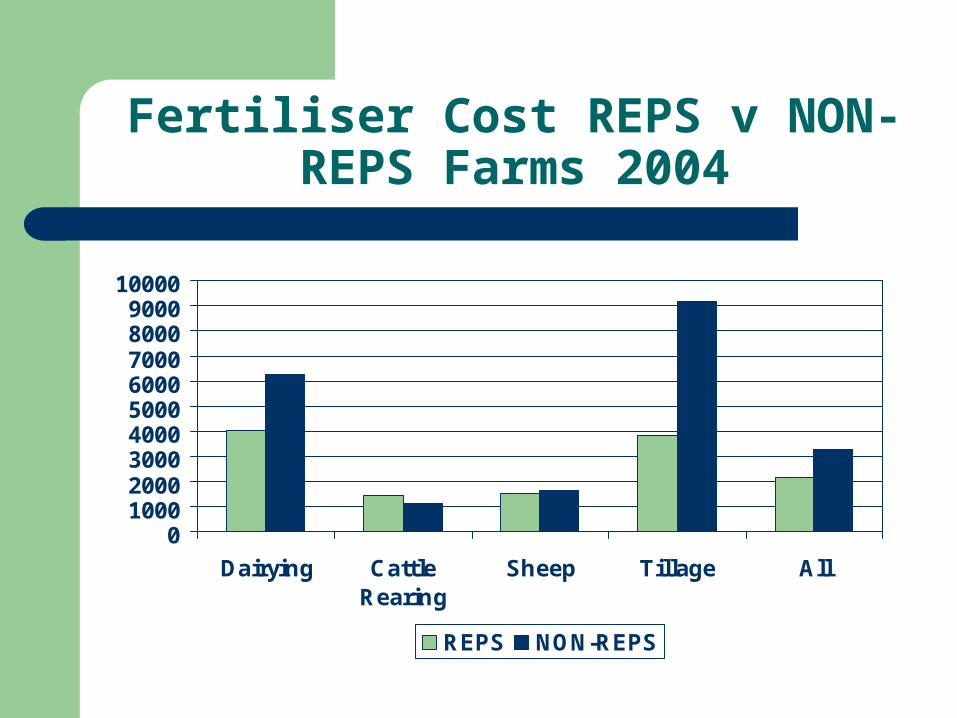
Fertiliser Cost REPS v NON-REPS Farms 2004
DAIRYINGCATTLE
REARING SHEEP TILLAGE ALL
REPS 4,040 1,430 1,510 3,860 2,160
NON-REPS 6,280 1,130 1,620 9,170 3,290
€/Farm
0100020003000400050006000700080009000
10000
Dairying CattleRearing
Sheep Tillage All
REPS NON-REPS
Fertiliser Cost REPS v NON-REPS Farms 2004

Fertiliser Cost by Performance -Dairying - 2004
Bottom Middle Top
25% 50% 25%
Gross Margin €/Ha 1,210 2,044 2,990
Fertiliser €/Ha 130 144 180
LUs/Ha 1.7 2.0 2.4
Dairying

Fertiliser Cost by Performance - Suckling - 2004
Bottom Middle Top
25% 50% 25%
Gross Margin €/Ha 540 600 835
Fertiliser €/Ha 44 40 55
LUs/Ha 1.5 1.6 1.9
Single Suckling

Fertiliser Cost by Performance - Sheep - 2004
Bottom Middle Top
25% 50% 25%
Gross Margin €/Ha 245 670 1,200
Fertiliser €/Ha 52 50 87
Ewes/Ha 6.5 8.4 12.4
Mid-Season Lamb
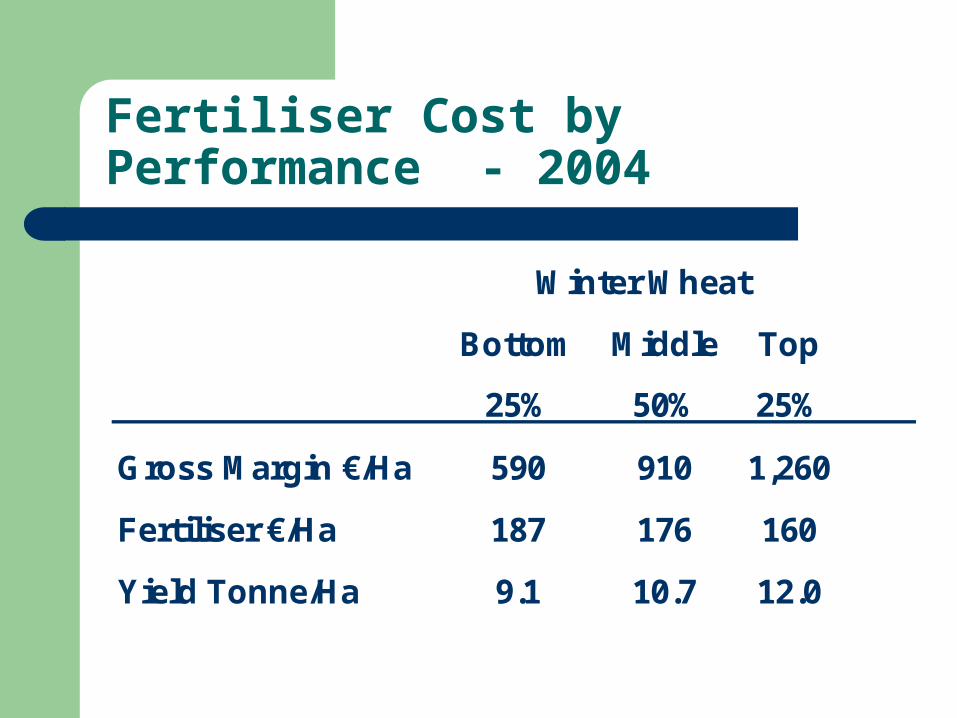
Fertiliser Cost by Performance - 2004
Bottom Middle Top
25% 50% 25%
Gross Margin €/Ha 590 910 1,260
Fertiliser €/Ha 187 176 160
Yield Tonne/Ha 9.1 10.7 12.0
Winter Wheat

SUMMARY
Farm Numbers Declining / Viable Farms Constant
Farm Income Virtually Static
Dairying Profitable/Drystock in Difficulty
Fertiliser Cost Per Farm Static
Tillage & Dairy Farms – Biggest Users
Fertiliser Cost 52% Higher on NON-REPS Farms
Enterprise Performance – Highest Fertiliser Cost on Top
Performance (except cereals)


