Page 1 of 18 London Economics International LLC contact: 717 Atlantic Ave, Suite 1A Julia Frayer/ Victor Chung Boston, MA 02111 Tel: (617) 933-7221 www.londoneconomics.com [email protected]Financial analysis of the sufficiency of Brattle’s estimated ATWACC to support investment in a new merchant peaker in Alberta prepared by London Economics International LLC July 6, 2018 Alberta is currently in the process of moving from an energy-only market design to an energy & capacity market design. London Economics International LLC (“LEI”) was retained by TransAlta Corporation (“TransAlta”) to review the methodologies proposed by the Brattle Group (“Brattle”), AESO’s consultant, to estimate the After-tax Weighted Average Cost of Capital (“ATWACC”) underpinning its Gross Cost of New Entry (“Gross CONE”) calculation. In this memo, LEI presents quantitative evidence demonstrating that using Brattle’s ATWACC, the resulting Gross CONE, and other assumptions from AESO, coupled with a more realistic consideration of the debt structure (as would be required by any financial institution lending to such a merchant generation project) leads to a lower return on equity for investors than the expected returns Brattle identified in its justification for the cost of equity. This financial analysis suggests that the ATWACC estimated by Brattle is too low, and therefore a capacity price based on this ATWACC and associated Gross CONE would lead to an outcome where investing in a merchant peaker in Alberta would not be an attractive economic investment. Table of contents 1 WHY IS PROPER ESTIMATION OF THE CONE VALUE IMPORTANT TO THE CAPACITY MARKET DESIGN? ..... 2 2 OVERVIEW OF BRATTLE’S ATWACC ............................................................................................................... 2 3 FINANCING ASSUMPTIONS IMPLIED IN BRATTLE’S ATWACC CALCULATIONS ARE NOT REALISTIC ......... 3 3.1 THE SIZE OF DEBT SHOULD BE DERIVED USING A TARGET DEBT-SERVICE COVERAGE RATIO FOR THE PROJECT BASED ON A RANGE OF EXPECTED CASHFLOWS ....................................................................................................... 4 3.2 DEBT HAS TO BE PAID DOWN WITHIN THE LIFETIME OF THE PROJECT ........................................................... 6 3.3 LEI’S PRO FORMA MODEL DEMONSTRATES BRATTLE’S ATWACC IS UNREALISTIC..................................... 7 3.3.1 Assumptions .......................................................................................................................................... 8 3.3.2 Adding in cash sweep provisions ......................................................................................................... 11 3.3.3 Less ideal market conditions scenario .................................................................................................. 13 4 APPENDIX........................................................................................................................................................... 15
Transcript
Page 1 of 18
London Economics International LLC contact:
717 Atlantic Ave, Suite 1A Julia Frayer/ Victor Chung
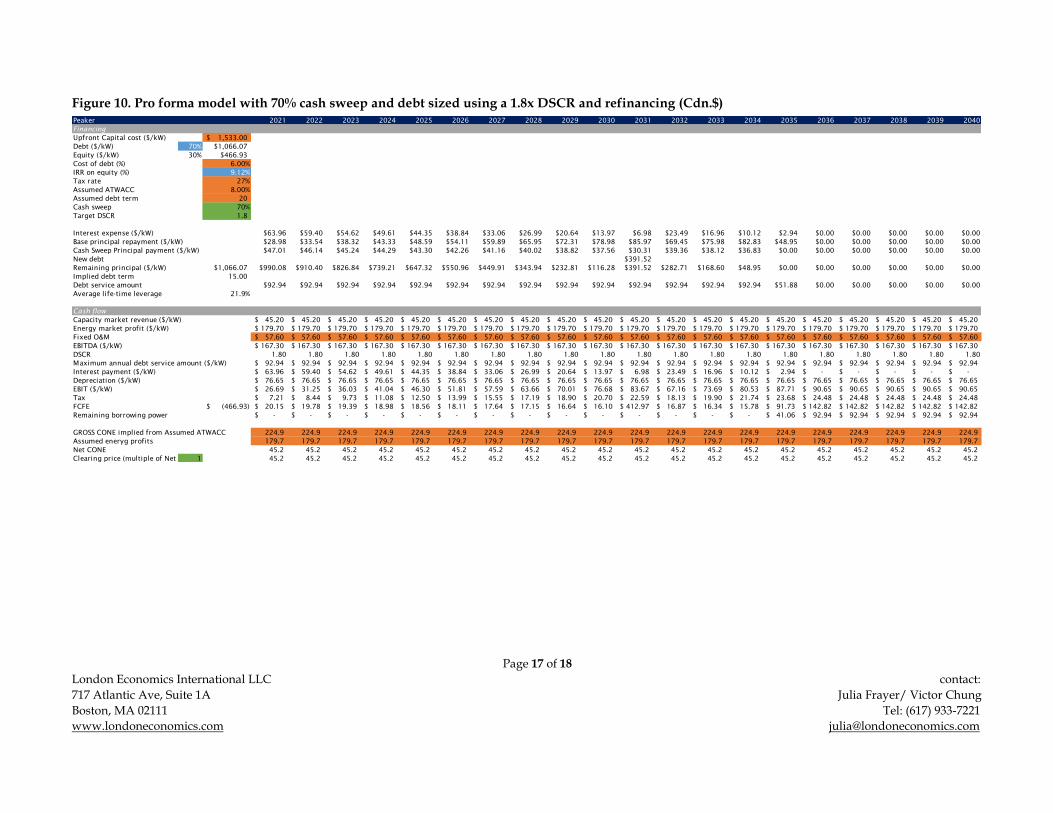
Financial analysis of the sufficiency of Brattle’s
estimated ATWACC to support investment in a new
merchant peaker in Alberta
prepared by London Economics International LLC
July 6, 2018
Alberta is currently in the process of moving from an energy-only market design to an energy &
capacity market design. London Economics International LLC (“LEI”) was retained by
TransAlta Corporation (“TransAlta”) to review the methodologies proposed by the Brattle
Group (“Brattle”), AESO’s consultant, to estimate the After-tax Weighted Average Cost of
Capital (“ATWACC”) underpinning its Gross Cost of New Entry (“Gross CONE”) calculation.
In this memo, LEI presents quantitative evidence demonstrating that using Brattle’s ATWACC,
the resulting Gross CONE, and other assumptions from AESO, coupled with a more realistic
consideration of the debt structure (as would be required by any financial institution lending to
such a merchant generation project) leads to a lower return on equity for investors than the
expected returns Brattle identified in its justification for the cost of equity. This financial
analysis suggests that the ATWACC estimated by Brattle is too low, and therefore a capacity
price based on this ATWACC and associated Gross CONE would lead to an outcome where
investing in a merchant peaker in Alberta would not be an attractive economic investment.
Table of contents 1 WHY IS PROPER ESTIMATION OF THE CONE VALUE IMPORTANT TO THE CAPACITY MARKET DESIGN? ..... 2
2 OVERVIEW OF BRATTLE’S ATWACC ............................................................................................................... 2
3 FINANCING ASSUMPTIONS IMPLIED IN BRATTLE’S ATWACC CALCULATIONS ARE NOT REALISTIC ......... 3
3.1 THE SIZE OF DEBT SHOULD BE DERIVED USING A TARGET DEBT-SERVICE COVERAGE RATIO FOR THE PROJECT
BASED ON A RANGE OF EXPECTED CASHFLOWS ....................................................................................................... 4 3.2 DEBT HAS TO BE PAID DOWN WITHIN THE LIFETIME OF THE PROJECT ........................................................... 6 3.3 LEI’S PRO FORMA MODEL DEMONSTRATES BRATTLE’S ATWACC IS UNREALISTIC ..................................... 7
3.3.1 Assumptions .......................................................................................................................................... 8 3.3.2 Adding in cash sweep provisions ......................................................................................................... 11 3.3.3 Less ideal market conditions scenario .................................................................................................. 13
1 Why is proper estimation of the CONE value important to the
capacity market design?
The Cost of New Entry (“CONE”) is a key component in capacity market design. The Brattle
Group (“Brattle”) stated that CONE is one of the estimates needed to “anchor” the proposed
capacity market’s sloped demand curve. During the capacity market demand curve design, a
Gross CONE, which aims to reflect the annualized carrying cost of a new generator based on a
reference technology appropriate for Alberta’s market, is first estimated. Then, an Energy and
Ancillary Services (“E&AS”) offset, is subtracted from the Gross CONE to arrive at a Net CONE.
However, Brattle stated that “the Net CONE will not determine the market clearing price of
capacity” (emphasis by Brattle), and “rather the market clearing price will depend on the offers
that suppliers make into the capacity market auction.”1
While Net CONE is not the only determining factor of the capacity market clearing price, it does
have an important impact on the capacity market clearing price. For example:
▪ holding other factors constant (demand forecast, reliability requirement, and supply), changes in Net CONE shift the capacity demand curve and change the point of intersection between the cumulative supply of capacity offers and the demand curve, therefore influencing the capacity clearing price; and,
▪ if the Net CONE is materially lower than the actual cost of a new efficient generator, in the long run the market may not be able to procure the resources it needs to achieve its reliability target, as the capacity clearing price may not be attractive enough for investors to build new generating units.
As such, ATWACC is critical to ensuring that a key desired end-state of AESO’s capacity market
design – new investment by the private sector – is achieved.
2 Overview of Brattle’s ATWACC
The key components of ATWACC relate to the cost of equity, the cost of debt, and the capital
structure or leverage, as illustrated in the formula below:
ATWACC = cost of equity x (1-debt/capital) + (1-tax rate) x cost of debt x (debt/capital)
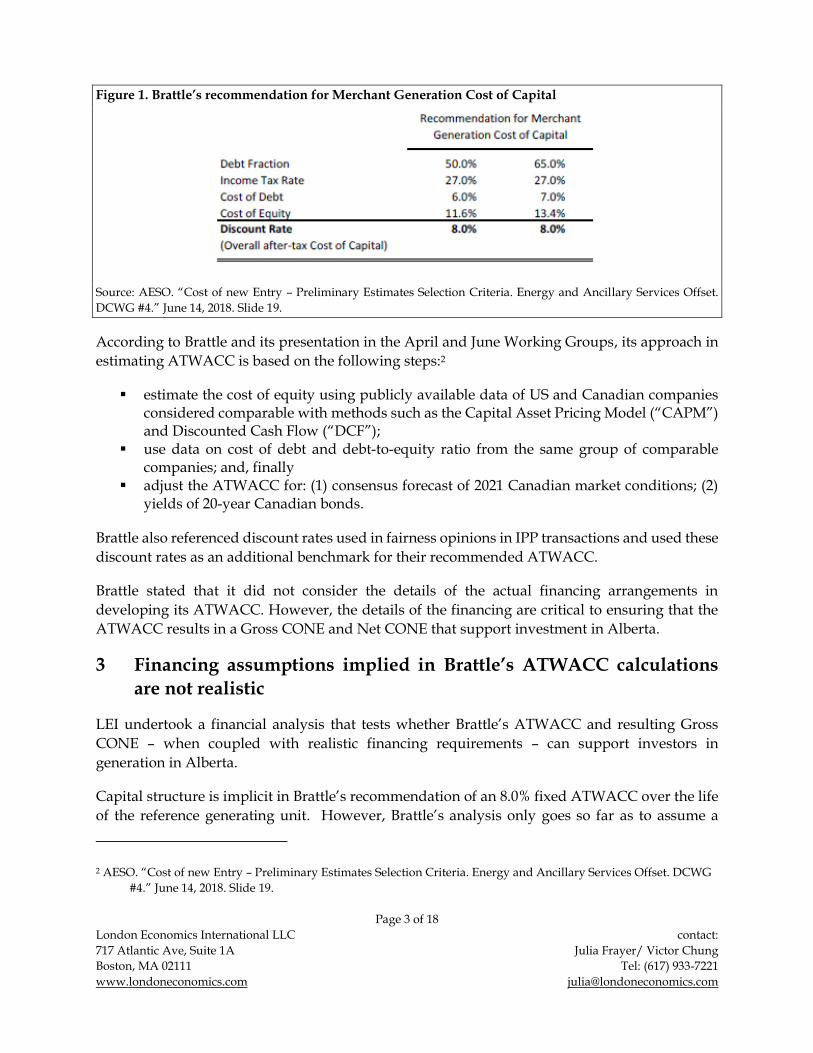
In the June 14th 2018 Working Group materials, Brattle recommended an ATWACC of 8.0%, for
new generation investment in Alberta, based on the assumptions shown in the table below.
1 AESO. “Cost of New Entry – Preliminary Estimates Selection Criteria, Energy and Ancillary Services Offset DCWG
Figure 1. Brattle’s recommendation for Merchant Generation Cost of Capital
Source: AESO. “Cost of new Entry – Preliminary Estimates Selection Criteria. Energy and Ancillary Services Offset.
DCWG #4.” June 14, 2018. Slide 19.
According to Brattle and its presentation in the April and June Working Groups, its approach in
estimating ATWACC is based on the following steps:2
▪ estimate the cost of equity using publicly available data of US and Canadian companies considered comparable with methods such as the Capital Asset Pricing Model (“CAPM”) and Discounted Cash Flow (“DCF”);
▪ use data on cost of debt and debt-to-equity ratio from the same group of comparable companies; and, finally
▪ adjust the ATWACC for: (1) consensus forecast of 2021 Canadian market conditions; (2) yields of 20-year Canadian bonds.
Brattle also referenced discount rates used in fairness opinions in IPP transactions and used these
discount rates as an additional benchmark for their recommended ATWACC.
Brattle stated that it did not consider the details of the actual financing arrangements in
developing its ATWACC. However, the details of the financing are critical to ensuring that the
ATWACC results in a Gross CONE and Net CONE that support investment in Alberta.
3 Financing assumptions implied in Brattle’s ATWACC calculations
are not realistic
LEI undertook a financial analysis that tests whether Brattle’s ATWACC and resulting Gross
CONE – when coupled with realistic financing requirements – can support investors in
generation in Alberta.
Capital structure is implicit in Brattle’s recommendation of an 8.0% fixed ATWACC over the life
of the reference generating unit. However, Brattle’s analysis only goes so far as to assume a
2 AESO. “Cost of new Entry – Preliminary Estimates Selection Criteria. Energy and Ancillary Services Offset. DCWG
used to pay down debt (such as 100% or 50%), and the target level of debt paydown (i.e., the cash
flow sweep is no longer effective once a certain amount of debt has been paid down).”8
A constant capital structure over time would not be a realistic assumption for a physical asset
with a limited economic life. To test these assumptions, LEI’s pro forma financial model also
considers cash sweeps.
3.3 LEI’s pro forma model demonstrates Brattle’s ATWACC is unrealistic
LEI’s pro forma financial model relies on Brattle’s capital and debt costs assumptions, associated
Gross CONE and Net CONE values (based on AESO’s energy revenue assumptions). In addition,
LEI’s financial model reflects realistic debt provisions such as an appropriate DSCR and cash
sweep when determining the debt size and modeling the project’s cash flow.
The finance textbook “Corporate and Project Finance Modeling” describes four different methods
for sculpting debt: 9
1. using a solver tool to find both the repayments and the debt size by matching the target DSCR wit the modeled DSCR and setting the closing debt balance to zero;
2. using the definition of DSCR to determine the repayment and then sets the ending debt balance to zero by changing the debt size using the Goal Seek tool;
3. uses the fact that net present value of debt service is equal to the remaining debt balance to establish the size of the debt; and ,
4. backward induction approach that begins with a zero balance at the end of the debt term, and work backwards to establish the amount of the debt at commercial operation.
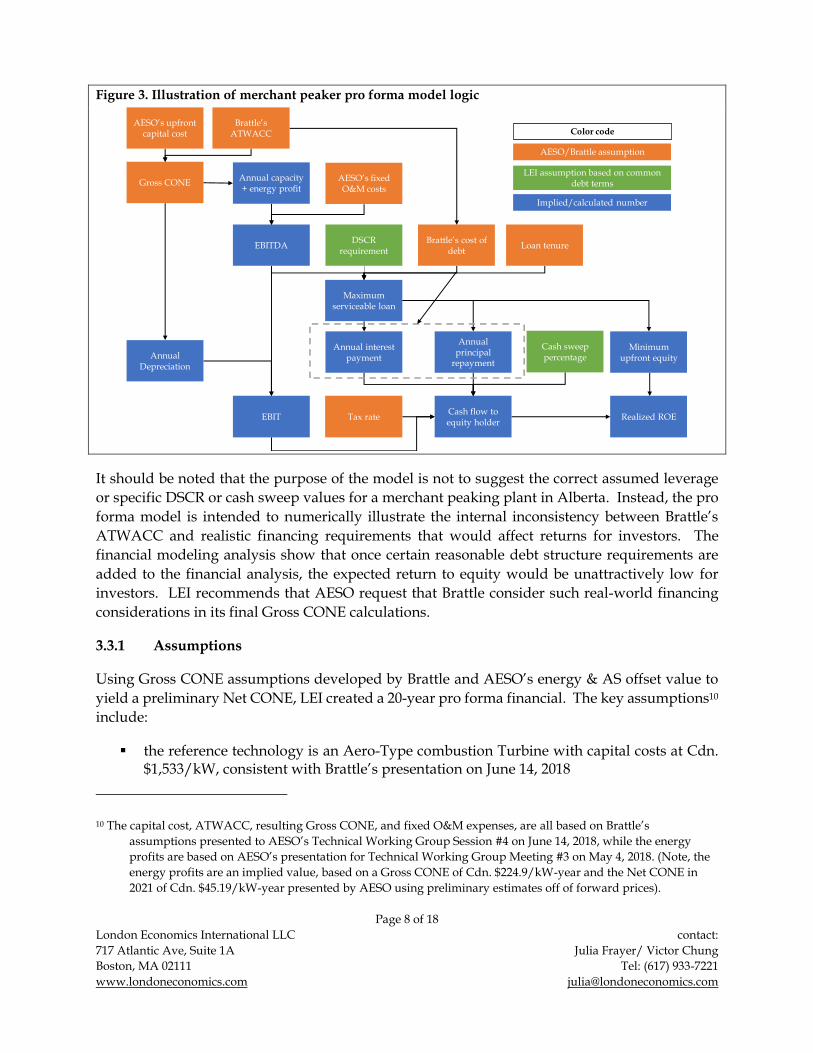
The method LEI uses in the pro forma model is the third method. The logic of LEI’s pro forma
model is presented in Figure 3.
8 Standard & Poor’s. “Standard & Poor’s Project Finance Ratings Criteria – Reference Guide”. September 16, 2014.
Page 85.
9 Edward Bodme. “Corporate and Project Finance Modeling.” October 2014. Chapter 41.
Figure 3. Illustration of merchant peaker pro forma model logic
It should be noted that the purpose of the model is not to suggest the correct assumed leverage
or specific DSCR or cash sweep values for a merchant peaking plant in Alberta. Instead, the pro
forma model is intended to numerically illustrate the internal inconsistency between Brattle’s
ATWACC and realistic financing requirements that would affect returns for investors. The
financial modeling analysis show that once certain reasonable debt structure requirements are
added to the financial analysis, the expected return to equity would be unattractively low for
investors. LEI recommends that AESO request that Brattle consider such real-world financing
considerations in its final Gross CONE calculations.
3.3.1 Assumptions
Using Gross CONE assumptions developed by Brattle and AESO’s energy & AS offset value to
yield a preliminary Net CONE, LEI created a 20-year pro forma financial. The key assumptions10
include:
▪ the reference technology is an Aero-Type combustion Turbine with capital costs at Cdn. $1,533/kW, consistent with Brattle’s presentation on June 14, 2018
10 The capital cost, ATWACC, resulting Gross CONE, and fixed O&M expenses, are all based on Brattle’s
assumptions presented to AESO’s Technical Working Group Session #4 on June 14, 2018, while the energy
profits are based on AESO’s presentation for Technical Working Group Meeting #3 on May 4, 2018. (Note, the
energy profits are an implied value, based on a Gross CONE of Cdn. $224.9/kW-year and the Net CONE in
2021 of Cdn. $45.19/kW-year presented by AESO using preliminary estimates off of forward prices).
▪ the cost of debt is assumed to be 6%, based on Brattle’s low-end estimate consistent with Brattle’s presentation on June 14, 2018;
▪ debt term of 20 years based on Brattle assumption in presentation on June 14, 2018; ▪ tax rate of 27%, same as Brattle’s assumption from presentation on June 14, 2018; ▪ the generator would be able to earn exactly the forecasted energy profits in the energy
market every year that correspond to AESO’s estimate of E&AS, which are captured in a Net CONE;
▪ the generator would be able to earn a capacity price exactly equal to this same Net CONE in the capacity market every year; and
▪ the generator would incur exactly the same amount of expected fixed O&M costs over its lifetime as was estimated in the Gross CONE.
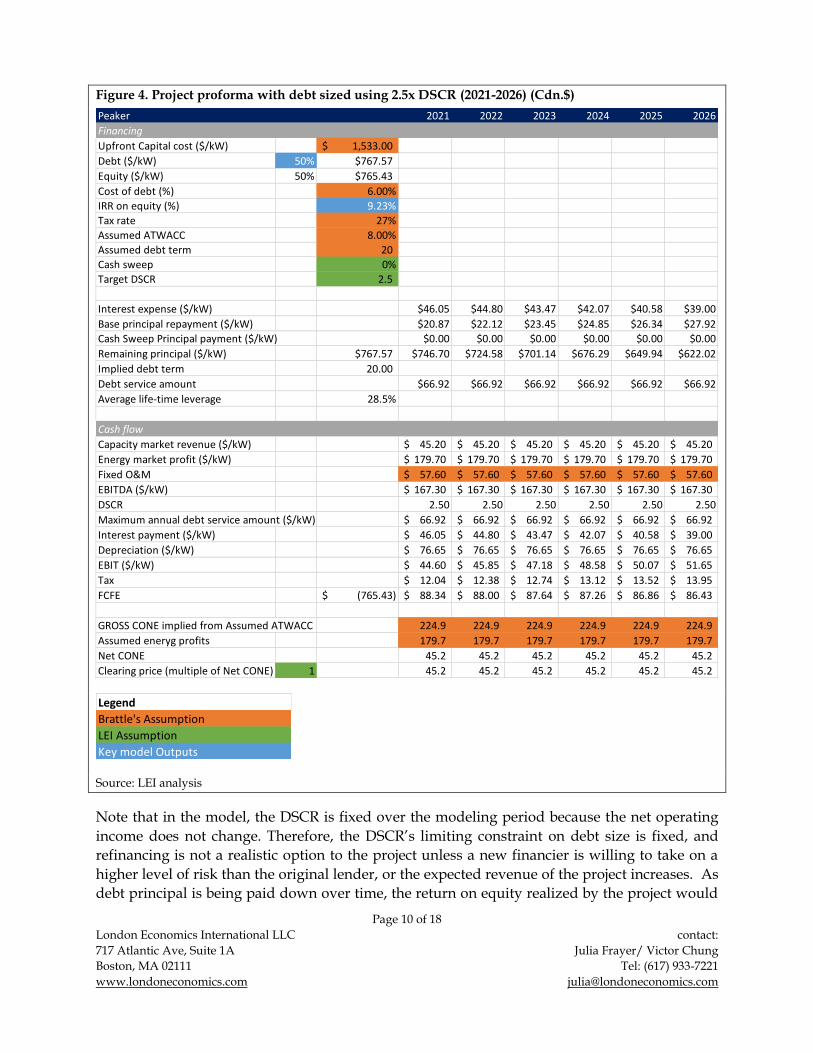
The amount of debt is based on the DSCR threshold of 2.5x instead of an assumed level of
leverage. In addition, LEI considered the requirement for cash sweeps. The model’s primary
output is a calculated return on equity, which is then compared to the returns that Brattle
identified in its ATWACC analysis.
A truncated snapshot of the financial pro forma showing the results for 2021-2026 is presented in
Figure 4 below. The full 20-year (2021-2040) model is available in the appendix. With a DSCR
requirement of 2.5x, the project would be able to obtain an initial 50% debt-to-capital ratio.
However, the realized return on equity (shown as internal rate of return (“IRR”) value), is only
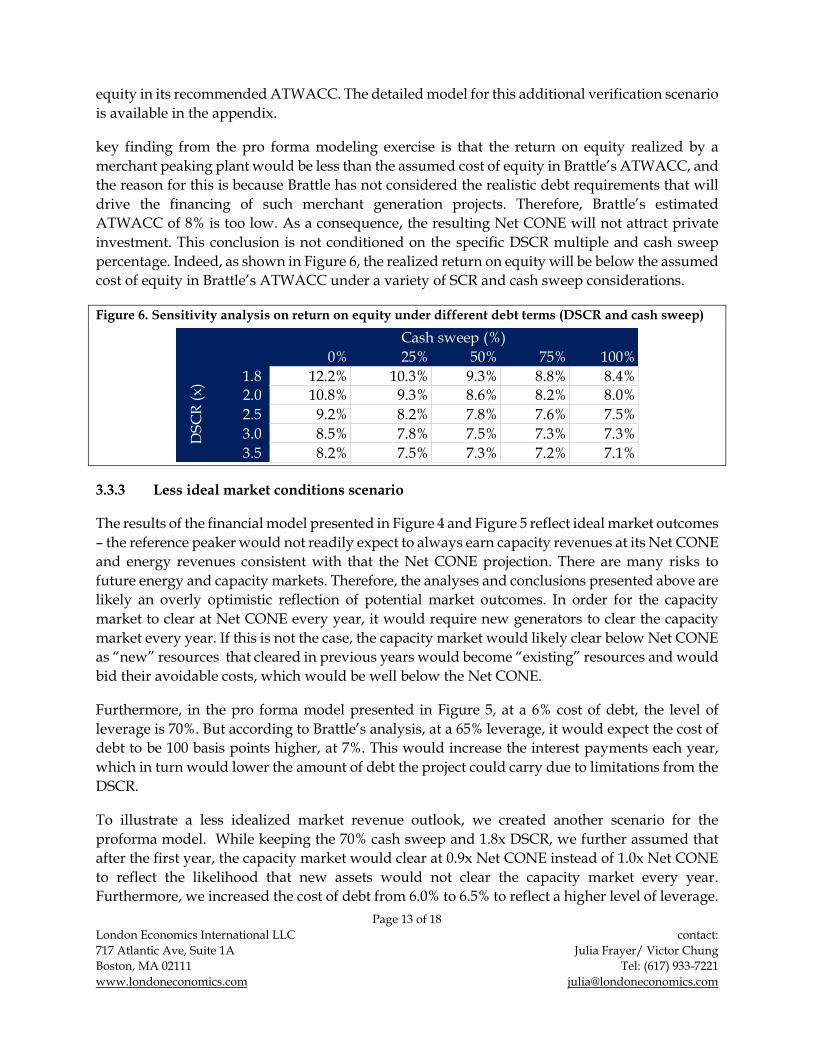
9.23%, which is lower than the cost of equity range of 11.6% to 13.4% assumed by Brattle in its