Page 1
Executive Summary
The report provides a brief analysis of the financial performance of the company Titas Gas
Transmission and Distribution Company Limited of the years 2007 to 2011. From the balance
sheets and income statements from Titas gas, a vertical balance sheet and income statement is
created. In the vertical balance sheet, all figures are divided by total assets and expressed as a
percentage. In the vertical income statements, all figures are divided by sales and expressed as a
percentage, including averages and standard deviations. The horizontal balance sheets and
income statements are produced using a different approach. The figures are based on the year
2007, and all base year figures are taken as 100%. All the other items are expressed as a
percentage of its base year figures. The report further forecasts income statements and balance
sheets for 2012 and 2013.
This report also provides ratio analysis of year 2007 to 2011 and these ratios are calculated and
interpreted so that a trend of the performance in particular areas may be observed. The derived
data is also used to compare against past performances of the company and current performances
of existing competitors. Graphical representation is also provided for better understanding of the
numerical content. The method of analysis used is trend analysis for the mentioned years. The
types of ratios discussed are liquidity, asset management, debt management, and profitability and
stock-market ratios. The calculations are shown in details in the appendix and the formulas are
given within the ratio tables.
Required market return is determined using a risk free rate of 9.05 which is set by Bangladesh
Bank. Beta is calculated using market returns from July 2008 to July 2011. A weighted average
cost of capital is calculated using cost of equity, cost of debt and cost of retained earnings. This
helped us formulate an optimum capital structure for Titas. Finally, the report determined
intrinsic price using the dividend discount model. The calculations are shown in details in the
appendix and the formulas are given within the ratio tables.
In fact, the report has established a comprehensive view to understand company’s financial
position and the market performance of the company through important indicators and authentic
interpretations.
Page 2
Introduction
The report has represented an overall financial and market position of the company ‘Titas Gas
Transmission Co. Ltd. Preparing this report, the company has been compared with the companies
which are enlisted in DSE in the same industry sector named ‘Fuel and Energy Sector’.
The report has tried to understand the company’s current financial position and compared it with
previous performance. Moreover, monthly market return has been realized to understand the
company’s volatility with market and the required rate of return that a shareholder can assume as
a perfect rate of return.
Moreover, report has tried to understand industry condition and tried to find the Titas Gas
Transmission Co Ltd. Loop holes in different performance indicator while giving suggestion to
improve the situation.
Company Background
Titas Gas T & D Co. Ltd. (TGTDCL) was formed in November 1964 as a joint Stock Company
(Under the Company’s Act 1913) of the central Government of Pakistan on the one hand and
Pakistan Shell Oil Company on the other, with a view to transmitting and distributing natural gas
to the Dhaka city the then provincial capital of Pakistan from the discovered gas field called
“Titas” located on the bank of the River Titas, within the close vicinity of the present
Brahmanbaria district of Bangladesh. The authorized capital was Taka 17.8 million only, divided
into 17800 shares of Taka 10.00 each. Ninety percent of the shares were subscribed by the then
central Government of Pakistan and remaining ten percent by the Shell Oil Company.
In December 1971, after nine months of liberation war, Bangladesh emerged in the world map as
a new independent state with the same geographical boundary of the then East Pakistan. In
March 26, 1972 Govt. has formed “ Bangladesh Oil, Gas & Mineral Corporation (BOGMC)
under the Presidential Executive Order and Titas Gas T&D Co. Ltd. has become an enterprise of
BOGMC. Titas Gas T&D Co. Ltd. which was earlier established as a joint stock company with
90% share capital of the Govt. of Pakistan naturally vested to the Govt. of the People’s Republic
Page 3
of Bangladesh and the rest 10% share capital of Pakistan Shell Oil Company was transferred to
the newly formed Bangladesh Shell Oil Company. During 1975, under the nationalization
program, Govt. has brought back 10% share of Shell Oil Co. and Titas Gas T&D Co. Ltd. has
become a 100% Government owned Company. Meanwhile, during August1974, Bangladesh Oil
& Gas Corporation/Petrobangla and during October 1975, Ministry of Energy & Mineral
Resources had been formed. TGTDCL has been placed under the administrative control of the
newly formed ministry along with Petrobangla and its subsidiary Companys.
The basic objective of the Company was to construct, own and operate natural gas transmission
& distribution facilities in the mid-eastern region of Bangladesh i.e. Comilla, Mymensingh and
Dhaka district with the right of purchasing, transmission, distribution, sales and disposal of
natural gas within the jurisdiction of greater districts before creation of new districts.
Common Size Statements
Titas Gas Transmission and Distribution Company Limited
Vertical balance sheet
2007 2008 2009 2010 2011 AVERA
GE
STANDA
RD
DEVIATI
ON
1. CAPITAL
AND
RESERVES
28.9215
%
37.3510
%
38.7550
%
41.5726
%
47.2751
%
38.7750
%
6.6932%
a) Share
capital
7.1077% 23.3623
%
19.9490
%
16.9568
%
15.7679
%
16.6288
%
6.0800%
b) Deposits
for Share
0.0020% 0.0029% 0.0039% 0.0136% 0.0490% 0.0143% 0.0200%
Page 4
c) Capital
reserves
2.2455% 2.0586% 1.7578% 1.4942% 1.2631% 1.7639% 0.4007%
d) Revenue
reserves
19.5663
%
11.9272
%
17.0443
%
23.1080
%
30.1951
%
20.3682
%
6.8377%
2. LONG-
TERM
BORROWIN
GS
13.6503
%
7.3386% 5.9360% 4.2541% 3.4960% 6.9350% 4.0395%
a) Unsecured
loans - local
sources
4.6579% 0.0000% 0.0000% 0.0001% 0.0053% 0.9327% 2.0825%
b) Unsecured
loans -
foreign
sources
8.9925% 7.3386% 5.9360% 4.2540% 3.4907% 6.0024% 2.2414%
3. OTHER
LONG-
TERM
LIABILITIES
15.5279
%
17.3713
%
17.3848
%
15.7697
%
13.5497
%
15.9207
%
1.5848%
a) Pension
fund
1.4845% 1.4146% 1.1988% 0.9892% 0.7723% 1.1719% 0.2960%
b) Gratuity 0.0276% 0.0287% 0.0223% 0.0293% 0.0263% 0.0268% 0.0028%
Page 5
c) Leave pay 0.3934% 0.3874% 0.3446% 0.3208% 0.2888% 0.3470% 0.0443%
d) General
provident
fund
0.5817% 0.9121% 0.8861% 0.8276% 0.7522% 0.7919% 0.1326%
e) Customers'
security
deposits
13.0407
%
14.6285
%
14.9331
%
13.6028
%
11.7100
%
13.5830
%
1.2960%
4. TOTAL
CAPITAL
EMPLOYED
58.0997
%
62.0609
%
62.0759
%
61.5964
%
64.3208
%
61.6307
%
2.2410%
APPLICATI
ON OF
FUNDS :
0.0000% 0.0000% 0.0000% 0.0000% 0.0000% 0.0000% 0.0000%
5. FIXED
ASSETS
35.3803
%
31.9513
%
27.3558
%
22.5859
%
19.3961
%
27.3339
%
6.5502%
a) Fixed
assets (at
cost- less
accum.
depreciation)
35.3716
%
31.9404
%
27.3375
%
22.3235
%
18.8006
%
27.1547
%
6.7747%
b) Capital
work-in-
progress
0.0088% 0.0109% 0.0182% 0.2624% 0.5955% 0.1792% 0.2567%
Page 6
6.
INVESTME
NTS AND
OTHER
ASSETS
14.5783
%
16.7379
%
23.8109
%
31.3809
%
36.1923
%
24.5401
%
9.2630%
a) Long-term
bank deposits
12.0701
%
14.5220
%
21.9376
%
29.9952
%
34.5558
%
22.6161
%
9.6721%
b) Loan to
employees
2.5082% 2.2159% 1.8734% 1.3857% 1.6366% 1.9239% 0.4476%
7. CURRENT
ASSETS
50.0414
%
51.3108
%
48.8333
%
46.0332
%
44.4116
%
48.1261
%
2.8499%
a) Inventories
of stores and
other
materials
3.9339% 3.9198% 4.2662% 3.6019% 3.0377% 3.7519% 0.4633%
b) Advances,
deposits and
prepayments
0.7680% 2.9310% 0.6486% 0.6848% 0.4050% 1.0875% 1.0394%
c) Trade
debtors (Net)
41.1249
%
38.6690
%
30.3638
%
27.9368
%
25.5293
%
32.7248
%
6.8222%
d) Cash and
bank balances
3.5031% 5.4864% 12.0233
%
12.2200
%
13.3685
%
9.3203% 4.4900%
Page 7
e) Other
current assets
0.7115% 0.3045% 1.5313% 1.5897% 2.0711% 1.2416% 0.7163%
TOTAL
ASSET
100.0000
%
100.0000
%
100.0000
%
100.0000
%
100.0000
%
100.0000
%
0.0000%
8.
CURRENT
LIABILITIES
( 8i + 8ii )
41.9003
%
37.9391
%
37.9241
%
38.4036
%
35.6792
%
38.3693
%
2.2410%
i) GROUP
COMPANY
ACCOUNTS
34.7699
%
25.6940
%
24.9805
%
24.0934
%
23.4682
%
26.6012
%
4.6444%
a) Payable for
gas purchase
&
transmission
31.8303
%
23.8113
%
22.7944
%
20.2214
%
1.8943% 20.1103
%
11.0690%
b) Payable for
PDF&
BAPEX
margin
3.2323% 2.1774% 1.6848% 1.6378% 2.3397% 2.2144% 0.6454%
c) Payable for
defi cit
wellhead
margin fund
for BAPEX
0.0000% 0.0000% 0.0771% 0.0911% 0.1331% 0.0603% 0.0588%
d) Payable for
gas
development
0.0000% 0.0000% 0.0000% 1.6377% 1.6332% 0.6542% 0.8958%
Page 8
fund
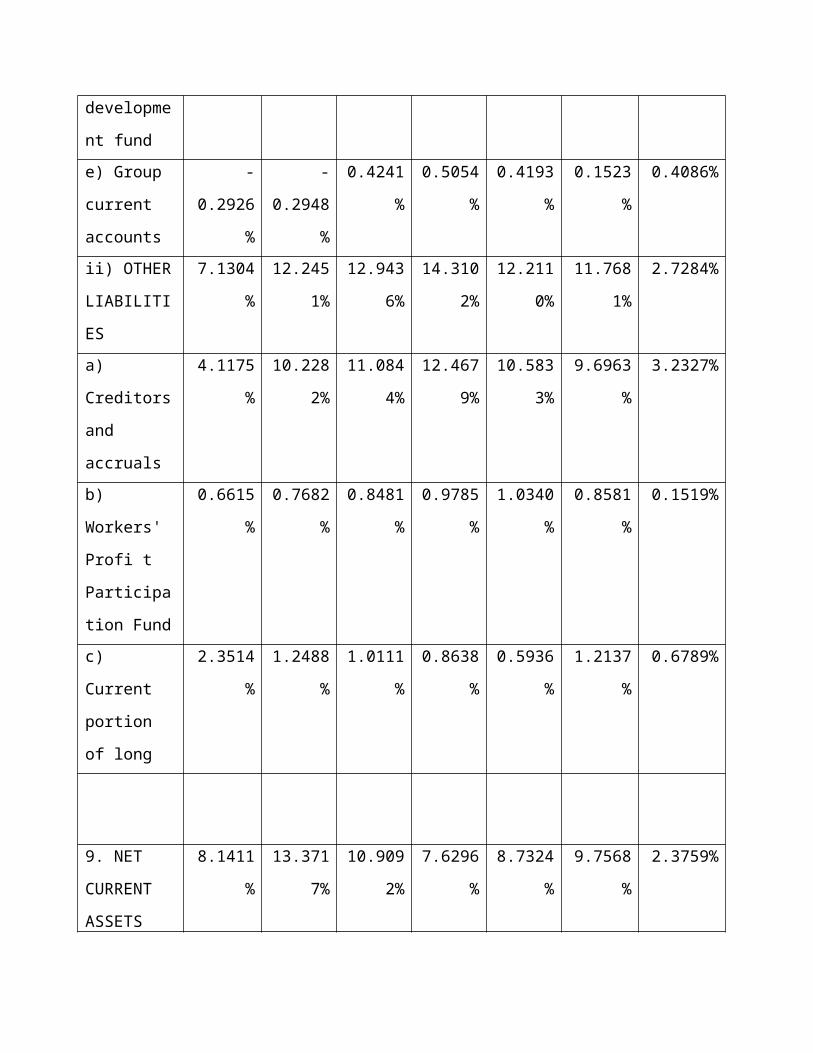
e) Group
current
accounts
-0.2926% -
0.2948%
0.4241% 0.5054% 0.4193% 0.1523% 0.4086%
ii) OTHER
LIABILITIES
7.1304% 12.2451
%
12.9436
%
14.3102
%
12.2110
%
11.7681
%
2.7284%
a) Creditors
and accruals
4.1175% 10.2282
%
11.0844
%
12.4679
%
10.5833
%
9.6963% 3.2327%
b) Workers'
Profi t
Participation
Fund
0.6615% 0.7682% 0.8481% 0.9785% 1.0340% 0.8581% 0.1519%
c) Current
portion of
long
2.3514% 1.2488% 1.0111% 0.8638% 0.5936% 1.2137% 0.6789%
9. NET
CURRENT
ASSETS ( 7
8.1411% 13.3717
%
10.9092
%
7.6296% 8.7324% 9.7568% 2.3759%
10. NET
ASSETS
( 5+6+9 )
58.0997
%
61.9627
%
62.0759
%
61.5964
%
64.3208
%
61.6111
%
2.2367%
Page 9
Here all the figures were divided by Total assets of that particular year and they were expressed
as a percentage of that year’s total asset.
Titas Gas Transmission and Distribution Company Limited
Vertical Income statement
2007 2008 2009 2010 2011 AVERAG
E
STANDAR
D
DEVIATIO
N
1. SALES 100.0000% 100.0000
%
100.0000% 100.0000% 100.0000% 100.0000% 0.0000%
a) Gas sales revenue 98.5896% 98.6618% 98.8712% 98.8194% 98.9241% 98.7732% 0.1420%
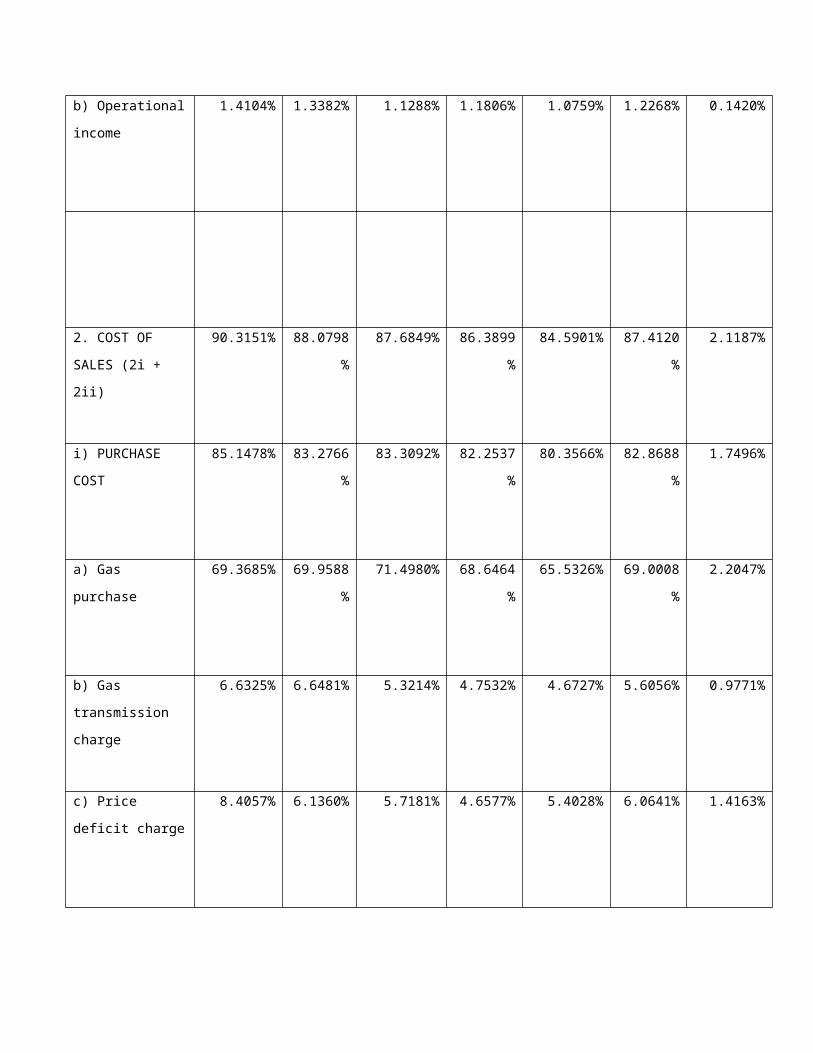
b) Operational
income
1.4104% 1.3382% 1.1288% 1.1806% 1.0759% 1.2268% 0.1420%
2. COST OF SALES
(2i + 2ii)
90.3151% 88.0798% 87.6849% 86.3899% 84.5901% 87.4120% 2.1187%
Page 10
i) PURCHASE
COST
85.1478% 83.2766% 83.3092% 82.2537% 80.3566% 82.8688% 1.7496%
a) Gas purchase 69.3685% 69.9588% 71.4980% 68.6464% 65.5326% 69.0008% 2.2047%
b) Gas transmission
charge
6.6325% 6.6481% 5.3214% 4.7532% 4.6727% 5.6056% 0.9771%
c) Price deficit
charge
8.4057% 6.1360% 5.7181% 4.6577% 5.4028% 6.0641% 1.4163%
d) Gas development
charge
0.0000% 0.0000% 0.0000% 3.5695% 4.0319% 1.5203% 2.0881%
e) BAPEX margin 0.7412% 0.5337% 0.4062% 0.3345% 0.3784% 0.4788% 0.1643%
f) Deficit wellhead
margin for BAPEX
0.0000% 0.0000% 0.3656% 0.2924% 0.3382% 0.1992% 0.1838%
Page 11
ii)
ADMINISTRATIVE
& OTHER COST
5.1673% 4.8032% 4.3757% 4.1363% 4.2336% 4.5432% 0.4320%
a) Personnel costs 1.7536% 1.5391% 1.4251% 1.5457% 1.6623% 1.5852% 0.1261%
b) Professional
services
0.0396% 0.0355% 0.0336% 0.0200% 0.0210% 0.0300% 0.0089%
c) Promotional costs 0.0212% 0.0155% 0.0136% 0.0156% 0.0110% 0.0154% 0.0038%
d) Power costs 0.0592% 0.0438% 0.0339% 0.0339% 0.0331% 0.0408% 0.0112%
e) Communication
costs
0.0134% 0.0116% 0.0087% 0.0074% 0.0064% 0.0095% 0.0029%
f) Transport costs 0.1677% 0.1388% 0.1262% 0.1218% 0.1121% 0.1333% 0.0215%
Page 12
g) Occupancy costs 0.1049% 0.0915% 0.0766% 0.0793% 0.0964% 0.0898% 0.0118%
h) Administrative
costs
0.0765% 0.1144% 0.0833% 0.0856% 0.0964% 0.0913% 0.0148%
i) Miscellaneous
costs
0.0584% 0.0432% 0.0310% 0.0225% 0.0288% 0.0368% 0.0142%
j) Transmission &
distribution costs
0.1040% 0.0592% 0.0937% 0.0533% 0.0616% 0.0744% 0.0229%
k) Financial charges 0.0164% 0.0038% 0.0019% 0.0025% 0.0043% 0.0058% 0.0060%
l) Bad & doubtful
debts provision
0.8146% 0.8489% 0.7637% 0.6757% 0.6957% 0.7597% 0.0744%
m) Depreciation
charges
1.7658% 1.7460% 1.5360% 1.2993% 1.2295% 1.5153% 0.2474%
Page 13
n) Petrobangla
Service Charge
0.1464% 0.1119% 0.1484% 0.1737% 0.1751% 0.1511% 0.0258%
3. OPERATING
PROFIT (1-2)
9.6849% 11.9202% 12.3151% 13.6101% 15.4099% 12.5880% 2.1187%
4. NON-
OPERATIONAL
INCOME
0.6291% 0.7547% 0.6795% 0.5637% 0.8363% 0.6927% 0.1064%
5. TOTAL INCOME
(3+4)
10.3140% 12.6750% 12.9945% 14.1738% 16.2461% 13.2807% 2.1703%
6. FINANCIAL
INCOME
-0.3141% -0.6247% 1.5502% 1.8634% 2.6419% 1.0233% 1.4237%
Page 14
Interest income 0.4633% 0.3636% 1.7571% 2.0069% 2.7604% 1.4703% 1.0336%
Less: Interest cost 0.7774% 0.9882% 0.2070% 0.1435% 0.1185% 0.4469% 0.4061%
7. NET PROFIT
BEFORE
CONTRIBUTION
TO ‘WPPF’ (5+6)
10.6281% 13.2996% 14.5447% 16.0372% 18.8880% 14.6795% 3.0778%
8. WORKERS’
PARTICIPATION
IN PROFITS
0.5061% 0.6333% 0.6926% 0.7637% 0.8994% 0.6990% 0.1466%
9. NET PROFIT
BEFORE
TAXATION (7-8)
10.1220% 12.6663% 13.8521% 15.2735% 17.9886% 13.9805% 2.9312%
Page 15
10. PROVISION
FOR TAXATION
3.5115% 3.2296% 3.5437% 3.9145% 4.6008% 3.7600% 0.5293%
a) Current Tax 0.0000% 3.1349% 3.4284% 3.7802% 4.4522% 2.9591% 1.7256%
b) Deferred Tax 0.0000% 0.0947% 0.1153% 0.1343% 0.1486% 0.0986% 0.0587%
11. NET PROFIT
FOR THE YEAR
AFTER TAXATION
(9-10)
6.6104% 9.4367% 10.3084% 11.3590% 13.3878% 10.2205% 2.4991%
Here all the figures were divided by Total sales of that particular year and they were expressed as
a percentage of that year’s total sales.
Titas Gas Transmission and Distribution Company Limited
Horizontal Balance sheet
2007 2008 2009 2010 2011
1. CAPITAL
AND RESERVES
100.0000% 140.8718% 171.1765% 216.0233% 290.5956%
Page 16
a) Share capital 100.0000% 358.5342% 358.5342% 358.5342% 394.3876%
b) Deposits for
Share
100.0000% 160.9869% 252.4671% 1046.2096% 4463.0694%
c) Capital
reserves
100.0000% 100.0000% 100.0000% 100.0000% 100.0000%
d) Revenue
reserves
100.0000% 66.4922% 111.2773% 177.4872% 274.3495%
2. LONG-TERM
BORROWINGS
100.0000% 58.6429% 55.5506% 46.8364% 45.5304%
a) Unsecured
loans - local
sources
100.0000% 0.0000% 0.0000% 0.0038% 0.2017%
b) Unsecured
loans - foreign
sources
100.0000% 89.0184% 84.3244% 71.0945% 69.0095%
3. OTHER
LONG-TERM
LIABILITIES
100.0000% 122.0290% 143.0195% 152.6248% 155.1297%
a) Pension fund 100.0000% 103.9452% 103.1654% 100.1457% 92.4894%
b) Gratuity 100.0000% 113.4480% 103.0497% 159.8528% 169.7612%
c) Leave pay 100.0000% 107.4262% 111.9082% 122.5379% 130.5295%
d) General
provident fund
100.0000% 171.0220% 194.5680% 213.8010% 229.8694%
e) Customers'
security deposits
100.0000% 122.3607% 146.2797% 156.7619% 159.6373%
4. TOTAL
CAPITAL
EMPLOYED
100.0000% 116.5164% 136.4853% 159.3294% 196.8134%
Page 17
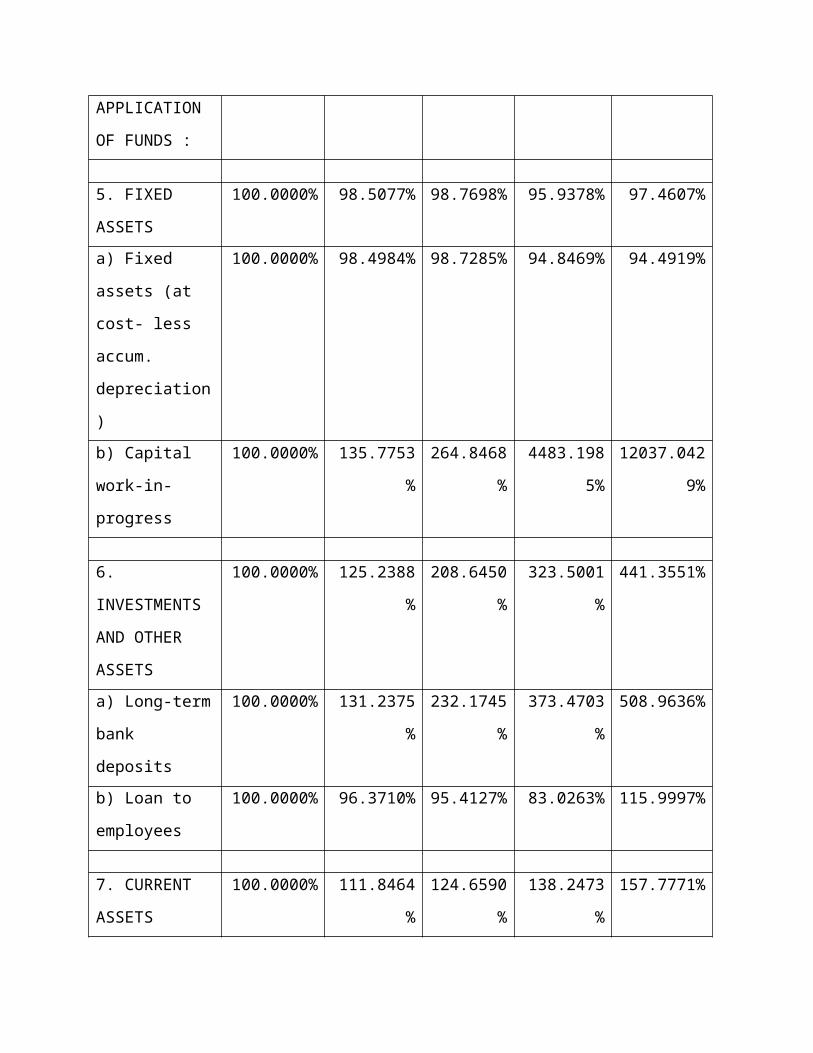
APPLICATION
OF FUNDS :
5. FIXED
ASSETS
100.0000% 98.5077% 98.7698% 95.9378% 97.4607%
a) Fixed assets (at
cost- less accum.
depreciation)
100.0000% 98.4984% 98.7285% 94.8469% 94.4919%
b) Capital work-
in-progress
100.0000% 135.7753% 264.8468% 4483.1985% 12037.0429
%
6.
INVESTMENTS
AND OTHER
ASSETS
100.0000% 125.2388% 208.6450% 323.5001% 441.3551%
a) Long-term
bank deposits
100.0000% 131.2375% 232.1745% 373.4703% 508.9636%
b) Loan to
employees
100.0000% 96.3710% 95.4127% 83.0263% 115.9997%
7. CURRENT
ASSETS
100.0000% 111.8464% 124.6590% 138.2473% 157.7771%
a) Inventories of
stores and other
materials
100.0000% 108.6893% 138.5357% 137.6009% 137.2788%
b) Advances,
deposits and
prepayments
100.0000% 416.2701% 107.8791% 133.9937% 93.7354%
c) Trade debtors
(Net)
100.0000% 102.5656% 94.3168% 102.0909% 110.3601%
Page 18
d) Cash and bank
balances
100.0000% 170.8351% 438.4349% 524.2433% 678.4314%
e) Other current
assets
100.0000% 46.6838% 274.9443% 335.7970% 517.5022%
8. CURRENT
LIABILITIES ( 8i
+ 8ii )
100.0000% 98.7673% 115.6207% 137.7432% 151.3824%
i) GROUP
COMPANY
ACCOUNTS
100.0000% 80.6066% 91.7770% 104.1381% 119.9924%
a) Payable for gas
purchase &
transmission
100.0000% 81.5994% 91.4798% 95.4742% 10.5799%
b) Payable for
PDF& BAPEX
margin
100.0000% 73.4817% 66.5868% 76.1497% 128.6854%
c) Payable for defi cit wellhead
margin fund for BAPEX
d) Payable for gas
development fund
e) Group current
accounts
100.0000% 109.9033% -
185.1467%
-259.5647% -254.7592%
ii) OTHER
LIABILITIES
100.0000% 187.3249% 231.8899% 301.6124% 304.4504%
a) Creditors and
accruals
100.0000% 270.9619% 343.8881% 455.0664% 456.9470%
b) Workers' Profi
t Participation
Fund
100.0000% 126.6744% 163.7896% 222.3195% 277.9012%
c) Current portion 100.0000% 57.9304% 54.9279% 55.2056% 44.8826%
Page 19
of long
9. NET
CURRENT
ASSETS ( 7
100.0000% 179.1613% 171.1767% 140.8421% 190.6893%
10. NET ASSETS
( 5+6+9 )
100.0000% 116.3321% 136.4853% 159.3294% 196.8134%
AVERAGE 100.0000% 127.8041% 145.5692% 299.8819% 615.5089%
STANDARD
DEVIATION
0.0000% 77.2441% 106.4167% 724.1199% 2032.1331%
Here, the figures of 2007 balance sheet were taken as the base year data and all the other figures
for other 4 years were expressed as percentage of the figures of 2007.
Titas Gas Transmission and Distribution Company Limited
Horizontal Income statement
2007 2008 2009 2010 2011
1. SALES 100.0000% 114.7410
%
135.7982% 165.7129% 175.9656%
a) Gas sales
revenue
100.0000% 114.8250
%
136.1861% 166.0991% 176.5626%
b) Operational
income
100.0000% 108.8707
%
108.6813% 138.7169% 134.2335%
2. COST OF
SALES (2i + 2ii)
100.0000% 111.9011
%
131.8434% 158.5109% 164.8113%
i) PURCHASE
COST
100.0000% 112.2195
%
132.8660% 160.0804% 166.0641%
a) Gas purchase 100.0000% 115.7175 139.9670% 163.9880% 166.2353%
Page 20
%
b) Gas transmission
charge
100.0000% 115.0113
%
108.9531% 118.7575% 123.9709%
c) Price deficit
charge
100.0000% 83.7587% 92.3794% 91.8237% 113.1020%
d) Gas development
charge
e) BAPEX margin 100.0000% 82.6221% 74.4214% 74.7865% 89.8300%
f) Deficit wellhead
margin for BAPEX
ii)
ADMINISTRATIV
E & OTHER COST
100.0000% 106.6548
%
114.9941% 132.6475% 144.1684%
a) Personnel costs 100.0000% 100.7075
%
110.3648% 146.0739% 166.8052%
b) Professional
services
100.0000% 102.7088
%
115.0358% 83.7747% 93.2909%
c) Promotional
costs
100.0000% 83.8129% 86.8999% 121.7389% 90.8989%
d) Power costs 100.0000% 84.8104% 77.8006% 94.6853% 98.2623%
e) Communication
costs
100.0000% 99.1870% 87.6410% 91.3799% 83.6163%
f) Transport costs 100.0000% 94.9911% 102.1950% 120.3268% 117.6912%
g) Occupancy costs 100.0000% 100.0746
%
99.1929% 125.2357% 161.7564%
h) Administrative
costs
100.0000% 171.6710
%
147.9413% 185.5579% 221.8503%
i) Miscellaneous
costs
100.0000% 84.9515% 72.1055% 63.9472% 86.6814%
j) Transmission &
distribution costs
100.0000% 65.2907% 122.3062% 84.8456% 104.1918%
Page 21
k) Financial charges 100.0000% 26.4307% 15.6336% 25.4553% 46.2341%
l) Bad & doubtful
debts provision
100.0000% 119.5733
%
127.3174% 137.4543% 150.2809%
m) Depreciation
charges
100.0000% 113.4586
%
118.1299% 121.9327% 122.5228%
n) Petrobangla
Service Charge
100.0000% 87.6839% 137.6357% 196.6873% 210.4414%
3. OPERATING
PROFIT (1-2)
100.0000% 141.2245
%
172.6778% 232.8751% 279.9837%
4. NON-
OPERATIONAL
INCOME
100.0000% 137.6471
%
146.6616% 148.4899% 233.9034%
5. TOTAL
INCOME (3+4)
100.0000% 141.0062
%
171.0909% 227.7278% 277.1729%
6. FINANCIAL
INCOME
100.0000% 228.2081
%
-670.2454% -983.1501% -
1480.1405
%
Interest income 100.0000% 90.0297% 514.9773% 717.7448% 1048.3014
%
Less: Interest cost 100.0000% 145.8530
%
36.1533% 30.5919% 26.8237%
7. NET PROFIT
BEFORE
CONTRIBUTION
TO ‘WPPF’ (5+6)
100.0000% 143.5832
%
185.8417% 250.0517% 312.7225%
8. WORKERS’
PARTICIPATION
IN PROFITS
100.0000% 143.5832
%
185.8417% 250.0517% 312.7225%
9. NET PROFIT 100.0000% 143.5832 185.8417% 250.0517% 312.7225%
Page 22
BEFORE
TAXATION (7-8)
%
10. PROVISION
FOR TAXATION
100.0000% 105.5275
%
137.0408% 184.7282% 230.5495%
a) Current Tax
b) Deferred Tax
11. NET PROFIT
FOR THE YEAR
AFTER
TAXATION (9-10)
100.0000% 163.7987
%
211.7652% 284.7523% 356.3735%
AVERAGE 100.0000% 113.8777
%
110.6839% 130.4038% 146.3029%
STANDARD
DEVIATION
0.0000% 34.9823% 156.7841% 225.2809% 329.7675%
Here, the figures of 2007 income statement were taken as the base year data and all the other
figures for other 4 years were expressed as percentage of the figures of 2007.
Forecasted Statements for 2010 and 2011:
Forecasted balance sheets and Income statements for 2012 and 2013 have been created through
percentage of sales method. Discretionary financing and common equity excluding retained earnings
assumed to be fixed for both two years.
Forecasted Balance Sheet:
Titas Gas Transmission Distribution Ltd
Page 23
Pro forma balance sheet (% of Sales Method)
As at 2012 & 2013
Notes:
2012 2013
Current asset 30582950474.29 35246850421.61
Fixed Asset 13356272254.46 15397164573.22
Investments 24926171208.05 28727412317.28
Total asset 68865393936.79 79371427312.11
Equity and
Liabilities
Current liabilities 24570647371.49 28317671095.63
Long term
Borrowings
2,088,802,253 2,088,802,253
Others Long term
liabilities
8,095,811,119 8,095,811,119
Total Liabilities 34755260743.49 38502284467.64
Equity
Share capital 9,421,160,300 9,421,160,300
Deposits for Share 29,272,335 29,272,335
Capital reserves 754,693,866 754,693,866
Revenue
reserve/retained
earnings
3293498371.21 3798623967.99
Total Equity 13498624872.21 14003750468.99
Total Equity and
Liabilities
48253885615.70 52506034936.63
Discretionary
Financing Needed
20611508321.09 26865392375.49
Page 24
While calculating retained earnings dividend was calculated as the percentage of the
income of the 2011 dividend paid.
Forecasted Income Statements:
Sales Growth Calculation:
Year Growth (g) Average growth
2008 14.74% 15.33%
2009 18.35%
2010 22.02%
2011 6.19%
Growth calculation from Future value formula
FV=PV*(1+g)4
Or, (1+g)4 =6855123385238957171618
Or, g= 0.1517 or 15.17%
Average sales growth:
g= 15.33+15.17
2
Or, g= 15.25%
Page 25
Titas Gas Transmission Distribution Ltd
Pro forma Income Statements (% of Sales Method)
For the year ended June 30, 2012 & 2013
Page 26
Notes:
2012 2013
Revenue 79005297014.43 91053604809.13
Cost of turnover 63485936927.77 73167542309.26
Gross Profit 15519360086.65 17886062499.86
Operating Expenses:
Operating Expenses 3341924063.71 3851567483.42
Operating profit 12177436022.94 14034495016.44
Non Operational
Income
663644494.92 764850280.39
Total Income 12841080517.86 14799345296.83
Financial Income 2099307225.6 2431840520.73
Net profit Before
Contribution to
WPPF
14940387743.46 17231185817.56
Workers Participation
In Profit
711047673.12 819482443.28
Net Profit Before
Tax(EBT)
14229340070.33345 16411703374.28531
Tax 3638442255.98 4196472552.80
Net Profit for the
Year After Tax
10590897814.34 12215230821.4
2012 2013
Revenue 79005297014.43 91053604809.13
Cost of turnover 63485936927.77 73167542309.26
Gross Profit 15519360086.65 17886062499.86
Operating Expenses:
Operating Expenses 3341924063.71 3851567483.42
Operating profit 12177436022.94 14034495016.44
Non Operational
Income
663644494.92 764850280.39
Total Income 12841080517.86 14799345296.83
Financial Income 2099307225.6 2431840520.73
Net profit Before
Contribution to
WPPF
14940387743.46 17231185817.56
Workers Participation
In Profit
711047673.12 819482443.28
Net Profit Before 14229340070.33345 16411703374.28531
Page 27
Depreciation expenses changes with changes in sales overtime
Ratio Analysis
Liquidity Ratio
Current Ratio:
Current Ratio=Current Asset
Current Liabilities
Year 2007 2008 2009 2010 2011 Industry
Average
Ratio 1.19 times 1.35 times 1.29 times 1.20 times 1.24 times 1.97 times
2007 2008 2009 2010 20111.1
1.15
1.2
1.25
1.3
1.35
1.4
1.19
1.35
1.29
1.2
1.24
Current Ratio
Current Ratio
TIMES
YEAR
Page 28
Tita
s Gas
Desco
Meg
hna
Jam
una
Padm
a
Barak
atulla
h
Power
Grid
Indust
ry A
vera
ge0
0.5
1
1.5
2
2.5
3
3.5
4
1.24
3.49
1.12 1.19 1.05
3.64
2.09 1.97
Current Ratio(2011)
Current Ratio
TIMES
Company & Industry Avg.
Analysis:
In 2011, Titas Gas Transmission & Distribution Co. Ltd’s current assets were only 1.24 times of
their current liabilities. The ratios are fluctuating through 2007 to 2011. In 2011 current ratio
slightly increased by changing the trend from downward to upward but it is less than 2008
&2009. So performance is not satisfactory. It caused due to more relative change in current asset
than current liabilities. Some of the Company like Barakatullah & Desco are doing much better
than Titas. They are above industry average whereas Titas is operating below industry Average.
So performance is really bad.
Quick/Acid Test Ratio:
Acid Test Ratio=Current Asset−Inventory
Current Liabilities
Year 2007 2008 2009 2010 2011 Industry
Average
Ratio 1.10 times 1.24 times 1.18 times 1.10 times 1.16 times 1.69 times
Page 29
2007 2008 2009 2010 20111
1.05
1.1
1.15
1.2
1.25
1.3
1.1
1.24
1.18
1.1
1.16
Acid Test Ratio
Acid Test Ratio
TIMES
YEAR
Tita
s Gas
Des
co
Meg
hna
Jam
una
Padm
a
Barak
atulla
h
Power
Grid
Indust
ry A
vera
ge0
0.5
1
1.5
2
2.5
3
3.5
4
1.16
2.78
0.8700000000000010.72000000000000
10.9
3.51
1.91.69
Acid Test Ratio(2011)
Acid Test Ratio
Company & In-dustry Avg.
TIMES
Analysis:
In 2011, Titas gas transmission and co. ltd’s Current asset excluding inventory was only 1.16
times of its current liabilities. It declined compared to 2008 and 2009. The trend is fluctuating
from year to year. It also is operating below industry average. So Performance is not favorable.
But it increased from 2010 due to more relative change in current asset excluding inventory that
current liabilities.
Net Working Capital:
Net Working Capital=Current Asset-Current Liabilities
Year 2007 2008 2009 2010 2011 Industry
Page 30
Average
Ratio 2736131661
TK
4902089610
TK
4683621210
TK
3853625688
TK
5217510630
Tk
5,072,665,231tk
2007 2008 2009 2010 2011BDT 0.00
BDT 1,000,000,000.00
BDT 2,000,000,000.00
BDT 3,000,000,000.00
BDT 4,000,000,000.00
BDT 5,000,000,000.00
BDT 6,000,000,000.00
2736131661
49020896104683621210
3853625688
5217510630
Net Working Capital
Net Working Capital
YEAR
Amount
Titas
Gas
Desco
Meg
hna
Jamuna
Padma
Barak
atulla
h
PowerGrid
Industry A
vera
geBDT 0.00
BDT 2,000,000,000.00
BDT 4,000,000,000.00
BDT 6,000,000,000.00
BDT 8,000,000,000.00
BDT 10,000,000,000.00
BDT 12,000,000,000.00
BDT 14,000,000,000.00
BDT 16,000,000,000.00
BDT
5,21
7,51
0,63
0.00
BDT
14,0
16,1
89,5
92.0
0
BDT
2,28
8,12
2,38
1.00
BDT
2,31
2,89
1,94
0.00
BDT
2,77
7,51
6,00
0.00
BDT
921,
625,
711.
00
BDT
7,97
4,80
0,36
2.00
BDT
5,07
2,66
5,23
1.00
Net Working Capital(2011)
Net Working Capital
Company & In-dustry Avg.
Amount
Analysis:
In 2011, net working capital increased but the trend is fluctuating significantly through 2007 to
2011. It is above industry average but significantly below some companies in the industry. So the
performance is not enough.
Page 31
Cash Conversion Cycle:
Cash Conversion Cycle = Days in Inventory + Days Sales Outstanding –Average Payment Period
Year 2007 2008 2009 2010 2011 Industry
Average
Ratio 27 days 45 Days 24 days 23 days 18 days 217.67days
2007 2008 2009 2010 20110
5
10
15
20
25
30
35
40
45
50
27
45
24 23
18
Cash Conversion Cycle
Cash Conversion Cycle
YEAR
DAYS
Tita
s Gas
Des
co
Meg
hna
Jam
una
Padm
a
Barak
atulla
h
Power
Grid
Indust
ry A
vera
ge
-1200
-1000
-800
-600
-400
-200
0
200
400
18
160
-1049
-0.44
82 75141
218
Cash Conversion Cycle(2011)
Cash Conversion Cycle
Company & Industry Avg
Days
Analysis:
On an average, In 2011 it takes 18 day to covert Titas gas distribution &transmission co. Ltd’s
invested Capital into cash.
Insight Gain:
Page 32
The company’s liquidity ratios are indicating that the company is not doing well in this section.
Their performance is not stable through the years. In some cases its performance is below
industry average whereas some company is doing above industry average. So management need
to find out the problem and should take necessary initiatives. Otherwise the company will not be
able to compete in the industry.
Asset Management Ratios
Inventory turnover:
Inventory turnover=Cost of Goods Sold
Inve ntory
Year 2007 2008 2009 2010 2011 Industry
Average
Ratio 25.08 times 25.90 times 24.06 times 29.19 times 31.95 times 10.01times
2007 2008 2008 2009 2010 20110
5
10
15
20
25
30
35
25.08 25.9
31.95
24.06
29.1931.95
Inventory turnover
Inventory turnover
Page 33
Tita
s
Jam
una
Padm
a
Meg
hna
Desco
Barka
tulla
h
Power
Grid
Indust
ry A
vera
ge0
5
10
15
20
25
30
35 31.95
13.4311.85
0.391000000000001
2.18
8.5
3.42
10.01
Inventory turnover
Inventory turnover
Analysis:
In 2011, the company has sold out and restored its inventory 31.95 times. Performance inclined
compared to 2009 and it’s far above industry average which shows a superior position in the
industry. However, inventory turnover ratio increased as relative change in COGS was higher
than the relative change in inventory.
Days in Inventory:
Days in Inventory=365
Inventory
Year 2007 2008 2009 2010 2011 Industry
Average
Ratio 15days 14.09days 15 days 13 days 11.42 days 188.54days
Page 34
2007 2008 2009 2010 20110
2
4
6
8
10
12
14
1615
14.0915
13
11.42
Days in invetory
Days in invetory
Titas
Jam
una
Padm
a
Meg
hna
Desco
Barka
tulla
h
Power G
rid
Industr
y Ave
rage
0100200300400500600700800900
1000
11.42 27.23 31
933.5
167.43
43106.72
188.54
Days Inventory
Days Inventory
Analysis:
It means the inventory of Titas Gas Transmission Co. Ltd on average stays in the inventory for
11.4 days before it sold out.
Total Asset turnover ratio:
TATO=Sales
Total Assets
Year 2007 2008 2009 2010 2011 Industry
Average
Page 35
Ratio 1.16 times 1.20 times 1.23 times 1.28 times 1.15 times 1.29 times
2007 2008 2009 2010 20111.05
1.1
1.15
1.2
1.25
1.3
1.16
1.2
1.23
1.28
1.15
TATO
TATO
Titas Jamuna Padma Meghna Desco Barkatullah Power Grid Industry Average
0
1
2
3
4
5
6
4.3
5.21
1.86
4.5
0.42 0.24 0.08
1.29
TATO
TATO
Analysis:
In 2011 every 1 TK worth of asset generated 1.15 TK worth of sales. Performance declined
compared to 2010 and the performance was unfavorable as it was below industry average.
However, the decline in the performance was caused by the higher relative change in total asset
than the relative change in sales.
Page 36
Fixed Asset turnover ratio:
FATO=Sales
¿ Assets
Year 2007 2008 2009 2010 2011 Industry
Average
Ratio 3.28 times 3.76 times 4.51 times 5.66 times 5.92times 39.33times
2007 2008 2009 20110
1
2
3
4
5
6
3.283.76
4.51
5.66
FATO
FATO
Titas
Jam
una
Padm
a
Meg
hna
Desco
Barka
tulla
h
Power G
rid
Industr
y Ave
rage
0
50
100
150
200
250
300
5.92 15.76
245.3
6.57 1.27 0.41 0.11
39.33
FATO
FATO
Analysis:
Page 37
In 2011 every 1 TK worth of fixed asset generated 1.15 TK worth of sales. Performance inclined
compared to 2010 but the performance was unfavorable as it was below industry average.
However, the incline in the performance was caused by the higher relative change in sales than
the relative change in fixed assets.
Days Sales Outstanding:
DSO =Account Receivables
Sales×365
Year 2007 2008 2009 2010 2011 Industry
Average
Ratio 130 day 117 days 90 day 80 days 81.22 days 219 days
2007 2008 2009 2010 20110
20
40
60
80
100
120
140130
117
9080 81.22
DSO
DSO
Page 38
Titas
Jam
una
Padm
a
Meg
hna
Desco
Barka
tulla
h
Power G
rid
Industr
y Ave
rage0
200
400
600
800
1000
1200
1400
81.222.01 55
1167
80.27 67 81219
DSO
DSO
Analysis:
In 2011, Titas took on an average 81.22 days to collect account receivables from the customers.
Days Payable Outstanding:
DSO =Account PayablesPurchase/COGS
×365
Year 2007 2008 2009 2010 2011 Industry
Average
Ratio 118 days 86 days 81 days 70 days 74.99 490 days
Page 39
2007 2008 2009 2010 20110
20
40
60
80
100
120
140
118
8681
7074.99
DPO
DPO
Titas
Jamuna
Padma
Meghna
Desco
Barkatu
llah
Power Grid
Industry A
verag
e0
500
1000
1500
2000
2500
3000
3500
74.99 29.68 4
3150
87.21 35 47
490
DPO
DPO
Analysis:
In 2011, Titas took on an average 74.99 days to make payment to its suppliers.
Comparing with DSO of 2011 Titas was in unfavorable position since it takes 81.22 days to
collect A/R from customers and 74.99 days to make payment to suppliers.
Insight Gained from Asset Management Ratio:
Page 40
Analyzing all the ratios it can be clear that the company has inefficiency in collecting A/R from
the customer which can create liquidity problem in future for the company. Moreover, it has
inefficiency in utilizing assets to generate higher sales revealing the company’s weakness in
asset management.
Debt Management Ratio:
Debt Ratio:
Debt Ratio =Total DebtTotal Asset
×100
Year 2007 2008 2009 2010 2011 Industry
Average
Ratio 29.18% 62.64% 61.24% 58.43% 52.72% 62.71%
2007 2008 2009 2010 20110.00%
10.00%
20.00%
30.00%
40.00%
50.00%
60.00%
70.00%
29.18%
62.64% 61.24%58.43%
52.72%
Debt Ratio
Debt Ratio
YEAR
Page 41
Tita
s Gas
Desco
Meg
hna
Jam
una
Padm
a
Barak
atulla
h
Power
Grid
Indust
ry A
vera
ge0.00%10.00%20.00%30.00%40.00%50.00%60.00%70.00%80.00%90.00%
100.00%
52.72%
9.40%
90.72%82.22%
94.00%
36.46%
73.45%62.71%
Debt Ratio(2011)
Debt Ratio
Company & Industry Avg
Analysis:
In 2011, the company’s 52.72% of the total assets were purchased by debt which means for
every 1 TK of total asset nearly .53 TK financed by debt. It is declining from 2008 which is very
favorable for the company because lower the debt ratio, the higher the cushion against creditor’s
losses in the event of bankruptcy.
From Capital Structure Point of View
Titas gas transmission & distribution company ltd’s capital structure consists of 52.72% debt and
rest is equity.
Times Interest Earned:
Times Interest Earned =EarningsBefore Interest∧Tax
Interest Expense
Year 2007 2008 2009 2010 2011 Industry
Average
Ratio 20.90 times 34.86 times 71.27 times 112.74 times 130.03 times 32.02times
Page 42
2007 2008 2009 2010 20110
20
40
60
80
100
120
140
20.9
34.86
71.27
112.74
130.03
Times Interest Earned
Times Interest Earned
TIMES
YEAR
Tita
s Gas
Des
co
Meg
hna
Jam
una
Padm
a
Barak
atulla
h
Power
Grid
Indust
ry A
vera
ge0
20
40
60
80
100
120
140 130.03
7.220
2.38 0.5293
32.02
Times Interest Earned(2011)
Times Interest Earned
Company & Industry Avg.
TIMES
Analysis:
In 2011, Titas gas distribution & company ltd’s Earnings before interest and tax is 130.03 times
higher than its interest expense and it is increasing through the year. The company is much
higher than industry average. So the company is in a good shape.
Insight Gain:
The company is doing well in the debt management in the company. The times interest earned is
increasing which is an indication that company using less amount of debt in its operation.
Profitability Ratio
Gross Profit Margin:
Page 43
Gross Profit Margin=Gross Profit
Sales×100 %
Year 2007 2008 2009 2010 2011 Industry
Average
Ratio 14.85% 16.95% 16.69% 17.75% 19.64% 22.33%
2007 2008 2009 2010 20110.00%
5.00%
10.00%
15.00%
20.00%
25.00%
14.85%
16.95% 16.69%17.75%
19.64%
Gross Profit Margin
Gross Profit Margin
Padma
Jamuna
Meg
hnaTit
as
Power G
rid
Desco
Barka
tulla
h
Industry A
vera
ge0.00%
10.00%
20.00%
30.00%
40.00%
50.00%
60.00%
1.46% 1.24%
35.19%
19.64%
26.86%22.75%
49.18%
22.33%
Gross Profit Margin
Gross Profit Margin
Analysis:
In 2011, for every 100 Tk sales Titas Gas Transmission Co. Ltd generated 19.64 Tk gross profit.
Performance inclined compared to 2009 and it’s certainly below industry average which shows
Page 44
an unfavorable position in the industry. However, gross profit margin increased as relative
change in gross profit was higher than the relative change in sales.
Operating Profit Margin:
Operating Profit Margin=OperatingProfit
Sales×100 %
Year 2007 2008 2009 2010 2011 Industry
Average
Ratio 9.68% 12.08% 12.32% 16.18% 15.41% 15.38%
2007 2008 2009 2010 20110.00%
2.00%
4.00%
6.00%
8.00%
10.00%
12.00%
14.00%
16.00%
18.00%
9.68%
12.08% 12.32%
16.18%15.41%
Operating Profit Margin
Operating Profit Margin
Page 45
Titas
Jamuna
Padma
Meghna
Desco
Barkatu
llah
Power Grid
Industry A
verag
e0.00%
5.00%
10.00%
15.00%
20.00%
25.00%
15.41%
0.78% 1.19%
19.74%
16.28%
12.32%13.59%
15.41%
Operating Profit Margin
Operating Profit Margin
Analysis:
In 2011, for every 100 Tk sales Titas Gas Transmission Co. Ltd produced 14.41 Tk operating
profit. Performance declined compared to 2009 and it’s just above industry average which shows
a favorable performance in the industry. However, operating profit margin declined because
relative change in sales was higher than the relative change in operating profit.
Net Profit Margin:
Net Profit Margin=Net Profit after tax
Sales×100 %
Year 2007 2008 2009 2010 2011 Industry
Average
Ratio 6.61% 9.56% 10.31% 11.36% 13.39% 13.81%
Page 46
2007 2008 2009 2010 20110.00%
2.00%
4.00%
6.00%
8.00%
10.00%
12.00%
14.00%
16.00%
6.61%
9.56%10.31%
11.36%
13.39%
Net Profit Margin
Net Profit Margin
Titas
Jamuna
Padma
Meg
hna
Desco
Barka
tulla
h
Power G
rid
Industry A
vera
ge0.00%
5.00%
10.00%
15.00%
20.00%
25.00%
30.00%
35.00%
9.68%
1.30% 0.85%
30.93%
12.02%
21.40%
14.78% 13.81%
Net Profit Margin
Net Profit Margin
Analysis:
In 2011, Titas Gas Transmission Co. Ltd generated 13.39 Tk net profit for every 100 Tk of sales.
Performance inclined compared to 2010 whereas ratio was just below industry average showing
slightly unfavorable performance in the industry. However, the incline in the ratio compared to
2010 was caused due to higher relative change in net profit compared to relative change in sales
Return on Asset:
Return on Asset=Net Profit after tax
Total Asset×100 %
Year 2007 2008 2009 2010 2011 Industry
Page 47
Average
Ratio 7.66% 11.50% 12.70% 14.53% 15.36% 5.59%
2007 2008 2009 2010 20110.00%
2.00%
4.00%
6.00%
8.00%
10.00%
12.00%
14.00%
16.00%
18.00%
7.66%
11.50%12.70%
14.53%15.36%
Retrun on Asset
Retrun on Asset
Titas
Jamuna
Padma
Meg
hnaDes
co
Powergr
id
Barka
tulla
h
Industry A
vera
ge0.00%
2.00%
4.00%
6.00%
8.00%
10.00%
12.00%
14.00%
16.00%
18.00%15.36%
6.78%
1.58%
4.05%5.04%
14.78%
5.12% 5.59%
Return on Asset
Return on Asset
Analysis:
In 2011, Titas Gas Transmission Co. Ltd generated 15.36 Tk net profits from every 100 Tk
worth of total assets. The ratio inclined from 2010 and it was far above industry average
presenting its superior performance in the industry. However, the incline in the ratio in 2011 was
caused by a higher relative change in net profit than the relative change in total assets.
Page 48
Operating Return on Asset:
Operating Return on Asset=OperatingProfitTotal Asset
×100 %
Year 2007 2008 2009 2010 2011 Industry
Average
Ratio 11.23% 14.53% 12.32% 20.68% 17.68% 6.38%
2007 2008 2009 2010 20110.00%
5.00%
10.00%
15.00%
20.00%
25.00%
11.23%
14.53%
12.32%
20.68%
17.68%
Operating return on asset
Operating return on asset
Titas
Jamuna
Padma
Meghna
Desco
Powergrid
Barkatu
llah
Industry A
verag
e0.00%2.00%4.00%6.00%8.00%
10.00%12.00%14.00%16.00%18.00%20.00%
17.68%
4.05%2.22% 2.58%
6.82%
1.14%
10.23%
6.38%
Operating Return on Asset
Operating Return on Asset
Analysis:
Page 49
In 2011, Titas Gas Transmission Co. Ltd generated 17.68 Tk operating profit from every 100 Tk
worth of total assets. The ratio declined from 2010 but it was far above industry average
presenting its better performance in the industry. However, the decrease in the ratio in 2011 was
caused by a higher relative change in total assets than the relative change in operating profit.
Return on Equity
Return on Equity=Net Profit after taxTotalCommonEquity
×100 %
Year 2007 2008 2009 2010 2011 Industry
Average
Ratio 26.49% 30.8% 32.78% 34.92.% 32.49% 26.11%
2007 2008 2009 2010 20110.00%
5.00%
10.00%
15.00%
20.00%
25.00%
30.00%
35.00%
40.00%
26.49%
30.80%32.78%
34.92%32.49%
Return on Equity
Return on Equity
Page 50
Titas
Jam
una
Padm
a
Meg
hna
Desco
Powergr
id
Barka
tulla
h
Industr
y Ave
rage
0.00%
5.00%
10.00%
15.00%
20.00%
25.00%
30.00%
35.00%
40.00%
45.00%
32.49%
38.14%
26.65%
40.46%
14.90%
22.07%
8.06%
26.11%
Return on Equity
Return on Equity
Analysis:
In 2011, common share holders of the Titas Gas Transmission Co. Ltd earned 32.49 Tk for every
100 Tk invested in the company. The performance declined compared to 2010 but the
performance was far better than industry average showing a good position in the industry.
However, the decline in the performance in 2011 was caused by higher relative change in total
common equity than relative change in net income.
Insight Gained from the profitability ratio:
Analyzing the entire profitability ratio it is apparent that company is doing better in most of the
cases. However, it has not done well in the gross profit section reflecting its inefficiency in
controlling cost of goods sold which is reducing the gross profit in turn reducing the ratio.
Market Ratio:
Earnings per Share:
Earning per Share=
Net incomeav ailable ¿CommonShareholders ¿Total number of commonshare outstanding
Page 51
Year 2007 2008 2009 2010 2011 Industry
Average
Ratio N/A TK 49.25/
share
Tk 63.67/
share
TK
85.62/share
TK 97.41/
share
TK 37.11/
share
2008 2009 2010 20110
20
40
60
80
100
120
49.25
65.67
85.62
97.41
EPS
EPS
Jam
una
Padm
a
Meg
hna
Desco
Power
grid
Tita
s
Barka
tulla
h
Indust
ry A
vera
ge0
20
40
60
80
100
120
4.3
29.8218.39
70.99
22.07
97.41
2.32
37.11
EPS
EPS
Analysis:
In 2011, the common share holder earns TK 97.41/ Share. EPS increased compared to 2010 and
it was far above industry average. However, the increase in EPS was caused by increase in net
income from 2010 to 2011.
Page 52
Market to Book Value Ratio (M/B):
M/B Ratio=Market Value
Book Value per share
Year 2007 2008 2009 2010 2011 Industry
Average
Ratio N/A 3.12 times 3.53 Times 0.89times 0.23times 2.57 times
2008 2009 2010 20110
0.5
1
1.5
2
2.5
3
3.5
4
3.12
3.53
0.89
0.23
M/B Ratio
M/B Ratio
Titas Jamuna Meghna Padma Desco Power Grid
Barkatulla Industry average
0
1
2
3
4
5
6
7
8
0.23
3.644.13
7.4
0.2380.68
1.65
2.57
M/B ratio
M/B ratio
Analysis:
In 2011, the Market value of Titas share was .23 times higher than the book value per share. The
ratio declined compared to 2010 and it was far below industry average showing a serious
Page 53
unfavorable position in the industry. However, the ratio declined as relative change in book value
per share was higher than the relative change in market value.
Price Earnings ratio:
Price Earnings ratio=Market Price
EPS
Year 2007 2008 2009 2010 2011 Industry
Average
Ratio N/A 10.13 10.78 11.67 0.69 10.49
2008 2009 2010 20110
2
4
6
8
10
12
14
10.1310.78
11.67
0.690000000000001
P/E Ratio
P/E Ratio
Tita
s
Barka
tulla
h
Jam
una
Padm
a
Meg
hna
Desco
Power
Grid
Indust
ry a
vera
ge0
5
10
15
20
25
30
0.690000000000001
20.52
9.54
27.77
10.21
1.593.12
10.49
P/E ratio
P/E ratio
Page 54
Analysis:
In 2011, the common share holders of Titas were willing to pay .69 TK for every dollar of
reported earnings. The ratio is very low compared to industry average showing the share price is
highly undervalued. It also implies that it will create lack of confidence among the common
share holder on the company.
Insight gained from Market ratios:
Analyzing entire market ratios, it is apparent that in 2011 in DSE the price of share was
undervalued which is actually reflected by the P/E ratio. Although earning per share was
significantly high, investors were having lack of confidence to invest on it. It may be caused due
to the severe market fall in 2011 which caused the market price to fall significantly.
Risk and Return Analysis
Here,
Standard Deviation = √∑ (ki−k )2
n−1 * 100
Coefficient of variation=Standard DeviationRateof return
Average Return Standard
Deviation
Coefficient of
Variation
Titas Gas Co Ltd 2.37% 12.84% 5.42
DSE General
Index
0.89% 10.21% 11.47
Page 55
Analysis:
From the table, it is clear that Titas has a high rate of return and risk compared to market (DSE
general index). As we know, coefficient of variation measures the risk involved in per unit of
return, from the table it is apparent that Titas has low risk per unit of return compared to DSE
general index.
Market Return Analysis
Beta calculation:
-40.00% -20.00% 0.00% 20.00% 40.00%
-40.00%
-30.00%
-20.00%
-10.00%
0.00%
10.00%
20.00%
30.00%
40.00%
50.00%
f(x) = 0.849430795667443 x + 0.0161013677374449
Chart Title
TitasLinear (Titas)Linear (Titas)
Titas monthly Return
DSE General Index
Average Return Standard
Deviation
Coefficient of
Variation
Titas Gas Co Ltd 2.37% 12.84% 5.42
DSE General
Index
0.89% 10.21% 11.47
Page 56
Notes: Beta has been calculated by the monthly return from July, 2008 to July, 2012 as the
company was enlisted in DSE since July, 2012.
Analysis:
So the beta for the company is 0.8494 found by the scattered diagram and the regression analysis
which shows that the company’s volatility to the market returns. It means 1% change in the
market return will lead to .85% change in the company’s return.
Risk Free Rate (RF:
Reason to choose the rate of monthly T-Bill as the Risk Free Rate (RF):
From Bangladesh Bank website risk free rate of 9.05% has been chosen, which is the rate of
monthly T-bill is. It is chosen monthly as all the data used to calculate beta are in monthly basis.
Moreover, to calculate the average market return (RM) rate of return, DSE general index are used
which are also monthly. So, to match the period while calculating required rate of return (RK)
through CAPM, monthly risk free rate has been chosen.
Monthly Required Rate of Return (RE) Using CAPM:
Here,
Monthly Average Market Return= 0.89%
Risk Free return= 9.05%
β = 0.85
CAPM:
β=.85
RF= 9.05%
RE = RF+ β×(RM-RF)
RE=9.05%+.85(.89%-9.05%)
RE=2.11%
Annual Required Rate of Return (RE)= 25.37%
Page 57
Interest and other Cost of financing of debt:
Cost of debt is the calculated from the 2011 interest expense divided by long term loan of
2011and tax rate is calculated is divided by the tax paid in 2011 by the corresponding EBT.
Moreover, cost of equity/ retained earnings is the company’s annual required rate of return.
WD (weight of
debt)
KD (Cost of
debt)
Tax rate WE( Weight of
Common
equity)
WRE( Weight
of Retained
Earnings)
KE /KR ( Cost
of Common
equity/retained
earnings)
26.50% 3.89 % 25.57 % 26.55 % 46.95 % 25.37%
Weighted Average Cost of Capital:
WD*KD
(1-T)
WE*KE WRE*KRE WACC
7.67% 6.74% 11.91% 26.32%
Analysis:
WACC is a calculation of a firm's cost of capital in which each category of capital is
proportionately weighted. All capital sources - common stock, preferred stock, bonds and any
other long-term debt - are included in a WACC calculation. So, it is apparent from the table that
Titas has to spend proportionately 7.67% as the cost of debt, 6.74% as the cost of equity and
11.91% as the cost of retained earnings generating a total cost of capital of 26.32%.
Page 58
Optimal Capital Structure
Note: Weight combination of different categories of capital is arbitrary assumed
Analysis:
As we can see from the table, the optimal structure of the firm is the combination-5 which
consist of 66.95% retained earnings, 26.55% common equity and 6.50% generating highest value
of 30712975867.19 for the firm.
Dividend Policy
There are three views of dividend policy that a company can follow.
1st View: “Dividend Policy is absolutely irrelevant”
combinat
ion
Capital Debt WACC Value of the firm
Retained
Earnings
Common
Equity
1 46.95% 26.55% 26.50% 26.32% 29872803275.08
2 36.95% 16.55% 36.50% 26.68% 29469721971.51
3 26.95% 6.55% 46.50% 26.75% 29392604942.06
4 56.95% 36.55% 16.50% 26.96% 30287064029.28
5 66.95% 26.55% 6.50% 26.60% 30712975867.19
Page 59
This view says that there is no relationship between dividend policy and stock value. The logic
behind this is (total return=Capital gain yield + Dividend yield) that investor do not care whether
return come from capital gain yield or dividend yield. What they care is the total rate of return.
This view assumes perfect capital market exist.
2nd View: “Dividend is absolutely relevant”
This view says high dividend increases the share price because t believes that dividend income
has a higher value to the investor than do capital gains income. Logic for this is that dividends
are more certain than capital gains. There is no assumption in this view.
3rd View: “Low Dividend increases the Share Price”
This view says people always try to maximize after tax income. Investors always try to defer
taxes whenever possible. In case of dividend income taxes are paid when the dividend is
received, whereas capital gains are deferred until the stock is actually sold. So investors want
low dividend and high retention of firm’s earnings to increase the share price.
Titas Gas Transmission & Distribution Company ltd follows the 2nd view that is High
Dividend Increases the share price.
Justification:
As we see the historical dividend payment of Titas gas transmission and distribution company ltd
from 2008 to 2011, we see that it is increasing. So we can say that they are actually following 2nd
view. The reason behind this is that people are always concern about their certain income. In the
view of people dividend is a certain income whereas they are uncertain about the income from
the capital gain. The reason behind their belief is dividends can be predictable compared to
capital gain as management can control dividend but it cannot dictate the price of stock.
Keeping all this in mind the company decided to follow the view of Dividend is totally relevant.
Payment plans regarding dividend:
Page 60
Titas gas limited has been paying cash dividend to its shareholders since it started giving
dividends. The dividend per share paid to the shareholders in 2008, 2009, 2010, 2011 has been
9.38, 15.52, 26.98, and 24.80 taka respectively.
They have maintained a stable trend of increase in dividends in small amounts from 2008 to
2010. Only in 2011 there has been a slight decrease in dividend. Apart from this year, our
forecasted dividend for 2012, 2013 and 2014 has been 33.29, 44.94 and 47.19 taka respectively
which show small but upward increments in dividends.
So, we can conclude that Titas gas limited follows ‘stable dollar dividend payment’ plan in
paying dividends to its shareholders.
Conclusion
The financial position and performance of the company was overall good. The company should
try to improve the performance in certain areas especially in the asset management area to use of
the company’s full capability. Moreover, the company should use debt properly as a source of
fund rather than mostly depend on high cost sources like common holders equity and retained
earnings.
However, the market position of the firm was volatile as the price at the December end 2011 was
very low. P/E ratio indicates the undervaluation of the share price as well as the intrinsic price
determined in the report also proves the same. To improve the situation company should come
forward with new techniques and better understanding of the market.


![GAS SUPPLY AGREEMENT - bpdb.gov.bd · [insert month and year], in Dhaka, Bangladesh BY AND BETWEEN Titas Gas Transmission and Distribution Company Ltd . , with its registered office](https://static.documents.pub/doc/80x56/5dd11e2ad6be591ccb644e9d/gas-supply-agreement-bpdbgovbd-insert-month-and-year-in-dhaka-bangladesh.jpg)

