38
| Date post: | 26-Oct-2014 |
| Category: |
Documents |
| Upload: | maria-khan |
| View: | 87 times |
| Download: | 0 times |


FINANCIAL ANALYSIS OF
FAUJI FERTILIZER COMPANY LIMITED PAKISTAN.

IN THE NAME OF ALLAH, THE MOST MERCIFUL, THE MOST KIND
All praise is for Allah Almighty, the Creator of this world who enables me to do this arduous work. Firstly I am very thankful and obliged to my GOD. GOD blessing me a Lot and give me the strength, hope and cool calm temperament that keep me alive my thinking and my motivation to complete the project in a very short and tight period of time. Without my ALLAH blessing it is not possible for me to complete this project in time. I am very thankful to my ALLAH. I would also like express my sincere and deep thankfulness to my parents, brother. They all are support me a lot in moral sense and technical aspects as well. My parents, brother keepmotivating me. My class fellow and Google.com support, guide and help me in technical grounds.Finally and most importantly, I am very thankful to my respected teacher Sir Yasir shehzad whose superb guidance help me to complete this task.
ACKNOWLEDGEMENT
This project is about financial statement analysis of any company of Pakistan to gain knowledge about its financial performance for last five years. My ana-lytical report is about the financial situation of the Fuji fertilizer limited, the largest manufacturers of
fertilizer in Pakistan. They are one of the top companies of the country with a massive share in the market of urea. This analysis would certainly help us in knowing the current financial status of the company.
What is financial statement analysis?
Process of identifying financial strengths and weaknesses of the firm by properly establishing relationship between the items of the balance sheet and the profit and loss account.Our purpose of doing financial statement analysis:
Financial statements are prepared to meet external reporting obligations and also for decision making purposes. They play a dominant role in setting the framework of managerial decisions. But the information provided in the fi-nancial statements is not an end in itself as no meaningful conclusions can be drawn from these statements alone. However, the information provided in the financial statements is of immense use in making decisions through anal-ysis and interpretation of financial statements.
Tools and Techniques of Financial Statement Analysis:
Following are the most important tools and techniques of financial statement analysis:1. Horizontal and Vertical Analysis2. Ratios Analysis
AB-STRACT:
INTRODUCTION TO COMPANY:
With a vision to acquire self - sufficiency in fertilizer production in the coun-
try, FFC was
Incorporated in 1978 as a private limited company. This was a joint venture
between
Fauji Foundation (a leading charitable trust in Pakistan) and Haldol Topsoil
A/S oftener. The initial authorized capital of the company was 813.9 Million
Rupees. The
Present share capital of the company stands at Rs. 3.0 Billion. Additionally,
FFC has Rs.1.0 Billion stakes in the subsidiary Fauji Fertilizer Bin Qasim Lim-
ited (formerly CJoran Fertilizer Company Limited).FFC commenced commer-
cial production of urea in
1982 with annual capacity of 570,000 metric tons.
Through De-Bottle Necking (DBN) program, the production capacity of the
existing plant increased to 695,000 metric tons per year.
FFC participated as a major shareholder in a new DAPS/Urea manufacturing
complex
with participation of major international/national institutions. The new com-
pany FaujiFertilizer Bin Qasim Limited (formerly FFC-Jordan Fertilizer Com-
pany Limited) commenced commercial production with effect from January
01, 2000. The facility isdesigned to produce 551,000 metric tons of urea and
445,500 metric tons of DAP This excellent performance was due to hard work
and dedication of all employees and the progressive approach and support
from the top management.
In the year 2002, FFC acquired ex Pak Saudi Fertilizers Limited (PSFL) Urea
Plant situated at Mirpur Mathelo, District Ghotki from National Fertilizer Cor-
poration (NFC) through privatization process of the Government of Pakistan.
This acquisition at Rs 8,151 million represents one of the largest industrial

sector transactions in Pakistan Company’s brand name is “SONA” under the
umbrella of the Fauji fertilizer company
that is abbreviated as given.
The company introduced its product under the name of “SONA UREA” in
1982 as the
first plant was underway as far as the production is concerned; the company
and brand
name had already been registered when the company entered the business
in 1978.At
first, the company had put all its efforts in the production of urea as there
was a definite
need for the urea production in the country because of the high demand and
consumption.
Talking about the current situation and the future prospective, the company
has been one of the leading Organizations of the country for a long time now
and the brand name are very well established.
COMMON SIZE ANALYSIS, as used in vertical analysis of financial statements,
an item is used as a base value and all other accounts in the financial statement are
compared to this base value. On the balance sheet, total assets equal 100% and
each asset is stated as a percentage of total assets. Similarly, total liabilities and
stockholders equity are assigned 100%, with a given liability or equity account
stated as a percentage of total liabilities and stockholders equity. On the income
statement, 100% is assigned to net sales, with all revenue and expense accounts
then related to it in percentages.
COMMON SIZE ANALYSIS OF FFC
Vertical analysis is Technique for identifying relationship between items in the same financial state-ment by expressing all amounts as the percentage of the total amount taken as 100. In a bal-ance sheet, for example, cash and other assets are shown as a per-centage of the total assets and, in an income statement, each ex-pense is shown as a percentage of
the sales revenue. Financial statements using this technique are called common size financial state-ments.
VERTICAL COMMON SIZE ANALYSIS (INCOME STATEMENT)
2007 2008 2009 2010 2011SALES 100 100 100 100 100COST OF SALES
64.41% 64.29% 67.58% 64.41% 59.60%
GROSS PROFIT
35.58% 40.39% 32.42% 35.59% 40.40%
HORIZANTA
L ANALYSIS:

DISTRIBU-TION COST
8.5% 9.30% 9.17% 8.51% 8.72%
OPERATING PROFIT
27.08% 26.40% 23.42% 27.08% 31.67%
FINANCE COST
2.47% 1.28% 1.67% 2.47% 2.27%
OTHER EX-PENSES
2.97% 2.46% 2.46% 2.97% 2.93%
OTHER IN-COME
4.44% 5.65% 4.21% 5.86% 6.35%
NET PROFIT BE-FORE TAX
29.02% 28.31% 23.32% 27.49% 32.82%
PROVISION FOR TAXA-TION
9.98% 9.09% 7.84% 8.63% 11.49%
NET PROFIT AF-TER TAX
19.04% 19.21% 15.48% 18.86% 21.33%
Interpretation:
Throughout 5 years there fluctuations in percentage of gross profit to sales. 1stly it increases then starts de-creasing through 2011.gross profit also fluctuate accord-ingly. Over all vertical common size analysis shows that due to fluctuations in expenses gross profit also fluctu-ates accordingly.

HORIZANTAL COMMON SIZE ANALYSIS INCOME STATEMENT:
2007
2008 2009 2010 2011
SALES 100 121.18%
142.44%
135.20%
145.49%
COST OF SALES 100 124.51%
153.84%
139.17%
138.59%
GROSS PROFIT 100 115.62%
123.38%
128.56%
157.04%
DISTRIBUTION COST
100 134.22%
155.49%
136.92%
151.08%
OPERATING PROFIT
100 110.23%
114.08%
126.16%
158.78%
FINANCE COST 100 87.44%
134.33%
188.77%
186.35%
OTHER EX-PENSES
100 111.83%
131.31%
150.76%
159.86%
100 111.70%
110.75%
118.97%
156.67%
OTHER INCOME (DIVIDEND/OTH-ERS)
100 154.21%
134.94%
178.31%
208.08%
NET PROFIT BE-FORE TAX
100 118.21%
114.45%
128.05%
164.52%
PROVISION FOR TAX
100 110.38%
111.91%
116.91%
167.51%
NET PROFIT AF-TER TAX
100 122.31%
115.78%
133.89%
162.96%
Interpretation:
There is material increase in sales as compared to base year .expenses and cost of goods sold also increase. And ultimately net profit also increases as compared to base year throughout five years.
LIQUIDITY ANALYSIS OF FFC:
Definition of 'Liquidity'
1. The degree to which an asset or security can be bought or sold in the market without affecting the asset's price. Liquidity is characterized by a high level of trading activity. Assets that can be easily bought or sold are known as liquid assets.
2. The ability to convert an asset to cash quickly. Also known as "marketability".
There is no specific liquidity formula; however, liquidity is often calculated by using liquidity ra-tios.
Liquidity Ratios:
Liquidity ratios measure the short term solvency of finan-cial position of a firm. These ratios are calculated to com-ment upon the short term paying capacity of a concern or the firm's ability to meet its current obligations. Following are the most important liquidity ratios.
1) Current ratio
2) Liquid / Acid test / Quick ratio
3) Accounts receivable turnover

4) Inventory turnover
5) Cash ratio
CURRENT RATIO:
Definition:
Current ratio may be defined as the relationship be-tween current assets and current liabilities. This ratio is also known as "working capital ratio". It is a measure of general liquidity and is most widely used to make the analysis for short term financial position or liquidity of a firm. It is calculated by dividing the total of the current assets by total of the current liabilities.
Formula:
Following formula is used to calculate current ratio:
Current Ratio = Current Assets / Current Liabilities.
Current ratio
2007 2008 2009 2010 2011
0.44 0.8 0.83 0.83 1.06
Graphical representation:
2007 2008 2009 2010 20110
0.2
0.4
0.6
0.8
1
1.2
current ratio
current ratio
Quick ratio:
Definition:

An indicator of a company's short-term liquidity. The quick ratio measures a company's ability to
meet its short-term obligations with its most liquid assets. The higher the quick ratio, the better
the position of the company.
The quick ratio is calculated as:
Quick ratio
2007 2008 2009 2010 2011
0.88 0.009 0.82 0.82 1.04
GRAPHICAL REPRESENTATION:
2007 2008 2009 2010 20110
0.2
0.4
0.6
0.8
1
1.2
QUICK RATIO
QUICK RATIO

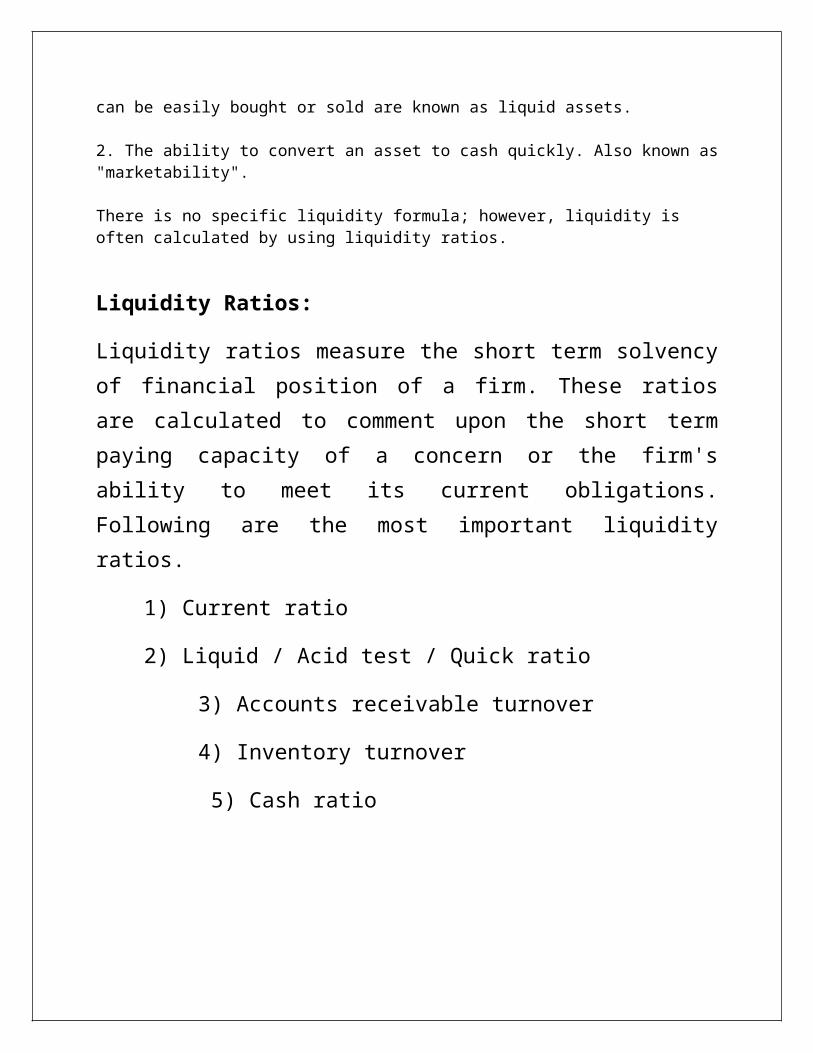
Accounts receivable turnover ratio:
Definition:
An accounting measure used to quantify a firm's effectiveness in extending credit as well as col-lecting debts. The receivables turnover ratio is an activity ratio, measuring how efficiently a firm uses its assets.
Formula:
Accounts re-ceivable turnover
2007 2008 2009 2010 2011
21.18 times 27.57 times 96 times 145.97 times 248 times
2007 2008 2009 2010 20110
50
100
150
200
250
300
accounts receivable turnover ratio
accounts receivable turnover ratio

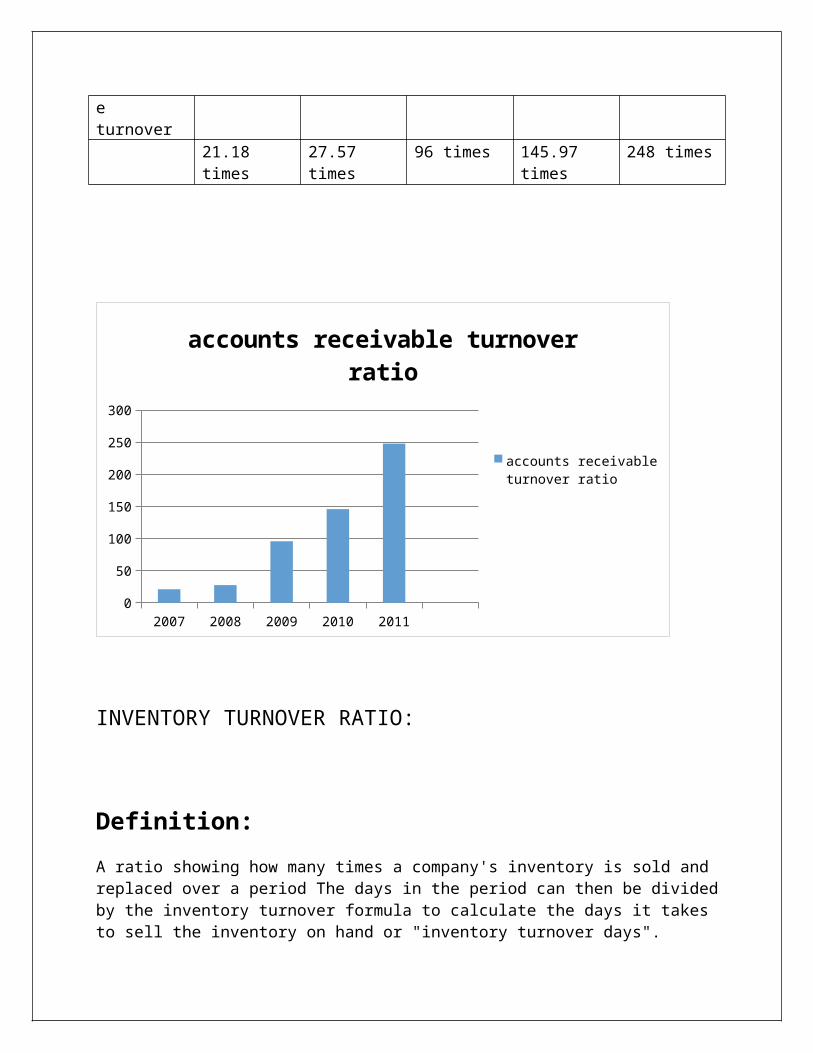
INVENTORY TURNOVER RATIO:
Definition:
A ratio showing how many times a company's inventory is sold and replaced over a period The days in the period can then be divided by the inventory turnover formula to calculate the days it takes to sell the inventory on hand or "inventory turnover days".
.
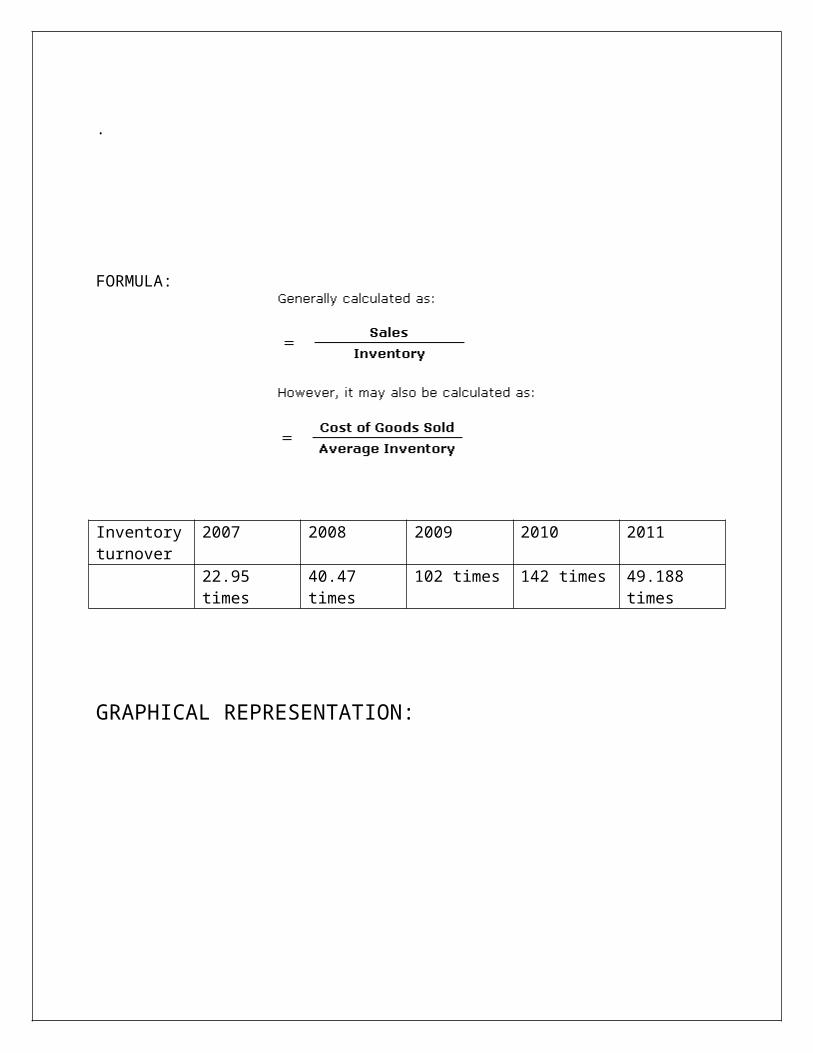
FORMULA:
Inventory turnover
2007 2008 2009 2010 2011
22.95 times 40.47 times 102 times 142 times 49.188 times
GRAPHICAL REPRESENTATION:

2007 2008 2009 2010 20110
20
40
60
80
100
120
140
160
INVENTORY TURNOVER RATIO
INVENTORY TURNOVER RATIO
CASH RATIO:
The cash ratio is an indicator of a company's liquidity that further refines both the current ratio and the quick ratio by measuring the amount of cash, cash equivalents or invested funds there are in current assets to cover current liabilities.
Formula:
Cash ra-tio
2007 2008 2009 2010 2011
0.38 0.37 0.59 0.64 0.89
GRAPHICAL REPRESENTATION:
2007 2008 2009 2010 20110
0.1
0.2
0.3
0.4
0.5
0.6
0.7
0.8
0.9
1
CASH RATIO
CASH RATIO
INTRPRETATION OF OVERALL LIQUIDITY:
LONG TERM DEBT PAYING ABILITY OF FOUJI FERTILIZER COMPANY:
Definition of 'Long-Term Debt'
Loans and financial obligations lasting over one year.
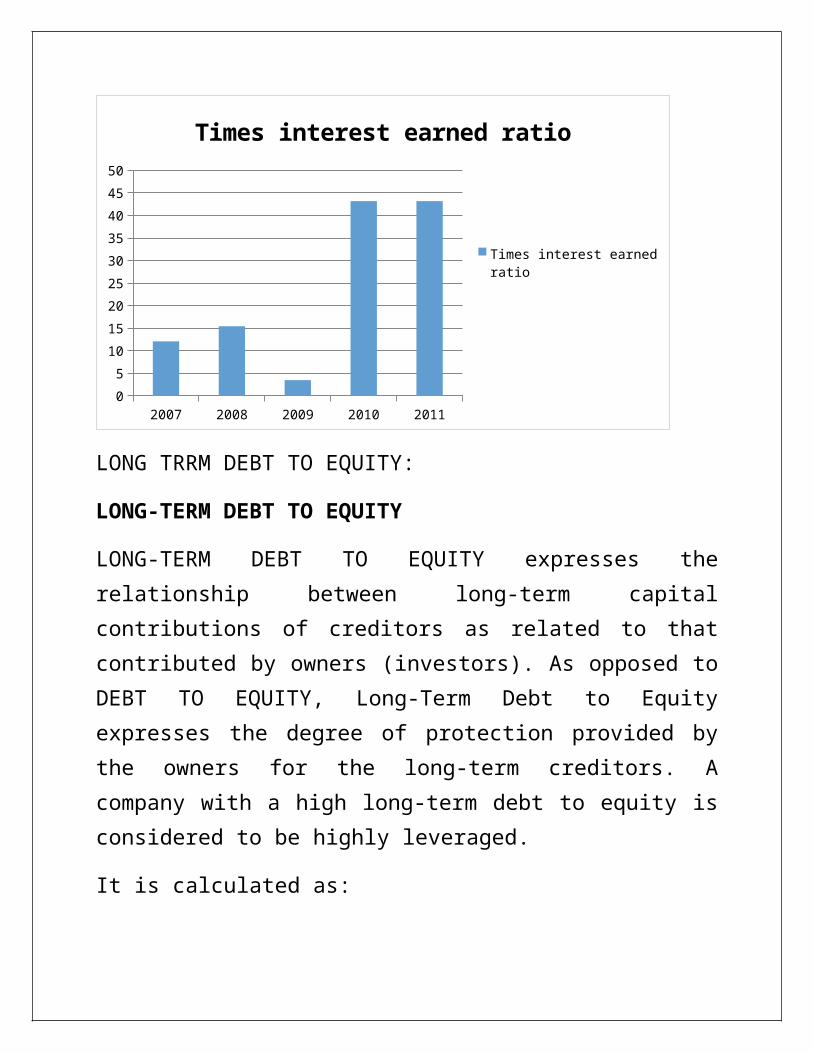
Times interest earned ratio:
Definition of 'Times Interest Earned - TIE'
A metric used to measure a company's ability to meet its debt obligations. It is calculated by tak-ing a company's earnings before interest and taxes (EBIT) and dividing it by the total interest payable on bonds and other contractual debt. It is usually quoted as a ratio and indicates how many times a company can cover its interest charges on a pretax basis. Failing to meet these obli-

gations could force a company into bankruptcy. Also referred to as "interest coverage ratio" and "fixed-charged coverage."
It is calculated as:
Times interest earned
2007 2008 2009 2010 2011
12.11 15.44 14.82 43.19 43.20
GRAPHICAL REPRESENTATION:
2007 2008 2009 2010 20110
5
10
15
20
25
30
35
40
45
50
Times interest earned ratio
Times interest earned ra-tio
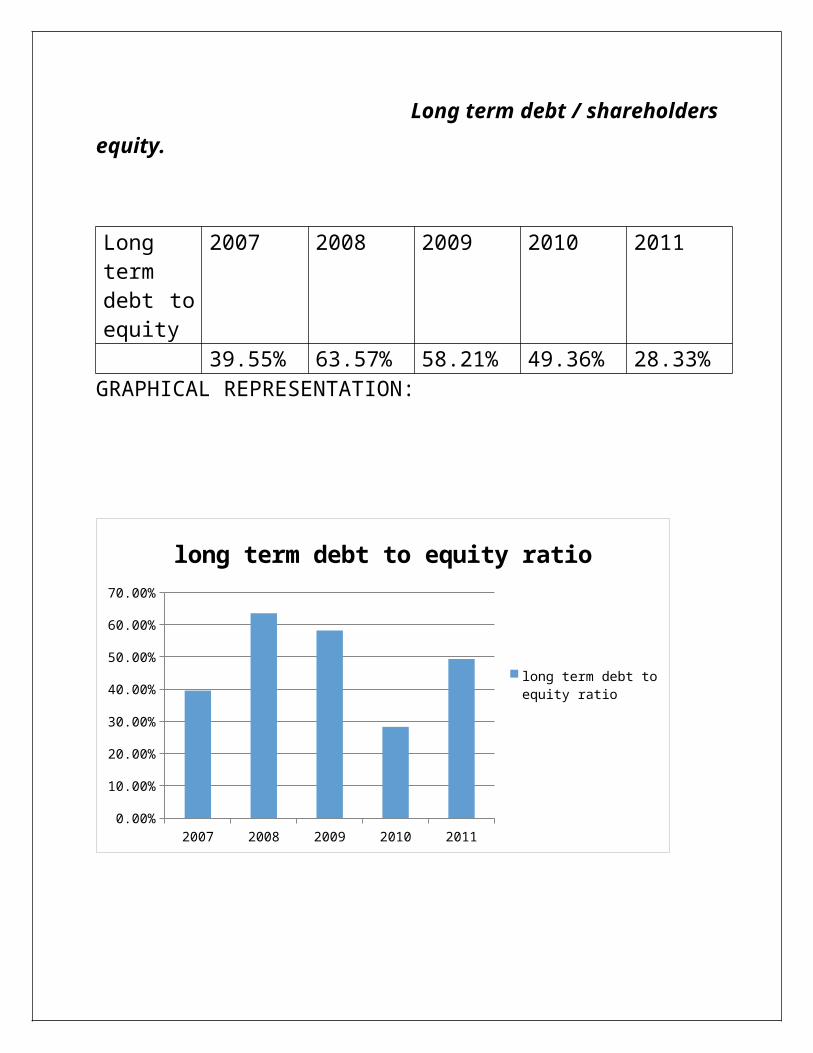
LONG TRRM DEBT TO EQUITY:
LONG-TERM DEBT TO EQUITY

LONG-TERM DEBT TO EQUITY expresses the relationship between long-term capital contributions of creditors as related to that contributed by owners (investors). As op-posed to DEBT TO EQUITY, Long-Term Debt to Equity ex-presses the degree of protection provided by the owners for the long-term creditors. A company with a high long-term debt to equity is considered to be highly leveraged.
It is calculated as:
Long term debt / shareholders equity.
Long term debt to equity
2007 2008 2009 2010 2011
39.55% 63.57% 58.21% 49.36% 28.33%GRAPHICAL REPRESENTATION:
2007 2008 2009 2010 20110.00%
10.00%
20.00%
30.00%
40.00%
50.00%
60.00%
70.00%
long term debt to equity ratio
long term debt to equity ratio
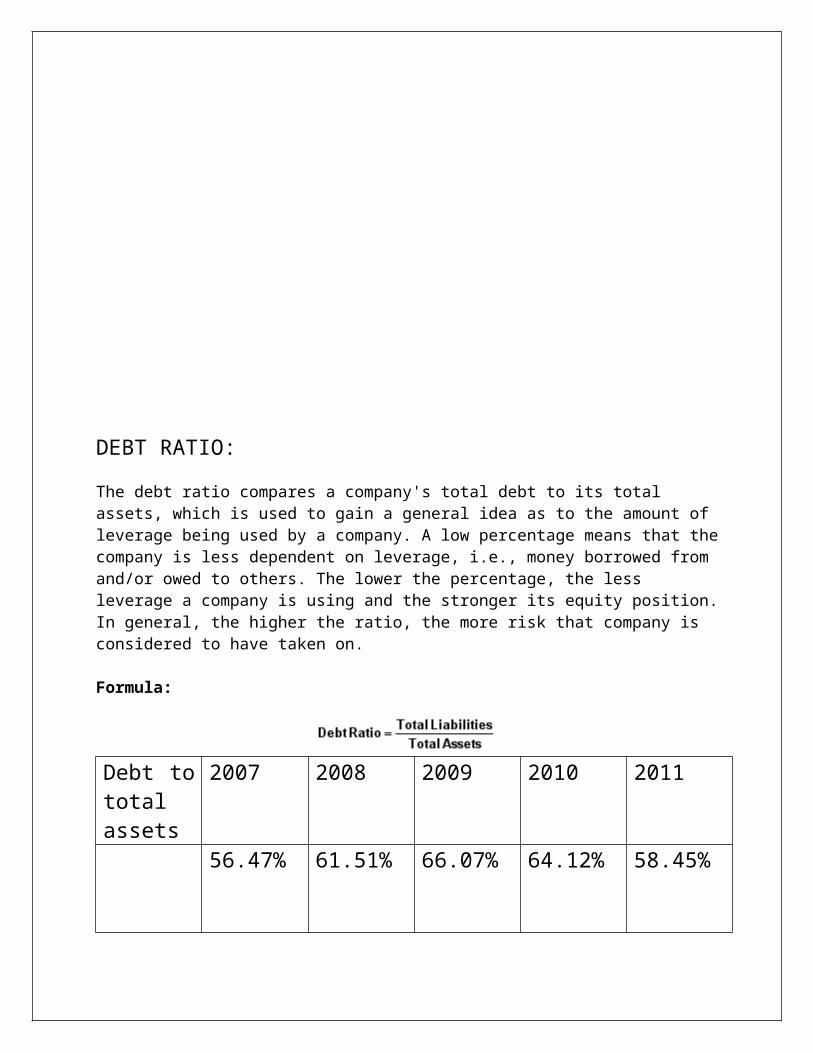
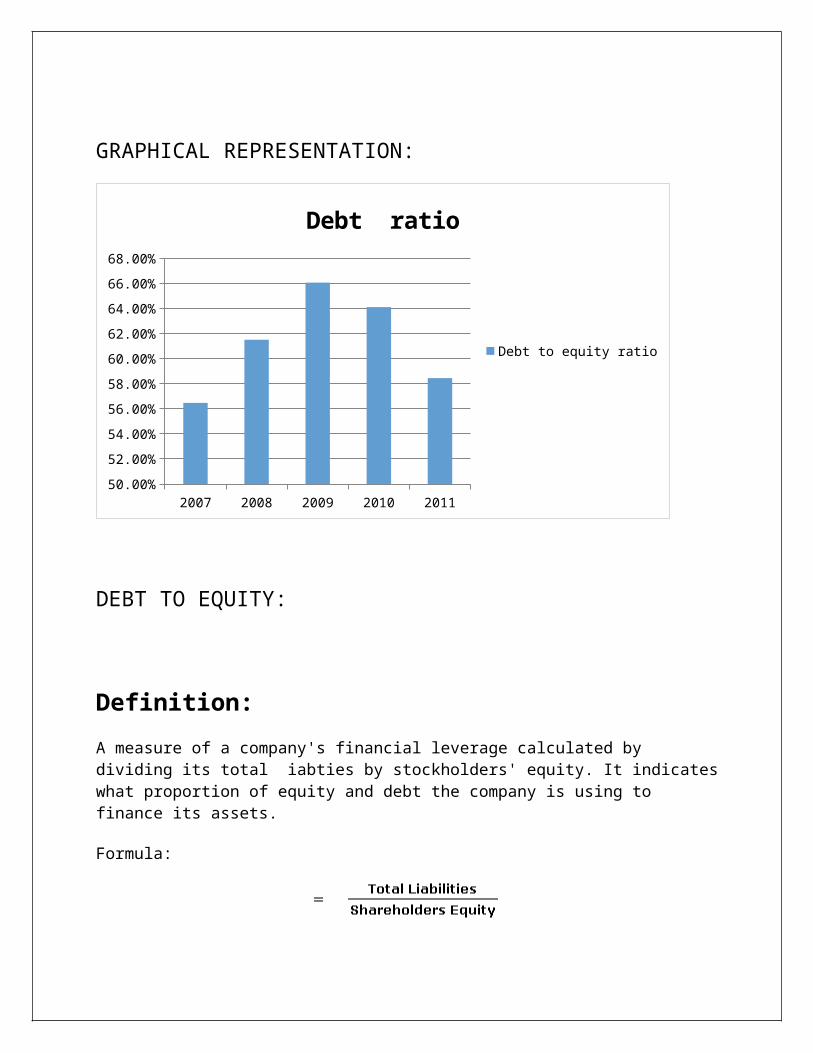
DEBT RATIO:
The debt ratio compares a company's total debt to its total assets, which is used to gain a general idea as to the amount of leverage being used by a company. A low percentage means that the company is less dependent on leverage, i.e., money borrowed from and/or owed to others. The lower the percentage, the less leverage a company is using and the stronger its equity position. In

general, the higher the ratio, the more risk that company is considered to have taken on.
Formula:
Debt to total as-sets
2007 2008 2009 2010 2011
56.47% 61.51% 66.07% 64.12% 58.45%
GRAPHICAL REPRESENTATION:
2007 2008 2009 2010 201150.00%
52.00%
54.00%
56.00%
58.00%
60.00%
62.00%
64.00%
66.00%
68.00%
Debt ratio
Debt to equity ratio
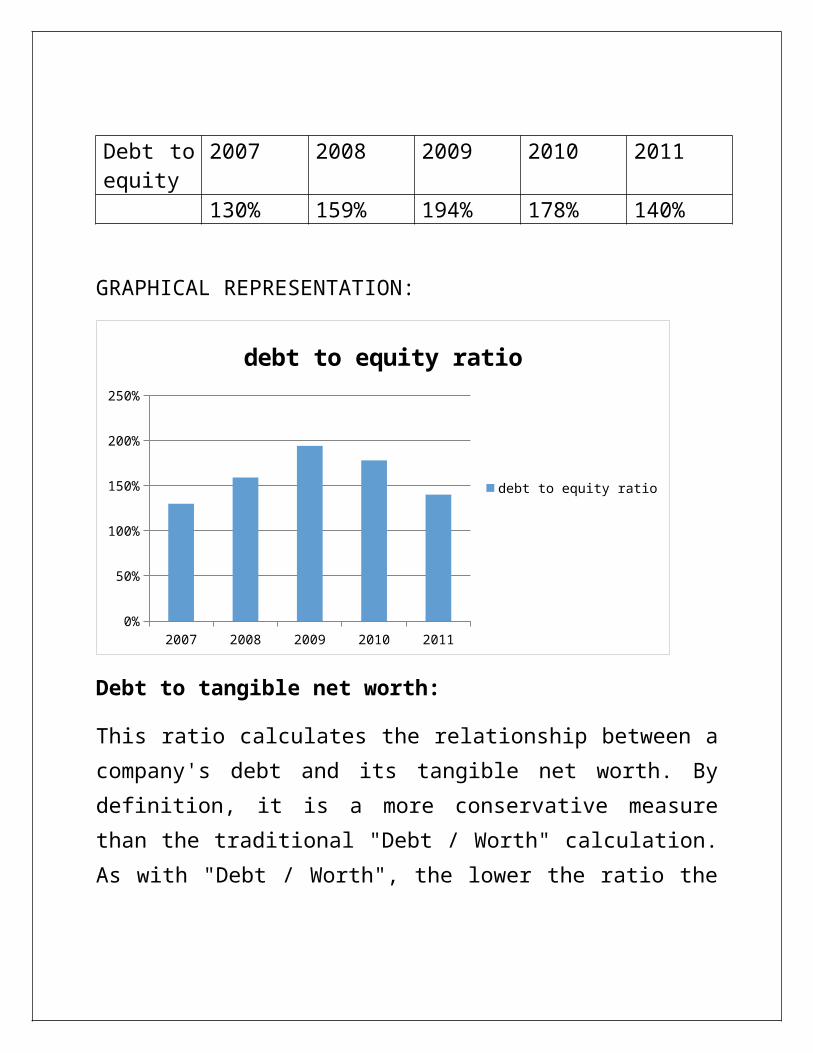
DEBT TO EQUITY:
Definition:
A measure of a company's financial leverage calculated by dividing its total iabties by stock-holders' equity. It indicates what proportion of equity and debt the company is using to finance its assets.
Formula:
Debt to equity
2007 2008 2009 2010 2011
130% 159% 194% 178% 140%
GRAPHICAL REPRESENTATION:
2007 2008 2009 2010 20110%
50%
100%
150%
200%
250%
debt to equity ratio
debt to equity ratio
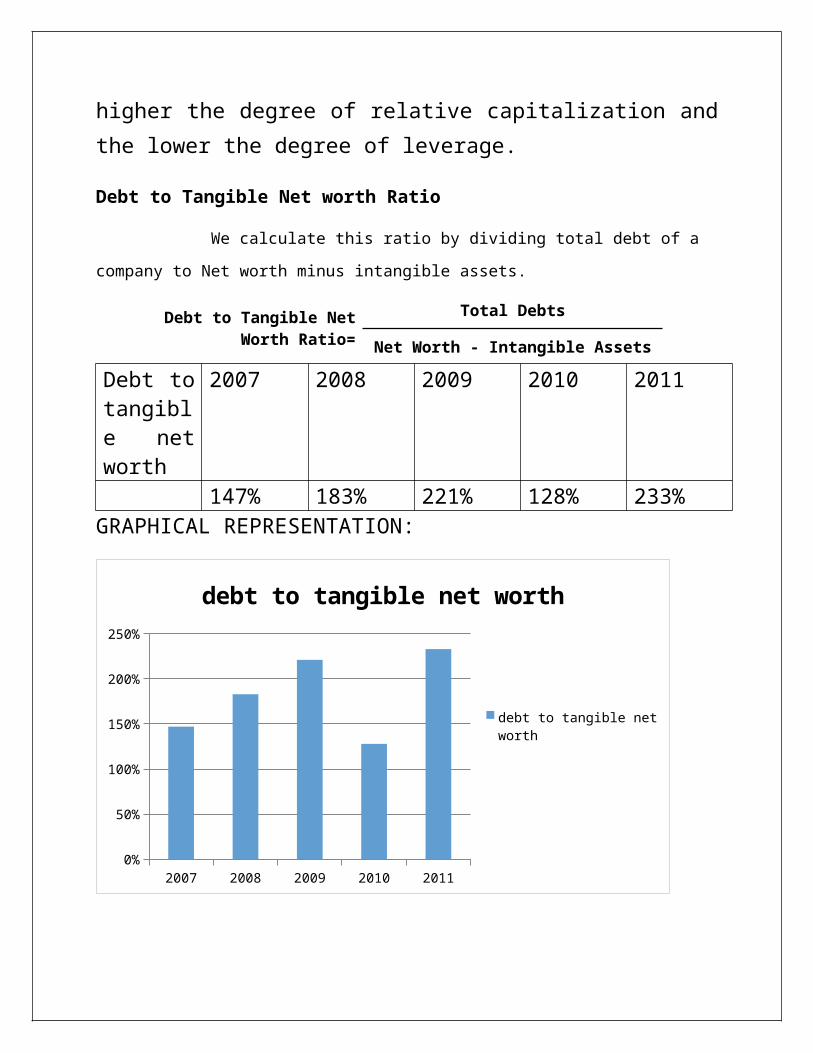
Debt to tangible net worth:
This ratio calculates the relationship between a com-pany's debt and its tangible net worth. By definition, it is a more conservative measure than the traditional "Debt / Worth" calculation. As with "Debt / Worth", the lower the
ratio the higher the degree of relative capitalization and the lower the degree of leverage.
Debt to Tangible Net worth Ratio
We calculate this ratio by dividing total debt of a company to Net worth minus intangible
assets.
Debt to Tangible Net Worth Ratio=Total Debts
Net Worth - Intangible Assets
Debt to tangible net worth
2007 2008 2009 2010 2011
147% 183% 221% 128% 233%GRAPHICAL REPRESENTATION:
2007 2008 2009 2010 20110%
50%
100%
150%
200%
250%
debt to tangible net worth
debt to tangible net worth
INTERPRETATION OF OVERALL LONG TERM DEBTPAYING ABILITY:
PROFITIBILITY ANALYSIS:
Definition of 'Profitability Ratios'
A class of financial metrics that are used to assess a busi-ness's ability to generate earnings as compared to its ex-penses and other relevant costs incurred during a specific period of time. For most of these ratios, having a higher value relative to a competitor's ratio or the same ratio from a previous period is indicative that the company is doing well.
Following are profitability ratios:
1)Net profit margin2)Total assets turnover3)Return on assets4)Operating income margin5)Operating assets turnover6)Return on operating assets7)Return on total equity
Net profit margin:
Definition:
Net profit divided by net revenues, often expressed as a percentage. This number is an indication of how effective a company is at cost control. The higher the net profit margin is, the more effective the company is at convert-ing revenue into actual profit... Also called net margin.
The formula for net profit margin is:
(Total Revenue – Total Expenses)/Total Revenue = Net Profit/Total Revenue = Net Profit margin
NET PROFIT MARGIN
2007 2008 2009 2010 2011
18.86% 21.33% 24.40%
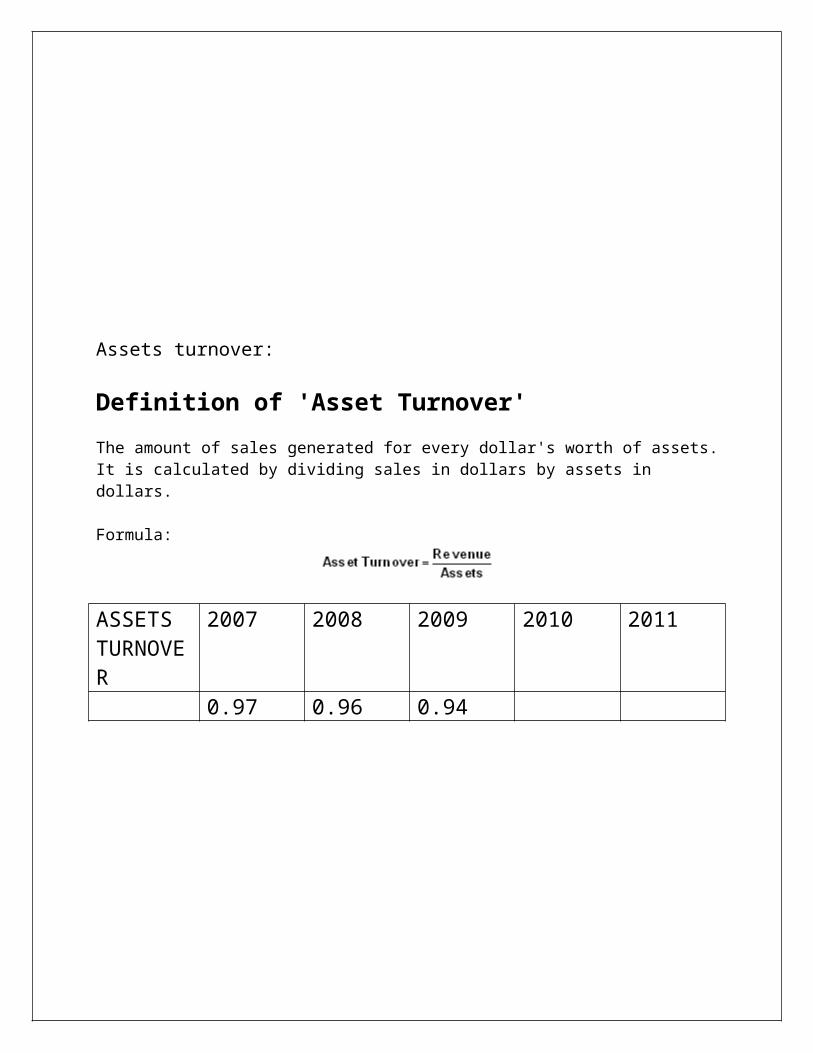
Assets turnover:
Definition of 'Asset Turnover'
The amount of sales generated for every dollar's worth of assets. It is calculated by dividing sales in dollars by assets in dollars.
Formula:
ASSETS TURNOVER
2007 2008 2009 2010 2011
0.97 0.96 0.94
RETURN ON ASSETS:
Definition of 'Return on Assets - ROA'
An indicator of how profitable a company is relative to its total assets. ROA gives an idea as to how efficient management is at using its assets to generate earnings. Calculated by dividing a company's annual earnings by its total assets, ROA is displayed as a percentage. Sometimes this is referred to as "return on investment".
The formula for return on assets is:
RETURN ON AS-SETS
2007 2008 2009 2010 2011
18.33% 20.44% 22.89%

OPERATING INCOME MARGIN:
Definition of 'Operating Margin'
A ratio used to measure a company's pricing strategy and operating efficiency.
Calculated as:
Operating margin is a measurement of what proportion of a company's revenue is left over after paying for variable costs of production such as wages, raw materials, etc. A healthy operating margin is required for a company to be able to pay for its fixed costs, such as interest on debt.
GROSS PROFIT MARGIN:
Definition of 'Gross Profit Margin'
A financial metric used to assess a firm's financial health by revealing the proportion of money left over from revenues after accounting for the cost of goods sold. Gross profit margin serves as the source for paying additional expenses and future savings.
Also known as "gross margin".
Calculated as:

RETURN ON OPERATING ASSETS:
Return on Operating Assets
Description: The return on operating assets measure only includes in the denominator those assets actively used to create revenue. This focuses management attention on the amount of assets actually required to run the busi-ness, so that it has a theoretical targeted asset level to achieve. A typical result of this measurement is an ongo-ing campaign to eliminate unnecessary assets.
FORMULA:
Operating assets turnover= Earnings before Interest and Taxes / Operating Assets x 100
RETURN ON TOTAL EQUITY:
Definition of 'Return on Equity - ROE'
The amount of net income returned as a percentage of shareholders equity. Return on eq-uity measures a corporation's profitability by revealing how much profit a company gener-ates with the money shareholders have invested.
ROE is expressed as a percentage and calculated as:
Return on Equity = Net Income/Shareholder's Equity
Net income is for the full fiscal year (before dividends paid to common stock holders but after dividends to preferred stock.) Shareholder's equity does not include preferred shares.
RETURN ON EQUITY
2007 2008 2009 2010 2011
42.11% 53.11% 67.44%


