49
Financial and Operating Results Investors and Analysts Briefing Year Ended December 31, 2014 February 23, 2015

Financial and Operating Results
Investors and Analysts Br ief ingYear Ended December 31, 2014
Feb r ua r y 2 3 , 2 0 1 5


2014 Operating Highlights2014 Operating Highlights
Rising Peak DemandExpanding Customer Base Higher Net System InputGrowing Energy Sales
Operational excellence in Distribution System & Customer Service Performance
NSI Fuel MixNSI Sources
Business Updates & Events of Interest
Ave. Customer Bill Flat Y-O-Y


Growing Energy Sales: 2014FY� Energy sales Up 3.2% vs. 2013 (+1,076 GWh)
�Net of impact of Typhoon ‘Glenda’ (in July), Total Sales is 3.8% up
� Energy sales Up 3.2% vs. 2013 (+1,076 GWh)�Net of impact of Typhoon ‘Glenda’ (in July), Total Sales is 3.8% up
30,247 30,592
32,771
34,084
35,160
2010 2011 2012 2013 2014
in GWh
3.2%����
Movers* for 2014:
4.2%
*Applies to GP customers under Industrial and Commercial segments.
INDUSTRIAL Food & BeveragesBasic Metals
Rubber & Plastics
3.9%
COMMERCIALReal Estate
Private ServicesTrade
RESIDENTIALNew customer accounts
1.3%
39.3%
30.9%
29.5%
Sales volume for Flat
Streetlights (131 GWh)
account for 0.4%
CONSOLIDATED

4.85
5.03
5.19
5.37
5.57
2010 2011 2012 2013 2014
CONSOLIDATED
Expanding Customer Base: 2014FY� Up 3.9% vs. 2013 (+207,056 new customers)
�Highest YE growth since 2004 (10 years ago)
� Up 3.9% vs. 2013 (+207,056 new customers)�Highest YE growth since 2004 (10 years ago)
in million customers
3.9%����
Segment share for 2014:
INDUSTRIAL 9,824
Customers
COMMERCIAL0.464 million Customers
RESIDENTIAL5.1 millionCustomers
1.2%
4.0% 2.4%
4,501 Flat Strt Customers
account for 0.3% of Total
8.3%
91.4%
0.2%

5,374 5,283
5,633
5,928
6,121 *
2010 2011 2012 2013 2014
PARENT
Rising Peak Demand: 2014FY� Meralco Peak Demand up 3.3% vs. 2013 (+193 MW)
Meralco Peak Demand, MW:
*occurred on May 21, 2014
3.3%����
1.7%�6.6%�
5.2%�
7,656 7,552
7,889
8,305
8,717 *
2010 2011 2012 2013 2014
Luzon Peak Demand, MW:
5.0%����
1.4%�
4.5%�
5.3%�
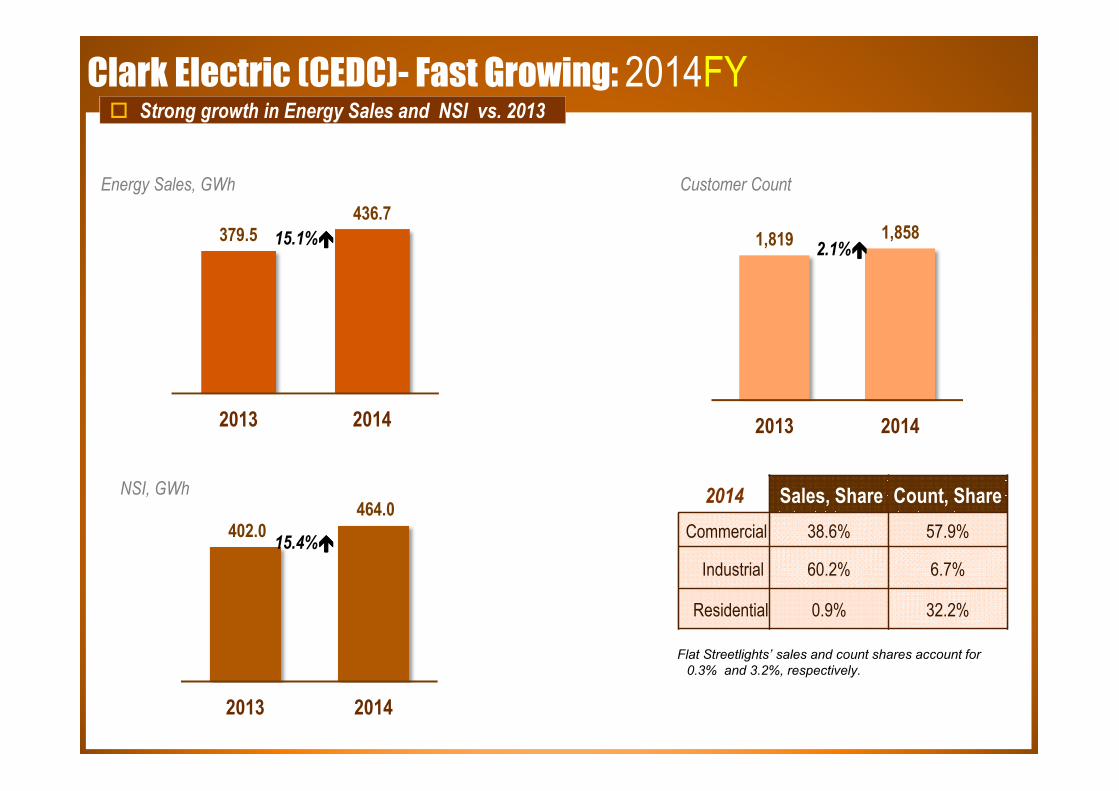
379.5436.7
2013 2014
1,819 1,858
2013 2014
15.1%����2.1%����
Energy Sales, GWh
NSI, GWh
Customer Count
402.0 464.0
2013 2014
15.4%����
Clark Electric (CEDC)- Fast Growing: 2014FY
2014 Sales, Share Count, Share
Commercial 38.6% 57.9%
Industrial 60.2% 6.7%
Residential 0.9% 32.2%
Flat Streetlights’ sales and count shares account for
0.3% and 3.2%, respectively.
� Strong growth in Energy Sales and NSI vs. 2013
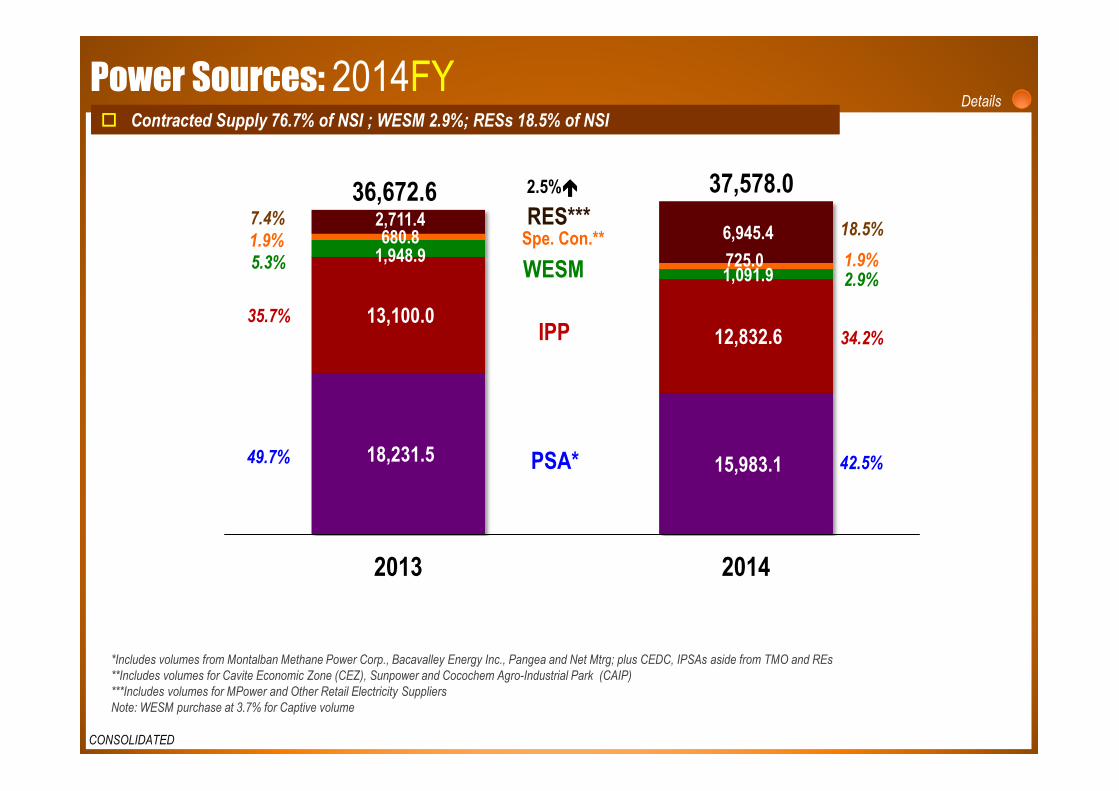
Power Sources: 2014FY
*Includes volumes from Montalban Methane Power Corp., Bacavalley Energy Inc., Pangea and Net Mtrg; plus CEDC, IPSAs aside from TMO and REs
**Includes volumes for Cavite Economic Zone (CEZ), Sunpower and Cocochem Agro-Industrial Park (CAIP)
***Includes volumes for MPower and Other Retail Electricity Suppliers
Note: WESM purchase at 3.7% for Captive volume
18,231.5 15,983.1
13,100.0 12,832.6
1,948.9 1,091.9
680.8
725.0
2,711.4 6,945.4
2013 2014
RES***
PSA*
IPP
Spe. Con.**
WESM
37,578.036,672.6 2.5%����
Details
42.5%
34.2%
2.9%1.9%
18.5%
49.7%
35.7%
5.3%
1.9%
7.4%
� Contracted Supply 76.7% of NSI ; WESM 2.9%; RESs 18.5% of NSI� Contracted Supply 76.7% of NSI ; WESM 2.9%; RESs 18.5% of NSI
CONSOLIDATED
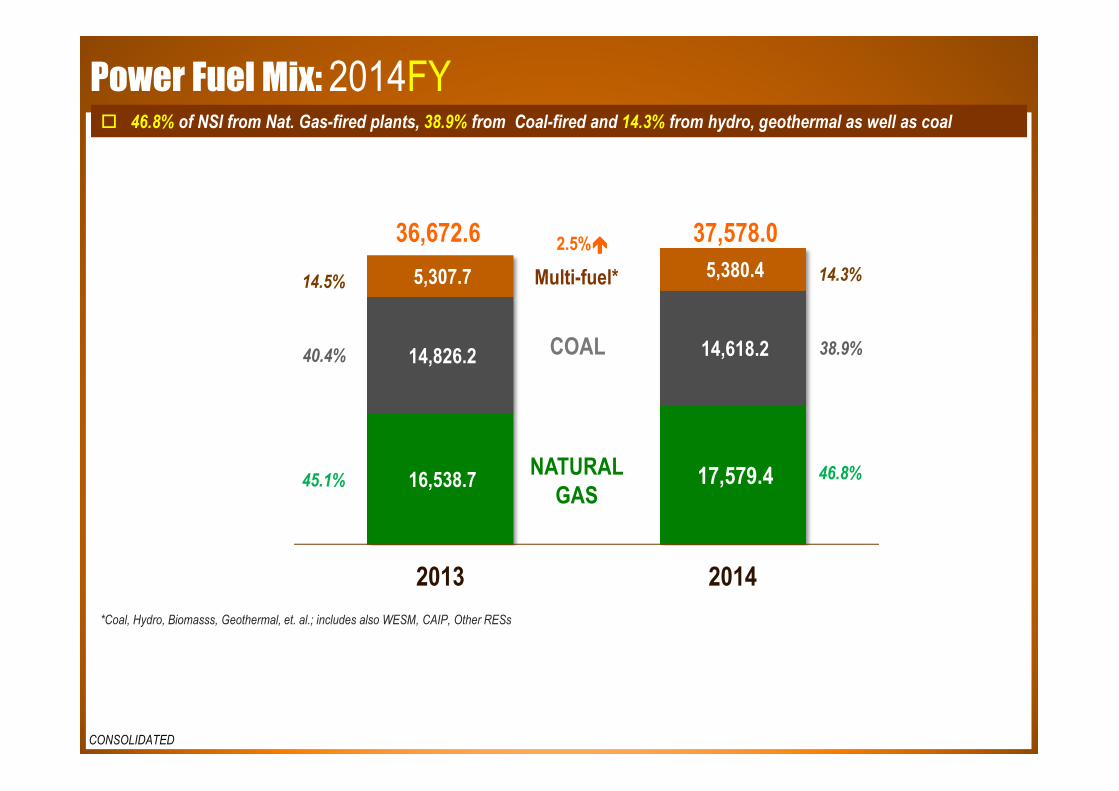
Power Fuel Mix: 2014FY
*Coal, Hydro, Biomasss, Geothermal, et. al.; includes also WESM, CAIP, Other RESs
16,538.7 17,579.4
14,826.2 14,618.2
5,307.7 5,380.4
2013 2014
NATURAL
GAS
COAL
Multi-fuel*
37,578.036,672.6 2.5%����
46.8%
38.9%
14.3%
45.1%
40.4%
14.5%
� 46.8% of NSI from Nat. Gas-fired plants, 38.9% from Coal-fired and 14.3% from hydro, geothermal as well as coal � 46.8% of NSI from Nat. Gas-fired plants, 38.9% from Coal-fired and 14.3% from hydro, geothermal as well as coal
CONSOLIDATED
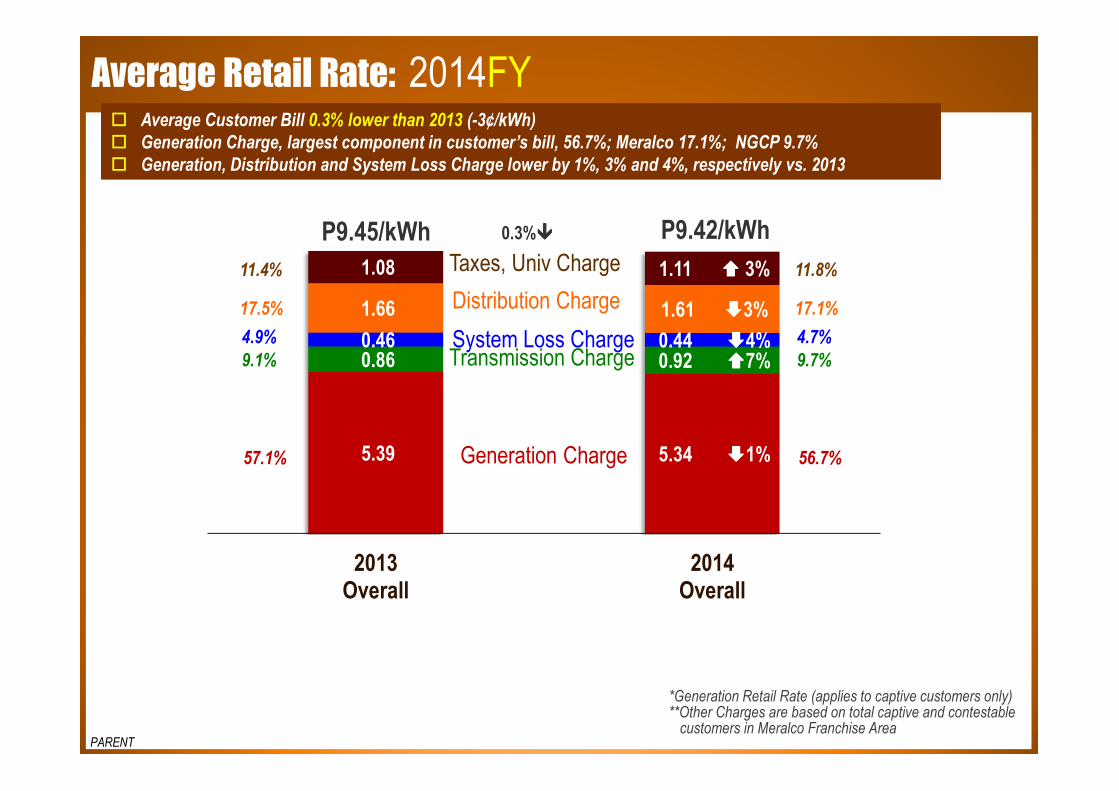
Average Retail Rate: 2014FY� Average Customer Bill 0.3% lower than 2013 (-3¢/kWh)
� Generation Charge, largest component in customer’s bill, 56.7%; Meralco 17.1%; NGCP 9.7%
� Generation, Distribution and System Loss Charge lower by 1%, 3% and 4%, respectively vs. 2013
� Average Customer Bill 0.3% lower than 2013 (-3¢/kWh)
� Generation Charge, largest component in customer’s bill, 56.7%; Meralco 17.1%; NGCP 9.7%
� Generation, Distribution and System Loss Charge lower by 1%, 3% and 4%, respectively vs. 2013
*Generation Retail Rate (applies to captive customers only)**Other Charges are based on total captive and contestable customers in Meralco Franchise Area
PARENT
5.39 5.34 ����1%
0.86 0.92 ����7%0.46 0.44 ����4%
1.66 1.61 ����3%
1.08 1.11 ���� 3%
2013Overall
2014Overall
P9.45/kWh P9.42/kWh
Generation Charge
Transmission ChargeSystem Loss Charge
Distribution Charge
Taxes, Univ Charge
56.7%
9.7%
4.7%
17.1%
11.8%
57.1%
9.1%
4.9%
17.5%
11.4%
0.3%����
Operational Excellence - System Loss Performance: 2014FY
8.5%
9.5%
PARENT
2.01%
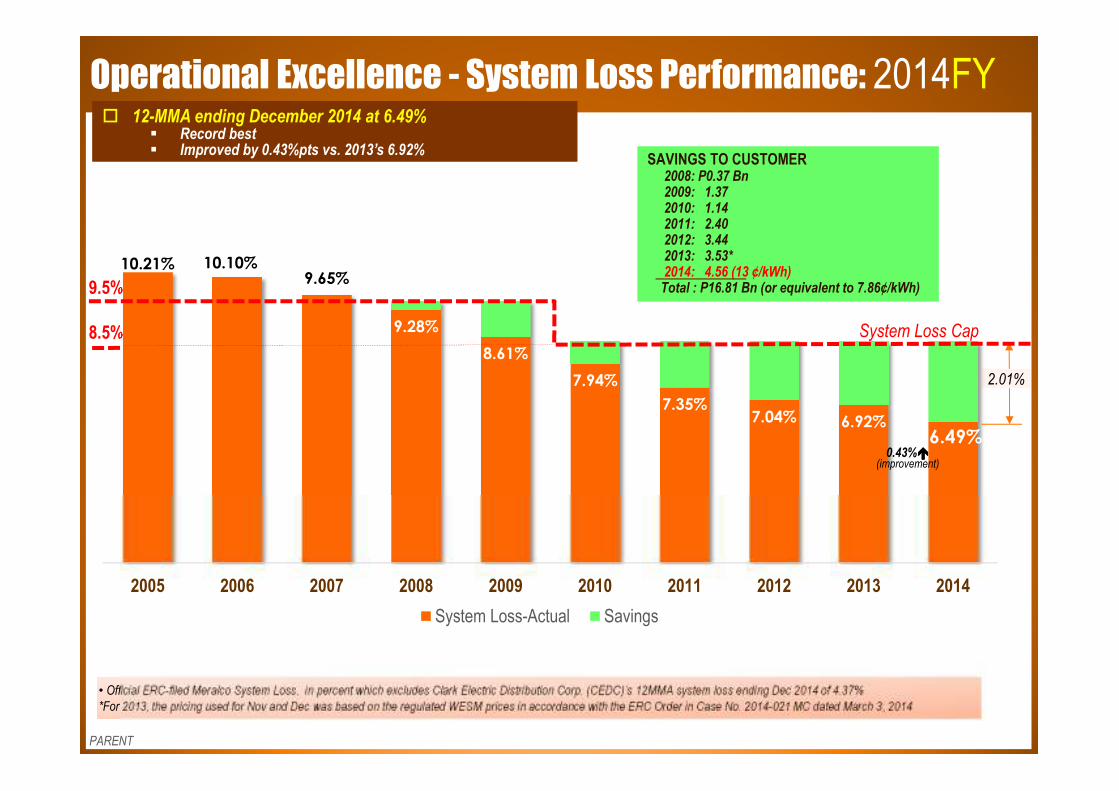
• Official ERC-filed Meralco System Loss, in percent which excludes Clark Electric Distribution Corp. (CEDC)’s 12MMA system loss ending Dec 2014 of 4.37%
*For 2013, the pricing used for Nov and Dec was based on the regulated WESM prices in accordance with the ERC Order in Case No. 2014-021 MC dated March 3, 2014
� 12-MMA ending December 2014 at 6.49%� Record best� Improved by 0.43%pts vs. 2013’s 6.92%
� 12-MMA ending December 2014 at 6.49%� Record best� Improved by 0.43%pts vs. 2013’s 6.92%
10.21% 10.10%9.65%
9.28%
8.61%
7.94%
7.35%7.04% 6.92%
6.49%
2005 2006 2007 2008 2009 2010 2011 2012 2013 2014
System Loss-Actual Savings
0.43%����(improvement)
System Loss Cap
SAVINGS TO CUSTOMER2008: P0.37 Bn2009: 1.37 2010: 1.14 2011: 2.402012: 3.442013: 3.53*2014: 4.56 (13 ¢/kWh)Total : P16.81 Bn (or equivalent to 7.86¢/kWh)
SAVINGS TO CUSTOMER2008: P0.37 Bn2009: 1.37 2010: 1.14 2011: 2.402012: 3.442013: 3.53*2014: 4.56 (13 ¢/kWh)Total : P16.81 Bn (or equivalent to 7.86¢/kWh)
Operational Excellence - S Factor Performance: 2014FY
PARENT
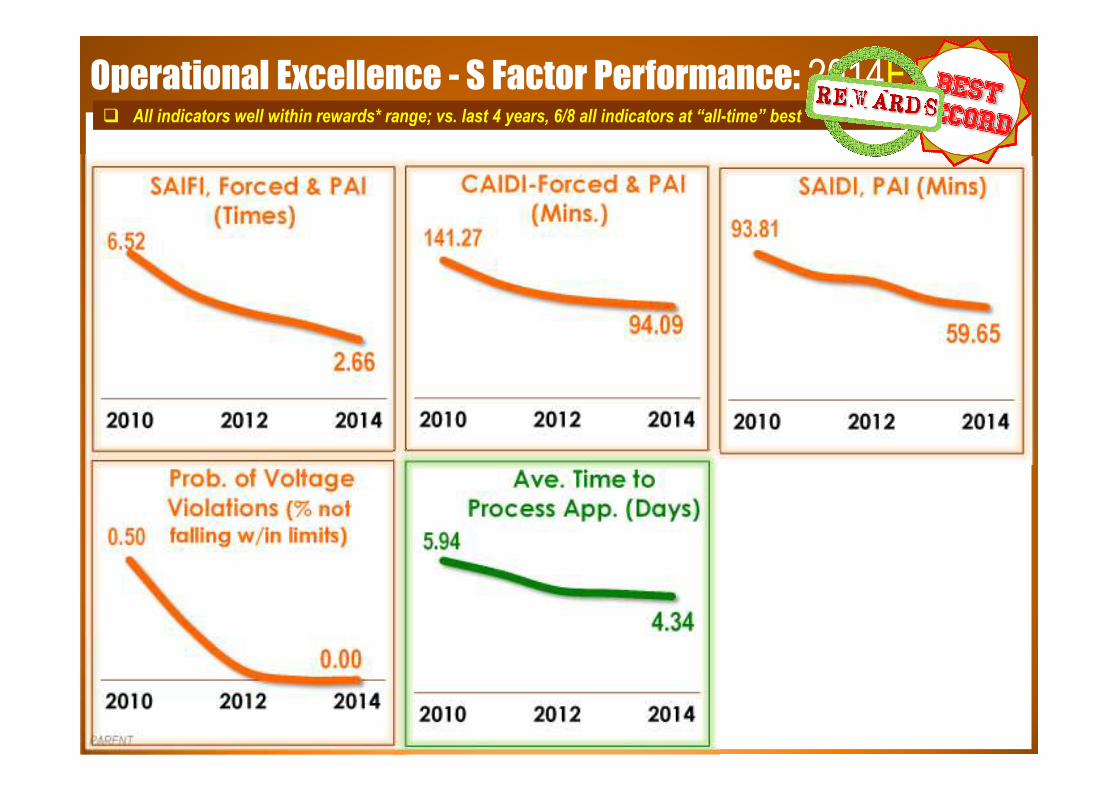
� All indicators well within rewards* range; vs. last 4 years, 6/8 all indicators at “all-time” best� All indicators well within rewards* range; vs. last 4 years, 6/8 all indicators at “all-time” best
6.52
2.66
2010 2012 2014
SAIFI, Forced & PAI
(Times) 141.27
94.09
2010 2012 2014
CAIDI-Forced & PAI
(Mins.) 93.81
59.65
2010 2012 2014
SAIDI, PAI (Mins)
0.50
0.00
2010 2012 2014
Prob. of Voltage
Violations (% not falling w/in limits) 5.94
4.34
2010 2012 2014
Ave. Time to
Process App. (Days)

Operational Excellence – S Factor Performance: 2014FY
PARENT
� All indicators well within rewards* range; vs. last 4 years, 6/8 all indicators at “all-time” best� All indicators well within rewards* range; vs. last 4 years, 6/8 all indicators at “all-time” best
3.38 2.52
2010 2012 2014
Ave. Time to
Connect (Days)
24.55
5.64
2010 2012 2014
Call Center
Performance (Secs)

Performing Under Adverse Condition:
SUMMARY OF IMPACT OF MAJOR WEATHER
DISTURBANCES TO MERALCO
Typhoon
'GLENDA'
T yphoon
'MARIO'
Storm
‘RUBY'
Inclusive Dates (including completion of restoration) July 15-20, 2014 September 19 only December 9, 2014
Circuits Affected during height of weather disturbance627
(89.44% of 701 circuits)91
(12.98% of 701 circuits)
12 (1.77% of 701 circuits)
Sustained Interruption Events 616 37 4
Momentary Interruption Events 11 54 10
Customers Affected during height of weather disturbance4,640,000
(87.5% of total number of
customers)
397,714(7.49% of total number of
customers)
2,692(87.5% of total number of
customers)
Unrealized Sales (GWh) 230 33 24
Total Damage to Facilities in PhP (Poles, wires, DTs) 399,456,850.78 934,000.00 732,848
Typhoons ‘Glenda’, ‘Mario’ & ‘Ruby’
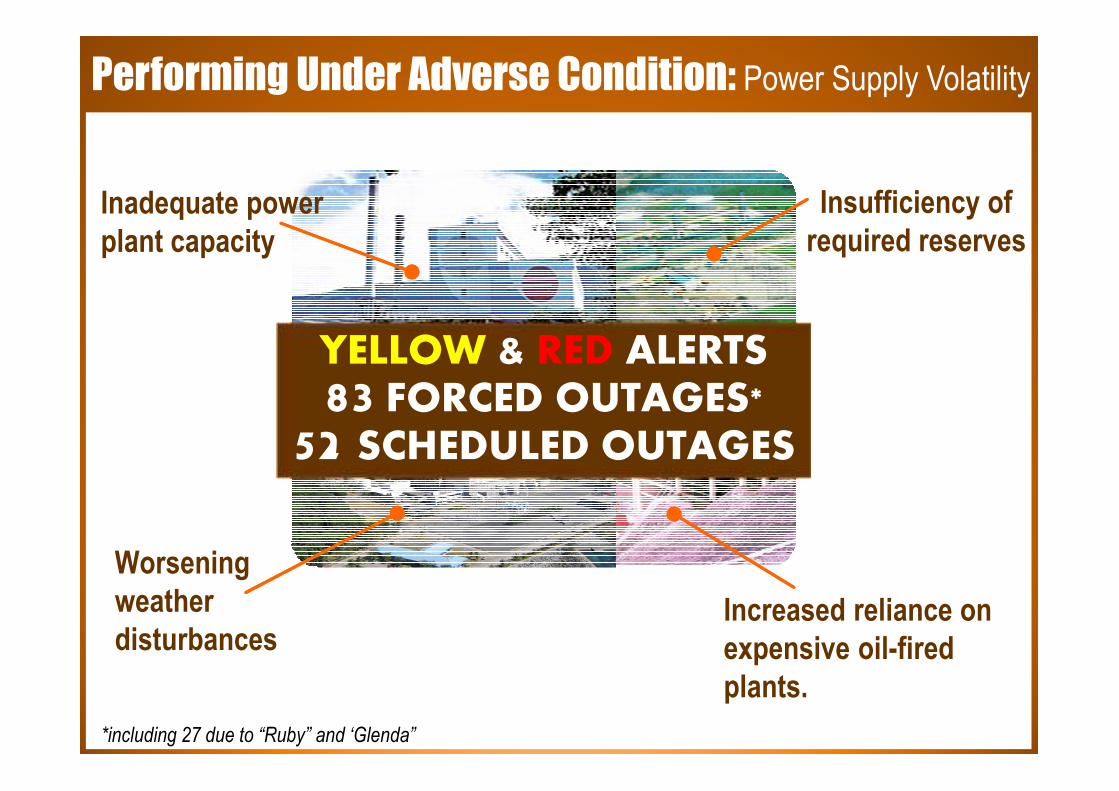
Inadequate power
plant capacity
Insufficiency of
required reserves
Worsening
weather
disturbancesIncreased reliance on
expensive oil-fired
plants.
YELLOW & RED ALERTS
83 FORCED OUTAGES*
52 SCHEDULED OUTAGES
Performing Under Adverse Condition: Power Supply Volatility
*including 27 due to “Ruby” and ‘Glenda”
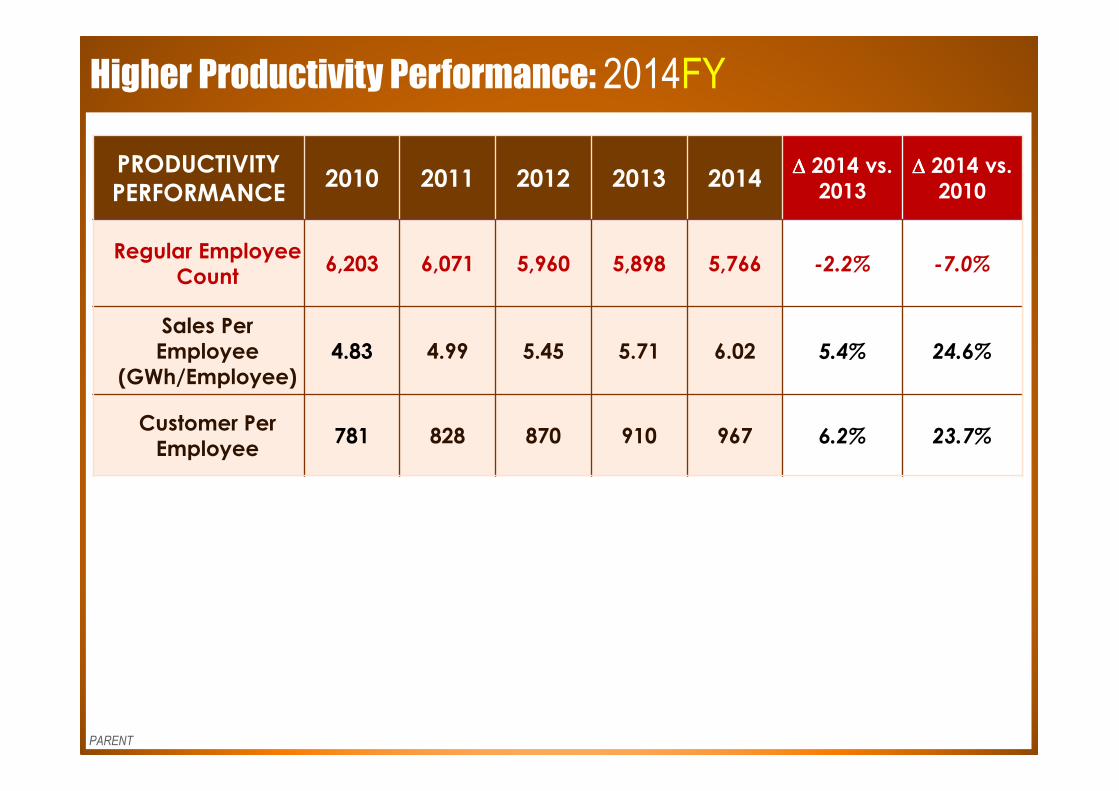
Higher Productivity Performance: 2014FY
PARENT
PRODUCTIVITY
PERFORMANCE2010 2011 2012 2013 2014
∆∆∆∆ 2014 vs.
2013
∆∆∆∆ 2014 vs.
2010
Regular Employee
Count6,203 6,071 5,960 5,898 5,766 -2.2% -7.0%
Sales Per
Employee
(GWh/Employee)
4.83 4.99 5.45 5.71 6.02 5.4% 24.6%
Customer Per
Employee781 828 870 910 967 6.2% 23.7%


Increasing Capital Expenditures: 2014 FY
9,053 8,748
10,321 10,187
12,350
2010 2011 2012 2013 2014
In PhP, Mn
21.2%����

Business Updates: 2014 4QCompleted Electric Capital Projects
Araneta-Cubao-Kamuning 115
kV Line
Caliraya-Botocan 115
kV Line Restoration
Therma Mobile, Inc. (TMO)
Connection
CPIP Substation
PAGCOR Substation(on-going until 2015)
Batangas City-Bolbok-
Simlong 69 kV Line(on-going until 2015)
Facilities relocation for
NAIA Project(on-going until 2015)
Valencia (QC) GIS Substation
Tayabas 2nd 115 kV Line in Tayabas,
Quezon
83 MVA Transformer at Tegen S/S
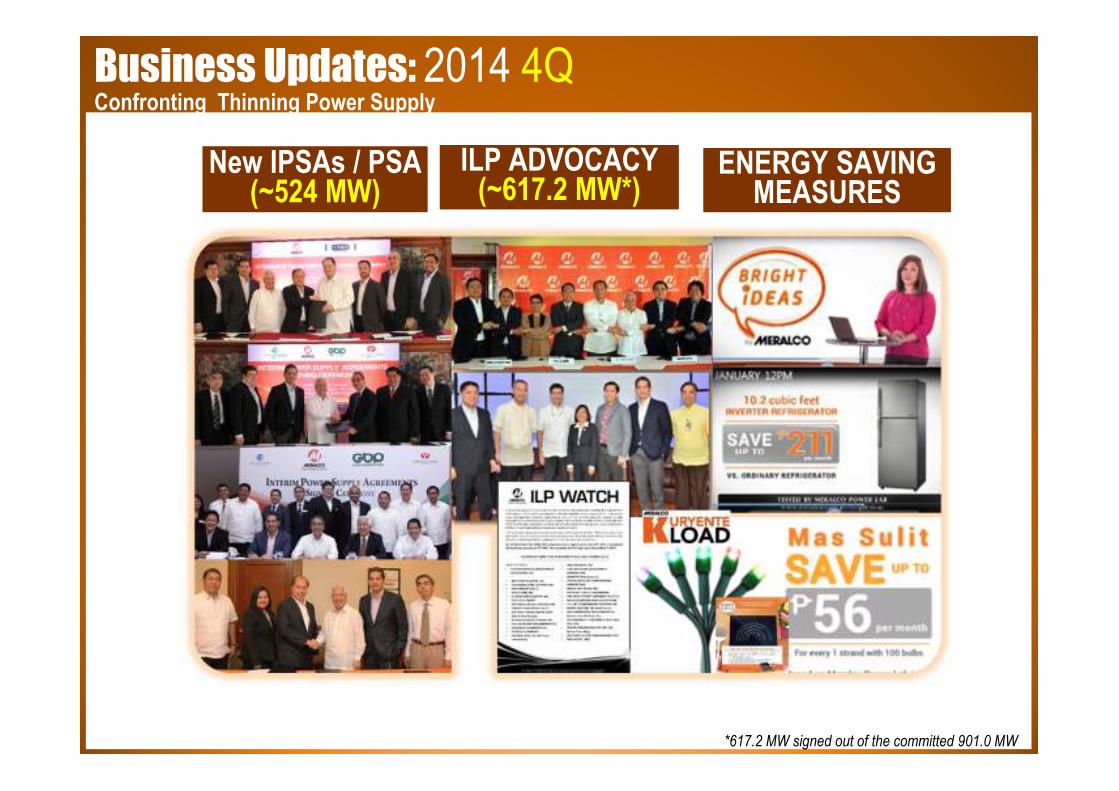
Business Updates: 2014 4QConfronting Thinning Power Supply
*736 MW signed out of the committed 882 MW
New IPSAs / PSA (~524 MW)
New IPSAs / PSA (~524 MW)
ENERGY SAVING MEASURES
ENERGY SAVING MEASURES
ILP ADVOCACY (~617.2 MW*)
ILP ADVOCACY (~617.2 MW*)
*617.2 MW signed out of the committed 901.0 MW
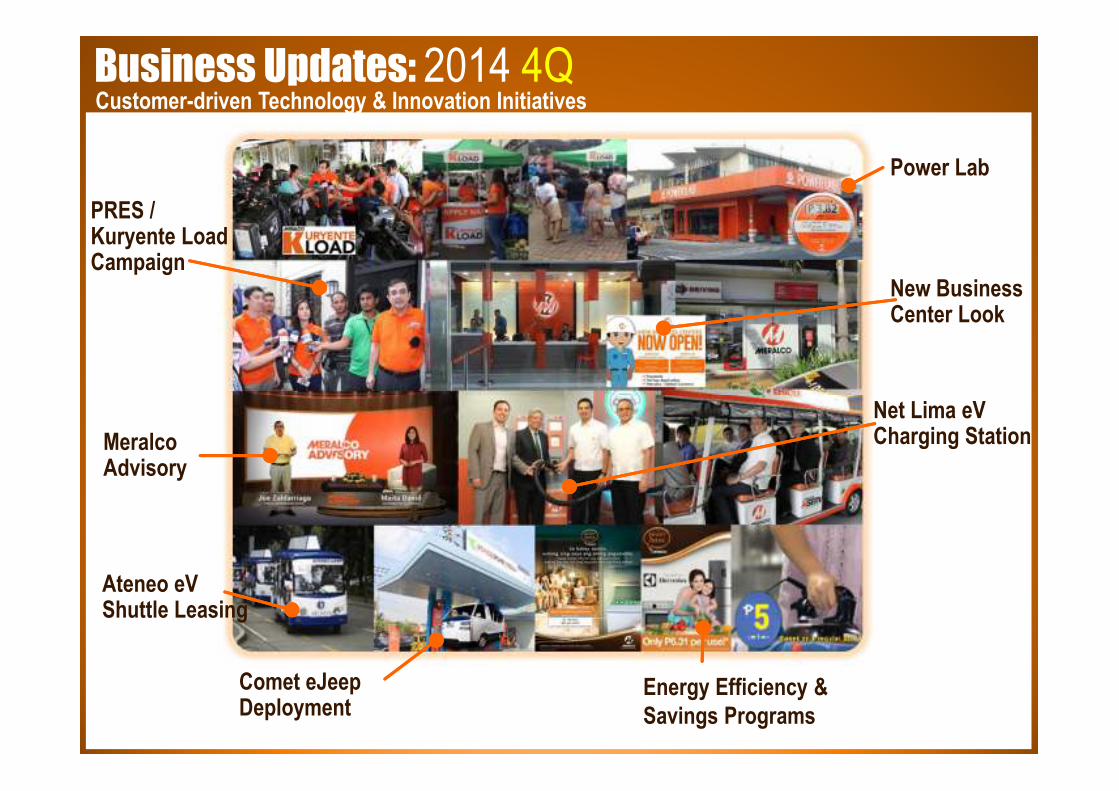
Business Updates: 2014 4Q
Ateneo eV Shuttle Leasing
Power Lab
PRES / Kuryente LoadCampaign
MeralcoAdvisory
Energy Efficiency &
Savings Programs
Comet eJeepDeployment
Net Lima eV Charging Station
Customer-driven Technology & Innovation Initiatives
New Business Center Look

Business Updates: 2014 4QMaking a Difference in Society and Communities
MERALCO AWARDED FOR CORPORATE SOCIALLY RESPONSIBILITY IN ASIA
•During the inaugural Asia Corporate Excellence and Sustainability (ACES) Awards 2014 in Singapore.
OMF President Jeffrey O. Tarayao receives
award on behalf of Meralco from jury
members Dr. Jayanthi Desan, Managing Dir.
of Synergio Consulting SDN BHD and Andrew
Bryant, Author of Self Leadership
12 public elementary and high schools in the
municipalities of Rodriguez and Tanay, Rizal now enjoy
the benefits of electricity after the installation of solar
photo-voltaic (PV) systems in their schools.
Assistance beyond
Meralco’s borders


Regulatory Updates - Outline
• WESM Primary Offer Cap and Secondary Price Cap
• FIT Updates
• Updates on Emergency Powers

Primary offer cap was reduced to P32/kWh from P62/kWh
Jun 9, 2006 – ERC, DOE and PEMC issued Joint Res 2, S. 2006, setting the primary
offer price cap to P62,000/MWh for 90 days
Dec 27, 2013 – ERC, DOE and PEMC issued Joint Res 2, S. 2013, setting the primary
offer price cap to P32,000/MWh for 90 days
Mar 26, 2014 – Extended primary offer cap for 60 days (Joint Res 1, S. 2014)
Jun 16, 2014– WESM Tripartite Committee conducted a public consultation
Oct 24, 2014 – Extended primary offer cap for 120 days (Joint Res 4, S. 2014) (until
Feb 21, 2015)
“The WESM Tripartite Committee further recognizes that
the appropriate level of the WESM Offer Cap should
complement and be consistent with the permanent
preemptive measure in the WESM to be issued by ERC.”

WESM prices capped at P6.245/kWh upon breach of threshold
May 5, 2014 – Interim mitigating measure: P6,245/MWh secondary
price cap (ERC Res 8, S. 2014)
Jun 16, 2014 – Extended secondary cap for 45 days (ERC Res 13, S.
2014)
Jul 23, 2014 – ERC conducted a public consultation
Aug 5, 2014 – Extended secondary cap for 120 days (ERC Res 14, S.
2014)
Sep 29, 2014 – ERC conducted a public consultation
Dec 15, 2014 – Permanent preemptive mitigating measure (ERC
Res 20, S. 2014)
Dec 24, 2014 – ERC published the Resolution in the Daily Tribune
Jan 9, 2015 – Effectivity of the new secondary cap

ERC sets final secondary price cap in the WESM
Source: ERC Discussion Paper on Preemptive Measure in WESM
Final
Jan 2015-
onwards
Interim
May-Dec 2014
Rolling Ave Threshold
P9,000/MWh P8,187/MWh
Rolling Period
7 days (168 hours) 3 days (72 hours)
Secondary Price Cap
P6,245/MWh P6,245/MWH
Period
No. of
Hours in
a Day
Average
LWAP
(P/MWh)
Price Threshold
(P/MWh)
Average
LWAP
(P/MWh)
Price
Threshold
(P/MWh)
1st Off-Peak 8 2,756.00 22,048.00 2,675.01 21,400.08
Peak 10 8,166.00 81,660.00 7,895.76 78,957.60
Price Spike 3 32,000.00 96,000.00 27,000.00 81,000.00
2nd Off-Peak 3 5,432.00 16,296.00 5,042.63 15,127.89
Total 24 216,004.00 196,485.57
Price threshold
within rolling period1,512,028.00 589,456.71
Rolling Period
(Hours)168 72
Rolling Period (Days) 7 3
Cumulative Price
Threshold (P/MWh)9,000 8,187
Final Preemptive Measure
(ERC Res 20, S. 2014)
Interim Mitigating Measure
(ERC Res 14, S. 2014)
a. Rolling Average Threshold:
Php9,000/MWh, based on historical
summer prices from April, May and June
2010-2014 and allowance for 3 intervals
in a day with price at Php32,000/MWh.
b. Price Cap: Php6,245/MWh, based on
LWAP in the WESM from January to
September 2013.
c. Lifting of Price Cap: Evaluation of rolling
average shall be by the hour once price
cap is imposed.

Feed-in-Tariff (FIT) Implementation
• 1st Batch of Installation Targets set by the DOE
*FIT Rates approved by the ERC in July 2012
** Installation Targets set by the DOE in June 2011
• The DOE has, so far, endorsed 14 RE projects for FIT, with an aggregate capacity of 304MW.
RE Technology FIT Rates*
(Php/kWh)
Installation
Targets** (MW)
ROR- Hydro 5.90 250
Biomass 6.63 250
Wind 8.53 200
Solar 9.68 50
OTEC Deferred -
Total 750MW
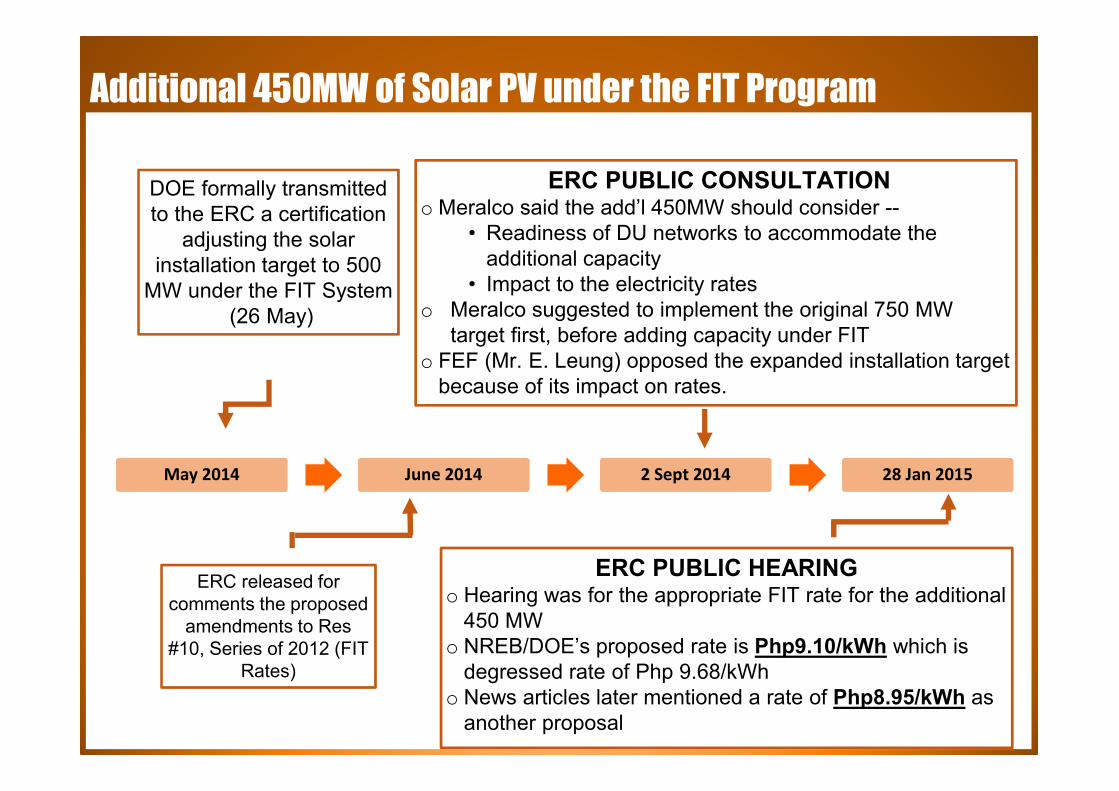
Additional 450MW of Solar PV under the FIT Program
May 2014 June 2014 2 Sept 2014 28 Jan 2015
DOE formally transmitted
to the ERC a certification
adjusting the solar
installation target to 500
MW under the FIT System
(26 May)
ERC released for
comments the proposed
amendments to Res
#10, Series of 2012 (FIT
Rates)
ERC PUBLIC CONSULTATION o Meralco said the add’l 450MW should consider --
• Readiness of DU networks to accommodate the
additional capacity
• Impact to the electricity rates
o Meralco suggested to implement the original 750 MW
target first, before adding capacity under FIT
o FEF (Mr. E. Leung) opposed the expanded installation target
because of its impact on rates.
ERC PUBLIC HEARINGo Hearing was for the appropriate FIT rate for the additional
450 MW
o NREB/DOE’s proposed rate is Php9.10/kWh which is
degressed rate of Php 9.68/kWh
o News articles later mentioned a rate of Php8.95/kWh as
another proposal
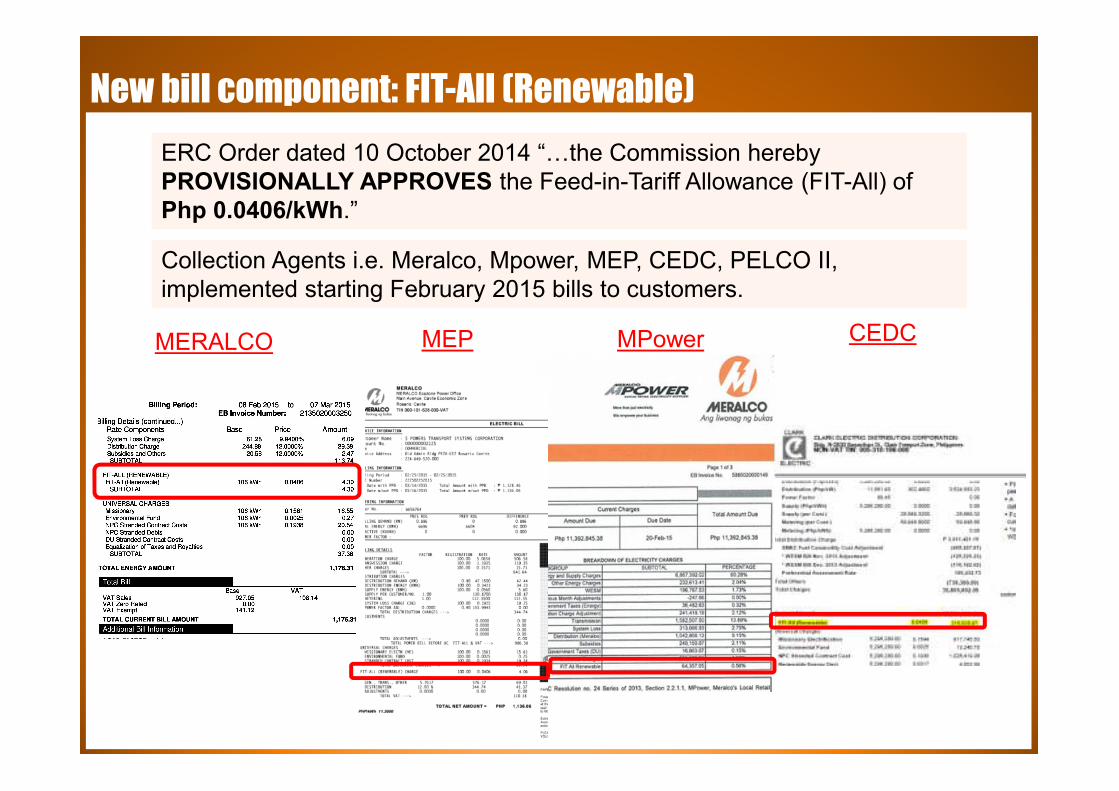
New bill component: FIT-All (Renewable)
ERC Order dated 10 October 2014 “Cthe Commission hereby
PROVISIONALLY APPROVES the Feed-in-Tariff Allowance (FIT-All) of
Php 0.0406/kWh.”
Collection Agents i.e. Meralco, Mpower, MEP, CEDC, PELCO II,
implemented starting February 2015 bills to customers.
MERALCO MEP MPower CEDC

Meralco’s Info Campaign to Customers and Employees
Bill Advisory
Appeared on all
February bills to
customers
Spark February 2015 Issue
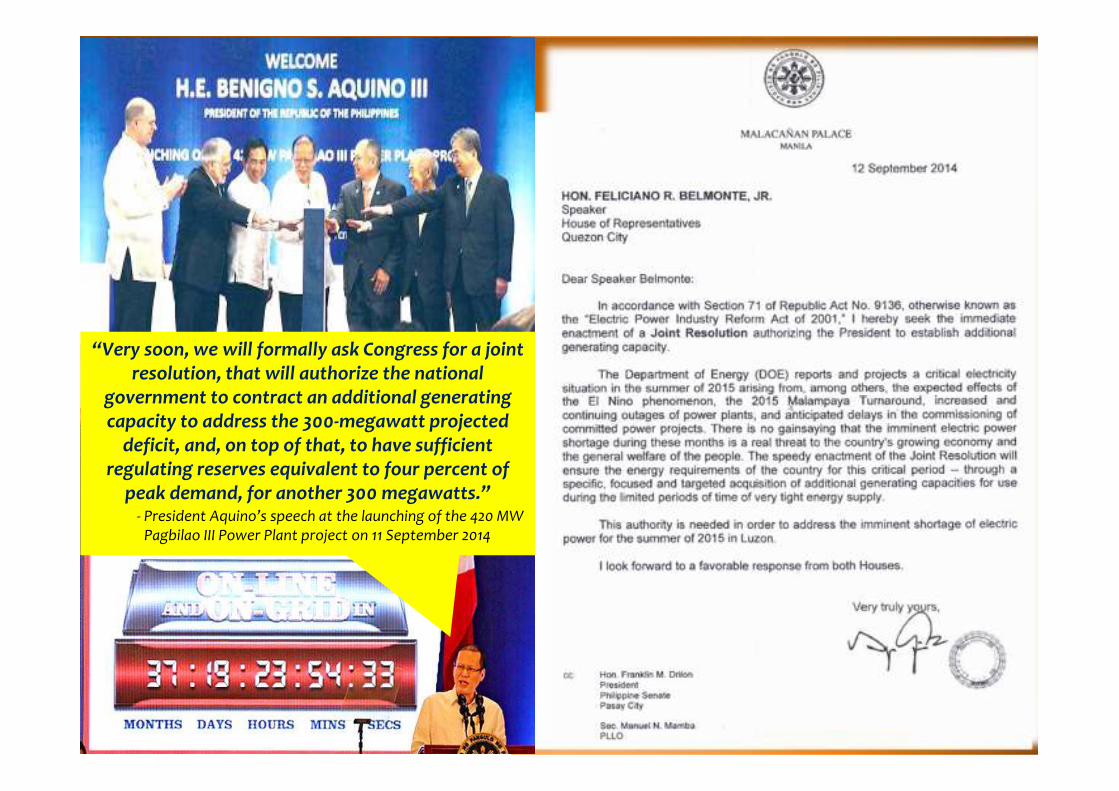
“Very soon, we will formally ask Congress for a joint
resolution, that will authorize the national
government to contract an additional generating
capacity to address the 300-megawatt projected
deficit, and, on top of that, to have sufficient
regulating reserves equivalent to four percent of
peak demand, for another 300 megawatts.”- President Aquino’s speech at the launching of the 420 MW
Pagbilao III Power Plant project on 11 September 2014

Updates on Emergency Powers
� Sep 25, 2014 : House Resolution No. 1533 “Directing The
Committee On Energy To Conduct An Inquiry, In Aid
Of Legislation, To Determine Government Options
To Alleviate Power Shortage In 2015” was filed by
Speaker Belmonte and Majority Floor Leader Neptali
Gonzales Jr.
� The leadership of the House is targeting the First Quarter of 2015 to
enact Joint Resolution into a law.
� Dec 02, 2014 : Sponsorship Speech of Cong. Reynaldo Umali
� Nov 18, 2014 : The House Committee on Energy approved
House Joint Resolution 21
: 19 voted in favor, 1 not in favor and 1 abstained
� Nov 27, 2014 : Letter certifying as urgent HJR 21 signed by Exec.
Sec. Paquito Ochoa transmitted to the office of
Speaker Belmonte Jr. on Dec. 1
� Nov 26, 2014 : Committee Report recommending approval of HJR 21
� Dec 10, 2014 : The House successively approved on Second and
Third Reading House Joint Resolution No. 21
Updates on Emergency Powers
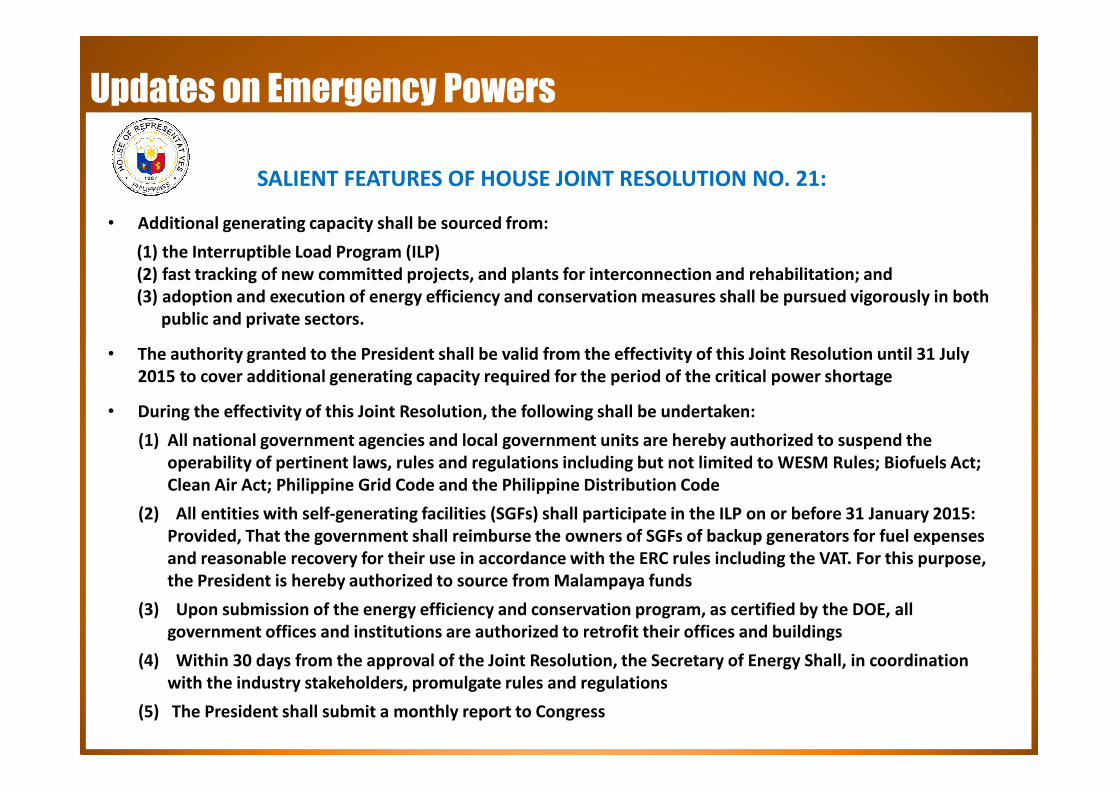
SALIENT FEATURES OF HOUSE JOINT RESOLUTION NO. 21:
• Additional generating capacity shall be sourced from:
(1) the Interruptible Load Program (ILP)
(2) fast tracking of new committed projects, and plants for interconnection and rehabilitation; and
(3) adoption and execution of energy efficiency and conservation measures shall be pursued vigorously in both
public and private sectors.
• The authority granted to the President shall be valid from the effectivity of this Joint Resolution until 31 July
2015 to cover additional generating capacity required for the period of the critical power shortage
• During the effectivity of this Joint Resolution, the following shall be undertaken:
(1) All national government agencies and local government units are hereby authorized to suspend the
operability of pertinent laws, rules and regulations including but not limited to WESM Rules; Biofuels Act;
Clean Air Act; Philippine Grid Code and the Philippine Distribution Code
(2) All entities with self-generating facilities (SGFs) shall participate in the ILP on or before 31 January 2015:
Provided, That the government shall reimburse the owners of SGFs of backup generators for fuel expenses
and reasonable recovery for their use in accordance with the ERC rules including the VAT. For this purpose,
the President is hereby authorized to source from Malampaya funds
(3) Upon submission of the energy efficiency and conservation program, as certified by the DOE, all
government offices and institutions are authorized to retrofit their offices and buildings
(4) Within 30 days from the approval of the Joint Resolution, the Secretary of Energy Shall, in coordination
with the industry stakeholders, promulgate rules and regulations
(5) The President shall submit a monthly report to Congress
Updates on Emergency Powers
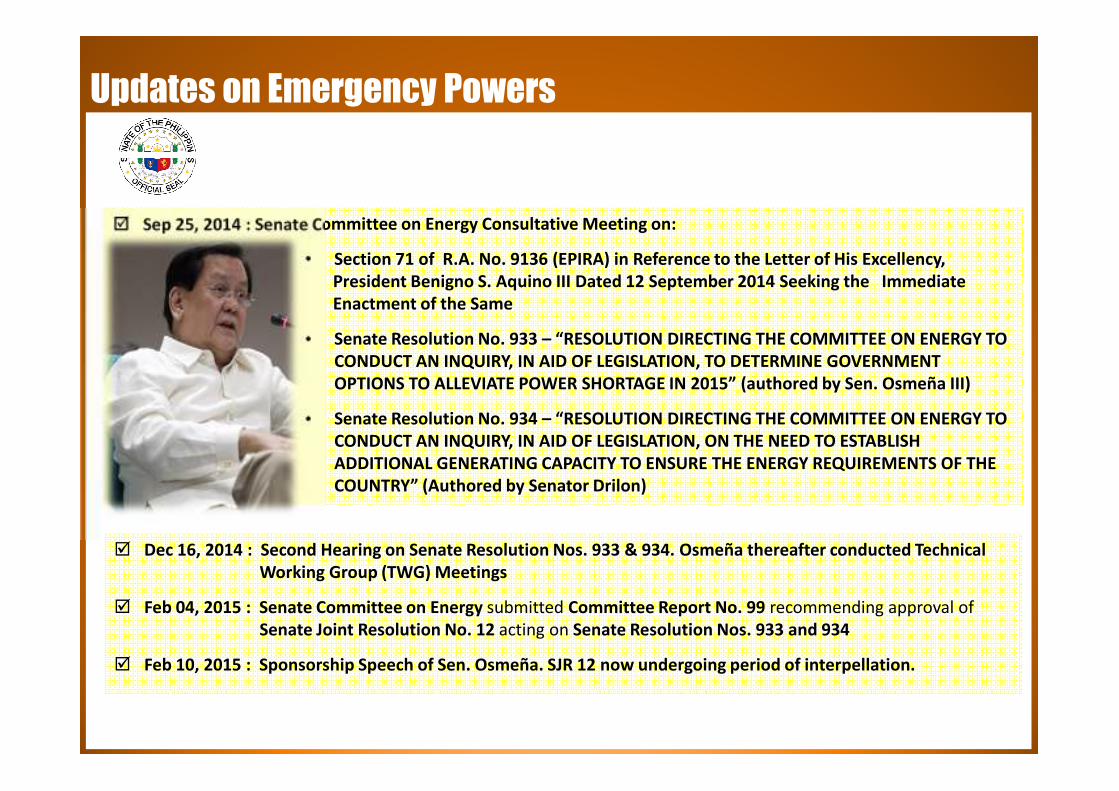
� Sep 25, 2014 : Senate Committee on Energy Consultative Meeting on:
• Section 71 of R.A. No. 9136 (EPIRA) in Reference to the Letter of His Excellency,
President Benigno S. Aquino III Dated 12 September 2014 Seeking the Immediate
Enactment of the Same
• Senate Resolution No. 933 – “RESOLUTION DIRECTING THE COMMITTEE ON ENERGY TO
CONDUCT AN INQUIRY, IN AID OF LEGISLATION, TO DETERMINE GOVERNMENT
OPTIONS TO ALLEVIATE POWER SHORTAGE IN 2015” (authored by Sen. Osmeña III)
• Senate Resolution No. 934 – “RESOLUTION DIRECTING THE COMMITTEE ON ENERGY TO
CONDUCT AN INQUIRY, IN AID OF LEGISLATION, ON THE NEED TO ESTABLISH
ADDITIONAL GENERATING CAPACITY TO ENSURE THE ENERGY REQUIREMENTS OF THE
COUNTRY” (Authored by Senator Drilon)
� Dec 16, 2014 : Second Hearing on Senate Resolution Nos. 933 & 934. Osmeña thereafter conducted Technical
Working Group (TWG) Meetings
� Feb 04, 2015 : Senate Committee on Energy submitted Committee Report No. 99 recommending approval of
Senate Joint Resolution No. 12 acting on Senate Resolution Nos. 933 and 934
� Feb 10, 2015 : Sponsorship Speech of Sen. Osmeña. SJR 12 now undergoing period of interpellation.

Updates on Emergency Powers
SALIENT FEATURES OF SENATE JOINT RESOLUTION NO. 12:
• DOE, in coordination with other government agencies, to suspend application of necessary certifications,
permits, licenses, consents, and other authorizations to ensure existing committed projects and plants for
connection, interconnection or transmission and rehabilitation will be able to provide additional capacity from
March to July 31, 2015
• DOE to instruct the system operator not utilize existing hydroelectric plants as Must Run Units and encourage
these plants to conserve water during off-peak hours from March 1, 2015 to July 31, 2015;
• ERC to allow the activation of the ILP whenever the net operating reserve of the Luzon grid is less than 350 MW
(“Orange Alert”)
• ERC to issue the requisite regulation which shall suspend or amend, for the period covered by the Joint
Resolution, the N-1 Criterion under the Grid and Distribution Codes
Designate the “Malampaya Fund” as funding source of extraordinary expenses:
� to entities (i.e. Texas Instruments, Phoenix Semicon & Hanjin) enjoying discounted rates under pertinent EOs for
the incremental increase in rates arising from recovery of the De-Loading Compensation;
� to customers which are allowed an option to recover their De-Loading Compensation from the Government as
may be provided in the ILP Rules;
� by PSALM for increasing the pumping operation hours of CBK to optimize its generating capacity, differential cost
of diesel and natural gas fuel for ILIJAN and dispatch of MALAYA;
� by PSALM in supplying fuel to and expanding the fuel storage facilities of MALAYA;
� by NPC for disturbance and/or displacement compensation to affected households and resort owners within the
Caliraya Lake
� by entities in increasing the storage facilities of diesel for use by natural gas plants as certified by the DOE

Amendment to Biofuels Act of 2006
� On 9 Feb 2014, the Senate Committee on Energy,
conducted a hearing on Senate Bill No. 2622 entitled: An
Act Amending Republic Act No. 9367, Otherwise Known
as the "Biofuels Act of 2006" (by Senator Osmeña)
� Chairperson Osmeña introduced SB 2622 which seeks to
exempt the Ilijan plant and other similarly situated
generation plants (i.e. First Gas Plants) from compliance
with the minimum biodiesel blend to augment the power
supply during periods of natural gas supply shortages
� The proposed amendment is on Section 5 of the Biofuels Act. There will be a proposed insertion
that would read as follows: "PROVIDED THAT NATURAL GAS POWER GENERATION PLANTS MAY USE
NEAT DIESEL AS THEIR ALTERNATIVE FUEL DURING SHORTAGES OF NATURAL GAS SUPPLIES:
PROVIDED, HOWEVER, THAT THE DOE SHALL ENSURE THAT THE AUTHORITY GRANTED HEREIN
SHALL ONLY BE AVAILED OF, DIRECTLY OR INDIRECTLY BY NATURAL GAS POWER PLANTS.”
� On 17 Feb 2015, the Committee on Energy submitted Committee Report No. 120 recommending
approval of Senate Bill No. 2622.

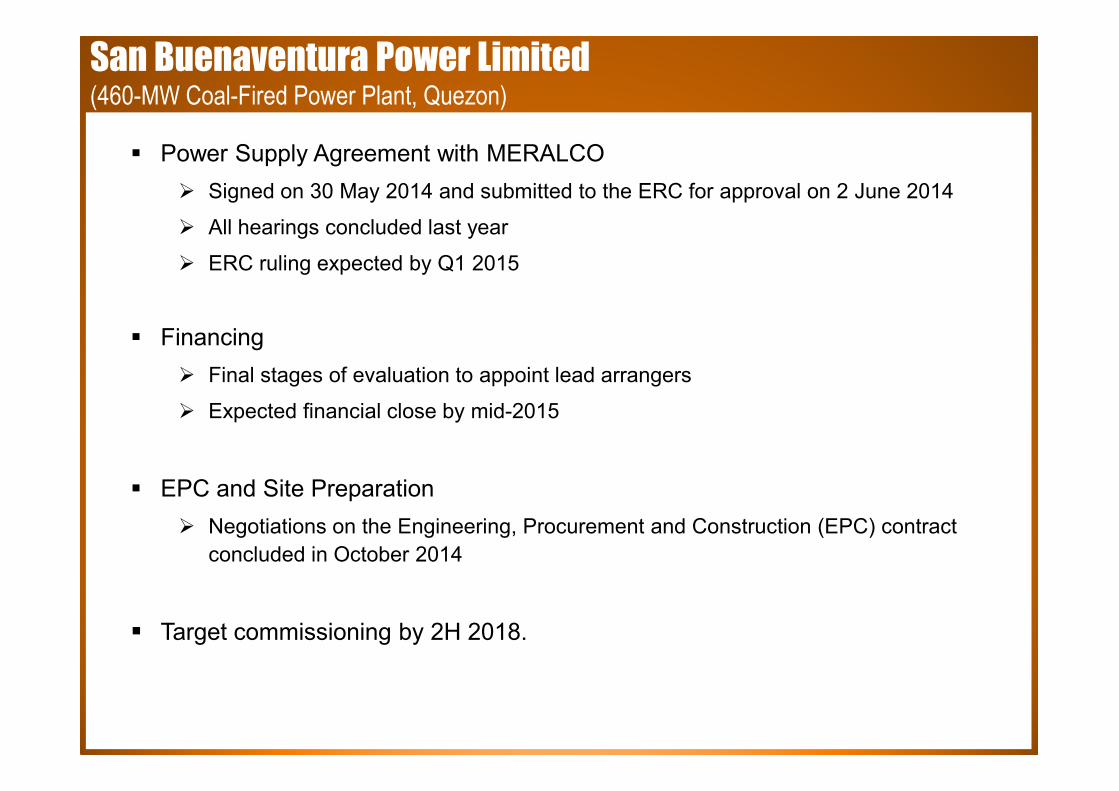
� Power Supply Agreement with MERALCO
� Signed on 30 May 2014 and submitted to the ERC for approval on 2 June 2014
� All hearings concluded last year
� ERC ruling expected by Q1 2015
� Financing
� Final stages of evaluation to appoint lead arrangers
� Expected financial close by mid-2015
� EPC and Site Preparation
� Negotiations on the Engineering, Procurement and Construction (EPC) contract
concluded in October 2014
� Target commissioning by 2H 2018.
San Buenaventura Power Limited (460-MW Coal-Fired Power Plant, Quezon)
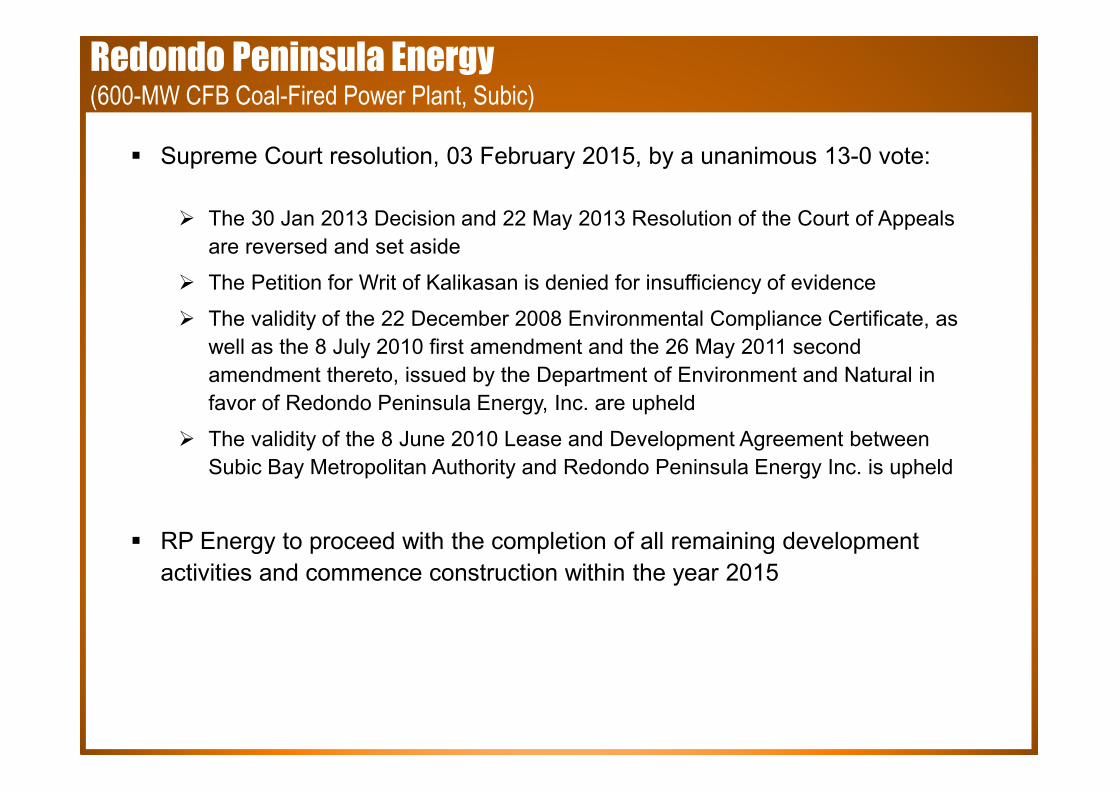
� Supreme Court resolution, 03 February 2015, by a unanimous 13-0 vote:
� The 30 Jan 2013 Decision and 22 May 2013 Resolution of the Court of Appeals
are reversed and set aside
� The Petition for Writ of Kalikasan is denied for insufficiency of evidence
� The validity of the 22 December 2008 Environmental Compliance Certificate, as
well as the 8 July 2010 first amendment and the 26 May 2011 second
amendment thereto, issued by the Department of Environment and Natural in
favor of Redondo Peninsula Energy, Inc. are upheld
� The validity of the 8 June 2010 Lease and Development Agreement between
Subic Bay Metropolitan Authority and Redondo Peninsula Energy Inc. is upheld
� RP Energy to proceed with the completion of all remaining development
activities and commence construction within the year 2015
Redondo Peninsula Energy (600-MW CFB Coal-Fired Power Plant, Subic)
Atimonan One Energy(2 x 600-MW PC Coal-Fired Power Plant, Quezon)
� Development activities for the 2 x 600-MW supercritical pulverized coal-fired
power plant in Atimonan, Quezon gained headway in 2014.
� An experienced international engineering firm has been engaged as Owner’s
Engineer. Engineering, Procurement and Construction (EPC) prequalification
process has commenced.
� Process of applying for an Environmental Compliance Certificate (ECC) has
commenced.

Global Business Power Corporation (GBPC)
� MGen acquired a 20% equity interest in GBPC in Oct 2013.
� GBPC operates a total of 627-MW (gross capacity) composed of coal and diesel-
fired power plants. In addition, it has 232 MW (gross) of coal-fired power plants
under construction in the Visayas.
� In June 2014, MGen raised its stake in GBPC from 20% to 22%.
� GBPC’s Toledo Power Corporation completed construction of its 1 x 82-MW
CFB coal-fired power plant expansion. Achieved commercial operation in
Dec 2014.
� GBPC’s Panay Energy Development Corporation is constructing a 150-MW
coal-fired power plant at the site of its two (2) operating coal power plants.
Commercial operations date is expected in 3Q 2016.


17,023 18,128 17,211 18,053
6%7%
6%7%
0%
2%
4%
6%
8%
10%
12%
14%
16%
18%
-
4,000
8,000
12,000
16,000
20,000
24,000
28,000
32,000
2013 2014 2013 2014
Revenues, EBITDA and Net Income
CONSOLIDATED REVENUES (in P mn)
& ENERGY SALES (in GWh)EBITDA (in P mn) AND MARGINS
NET INCOME (in P mn) AND MARGINS
CORE REPORTED
CORE REPORTED
30,845 33,172
30,682 32,979
10%
12%
10%
12%
0%
2%
4%
6%
8%
10%
12%
14%
16%
18%
0
4,000
8,000
12,000
16,000
20,000
24,000
28,000
32,000
2013 2014 2013 2014
298,636
266,336
34,084
35,160
33,000
34,000
35,000
36,000
-
50,000
100,000
150,000
200,000
250,000
300,000
2013 2014
Non-electricity Revenues Electricity Revenues Energy Sales
10,187
12,350
2013 2014
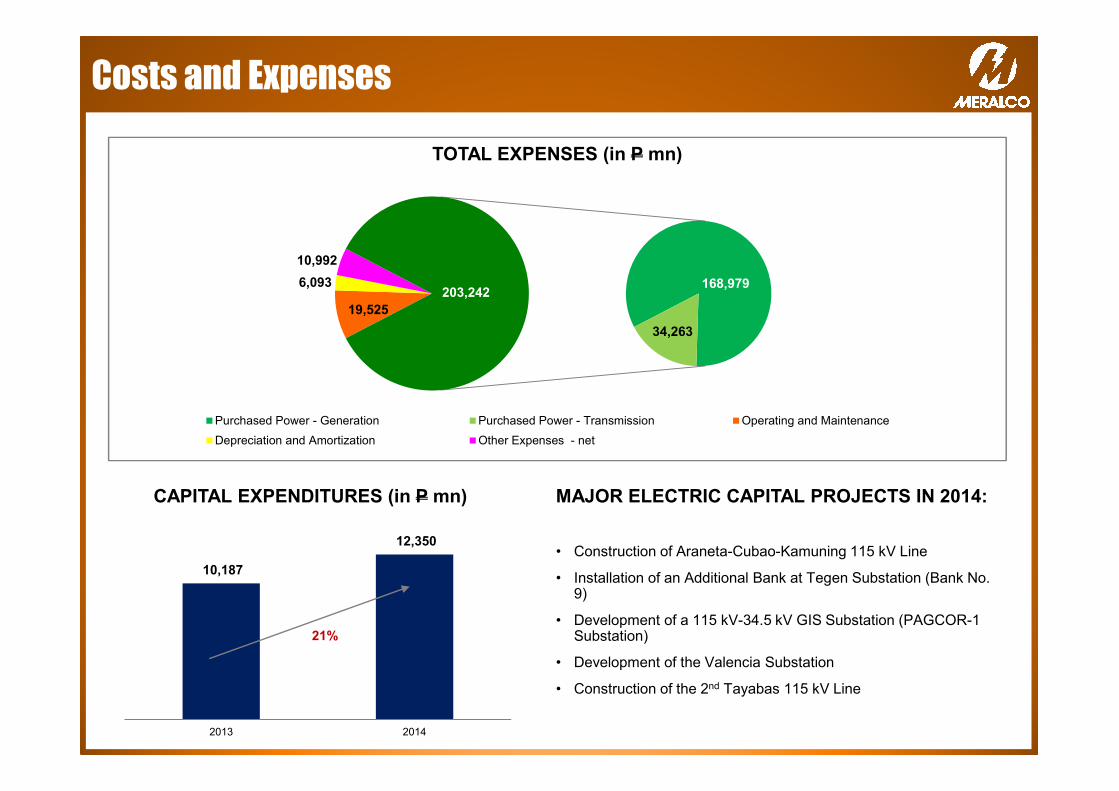
Costs and Expenses
TOTAL EXPENSES (in P mn)
CAPITAL EXPENDITURES (in P mn)
21%
168,979
34,263
19,525
6,093
10,992
203,242
Purchased Power - Generation Purchased Power - Transmission Operating and Maintenance
Depreciation and Amortization Other Expenses - net
MAJOR ELECTRIC CAPITAL PROJECTS IN 2014:
• Construction of Araneta-Cubao-Kamuning 115 kV Line
• Installation of an Additional Bank at Tegen Substation (Bank No. 9)
• Development of a 115 kV-34.5 kV GIS Substation (PAGCOR-1 Substation)
• Development of the Valencia Substation
• Construction of the 2nd Tayabas 115 kV Line
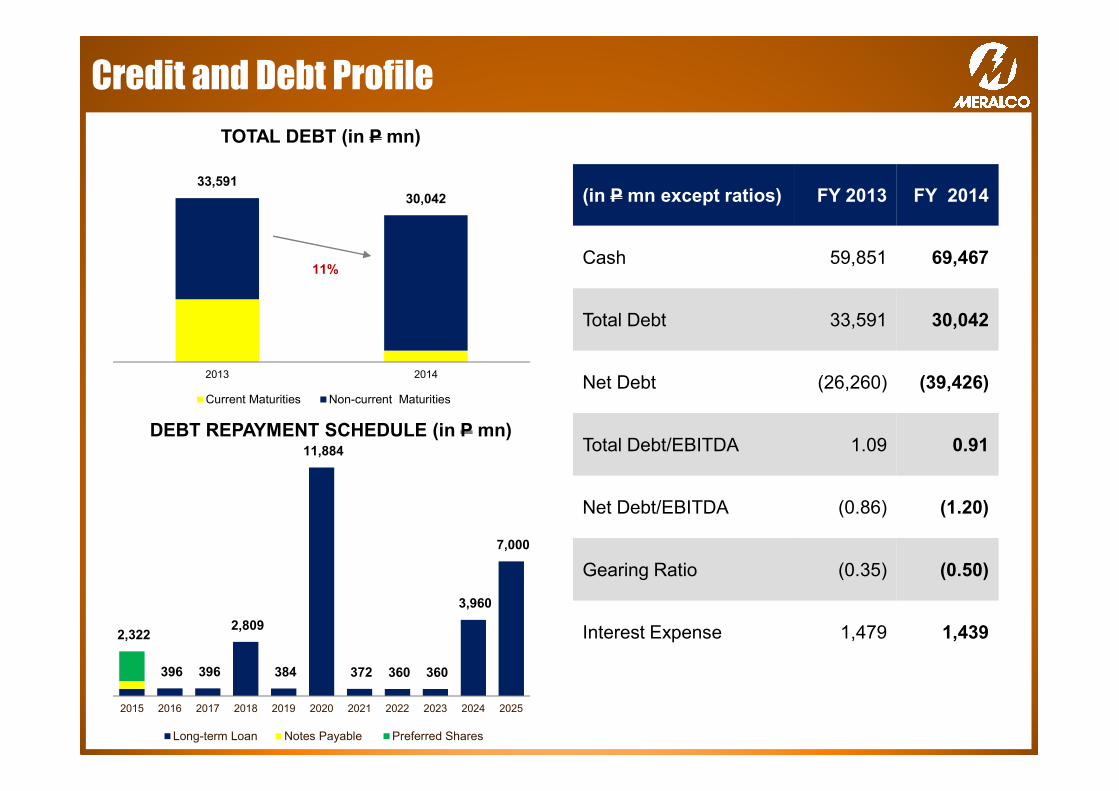
33,591
30,042
2013 2014
Current Maturities Non-current Maturities
Credit and Debt Profile
TOTAL DEBT (in P mn)
DEBT REPAYMENT SCHEDULE (in P mn)
11%
2,322
396 396
2,809
384
11,884
372 360 360
3,960
7,000
2015 2016 2017 2018 2019 2020 2021 2022 2023 2024 2025
Long-term Loan Notes Payable Preferred Shares
(in P mn except ratios) FY 2013 FY 2014
Cash 59,851 69,467
Total Debt 33,591 30,042
Net Debt (26,260) (39,426)
Total Debt/EBITDA 1.09 0.91
Net Debt/EBITDA (0.86) (1.20)
Gearing Ratio (0.35) (0.50)
Interest Expense 1,479 1,439
6.45
9.25 10.10
12.08 12.87
3% 3% 3%
4%5%
0%
1%
2%
3%
4%
5%
6%
7%
8%
-
2.00
4.00
6.00
8.00
10.00
12.00
14.00
2010 2011 2012 2013 2014
Dividends Declared Out of Core Earnings for the Year
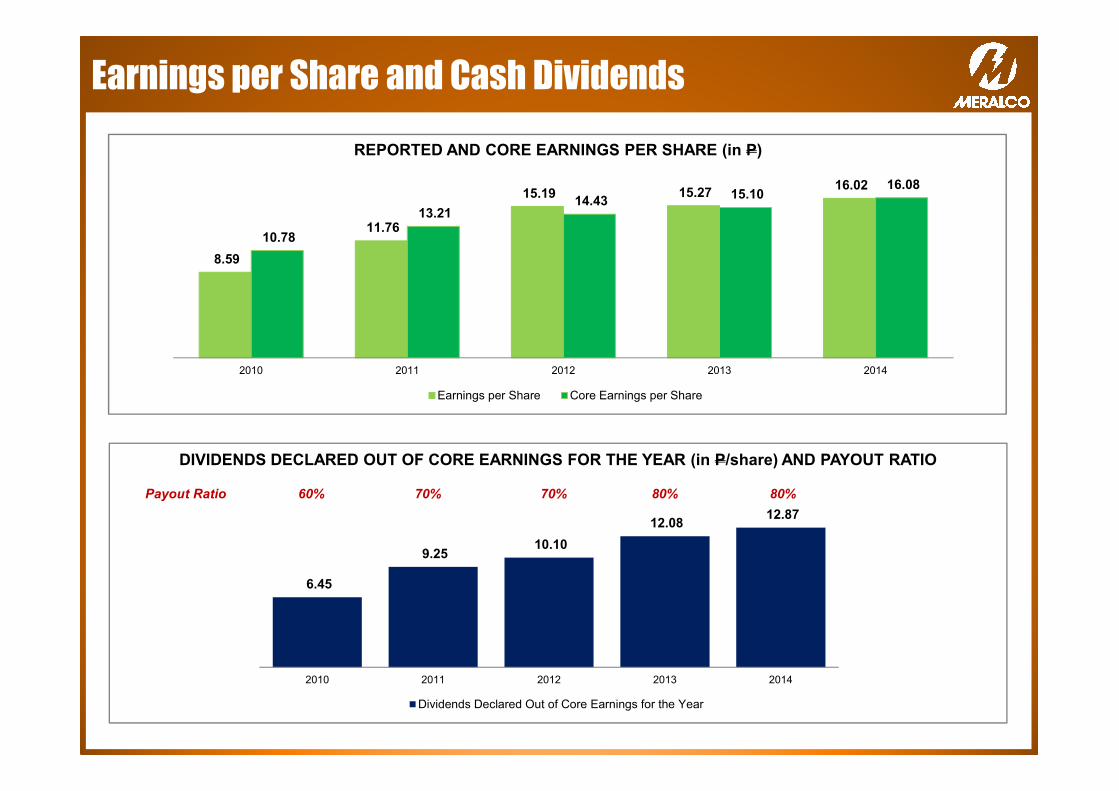
Earnings per Share and Cash Dividends
DIVIDENDS DECLARED OUT OF CORE EARNINGS FOR THE YEAR (in P/share) AND PAYOUT RATIO
REPORTED AND CORE EARNINGS PER SHARE (in P)
8.59
11.76
15.19 15.27 16.02
10.78
13.21 14.43
15.10 16.08
2010 2011 2012 2013 2014
Earnings per Share Core Earnings per Share
Payout Ratio 60% 70% 70% 80% 80%

Cautionary Statements
This presentation is prepared for the participants of the MERALCO Investors and
Analysts Briefing & Teleconference held on February 23, 2015. This
presentation has consequential limitations and is not a comprehensive discussion
about Manila Electric Company and Subsidiaries (MERALCO). The same
materials are restricted to the participants and may only be used in conjunction with
the meeting held on such date.
The information contained herein should not be quoted in whole or in part without
prior consent of MERALCO. No responsibility to any third party is accepted as the
presentation has not been prepared for and is not intended for any other purpose.
Accordingly, MERALCO makes no representation or assurance that any projected
results based on the use of these information will be realized. Investors and analysts
should not place undue reliance on these information, though presumed correct at
the time of the presentation. These information are exposed to various risks and
competitive uncertainties and contingencies which are beyond MERALCO’s control.

![Financial Highlights: Fiscal Year 2019 Ended March 31, 2020 · Analysis of Operating Results and Financial Position (1) Analysis of Operating Results [Financial Highlights] (¥Billion)](https://static.documents.pub/doc/80x56/5f87cb83eec6bf3ef911a685/financial-highlights-fiscal-year-2019-ended-march-31-2020-analysis-of-operating.jpg)


