263
Financia Editor Financial Aspects of Recent Trends in the Global Economy Volume II Rajmund MIRDALA
Financia
Editor
Financial Aspects of Recent Trends
in the Global Economy
Volume II
Rajmund MIRDALA

Copyright © 2013 ASERS Publishing Craiova, Romania [email protected]
All Rights Reserved. No part of this publication may be reproduced, stored in a retrieval system or transmitted in any form or by any means, electronic, mechanical, photocopying, recording, scanning or otherwise, except under the terms of the Romanian Copyright, Designs and Patents Law, without the permission in writing of the Publisher, Requests to the Publisher should be addressed to the Permissions Department.
Descrierea CIP a Bibliotecii Naţionale a României Financial aspects of recent trends in the global economy / Rajmund Mirdala (ed.). - Craiova : ASERS Publishing, 2013 2 vol. ISBN 978-606-93129-5-7 Vol. 2 / Itir Ozer-Imer, Ibrahim Ozkan, Alexis Derviz, ... - Bibliogr. - ISBN 978-606-93129-7-1 I. Ozer-Imer, Itir II. Ozkan, Ibrahim III. Derviz, Alexis IV. Mirdala, Rajmund (ed.) 338(100)
Typeset in Arial Narrow by ASERS Publishing Printed and bound in Romania by Universitaria Printing House, Brestei Street, 156A, Craiova, Romania
How to order E-mail for orders and customer service enquiries: [email protected]
ASERS Publishing Books Collections‟ are the initiative of Association of Sustainable Education, Research and Science to publish a series of books in many fields of knowledge with a special focus on emerging and frontier areas of scientific research. The books in these collections are based on relevant, authoritative and thought-provoking chapters written by experts to meet the requirements of executives, research scholars, academicians and students of master programs. Anonymous peer reviewers selected by the publisher provided many helpful comments and suggestions during the preparation of the manuscript for this book. They have also furnished a general assessment of the book's approach, coverage, organization, writing style and competitiveness.
Editorial Board Mădălina Constantinescu Manager of ASERS Publishing
Scientific Board of ASERS Publishing Mico Apostolov Sant Anna School of Advanced Studies, Italy
Brikend Aziri East European University, Faculty of Business and Economy, Macedonia
Monal Abdel Baki American University in Cairo, Egypt
Santiago Budria University of Madeira, Portugal
Felice Corona University of Salerno, Italy
Francesco P. Esposito French Institute for Agricultural Research, Jouy-en-Josas, France
Jean-Paul Gaertner l'Ecole de Management de Strasbourg, France
Nodar Lekishvili Tibilisi State University, Georgia
Ivan Kitov Russian Academy of Sciences, Russia
Rajmund Mirdala Technical University of Kosice, Faculty of Economics, Slovak Republic
Piotr Misztal Technical University of Radom, Economic Department, Poland
Rajesh K. Pillania Management Development Institute, India
Russell Pittman Economic Analysis Group, Antitrust Division, US Department of Justice, USA
Andreea Pascucci University of Bologna, Italy
Roberta De Santis LUISS University, Italy
Hans-Jürgen Weißbach University of Applied Sciences - Frankfurt am Main, Germany
ASERS Publishing http://www.asers.eu/asers-publishing ISBN-L: 978-606-93129-5-7 Print ISBN: 978-606-93129-7-1 Online ISBN: 978-606-93129-8-8
Copyright © 2013 by ASERS Publishing, a business unit of ASERS Ltd.
ASERS Publishing
Financial Aspects of Recent Trends in the Global Economy (FINART) Volume II
From the Editor By Rajmund MIRDALA
… 5
III. Financial Markets (Risks and Solutions)
Chapter 1. On the Co-movements of Exchange Rates by Itir OZER-IMER and Ibrahim OZKAN
… 11
Chapter 2. Collateral Composition, Diversification Risk, and Systemically Important Merchant Banks by Alexis DERVIZ
… 38
Chapter 3. Reform of Existing and Building of New Institutional Structure OTC Financial Derivatives Market by Dragan Miodrag MOMIROVIĆ
… 57
Chapter 4. Financial Markets Prudential Regulation as a Dynamic Self-Corrective Process by Josef MLÁDEK
… 78
Chapter 5. Global and Regional Regulatory Changes to the Financial Industry as a Consequence of the Financial Crisis: the Case of the European Union by Roberto J. SANTILLÁN-SALGADO
… 91
Chapter 6. Mark to Market Accounting as a Magnifier of Financial Crises by Nemanja Milovan STANISIC, Snezana Drago POPOVCIC-AVRIC, Vule Miroljub MIZDRAKOVIC and Marina MILAN DJENIC
… 110
Chapter 7. Market Timing Ability of Socially Responsible Investing Funds in Luxembourg by Wei Rong ANG and Hooi Hooi LEAN
… 127
Chapter 8. The Market of High Risk Financial Services by Jacek BINDA and Paweł MROWIEC
… 136
ASERS Publishing
Financial Aspects of Recent Trends in the Global Economy (FINART) Volume II
EDITOR
Rajmund MIRDALA Technical University of Kosice, Faculty of Economics, Slovak Republic
Chapters Contributions
Itir OZER-IMER Hacettepe University, Faculty of Economics and Administrative Sciences, Turkey
Ibrahim OZKAN Hacettepe University, Faculty of Economics and Administrative Sciences, Turkey
Alexis DERVIZ Czech National Bank & Institute of Information Theory and Automation, Czech republic
Dragan Miodrag MOMIROVIĆ University "Union" Belgrade, Faculty of Industrial Management Business, Serbi
Josef MLÁDEK University of Economics in Prague, Czech republic
Roberto J. SANTILLÁN-SALGADO EGADE Business School, Tecnológico de Monterrey, Mexico
Nemanja Milovan STANISIC Singidunum University, Faculty of Business in Belgrade, Serbia
Snezana Drago POPOVCIC-AVRIC Singidunum University, Faculty of Economics, Finance and Administration, Serbia
Snezana Drago POPOVCIC-AVRIC Singidunum University, Serbia
Vule Miroljub MIZDRAKOVIC Singidunum University, Serbia
Marina Milan DJENIC Singidunum University, Serbia
Wei Rong ANG Universiti Sains Malaysia, School of Social Sciences, Malaysia
Hooi Hooi LEAN Universiti Sains Malaysia, School of Social Sciences, Malaysia
Jacek BINDA Bielsko-Biała School of Finance and Law, Poland
Paweł MROWIEC Bielsko-Biała School of Finance and Law, Poland
Table of Contents
IV. Eurozone Perspectives
Chapter 9. The Crisis of Euro’s Governance: Institutional Aspects and Policy Issues by Daniele SCHILIRÒ
… 150
Chapter 10. Monetary Union and the Role of the Monetary Policy from the Point of View of Selected Theoretical Approaches by Rastislav KOTULIČ, Jaroslava HEČKOVÁ and Alexandra CHAPČÁKOVÁ
… 164
Chapter 11. Forced Changes in Banks Financing Growth in East European Countries by Nebojsa SAVIC, Goran PITIC and Lidija BARJAKTAROVIC
… 189
Chapter 12. Fiscal Policy and External Constraint in the European Monetary Union by Rosaria Rita CANALE
… 204
Chapter 13. Determinants of Fiscal Consolidation Success in V4 Countries by Radovan DRÁB and Lucia MIHÓKOVÁ
… 220
Chapter 14. Developments in Models of Majority Voting over Fixed Income Taxations by Cristian Marius LITAN, Paula CURT and Diana Andrada FILIP
… 244
List of Tables
... 259 List of Figures
... 261
ASERS Publishing
Financial Aspects of Recent Trends in the Global Economy (FINART) Volume II
Chapters Contributions
Daniele SCHILIRÒ University of Messina, Faculty of Education Sciences, Italy
Rastislav KOTULIČ University of Prešov in Prešov, Faculty of Management, Slovak republic
Jaroslava HEČKOVÁ University of Prešov in Prešov, Faculty of Management, Slovak republic
Alexandra CHAPČÁKOVÁ University of Prešov in Prešov, Faculty of Management, Slovak republic
Nebojsa SAVIC University of Singidunum in Belgrade, Faculty of Economics, Finance and Administration, Serbia
Goran PITIC University of Singidunum in Belgrade, Faculty of Economics, Finance and Administration, Serbia
Lidija BARJAKTAROVIC University of Singidunum in Belgrade, Faculty of Economics, Finance and Administration, Serbia
Rosaria Rita CANALE University of Naples “Parthenope”, Faculty of Economics, Italy
Radovan DRÁB Pavol Jozef Šafárik University in Košice, Faculty of Public Administration, Slovak republic
Lucia MIHÓKOVÁ Technical university in Košice, Faculty of Economics, Slovak republic
Cristian Marius LITAN Babeş-Bolyai University of Cluj-Napoca, Faculty of Economics and Business Administration, Romania
Paula CURT Babeş-Bolyai University of Cluj-Napoca, Faculty of Economics and Business Administration, Romania
Diana Andrada FILIP Babeş-Bolyai University of Cluj-Napoca, Faculty of Economics and Business Administration, Romania
Copyright © 2013 by ASERS Publishing, a business unit of ASERS Ltd.
Table of Contents
Financial Aspects of Recent Trends in the Global Economy
5
From the Editor
Current global financial and economic crisis represents one of the key areas of policy makers
as well as academics discussions. Together with debt crisis they may be considered as one of the
most crucial challenges that official authorities are facing over the past few decades. Crisis period
focused attention of economists to various areas of the financial aspects of recent trends in the world
economy in the new global era.
Financial liberalization together with the process of growing financial integration among
countries in global content significantly contributed to rapid increase in the financial dependence of
national financial markets. Intensification and internationalization of financial transactions, financial
innovations and rising strength of financial institutions accelerated growing potential of the financial
sector. It is not surprising that nowadays daily turnover in financial transactions significantly exceeds
daily turnover in trade all over the world. As a result overall impact of financial sector activities on the
real economy markedly increased over last few decades. Finally, a rising demand for more effective
regulation of national financial sectors and international financial transactions seems to be a
convenient way that policymakers suggest as the appropriate solution for current global financial
challenges. Within this context we also point to an increasing relevancy of voices calling for new
arrangement of international monetary system.
Increased uncertainty considerably reduced allocation effectiveness of the financial markets
during the crisis period. While the interest rates during the recession period generally decreased,
costs of lending increased mostly for highly indebted countries. Economic crisis emphasized another
crucial aspect of the current development in the world economy generally known as debt financing of
economic growth and related negative trend in public debt development. Particular problems in the
most indebted Eurozone countries affected not only stability of the euro exchange rate but also
became the main reason for accelerating the process of fiscal unification, banking union formation and
key adjustments in Eurozone stabilization mechanisms. As a result the pressures to strengthen
financial discipline of the Eurozone member countries increased while the alternative scenarios of
Eurozone reconstruction remained still alive (i.e. national bankruptcy, fiscal union).
Another problem partially related to the current debt crisis represents a significant growth of
the corporate debt, also known as corporate funding crisis. Accumulation of corporate debt during last
few decades together with slow post crisis recovery in the main world economy centers raises the risk
of upcoming corporate insolvency wave as a result of the huge wall of maturing debt signalizing
refinancing difficulties in credit markets in United States, Europe and Asia.
The last problem we emphasize as a direct consequence of negative aspects of the current
crisis period is related to the rising indebtedness of households. In many countries an individual
insolvency still deserves not sufficient attention of official authorities. Personal bankruptcy as a
complex consolidation procedure is also not adequately implemented in the national legislation
especially in the less developed countries considering wide aspects of this process.
In the global era soundness financial sector and financial discipline of agents (governments, investors,
households) represents one of the key aspects of generally expected positive outcomes of economic
and financial globalization. Sustainable economic growth of the global economy is necessarily
Volume II, From the Editor
6
conditional to positive contributions of the financial sector development as well as the financial
discipline of agents to the real performance of economies.
Thus, the goal of this book - Financial Aspects of the Recent Trends in the Global Economy
(FINART) - is to encourage the exchange of new ideas about challenges in global trends in finance in
the view of wide aspects of current financial and (public, corporate, households) debt crisis. The book
consists of 29 chapters that are organized in 4 blocks - Economic and Financial Crisis (Issues and
Challenges) and Global Imbalances, Debt Constrains and Exchange Rates Arrangements are
included in the Volume I of the book; Financial Markets (Risks and Solutions) and Eurozone
Perspectives are included in the Volume II of the book.
Block III - Global Imbalances, Debt Constrains and Exchange Rates Arrangements - begins
with chapter On the Co-movements of Exchange Rates by Itir Ozer-Imer and Ibrahim Ozkan. Their
chapter assesses exchange rate co-movements by grouping the currencies based on similarities in
their patterns, and emphasizes the importance of the trajectories of exchange rate co-movements in
the exchange rate classification. Hierarchical clustering is performed with some widely used similarity
measures along with the longest common subsequence (LCS) algorithm. Weekly series of twenty-one
currencies were used in this study. The results show that; i) LCS performs better than the other
measures and it produces comprehensible results, ii) historical and geographical factors play an
important role in the co-movements of currencies. Co-movements (common trajectories) of currencies
need to be taken into consideration in studies on exchange rate behavior; since these trajectories
usually contain most of the information. This chapter has important implications for the analyses in the
research areas of exchange rate regime choice, monetary policy implementation, and the optimum
currency areas (OCA) theory.
Chapter 2 - Collateral Composition, Diversification Risk, and Systemically Important Merchant
Banks - by Alexis Derviz, deals with impact of collateral diversification by non-financial firms on
systemic risk in a general equilibrium model with standard production functions and mixed debt-equity
financing. Systemic risk comes about as soon as firms diversify their collateral by holding claims on a
big wholesale (merchant) bank whose asset side includes claims on the same producer set. The
merchant bank sector proves to be fragile (has a short distance to default) regardless of competition.
In this setting, the policy response consisting in official guarantees for the merchant bank liabilities
entails considerable government loss risk. An alternative without the need of public sector involvement
is to encourage systemically important merchant banks to introduce a simple bail-in mechanism by
restricting their liabilities to contingent convertible bonds. This direction of regulatory policies can be
particularly relevant for containment of systemic events in globally leveraged economies serviced by
big international banks outside the host country regulatory control.
Chapter 3 - Reform of Existing and Building of New Institutional Structure Over the Counter
Financial Derivatives Market - by Dragan Miodrag Momirović, aims to show in main aspects a new
regulatory and supervisory structure of OTC financial derivatives markets, their structure, differences,
practical’s and policies implications and problems of application on the basis of the initiative group
G20 and other relevant international organs regulations. The financial crisis which occurred during
2008 has shown that markets are OTC (over-the-counter) derivatives unregulated and insufficiently
Financial Aspects of Recent Trends in the Global Economy
7
controlled and represent a potential source of systemic risk build up. At summits in Pittsburgh G20
leaders by made binding recommendations for the reform of the existing buildings and the new
institutional structure of OTC financial derivatives market. Recommendations are relating to the
standardizations of contracts, mandatory central clearing of all transactions, trading across exchanges
or electronic platforms, capital and margin requirements and reporting through trades repositories.
Chapter 4 - Financial Markets Prudential Regulation as a Dynamic Self-Corrective Process -
by Josef Mládek, studies the issues of economic and financial cycle and their interconnections. In this
vein of research, risk-based prudential regulation of financial markets is of center importance. This
chapter is therefore structured as follows. First, it highlights some specific features of prudential
regulation in the financial markets. It looks at a different nature of the regulated risk in financial
markets compared with other sectors of the economy and the consequences thereof for the
robustness of the regulation. Related to that, effort of the regulated entities to optimize the impact of
regulation on them is investigated. Finally, lessons learned are applied to shed some more light on the
prospects of regulatory reform in order to achieve more viable and robust risk regulation of financial
markets.
Chapter 5 - Global and Regional Regulatory Changes to the Financial Industry as a
Consequence of the Financial Crisis: The Case of the European Union - by Roberto J. Santillán-
Salgado, briefly discusses the antecedents of Financial Regulation in the European Union, as well as
the political and institutional responses of governments to the Financial Crisis of 2007-2009. As a
result of author’s critical analysis, we conclude there is no doubt of the interest of national authorities
to minimize the probability of a repetition of a systemic financial stress episode or, worse yet, another
fully fledged financial crisis; but the challenge to conciliate so many legislations, political interests and
economic interests is not a trivial matter. While the discussion about the origins and consequences of
the recent Financial Crisis will be an ongoing topic for many years to come, a number of national
governments, regulatory agencies and international financial organizations, have already taken
important steps and towards the implementation of new regulatory frameworks, as well as more
robust supervision mechanisms of the financial industry.
Chapter 6 - Mark to Market Accounting as a Magnifier of Financial Crises - by Nemanja
Milovan Stanisic, Snezana Drago Popovcic-Avric, Vule Miroljub Mizdrakovic and Marina Milan Djenic,
provides an analysis on whether mark-to-market accounting magnifies financial crises. Even though
the results of numerous studies on this topic offer various conclusions, the majority of them conclude
that fair value accounting, or mark-to-market accounting, does not cause financial crises. Most studies
that had similar conclusions dealt with the 2006-2008 period, whereas we focus our research on
period from 1881 to present day. Primarily, authors will point out the historical context of the
implementation of mark-to-market accounting and consequences it had. Authors consider the long
term relationship between United States (US) GDP and the S&P 500 index values and key historical
developments to conclude that implementation of mark-to-market accounting contributes to creating of
asset bubbles and assets overestimations. Even though mark-to-market accounting does not cause
financial crises, it does magnify fundamental procyclicality which is inherent in efficient markets.
Chapter 7 - Market Timing Ability of Socially Responsible Investing Funds in Luxembourg - by
Wei Rong Ang and Hooi Hooi Lean, investigates the market timing ability of SRI funds in Luxembourg.
Volume II, From the Editor
8
Luxembourg is the largest fund investment center in Europe and played an important role in promoting
SRI funds. This study uses data from Eurekahedge database for 188 SRI funds in Luxembourg for the
sample period of January 2001 to December 2011. Authors employed two market timing models, i.e.
the four-factor Treynor-Mazuy (1966) model and Henriksson-Merton (1981) model for the analysis.
Authors found that the SRI fund managers in Luxembourg are skillful. In other words, they are good in
forecasting the market trends. Moreover, there is no size and momentum effects found but value
effect is existed. Authors also found that the SRI funds have higher return during the financial crisis.
Hence, authors suggest that the SRI funds can be used as a hedging instrument during the crisis.
Chapter 8 - The Market of High Risk Financial Services - by Jacek Binda and Paweł Mrowiec,
analyses of the market of high risk financial services, the reasons of its fast growth as well as
supervisory activities undertaken by Polish Financial Supervision Authority (KNF) related to this
phenomenon. The black list of entities which do not hold a permission to render bank services,
especially such as receiving money deposits in order to charge them with risk, is getting longer and
longer. In the end of November the list, prepared by Polish Financial Supervision Authority (KNF) had
33 entries, which constitutes a 43% increase compared to the end of September. The reason for this
may be the introduction by KNF of tightened criteria for loan availability in the form of T
recommendation. Implementation of T recommendation shifted the demand for bank services towards
non-bank entities.
Block IV - Financial Markets (Risks and Solutions) - begins with chapter 9 - The Crisis of
Euro’s Governance: Institutional Aspects and Policy Issues - by Daniele Schilirò. Her chapter
discusses the issue concerning rules and discretion in the governance of the euro. In the following
section it describes the euro crisis and examines the remedies put in place, noting that despite the
statements and the efforts of the European authorities the confidence in the euro is diminishing. Thus
the exit of Greece from the euro or even the breakdown of the single currency has become a
hypothesis discussed more frequently among economists, politicians, central bankers and
businessmen. The last section of the chapter focuses on what’s wrong in the governance of the euro
and examines the institutional aspects and the economic policy issues suggesting that the European
integration allows to ensure the European citizens independence and protect their historical freedom,
but also to influence and thus affect the choices from which may depend the future prosperity of
European nations involved.
Chapter 10 - Monetary Union and the Role of the Monetary Policy from the Point of View of
Selected Theoretical Approaches - by Rastislav Kotulič, Jaroslava Hečková and Alexandra
Chapčáková, provides a brief overview of key milestones in the process of the European monetary
integration. We also evaluate positive and negative aspects of this process in the view of selected
theoretical approaches. The effective international monetary system is an important precondition to a
successful fulfillment of international economic transactions. The existing development of international
monetary systems indicates the need of one strong currency, at most a small number of national
currencies to ensure international transactions. It has to be a currency (currencies) that would be
based on a strong national economy, especially in the current period that is marked by the
strengthening of the long duration of international economic transactions. The instability of the national
Financial Aspects of Recent Trends in the Global Economy
9
currency that would take place of the international (world) currency is connected to depreciative as
well as revaluation processes, which does not contribute to the development of the world economy.
Chapter 11 - Forced Changes in Banks Financing Growth in East European Countries - by
Nebojsa Savic, Goran Pitic and Lidija Barjaktarovic, analyzes causes of changes of importance of
various foreign sources of financing in the analyzed period. The need to analyze CBCs, in particular,
was derived from the fact that they represented the largest source used by banks to grant credit. In
this regard, authors analyzed especially the levels of deposit and lending interest rates, and their
structures. The experience during the Great Recession shows that excessive reliance on foreign
capital inflows makes a country vulnerable.
Chapter 12 - Fiscal Policy and External Constraint in the European Monetary Union - by
Rosaria Rita Canale, puts in doubt this conclusion and connects fiscal crises with the balance of
payments. A stylized model is presented. Its results are: 1) public expenditure can have positive
effects not only on growth but also on deficit and debt if it is not accompanied by an a interest rate
increase by the Central Bank; 2) when an external constraint is introduced fiscal policy can have
negative effects if it comes with a balance of payment deficit. The same negative effects result from
whatever shock causing negative expectation about the future growth of the national economy. The
results suggest that to make a currency union work it is necessary to overcome national boundaries.
Chapter 13 - Determinants of Fiscal Consolidation Success in V4 Countries - by Radovan
Dráb and Lucia Mihóková, focuses on the identification and comparison of revenue and expenditure
based consolidation, which would substantially contribute to the reduction of public debt in the V4
countries for the period 1996 to 2014. This analysis was performed in several stages. The first part
focuses on the determination of the debt accumulation and debt reduction periods by using year-on-
year comparisons with a debt-to-GDP ratio indicator. The second part of the analysis was focused on
model specification based on theoretical and empirical evidence in order to identify factors, which in
related periods influenced the major part of debt reduction and debt accumulation in Visegrad
countries. The probability of success in fiscal consolidation described in the last part has been derived
based on a logistic probabilistic model with two different equations for revenue and expenditure
consolidation.
Chapter 14 - Developments in Models of Majority Voting over Fixed Income Taxations - by
Cristian Marius Litan, Paula Curt and Diana Andrada Filip, focuses on several aims: 1. Authors
discussed how standard equilibrium concepts from simple majority voting games in coalitional form
(e.g. core, -core and least core) can be adapted to the general setup of voting over income tax
schedules, as well as the conditions under which such adapted concepts are stable. 2. Authors
investigated which are the implications of these concepts, from the perspective of progressivity versus
regressivity, for workhorse models of the positive theory of income taxation (e.g. with restricted policy
spaces such as quadratic taxation models, piecewise linear taxation models, etc.). Finally, authors
provided a brief critical evaluation of the extent to which this approach is able to address the
difficulties acknowledged by the literature in the field and we draw future lines of investigation.
Rajmund Mirdala
Financial Aspects of Recent Trends in the Global Economy
10
x;
III.
Financial Markets
(Risks and Solutions)
Financial Aspects of Recent Trends in the Global Economy
11
x
Chapter 1
ON THE CO-MOVEMENTS OF EXCHANGE RATES
by Itir OZER-IMER
Hacettepe University, Faculty of Economics and Administrative Sciences, Turkey
and Ibrahim OZKAN
Hacettepe University, Faculty of Economics and Administrative Sciences, Turkey
1.1 Introduction
1.2 Data and methodology
1.3 Results
1.4 Conclusion
1.5 References
1.6 Appendices
Volume II, Chapter 1 Itir Ozer-Imer and Ibrahim Ozkan
12
ON THE CO-MOVEMENTS OF EXCHANGE RATES
Itir Ozer-Imer 1
Hacettepe University
Faculty of Economics and Administrative Sciences, Turkey
Ibrahim Ozkan 2
Hacettepe University
Faculty of Economics and Administrative Sciences, Turkey
Abstract
The aims of this study are to assess exchange rate co-movements by grouping the currencies based on
similarities in their patterns, and to emphasize the importance of the trajectories of exchange rate co-
movements in the exchange rate classification. Hierarchical clustering is performed with some widely used
similarity measures along with the longest common subsequence (LCS) algorithm. Weekly series of twenty-
one currencies were used in this study. The results show that; i) LCS performs better than the other measures
and it produces comprehensible results, ii) historical and geographical factors play an important role in the co-
movement of currencies. Co-movements (common trajectories) of currencies need to be taken into
consideration in studies on exchange rate behavior; since these trajectories usually contain most of the
information. This chapter has important implications for the analyses in the research areas of exchange rate
regime choice, monetary policy implementation, and the optimum currency areas (OCA) theory.
Keywords: co-movements, exchange rate patterns, exchange rate classification, clustering, longest common
subsequence.
1.1 Introduction
The need to understand the behavior of exchange rates has generated a vast empirical
literature. Despite this vast literature, many issues remain unsolved even though it has been a popular
area of research. Exchange rate behavior is important from the viewpoint of international finance,
exchange rate regime classification and the optimum currency areas (OCA) theory.
The empirical literature on the choice of exchange rate regimes has been mostly based on the
International Monetary Fund’s (IMF) de jure classification of exchange rate regimes until 1999.3 The
IMF’s Annual Report on Exchange Arrangements and Exchange Restrictions took into consideration
the officially announced regimes of the countries. Provision of a comprehensive set of countries,
frequent update and historical data extending back to 1970 were the key advantages of this
classification (Bubula and Otker-Robe, 2002).
1 Itir Ozer-Imer, Assistant Professor at Hacettepe University, Faculty of Economics and Administrative Sciences, Department of
International Relations, 06800, Beytepe, Ankara, Turkey 2 Ibrahim Ozkan, Associate Professor at Hacettepe University, Faculty of Economics and Administrative Sciences, Department of
Economics, 06800, Beytepe, Ankara, Turkey 3 As Frankel (1999: 3-5) has put forward there is a continuum of flexibility from the most rigid to free floating; currency union,
currency board, “truly fixed” exchange rate, adjustable peg, crawling peg, basket peg, target zone or band, managed (dirty) float, and free float.
Financial Aspects of Recent Trends in the Global Economy
13
It has been observed that there had been divergences between the officially reported and
actual exchange rate regime arrangements (Calvo and Reinhart, 2002). Some countries which
reported pegged exchange rate regimes to the IMF were either unable or unwilling to keep the
exchange rate pegged. Some other countries, despite official commitment to flexible exchange rates,
intervened in the foreign exchange markets to limit movements of the exchange rates because of the
fear of floating (Calvo and Reinhart, 2002). De jure classification failed to reflect the actual monetary
autonomy of the regimes because the grouping of pegs had different degrees of flexibilities. Hence,
IMF itself adopted a new classification based on de facto classification in 1999, while a new empirical
literature based on de facto classification was emerging. Despite being an improvement, this system
lacked a historical database.
The empirical literature on the classification of exchange rates does not constitute a unified
structure, however, the following studies can be emphasized in a selective manner.4 In an effort to
extend the time period backwards, Bubula and Otker-Robe (2002) constructed a monthly database on
de facto regimes by including all IMF member countries from 1990 to the beginning of 2001, whereas
Reinhart and Rogoff’s (2004) database contains 153 countries’ monthly data from 1946 to 2001. Levy-
Yeyati and Sturzenegger’s (2005) de facto classification covered all IMF-reporting countries from 1974
to 2000. They classified exchange rate regimes on the basis of changes in the nominal exchange
rates, the volatility of these changes, and the volatility of international reserves. Eichengreen and
Razo-Garcia (2011) considered the Bubula-Otker-Robe (BOR), Reinhart-Rogoff (RAR) and Levy-
Yeyati-Sturzenegger (LYS) classifications to analyze disagreements over these three classifications
and showed that the disagreements are most prevalent in middle and low-income countries. Ghosh et
al. (2011) used the classification data covering the period between 1980 and 2010 for 145 emerging
and developing countries to analyze and compare the inflation performance of countries under de jure
and de facto pegs.
There is no consensus in the literature with regard to the robustness of regime comparisons
since “sample periods, data frequency, conditioning variables, definitions of regimes, empirical
methodologies used to classify regimes, the level of details in the regime classification, the kinds of
countries included in the sample, the influence of shocks on the outcomes, and the treatment of
endogeneity” (Tavlas et al., 2008: 961) differ in these studies. The aim of our study is neither
constructing de jure or de facto classification nor testing a theory, but is rather to assess exchange
rate patterns and behavior based on an atheoretical methodology, which is closer to human
perception, and hence, which is understandable. We believe that the trajectories of exchange rate co-
movements are vital phenomena for the classification of exchange rates since these trajectories
contain most of the information.
If the currencies of countries move together, then those countries would become good
candidates for pegging their currencies and forming an optimum currency area (OCA). Although our
study allows for a special classification to analyze natural candidates for the OCAs, we did not
conduct the analysis from the viewpoint of the OCA theory. Instead, this study explores the natural
clusters of currencies by taking into account their co-movements.
4 For a survey of the empirical literature on the classification of exchange rates see Tavlas et al. (2008).
Volume II, Chapter 1 Itir Ozer-Imer and Ibrahim Ozkan
14
Although there is a diversified literature on co-movement, there is no common understanding
of this phenomenon (Hochstotter and Weskamp, 2012: 3). In this study, co-movement is defined as
the similarity of the exchange rate trajectories. Similarity is measured based on common patterns in
exchange rates since co-movement creates common patterns. Two different lines of research can be
distinguished in the co-movement studies; i) co-movement studies related with the field of finance;
financial assets/markets, asset prices or their returns (Bonfiglioli and Favero, 2005; Connolly et al.,
2007; Ammer et al., 2011), ii) co-movement studies related with the foreign exchange markets. Co-
movement studies in this second category have usually been conducted with emphasis on co-
movement between exchange rates and financial assets/markets (Hochstotter and Weskamp, 2012),
and exchange rates and some economic fundamentals, such as interest rate (Takagi, 1991; Sanchez,
2006), oil price (Buetzer et al., 2012; Reboredo, 2012), etc. To our knowledge, research on the co-
movement of exchanges rates is a relatively intact area. Among those few, some employed pattern
recognition (Huang, 2011), while some considered the foreign exchange markets as networks (Fenn
et al., 2012; Sharif et al., 2012). Most of the analyses on exchange rate co-movement have used
correlation (Benediktsdottir and Scotti, 2009; Li, 2011; Wu et al., 2012; Fen et al., 2012; Sharif et al.,
2012).
Since exchange rates constitute the largest asset class in the world (Galati and Melvin, 2004;
Hochstotter and Weskamp, 2012), their behavior can be understood just like any other financial asset.
In fact, two currencies can be treated as the same asset if they are co-integrated (Kuhl, 2008). With
an attempt to explore the behavior of exchange rates, our study aims; i) to examine whether exchange
rates have some common patterns, ii) to observe the natural groups of currencies based on common
patterns and iii) to link the natural group of currencies with the exchange rate classifications in the
literature. Since we seek to introduce a novel approach for this assessment in a fully reproducible
way5, the currency data in the sample have been obtained from the open access database of Federal
Reserve Economic Data (FRED)6 and the statistical software used in the study is an open source
program called R.7
To assess the common patterns in exchange rates, we employed longest common
subsequence (LCS) algorithm. Some other quantitative similarity measures, such as correlation,
brownian distance correlation, euclidian distance, mutual information, Kolmogorov-Smirnov (KS) test
and maximal information have also been used to measure similarities. We formed clusters based on
these similarities with an application of hierarchical clustering. We then compared findings and
observed that LCS performs better than the other commonly employed measures. It was seen that
LCS is very suitable for sequence interdependence or trajectory similarity and a very short discussion
is given in section 1.2.2. We confirmed our results with the annual reports of the Bank for International
Settlements (BIS). Finally, we compared the natural clusters found in this study with the exchange
rate classifications in the literature.
We believe the LCS technique employed in this study is very valuable for analyzing the co-
movements of exchange rates and exchange rate regimes, which are of great importance for the
international monetary arrangements, financial integration, and financial deepening.
5 The R-scripts necessary to reproduce the analysis are given in Appendix F. 6 http://research.stlouisfed.org/fred2/. 7 For details see http://cran.r-project.org/.
Financial Aspects of Recent Trends in the Global Economy
15
1.2 Data and methodology
1.2.1 Data
We downloaded the exchange rates data from the database of FRED with the R program
script in order to obtain fully reproducible results. Countries and regions (currencies) in the sample are
the European Union (the Euro-EU), Brazil (Brazilian real-BZ), Mexico (Mexican peso-MX), South
Africa (South African rand-SF), Malaysia (Malaysian ringgit-MA), India (Indian rupee-IN), Australia
(Australian dollar-AL), New Zealand (New Zealand dollar-NZ), Canada (Canadian dollar-CA), the
United Kingdom (Pound sterling-UK), Switzerland (Swiss franc-SZ), Japan (Japanese yen-JP),
Norway (Norwegian krone-NO), Denmark (Danish krone-DN), Sweden (Swedish krona-SD), Hong
Kong (Hong Kong dollar-HK), Singapore (Singapore dollar-SI), Taiwan (new Taiwan dollar-TA), Korea
(the won-KO), Thailand (Thai baht-TH) and Venezuela (Venezuelan bolivar-VZ).8 VZ has been
included in the sample to serve as the control series. We downloaded the exchange rates for the time
span of their availability and August 10, 2012. We based our analysis on weekly observations. In
addition to these currencies, FRED database also comprises Chinese Yuan (a pegged exchange rate)
and Sri Lankan Rupees. We excluded China and Sri Lanka from our analysis. The reason for the
inclusion of the other currencies in the sample from the FRED’s database is to obtain results which
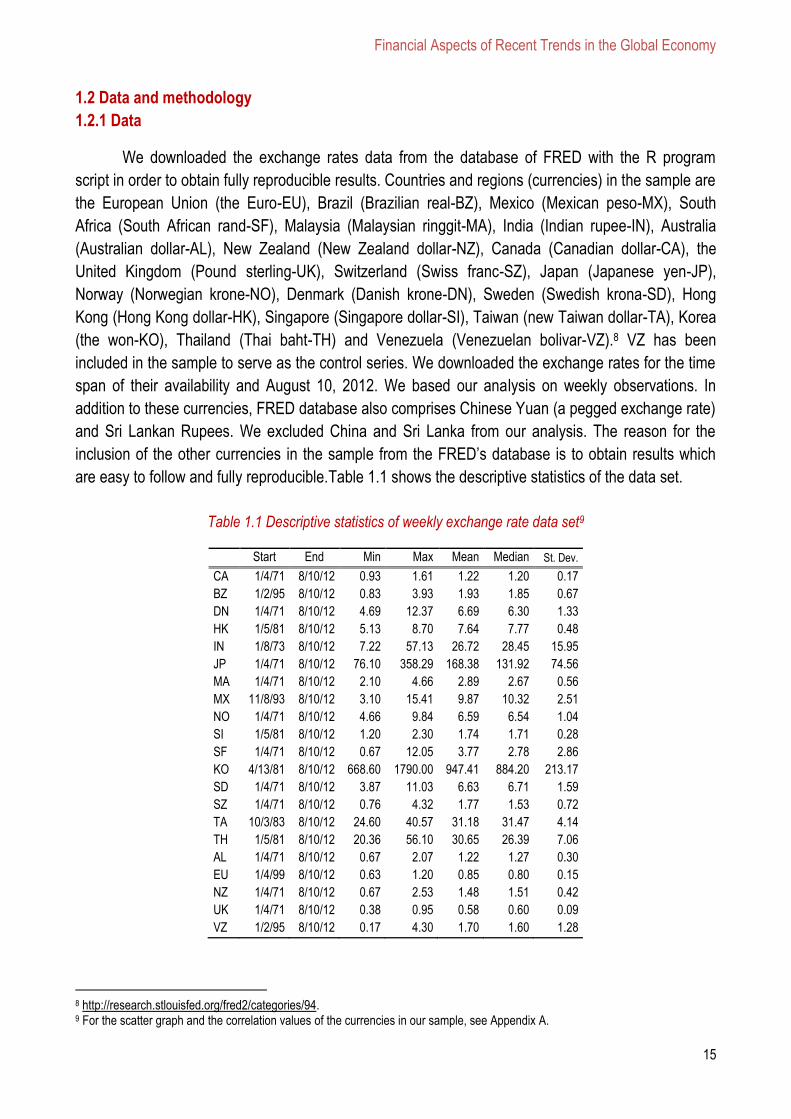
are easy to follow and fully reproducible.Table 1.1 shows the descriptive statistics of the data set.
Table 1.1 Descriptive statistics of weekly exchange rate data set9
Start End Min Max Mean Median St. Dev.
CA 1/4/71 8/10/12 0.93 1.61 1.22 1.20 0.17
BZ 1/2/95 8/10/12 0.83 3.93 1.93 1.85 0.67
DN 1/4/71 8/10/12 4.69 12.37 6.69 6.30 1.33
HK 1/5/81 8/10/12 5.13 8.70 7.64 7.77 0.48
IN 1/8/73 8/10/12 7.22 57.13 26.72 28.45 15.95
JP 1/4/71 8/10/12 76.10 358.29 168.38 131.92 74.56
MA 1/4/71 8/10/12 2.10 4.66 2.89 2.67 0.56
MX 11/8/93 8/10/12 3.10 15.41 9.87 10.32 2.51
NO 1/4/71 8/10/12 4.66 9.84 6.59 6.54 1.04
SI 1/5/81 8/10/12 1.20 2.30 1.74 1.71 0.28
SF 1/4/71 8/10/12 0.67 12.05 3.77 2.78 2.86
KO 4/13/81 8/10/12 668.60 1790.00 947.41 884.20 213.17
SD 1/4/71 8/10/12 3.87 11.03 6.63 6.71 1.59
SZ 1/4/71 8/10/12 0.76 4.32 1.77 1.53 0.72
TA 10/3/83 8/10/12 24.60 40.57 31.18 31.47 4.14
TH 1/5/81 8/10/12 20.36 56.10 30.65 26.39 7.06
AL 1/4/71 8/10/12 0.67 2.07 1.22 1.27 0.30
EU 1/4/99 8/10/12 0.63 1.20 0.85 0.80 0.15
NZ 1/4/71 8/10/12 0.67 2.53 1.48 1.51 0.42
UK 1/4/71 8/10/12 0.38 0.95 0.58 0.60 0.09
VZ 1/2/95 8/10/12 0.17 4.30 1.70 1.60 1.28
8 http://research.stlouisfed.org/fred2/categories/94. 9 For the scatter graph and the correlation values of the currencies in our sample, see Appendix A.

Volume II, Chapter 1 Itir Ozer-Imer and Ibrahim Ozkan
16
The descriptive statistics of the data exhibit different characteristics. In general, scaling
(transforming the variables so that they have zero means and unity variances) is a choice before
proceeding Since the currencies are treated as financial assets, we obtained return series for all
currencies, ic as 1, lnln ttti ccret , which also remove any constant and linear trend in mean for
all similarity measures except LCS. LCS is flexible enough for this type of data set since it checks the
convexity (concavity) of trajectories.
1.2.2 Methodology
The approach to find the interdependencies between exchange rates follows three steps; (i)
obtaining a matrix that represent the degree of associations, (ii) simply applying hierarchical clustering
algorithm to get the cluster dendrogram that shows clustered structure of exchange rates, and (iii)
assessing the clusters based on the BIS reports.
The interdependencies between time series can be measured by means of similarity/
dissimilarity measures. There are several measures suggested in the literature. In this study,
correlation, euclidian distance, brownian distance correlation, maximal information, mutual
information, Kolmogorov-Smirnov (KS) test and the longest common subsequence (LCS) have been
employed. Among these, correlation and euclidian distance are the most widely used measures.
Brownian distance correlation and maximal information have been developed and suggested very
recently. Since the mutual information is a measure for nonlinear correlations, it is suitable for the type
of analysis conducted in this study. K-S test is one of the widely used nonparametric tests to compare
the cumulative probability function to assess whether random variables are drawn from the same
probability distribution function. Hence, it is a suitable measure to assess the cumulative distribution
functions of return series. Finally, LCS is a measure that is used to match the sequences successfully
regardless of the nature of the data.
Correlation
The correlation between two random variables X and Y is given as:
)Yvar()Xvar(
)Y,Xcov()Y,X(corr (1.1)
and 11 )Y,X(corr
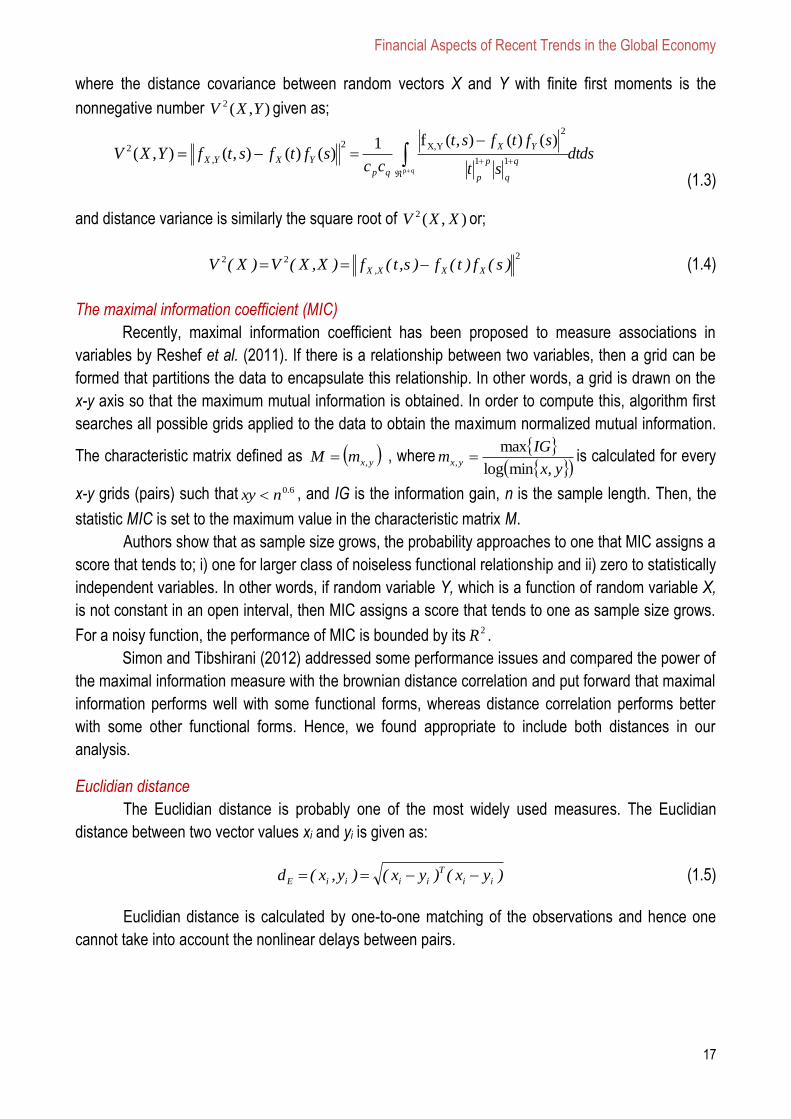
Distance correlation (Brownian distance correlation)
Distance correlation is a new approach in testing the dependence of random vectors (Szekely
et al.., 2007; Szekely and Rizzo, 2009 and 2010). The distance correlation between random vectors X
and Y with finite first moments is the nonnegative number R(X,Y ) defined by
0)()(0
0)()()()(
),(
),(
22
22
22
2
2
YVXV
YVXVYVXV
YXV
YXR (1.2)
Financial Aspects of Recent Trends in the Global Economy
17
where the distance covariance between random vectors X and Y with finite first moments is the
nonnegative number ),(2 YXV given as;
2
,
2 )()(),(),( sftfstfYXV YXYX dtdsst
sftfst
cc q
q
p
p
YX
qp
qp
11
2
YX, )()(),(f1
(1.3)
and distance variance is similarly the square root of ),(2 XXV or;
222 )s(f)t(f)s,t(f)X,X(V)X(V XXX,X (1.4)
The maximal information coefficient (MIC)
Recently, maximal information coefficient has been proposed to measure associations in
variables by Reshef et al. (2011). If there is a relationship between two variables, then a grid can be
formed that partitions the data to encapsulate this relationship. In other words, a grid is drawn on the
x-y axis so that the maximum mutual information is obtained. In order to compute this, algorithm first
searches all possible grids applied to the data to obtain the maximum normalized mutual information.
The characteristic matrix defined as yxmM , , where
yx
IGm yx
,minlog
max, is calculated for every
x-y grids (pairs) such that 6.0nxy , and IG is the information gain, n is the sample length. Then, the
statistic MIC is set to the maximum value in the characteristic matrix M.
Authors show that as sample size grows, the probability approaches to one that MIC assigns a
score that tends to; i) one for larger class of noiseless functional relationship and ii) zero to statistically
independent variables. In other words, if random variable Y, which is a function of random variable X,
is not constant in an open interval, then MIC assigns a score that tends to one as sample size grows.
For a noisy function, the performance of MIC is bounded by its 2R .
Simon and Tibshirani (2012) addressed some performance issues and compared the power of
the maximal information measure with the brownian distance correlation and put forward that maximal
information performs well with some functional forms, whereas distance correlation performs better
with some other functional forms. Hence, we found appropriate to include both distances in our
analysis.
Euclidian distance
The Euclidian distance is probably one of the most widely used measures. The Euclidian
distance between two vector values xi and yi is given as:
)yx()yx()y,x(d ii
T
iiiiE (1.5)
Euclidian distance is calculated by one-to-one matching of the observations and hence one
cannot take into account the nonlinear delays between pairs.
Volume II, Chapter 1 Itir Ozer-Imer and Ibrahim Ozkan
18
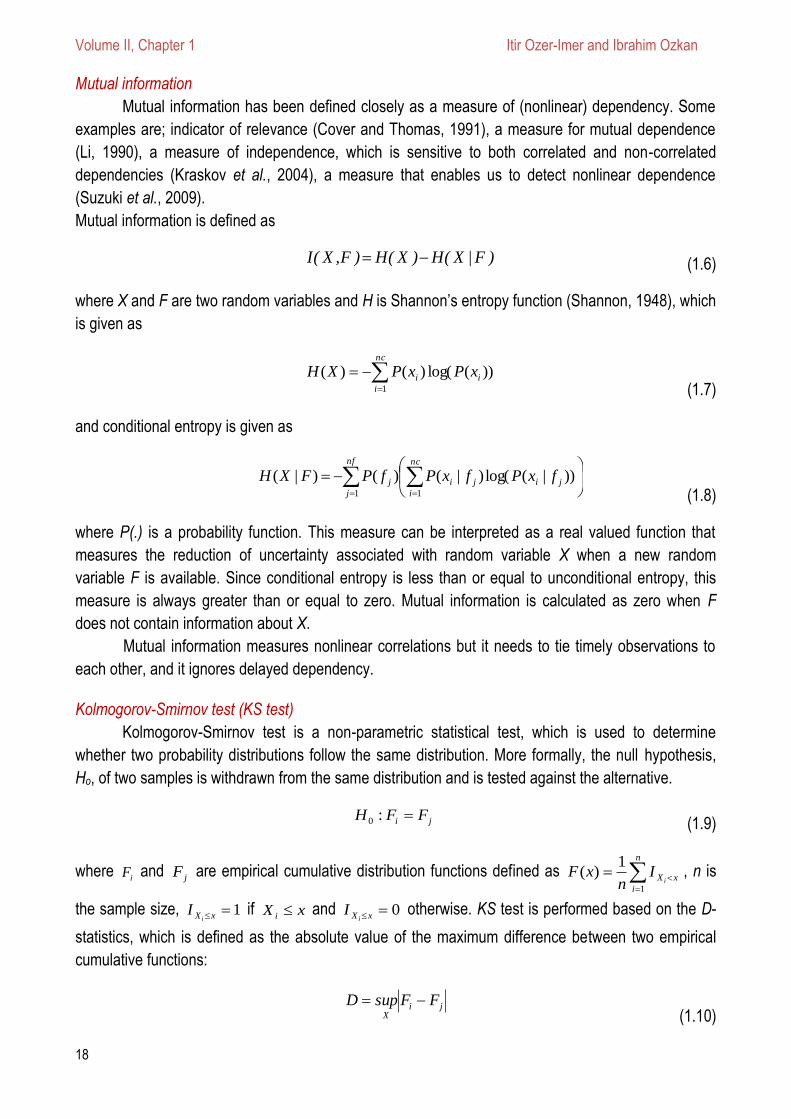
Mutual information
Mutual information has been defined closely as a measure of (nonlinear) dependency. Some
examples are; indicator of relevance (Cover and Thomas, 1991), a measure for mutual dependence
(Li, 1990), a measure of independence, which is sensitive to both correlated and non-correlated
dependencies (Kraskov et al., 2004), a measure that enables us to detect nonlinear dependence
(Suzuki et al., 2009).
Mutual information is defined as
)F|X(H)X(H)F,X(I (1.6)
where X and F are two random variables and H is Shannon’s entropy function (Shannon, 1948), which
is given as
nc
i
ii xPxPXH1
))(log()()(
(1.7)
and conditional entropy is given as
nc
i
jiji
nf
j
j fxPfxPfPFXH11
))|(log()|()()|(
(1.8)
where P(.) is a probability function. This measure can be interpreted as a real valued function that
measures the reduction of uncertainty associated with random variable X when a new random
variable F is available. Since conditional entropy is less than or equal to unconditional entropy, this
measure is always greater than or equal to zero. Mutual information is calculated as zero when F
does not contain information about X.
Mutual information measures nonlinear correlations but it needs to tie timely observations to
each other, and it ignores delayed dependency.
Kolmogorov-Smirnov test (KS test)
Kolmogorov-Smirnov test is a non-parametric statistical test, which is used to determine
whether two probability distributions follow the same distribution. More formally, the null hypothesis,
Ho, of two samples is withdrawn from the same distribution and is tested against the alternative.
ji FFH :0 (1.9)
where iF and jF
are empirical cumulative distribution functions defined as
n
i
xX iI
nxF
1
1)( , n is
the sample size, 1xX iI if xX i and 0xX i
I otherwise. KS test is performed based on the D-
statistics, which is defined as the absolute value of the maximum difference between two empirical
cumulative functions:
jiX
FFsupD (1.10)
Financial Aspects of Recent Trends in the Global Economy
19
Kolmogorov (1938) showed that for the larger value of D, the null hypothesis is rejected. He
provided the critical values. The p-values associated with this test are used as a similarity measure for
the exchange rate return distributions.
Longest common subsequence (LCS)
There are several high level representations suggested in the literature to improve the quality
of the measures in general. Examples are the fourier transform (representing time series with best 5-
10 frequencies), wavelets (to capture time-frequency space properties), eigenwaves and local
polynomial models. A good hierarchy for time series representation is given in Lin et al. (2007). One
can find simple explanatory examples of how some quantitative measures fail to capture the similarity
between time series in the literature (see Hoppner, 2002a and Jachner et al., 2007). Therefore,
capturing the similarities as humans do is also a central work for many knowledge discovery
algorithms. Hoppner (2002b) suggests three steps to analyze interdependencies. First step is labeling
(or describing “convex”, “concave”, “convex-concave”, “concave-convex”) numerical values. Next step
is finding the patterns and the last step is deriving rules about pattern dependencies.
One can convert time series to symbolic level and analyze both frequent and infrequent
patterns with the LCS. LCS in general is used to find similar common patterns within symbolic data.
However, it is adapted to find the common patterns of real valued sequences as well. Due to the
properties of exchange rate data, the similarity measure should be robust to noise, support elastic and
imprecise matches. Both dynamic time warping (DTW) and LCS has these characteristics (Vlachos et
al., 2003). However, LCS is very robust and performs better than the euclidian, correlation and DTW
(Vlachos et al., 2002), specifically in noisy environment. Hence, DTW is not included in this study.
LCS is a subsequence, S, of the maximal length between two strings, say A and B. Let,
psssS ,...,, 21 is a subsequence of bothnaaaA ,....,, 21 and
mbbbB ,....,, 21 , where nmp .
Then the mappings are defined as npFA ,...,2,1,...,2,1: and mpFB ,...,2,1,...,2,1: such
that jiFA )( if ji as , (similarly jiFB )( if ji bs ) and mapping functions are monotone strictly
increasing (Hirschberg, 1977). It is then easy to compute the similarity between two strings directly
related with the length of LCS. The degree of similarity is increasing with the length of LCS.
In order to obtain LCSs of exchange rate series, “qualV” package of R program is used.10 If
two series have no common patterns, the distance value is calculated as one and if two series are
exactly equal or one time series contain exactly the other, then this value is calculated as zero.11
1.3 Results
Figure 1.1 shows the cluster dendrogram for LCS.12
10 http://www.jstatsoft.org/v22/i08/. 11 See table B1 in Appendix B for LCS distances.
For an example of the matching of two time series, see Appendix C. 12 In order to check the robustness of our results, we repeated the algorithm for weekly exchange rate series by KS statistic, distance
correlation, correlation, mutual information, maximal information, and euclidian measures. These are given in figures D1 and D2 in Appendix D.

Volume II, Chapter 1 Itir Ozer-Imer and Ibrahim Ozkan
20
Figure 1.1 Weekly exchange rates cluster dendrogram for LCS measure
1- NO (Norwegian krone), DN (Danish krone) and SD (Swedish krona) form the first group that is tied
with high similarities (with 0.24-0.26 distance values).13 These countries formed the Scandinavian
Monetary Union in the past. This result shows that market still treats these currencies as if they are
very similar.
2- AL (Australian dollar), NZ (New Zealand dolar) and CA (Canadian dolar) together with the UK
(British Pound) are behaving similarly. These countries were part of the Dominion of the British
Empire. These are also the commonwealth countries. This is an example of how historical ties play
an important role in exchange rate co-movements. In addition, IN (Indian rupee), MA (Malaysian
ringgit) and SF (South African Rand) behave similar with these currencies. Taking into
consideration the fact that India, Malaysia and South Africa were under the hegemony of the British
Empire in history, this result exhibits a strong evidence of historical ties.
3- HK (Hong Kong dollar), SI (Singapore dollar), TA (New Taiwan dollar), KO (South Korean Won)
and TH (Thai Baht) fit in the same group. Geographical proximity seems to be an important factor
for the similar pattern in their exchange rates although there had been European influence in the
region in history.
4- BZ (Brazilian real) and MX (Mexican peso) exchange rates have strong similarities. These are both
developing countries in Latin America. Interestingly, Euro shares similar exchange rate dynamics
with these currencies. Euro is behaving quite different than the Scandinavian currencies and the
British pound. This may explain why the UK, Denmark and Sweden used the opt-out provision from
the Economic and Monetary Union (EMU).
5- Another interesting similar exchange rate co-movement appears to be the SZ (Swiss franc) and JP
(Japanese yen). Historically, SZ was regarded as safe haven currency. Although JP has not been
13 In order to check whether we can measure those values even though the processes are random walks, we performed a simulation
for different sequence lengths. The result of this simulation together with a short discussion of our LCS results is given in Appendix E.
VZ
EU
BZ
MX
SF
MA
IN
AL
NZ CA
UK
SD
DN
NO
JP
SZ
HK
KO
TA
SI
TH
0.2
0.3
0.4
0.5
0.6
0.7
0.8
Fx Rates: LCS as Similarity
Dis
sim
ilarity
Financial Aspects of Recent Trends in the Global Economy
21
regarded as a safe haven, both currencies are subject to carry trades (Bank for International
Settlements-BIS, 2003)14.
The comparison of the results obtained by LCS distance with those of the widely used
similarity measures clearly shows that LCS produces much better clusters. A brief summary of those
results is as follows:
1- The cluster dendrogram of KS statistic does not make sense, i.e., CA and SI are grouped together,
whereas MX and UK seem to be behaving similarly. It is safe to state that since KS statistic does
not take the time into account, it may not produce sensible results for behavior of time varying
currencies.
2- AL and NZ behave similarly in distance correlation, correlation, mutual information, maximal
information and euclidian dendrograms. However, AL, NZ, CA and UK were the part of the
Dominion of the British Empire and this group of currencies is not identified as co-moving in the
results obtained by these similarity measures as in the case of LCS.
3- Although the behavior of NO, DN and SD are similar in the correlation and euclidian dendrograms
as in the case of the LCS dendrogram, other findings of these measures are less reasonable
compared to the LCS results. For example, it is hard to explain why NO and MX, and BZ and DN
seem to co-move in the mutual information dendrogram. NO and SD behave similarly, DN is close
to this group and it moves closely with SZ in distance correlation and maximal information
dendrograms. Again, when other groups in these measures are taken into consideration, it is
observed that LCS results make more sense compared to these measures.
4- The interdependence between IN, MA and SF is not clearly visible in the findings of these
measures. As an illustrative example, MA and VZ seem to be behaving similarly in the maximal
information dendrogram, and although IN is close to this group, it moves on its own, whereas SF
is not close to this group.
5- In the dendrograms of all these measures, the co-movement of HK, SI, TA, KO, and TH based on
geographical proximity is not observed as precisely as in the LCS dendrogram. Although TA, KO
and TH seem to be behaving similarly in the results obtained by the distance correlation and
euclidian measures, HK is dissimilar to this group and SI seems to co-move with the EU in
distance correlation dendrogram, whereas HK and BZ, and SI and EU form other groups in the
euclidian dendrogram.
6- BZ and MX behave similarly in distance correlation, correlation and maximal information
dendrograms, whereas MX and NO, and BZ and DN co-move in the mutual distance dendrogam,
which are hard to explain. Finally, although MX is close to BZ, BZ co-moves with HK in the
euclidian distance dendrogram.
We examined the annual reports of the BIS, particularly, the foreign exchange market sections
through 2001 to 200815. As put forward in both theoretical and empirical studies of exchange rates, it
is asserted in the annual report of the BIS that “exchange rate movements are notoriously difficult to
14 http://www.moneyweek.com/investments/the-carry-trade-a-tsunami-in-the-making.aspx.
http://www.contrarianprofits.com/articles/why-the-yen-and-swiss-franc-are-great-safe-haven-plays-now/5873. 15 The annual reports of the BIS for the years 2009, 2010 and 2011 do not contain assessments of foreign exchange markets and
the determinants behind exchange rate movements as in the previous years.
Volume II, Chapter 1 Itir Ozer-Imer and Ibrahim Ozkan
22
explain. In particular, it is difficult to find explanations that could be valid for all currency pairs
simultaneously” (BIS, 2001: 85).
Movements of the main currencies seemed to be driven by:
prospective growth differentials, and portfolio and foreign direct investment flows (BIS, 2001: 81);
the prospects for relative economic performance in the main economic areas, monetary policy
decisions and interest rate differentials (BIS, 2002: 79);
interest rate differentials (BIS, 2003: 80);
the external imbalance of the United States, interest rate differentials and exchange rate policies in
Asia (BIS, 2004: 85);
the markets’ focus on the external imbalance of the United States and the role of the dollar in
international portfolios, domestic growth prospects and interest rate differentials and intervention
practices in emerging market countries, particularly in Asia (BIS 2005: 82);
domestic growth prospects and interest rate differentials, the widening external imbalance of the
United States and exchange rate policies and intervention practices in emerging market countries
(BIS, 2006: 84);
the macroeconomic outlook, exchange rate policies and associated intervention (particularly in
emerging market countries in Asia) and global external imbalances (BIS, 2007: 83);
expected growth differentials (BIS, 2008: 75).
In accordance with our results, annual reports of the BIS confirm that CA, AL and NZ behave
similarly. For example, it was observed that these dollar bloc countries depreciated throughout 2000
(BIS, 2001). Although the driving force behind these currencies, namely, commodity prices rose, this
did not support these currencies in 2000. Between early 2000 and late 2001, the traditional positive
correlation between AL, CA and NZ dollars and commodity prices did not hold. In 2000, these
currencies “had weakened to historical (or close to historical) lows even as commodity prices had
risen substantially” (BIS 2002: 87). These currencies depreciated in 2004 as “US monetary policy
markedly reduced the attractiveness of carry trades” (BIS 2004: 88), whereas in 2005 depreciation of
CA against the US dollar, broke the pattern of broad synchronicity with AL and NZ observed in the
past as the latter two appreciated against the US dollar. However, except for 2005, these currencies
displayed highly similar patterns between 2001 and 2008. Several Asian currencies, such as TA, KO,
TH and TA are mentioned together in the BIS reports and again this supports our finding that they
exhibit similar patterns. In 2003, carry trade strategies became attractive given the low interest rate
environments in the economies of the United States, European Union, Japan and Switzerland (BIS
2003: 88). This observation is in line with our result that the JP and SZ fit in the same group.
Interestingly, BZ and SF are mentioned together in the BIS reports (BZ and SF are considered as
emerging markets). Although these currencies are in different groups in our analysis, these two
groups are very close to each other. In 2003, BZ and MX exhibited similar dynamics, both
experiencing significant declines. Although the movements of NO, SD and DN are also taken into
consideration in the BIS reports, the link between those currencies are not as clear as CA, AL and NZ.
As mentioned above, these countries formed the Scandinavian Monetary Union in history.
After comparing the LCS results with those obtained by the commonly used measures and
confirming them with the BIS annual reports, it can be stated that LCS performs better than the other
measures. Below, these results are linked with the well-known exchange rate classifications in the
Financial Aspects of Recent Trends in the Global Economy
23
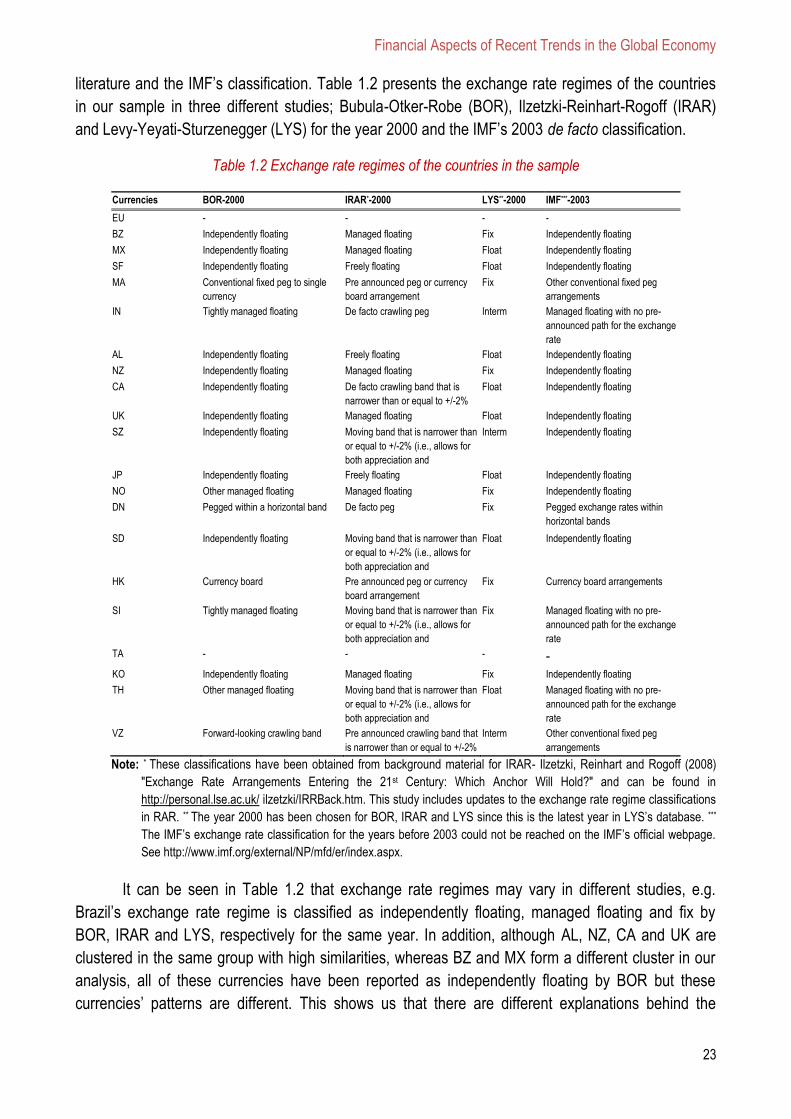
literature and the IMF’s classification. Table 1.2 presents the exchange rate regimes of the countries
in our sample in three different studies; Bubula-Otker-Robe (BOR), Ilzetzki-Reinhart-Rogoff (IRAR)
and Levy-Yeyati-Sturzenegger (LYS) for the year 2000 and the IMF’s 2003 de facto classification.
Table 1.2 Exchange rate regimes of the countries in the sample
Currencies BOR-2000 IRAR*-2000 LYS**-2000 IMF***-2003
EU - - - -
BZ Independently floating Managed floating Fix Independently floating
MX Independently floating Managed floating Float Independently floating
SF Independently floating Freely floating Float Independently floating
MA Conventional fixed peg to single
currency
Pre announced peg or currency
board arrangement
Fix Other conventional fixed peg
arrangements
IN Tightly managed floating De facto crawling peg Interm Managed floating with no pre-
announced path for the exchange
rate
AL Independently floating Freely floating Float Independently floating
NZ Independently floating Managed floating Fix Independently floating
CA Independently floating De facto crawling band that is
narrower than or equal to +/-2%
Float Independently floating
UK Independently floating Managed floating Float Independently floating
SZ Independently floating Moving band that is narrower than
or equal to +/-2% (i.e., allows for
both appreciation and
Interm Independently floating
JP Independently floating Freely floating Float Independently floating
NO Other managed floating Managed floating Fix Independently floating
DN Pegged within a horizontal band De facto peg Fix Pegged exchange rates within
horizontal bands
SD Independently floating Moving band that is narrower than
or equal to +/-2% (i.e., allows for
both appreciation and
Float Independently floating
HK Currency board Pre announced peg or currency
board arrangement
Fix Currency board arrangements
SI Tightly managed floating Moving band that is narrower than
or equal to +/-2% (i.e., allows for
both appreciation and
Fix Managed floating with no pre-
announced path for the exchange
rate
TA - - - - KO Independently floating Managed floating Fix Independently floating
TH Other managed floating Moving band that is narrower than
or equal to +/-2% (i.e., allows for
both appreciation and
Float Managed floating with no pre-
announced path for the exchange
rate
VZ Forward-looking crawling band Pre announced crawling band that
is narrower than or equal to +/-2%
Interm Other conventional fixed peg
arrangements
Note: * These classifications have been obtained from background material for IRAR- Ilzetzki, Reinhart and Rogoff (2008)
"Exchange Rate Arrangements Entering the 21st Century: Which Anchor Will Hold?" and can be found in
http://personal.lse.ac.uk/ ilzetzki/IRRBack.htm. This study includes updates to the exchange rate regime classifications
in RAR. ** The year 2000 has been chosen for BOR, IRAR and LYS since this is the latest year in LYS’s database. ***
The IMF’s exchange rate classification for the years before 2003 could not be reached on the IMF’s official webpage.
See http://www.imf.org/external/NP/mfd/er/index.aspx.
It can be seen in Table 1.2 that exchange rate regimes may vary in different studies, e.g.
Brazil’s exchange rate regime is classified as independently floating, managed floating and fix by
BOR, IRAR and LYS, respectively for the same year. In addition, although AL, NZ, CA and UK are
clustered in the same group with high similarities, whereas BZ and MX form a different cluster in our
analysis, all of these currencies have been reported as independently floating by BOR but these
currencies’ patterns are different. This shows us that there are different explanations behind the
Volume II, Chapter 1 Itir Ozer-Imer and Ibrahim Ozkan
24
determination, co-movement and interdependencies of these currencies and these are not observed
in measures employing standard statistical tools.
1.4 Conclusion
There are various empirical studies on the exchange rate behavior with no common
consensus. It is not reasonable to expect that exchange rates would behave independently in this
world of increasing globalization, deepening financial integration, and in the light of what we have
known for 50 years by the impossible trinity; pegged exchange rate regime, monetary policy
sovereignty and free capital flows. If interdependencies exist in currency movements, trajectories of
exchange rate data should contain this information. Because of these reasons, exchange rate
classifications based on similarities in trajectories would be more efficient since pursuing independent
policies is either very difficult or impossible for countries. Analyzing this very difficult phenomenon of
co-movements and dependencies of currencies requires more flexible pattern recognition techniques.
As discussed in section 1, there have been a few attempts recently. With an application of the pattern
recognition technique, LCS, this study demonstrates that exchange rates have some common
patterns that can be explained by some non-economic factors such as historical ties and geographical
proximity. This study also shows that exchange rate classifications should take the co-movements
(common trajectories) of currencies into consideration, and the similarities in the volatility of exchange
rates can only be a minor part of the analysis since co-movement contains more information than
volatility.
In this study, correlation, brownian distance correlation, euclidian distance, mutual information,
KS test, maximal information, and LCS have been used to assess the co-movements of currencies.
The findings show that LCS produces better and comprehensible results compared to the other
measures. In addition, they make sense when assessed on the basis of the BIS annual reports.
According to the LCS results, exchange rate behavior can be explained by historical ties, geographical
proximity, political isolation, i.e. Venezuela (VZ). Historical ties seems to be the reason for the similar
exchange rate behavior of IN, MA and SF, whereas geographical proximity seems to be the driving
force behind the co-movement of HK, SI, TA, KO and TH. For the similar exchange rate dynamics of
AL, NZ, CA and the UK, historical ties seem to be the common determining factor. NO, DN and SD
were the members of the Scandinavian Monetary Union in history, whereas BZ and MX are both
developing countries in Latin America. Other than these, carry trade strategies seem to be the
common underlying factor for the co-movement of SZ and JP. Some economic factors such as
inflation, commodity prices, interest rate differentials and growth differentials have been mentioned as
the driving force behind the exchange rate behavior in the BIS reports, and the relative importance of
each economic factor changes from one year to another.
We believe the clusters in this study based on the similarity of trajectories preserve essential
information. If there is interdependency between some currencies, trajectory similarity may produce a
signal for the monetary authorities to adapt their policy decisions accordingly. The similarities of
trajectories are also essential from the viewpoint of the OCA theory. Volatility of the real exchange
rates is used as a criterion in the empirical studies of the OCA theory but this measure contains
incomplete information since it is an average of all changes in trajectory. Hence, the natural
Financial Aspects of Recent Trends in the Global Economy
25
candidates for adopting a common currency are the currencies that have common patterns. In
summary, common patterns of exchange rates are vital and reveal important information for the
analyses in the research areas of exchange rate regime choice, monetary policy implementation, and
the OCA theory.
1.5 References
[1] Ammer, J., Cai, F., Scotti, C. (2011). Has international financial co-movement changed? Emerging markets in the 2007-2009 financial crisis. Contemporary Studies in Economic and Financial Analysis, 93: 231-253.
[2] Benediktsdottir, S., Scotti, C. (2009). Exchange Rates Dependence: What drives it? Board of Governors of the Federal Reserve System, International Finance Discussion Papers, Number 969.
[3] Bonfiglioli, A., Favero, C.A. (2005). Explaining co-movements between stock markets: The case of US and Germany. Journal of International Money and Finance, 24: 1299-1316.
[4] Buetzer, S., Habib, M.M., Stracca, L. (2012). Global exchange rate configurations do oil shocks matter?, ECB Working Paper Series, NO 1442.
[5] Bubula, A., Otker-Robe, I. (2002). The evolution of exchange rate regimes since 1990: Evidence from De Facto Polities, IMF WP/02/155.
[6] Calvo, G., Reinhart, C. (2002). Fear of floating. Quarterly Journal of Economics, 47(2): 379-408.
[7] Connolly, R., Stivers, C., Sun, L. (2007). Commonality in the time variation of stock-stock and stock-bond return comovements. Journal of Financial Markets, 10(2): 192-218.
[8] Cover, T.M., Thomas, J.A. (1991). Elements of Information Theory, John Wiley &Sons.
[9] Eichengreen, B., Razo-Garcia, R. (2011). How reliable are de facto exchange rate regime classifications? NBER Working Paper Series, Working Paper 17318.
[10] Fenn, D.J., Porter, M.A., Mucha, P.J., McDonald, M., Williams, S., Johnson, N.F., Jones, N.S. (2012). Dynamical clustering of exchange rates. Quantitative Finance, 12(10): 1493-1520.
[11] Frankel, J. (1999). No single currency regime is right for all countries or at all times, NBER Working Paper 7338.
[12] Galati, G., Melvin, M. (2004). Why has FX trading surged? Explaining the 2004 triennial survey. BIS Quarterly Review.
[13] Ghosh, A.R., Qureshi, M.S., Tsangarides, C. (2011). Words vs. Deeds: What Really Matters? IMF WP/11/112.
[14] Hirschberg, D.S. (1977). Algorithms for the longest common subsequence problem. Journal of the ACM, 24(4): 664–675.
[15] Hochstotter, M., Weskamp, P. (2012). International Co-movement of Equity Markets and Foreign Exchange. Available at https://statistik.ets.kit.edu/download/equity-FX-como_V1.pdf.
[16] Hoppner, F. (2002a). Time series abstraction methods – a survey. http://public.fhwolfenbuettel.de/ ~hoeppnef/paper/Hoeppner-GIWS-2002.pdf.
[17] Hoppner, F. (2002b). Learning dependencies in multivariate time series. Proceedings of the ECAI’02 Workshop on Knowledge Discovery in (Spatio) Temporal Data, Lyon, France, 25–31.
[18] Huang, Q-H. (2011). Discovery of time-inconsecutive co-movement patterns of foreign currencies using an evolutionary biclustering method. Applied Mathematics and Computation, 218: 4353–4364.
[19] Jachner, S.K., Van den Boogaart, G., Petzoldt, T. (2007). Statistical Methods for the Qualitative Assessment of Dynamical Models with Time Delay (R package qualV). Journal of Statistical Software, 22(8): 1-30.
Volume II, Chapter 1 Itir Ozer-Imer and Ibrahim Ozkan
26
[20] Kolmogorov, A.N. (1938). On analytical methods in probability theory (in Russian). Progress of Math. Sci., 5: 5–41.
[21] Kraskov, A., Stogbauer, H., Grassberger, P. (2004). Estimating mutual information. Physical Review E, 69(6): 066-138.
[22] Kuhl, M. (2008). Strong co-movements of exchange rates: Theoretical and empirical cases when currencies become the same asset. Cege Discussion Papers, Number 76.
[23] Levy-Yeyati, E., Sturzenegger, F. (2005). Classifying exchange rate regimes: Deeds vs. words. European Economic Review, 49: 1603–1635.
[24] Li, W. (1990). Mutual information functions versus correlation functions. Journal of statistical physics, 60(5): 823-837.
[25] Li, X-M. (2011). How do exchange rates co-move? A study on the currencies of five inflation-targeting countries. Journal of Banking and Finance, 35: 418–429.
[26] Lin, J., Keogh, E., Wei, L., Lonardi, S. (2007). Experiencing SAX: a novel symbolic representation of time series. Data Mining and Knowledge Discovery, 15(2): 107-144.
[27] Reboredo, J.C. (2012). Modeling oil price and exchange rate co-movements. Journal of Policy Modeling, 34: 419–440.
[28] Reinhart, C.M., Rogoff, K.S. (2004). The modern history of exchange rate arrangements: A Reinterpretation. The Quarterly Journal of Economics, CXIX (1): 1-48.
[29] Reshef, D. N., Reshef, Y.A., Finucane, H.K., Grossman, S.R., McVean, G., Turnbaugh, P.J., Lander, E.S., Mitzenmacher, M., Sabeti, P.C. (2011). Detecting novel associations in large data sets. Science, 334(6062): 1518-1524.
[30] Sanchez, M. (2006). How does information affect the co-movement between interest rates and exchange rates? ECB Working Paper No. 608.
[31] Shannon, C.E. (1948). A mathematical theory of communication. The Bell System Technical Journal, 27(3): 379–423.
[32] Sharif, S., Yusoff, N.S., Djauhari, M.A. (2012). Network topology of foreign exchange rate. Modern Applied Science, 6(11): 35-43.
[33] Simon, N., Tibshirani, R. (2012). Comment on “Detecting novel associations in large data sets.” by Reshef, et al., Science, Dec. 16, 2011. Unpublished manuscript, available at http://wwwstat.stanford. edu/~tibs/reshef/comment.pdf.
[34] Suzuki, T., Sugiyama, M., Kanamori, T., Sese, J. (2009). Mutual information estimation reveals global associations between stimuli and biological processes. BMC bioinformatics, 10(Suppl.1), S52.
[35] Szekely, G.J., Rizzo, M.L., Bakirov, N.K. (2007). Measuring and testing dependence by correlation of distances. The Annals of Statistics, 35(6): 2769–2794.
[36] Szekely, G.J., Rizzo, M.L. (2009). Brownian Distance Covariance. The Annals of Statistics, 3(4): 1236–1265.
[37] Szekely, G.J., Rizzo, M.L. (2010). Rejoinder: Brownian Distance Covariance. The Annals of Statistics, 3(4): 1303–1308.
[38] Takagi, S. (1991). Imperfect information and the co-movement of the exchange rate and the interest rate: a signal extraction approach. International Economic Review, 32(4): 1023-1035.
[39] Tavlas, G., Dellas, H., Stockman, A.C. (2008). The classification and performance of alternative exchange-rate systems. European Economic Review, 52: 941– 963.
[40] Vlachos, M., Gunopoulos, D., Kollios, G. (2002). Discovering similar multidimensional trajectories. Proceedings of the 18th International Conference on Data Engineering (February 26 - March 01, 2002). ICDE. IEEE Computer Society, Washington, DC, 673.
[41] Vlachos, M., Hadjielefttheriou M., Gunopulos, D., Heogh, E. (2003). Indexing multidimensional time series with support for multiple distance measures. In Proc. ACM SIGKDD, pages 216-225.

Financial Aspects of Recent Trends in the Global Economy
27
[42] Wu, A. Y-T., Shen, C-M., Chao, M-F. (2012). Correlation of Currencies in BRICS Countries. Business and Information, C1398- C1412.
*** BIS. (2001). 71st Annual Report. Bank for International Settlements, http://www.bis.org/publ/arpdf/
ar2001e.htm.
*** BIS. (2002). 72nd Annual Report, http://www.bis.org/publ/arpdf/ar2002e.htm.
*** BIS. (2003). 73rd Annual Report, http://www.bis.org/publ/arpdf/ar2003e.htm.
*** BIS (2004). 74th Annual Report, http://www.bis.org/publ/arpdf/ar2004e.htm.
*** BIS. (2005). 75th Annual Report, http://www.bis.org/publ/arpdf/ar2005e.htm.
*** BIS. (2006). 76th Annual Report, http://www.bis.org/publ/arpdf/ar2006e.htm.
*** BIS. (2007). 77th Annual Report, Bank for International Settlements, http://www.bis.org/publ/arpdf
/ar2007e.htm.
*** BIS. (2008). 78th Annual Report, Bank for International Settlements, http://www.bis.org/publ/arpdf/ar
2008e.htm.
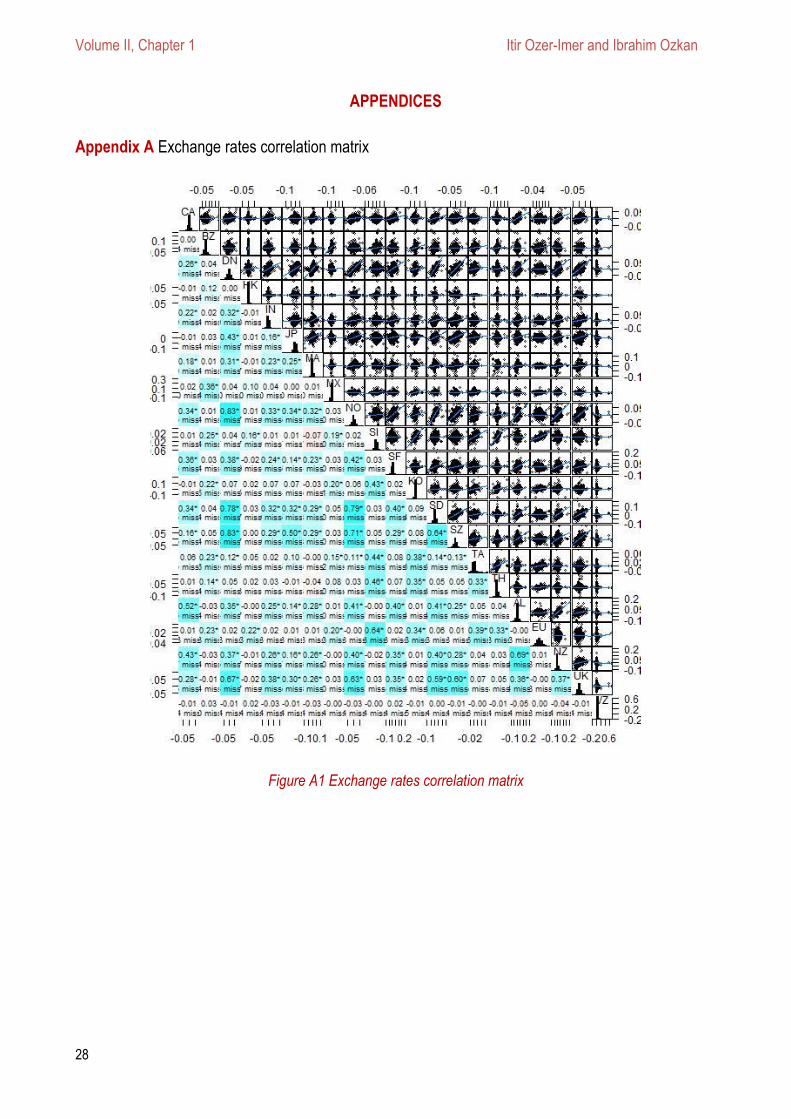
Volume II, Chapter 1 Itir Ozer-Imer and Ibrahim Ozkan
28
APPENDICES
Appendix A Exchange rates correlation matrix
Figure A1 Exchange rates correlation matrix
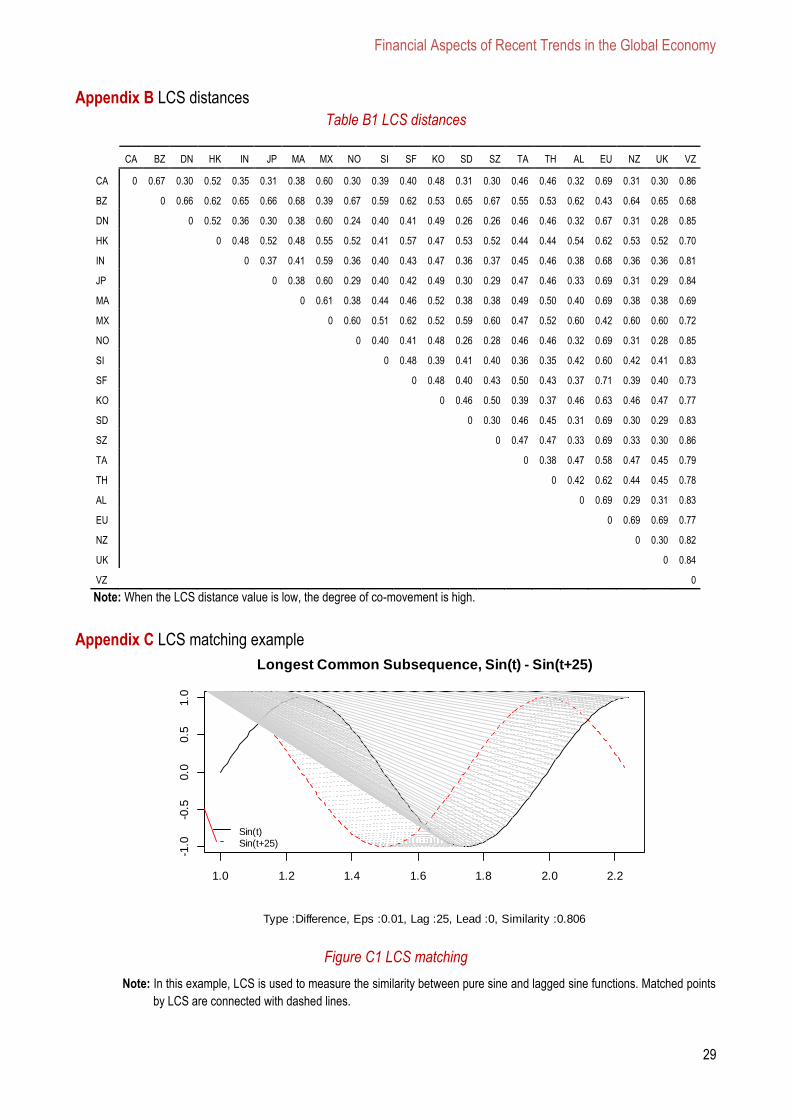
Financial Aspects of Recent Trends in the Global Economy
29
Appendix B LCS distances
Table B1 LCS distances
CA BZ DN HK IN JP MA MX NO SI SF KO SD SZ TA TH AL EU NZ UK VZ
CA 0 0.67 0.30 0.52 0.35 0.31 0.38 0.60 0.30 0.39 0.40 0.48 0.31 0.30 0.46 0.46 0.32 0.69 0.31 0.30 0.86
BZ
0 0.66 0.62 0.65 0.66 0.68 0.39 0.67 0.59 0.62 0.53 0.65 0.67 0.55 0.53 0.62 0.43 0.64 0.65 0.68
DN
0 0.52 0.36 0.30 0.38 0.60 0.24 0.40 0.41 0.49 0.26 0.26 0.46 0.46 0.32 0.67 0.31 0.28 0.85
HK
0 0.48 0.52 0.48 0.55 0.52 0.41 0.57 0.47 0.53 0.52 0.44 0.44 0.54 0.62 0.53 0.52 0.70
IN
0 0.37 0.41 0.59 0.36 0.40 0.43 0.47 0.36 0.37 0.45 0.46 0.38 0.68 0.36 0.36 0.81
JP
0 0.38 0.60 0.29 0.40 0.42 0.49 0.30 0.29 0.47 0.46 0.33 0.69 0.31 0.29 0.84
MA
0 0.61 0.38 0.44 0.46 0.52 0.38 0.38 0.49 0.50 0.40 0.69 0.38 0.38 0.69
MX
0 0.60 0.51 0.62 0.52 0.59 0.60 0.47 0.52 0.60 0.42 0.60 0.60 0.72
NO
0 0.40 0.41 0.48 0.26 0.28 0.46 0.46 0.32 0.69 0.31 0.28 0.85
SI
0 0.48 0.39 0.41 0.40 0.36 0.35 0.42 0.60 0.42 0.41 0.83
SF
0 0.48 0.40 0.43 0.50 0.43 0.37 0.71 0.39 0.40 0.73
KO
0 0.46 0.50 0.39 0.37 0.46 0.63 0.46 0.47 0.77
SD
0 0.30 0.46 0.45 0.31 0.69 0.30 0.29 0.83
SZ
0 0.47 0.47 0.33 0.69 0.33 0.30 0.86
TA
0 0.38 0.47 0.58 0.47 0.45 0.79
TH
0 0.42 0.62 0.44 0.45 0.78
AL
0 0.69 0.29 0.31 0.83
EU
0 0.69 0.69 0.77
NZ
0 0.30 0.82
UK
0 0.84
VZ
0
Note: When the LCS distance value is low, the degree of co-movement is high.
Appendix C LCS matching example
Figure C1 LCS matching
Note: In this example, LCS is used to measure the similarity between pure sine and lagged sine functions. Matched points
by LCS are connected with dashed lines.
Type :Difference, Eps :0.01, Lag :25, Lead :0, Similarity :0.806
1.0 1.2 1.4 1.6 1.8 2.0 2.2
-1.0
-0.5
0.0
0.5
1.0
Sin(t)
Sin(t+25)
Longest Common Subsequence, Sin(t) - Sin(t+25)
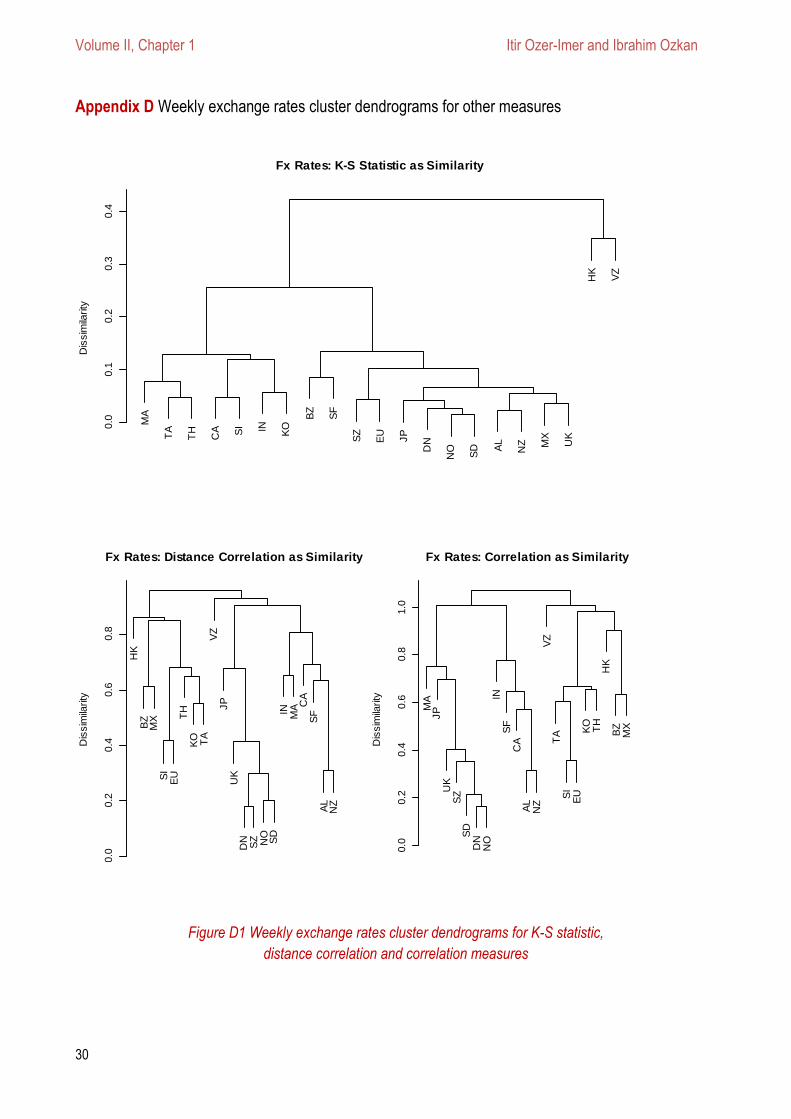
Volume II, Chapter 1 Itir Ozer-Imer and Ibrahim Ozkan
30
Appendix D Weekly exchange rates cluster dendrograms for other measures
Figure D1 Weekly exchange rates cluster dendrograms for K-S statistic,
distance correlation and correlation measures
MA
TA
TH
CA SI IN KO
BZ
SF
SZ
EU
JP
DN
NO
SD A
L
NZ M
X
UK
HK
VZ
0.0
0.1
0.2
0.3
0.4
Fx Rates: K-S Statistic as Similarity
Dis
sim
ilarity
HK
BZ
MX
SI
EU
TH
KO TA
VZ
JP
UK
DN
SZ NO
SD
IN MA C
AS
FA
LN
Z
0.0
0.2
0.4
0.6
0.8
Fx Rates: Distance Correlation as Similarity
Dis
sim
ilarity
MA
JP
UK
SZ
SD
DN
NO
INS
FC
AA
LN
ZV
ZT
AS
IE
UK
OT
HH
KB
ZM
X
0.0
0.2
0.4
0.6
0.8
1.0
Fx Rates: Correlation as Similarity
Dis
sim
ilarity
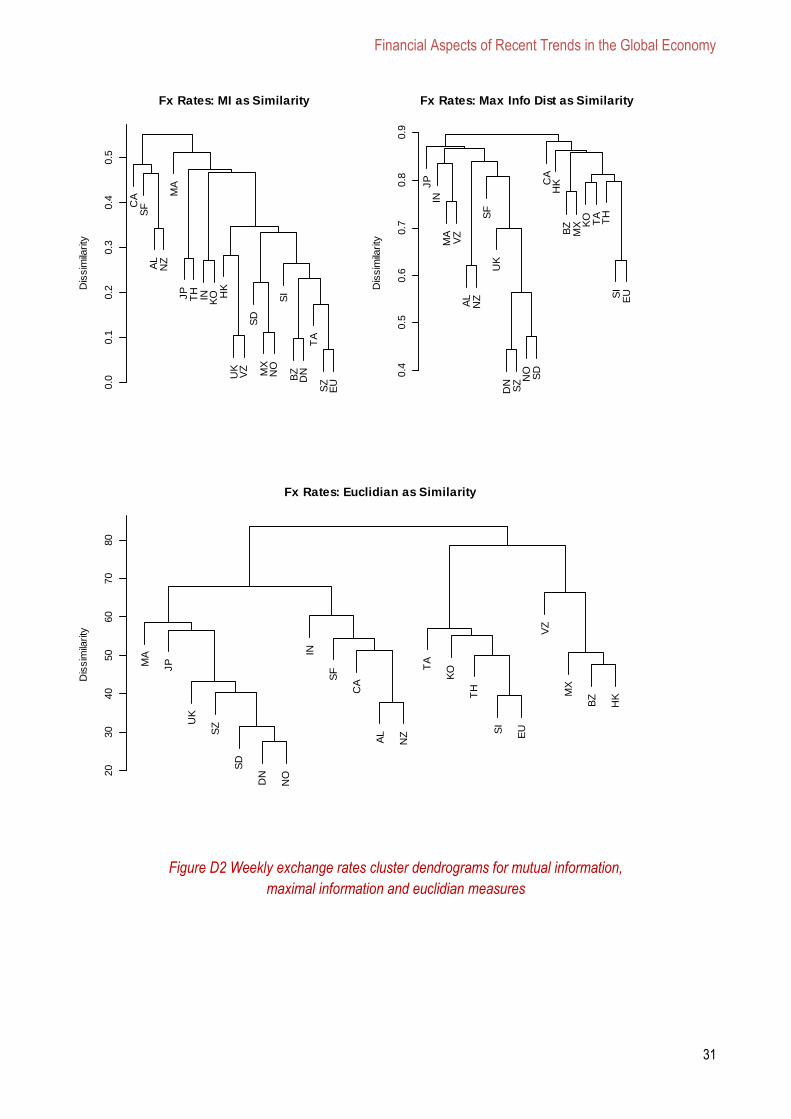
Financial Aspects of Recent Trends in the Global Economy
31
Figure D2 Weekly exchange rates cluster dendrograms for mutual information,
maximal information and euclidian measures
CA
SF
AL
NZ
MA
JP
TH
IN KO H
KU
KV
ZS
DM
XN
OS
IB
ZD
NT
AS
ZE
U0.0
0.1
0.2
0.3
0.4
0.5
Fx Rates: MI as Similarity
Dis
sim
ilarity
JP
INM
AV
ZA
LN
ZS
FU
KD
NS
Z NO
SD
CA
HK
BZ
MX K
O TA
TH
SI
EU
0.4
0.5
0.6
0.7
0.8
0.9
Fx Rates: Max Info Dist as Similarity
Dis
sim
ilarity
MA
JP
UK
SZ
SD
DN
NO
IN
SF
CA
AL
NZ
TA
KO
TH
SI
EU
VZ
MX
BZ
HK
20
30
40
50
60
70
80
Fx Rates: Euclidian as Similarity
Dis
sim
ilarity
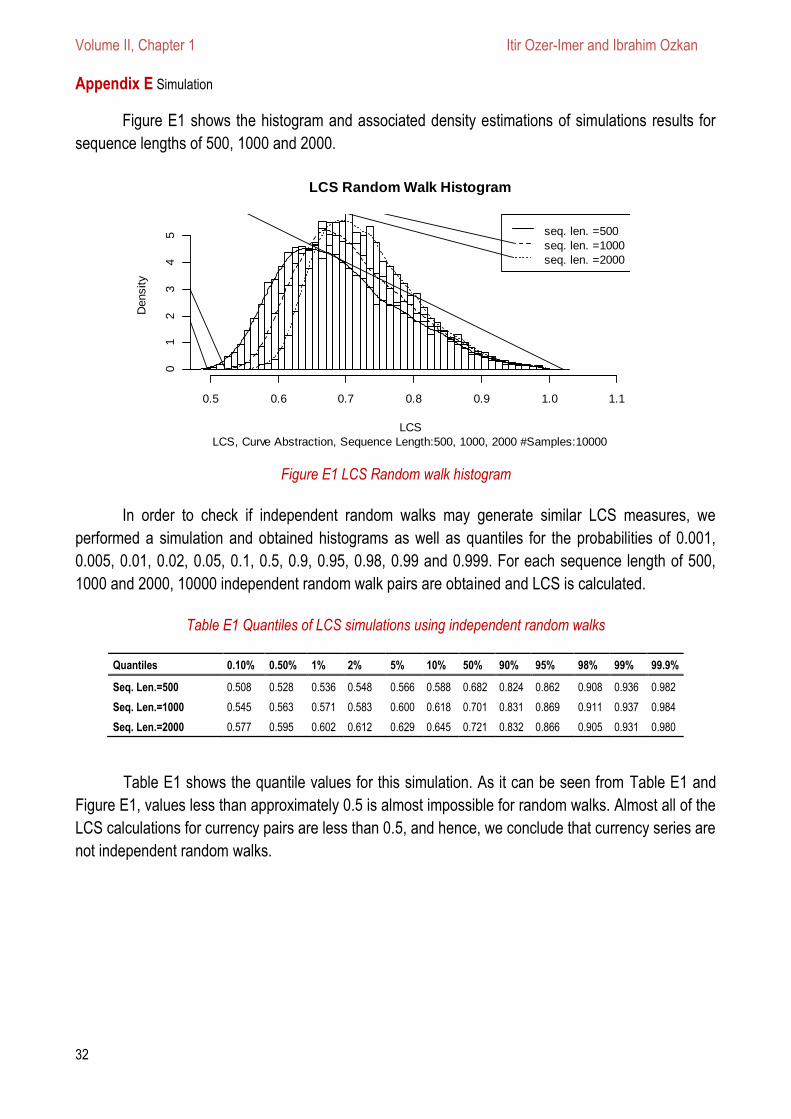
Volume II, Chapter 1 Itir Ozer-Imer and Ibrahim Ozkan
32
Appendix E Simulation
Figure E1 shows the histogram and associated density estimations of simulations results for
sequence lengths of 500, 1000 and 2000.
Figure E1 LCS Random walk histogram
In order to check if independent random walks may generate similar LCS measures, we
performed a simulation and obtained histograms as well as quantiles for the probabilities of 0.001,
0.005, 0.01, 0.02, 0.05, 0.1, 0.5, 0.9, 0.95, 0.98, 0.99 and 0.999. For each sequence length of 500,
1000 and 2000, 10000 independent random walk pairs are obtained and LCS is calculated.
Table E1 Quantiles of LCS simulations using independent random walks
Quantiles 0.10% 0.50% 1% 2% 5% 10% 50% 90% 95% 98% 99% 99.9%
Seq. Len.=500 0.508 0.528 0.536 0.548 0.566 0.588 0.682 0.824 0.862 0.908 0.936 0.982
Seq. Len.=1000 0.545 0.563 0.571 0.583 0.600 0.618 0.701 0.831 0.869 0.911 0.937 0.984
Seq. Len.=2000 0.577 0.595 0.602 0.612 0.629 0.645 0.721 0.832 0.866 0.905 0.931 0.980
Table E1 shows the quantile values for this simulation. As it can be seen from Table E1 and
Figure E1, values less than approximately 0.5 is almost impossible for random walks. Almost all of the
LCS calculations for currency pairs are less than 0.5, and hence, we conclude that currency series are
not independent random walks.
LCS Random Walk Histogram
LCS, Curve Abstraction, Sequence Length:500, 1000, 2000 #Samples:10000
LCS
Density
0.5 0.6 0.7 0.8 0.9 1.0 1.1
01
23
45 seq. len. =500
seq. len. =1000
seq. len. =2000
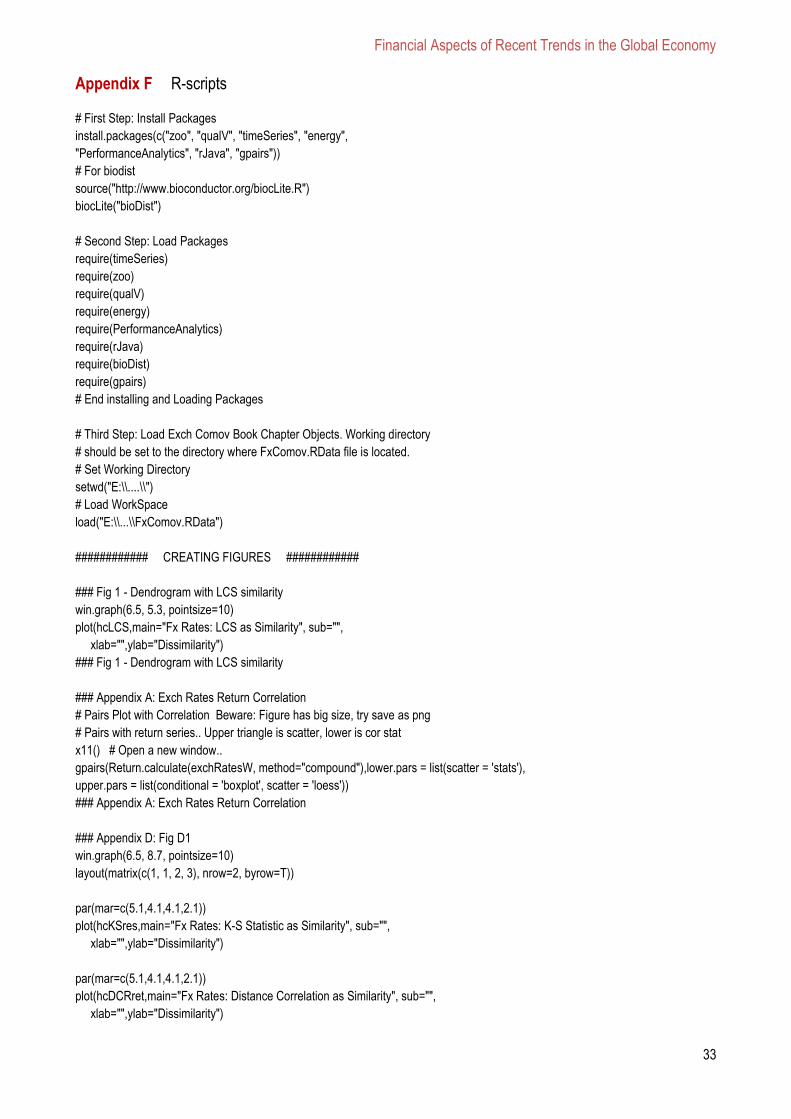
Financial Aspects of Recent Trends in the Global Economy
33
Appendix F R-scripts
# First Step: Install Packages
install.packages(c("zoo", "qualV", "timeSeries", "energy",
"PerformanceAnalytics", "rJava", "gpairs"))
# For biodist
source("http://www.bioconductor.org/biocLite.R")
biocLite("bioDist")
# Second Step: Load Packages
require(timeSeries)
require(zoo)
require(qualV)
require(energy)
require(PerformanceAnalytics)
require(rJava)
require(bioDist)
require(gpairs)
# End installing and Loading Packages
# Third Step: Load Exch Comov Book Chapter Objects. Working directory
# should be set to the directory where FxComov.RData file is located.
# Set Working Directory
setwd("E:\\....\\")
# Load WorkSpace
load("E:\\...\\FxComov.RData")
############ CREATING FIGURES ############
### Fig 1 - Dendrogram with LCS similarity
win.graph(6.5, 5.3, pointsize=10)
plot(hcLCS,main="Fx Rates: LCS as Similarity", sub="",
xlab="",ylab="Dissimilarity")
### Fig 1 - Dendrogram with LCS similarity
### Appendix A: Exch Rates Return Correlation
# Pairs Plot with Correlation Beware: Figure has big size, try save as png
# Pairs with return series.. Upper triangle is scatter, lower is cor stat
x11() # Open a new window..
gpairs(Return.calculate(exchRatesW, method="compound"),lower.pars = list(scatter = 'stats'),
upper.pars = list(conditional = 'boxplot', scatter = 'loess'))
### Appendix A: Exch Rates Return Correlation
### Appendix D: Fig D1
win.graph(6.5, 8.7, pointsize=10)
layout(matrix(c(1, 1, 2, 3), nrow=2, byrow=T))
par(mar=c(5.1,4.1,4.1,2.1))
plot(hcKSres,main="Fx Rates: K-S Statistic as Similarity", sub="",
xlab="",ylab="Dissimilarity")
par(mar=c(5.1,4.1,4.1,2.1))
plot(hcDCRret,main="Fx Rates: Distance Correlation as Similarity", sub="",
xlab="",ylab="Dissimilarity")
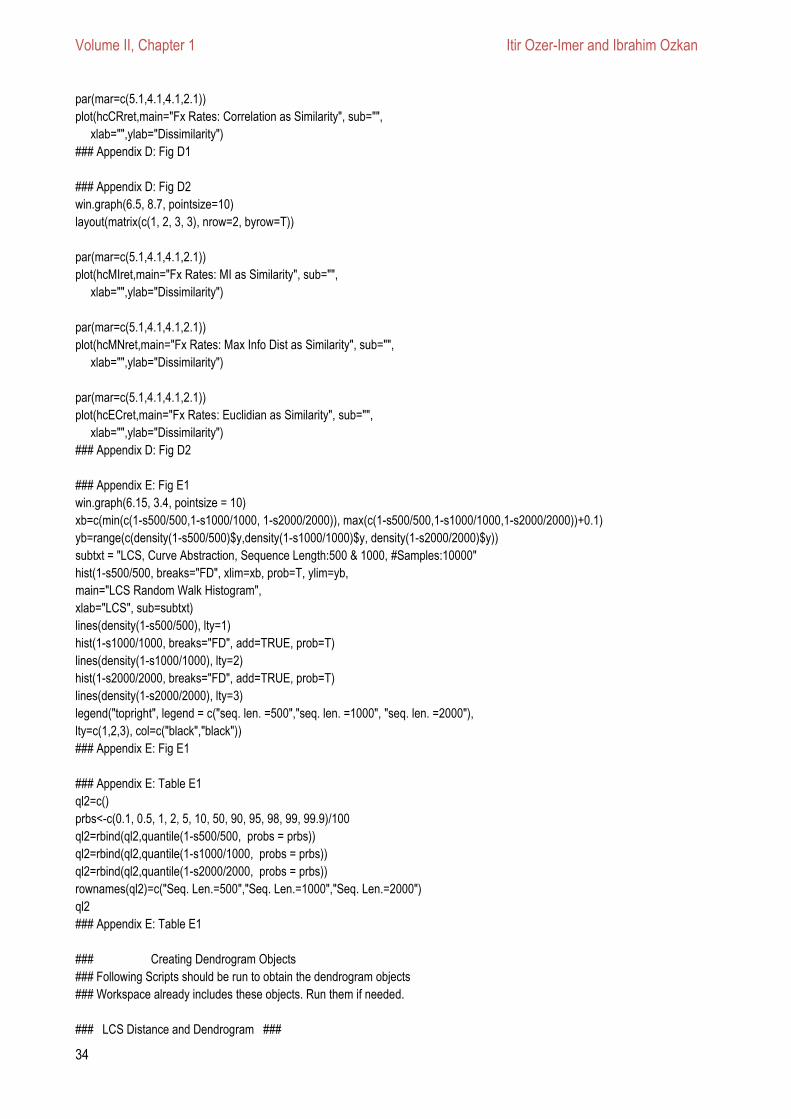
Volume II, Chapter 1 Itir Ozer-Imer and Ibrahim Ozkan
34
par(mar=c(5.1,4.1,4.1,2.1))
plot(hcCRret,main="Fx Rates: Correlation as Similarity", sub="",
xlab="",ylab="Dissimilarity")
### Appendix D: Fig D1
### Appendix D: Fig D2
win.graph(6.5, 8.7, pointsize=10)
layout(matrix(c(1, 2, 3, 3), nrow=2, byrow=T))
par(mar=c(5.1,4.1,4.1,2.1))
plot(hcMIret,main="Fx Rates: MI as Similarity", sub="",
xlab="",ylab="Dissimilarity")
par(mar=c(5.1,4.1,4.1,2.1))
plot(hcMNret,main="Fx Rates: Max Info Dist as Similarity", sub="",
xlab="",ylab="Dissimilarity")
par(mar=c(5.1,4.1,4.1,2.1))
plot(hcECret,main="Fx Rates: Euclidian as Similarity", sub="",
xlab="",ylab="Dissimilarity")
### Appendix D: Fig D2
### Appendix E: Fig E1
win.graph(6.15, 3.4, pointsize = 10)
xb=c(min(c(1-s500/500,1-s1000/1000, 1-s2000/2000)), max(c(1-s500/500,1-s1000/1000,1-s2000/2000))+0.1)
yb=range(c(density(1-s500/500)$y,density(1-s1000/1000)$y, density(1-s2000/2000)$y))
subtxt = "LCS, Curve Abstraction, Sequence Length:500 & 1000, #Samples:10000"
hist(1-s500/500, breaks="FD", xlim=xb, prob=T, ylim=yb,
main="LCS Random Walk Histogram",
xlab="LCS", sub=subtxt)
lines(density(1-s500/500), lty=1)
hist(1-s1000/1000, breaks="FD", add=TRUE, prob=T)
lines(density(1-s1000/1000), lty=2)
hist(1-s2000/2000, breaks="FD", add=TRUE, prob=T)
lines(density(1-s2000/2000), lty=3)
legend("topright", legend = c("seq. len. =500","seq. len. =1000", "seq. len. =2000"),
lty=c(1,2,3), col=c("black","black"))
### Appendix E: Fig E1
### Appendix E: Table E1
ql2=c()
prbs<-c(0.1, 0.5, 1, 2, 5, 10, 50, 90, 95, 98, 99, 99.9)/100
ql2=rbind(ql2,quantile(1-s500/500, probs = prbs))
ql2=rbind(ql2,quantile(1-s1000/1000, probs = prbs))
ql2=rbind(ql2,quantile(1-s2000/2000, probs = prbs))
rownames(ql2)=c("Seq. Len.=500","Seq. Len.=1000","Seq. Len.=2000")
ql2
### Appendix E: Table E1
### Creating Dendrogram Objects
### Following Scripts should be run to obtain the dendrogram objects
### Workspace already includes these objects. Run them if needed.
### LCS Distance and Dendrogram ###
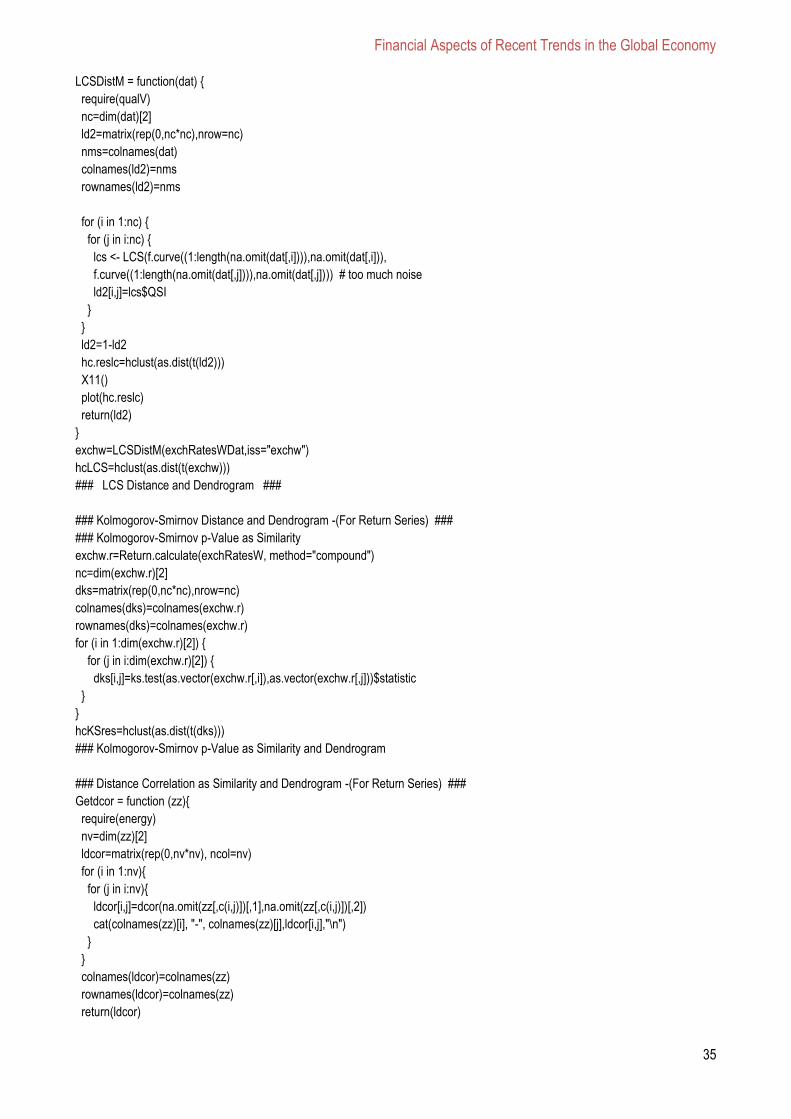
Financial Aspects of Recent Trends in the Global Economy
35
LCSDistM = function(dat) {
require(qualV)
nc=dim(dat)[2]
ld2=matrix(rep(0,nc*nc),nrow=nc)
nms=colnames(dat)
colnames(ld2)=nms
rownames(ld2)=nms
for (i in 1:nc) {
for (j in i:nc) {
lcs <- LCS(f.curve((1:length(na.omit(dat[,i]))),na.omit(dat[,i])),
f.curve((1:length(na.omit(dat[,j]))),na.omit(dat[,j]))) # too much noise
ld2[i,j]=lcs$QSI
}
}
ld2=1-ld2
hc.reslc=hclust(as.dist(t(ld2)))
X11()
plot(hc.reslc)
return(ld2)
}
exchw=LCSDistM(exchRatesWDat,iss="exchw")
hcLCS=hclust(as.dist(t(exchw)))
### LCS Distance and Dendrogram ###
### Kolmogorov-Smirnov Distance and Dendrogram -(For Return Series) ###
### Kolmogorov-Smirnov p-Value as Similarity
exchw.r=Return.calculate(exchRatesW, method="compound")
nc=dim(exchw.r)[2]
dks=matrix(rep(0,nc*nc),nrow=nc)
colnames(dks)=colnames(exchw.r)
rownames(dks)=colnames(exchw.r)
for (i in 1:dim(exchw.r)[2]) {
for (j in i:dim(exchw.r)[2]) {
dks[i,j]=ks.test(as.vector(exchw.r[,i]),as.vector(exchw.r[,j]))$statistic
}
}
hcKSres=hclust(as.dist(t(dks)))
### Kolmogorov-Smirnov p-Value as Similarity and Dendrogram
### Distance Correlation as Similarity and Dendrogram -(For Return Series) ###
Getdcor = function (zz){
require(energy)
nv=dim(zz)[2]
ldcor=matrix(rep(0,nv*nv), ncol=nv)
for (i in 1:nv){
for (j in i:nv){
ldcor[i,j]=dcor(na.omit(zz[,c(i,j)])[,1],na.omit(zz[,c(i,j)])[,2])
cat(colnames(zz)[i], "-", colnames(zz)[j],ldcor[i,j],"\n")
}
}
colnames(ldcor)=colnames(zz)
rownames(ldcor)=colnames(zz)
return(ldcor)
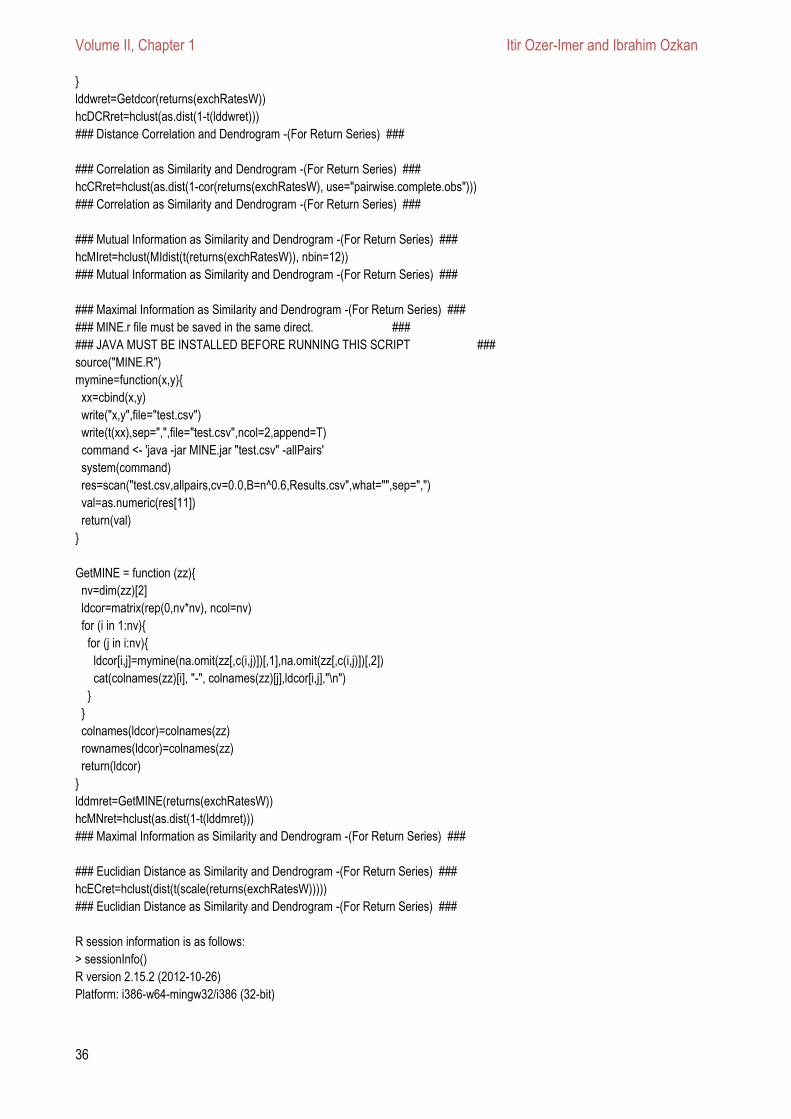
Volume II, Chapter 1 Itir Ozer-Imer and Ibrahim Ozkan
36
}
lddwret=Getdcor(returns(exchRatesW))
hcDCRret=hclust(as.dist(1-t(lddwret)))
### Distance Correlation and Dendrogram -(For Return Series) ###
### Correlation as Similarity and Dendrogram -(For Return Series) ###
hcCRret=hclust(as.dist(1-cor(returns(exchRatesW), use="pairwise.complete.obs")))
### Correlation as Similarity and Dendrogram -(For Return Series) ###
### Mutual Information as Similarity and Dendrogram -(For Return Series) ###
hcMIret=hclust(MIdist(t(returns(exchRatesW)), nbin=12))
### Mutual Information as Similarity and Dendrogram -(For Return Series) ###
### Maximal Information as Similarity and Dendrogram -(For Return Series) ###
### MINE.r file must be saved in the same direct. ###
### JAVA MUST BE INSTALLED BEFORE RUNNING THIS SCRIPT ###
source("MINE.R")
mymine=function(x,y){
xx=cbind(x,y)
write("x,y",file="test.csv")
write(t(xx),sep=",",file="test.csv",ncol=2,append=T)
command <- 'java -jar MINE.jar "test.csv" -allPairs'
system(command)
res=scan("test.csv,allpairs,cv=0.0,B=n^0.6,Results.csv",what="",sep=",")
val=as.numeric(res[11])
return(val)
}
GetMINE = function (zz){
nv=dim(zz)[2]
ldcor=matrix(rep(0,nv*nv), ncol=nv)
for (i in 1:nv){
for (j in i:nv){
ldcor[i,j]=mymine(na.omit(zz[,c(i,j)])[,1],na.omit(zz[,c(i,j)])[,2])
cat(colnames(zz)[i], "-", colnames(zz)[j],ldcor[i,j],"\n")
}
}
colnames(ldcor)=colnames(zz)
rownames(ldcor)=colnames(zz)
return(ldcor)
}
lddmret=GetMINE(returns(exchRatesW))
hcMNret=hclust(as.dist(1-t(lddmret)))
### Maximal Information as Similarity and Dendrogram -(For Return Series) ###
### Euclidian Distance as Similarity and Dendrogram -(For Return Series) ###
hcECret=hclust(dist(t(scale(returns(exchRatesW)))))
### Euclidian Distance as Similarity and Dendrogram -(For Return Series) ###
R session information is as follows:
> sessionInfo()
R version 2.15.2 (2012-10-26)
Platform: i386-w64-mingw32/i386 (32-bit)
Financial Aspects of Recent Trends in the Global Economy
37
locale:
[1] LC_COLLATE=Turkish_Turkey.1254 LC_CTYPE=Turkish_Turkey.1254 LC_MONETARY=Turkish_Turkey.1254
LC_NUMERIC=C LC_TIME=Turkish_Turkey.1254
attached base packages:
[1] grid stats graphics grDevices utils datasets methods base
other attached packages:
[1] gpairs_1.1 vcd_1.2-13 colorspace_1.2-0 barcode_1.1 lattice_0.20-10
[6] bioDist_1.30.0 Biobase_2.18.0 BiocGenerics_0.4.0 rJava_0.9-
3 PerformanceAnalytics_1.0.4.4
[11] xts_0.9-1 energy_1.4-0 MASS_7.3-22 boot_1.3-7 qualV_0.3
[16] KernSmooth_2.23-8 zoo_1.7-9 timeSeries_2160.95 timeDate_2160.97 BiocInstaller_1.8.3
loaded via a namespace (and not attached):
[1] tools_2.15.2
>
Volume II, Chapter 2 Alexis Derviz
38
x
Chapter 2
COLLATERAL COMPOSITION, DIVERSIFICATION RISK, AND SYSTEMICALLY IMPORTANT MERCHANT BANKS
by Alexis DERVIZ
Czech National Bank, Czech republic
Institute of Information Theory and Automation, Czech republic
2.1 Introduction
2.2 Methodological background
2.3 Model
2.4 Calculated equilibria
2.5 Discussion and conclusion
2.6 References
Financial Aspects of Recent Trends in the Global Economy
39
COLLATERAL COMPOSITION, DIVERSIFICATION RISK, AND SYSTEMICALLY IMPORTANT MERCHANT BANKS
Alexis Derviz 16
Czech National Bank, Czech republic
Institute of Information Theory and Automation, Czech republic
Abstract
We study the impact of collateral diversification by non-financial firms on systemic risk in a general
equilibrium model with standard production functions and mixed debt-equity financing. Systemic risk comes
about as soon as firms diversify their collateral by holding claims on a big wholesale (merchant) bank whose
asset side includes claims on the same producer set. The merchant bank sector proves to be fragile (has a
short distance to default) regardless of competition. In this setting, the policy response consisting in official
guarantees for the merchant bank liabilities entails considerable government loss risk. An alternative without
the need of public sector involvement is to encourage systemically important merchant banks to introduce a
simple bail-in mechanism by restricting their liabilities to contingent convertible bonds. This direction of
regulatory policies can be particularly relevant for containment of systemic events in globally leveraged
economies serviced by big international banks outside the host country regulatory control.
Keywords: collateral, diversification, default systemic risk, merchant bank, CoCos.
2.1 Introduction
Financial instability and crises are inseparably tied to the phenomenon of default. A crisis can
start with mass defaults on micro level, as in the US subprime mortgage market breakdown case of
2007. It often results in default, including one of financial intermediaries, as in most manifestations of
the latest financial crisis in the US and Europe following summer months of 2008. At its worse, there is
a vicious circle of defaults involving banks, non-banking private sector and the government, so that
funds borrowed to prevent insolvency in one sector push towards insolvency the one who went to
rescue, as in the current EU periphery sovereign debt impasse. This makes default a natural
candidate for the role of absolute economic evil and the main adversary of prudential policy.
However, as if totally unaware of this dismal record, the available economic theories of default
offer a much less dramatic picture. Agents enter into debt contracts conscious of the possibility that
the payment obligation will not be honored, and there is a whole spectrum of methods, from
elementary to highly sophisticated, describing how the non-payment contingency can be reflected in
the price of a debt claim. In popular terms, forewarned should be forearmed, so, where are the arms
of rational creditors? If default is so universally bad, why are there perfectly sensible theories telling us
how the debtor chooses to default optimally, or how the creditor optimally calls an insolvency
procedure in advance of a credit event? Unfortunately, economics has not yet developed a
16 Alexis Derviz, Principal Economist at Czech National Bank, Monetary and Statistics Department, Na Příkopě 28
115 03 Praha 1, Czech republic; Research Fellow at Institute of Information Theory and Automation, Department of Econometrics, Czech republic
Volume II, Chapter 2 Alexis Derviz
40
comprehensive picture of default costs, their genesis, structure or ways of containment. These
matters are mainly explored by practitioners. From the point of view of the latter, including
policymakers, the disastrous effect of default on economic activity and welfare comes from two
sources: legal complexity of debt workout procedures and destruction of value, such as human capital
and other assets, as a result of forced changes of ownership and control. Neither of the named areas
is sufficiently investigated by mainstream financial economics whose language is usually employed to
formulate policy. Therefore, there is not much more than a general understanding that both private
and social default costs are significant enough to be acted against. This understanding has a very
long tradition and may have been the principal force behind the custom, existing since ancient times,
of equipping loan agreements that showed a material default probability, with the provision of recourse
to collateral. Accordingly, without dwelling excessively on the question why, economics of debt and
investment includes collateral as a standard element of its models. As an unintended consequence,
since financial crises same as their spillovers to the real economy are crises of risky debt and the
latter has collateral attached to it (with the objective to reduce risk), what we face are, essentially,
crises of collateral markets. This observation has been gradually finding its way into formal theory in
works of Morris and Shin (2004), Brunnermeier and Pedersen (2009) and Geanakoplos (2010),
among others.
No matter how much an in-depth theory of default involving collateral processing would be
welcome, our objective here is more modest and goes in a somewhat different direction. Taking as
given the lesson that factors relevant for collateral price movements matter substantially for the
economy as whole, we would like to examine in what ways the heterogeneous collateral and the origin
of its different subspecies, can generate sources of systemic risk. This is a question earlier models did
not cover sufficiently. For an answer, we will employ a formal approach much more explicit than the
extant macroeconomic models (mainly DSGE) have been used to.
The rest of the chapter is organized as follows. In Section 2.2, we give a formal outline of the
problem, our solution approach and put both in the context of existing literature. Section 2.3 describes
the model. Section 4 reports results of numerical experiments of different merchant bank liability
regimes. Section 5 discusses implications of these simulation results in more detail and concludes.
2.2. Methodological background
What we work with is, essentially, a model of production financing in which the Modigliani-
Miller law does not hold for capital scarcity reasons. Those who have the knowledge and authority to
invest (firm shareholders) do not have own funds whereas those who can bring investors and
production opportunities together (merchant banks) first need to convince at least some of the
potential investors to become depositors as well, since there is no one else to turn to. However, no
one can deposit enough without borrowing from some other party (commercial banks) first, and such
loans are risky. This economy can only operate with leverage, and with leverage comes a systemic
risk threat.
It turns out that, in a fairly standard model of debt-financed producer choices under
uncertainty, the threat of a systemic collateralization breakdown is not just conceptually, but also
Financial Aspects of Recent Trends in the Global Economy
41
quantitatively, significant. To see this, one only needs to recognize and implement in the model a few
notoriously salient stylized facts.
First, firms and their managers do not normally engage in outside equity investment of their
own. Particularly, when they decide to purchase liquid collateral other than a sight deposit, they have
no other choice than to become clients of the investment banking industry. Second, investment
banking tends to be oligopolistic with marked economies of scale. This property is usually explained,
among other things, by diversification benefits positively related to size, soft “closed club” human
expertise of investment monitoring and information processing, or high fixed costs involved,
sometimes also by political clout going hand in hand with network externalities. In any case, and
despite turbulent structural overhauls they regularly go through, mature financial centers catering to
corporate clients are invariably dominated by a few big companies, for which we will employ the term
merchant bank17. Third, no matter how much the merchant bank would like to fund its liabilities by a
well-diversified asset portfolio, in a globalized (i.e. essentially closed) economy it cannot avoid buying
liabilities connected to, ultimately, the same universe of firms whose deposit money it accepts. The
chain from some firm’s excess cash invested in a merchant bank CD to a private equity fund holding
shares of that very firm may have multiple links, but it can be invariably traced down. Accordingly, by
aggregating the merchant bank sector into one entity and inspecting that entity’s balance sheet, we
feel it justifiable to stylize the analysis, initially, to the case of just a few firms (we will have two in the
quantitative examples of this chapter) holding claims on one merchant bank who, in its turn, holds a
tangible portion of equity of those same firms.
Not surprisingly, in such an environment, the aggregate productivity threshold below which
there comes default of the merchant bank is much higher than the same threshold for an individual
producer. The merchant bank has to pay sufficiently high deposit rates to its investors to be attractive
as a collateral provider. Therefore, there is a clear bound to the merchant bank profit regardless of
competition in the industry. The situation of a commercial bank lending to the same producers is
qualitatively different, as its market power depends mainly on informational exclusivity in relation to
the client and is only limited by the productivity characteristics of the latter.
The merchant bank can offer claims on itself as diversified collateral to the firms only as long
as it is solvent, but the solvency buffer size, i.e. the merchant bank profit, is limited by the need to
make collateral worthy. Consequently, diversified collateral in the form of deposits (or bonds) is much
more susceptible to systemic impairment than liabilities of standalone producers. Under this structure
of financial services, the more one tries to diversify the more fragile leverage one creates, and the
harsher are the aggregate consequences.
Can there be a remedy, particularly assisted by an appropriate policy? The most immediate
one (also tried many times) would be an official guarantee of the merchant bank liabilities. However,
the fiscal costs may be untenable, as the Irish and Spanish examples of these days make clear.
Naturally, going back to default treatment in the earlier mainstream microeconomics, a merchant bank
default would be no problem at all if its pecuniary implications were transferred one-to-one to the
ultimate creditors and did not receive an institutional spin in the form of value-destroying bankruptcy
17 Our use of the term is motivated by its inclusiveness in the sense that features like catering to the corporate sector instead of retail
clients, cross-border operations, involvement in private equity investment and substantial market power are, or were in the past, all typical for this financial institution variety. A historical overview of the subject can be found in, e.g. Craig (2002).
Volume II, Chapter 2 Alexis Derviz
42
procedure. In a frictionless world, this could be achieved if the merchant bank were mandated to issue
only equity as liabilities. Still, merchant bank equity may be unsellable to firms for reasons already
explained in Townsend’s (1979) costly state verification (CSV) model: impossibility for a small
shareholder to establish the appropriate value of the dividend that a big and complex merchant bank
owes him. Therefore, we suggest an alternative, equally inspired by Townsend (1979) as well as the
Black-Scholes (1973) and Merton (1974) treatment of risky company debt. Recall that under the
Black-Scholes-Merton approach the company assets in default are transferred one to one to the
creditor. The same thing happens under the debt contract considered in Townsend (1979). This is
tantamount to the creditor becoming a shareholder. The resulting liability is a fixed-income debt
instrument in good times and equity in bad times, i.e., essentially, a convertible bond. An important
formal difference with the classical understanding of the latter is that its covenant makes conversion
the decision of the holder. In our setting, the conversion trigger is exogenously tied to the merchant
bank solvency (the current model is sufficiently simple in this respect, so that one can assume
automatic conversion whenever the bank is unable to pay the original deposit rate, without further
procedural details). This means that our construction is, essentially, a variety of the so-called
contingent convertible (CoCo) bond. In our view, the most important advantage of this bond covenant
is that a shareholder of a living company has a much stronger legal standing in what concerns state
verification than a creditor of a defaulting company. So, the key statement we want to exemplify with
our formal exercise is that an insolvent merchant bank should not be sent into bankruptcy but rather,
exchange its fixed income liabilities for shares and then distribute whatever (little) it actually earned
among the old and new shareholders. In this way, consequences of an adverse aggregate productivity
shock will not be avoided. They will still be borne. However, in our model of merchant bank bond
conversion they only have a one-to-one impact on firm owners whereas in a pure deposit-taking
merchant bank facing insolvency they are expanded. Additional losses emerge either because of a
system-wide shock due to debt workout delays and destruction of value (if the merchant bank is
allowed to fail) or in view of a heavy fiscal burden (if official deposit guarantees are given).
Accordingly, risks will be diversified as long as they are really diversifiable and not just be different
labels of an aggregate risk common to everybody (as in a systemic shock case), whereas the costs of
the latter will be distributed predictably among firm owners without a legal breakdown.
Firms that hold liquid assets in parallel with using bank loans are a well known phenomenon. It
was studied theoretically in the context of credit constrained neoclassical economy by Woodford
(1990), and there has been substantial theoretical and empirical literature in the same vein since then
(see, e.g., Bacchetta and Benhima, 2010, for further references). Diversification leading to the
opposite of its initial goal, i.e. risk concentration, has been quantitatively examined by, e.g., Ibragimov
et al. (2011) and a host of earlier papers cited therein. However, these models are almost purely
probabilistic and have but a rudimentary economic structure (i.e. no distinction between agent roles or
between equity and debt, etc.). In our approach, diversification curse is accommodated in a standard
choice-theoretic environment of a production economy.
Financial Aspects of Recent Trends in the Global Economy
43
2.3. Model
2.3.1 The economy
Agents of this economy include firm shareholders, firm managers, workers, commercial banks
and merchant banks. In the baseline setup, there will be two firms with one shareholder, one manager
and one worker in each, two commercial banks and one merchant bank. Investment opportunities
include firm stock (available to the merchant bank), bank loans (available to the commercial banks)
and claims on the merchant bank in deposit form (available to the two firms’ shareholders).
A household sells one unit of labor to his firm. A shareholder owns an exogenous endowment
of stock in his firm, measured in the same units as physical capital and transferrable between the
latter and deposits in the merchant bank, at no cost. Firm managers hire labor, borrow from
commercial banks and split the loan proceeds between wage expenditure and purchase of physical
capital in access of the quantity provided by the shareholder. The merchant bank purchases private
equity partnerships in both firms with funds raised as deposits; it can also invest in the world market
(outside the examined economy) at a fixed positive rate.
There are two periods. In the first, labor hiring and pre-paying, borrowing and investment
decisions are made, in the second, the production output is sold and the revenue distributed between
the borrowers and the lenders, and other investment returns paid out.
The producer has a Cobb-Douglas production function
1( , )Af k m ALk m , (2.1)
in which k is physical capital, m is labor, L is a private total factor productivity (TFP) component, and A
is an aggregate TFP component. We think of the situations in which A is a random variable with
known distribution, whereas L is either a simple scaling constant (benchmark case) or a firm-specific
parameter with each of a large set of small firms identified by their individual L-values.
Capital is released after the end of the production cycle, but its transformation from producer-
specific to generally usable state is costly. For each quantity k leaving the production facility one gets
(1-t(k))k marketable units for further use. The structure of capital transformation function t is as
follows:
( ) ( )t k k , (2.2)
where positive constant is the conventional depreciation rate and a strictly increasing function
((0)=0, (k)>0 for all k>0) stands for increasing “capital dismantling” costs. That is, can be
considered a reverse of the traditional capital installation cost function. If the firm defaults (see later),
(1-t(k))k is added to the collateral seized by the lender, if it survives, this term is a part of the
shareholder revenue (“EBIT”). Thus, EBIT comprises
( , ) 1 ( )Af k m t k k ,
and one other term to be described below.
Volume II, Chapter 2 Alexis Derviz
44
We assume a competitive labor market with labor force supply normalized to unity for each
firm (if there are many firms, one has to assume some form of firm-specific skills; in that case, m
becomes more a variety of human capital than classic unskilled labor). Labor market competitiveness
means that workers are paid the marginal product of labor as wage, and the wage expenditure is
subtracted from the firm revenue. To avoid dealing with wage settlements in a defaulting firm, we
assume that the whole wage bill is paid in advance in period 1, for which purpose the firm borrows the
whole amount bm from its “house” bank (working capital loan).
The labor market does not play any significant conceptual role in this model, but it is
necessary for calibration purposes. With a single-input production function, one would have obtained
unrealistically high marginal products of capital as well as interest rate levels, and also have had
difficulties generating reasonable default rates.
Remark The present version is in two periods. In a multi-period variant, interpretation of m as
skilled labor (firm-specific human capital) could be used to augment default costs in welfare terms with
the corresponding loss of accumulated human capital. This feature might add rationale to policy trying
to reduce default frequency.
2.3.2 Borrowing, collateral, and default
Physical capital is financed by both equity and bank debt. If q is the amount available as equity
(the equity market shall be defined separately), then
kk q v b (2.3)
Here, bk is the amount borrowed to co-finance physical capital purchase. We have already
introduced another component of bank debt, bm, needed to pay labor force wages. Thus, the total loan
size is b=bk+bm.
The remaining term on the right hand side of (2.3), v, is the amount set aside by the controlling
shareholder as a source of additional collateral in excess of (1-t(k))k. This quantity (we call it
diversified collateral) is invested outside the firm to generate a buffer formally unrelated to the
company’s own production. (Note that “unrelated to” does not always mean “independent of”, since,
under systemic events, as we shall see, the dependence comes about.) When v=0, the only collateral
the firm has comes from its own output and (dismantled) physical capital. When v>0, the collateral is
augmented by (1+io)v, where io is the rate of return that can be earned on v in financial markets
through the merchant bank. In a surviving firm, (1+io)v is a part of its revenue. We set the maximal
allowed value of v equal to q in order to exclude cases of unlimited leverage out of bank-lent funds.
When v=q, the firm only finances physical capital out of its bank loan while spending the totality of its
equity capital on collateral diversification. Such a behavior, if shared by all producers, generates the
maximum admissible degree of leverage in the economy.
The firm pays the shareholders dividends defined as:
( ) max ( , ) 1 ( ) (1 ) (1 )( ),0o k my A Af k m t k k i v r b b , (2.4)
Financial Aspects of Recent Trends in the Global Economy
45
under constraint bk=k-q+v. In a defaulting firm, Af(k,m)+(1-t(k))k+(1+io)v is treated as collateral seized
by the bank. This definition of collateral is a synthesis of the Classical Black-Scholes-Merton one
(Black and Scholes, 1973, Merton, 1974), later taken over by Bernanke, Gertler and Gilchrist (1999)
and supported by Townsend’s (1979) CSV analysis, and the Kiyotaki-Moore (1997) concept, also
widely used in models created by Geanakoplos (cf. Geanakoplos, 2010, and references to his earlier
papers therein). The “Merton part” is formed by the output plus released physical capital, Af(k,m)+k.
We have added the -kt(k) term to account for the difference between firm-specific and general
collateral, important both conceptually and quantitatively. The term (1+io)v is the “Geanakoplos part”,
potentially liquid but subject to random swings in value. In a multi-period model, this part would be the
source of collateral cycle and, given a systemic event, the debt deflation effect.
The firm either survives or defaults depending on the realized total factor productivity A.
Survival is equivalent to the firm’s EBIT exceeding its debt service:
( , ) 1 ( ) (1 ) (1 )o k mAf k m t k k i v r b b . (2.5)
This happens if and only if the realized A exceeds the threshold value:
1
(1 ) 1 ( ) (1 )k m o
dr b b t k k i v
ALk m
. (2.6)
If the realized A is below Ad, the firm defaults and the bank seizes EBIT, whereas the firm
shareholders get nothing. There are situations in which Ad is negative (typically, this means very
strongly capitalized firms in an environment of low lending rates), in which case survival is a certainty.
2.3.3 Investment and labor hiring decisions
Let us denote the p.d.f. of aggregate TFP factor A by and introduce the notation:
A
dSSA )()( ,
A
dSSSA )()( , for A0.
That is, +(A
d) is the survival probability of the firm and +
(Ad) is the expected TFP of
surviving firms. Another piece of notation to be used in the sequel is:
( )( )
( )
AA
A
-
the average TFP-value of a firm conditioned on it exceeding A.
For future use, we also introduce the notation for the cumulative distribution of A (i.e.
+(A)=1-(A)) and -
- for the expected TFP of defaulting firms (i.e. )()( AAA , A being
the unconditional mean of A).
We assume a hired manager remunerated in proportion with the firm’s dividend (i.e. the
manager receives 0 if the firm defaults). This assumption is made to avoid complications with agency
Volume II, Chapter 2 Alexis Derviz
46
problems between the shareholder and the manager. Also for the sake of simplification, we assume
manager risk-neutrality.
The manager takes the level of equity q, the diversified collateral v, the lending rate r and the
wage level as given and decides upon labor hiring and investment in physical capital k (which, for him,
becomes equivalent to setting the size of the bank loan). Due to risk-neutrality, the chosen k- and m-
levels must satisfy the first order conditions:
( , ) ( ) ( )d dkA f k m A r t k kt k
, (2.7a)
( , ) (1 )d dmA f k m A r w , (2.7b)
where w is wage, paid, as was agreed, out of the bank loan in advance of production (that is why
(2.7b) contains the lending rate factor 1+r). Accordingly, bm=wm and
( , ) (1 )d mmA f k m m r b .
In the case of Cobb-Douglas production, this fact allows one to eliminate the labor market
variables from further calculations completely. Recall that we normalize the labor input to unity,
therewith pinning the wage level down.
2.3.4 Bank loans
Jointly, production decisions (2.7) determine the demand B(r) for loans (parameters on which
B depends beside r are omitted for simplicity). On the credit supply side, a commercial bank is
assumed to enjoy market power over borrower (e.g. due to a borrower hold-up problem of the
Diamond-Rajan type, cf. Diamond and Rajan, 2000, as the firm cannot credibly communicate its
productivity type to outsiders). The base funding cost for the bank is denoted by i. To endow credit
supply side with some realistic elasticity, we assume that there is also a non-linear component of the
funding cost, e.g. quadratic of the form
2
0)(
2
q
yvrBa, (2.8)
which is added to the linear component (1+i)B(r) and puts an additional brake on borrower leverage
expansion in excess of some exogenous reference level. Here, we have set the driving variable of this
brake as the ratio of the debt in excess of the diversified part of the collateral plus a reference output,
y0, over the equity value. The exogenous parameters appearing in (2.8), namely, y0 and a positive
constant a, originate in macroprudential regulation.
We will denote by hats the variables (such as physical capital and production level) chosen
optimally by the borrowing firm. A risk-neutral bank announces r taking into account the loan demand,
its funding costs, and the equity value of the loan applicant. Altogether, the bank maximizes the
expected profit from the loan given by:
Financial Aspects of Recent Trends in the Global Economy
47
2
0( )ˆ ˆ ˆˆ ˆ ˆ1 1 (1 ) ( ) (1 ) ( )2
d d o d B r n yaA f A t k k i n A r B r i B r
q
2.3.5 Choice of collateral diversification
We assume that the shareholder sets aside the preferred quantity of diversified collateral, v, in
advance of all other decisions in the first period. Generically, varying v from zero to q, one obtains
increasing total output, but decreasing expected dividend. The former property is the consequence of
higher debt levels under higher v, cf. (2.3): whereas physical capital k is determined “technologically”
by the hired manager according to (2.7a), there is less equity to finance it if q is diverted towards v.
Consequently, the firm must borrow more and the debt service component of output goes up.
Declining dividends are a consequence of higher debt service. As a result, the firm manager and the
shareholders would prefer no collateral diversification at all (at least as long as they do not internalize
the effect of their financial decisions on the lending rate). On the contrary, both banks and the GDP-
valuing social planner would prefer maximal diversification. However, if the social planner overlooks
the systemic consequences of collateral funds being invested in the same type of assets (firm equity
directly or through further intermediaries such as the merchant bank in our case), she runs the risk of
magnifying a systemic crisis which might emanate from, e.g., an adverse shock to aggregate TFP.
Actually, a regulatory omission is easy since, whilst collateral in the form of the firm’s physical assets
is generally regarded as highly illiquid, window-dressing v can create a powerful illusion of collateral
liquidity.
Since firms are unable to engage in equity trade of their own, they need expert intermediaries.
Intermediaries accumulate assets which, as they may erroneously believe, play the role of risk
diversifiers.
Having both equity and debt investment financing is important while we want to consider a
case of limited (or, at least, highly elastic) supply of equity capital. That this intention has good
grounds can be validated ex post in our setting if one considers a standard stock market populated by
traditional small moderately risk-averse equity investors. Then it turns out that in many situations such
a market, acting on the usual limited information about the producer technology, is only able to
provide for a portion of the needed capital, the rest being necessary to have available as either an
exogenous foundation stock, private partnership or bank loan. In other words, quite often, there does
not exist an equilibrium based predominantly on publicly traded stock able to complement a small
level of private equity participation. These are the cases when a merchant bank can fill the gap.
2.3.6 Merchant banks, equity partnerships
The basic arrangement to be considered here for the merchant bank is to take deposits from
both firms. These deposits constitute its liability side. On the asset side, the merchant bank acquires
shares of the same two firms in the form of a partnership or private equity participation. One should
remember that the abstract merchant bank construction here impersonates the whole global
investment banking sector. Inside this aggregate construction with its consolidated balance sheet,
Volume II, Chapter 2 Alexis Derviz
48
individual institutions hold claims on others from the same set, so that the balance sheets of
constituent parts are strongly interconnected. Shin and Shin (2011) argue that growth of these non-
core bank liabilities (they also include foreign liabilities in the same non-core group) indicate a nascent
credit bubble. This view can be made consistent with our own if we agree that a high weight of non-
core bank liabilities is just the reverse side of concentrating non-financial corporate sector non-core
(outside collateral in our terms) assets within one highly specialized branch of the financial industry,
which is represented by the merchant bank in the model.
Being a big company, the merchant bank acquires a stock sufficient to influence the marginal
product of capital in any firm it buys itself into. For simplicity, we assume a risk-neutral merchant bank,
as would be natural to expect from a manager of a large enterprise. In any case, risk attitudes of
merchant banks are not our prime concern here.
The firm is controlled by two agents: the holder of the foundation stock, which we consider an
exogenous initial endowment, and the merchant bank purchasing a partnership. One can think of
many variants as to how the stock is split between the two, e.g. depending on the relative negotiation
power. Namely, the optimal size of private partnership from the viewpoint of the foundation stock
holder is normally smaller than the optimal size from the merchant bank (incoming partner)
perspective. In order not to complicate matters with the issue of bargaining between shareholder
incumbents and newcomers, we assume throughout that the two are always able to agree on the
partnership size that maximizes the producer’s expected output when the amount and cost of credit
(commercial bank loan size and the lending rate) are given. This is what would happen if the
representative shareholder played a symmetric information simultaneous-move game with the firm
manager (recall that the latter, in his turn, is assumed to take the equity capital size as given).
We assume that the merchant bank has just one other investment opportunity beside equity
partnerships in the two firms. This outside investment has the form of a homogeneous asset paying
net return i0 on a unit of investment. Since, in order not to complicate matters with the merchant bank
risk management decisions, we will deal with risk-neutral merchant banks in this chapter, it is
irrelevant whether i0 is deterministic or stochastic. So, we take it to be a mean net return. Recall that
the merchant bank and the incumbent shareholder take the borrowing decision of the manager as
given. The initial stock qh given exogenously, and taking into account the first order conditions (2.7) of
the production input optimization, they should jointly optimize the size of merchant bank’s private
partnership, qp, to satisfy the following simple first order condition:
0( ) (1 ) 1d h pA q q r i . (2.9)
Here, the default threshold Ad defined in (6) is considered a function of total equity capital
qh+qp=q (recall that physical capital is given by k=bk+q-v, v has been pre-defined by the shareholder,
cf. 2.5, b=bm+bk is chosen by the manager and bm is pinned down by (2.7b)).
When there are just two ex-ante identical firms, the v value of one becomes the qp-value of the
other, and vice versa. In this chapter, we restrict attention to this symmetric case.
Financial Aspects of Recent Trends in the Global Economy
49
2.4 Calculated equilibria
Let us start with the case in which the merchant bank pays the agreed deposit rate regardless
of the performance of its equity portfolio. For instance, this behavior can be rationally expected from it
by the firm shareholders (who decide about the deposit amounts) if the government provides full
guarantee. That is, we examine, so to say, an “Irish” type of policy.
Given the outside return rate i0 and the commercial bank cost of funds, i, simple symmetric
(i.e. with two identical firms and TFP A being the common aggregate productivity shock) equilibria of
our model are pairs of lending rate r and merchant bank partnership size qp variables jointly satisfying
equations (2.7a) and (2.9). The economy is then characterized by fundamentals collected in the last
column of Table 2.1 (all values are for one of the two identical representative firms). For comparison,
in two additional columns we also show values of economic fundamentals in the cases when collateral
diversification is restricted downwards away from the decentralized equilibrium: one with no collateral
diversification (v=0) and another with low collateral diversification (v=0.1).
Apparently, total output is not particularly affected by the diversified funds approaching the
optimal size. On the other hand, the survival probability increases and the TFP default threshold
decreases. This can be attractive from the viewpoint of risk managers within firms, and provide strong
support to the use of diversifying financial intermediary services.
An important thing to observe about the results shown in Table 2.1 is the merchant bank
performance. Whereas individual firm default probabilities are less than 2% (a little higher if collateral
diversification size is restricted) even when their TFP shocks are perfectly correlated, as we assume
in this example, the merchant bank makes a negative profit even under a small deviation from the
average TFP of unity. This fragility can be somewhat reduced when it is allowed to raise the size of its
partnership to the optimal level, but still remains incomparable with those of its client firms: the latter
safely survive when their common TFP falls to the level of 0.5, whereas the merchant bank becomes
insolvent.
Insolvency of the merchant bank means that the loss must be taken by the government who
provided the deposit guarantee. The expected size of official loss conditioned on the aggregate TFP
falling below the merchant bank survival threshold, is shown in the last column of Table 2.1. Although
it starts at a low level when collateral diversification and the implied leverage are low themselves
(because the merchant bank balance sheet size is proportional to leverage), it reaches levels
comparable to the economy’s aggregate output as soon as collateral diversification moves towards
the decentralized equilibrium of the last column. If guarantees must be funded by additional tax
revenue, the private sector’s net loss from collateral diversification behavior would likely exceed its
benefits from optimal capital structure.
If collateral diversification entails such big tail risks to the public sector, can the firms do
without it, given that the government may take steps to ban outside collateral altogether? The model
suggests that attractions of collateral diversification behavior can be quite strong. One reason is the
already mentioned reduction of default frequency in sectors that diversify. Another is even more
fundamental and has to do with scarce equity capital.
Our next example concerns a pair of cases in which the foundation equity is lower compared
to the qh=2.7 value considered earlier. Let us allow for the existence of a standard market with the
Volume II, Chapter 2 Alexis Derviz
50
firm’s shares, in which traders are small, risk-averse with negative exponential utility of final wealth,
and have alternative investment opportunities beside the discussed firm stock, with an imperfect
correlation of returns. The important thing is that these investors do not know the firm production
function, just the statistics of its TFP, average revenue and costs, i.e. see the dividend defined in (2.4)
as an affine function Af+g truncated at zero due to limited liability at default, with no introspect into the
structure of f and g. Being small, they do not internalize the effect of their investment on the firm’s
earnings (as opposed to the merchant bank with its private equity position). As a first step, we would
like to know what amount of equity capital is this set of traders able to provide in equilibrium.
The results for the case of two identical firms in a symmetric equilibrium (i.e. v=qp) are shown
in the first column of Table 2.2. We see that the firm cannot be completely financed in the secondary
stock market, i.e. there is a minimal positive value of foundation capital qh for which both equity and
credit markets clear. This is a variation of the classical CSV theme: investors without inside
knowledge of the firm can provide only so much equity. The needed minimal qh for the chosen stock
market parameters is provided in the column head. As soon as the available foundation stock is lower,
public traders are not enough, one needs additional private equity to get the firm operating, and the
merchant bank becomes indispensible. In circumstances of scarce private equity, leverage through
collateral diversification becomes attractive from the private sector perspective no matter what the
public authority knows or thinks about the attached risks.
The first column of Table 2.2 was calculated under the natural assumption that there are no
private equity partnerships beside the foundation stock (i.e. v=0). We call this case of stock market
financing complete. If the number of publicly traded shares is normalized to unity (number in the last
line), the penultimate two (equal) numbers of the same column give the total stock market financing
and the share price. Next, let us allow for a non-zero participation of the merchant bank (positive v) in
the presence of the same stock market. Since, from the stock market trader perspective there is no
difference between equity provided in the form of foundation stock and private equity partnership (due
to the assumed joint optimality behavior of inside shareholders, expressed by (2.9), only the sum
q=qh+qp matters), we fix the value qh=2 for definiteness. Then, one can raise the value of v from zero
to some level at which the outside stock market becomes redundant, i.e. the optimal level of equity
capital q*=qh+v*. The 2nd and 3rd columns of Table 2.2 describe the corresponding equilibria for the
intermediate case of v=1 and the maximal v-level compatible with secondary stock trading (the exact
number shown in the column heading).
Actually, the firm can now choose between raising private and public equity capital. In the
lower part of Table 2.2 we show two corner alternatives: all-public (denoted complete stock market
financing) and residual (denoted incomplete) public stock trading. Both alternatives are non-trivial only
in intermediate cases (since xe=0 when qp=q*-qh same as it was xe=1 when qp=0). We see that for
v=1, publicly trading stock comprises less than 50 % of shares in the Complete case and less than
2.5% in the Incomplete case. For obvious reasons, residual public trading results in a higher stock
price than the all-public trading.
Naturally, the size of possible partnership is not limited to the value q*-qh. It can grow further,
as we agreed in Section 2.3.2, up to the total equity level, which becomes an endogenously
determined quantity. This is the case of the entire foundation capital spent on diversified collateral,
whereas own production is funded by commercial bank loans. In fact, the amount of deposits
Financial Aspects of Recent Trends in the Global Economy
51
amassed by the merchant bank is now much bigger than required for optimal equity participations.
Therefore, we assume for simplicity that the merchant bank invests excess funds outside the
economy at the same rate as the one it pays to the firms, i.e. it makes no profit on this part of its
portfolio. All profits it can make in expectation come from private equity partnerships. However, with
growing deposit size servicing this liability becomes increasingly expensive, so that expected profits
fall whereas the merchant bank default threshold in terms of aggregate TFP becomes precariously
close to the average TFP value (of unity in our examples). That is, the resulting “crazy” leverage
serviced by the merchant bank comes along with an extreme fragility of the latter, which the regulator
should by all means prevent.
We go over to the third example which concerns a change in the definition of the merchant
bank claims. As mentioned in the introduction, it may be infeasible, even though desirable in principle,
to restrict merchant bank liabilities to common equity. So, we try out a hybrid solution that mandates
conversion into equity only when the merchant bank becomes insolvent. In this CoCo liability regime,
the firms do not have to solve the CSV problem in a high-earning merchant bank. On the other hand,
they participate in the debt workout as bona fide shareholders when the merchant bank is in distress,
meaning that, in bad times, they simply receive what little the economy (including the firm itself) in
aggregate was able to earn, without additional losses associated with the merchant bank dissolution
under a standard bankruptcy procedure.
When we say “bad times”, this means an intermediate outcome between the failure of the
merchant bank and that of the firms. (When aggregate TFP falls below the corporate default threshold
Ad, as defined by (2.6), everybody’s earnings are zero except for the commercial banks.) As could be
seen in the last column of Table 2.1, reproduced as the first column in Table 2.3, the TFP default
threshold of the merchant bank is much higher, so there is a whole range of TFP-realizations under
which the firms can operate, i.e. repay their loans, even if the merchant bank cannot honor its deposit
rate payments.
Complete quantitative results are shown in Table 2.3. Beside the 1st column carried over from
Table 2.1, we show a hypothetical case of the merchant bank issuing liabilities in the form of equity
only, in the 2nd column. Apparently, the change of legal status of the merchant bank liabilities has a
very modest impact on major fundamentals (interest rate, credit, investment, and average output), at
the same time as it eliminates, by construction, the huge conditional liability of the government
associated with the merchant bank deposit guarantee. However, as mentioned earlier, if pure equity
funding of the merchant banking sector is infeasible (e.g. for CSV and other asymmetric information-
related reasons), the 3rd column shows a compromise with deposits transformed into equity only when
the merchant bank does not earn enough to pay the deposits out in full. Also under this contractual
change, most economic fundamentals move only slightly. There is marginally less investment, lower
expected output and the lending rate going up by a couple of basis points. The survival probability of
both firms same as the TFP default threshold imperceptibly increase. A somewhat more tangible
change is visible in the quantity of diversified collateral (it is roughly 30 per cent higher under
convertible than under guaranteed deposits), as well as in the default threshold of the merchant bank
(it is about 14 per cent lower). Actually, when deposits are convertible, the default as such is not
required, so that it is better to talk about the liability transformation threshold. The expected profit of
Volume II, Chapter 2 Alexis Derviz
52
the merchant bank is also higher in the conversion case than under official guarantees (note that profit
is zero by construction in an equity-funded merchant bank). Most importantly, the merchant bank
LGD, comparable to the size of economy-wide physical capital aggregate, now disappears, same as
the associated contingent claim on the official bailout fund.
2.5 Discussion and conclusion
We have defined a production economy in which attempts to diversify productivity risk on
producer (micro) level result in elevated systemic (macro) risk due to the mechanism through which
collateral is being transformed into private equity partnerships and concentrated in one sector of the
financial industry (merchant banks) with a highly fragile balance sheet.
Merchant banks do not have to be fully competitive. They may pay fixed interest allowing for
an economic profit, but still be fragile because what they pay is tied to what their depositors receive as
prudential buffers. So, higher/lower buffers mean safer/riskier equity participations in the merchant
bank portfolio, but have to be provided by the merchant bank itself in the form of interest payments to
the same set of agents. The systemic merchant bank in this setting is not just a gainful enterprise but
also a device holding together the equilibrium in the credit market. As such, it cannot make full use of,
let alone abuse, its market power. An additional problem of interest in its own right would be of
choosing an optimal deposit rate for the merchant bank who internalizes the impact of paid interest on
the earnings of firms in its equity portfolio. We postpone this problem for future research but note that
even the set of feasible deposit rates in such a problem would be relatively narrow. That is, the
merchant bank is constrained in the ability to pay low rate for its funds to such a degree that it turns
out to be very moderately profitable and is forced to operate quite close to the default boundary. Its
high default probability becomes a natural concern of macroprudential regulation.
Leverage stemming from collateral diversification will hardly be voluntarily reduced to zero by
the non-financial private sector since under scarce equity, its presence both provides better
managerial incentives in firms and improves welfare. In certain cases, it can even be the only way to
allow production financing as standard secondary stock market participation is limited by information
barriers on the side of small shareholders.
However, what appears optimal from the micro perspective of a single enterprise can generate
poorly sustainable leverage in aggregate. In principle, any amount of leverage reduces distance to
default as long as one counts on the possibility of sudden deleveraging based on self-fulfilling
collateral reappraisal. Such a reappraisal, in its turn, entails a very probable solvency crisis in the
merchant bank sector since, as our examples have demonstrated, default thresholds of the latter are
much easier to attain than in a standard non-financial firm. The destiny of investment banks in the US
in 2008-9 provides a good example of this.
Policy we know from the latest crisis would, in our environment, roughly correspond to
merchant bank bailouts by government funds in order to prevent collateral destruction. This policy
entails considerable fiscal costs and soon reaches its limit, as the current sovereign solvency problem
in Europe has clearly demonstrated. Accordingly, one should look for alternatives, preferably such
that, instead of a futile attempt to transfer losses from sector to sector as a hot potato, would return
them to their originators. This is the mechanism of collateral back-conversion into the merchant bank
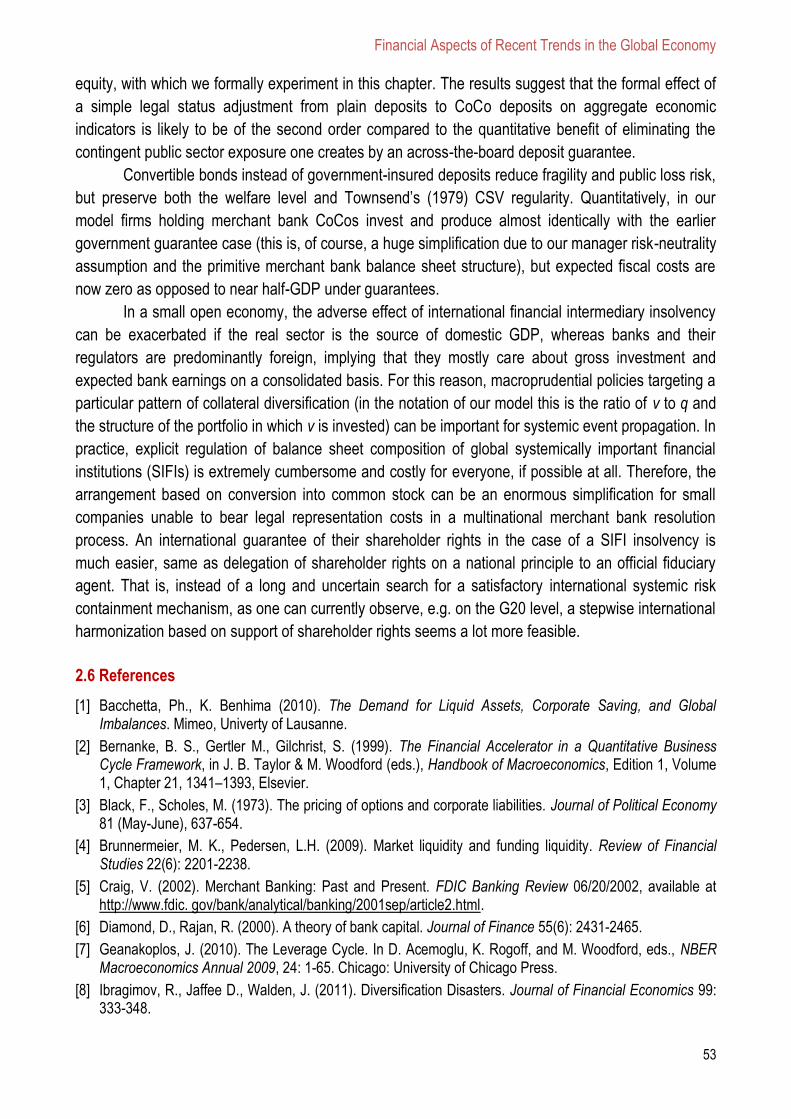
Financial Aspects of Recent Trends in the Global Economy
53
equity, with which we formally experiment in this chapter. The results suggest that the formal effect of
a simple legal status adjustment from plain deposits to CoCo deposits on aggregate economic
indicators is likely to be of the second order compared to the quantitative benefit of eliminating the
contingent public sector exposure one creates by an across-the-board deposit guarantee.
Convertible bonds instead of government-insured deposits reduce fragility and public loss risk,
but preserve both the welfare level and Townsend’s (1979) CSV regularity. Quantitatively, in our
model firms holding merchant bank CoCos invest and produce almost identically with the earlier
government guarantee case (this is, of course, a huge simplification due to our manager risk-neutrality
assumption and the primitive merchant bank balance sheet structure), but expected fiscal costs are
now zero as opposed to near half-GDP under guarantees.
In a small open economy, the adverse effect of international financial intermediary insolvency
can be exacerbated if the real sector is the source of domestic GDP, whereas banks and their
regulators are predominantly foreign, implying that they mostly care about gross investment and
expected bank earnings on a consolidated basis. For this reason, macroprudential policies targeting a
particular pattern of collateral diversification (in the notation of our model this is the ratio of v to q and
the structure of the portfolio in which v is invested) can be important for systemic event propagation. In
practice, explicit regulation of balance sheet composition of global systemically important financial
institutions (SIFIs) is extremely cumbersome and costly for everyone, if possible at all. Therefore, the
arrangement based on conversion into common stock can be an enormous simplification for small
companies unable to bear legal representation costs in a multinational merchant bank resolution
process. An international guarantee of their shareholder rights in the case of a SIFI insolvency is
much easier, same as delegation of shareholder rights on a national principle to an official fiduciary
agent. That is, instead of a long and uncertain search for a satisfactory international systemic risk
containment mechanism, as one can currently observe, e.g. on the G20 level, a stepwise international
harmonization based on support of shareholder rights seems a lot more feasible.
2.6 References
[1] Bacchetta, Ph., K. Benhima (2010). The Demand for Liquid Assets, Corporate Saving, and Global Imbalances. Mimeo, Univerty of Lausanne.
[2] Bernanke, B. S., Gertler M., Gilchrist, S. (1999). The Financial Accelerator in a Quantitative Business Cycle Framework, in J. B. Taylor & M. Woodford (eds.), Handbook of Macroeconomics, Edition 1, Volume 1, Chapter 21, 1341–1393, Elsevier.
[3] Black, F., Scholes, M. (1973). The pricing of options and corporate liabilities. Journal of Political Economy 81 (May-June), 637-654.
[4] Brunnermeier, M. K., Pedersen, L.H. (2009). Market liquidity and funding liquidity. Review of Financial Studies 22(6): 2201-2238.
[5] Craig, V. (2002). Merchant Banking: Past and Present. FDIC Banking Review 06/20/2002, available at http://www.fdic. gov/bank/analytical/banking/2001sep/article2.html.
[6] Diamond, D., Rajan, R. (2000). A theory of bank capital. Journal of Finance 55(6): 2431-2465.
[7] Geanakoplos, J. (2010). The Leverage Cycle. In D. Acemoglu, K. Rogoff, and M. Woodford, eds., NBER Macroeconomics Annual 2009, 24: 1-65. Chicago: University of Chicago Press.
[8] Ibragimov, R., Jaffee D., Walden, J. (2011). Diversification Disasters. Journal of Financial Economics 99: 333-348.
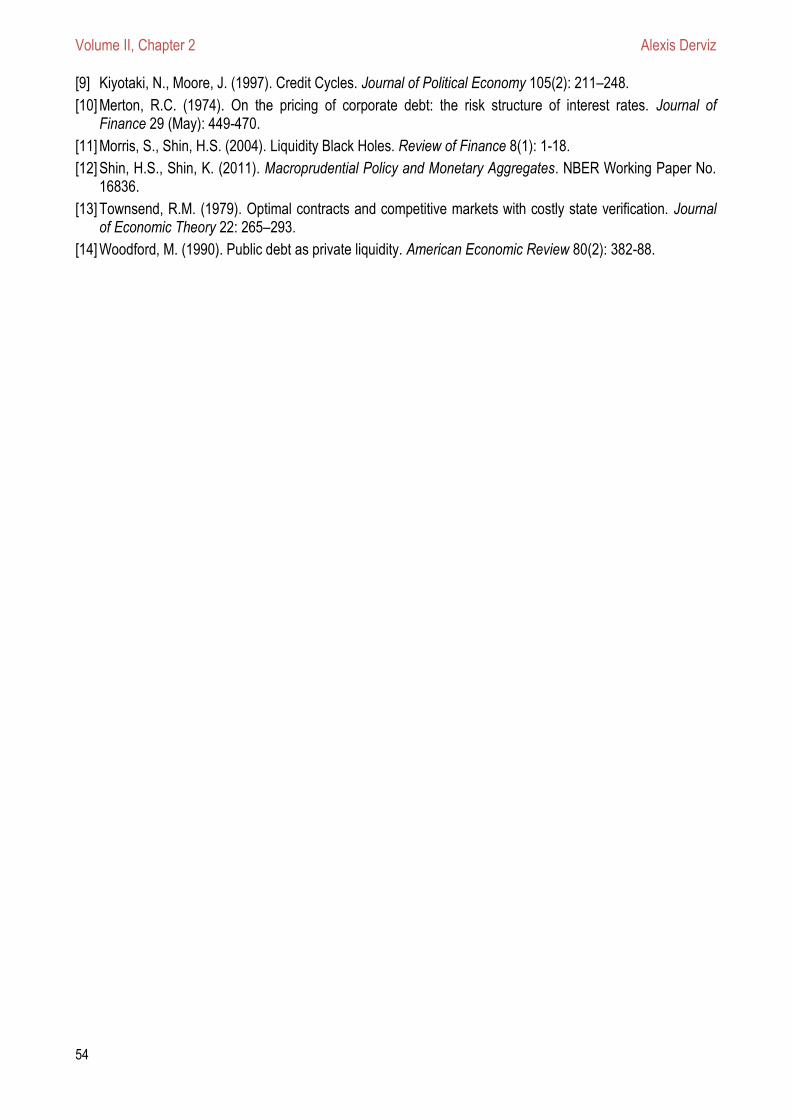
Volume II, Chapter 2 Alexis Derviz
54
[9] Kiyotaki, N., Moore, J. (1997). Credit Cycles. Journal of Political Economy 105(2): 211–248.
[10] Merton, R.C. (1974). On the pricing of corporate debt: the risk structure of interest rates. Journal of Finance 29 (May): 449-470.
[11] Morris, S., Shin, H.S. (2004). Liquidity Black Holes. Review of Finance 8(1): 1-18.
[12] Shin, H.S., Shin, K. (2011). Macroprudential Policy and Monetary Aggregates. NBER Working Paper No. 16836.
[13] Townsend, R.M. (1979). Optimal contracts and competitive markets with costly state verification. Journal of Economic Theory 22: 265–293.
[14] Woodford, M. (1990). Public debt as private liquidity. American Economic Review 80(2): 382-88.
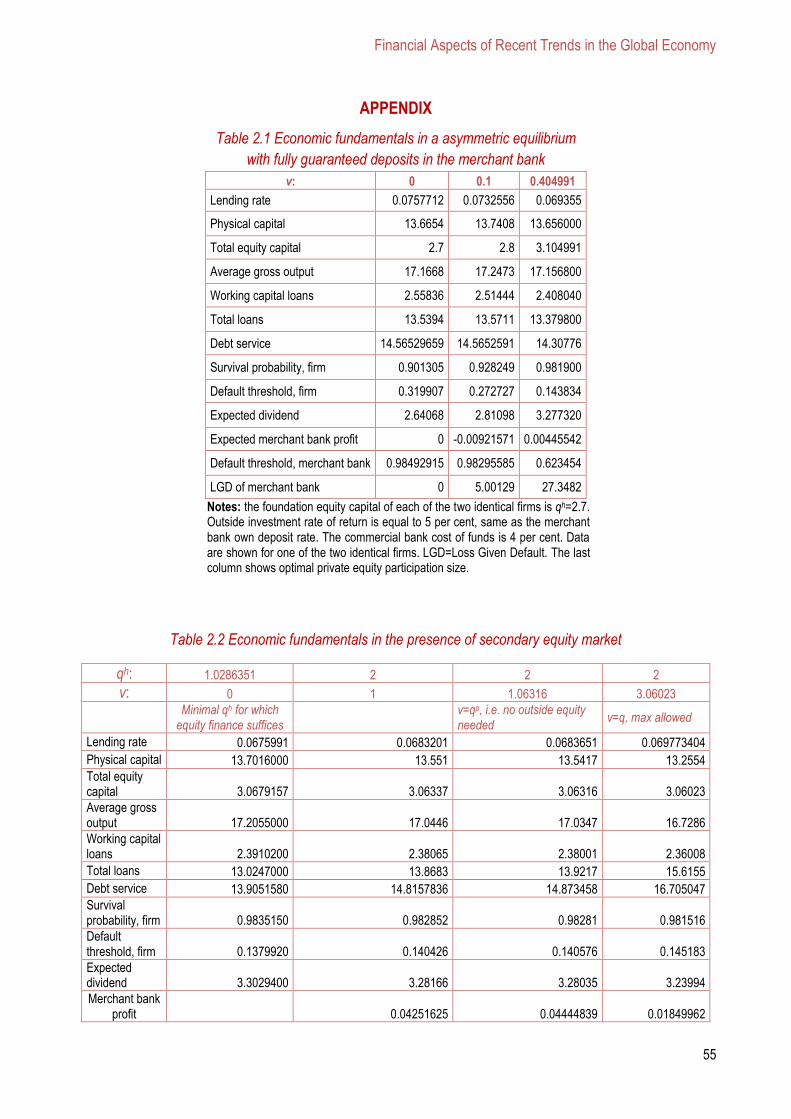
Financial Aspects of Recent Trends in the Global Economy
55
APPENDIX
Table 2.1 Economic fundamentals in a asymmetric equilibrium
with fully guaranteed deposits in the merchant bank
v: 0 0.1 0.404991
Lending rate 0.0757712 0.0732556 0.069355
Physical capital 13.6654 13.7408 13.656000
Total equity capital 2.7 2.8 3.104991
Average gross output 17.1668 17.2473 17.156800
Working capital loans 2.55836 2.51444 2.408040
Total loans 13.5394 13.5711 13.379800
Debt service 14.56529659 14.5652591 14.30776
Survival probability, firm 0.901305 0.928249 0.981900
Default threshold, firm 0.319907 0.272727 0.143834
Expected dividend 2.64068 2.81098 3.277320
Expected merchant bank profit 0 -0.00921571 0.00445542
Default threshold, merchant bank 0.98492915 0.98295585 0.623454
LGD of merchant bank 0 5.00129 27.3482
Notes: the foundation equity capital of each of the two identical firms is qh=2.7. Outside investment rate of return is equal to 5 per cent, same as the merchant bank own deposit rate. The commercial bank cost of funds is 4 per cent. Data are shown for one of the two identical firms. LGD=Loss Given Default. The last column shows optimal private equity participation size.
Table 2.2 Economic fundamentals in the presence of secondary equity market
qh: 1.0286351 2 2 2
v: 0 1 1.06316 3.06023
Minimal qh for which
equity finance suffices v=qp, i.e. no outside equity needed
v=q, max allowed
Lending rate 0.0675991 0.0683201 0.0683651 0.069773404
Physical capital 13.7016000 13.551 13.5417 13.2554
Total equity capital 3.0679157 3.06337 3.06316 3.06023
Average gross output 17.2055000 17.0446 17.0347 16.7286
Working capital loans 2.3910200 2.38065 2.38001 2.36008
Total loans 13.0247000 13.8683 13.9217 15.6155
Debt service 13.9051580 14.8157836 14.873458 16.705047
Survival probability, firm 0.9835150 0.982852 0.98281 0.981516
Default threshold, firm 0.1379920 0.140426 0.140576 0.145183
Expected dividend 3.3029400 3.28166 3.28035 3.23994
Merchant bank profit 0.04251625 0.04444839 0.01849962
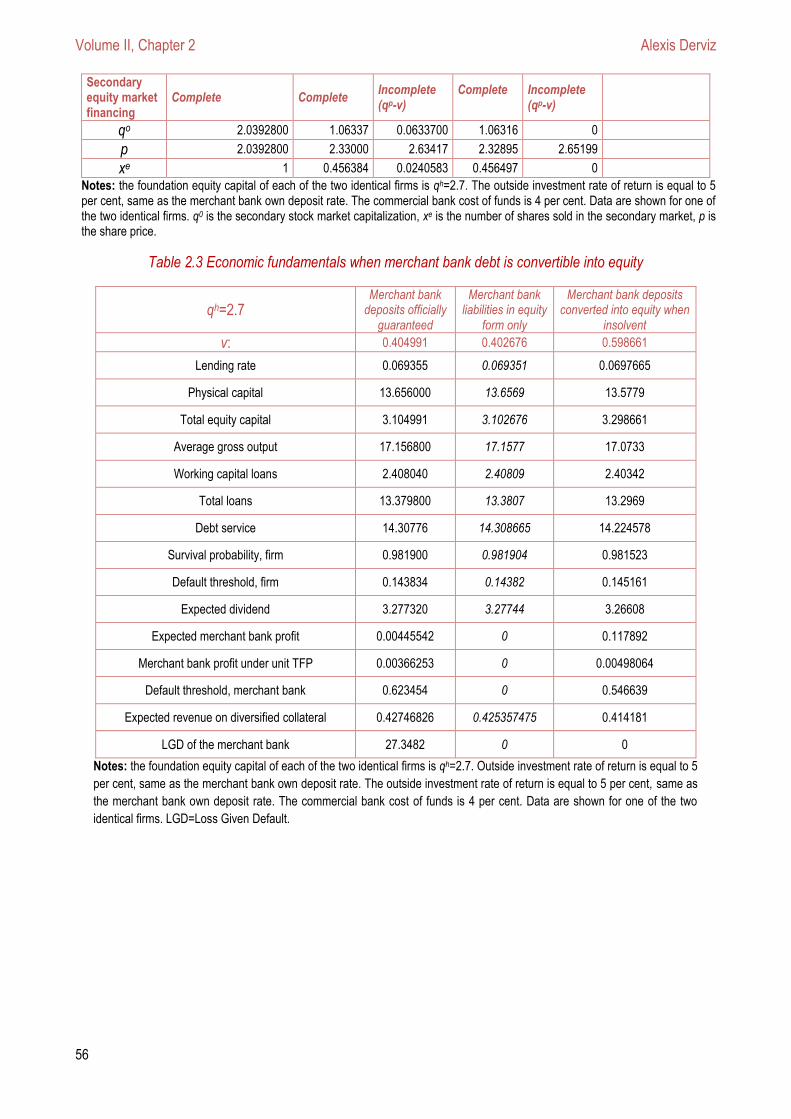
Volume II, Chapter 2 Alexis Derviz
56
Secondary equity market financing
Complete Complete Incomplete (qp-v)
Complete
Incomplete (qp-v)
qo 2.0392800 1.06337 0.0633700 1.06316 0
p 2.0392800 2.33000 2.63417 2.32895 2.65199
xe 1 0.456384 0.0240583 0.456497 0
Notes: the foundation equity capital of each of the two identical firms is qh=2.7. The outside investment rate of return is equal to 5 per cent, same as the merchant bank own deposit rate. The commercial bank cost of funds is 4 per cent. Data are shown for one of the two identical firms. q0 is the secondary stock market capitalization, xe is the number of shares sold in the secondary market, p is the share price.
Table 2.3 Economic fundamentals when merchant bank debt is convertible into equity
qh=2.7 Merchant bank
deposits officially guaranteed
Merchant bank liabilities in equity
form only
Merchant bank deposits converted into equity when
insolvent
v: 0.404991 0.402676 0.598661
Lending rate 0.069355 0.069351 0.0697665
Physical capital 13.656000 13.6569 13.5779
Total equity capital 3.104991 3.102676 3.298661
Average gross output 17.156800 17.1577 17.0733
Working capital loans 2.408040 2.40809 2.40342
Total loans 13.379800 13.3807 13.2969
Debt service 14.30776 14.308665 14.224578
Survival probability, firm 0.981900 0.981904 0.981523
Default threshold, firm 0.143834 0.14382 0.145161
Expected dividend 3.277320 3.27744 3.26608
Expected merchant bank profit 0.00445542 0 0.117892
Merchant bank profit under unit TFP 0.00366253 0 0.00498064
Default threshold, merchant bank 0.623454 0 0.546639
Expected revenue on diversified collateral 0.42746826 0.425357475 0.414181
LGD of the merchant bank 27.3482 0 0
Notes: the foundation equity capital of each of the two identical firms is qh=2.7. Outside investment rate of return is equal to 5
per cent, same as the merchant bank own deposit rate. The outside investment rate of return is equal to 5 per cent, same as
the merchant bank own deposit rate. The commercial bank cost of funds is 4 per cent. Data are shown for one of the two
identical firms. LGD=Loss Given Default.

Financial Aspects of Recent Trends in the Global Economy
57
x
Chapter 3
REFORM OF EXISTING AND BUILDING OF NEW INSTITUTIONAL STRUCTURE OVER THE COUNTER FINANCIAL DERIVATIVES MARKET
by Dragan Miodrag MOMIROVIĆ
University "Union" Belgrade, Faculty of Industrial Management Business, Serbia
3.1 Introduction
3.2 Development of over the counter financial derivatives markets
3.3 Rule of derivatives in the financial crisis
3.4 International regulatory initiative financial derivatives markets
3.5 Implementation and application of international initiative in United States
3.6 Implementation and application of international initiative in European Union
3.7 Differences and similarities of the new regulatory framework the European Union and
United.States
3.8 Implications of new regulatory measures
3.9 Instead of conclusion - international coordination and progress
3.10 References
Volume II, Chapter 3 Dragan Miodrag Momirović
58
REFORM OF EXISTING AND BUILDING OF NEW INSTITUTIONAL STRUCTURE OTC FINANCIAL DERIVATIVES MARKET
Dragan Miodrag MOMIROVIĆ 18
University "Union" Belgrade
Faculty of Industrial Management Business, Serbia
Abstract
The financial crisis which occurred during 2008 has shown that markets are OTC (over-the-counter)
derivatives unregulated and insufficiently controlled and represent a potential source of systemic risk build up.
At summits in Pittsburgh G20 leaders by made binding recommendations for the reform of the existing
buildings and the new institutional structure of OTC financial derivatives market. Recommendations are
relating to the standardizations of contracts, mandatory central clearing of all transactions, trading across
exchanges or electronic platforms, capital and margin requirements and reporting through trades repositories.
Analogously, the proposed recommendation at the international level, the FSB is on undertaken is of
initiatives, together, with other relevant international organizations with improved order to existing building and
new proposals and measures. FSB has announced the first report after consulting relevant stakeholders on
the OTC market of financial derivatives revised and adopted in final form at the G20 summit (2011) in Cannes.
US and EU and other countries have taken appropriate actions and measures to implement the
proposals and recommendations by Pittsburgh Summit. The US has adopted Dood-Frank Act, which in
Section VII regulates OTC derivatives, with final implementation 15 July 2011. EU has adopted EMIR, as the
main regulators, whose provisions are binding on all jurisdictions and its implementation will commence by of
end 2012. The new structure of OTC markets should be reduced systemic risk and improve the risk
management contracting partners, to ensure transparency and improve the financial infrastructure of
derivatives markets.
Keywords: OTC financial derivatives, standardization, central clearing, exchange or electronic platform
trading, trade repositories systemic risk.
3.1 Introduction
In light of the recent economic and financial crisis, identified hazards and threats of the
unregulated trade OTC financial derivatives market. The enormous expansion of OTC financial
derivatives market after the seventies and early eighties of the last century past and having reached
the culminations of several years before the crisis, during the crisis, showed certain regulatory and
supervisory deficiencies. Nevertheless, although proven that they are not the main cause of the great
financial crisis; they have no doubt contributed to its eruptions. Failure firm Lehman Brothers and AIG
rescue because of exposure revealed that the OTC derivatives market financial source buildup of
systemic risk. The crisis has shown that improper use of financial derivatives by financial and other
stakeholders in the search for new crops can cause financial problems, while turning them into
"financial weapons of mass destruction." "The mass destruction" comes from the very characteristics
18 Dragan Miodrag Momirović, Professor at University "Union" Belgrade, Faculty of Industrial Management Business, Ive Andrića 2,
Mladenovac, Serbia
Financial Aspects of Recent Trends in the Global Economy
59
of OTC derivatives and financial derivatives markets. These characteristics allow, their, strong mutual
flexibility and adaptability, which along with inadequate regulation and supervision can evoking a
powerful, combined, the synergy that stimulates investors to constantly search for new financial
derivative products that provide them with a new, higher yields. Retail unregulated OTC financial
derivatives markets, is performed bilaterally, (phone) or multilaterally (placing electronic platform)
contract between business partners without clearing obligations of and disclosure of data of the type
of contracts, prices, and transaction report without obligations of, and enforcing contracts. Such trade
was not available to the authorities responsible for monitoring and supervision and the only legal
framework was the contract itself. Enormous trade non-regulated unregulated market and strong
synergies of the combined effect of derivatives and OTC financial derivatives markets, strongly acted,
to spreading financial contagion has already occurred in the US.
Identified negative effects of unregulated OTC financial derivatives market, noted that it is
necessary to take certain actions, the direction, the revision of the existing structure and build a new
OTC financial derivatives market. Failure of OTC financial derivatives markets is the Pittsburgh
Summit, G20 leaders, (2009) the passing of a binding recommendations for increased regulation and
oversight of OTC financial derivatives markets "all standardized OTC derivative contracts should be
traded on exchanges or electronic trading platforms, where appropriate, and cleared through central
counterparties by end-2012 at the latest”. Financial Stability Board (FSB) in accordance with the
mandatory recommendations of the G20 leaders took certain actions (FSB, October 2010) in order to
improve existing and build new structures OTC financial derivatives markets, focusing primarily on
control deficiencies which have come after the recent crisis. In this way, they run international efforts
and mechanisms to strengthen the regulatory and supervisory framework of OTC financial derivatives
market.
The aim of this chapter is to, on the basis of the initiative group G20 and other relevant
international organs regulations, to show in main aspects a new regulatory and supervisory structure
of OTC financial derivatives markets, their structure, differences, practical’s and policies implications
and problems of application.
The contribution will be reflected in the presentation of the current problems a wide public as
an initial idea to deepen their thinking to finding new solutions and improvement criticism existing and
new of the regulatory and supervisory framework of OTC financial derivatives market.
The work consists of seven sections. The first section gives a brief review of the realized
financially derivatives trading volume on the OTC market. The second section focuses on observing
the role of derivatives in the recent financial crisis. The third section focuses on an international
initiative to improve existing and build a new architecture of the regulatory and supervisory framework
of OTC financial derivatives markets. In the fourth and fifth section we focus on the application of
international initiatives in the US and the EU, their actions and activities. In the sixth, outlines compare
the differences and similarities of the regulatory and supervisory framework of the US and the EU. In
the seventh section considers the implications of the new framework of regulation and supervision on
OTC entire financial sector and financial institutions. Instead of conclusions, we points to the problems
of successful implementation of the new regulatory and supervisory framework, international
coordination, and progress to date in the realization.
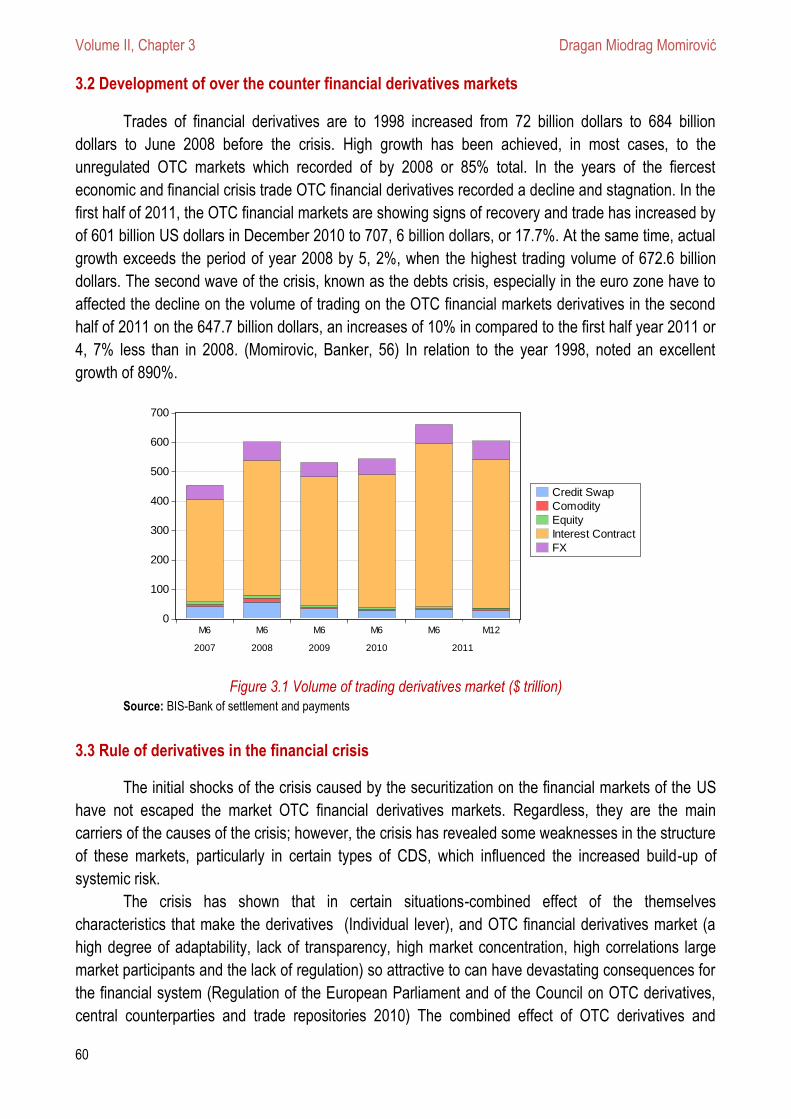
Volume II, Chapter 3 Dragan Miodrag Momirović
60
3.2 Development of over the counter financial derivatives markets
Trades of financial derivatives are to 1998 increased from 72 billion dollars to 684 billion
dollars to June 2008 before the crisis. High growth has been achieved, in most cases, to the
unregulated OTC markets which recorded of by 2008 or 85% total. In the years of the fiercest
economic and financial crisis trade OTC financial derivatives recorded a decline and stagnation. In the
first half of 2011, the OTC financial markets are showing signs of recovery and trade has increased by
of 601 billion US dollars in December 2010 to 707, 6 billion dollars, or 17.7%. At the same time, actual
growth exceeds the period of year 2008 by 5, 2%, when the highest trading volume of 672.6 billion
dollars. The second wave of the crisis, known as the debts crisis, especially in the euro zone have to
affected the decline on the volume of trading on the OTC financial markets derivatives in the second
half of 2011 on the 647.7 billion dollars, an increases of 10% in compared to the first half year 2011 or
4, 7% less than in 2008. (Momirovic, Banker, 56) In relation to the year 1998, noted an excellent
growth of 890%.
Figure 3.1 Volume of trading derivatives market ($ trillion) Source: BIS-Bank of settlement and payments
3.3 Rule of derivatives in the financial crisis
The initial shocks of the crisis caused by the securitization on the financial markets of the US
have not escaped the market OTC financial derivatives markets. Regardless, they are the main
carriers of the causes of the crisis; however, the crisis has revealed some weaknesses in the structure
of these markets, particularly in certain types of CDS, which influenced the increased build-up of
systemic risk.
The crisis has shown that in certain situations-combined effect of the themselves
characteristics that make the derivatives (Individual lever), and OTC financial derivatives market (a
high degree of adaptability, lack of transparency, high market concentration, high correlations large
market participants and the lack of regulation) so attractive to can have devastating consequences for
the financial system (Regulation of the European Parliament and of the Council on OTC derivatives,
central counterparties and trade repositories 2010) The combined effect of OTC derivatives and
0
100
200
300
400
500
600
700
M6 M6 M6 M6 M6 M12
2007 2008 2009 2010 2011
Credit Swap
Comodity
Equity
Interest Contract
FX

Financial Aspects of Recent Trends in the Global Economy
61
financial derivatives markets were operating, the instigating of the financial crisis in the US, especially
channel CDS contracts.
3.4 International regulatory initiative financial derivatives markets
Beatar Stearns collapse in March 2008, Brothers and Leman same year in September and
rescues of AIG bail a day later; he pointed to the failures and shortcomings of the functioning of OTC
financial markets derivatives. Identified failures and deficiencies relating to the lack of transparency,
risk exposure and inadequate limit and mitigate credit and operational risk. Developments and
identify failures OTC financial derivatives markets are strongly influenced to the co-ordinate approach
to solving accumulated problems initiative by of leader G 20 at a summit in London 2. April 2009. G20
leaders agreed that the urgent reform of OTC financial derivatives markets, through standardization
and strengthening resilience with a particular focus on the establishment of a central clearing counter
partners in order to provide more effective regulation, monitoring and supervision.
At the Pittsburgh Summit (September 2009) G20 leaders expressed their determination and
took a firm stand to strengthen the regulation, supervision and oversight of OTC financial derivatives
market, ordering that "all standardized OTC derivative contracts should be traded on exchanges or
electronic trading platforms, where appropriate, and cleared through central counterparties by end-
2012 at the latest. OTC derivative contracts should be reported to trade repositories. Non-centrally
cleared contracts should be subject to higher capital requirements. We ask the FSB and its relevant
members to assess regularly implementation and whether it is sufficient to improve transparency in
the derivatives markets, mitigate systemic risk, and protect against market abuse”. (The Pittsburgh
Summit, 2009)
Analogously, firmly expressed position G20 and obtained the guidelines, the FSB has initiated
the formation of a working group (establish in April 2010) at led by representatives of the Committee
on Payment and Settlement Systems (CPSS) the International Organization for Securities
Commission (IOSCO) and the European Commission with a mission to identify and recommendations
that support the consistent implementation of the objectives of the G20 leaders. Analogously, firmly
stated attitude G20 and obtained the guidelines, the FSB has initiated the formation of a working
group (established by in April 2010) with representatives of the Committee on Payments and
Settlement Systems (CPSS), the International Commission for the organization of the securities
(IOSCO) and the European Commission (EC) under the called, OTC Derivatives Working Group with
a mission to identify options and recommendations that support the consistent implementation of the
aim of the G20 leaders. It focused on common approaches to OTC derivatives market reforms to
achieve consistency in implementation across jurisdictions, while promoting greater use of OTC
derivatives products in standardized form and minimizing the potential for regulatory arbitrage. (FSB,
2010)
OTC Derivatives Working Group, in accordance with the commitment made by G20 report,
which cited twenty-one recommendations, which contain practical problems they may encounter in
implementing the goals of the government G20 commitments in terms of standardization, central
clearing, organized platform trading, and reporting of OTC derivatives to trade repositories. (Technical
Volume II, Chapter 3 Dragan Miodrag Momirović
62
Committee of IOSCO, 2011) FSB has adopted the report of the Working Group and forwarded for
consideration by the G20 leaders at the Seoul Summit in November 2010.
FSB in its report "Implementation of the reform of OTC derivatives markets" (October 2010)
noted that it is necessary to join the IOSCO work together and with other bodies, as appropriate,
coordinate the implementation of central clearing on the level of the derivative products from the
perspective of the participants or G20 recommendations.
IOSCO is in accordance with the requirements of the FSB, established an in October 2010,
Task Force on OTC Derivatives Regulation, (IOSCO Task Force) and to coordinate joint efforts in the
development work of monitoring, control surveillance and supervision relating to OTC derivatives.
IOSCO Task Force is trying to build a financial infrastructure and “develop international standards
related to OTC derivatives regulation, coordinate other international initiatives relating to OTC
derivatives regulation, and serve as a centralized group within IOSCO through which IOSCO
members can consult and coordinate generally on issues relating to OTC derivatives regulation "(
Joint Reports, 2012)
In the meantime, the IOSCO and prepared a report containing recommendations for the
establishment of the order of the clearing by the competent authorities in their respective jurisdictions.
Recommendations relating to the following: (IOSCO, 2012)
Determination of whether a mandatory clearing obligation should apply to a product or set of
products;
Consideration of potential exemptions to the mandatory clearing obligation;
Establishment of appropriate communication among authorities and with the public;
Consideration of relevant cross-border issues in the application of a mandatory clearing
obligation; and
Monitoring and reviewing on an ongoing basis of the overall process and application of the
mandatory clearing obligation.
In the context of the recommendations, the FSB and IOSCO suggests two approaches to
defining the obligations mandated choice product or group of products that should be subject to
mandatory clearing, as follows: (IOSCO, 2012)
The bottom-up approach considers products that a CCP proposes to or is authorized to
clear;
The top-down approach considers products that should be assessed for a mandatory
clearing obligation, but where there may be no CCP clearing or seeking to clear that
product.
Key levers FSB report for the summit in the village can be elaborated in four points:
1. Standardization;
2. Central Clearing;
3. Stock exchange or electronic trading platform;
4. Reporting of OTC transactions in trade repositories.

Financial Aspects of Recent Trends in the Global Economy
63
3.4.1 Standardization
Implies an increasing proportion of standardization of OTC contracts increased central
clearing and trading on exchanges and trading platforms in order to mitigate systemic risk and
improve transparency. Standardization recommendations from the report are: (FSB 2010)
Authorities should work with market participants to increase standardization of OTC
derivatives products’ contractual terms. In setting priorities for increased standardization of
contractual terms, authorities should consider the systemic relevance of particular types of
OTC derivatives products, including by assessing factors such as volumes and exposures;
Authorities should work with market participants to increase the proportion of the OTC
derivatives markets that uses standardized operational processes and straight through-
processing. Greater use of standardized, automated processes will promote the use of
standardized products;
To achieve increased standardization of contractual terms and greater use of standardized
operational processes as set out in the above recommendations 1 and 2, the OTC Derivatives
Supervisors Group (expanded to include relevant market regulators) (ODSG) should continue
to secure ambitious commitments from the major OTC derivatives market participants. These
commitments should include publishing a roadmap by 31 March 2011 with demanding
implementation milestones for achieving greater standardization and, as an interim measure
until mandatory clearing requirements are fully implemented, increasing volumes of centrally
cleared transactions. The roadmap should set forth baseline metrics and forward-looking
targets against which market participants will be measured;
Authorities should develop incentives and, where appropriate, regulation, to increase the use
of standardized products and standardized processes. Authorities should examine new market
activity on a regular basis to monitor the extent to which market participants may be trading
non-standardized contracts solely for the purpose of avoiding central clearing and trading
requirements and take steps to address such behavior.
3.4.2 Central clearing
FSB has identified a wide range of factors that would suggest the possibility of establishing a
clearing obligation, which can be summarized in three groups: (Sidanius and Wetherilt, 2012)
The degree of standardization of a product’s contractual terms and operational
processes;
The nature, depth and liquidity of the market for the product in question;
The availability of fair, reliable and generally accepted pricing sources.
At the same time, the recommendations proposed mandatory clearing requirements, as well
as, and strong requirements for risk management remaining un-cleaned central markets regulation
and supervision of the central rating (CCP).
Volume II, Chapter 3 Dragan Miodrag Momirović
64
3.4.3 Exchange or electronic platform trading
In the future, need to identify all actions that may be of importance for the realization of the
obligations for trading on the stock exchange or through standardized contracts trading platform.
Recommendations concerning: (FSB, 2010)
1. IOSCO, with involvement of other appropriate authorities, should conduct an analysis by 31
January 2011 of:
The characteristics of the various exchanges and electronic platforms that could be used
for derivatives trading;
The characteristics of a market that make exchange or electronic platform trading
practicable;
The benefits and costs of increasing exchange or electronic platform trading, including
identification of benefits that are incremental to those provided by increasing
standardization, moving to central clearing and reporting to trade repositories;
And the regulatory actions that may be advisable to shift trading to exchanges or
electronic trading platforms;
2. Authorities should explore the benefits and costs of requiring public price and volume
transparency of all trades, including for non-standardized or non-centrally cleared products that
continue to be traded over-the-counter.
3.4.4 Reporting on trade across repositories
The authorities need to have a global view of the OTC financial derivatives market, the full and
timely access to information necessary for the exercise of their powers. The recommendations are:
The government should establish a legal framework and to provide the basic functions of trade
repositories including data collection and comprehensive reporting with the implementation of
international standards developed jointly by CPSS and IOSCO;
Provide access to information for all markets both domestic and foreign regulators (monitoring,
supervision, effective resolution etc.) to an appropriate form and in accordance with their
mandate;
The authorities should ensure that where appropriate the legal framework in removing barriers
to data collection and dissemination of trade repositories and provide ready access to the
relevant authorities. This approach will be applied where there is no consensus rating for
regulatory reporting;
The authorities should ensure where necessary, the legal framework in removing barriers to
data collection and dissemination of trade repositories and provide unhindered access the
relevant authorities. This approach will apply where there is disagreement rating for regulatory
reporting;
The authorities need to OTC market participants from financial derivatives that require to
report all transactions, including, in addition, those who have reverted to central clearing, as
well as to preserve the information about them, regardless of whether it is carried out and
trade them to recorded and communicated in their reports;
Financial Aspects of Recent Trends in the Global Economy
65
The authorities should determine the catch reporting transactions on realized trade
repositories, and relevant organizations in charge of reforming the OTC financial derivatives
market to determine what information should be reported, in order to enable the authorities to
carry out their duties of monitoring, surveillance, monitoring and control.
At the same time, it should be easy to develop a methodology for collecting data on the global
level by the end of 2011 by the CPSS and IOSCO in consultation with the authorities ODRF with the
minimum requirements of formal standardization. The recommendations help achieve this objective,
including that trade repository data must be comprehensive, uniform and reliable and, if from more
than one source, provided in a form that facilitates aggregation on a global scale. (FSB, 2010)
The report contains ambitious targets, in line with the commitments made by the G20,
including deadlines and law enforcement. It identifies areas in need of constant research and
monitoring giving you in mind the constant progress of innovation of financial derivatives which can
seriously undermine the G20 initiatives and efforts of relevant organizations working on the regulation
of OTC financial derivatives market. Constant research and monitoring require additional
recommendations from the relevant institutions and authorities to set objectives.
At a summit in Seoul (November 2010), G20 leaders discussed the first report on the progress
and implementation of the reform of OTC financial derivatives market. G20 leaders have adopted the
recommendations of the FSB, with a request to continue monitoring the progress of reform and for the
month of March 2011, prepare an initial report on the implementation of these recommendations. FSB
report, as of April 2011, explains and discusses a number of issues that are of importance for the
implementation of the recommendations in a consistent and comprehensive way, and shows that the
implementation is at an early stage and that cannot be given relevant conclusions about the visible
progress. The body of this report is set out in two parts: (i) implementation by jurisdictions and
progress in international bodies’ work streams; and (ii) overall observations on progress, including
identification of issues meriting additional attention in the near term, and next steps. (FSB, 2011) At
the same time, the FSB has expressed some doubt when it comes to the likelihood of implementation
in some jurisdictions, remaining, in the belief that the goal can be achieved only with the full
involvement of the competent authorities, in terms of taking concrete actions.
In October 2011, FSB has released its second report on the progress of the reform of OTC
financial derivatives market. The report highlighted a detailed assessment of progress in implementing
reforms, as well as concerns about the speed of implementation of regulations, stressing the
importance of cooperation, regulatory bodies and government. In parallel, the FSB believes that it is a
priority increasing the dynamics of legislative and regulatory actions, so that as soon concretize
binding framework. At the same time, the authorities were obliged to take as soon as quick and
effective action in order to meet the deadlines given in the implementation of all defined areas
including, at the same time, judicial and policy decisions related to the organization of the trading
platform. It points to the consistency and application in order to avoid overlap gaps and conflicts of
legislative and regulatory framework. In this context, it is proposed to continue discussions among
participants in the reform, with a particular focus on bilateral or multilateral relations among
jurisdictions, insisting, at the same time, the consistency between them. The consistency is reflected
in the implementation of international standards that would directly solve the problems in case of
Volume II, Chapter 3 Dragan Miodrag Momirović
66
financial distress, or begin the process of international cooperation in alleviating and limiting the
spread of financial contagion. ODVG and FSB will continue to monitor the implementation of the
reform of OTC financial derivatives market. FSB will continue to encourage the full and consistent
implementation of the commitments the G-20 leaders through the “development of international
standards, the adoption of legal and regulatory framework and changes in market structures and
activities”. (FSB, 2011)
At the Cannes Summit (November 2011) G20 leaders have accepted the recommendations of
the final declaration of the FSB, in the reform of OTC financial derivatives market, "We endorse the
FSB progress report on implementation and ask the CPSS and IOSCO to work with FSB to carry
forward work on identifying data that could be provided by and to (TRs), and to define principles or
guidance on regulators’ and supervisors’ access to data held by (TRs). We call on the (BCBS and
IOSCO) together with other relevant organizations to develop for consultation standards on margining
for non-centrally cleared OTC derivatives by June 2012, and on the FSB to continue to report on
progress towards meeting our commitments on OTC derivatives”. (Joint report, 2012, p. 14) At the
same time, the summit requested IOSCO to analyze and assess the functioning of the credit default
swaps market (CDS). At the same time, leaders of the G20, as part of its agenda, supported the
recommendations of IOSCO (listed above), in the sense of improving regulation and supervision of
commodity derivatives markets. In addition, they agreed that regulators should be given effective
powers (powers effective resolution) to be able to react in time and minimize or prevent financial
distress in the market OTC derivatives. The conclusion of the summit was to reform the OTC
derivatives market is one of the key issues in building a new architecture of regulation and supervision
in order to provide more resilient and stable financial system.
3.5 Implementation and application of international initiative in United States
Reform of OTC financial derivatives in the US is initiated by the adoption of the Dodd-Frank
Wall Street Reform and Consumer Protection Act (Dodd-Frank Act) 21.07. 2010, that, in Section VII,
provides the federal level, the establishment of a new framework of market regulation of swaps and
security-based swaps (security-based swap), which is expected, when fully implemented, fundamental
changes in the functioning of the market swaps. The law is due to come into force on 16 July 2011,
but its implementation was delayed in late 2012, although the previously proposed date of
implementation, some provisions apply.
Chapter VII, Dodd-Frank Act contains many elements that affect OTC derivatives, but these are the
key areas, namely: (Chance, 2010)
Registration of swap dealers and major swap participants;
Push-Out Rule;
Swap clearing and execution;
Swap reporting;
Margin;
Volcker Rule.
In the Dood-Frank Act regulation and supervision of the Commission to trade commodity
futures (CFTC), was given the authority and responsibility over swaps, swap dealers and major swap
Financial Aspects of Recent Trends in the Global Economy
67
participants. Commission for Securities (SEC) is responsible and accountable for the security-based
swaps, as well as dealers and companies that are major participants in the OTC market of derivatives.
CFTC and SEC will cooperate and work together in order to solve certain problems related to the
definition of the key aspects of competence, issues of market intermediaries, as well as the adoption
and approval of regulatory legislation in the field of joint, mixed swaps, regulations, statistics of trade
repositories, solutions in the field of bookkeeping and records for swap entities from the security point
of major swap agreement. They are required to consult with the Federal Reserve Board (FRB) when it
comes to rules that are not common but also with other prudential regulators regarding capital and
margin rules. Also, they are constantly in consultation with the prudential regulators outside the United
States established in accordance with international standards of regulation and supervision of OTC
financial derivatives market.
This law established several new regulatory designation for participants to trade swaps.
Broker-dealers who make markets swap products must be registered as Swap Dealers (SD) with the
CFTC or recalls, or in both, depending on with whom swaps are traded. The Major Participants Swaps
(SME) is firms that have important positions in the trade or swap multiple clients, such as large asset
managers.
CFTC and SEC rules establish by the CCP for registration in accordance with the basic
principles of the Dodd-Frank Act. As a clearing agency may be registered by anyone who meets the
legal requirements and standards prescribed by the SEC. Registered clearing agency must have a
responsible person who will strictly adhere to established rules and submit annual and other reports.
Clearing agency must abide by certain rules and principles in their operations, such as, respect,
appreciation of participants and the suitability of products, risk management, problem solving and
conflict resolution, reporting, record keeping, public information, etc...
Push-Out Rule provides that cannot be provided federal financial assistance to any Swap
Dealer or Major Swap Participants. This prohibition would not apply to the FDIC deposit insurance
institutions and their activities are limited swaps, hedging and other risk management activities related
to their own activities and act as swap dealers in transactions involving rates (rates) or reference
assets that National Bank may invest. (ISDA, 2011,) Push-Out Rule restricts trading in derivatives
depository institutions (banks), and forbid them to act as swap dealers for default credit swaps, unless
the conduct swaps, cleared through clearing. At the same time, it enables banks to act as dealers in
the swaps interest rates, foreign exchange swaps, swaps and precious metals swaps cleared default
credit reference investors.
Regulators require that all products are considered to be subject to the swap clearing, filing
Derivatives Clearing Organization (DCO). In this way, it ensures the safety of the clearing house to
eliminate the risk of exposure. In spite of all regulatory efforts, not all swaps are eligible for clearing.
Trade clearing swaps must be executed on registered trading places, including Designated
Contrast Market (DCM) or Swap Execution Facilities (SEF). The CFTC and SEC are based on the
published final regulations in January 2012, established a system of recording transactions, which
must be registered and reporting system swap shop. Reports and registration data pertaining to
transactions subject to the clearing exchange or registered SDRs, DCOs, DCMs, SEFs, SDs, MSPs,
and non-SD/MSP counterparties. (Join report, 2012) At the same time it requires that all data related

Volume II, Chapter 3 Dragan Miodrag Momirović
68
to trade swaps, are available to the general public through timely and complete reporting. Reporting
should include data from two important phases of existence swap, first, in the process of creation and
other swaps, tracking the movement of the swap until the final termination or expiration. Timely
reporting will improve price transparency and other important variables.
Trade repositories are included in the Dodd-Frank's Act, which gives the discrete powers of
the CFTC and SEC, unless otherwise specified, in accordance with the rules and regulations
established mode of operation of TR. It should be observed that some of the following measures:
(Join report, 2012)
Acceptance, confirmation, and maintenance of data;
Provision of direct electronic access to the CFTC or SEC, as applicable, or any
designee;
Establishment at the direction of the CFTC or SEC, as applicable, of automated systems
for monitoring, screening, and analyzing data;
Maintenance of the privacy of any and all transaction information;
And, sharing of data on a confidential basis with certain specified entities or those
determined to be appropriate, upon request and after Commission notification.
Concurrently, the TR should consider anti-seismic occurrence, management arrangements and
conflicting interest. Dodd-Frank Act requires the execution of “swaps that are required to be cleared to
occur on a DCM or a registered or exempt SEF (in the case of swaps) or an exchange or a registered
or exempt security-based swap execution facility (“SBSEF”) (in the case of security-based swaps),
unless no such entities make these swaps available to trade”. (Join report, 2012) In some cases
compulsory execution request swap contracts are not subject to Dodd-Frank law. These cases relate
to trade swaps on unorganized markets, the possibility of executing swaps that can allow trade and
swap if the end-user exempt from the clearing.
In the same act, exposed are the requirements of prudential regulation relating to capital,
margin, or collateral, risk management, liquidity, and segregation. Capital requirements are designed
to provide sufficient liquidity firms to fulfill their contractual obligations without external arbitration and
major conflicts. Minimum requirements apply, the amount of margin, or collateral, especially in the
collateral that is greater than the margin of scale, with the desire to provide a sufficient amount of
financial resources to ensure the implementation and enforcement of contracts protect swaps dealers
from price changes and other unforeseen circumstances, such and assist in managing risk. The
problem is to "perfect the lien against the collateral." (Miller, 2009) Therefore, SFTC and SEC have
the authority to regulate its activity minimum requirements for capital and margin requirements for
swaps subject to the clearing. Have a higher risk swaps that are not in the clearing, and the Dodd-
Frank law envisages the possibility that SFTC, SEC and prudential regulators set minimum capital
margins that will "(1) help ensure the safety and soundness of the registrant; and (2) are appropriate
for the risk associated with the uncle a red Swaps they hold”, help ensure the safety and stability of
the registrant and respond to risk non-clearing swaps." (Join report, 2012) At the same time
established the requirement for collateral, which is made clear that collateral, must be separate from
the accounts or assets that should be used for one customer collateral to cover the obligations of
another customer or its own obligations.
Financial Aspects of Recent Trends in the Global Economy
69
Volker rule prohibits insured depository institutions to engage in the trade for its own account, is:
(skadden.com).
Engaging in proprietary trading;
Acquiring or retaining any equity, partnership or other ownership interests in hedge
funds or private,
Or sponsor a hedge fund for private equity fund.
This rule applies to all US banking institutions wherever they have activities or conduct trade.
Regulators, in addition to prescribing norms and sanctions behavior of participants in the OTC
derivatives market, financial, and have responsibility for the operation of the market. Accountability
refers to the discrete harmonizing rules and regulations, in accordance with the Dodd-Frank Act
requires the commission relating to the monitoring of TR, preventing manipulation of swaps, get
information, secrecy and integrity of financial transactions, timely reporting, analysis anti- seismic
conflict resolution, records and the like.
At the same time, Dodd-Frank Act contains many different aspects that will affect the
organization of business and technology firms that trade derivatives swap with and be subject to the
clearing of OTC derivatives. Operational and technological impacts may include central clearing of
OTC transactions, bilateral margin, segregation of collateral Parties, reporting on the transactions and
the like. The regulatory and supervisory framework Dodd-Frank Act, should: (Joint Report, 2012)
Provides for the registration and comprehensive regulation of swap dealers (“SDs”),
security-based swap dealers (“SBSDs”), major swap participants (“MSPs”), and major
security-based swap participants (“MSBSP”);
Imposes clearing and trade execution requirements on Swaps, subject to certain
exceptions;
Creates recordkeeping and real-time reporting regimes; and
Enhances the Commissions’ rulemaking and enforcement authorities with respect to
certain products, entities, and intermediaries subject to the Commissions’ oversight.
3.6 Implementation and application of international initiative in European Union
Since the outbreak of the crisis, the European Commission, among others, devoted
considerable attention to the regulation of OTC financial derivatives market. As of October 2009, the
Commission is actively working on finding solutions OTC financial derivatives markets, focusing on
short notice to CDS markets in order to build and start work clearing trade in Europe and in the
medium term, systematic monitoring of derivatives. Commission, 3 July 2009, "passed the first
communication that examines the role that derivatives played in the financial crisis, look at the
benefits and risks of derivatives markets as well as evaluating the identified risks have been reduced,"
and other communication, October 20, "said that the future political activities of the Commission ,
which aim to suggest, increasing transparency, reducing the risk of contracting partners and
operational risks, enhance market integrity and oversight on derivatives markets "(Regulation of the
European Parliament and of the Council, COM (2010) 484)
The European Council (EC) is, by analogy, the recommendations of the G 20 in Pittsburgh
issued a second conclusion December 2009, the need to revise the existing regulatory framework,
Volume II, Chapter 3 Dragan Miodrag Momirović
70
OTC financial derivatives market, in order to mitigate credit risk, improve transparency, liquidity,
efficiency and strengthen market integrity. The legal basis for the implementation of the proposal
concluded EC Regulation defines the 114th, Treaty on the Functioning of the European Union
(TFEU). Regulation is considered to be the most appropriate legal instrument to directly introduce a
mandatory requirement for all participants in the standardization of OTC financial derivatives clearing
through CCP and ensure that CCP take the consequences and significant concentrations of risk is
subject to uniform prudential standards of the EU. (Regulation of the European Parliament and of the
Council, COM (2010) 265)
September 2010, The European Council issued the act proposed by the European market
infrastructure regulation (EMIR) which, unlike the directive, has the force of law, and the endorsement
cover all jurisdictions in the EU. EMIR proposal contains requirements to increase transparency and
reduce credit and operational risk. At the same time these requests seek EMIR: (Joint Report, 2012)
Reporting of derivatives transactions to TRs and creates a new regulatory framework
for TRs;
Clearing of eligible OTC derivatives through CCPs and enhances the existing
regulatory framework for CCPs;
Measures to reduce counterparty credit risk and operational risk for bilaterally
transacted OTC derivatives.
Proposed regulation after publication of OTC financial derivatives markets by the EU Council
and the European Parliament have repeatedly revised proposal EMIR, as part of the legal process, in
a sense, solving some different views, but by the end of 2012., ultimately shape the law, Commission
in December 2010, published a public consultation on the revision of the Markets in Financial
Instruments Directive (MiFID) insisting comment on a draft revision of several existing directives,
including the revision of the directive proposal OTC financial derivatives, requiring that certain OTC
trading of financial derivatives is done on the stock exchange or electronic platform. In October 2011,
the EC published two draft proposals - one for revising MiFID19 (Revised MiFID) and the other for
creating a new regulation entitled the Markets in Financial Instruments Regulation (MiFIR) together
with EMIR, “EU Regulations. (Joint report, 2012)
After several discussions and review of legislative proposals, the Commission for the
regulation of OTC financial derivatives central contracting parties and trade repositories, European
Commission, European Parliament and European Council reached political agreement on 9. March
2012, on acceptance of bills EMIR to make it 29th March 2012, The European Parliament formally
adopted. EMIR decree adopted on regulating OTC derivatives are fairly stringent, as imposed through
central clearing CCP with the underwriting obligation of the contracting parties, as well as enforcing
financial obligations of the non-solvent. Clearing members are required to pass a certain amount of
money to cover the initial margin, which are designed to cover the changes that can occur in market
values, and to serve as a buffer to cover the loss. Each CCP should have special financial fund
contributions of its members. Altitude contribution margin and CCP will be measured and determined
on the basis of liquidity and credit ratings of each member of exposure and cost, requiring constant
19 The revised MiFID and MiFIR and relate to a wide range of financial instruments, including OTC derivatives. The revised MiFID
includes provisions for providers of investment services, investor protection, reporting, etc... MiFIR provisions include OTC transactions through the disclosure of trade, trade execution required in commercial areas, control activities and the elimination of trade barriers between providers and clearing services.
Financial Aspects of Recent Trends in the Global Economy
71
adaptation to specific situations. Segregation includes the so-called obligation "individual client
segregation" where assets and positions of every client should be distinguished from those that were
withheld for another client, (Smith, 2012). Further, it implies that the client is not exposed to losses
due to other positions; however, it should be provided timely return of his assets after the insolvency
of a clearing member.
Clearing obligations will be determined on the basis of the adopted two approaches "a top-
down", according to which the ESMA on its own initiative in consultation with the European
Commission for systemic risk (ESRB) to assess whether mandatory clearing applied to a derivative
that CCP has no power and access to the "bottom-up", where the CCP, in accordance with national
super-auditors can decide which contracts will be subject to mandatory clearing.
Standardized OTC derivatives contracts, which are traded on organized markets will be
subject to mandatory clearing through CCPs, as opposed to the revocation of which will require more
collateral. The argument that the collateral may concentration could cause risk, resolved by strict
prudential supervision, and strengthening organizational and commercial risk management with CCP.
Strict technical standards that are preparing to remove these doubts.
All derivative contracts, including OTC derivatives, in the future must be logged in and
registered with the central trade repositories20, in order to provide monitoring and control. Models are
exceptions to the mandatory clearing (CCP) related, the pension funds for a three-year, non-financial
firms that are below the "clearing threshold" and has some specific circumstances (hedging activities
of the Treasury, intra-group transactions). ESMA, ESRB and other relevant authorities are obliged to
do the draft technical standards "clearing threshold". Complex derivative products will remain without
a central clearing to additional regulations implementing Basel III will be subject to higher regulatory
capital charges and other credit risk mitigation procedures risk. (Smith, 2012)
Be sure the timely reporting of trade, improving transparency. In addition, EMIR will focus on
the post-trade OTC derivatives and other, unresolved aspects of regulation, cooperating with all
relevant authorities and regulatory bodies. Given that the regulations are taken in the form of EMIR
regulation, it will require implementation in national legislation but will be directly binding on member
states. (Smith, 2012) At the same time, the EMIR should be viewed in the broader global dimension,
especially within the recommendations of the Pittsburgh Summit 2009, in the context of the G20
commitments to implement strong measures of control and building a new structure of OTC
derivatives.
In light of the overall changes in the regulatory ESMA shall prescribe rules for the formation of
new markets and shopping centers in the central database where the participants of OTC financial
derivatives markets will be required to register all their transactions. Registered derivatives transaction
classification is by classes, in order to provide greater clarity and access to interested vendors.
Application of ESMA is expected after the full adoption of technical standards, drafted 16th published
February 2011, in the form of a consultative document entitled "Draft Regulation on technical
standards OTC derivatives, CCPs and trade repositories".
20 In the trade repository must be registered financial firms, banks, insurance companies, funds, etc... and non-financial organizations
(companies-energy, manufacturing, etc.) which have a large share in the sale of derivatives

Volume II, Chapter 3 Dragan Miodrag Momirović
72
The final text of the Regulation of the European Parliament and of the Council on OTC
Derivatives, Central Counterparties and Trade Repositories were published on 27 July 2012 in the
Official Journal of the European Union. EMIR will introduce significant changes to the over-the counter
(OTC) derivatives market by mandating central clearing for standardized contracts and imposing risk
mitigation standards for non-centrally cleared contracts. There will also be wide reporting
requirements. The clearing obligation will apply to both financial counterparties and non-financial
counterparties who exceed certain thresholds, and will apply broadly to OTC derivative contracts,
including interest rate, credit, equity, and foreign exchange and commodity derivatives. EMIR enters
into force on 16 August 2012. However, implementation will be gradual. The technical standards on
various topics regarding the clearing obligation, CCP requirements and trade repositories are still
being finalized, with the European Securities and Markets Authority (ESMA) and the other European
Supervisory Authorities (ESA) due to propose final technical standards to the EU Commission by 30
September 2012. Thereafter the Commission must formally adopt technical standards through
delegated acts. Existing EU CCPs will then have six months to apply for reauthorization, and once a
CCP has been authorized under EMIR, ESMA will consider whether to apply a clearing obligation to
the derivatives it clears. We expect the first central clearing obligations to be imposed in summer
2013. (Smith, 2012)
It is expected that primary legislation will be finally finished with the requirement to adopt by
the end of 2012, and implementation of the 2013. Since the form of regulations, it will be binding and
directly applicable in all Member States, without any further national implementation.
3.7 Differences and similarities of the new regulatory framework the European Union and
United States
Access to US and EU regulators to design a new institutional structure of OTC financial
derivatives market has a lot in common but different views. Adopted acts of the European
Commission and the Dodd-Frank Act are quite common, similar and different points. With respect to
regulatory responsibilities, derivative trading in the EU continues to be regulated by relevant national
regulators, and CCPs in the EU will come under the supervision of them too. (Janda, Rausser, 2011)
The EU ESMA will play a major role in the regulation of the task to control the CCP that not European.
In the US Dood-Frank Act allows the distribution of responsibilities between the CFTC, which has
jurisdiction over swaps and SEC, which has jurisdiction over security-based swaps. Implementation
period is different. Most of the provisions Dood Frank Act and relevant rules went into effect as of July
2011, while the EU Regulation should enter into force by the end of 2012.
Dood-Frank Act and EMIR essentially have the same perimeter. No matter that the EU
Regulation applies to a wide class of OTC derivatives, there are still some limitations. First, the EU
definition does not include spot foreign exchange transactions, and accordingly, the Commission felt
that it was important to exclude commercial forward foreign currency transactions. Second, the
definition also excludes some types of liquid physical commodity transactions. Dood Frank law applies
to a wide class of OTC derivatives, including any agreement, contract or transaction that may in the
future be traded like swap. In the US, foreign exchange swaps and forwards may be exempted by
regulation. Also the US but does not include some sort of liquid physical commodity transactions.
Financial Aspects of Recent Trends in the Global Economy
73
In the other key definitions of financial contracting partners including the EU, banks,
investment companies, insurance companies, registered funds (UCITS), pension funds and
alternative investment funds managers. In the US financial contracting partners are swap dealers,
major swap participants, commodity pools, private funds, employee benefit plans and other entities
mainly from the activities of the banking and financial sector, although the regulator may exempt small
banks, savings associations, and the like. Within this framework, defines the major swap participants
and entities that have a significant position in any class of OTC derivatives, entities that have an
exceptional position and may be exposed to risks that could threaten financial stability and high
leverage, entities that have an important place in any the class of OTC derivatives immense.
When it comes to banking trade OTC derivatives, the EU the EU approach does not introduce
any equivalent to the Dodd-Frank “push out” rule which restricts the derivatives trading activities of
banks. Similarly there is no EU equivalent to the “Volcker-rule” which restricts the proprietary trading
operations of bank groups. As opposed to the US, there is also no provision which would allow
regulators to restrict bank ownership of CCPs in the EU. (Janda et al. 2011) "Push out" rule allows
getting some help from the government and access to cheaper funds from the Federal Reserve banks
for greater trading volume, while Volker rule prohibits proprietary trading of many derivative
instruments regulated by some financial institutions or branches.
MiFID is within its jurisdiction, requires the dealer to the EU must have the power in their
dealings with OTC derivatives. There are exceptions when it comes to mandatory powers, which are
mainly related to certain categories of distributors, although such exemptions do not exist in the US At
the same time authorized dealers imposes rules of business conduct. In the US, Dood-Frank Act
requires the involvement of dealers in OTC derivatives and requires registration of certain major swap
participants and enforces rules of business conduct.
European Regulation requires from ESMA to decide which products will be subject to
mandatory clearing, although the criteria differ from the criteria the US Dood-Frank law requires
regulators to decide which OTC derivatives are subject to clearing, based on defined criteria that are
different from the criteria of the EU, for example, to take into account the competition, clearing costs
etc... In addition, US regulators can act as restricting trade agreement and before cleaning contracts
through CCPs.
The EU clearing obligations relating to the financial business partners with eligible derivative
contracts are entering into a business relationship with the other financial business partners. In the US
the clearing obligation applies to anyone who comes to trade derivatives.
Non-financial contractual partner, the EU may be subject to mandatory clearing if their
positions clearing exceed the threshold. In the US non-financial business partner can withdraw from
the clearing obligation, provided, however, that the use of derivatives for hedging or mitigating risk,
however, is required to notify the regulator on how it will fulfill its obligation to the untreated swaps.
The EU's financial business partners must report details of OTC derivatives contracts, even if
the object of clearing, registered in the trade repository. Non-financial business partners are required
to report their OTC contracts only if its position exceeds a certain threshold. In the US, each swap
must be reported to a registered trade repository.

Volume II, Chapter 3 Dragan Miodrag Momirović
74
The proposed EU Regulation requires financial counterparties (and nonfinancial
counterparties that exceed the clearing threshold) that enter into uncleared derivatives transactions to
have arrangements in place to measure, monitor and mitigate operational and credit risk, including
requirements for electronic confirmation, portfolio valuation and reconciliation, daily mark-to-market,
as well as an appropriately segregated exchange of collateral or an appropriate and proportionate
holding of capital (to be set by regulatory standards (Chance, 2011) Dood-Frank Act imposes
mandatory requirements of capital and margin requirements for all swap dealers and major swap
participants, but the margin requirements should not apply to the end users. The provisions of the law
give the right contractors to require swap dealers or major swap participants to segregate initial
margin on swaps untreated.
EU Regulation contains extensive provisions governing the organization and conduct of the
business of CCP, including liquidity requirements which cover 99% margin exposure. The terms of
portability include customer positions and collateral in case of default by the clearing. Dood-Frank law
gives regulators a major role to develop organizational and business standards for CCPs. It contains
provisions to require collateral for cleared swaps.
A very important institutional difference between the two regulatory approaches is that the
Dodd-Frank Act requires that transactions that are subject to the clearing requirement are also subject
to the mandatory exchange trading requirement. (Janda et al. 2011) Access to the execution of the
contract but not necessarily on the stock exchange or through a registered SEF, a new "category of
regulated multilateral trading facility", (Janda et al 2011). Further, it means that the trade will not occur
if the transaction is exempt from clearing, exchange or SEF and do not swap available to trade. In the
EU there is no suggestion of mandatory requirements to trade on the stock market, but such
provisions may be considered within the directive of MiFID.
Between these two regulatory looked there a significant difference when it comes to access
and "clearing organization ownership rules.”(Janda et al. 2011) Dood-Frank law includes the CFTC
and SEC proposals in the legal framework, with the idea, the limitations of votes of shareholders in a
clearing agency that includes two limitations, first, that no member of no more 20% of the voting
power and other, specialized financial entities that do not hold more than 40% of the voting power.
The alternative is that the voting capital does not exceed 5%. In the EU approach, holders of
significant shareholdings, direct or indirect, must be notified to the regulator, which may refuse
authorization of the CCP if it does not consider such shareholders to be suitable (taking into account
the need to ensure the sound and prudent management of the CCP). (Janda et al. 2011) EMIR does
not contain specific rules on the ownership of voting capital.
3.8 Implications of new regulatory measures
The high degree of regulation of OTC financial derivatives markets on a global and national
level, it will, in the future, affect all market participants, especially the big ones. Dodd-Frank Act and
EMIR Regulation intertwined with Basel III regulations and other regulatory authorities will be
extremely difficult to influence the company to quickly and effectively grasp and understand the new
market realities.
Financial Aspects of Recent Trends in the Global Economy
75
Clearing of OTC derivatives, CCPs competition between investors and portfolio sharing
between clearing and non-clearing will impact on the increase in funding costs for all participants in
the OTC market.
Requests to cover the cost margins, will affect the profitability and reduce the effects of
standardization and price transparency, especially when it comes to compensation payable to the
clearing agencies abroad
At the same time, initial margins requirements and the needs of their everyday adjustments
will affect the collateral securing higher costs for those contracts that have not been cleaned.
Exposure OTC financial derivatives markets netting at the portfolio can lead to loss of benefits,
in the sense that it will be an eligible trade agreements made through a clearing agency unfit through
bilateral agreements with collateral security or agreement. Multiple bilateral trades clearing and
mulching will cause collateral requirements. Therefore, optimization of collateral will be a top priority,
especially in terms of increasing the price of collateral and become a place of management efficiency.
Established a new regulatory framework, in terms of funding costs, at least, will lead to their increase,
which will make it difficult to trade OTC derivatives, and lead to a reduction in liquidity. The revocation
of the contract, it can cause higher capital requirements or financial assets to cover margin
requirements, which will undoubtedly decrease the liquidity. Consequences of that are, disorder
(unfair) competition, because the participants in the market of financial derivatives, selectively choose
their business partners, only regulatory and not by economic power.
There are fears that it will reduce the trade at the international level, as a result of increased
and more stringent demands of national and international regulators, which will directly affect the
possible choice of partner, reduce competition, inefficient allocation of resources collateral, liquidity
and capital resources.
The establishment of a central clearing may result in increased complexity of operational and
procedural tasks, which together with the rest of the major bilateral treaties require two marketing
activities in one place for almost all participants. At the same time, it will affect the load and increase
the pressure on companies that are subject to supervision by the various regulators.
Some proposals adopted laws, regulations and initiatives, or because of any accidental
overlaps, conflicts and gaps can cause potentially new risks that may harm financial stability. In
particular, it focuses on to centralize the clearing process can be a dangerous source of systemic risk,
due to the high concentration of risk in one body.
Uncertainty operating companies and other firms, and all laws, rules and regulations, they
finally enacted, creates uncertainty in the market, as well as discussions and complaints about how it
will affect all of the regulatory requirements for risk, market liquidity and trading. Initially, the
uncertainty will affect the integrated risk management, control and supervision of all financial
fragmented and more heterogeneous market.
The new structure will lead to the creation of equal conditions for all operations, in terms of
jurisdiction, arbitration, monitoring, compliance, joint monitoring activities, identify and mitigate
systemic risk and improve efficiency. At the same time, it will gradually create an environment for
innovation and the evolution of new financial products to existing OTC financial derivatives market, in
a sense, providing new services and tools.
Volume II, Chapter 3 Dragan Miodrag Momirović
76
At the same time, the new structure of OTC financial derivatives market has faced some
criticism, particularly in the US, which is why the proposed revision of certain provisions and certain
provisions of the arbitration to the Constitutional Court, which is mainly related to the negative impact
of the design on the development of financial markets, increasing the cost of participants, collateral
requirements, capital requirements, increase operational activities and more. Although on the other
hand the expectations are higher, especially in alleviating and limiting systemic risk and better risk
management firm.
3.9 Instead of conclusion - international coordination and progress
For the successful implementation of the new institutional structure of OTC financial
derivatives market needed a strong international coordination and cooperation between regulators.
Critical minimum that cooperation and coordination involves the ability of all relevant organs and
bodies to constantly develop shared goals, cooperative and multilateral relations and strengthen its
mission and commitment to the adopted goals. This cooperation is related to the coordination of
activities and actions to be taken to prevent any arbitrage between different jurisdictions with
significant differences in regulatory applications. Therefore, regulatory frameworks and standards for
CCP risk management should be consistent at the international level. Since of all participants required
strict consistency in the implementation of new regulatory and supervisory framework of the OTC
derivatives market. Strict consistency of participants includes the avoidance of possible overlaps in
the various jurisdictions, legal inconsistencies and gaps and potential for conflict of legislative and
regulatory rules and regulations. All this may delay or threaten the reform process and goals.
This consistency is based on a shared commitment to the defined responsibilities, actions and
goals and constantly works on the identification and promotion of unique, compatible approaches in
the search for better, more efficient and sustainable solutions. The challenges of global consistency,
(practical objectives) in addition to avoiding arbitration should apply to avoid market distortions.
Then, the condition of equal opportunities for all can be uncertain and questionable, when it
comes to multilateral coordination between participants originating from different jurisdictions and
between those in which the regulatory framework established by law and applies to those that have
yet to establish new rules. Improving and improving international coordination in the implementation of
the new framework of trade on the OTC financial market demands, and continuing to work together on
identifying gaps and their compliance. International harmonization is successfully achieved in the field
of CCP, electronic trading and risk management. However, there are certain problems when it comes
to coordinated and compatible application and operation of OTC financial derivatives markets at the
international level. The problems of international coordination relating to the timing of the
implementation of laws and regulations, cross-border competition, the implications of the laws and
regulations of local regulators (US, EU) on the global coordination, existing or potential differences
between geographically different jurisdictions and external-territoriality Dood- Frank Act, EMIR and
other organs. Unsolved problems and gaps in the existing international coordination and lack of
compliance, together with the impact of the new structure of OTC financial derivatives markets,
opening up new horizons and vistas "financial reengineering” looking for new products, adapted to
new conditions. In addition, there is a question, how participants in OTC financial derivatives market
Financial Aspects of Recent Trends in the Global Economy
77
required or forced to stick to US law, the EU and other countries, when operating outside of their
reach? Despite all the challenges and problems that encouraging progress has been made in setting
international standards, improvement of national legislation by some jurisdictions and the practical
application of reforms and activities. Substantial progress has been made in the OTC derivatives
markets of the developed US and EU which will be legislative and regulatory ready to implement new
measures by the end of the time limit. Other jurisdictions are at a disadvantage, although they have
made significant strides in legislation, especially regarding central clearing and reporting to trade
repositories. The reason for the lag in some jurisdictions holds the key regulatory frameworks
developed OTC market of the EU and US In addition, some jurisdictions have required a greater
certainty in the application of international principles and the protection of cross-border financial
market infrastructure in order to define an appropriate shape their own financial market infrastructure
in accordance with the recommendations of the G20.
3.10 References
[1] Chance, C. (2012). Regulation of OTC Derivatives Markets. A Comparison of EU and US Initives, ISDA.
[2] Janda, C., Rausser G., (2011). American and European Regulation of Over-the-Counter Derivatives Securities.
[3] Momirović, D. (2012). How to provide equal opportunities for all, Banker, Banking Association of Montenegro, Podgorica.
[4] Shange, C. (2010). The Dodd-Frank Act and the Proposed EU Regulation on OTC Derivatives - Impact on Asian Institutions, ISDA, December.
[5] Sidanius, C., Wetherilt, A. (2012). Thoughts on determining central clearing eligibility of OTC derivatives, Bank of England.
[6] Smith, H. (2012). EMIR: EU Regulation of OTC Derivatives, Central, counterparties and Trade Repositories, Financial regulation briefing.
[7] Smith, H. (2012). EMIR Timeline: Key Dates in the EU Regulation of OTC Derivatives, Central Counterparties and Trade Repositories.
*** Commission of the European community’s ensuring efficient safe and sound markets.
*** FSB. (2010). Implementing OTC Derivatives Market Reforms, October.
*** FSB. (2011). OTC Derivatives Market Reforms, Progress report on Implementation, April.
*** G20. (2009). Leaders summit, Pittsburg.
*** G20. (2011). Leaders summit, Canes.
*** IOSCO. (2012). Requirements for Mandatatory Clearing
*** ISDA. (2010). The Dodd-Frank Act and the Proposed EU Regulation on OTC Derivatives - Impact on Asian Institutions, December.
*** Joint report on international swap regulation, SFCT i SEC 2012.
*** Joint Reports on International Swap Regulation, January, 2012 TRS-trade rep CFTC-SEC.
*** Regulation of the European Parliament and of the Council on OTC derivatives, central counterparties and trade repositories, 2010.
*** Regulation of the European Parliament and of the Council, COM (2010)265.
*** Regulation of the European Parliament and of the Council, COM (2010)484.
*** Technical Committee of IOSCO. 2011. Report on Trading of OTC derivatives, www.skadden.com.
Volume II, Chapter 4 Josef Mládek
78
Chapter 4
FINANCIAL MARKETS PRUDENTIAL REGULATION AS A DYNAMIC SELF-CORRECTIVE PROCESS
by Josef MLÁDEK
University of Economics in Prague, Czech republic
4.1 Financial markets prudential regulation as a dynamic self-corrective process
4.2 Specific features of financial markets prudential regulation
4.3 The corrective process of prudential regulation
4.4 Ex-post critical overview of prudential regulation trends
4.5 Concluding remarks
4.6 References
Financial Aspects of Recent Trends in the Global Economy
79
FINANCIAL MARKETS PRUDENTIAL REGULATION
AS A DYNAMIC SELF-CORRECTIVE PROCESS
Josef MLÁDEK 21
University of Economics in Prague, Czech republic
Abstract
The recent financial crisis has reminded us (again) that the so-called great moderation of macro-
financial cycle was merely a mirage. It is therefore now more than ever appropriate to study the issues of
economic and financial cycle and their interconnections. In this vein of research, risk-based prudential
regulation of financial markets is of center importance. This chapter is therefore structured as follows. First, it
highlights some specific features of prudential regulation in the financial markets. It looks at a different nature
of the regulated risk in financial markets compared with other sectors of the economy and the consequences
thereof for the robustness of the regulation. Related to that, effort of the regulated entities to optimize the
impact of regulation on them is investigated. Finally, lessons learned are applied to shed some more light on
the prospects of regulatory reform in order to achieve more viable and robust risk regulation of financial
markets.
Keywords: financial markets, financial crisis, regulation.
4.1 Financial markets prudential regulation as a dynamic self-corrective process
The recent financial crisis has reminded us (again) that the so-called great moderation of
macro-financial cycle was merely a mirage. It is therefore now more than ever appropriate to study the
issues of economic and financial cycle and their interconnections. In this vein of research, risk-based
prudential regulation of financial markets is of center importance.
A brief initial literature review shows that the drawbacks of prudential risk regulation have been
reflected in the academic debate for quite a while. Doubts over prudential risk regulation include
issues such as regulatory arbitrage or unintended consequences of risk weights inducing increased
risk-taking (See e.g. Rochet, 1992). Baldwin and Black (2010) point out that too much attention is
devoted to the formal process of risk regulation rather than to the risk itself. Consequently,
identification of new forms and manifestations of risk seems to be less straightforward. Danielsson
(2002, p. 1274) points out that if the regulatory risk management actually worked, the systemic
failures should not actually ever happen. He therefore considers regulatory risk management to be
merely a placebo rather than a scientifically proven effective tool of crisis prevention. The decision to
use the relative riskiness of bank assets to calculate regulatory capital adequacy requirements was
according to the professor Goodhart (2005, p. 122) a wrong one. Laurence Meyer, at that time one of
the Fed governors, commented on the challenges faced by prudential regulation: “The growing size
and complexity of banking organizations make the supervisor's job of protecting bank safety and
soundness increasingly difficult. Size, scope, and complexity simply make it more difficult for
21 Josef Mládek, Researcher at University of Economics in Prague, Department of Institutional Economics, W. Churchill Sq. 4, 130
67 Prague 3, Czech Republic
Volume II, Chapter 4 Josef Mládek
80
supervisors to understand and evaluate bank positions and operations. In response, heightened
supervisory focus on risk-management procedures and policies has been under way for some time. ...
However, while new procedures, policies, and tools for risk management may ultimately buttress
supervision and regulation, these tools are based on relatively recent financial theories that have yet
to be tested under the full range of market conditions. Moreover, the sophistication and complexity of
these new tools often make it more difficult, not less, for supervisors to assess the true risk of a
banking organization and to assign appropriate capital requirements. Adding to these difficulties,
supervisors must account for risk exposures that are altered at an ever faster pace.” (Meyer, 1999)
Motivated by the financial and real economy losses caused by the crisis, numerous reform
proposals to amend the prudential regulation were drafted by members of academia and policy
makers and in some cases implemented. However, the main purpose of this chapter is not to consider
specific proposals for regulatory reform. For a better understanding of the principles of prudential
regulation it may be more appropriate to step back a little. Instead of an analysis of specific reform
initiatives it may be more desirable and intellectually fruitful to try to explain the elements of logic of
the prudential regulation. Subsequently, these findings and improved insight into these issues may
indeed allow for an enhanced analysis of consequences of specific regulatory reform proposals.
However, this does not imply that theory of regulation should be primarily based on empiricism. On the
contrary, in this chapter we use logical deduction to build (at least partial elements of) that logic, and
only following from that to comment on the current regulatory reform.
This chapter is therefore structured as follows. First, it highlights some specific features of
prudential regulation in the financial markets. It looks at a different nature of the regulated risk in
financial markets compared with other sectors of the economy and the consequences thereof for the
robustness of the regulation. Related to that, effort of the regulated entities to optimize the impact of
regulation on them is investigated. Finally, lessons learned are applied to shed some more light on the
prospects of regulatory reform in order to achieve more viable and robust risk regulation of financial
markets.
4.2 Specific features of financial markets prudential regulation
It could be argued that prudential regulation of financial markets is generally similar to the
efforts of government to influence outcomes in other industries. Nevertheless, several factors can be
identified which fundamentally distinguish prudential regulation of financial markets. Further on we
therefore discuss (i) greater risk endogeneity in financial markets, (ii) regulatory models of risk
regulation and risk endogeneity, (iii) time-lag before regulatory errors become apparent, (iv)
overlapping and conflicting sources of the regulation and, (v) the fuzzy line separating public and
private entities in financial markets.
A. Greater risk endogeneity in financial markets
Compared to risk regulation of other business sectors the nature of risk is different in financial
markets. Technological risks are of a central importance in the process of safety and prudential
regulation of e.g. a chemical industry or nuclear energy. However, in the case of prudential regulation
Financial Aspects of Recent Trends in the Global Economy
81
of financial markets, human action (e.g., a purposeful response to the incentives provided by the
regulation) comes into the forefront.
It is quite likely that those in charge of e.g. a chemical production process will in some way
adjust to the prudential rules governing their behavior. That is, they may take a course of action that is
complaint with the rules, but may at some margin circumnavigate the initial purpose of the regulation,
consequently making the drafting and implementing process of the regulatory rules more difficult. Risk
regulated by prudential regulation in any industry is therefore essentially always endogenous. But,
there is a greater degree of risk endogeneity in financial markets. Emphasis is deliberately given to
the adjective. In regulation of the “technological processes” risks, there will always be some basic
technical parameters the regulators may comfortably rely upon, because they are constant over time.
For example, the temperature at which certain chemical compounds react in a specific way does not
change as a result of human response to the regulatory rules. In contrast, in the case of prudential
regulation of the financial markets, it is much more difficult to find similar stability of parameters, that
regulation could make use of.
Obviously, some trends, patterns, relationships, causality can indeed by observed in financial
markets too. However, these may often discontinue unexpectedly and for (ex-ante) unknown reasons.
Furthermore, the statistical linkages are more likely to disappear if they are utilized in the regulatory
process. The famous Goodhart's law claims that the regulated entities are likely to adjust their action
in response to the incentives provided by the regulation and consequently weaken the initial causal
link between the goals of the regulation and the intermediating control variable used to accomplish the
regulatory objectives (see Goodhart and Mizen, 2003, pp. 241 - 246).
The optimization of the impact of regulation by the regulated entities upon themselves (even
while the rules of the regulation are observed), i.e. regulatory arbitrage, may take different forms. The
regulated entities may make use of regulation (1) in another jurisdiction, (2) for a different asset class
or for another segment of financial markets. Acharya et al. (2011, p.44) focus predominantly on the
second option, stating that regulatory arbitrage is the cause of the parallel financial (or shadow
banking) system, which reflects the ability of financial sector to create such organizational forms of
enterprise and engage in financial innovation in order to circumvent regulatory rules designed to limit
risk-taking by banks. The regulatory arbitrage leads to a reduction of capital requirements without
proportionate limits to undertaken risk exposures and at the same time increases complexity and
reduces the transparency of these financial businesses for other market participants and the
regulators (Jackson and Perraudin, 2000). The adjustment to capital adequacy rules and the
optimization of capital requirements by using asset securitization is discussed in Jones (2000).
Prudential regulation of the financial sector does not match the referred analogy of ensuring
safe operations of (even technologically complex) industrial production also because of the greater
complexity of the financial markets (see Haldane, 2009). Moreover, the complexity seems to be rising,
partly due to information technology and other factors reducing the costs of engaging in complex
activities and structures, but also to some extent because of complex organizational structures being
created on purpose in order to make policing of government guarantees more difficult and thereby to
extract higher private rents (see Jones, 2000, p. 37).
Volume II, Chapter 4 Josef Mládek
82
B. Regulatory models of risk regulation and risk endogeneity
Danielsson (2002, p. 1274-1276) notices a number of reasons of the failure of models of
regulatory risk management. These, according to him do not sufficiently reflect: (1) the limited ability of
past observations of market developments to be still relevant in the future, (2) the feedback between
action of market participants and the financial markets' outcomes, (3) a change in the statistical
parameters of the analyzed time series during a crisis period, even if investors tend to behave
differently during periods of an increased volatility, (4) the ability of the subjects of regulation to
circumvent and reduce the effectiveness of the regulatory rules.
Risk management models can obviously be improved over time and become more
sophisticated so that some of these objections can be mitigated. Despite that, the regulated entities
will always have their own interest to respond to the regulation to limit its costly impact on them.
Risk in the financial markets is therefore not determined from the outside, but on the contrary it
is an endogenous variable generated within the analyzed system. In order to be effective, risk
regulation needs to be able to adjust to market responses to it relatively quickly and appropriately.
Danielsson (ibid.) contrasts regulatory risk management in financial markets with weather prediction.
Unlike regulatory risk management, the very fact that weather is forecast does not affect the outcome.
In the case of regulation of risk, response of the subjects of the regulation to the risk regulation may
influence financial markets outcomes and the risk exposures undertaken. In addition, the similar
patterns of investment actions induced by regulatory risk management may cause liquidity problems
and may lead to higher volatility in asset prices (see Danielsson, 2002, p. 1276; Danielsson et al.,
2004). If regulations limit the opportunities of banks to optimize their positions at individual level, they
may incline to act more alike. Therefore, in particular during the crisis periods, this can produce more
volatile price developments due to increased discrepancy in supply and demand of specific assets,
and in turn limit liquidity and increase price volatility. Reliance on (in some sense) similar regulatory
approaches to risk management across financial institutions or similarities of adjustment to the
regulatory requirements has made the structure of the balance sheets of regulated institutions in some
way more similar.
Commenting on the risk endogeneity in financial markets prudential regulation, Danielsson
(2002, p. 1293) formulates an analogy of Goodhart's Law. Most existing risk models do not function
according to him properly in times of crisis, as the stochastic process of the market prices discovery is
endogenous to negotiations between market participants. If the prudential regulator attempts to
manage this process, it changes its dynamics, and consequently risk prediction ceases to be reliable.
To restate this, if you start to use models of regulatory risk management, their predictive power is
likely to lose its original properties.
If the regulatory models took into account to a greater degree specific risks of a particular
group of entities the issue of regulatory arbitrage could paradoxically become even more pronounced.
For example Morrison (2011) supports increased capital requirements for banks that are (supposedly)
too big to fail. At the same time, however, he is concerned that the specific requirements for a group of
entities will provide an additional opportunity for regulatory arbitrage. Similarly, De la Torre et al.
(2010) warn that tougher regulation of systemically important financial institutions would result in
circumvention of regulation and would only make the issue of correct setting of specific boundaries of
Financial Aspects of Recent Trends in the Global Economy
83
the regulatory treatment of different categories of regulated entities more pervasive.
Prudential regulation would according to these authors have to be continuously adjusted as
forces of regulatory arbitrage would make the financial firms outside the scope of the systemic
regulation more systemic (De la Torre et al., 2010, p. 27). In order to prevent circumvention of the
regulation and to limit the need for constant modification of its settings, the authors recommend a
uniform regulatory treatment of all segments of the financial market (De la Torre et al., 2010, p. 43).
The resilience and robustness of the proposal is however questionable, as the uniform approach may
not fully reflect the specific risks undertaken by the individual entities.
C. Time lag before regulatory errors become apparent
It needs to be pointed out that given the complexity of financial markets and the implied
difficulty to prudentially regulate them, relatively early materialization of inefficiencies caused by
regulatory failures can be a key (be it costly) indirect guideline to improve the quality of the regulation.
However, it may usually take a longer time in the financial markets before risks and imbalances
resulting from the regulatory errors become apparent. For example, it may take many years before
inefficient investments are manifested in a full asset bubble burst.
In contrast, an accident is likely to occur soon after safety rules are breached in a technological
process and moreover the extent of this rules violation (before an accident takes place) can usually be
observed by measurements of natural sciences.
At the same time it needs to be noted that the regulatory errors can operate in conjunction, so
an accident (a financial crisis) is more difficult to be traced back to a specific (set of) failure(s) in the
regulatory framework. Therefore, regulatory failure materialization is more important in the sense of
public debate, i.e. it signals that something needs to be done, rather than what exactly should be
done. The interlinkage can work in both directions, though. Not only that a materialization of losses
may support a needed public policy action to take place, public policy may postpone risk
materialization (so that for example politicians are reelected on good economy).
Obviously various negative developments and imbalances being accumulated can be with
some accuracy observed and estimated by economists in advance, however (again) these
observations cannot be confused with ease of direct measurement of, e.g. a rising temperature in a
nuclear power-plant cooling system. In addition, the currently very popular early warning indicators
may be a partial cause of the problem rather than an ideal cure. Due to the so-called paradox of
financial stability, precisely in the period of the fastest accumulation of risk and rising imbalances, the
financial sector and real economy usually appear to be most healthy. The seeming resilience is
usually underpinned by cyclically and structurally unsustainable factors some of them are (by
definition) recognized only after the bubble bursts.
With the corrective information signals of the prudential regulation failure being belated and
indirect to rely upon, expectations of what prudential regulation can deliver need to be assessed with
caution. An overambitious regulatory framework of financial stability may promote risk accumulation
on the sidelines and thus incur costly losses on the society.

Volume II, Chapter 4 Josef Mládek
84
D. Overlapping and conflicting sources of the regulation
The conduct of prudential regulation, its practical organization and possible reform is also
being complicated by the fact that it is usually conducted by a number of organizations and that their
functions to some extent overlap. Failure of prudential regulation to maintain financial stability or
prevent the transmission of destabilization of the financial sector into the real economy can result in
an increased political willingness (and necessity) to intervene further with use of public support
measures.
Prudential regulation in the narrow sense of the word has to deal with potentially destabilizing
consequences of wide range of government policies in other areas such as housing, land-use
planning, demography, social spending, fiscal policy, etc. As it has been mentioned, a much needed
adjustment of prudential regulation can be also delayed by the incentives of a political cycle to
postpone risk materialization.
A monetary authority may serve as an accommodating solution to an acute outburst of failure
of prudential regulation in the sense that, due to its monopoly on the production of money it can under
some conditions provide the ultimate liquidity backstop to avert a collapse of the financial sector. At
the same time, however, the monetary policy, because of its impact on the time value of money can
create bubbles in asset markets, increase pro-cyclicality and stimulate search for yield. Monetary
policy can thus itself be a source of instability in the financial markets that weakens the effectiveness
of prudential regulation. Moreover, the existence of monetary policy in terms of timely, organizationally
and politically relatively easy to apply instrument to support the financial sector by public authorities,
may increase expectations of a future bailout. Monetary policy can thus hamper the public authorities'
ability to credibly commit themselves not to provide bailouts. This is both because of the fact that
increased inefficiency of prudential regulation is more likely to ex post necessitate a bailout, and
because of higher ex ante expectations of a bailout due to the relatively practical easiness to do so by
an expansionary monetary policy.
E. Fuzzy line separating public and private entities in financial markets
Practical conduct and in particular reform of prudential regulation is also hampered by the
unclear boundaries between public and private sectors. This objection can be raised in other
regulated sectors of the economy as well, but its repercussions are more significant in the complex
financial markets.
A de jure private firm can act as a public organization to some extent, if it gained a(n implicit)
privilege to perform its activities as a result of a government intervention (e.g. rating agencies due to
their specific role in prudential risk regulation in some jurisdictions). In theory, the private interests may
thus be willing to oppose a change in the regulatory status quo because they may fear the
uncertainties of their future role due to the reform.
Neither the costs to change a provider of a regulatory framework are always a reliable
distinguishing feature between private and public arrangements. A public framework can also be opted
out by transferring activities to other jurisdictions. On the contrary, a system of regulatory rules
provided by competing private entities, such as a specific trading platform, can be prohibitively costly
Financial Aspects of Recent Trends in the Global Economy
85
to exit for the participants. Value of specific assets (such as a greater knowledge and reliability of
trading counter-parties due to the past transactions) may create a lock-in like situation even if the
rules' framework is operated by a competing provider. Collective action may thus be necessary under
both private and public regulatory rules arrangements to articulate a credible threat of exit and/or re-
bargain the regulatory rules.
Because of the interconnections between public and private entities and more specifically due
to the fact that prudential regulation usually sets the implicit charge for provision of a (be it
monopolistic) government “insurance scheme” of financial stability, efforts to “liberalize” prudential
regulation need to be considered with an appropriate caution. It could hardly be justified that the cost
of the insurance (i.e. the prudential requirements) was lowered (as a result of the “liberalization”), if at
the same time the public authorities may fail to credibly commit themselves to limiting the scope and
extent of the insurance pay-out.
4.3 The corrective process of prudential regulation
Continuous adjustment of regulatory rules is inevitable because of changes in market
conditions autonomous to the regulation, the response of regulated entities to the regulation and also
due to possible initial mistakes and errors made during the drafting of the prudential regulation.
Baldwin and Black (2008) summarize the various tasks of prudential regulation that it is able to
respond effectively to these developments. The regulation must, according to them, identify
developments that are undesirable or distorting the effort to meet the regulatory objectives, respond
to such behavior by implementing appropriate instruments, evaluate their success or failure, and if
necessary modify the procedures of regulation again. Fine-tuning of regulation over time is supported
by many other authors. Acharya et al. (2011, p. 44) criticize ignorance of regulatory arbitrage. Jones
(2000) asks for a better alignment of regulatory risk measurement with the actual extent of the risk
exposures undertaken by the banks. Given the changing market conditions, this is an implicit
expression of support for discretionary adjustments of regulation. De la Torre et al. (2010, p. 42)
criticize too slow response to changes in the structure of financial markets in the US, which led to a
decline in the effectiveness of the Glass-Steagall Act. Insufficient regulatory adjustments to financial
market developments that later led to the subprime mortgage crisis in the US are pointed out in Calem
and Follain (2007). Prudential regulation of financial markets tends to be criticized for its static nature
and inability to respond to market developments (e.g. Whitehead, 2011). Due to the speed of changes
in financial markets, the timeliness of regulatory response is a key factor of quality of prudential risk
regulation. However, all human action (including the processes that weaken the initial effectiveness of
the regulation) does happen over time. Therefore ensuring that the prudential regulators have the
incentives and information signals to respond relatively timely is of fundamental importance.
Regulation needs safeguards that prevent it from deviating on a path of social-wide
inefficiencies and/or redistribution. However these safeguards are inevitably themselves weakened by
the adverse effects they are supposed to protect the regulatory process from. Any safeguard is
therefore also endogenous to the process of regulation. Therefore, it is necessary to examine the
regulation as self-corrective process and look for robust long-term sources of discipline rather than
static safeguards.

Volume II, Chapter 4 Josef Mládek
86
Regulators can in theory be disciplined in multiple ways. There can be competition inside a
jurisdiction among regulators with overlapping powers. Or regulators in different jurisdictions can
compete against each other. Some argue that a decentralized conduct of prudential regulation within
smaller jurisdictions may improve discipline faced by the regulators due to an increased threat of
competition. Moreover, the smaller-jurisdiction-specific regulations may reflect local conditions more
appropriately. In addition, a higher number of jurisdictions also allows for a higher number of
independent experiments in specific regulatory settings. Therefore the regulators are likely to receive
more frequent and timely information signals about consequences of specific regulatory settings and
these can be compared in a cross-border manner. Moreover, a suboptimal regulatory decision will
only effect a smaller geographical area and the consequences will therefore be likely quantitatively
less severe. In smaller jurisdictions there usually also prevails a closer fiscal and democratic link
between the provider of a public good and the taxpayers, limiting the scope for rent-seeking.
However, the idea of small regulatory jurisdictions is simultaneously subject to criticism. The
critics claim, that a small size of jurisdiction may not reflect the need to regulate a globally
interconnected cross-border financial sector (see, e.g. Hardy and Nieto, 2011). Decentralized
competition without discipline, i.e. a clear and credible budget constraint is also likely to end in the
infamous race to the bottom. To prevent it, political mechanisms need to be examined. Functioning
democratic process may prevent regulatory capture and ensure that regulators serve the taxpayers
rather than any special interest groups. However, even that does not ensure the efficiency of the
regulation and does not prevent losses borne by the society as a whole. Even if democratic decision
making is not fully successful in preventing the dispersion of cots on to the public while concentrated
rents are captured by special interests, there can be other ways of limiting that. Special interests can
be held in check by themselves. In theory, they can compete against each other. Or, financial sector
in its own interest may be willing to prevent major financial crisis resulting into socialization of losses,
because it may fear the destabilization and long-term loss of profit opportunities. This may be in
particular the case in “financial centers” that can be punished by a loss of trust by their global clients,
who can easily chose between several options to allocate their assets. However, this self-interest of
the financial industry in a global financial center may prevent a one-off crisis, but it is less likely to help
avoid a slow, gradual process of cost dispersion facilitated by e.g. financial repression.
Sources of timely and appropriate information signals and discipline are in practice usually
closely linked, but are obviously not the same. An undisciplined framework of prudential regulation
that engages in redistribution may consequently get into a shape that makes collection of information
signals and manageability of the system in an efficient way hardly possible. But even prudential
regulators that face substantial discipline do not necessarily need to succeed in acting in an efficient
manner, even if they are more likely to be incentivized to do so.
4.4 Ex-post critical overview of prudential regulation trends
Effort to improve the effectiveness of the regulation and to limit the (unintended) redistribution
because of the regulation is (as it has been noted) were both (and still are) at the top of the reform to
do list after the 2008 crisis. However, following from the findings made so far, several concerns related
to the authorities' response to the crisis and developments since then can be identified. Here, we take
Financial Aspects of Recent Trends in the Global Economy
87
a look at just two of them. (I) the effort to accommodate financial markets by monetary policy
response has facilitated search for yield and has made risk prudential regulation more difficult. (II)
numerous new proposals were enacted contributing to greater regulatory complexity rising worries
about its practical implementation. But is an explicit quest for per se simple regulation to be
recommended?
A. Monetary policy accommodation and search for yield
The unprecedented monetary policy easing conducted by major central banks in response to
the crisis has (so far) managed to prevent a major financial melt-down. However, it has had some
unintended consequences too.
The cheap and available liquidity (at least to some counter-parties) has set-off yet another
period of search for yield and contributed to accumulation of debt and risk in balance sheets of (at
least) some financial market participants. Consequently, regulatory risk management has become
even more difficult. Monetary policy has increased the volatility of health of financial institutions, as
quality of assets held by the institutions has become ever more dependent on what the monetary
authorities (are perceived and expected to) do. As a result, a credible commitment not to provide bail-
out became even tougher to achieve.
Moreover, the monetary policy response has had a differentiated effect on developed and
emerging economies. In the developed, more indebted economies, it has failed to kick start
investment growth because of ongoing restructuring and deleveraging and a weak demand for credit.
Furthermore, reform of prudential risk regulation and ongoing policy concerns about Eurozone have
supported demand for assets, deemed to be safe by the financial market participants and also their
regulators.
In contrast to developed economies the global monetary easing has kick-started growth in
emerging markets. The liquidity and credit provided by central banks in developed markets entered
new segments in a potentially overconfident manner. Emerging markets debt yields have declined as
the asset class benefited from generally low levels of public and private debt and (at that time at least)
positive growth outlook. But the case is far from being clear cut. Economic performance was boosted
by growth of credit, investment and construction in countries such as Turkey, China or Poland.
Soaring demand for commodities, advanced technologies and big scale industrial projects has
supported exports not only from emerging markets but from some developed economies as well
including Eurozone members. The global interconnections in real economy and financial markets
have intensified again and also changed their structure. As a result, a wide range of countries could
be left hurt in an unexpected way in case of a future slow-down of the global economy.
The key learning should be that to assess domestic financial market developments and quality
of assets of local financial institutions the relevant authorities may need to consider a wide range of
global issues and interconnected causes. Alternative investment structures in China, high share of
consumer credit in Brazil, commodities super-cycle, global capital movements as a driver of
sustainability of public debt in India - these are some of the issues macroprudential authorities may
need to consider and grasp to be able to provide relevant advice. Macroprudential policy has never
been more difficult. It may be very useful as an alarm bell, but anything more than that again runs risk
of an overambitious regulation that is likely to fail.
Volume II, Chapter 4 Josef Mládek
88
B. Focus on the regulatory process rather than specific properties of its outcome
In the recent past it was widely believed that more detailed risk regulation will provide a
significant improvement; many looked with optimism at a transition to a Basel II (see e.g. Illing and
Paulin, 2005, p. 166; Lastra, 2004, p. 230). This is not to say that Basel I, II or III is necessarily more
or less appropriate. The key mistake (of academia in particular) is the enthusiasm to discover a short
cut to the desired outcome of regulation rather than to study regulation as a dynamic process of
evolutionary testing of ability of specific regulatory settings to produce the desired outcomes.
Haldane (2012) provides a remarkable case in favor of simple rather than complex prudential
regulation of financial markets. He points out the increasing complexity from Basel I to Basel II and III.
Consequently, he argues that complex regulation may be difficult to operate practically and may yield
suboptimal outcomes compared to simpler regulatory solutions. Haldane makes a rare, but a much
need case. However, his argument suffers from a number of weaknesses.
As the title of Haldane's article suggests an analogy of a dog catching a frisbee is used to
illustrate that an overcomplicated approach may help in catching neither a frisbee nor a financial
crisis. However the analogy is far from perfect. A dog running to catch a frisbee does not influence the
trajectory and other properties of its flight. In contrast, a regulator trying to catch and mitigate a
financial crisis does. In case of a frisbee physical parameters and analytical tools of natural sciences
can help to explain the path of the flight. In the financial markets, the path and the outcome depend on
a complex feedback response to the regulation by the regulated entities.
Knowing what not to do may help. But the idea to avoid overcomplexity hardly provides a
solution on what should be done. Moving away from regulatory complexity is not simple:
The difficulties in implementing and enforcing complex prudential rules do not necessarily imply
that simple rules would produce more desirable outcomes. On the contrary, they may fall prey to
similar regulatory arbitrage processes as complex regulations. The simpler rules may benefit from
easier policing and enforcement, but on the other hand they may not in the same manner cover all
the specific risks undertaken by financial markets participants.
It is possible that predictive power of simple measures in forecasting a bank failure may be a bit
overestimated. A simple measure may benefit in terms of its predictive power from the fact that it
was not used in practice recently, and therefore the regulated entities did not strategically adjust to
it their actions (e.g. asset allocations and portfolio structure). Therefore the Goodhart’s law did not
apply, but it would have, if the measure had been used.
Your enemy's enemy does not have to be your friend. Showing that complex regulation is not
likely to work does not provide a clear cut argument for simple regulation. Haldane fails to provide
answers on what should be done, and how should the desired outcomes be achieved. How much
more simple regulation should be implemented, and specifically in what areas? How would the
simple regulation cover the risks in complex financial markets? Haldane admits that simple rules
run the risk of “backdoor complexity“. So what would prevent the simple regulation from being
weakened by regulatory arbitrage or from deviating onto the path of gradually increasing
complexity?
Regulation is a dynamic path dependent process. Understanding the “appropriate properties”
of the outcome of regulatory design may not be enough. It may fail to provide the solution that fits the
Financial Aspects of Recent Trends in the Global Economy
89
local time- and jurisdiction- specific circumstances and culture. A few isolated “appropriate properties”
of regulation are not necessarily the same as the right process necessary to reach them and sustain
them. A functioning regulation that prevents inefficiencies and rent-seeking is indeed likely to be in
some sense simple. But simple regulation does not guarantee achieving these goals.
Moreover, simplicity or complexity of regulation is an outcome rather than a goal. It is a result
of the process of evolution of prudential regulation. Regulators need to be disciplined by those who
pay for it so that they have incentives to try to act on the discovered regulatory inefficiencies.
Regulatory complexity may obviously turn out undesirable, but not as such, rather as a result of a
failure of regulatory complexity to deliver. For example, complex regulatory systems may provide
feedback signals on regulatory errors too late. Again however, the quest for simplicity is rather an
indirect outcome of the search for efficient regulation.
4.5 Concluding remarks
Optimistic expectations of what can prudential regulation of financial markets achieve form the
risk of creating a too ambitious and thus vulnerable system. As it has been noted, in contrast to
natural sciences, risk cannot be measured reliably in financial markets. Parameters of prudential
regulation are more volatile due to purposeful human action incentivized by the regulation itself.
Signals of regulatory failure are due to the Sisyphean complexity of the task undertaken often only
indirect, blurred and belated. Multiple policy actions and private and public organizations impact the
outcome of prudential regulation of financial markets and their implications may be difficult to trace,
separate and reform. Moreover, because of the complex interconnections between financial markets
and real economy, effort to stabilize the cycle of financial markets requires that the competent
authorities can understand the real economy cycle and distinguish it from the structural changes in the
real economy. This can be very difficult not only due to potential economic policy pressures but
primarily because of cognitive issues.
Following from the previous points, it is obvious that financial markets and the system of their
prudential regulation can move for a relatively long time along a path of an unsustainable risk
accumulation resulting into huge losses when the imbalances and bubbles burst. Therefore an early
and reasonably appropriate corrective process of prudential regulation is key, so that not only
redistribution (socialization of losses) but also (and perhaps more importantly) wider societal-
inefficiencies are prevented soon enough from further accumulation and escalation. That is why,
guiding information signals and discipline (is discussed in this chapter) need to be provided to the
regulators so that they are both able and willing to adjust the regulatory framework efficiently.
4.6 References
[1] Acharya, V.V., Cooley, T., Richardson, M., Sylla, R., Walter, I. (2011). The Dodd-Frank Wall Street Reform and Consumer Protection Act: Accomplishments and Limitations. Journal of Applied Corporate Finance, 23(1): 43–56.
[2] Baldwin, R., Black, J. (2008). Really responsive regulation. The Modern Law Review, 71(1):59–94, doi: DOI: 10.1111/j.1468-2230.2008.00681.x.
[3] Baldwin, R., Black, J. (2010). Really Responsive Risk-Based Regulation. Law & Policy, 32(2): 181–213.
[4] Calem, P., Follain, J.R. (2007). Regulatory capital arbitrage and the potential competitive impact of Basel
Volume II, Chapter 4 Josef Mládek
90
II in the market for residential mortgages. The Journal of Real Estate Finance and Economics, 35(2): 197–219.
[5] Calomiris, C.W. (2011). An Incentive-Robust Programme for Financial Reform. The Manchester School, 79: 39–72.
[6] Danielsson, J. (2002). The emperor has no clothes: limits to risk modelling. Journal of Banking & Finance, 26(7): 1273–1296.
[7] Danielsson, J., Shin, H., Zigrand, J.P. (2004). The impact of risk regulation on price dynamics. Journal of Banking & Finance, 28(5): 1069–1087.
[8] de la Torre, A., Ize, A. and Skeie, D.R. (2010). Containing Systemic Risk: Paradigm-Based Perspectives on Regulatory Reform. Economía, 11 (1): 25–64.
[9] Goodhart, C. (2005). Financial regulation, credit risk and financial stability. National Institute Economic Review, 192 (1): 118–127.
[10] Goodhart, C., Mizen, P. (2003). Central Banking, Monetary Theory and Practice: Essays in Honour of Charles Goodhart. Edward Elgar.
[11] Haldane, A.G. (2009). Rethinking the financial network. Speech delivered at the Financial Student Association, Amsterdam, April [online].
[12] Haldane, A.G., May, R.M. (2011). Systemic risk in banking ecosystems. Nature, 469(7330): 351–355.
[13] Hardy, D.C., Nieto, M.J. (2011). Cross-border coordination of prudential supervision and deposit guarantees. Journal of Financial Stability, 7(3): 155–164.
[14] Houben, A., Kakes, J. (2011). Risk Identification and Mitigation: Lessons from the Crisis. Regulation and Banking after the Crisis. Vienna: SUERF. Available at: http://mx1.suerf.org/download/studies/study20112. pdf#page=83.
[15] Illing, M., Paulin, G. (2005). Basel II and the cyclicality of bank capital. Canadian Public Policy/Analyse de Politiques, 31(2): 161-180.
[16] Jones, D. (2000). Emerging problems with the Basel Capital Accord: Regulatory capital arbitrage and related issues. Journal of Banking & Finance, 24(2000): 35–58.
[17] Kadak, A.C., Matsuo, T. (2007). The nuclear industry’s transition to risk-informed regulation and operation in the United States. Reliability Engineering & System Safety, 92(5): 609–618.
[18] Lastra, R.M. (2004). Risk-based capital requirements and their impact upon the banking industry: Basel II and CAD III. Journal of Financial Regulation and Compliance, 12(3): 225–239.
[19] Meyer, L.H. (1999). Remarks before the Conference on Reforming Bank Capital Standards. Conference on Reforming Bank Capital Standards, Sponsored by Ernst & Young and AEI-Brookings Joint Center on Regulatory Studies, Council on Foreign Relations [online]. New York.
[20] Morrison, A.D. (2011). Systemic risks and the ‘too-big-to-fail’ problem. Oxford Review of Economic Policy, 27(3): 498–516.
[21] Rochet, J.C. (1992). Capital requirements and the behaviour of commercial banks. European Economic Review, 36(5): 1137–1170.
[22] Whitehead, C. (2011). The Volcker Rule and Evolving Financial Markets. Harvard Business Law Review, Volume 1, Cornell Legal Studies Research Paper No. 11-19.
Financial Aspects of Recent Trends in the Global Economy
91
Chapter 5
GLOBAL AND REGIONAL REGULATORY CHANGES TO THE FINANCIAL INDUSTRY AS A CONSEQUENCE OF THE FINANCIAL CRISIS: THE CASE OF THE EUROPEAN UNION
by Roberto J. SANTILLÁN-SALGADO
EGADE Business School, Tecnológico de Monterrey, Mexico
5.1 Introduction
5.2 The European Union’s financial regulation framework: some antecedents
5.3 The Basle agreements and a tentative explanation of why the existing regulations failed in
2007-2009
5.4 The integration of the European Union financial markets, national regulations and the
convergence efforts
5.5 Concluding remarks
5.6 References
Volume II, Chapter 5 Roberto J. Santillán-Salgado
92
GLOBAL AND REGIONAL REGULATORY CHANGES TO THE FINANCIAL INDUSTRY AS
A CONSEQUENCE OF THE FINANCIAL CRISIS: THE CASE OF THE EUROPEAN UNION
Roberto J. SANTILLÁN-SALGADO22
EGADE Business School, Tecnológico de Monterrey, Mexico
Abstract
Since the first signs of the financial crisis appeared during 2007, several national governments
announced initiatives to implement extensive bailout measures and recovery plans backed up with tax-payers
money. The official language was very similar in all countries; extraordinary measures were required to avoid a
systemic collapse that could endanger economic stability. However, it was during the Global Finance summit
that took place in London in November of 2008 that the most industrialized and the biggest emerging
economies agreed on the implementation of a global financial reform to close loopholes in regulation and
supervision. While the discussion about the origins and consequences of the recent Financial Crisis will be an
ongoing topic for many years to come, a number of national governments, regulatory agencies and
international financial organizations, have already taken important steps and towards the implementation of
new regulatory frameworks, as well as more robust supervision mechanisms of the financial industry.
This chapter briefly discusses the antecedents of Financial Regulation in the European Union, as well
as the political and institutional responses of governments to the Financial Crisis of 2007-2009. As a result of
our critical analysis, we conclude there is no doubt of the interest of national authorities to minimize the
probability of a repetition of a systemic financial stress episode or, worse yet, another fully fledged financial
crisis; but the challenge to conciliate so many legislations, political interests and economic interests is not a
trivial matter.
Keywords: financial crisis, financial industry, regulation.
“The central tasks of the theory of economic regulation
are to explain who will receive the benefits or burdens of
regulation, what form regulation will take, and the effects
of regulation upon the allocation of resources.”
George J. Stigler, The Theory of Economic Regulation, 1971.
5.1 Introduction
At a national level, the regulatory bodies of the financial industry consist of government-
sponsored supervisors plus a collection of legally binding rules and principles of behavior. The
violation of those regulations may result in penalties that go from simple pecuniary fines for minor
violations, to the loss of franchises in the case of institutions, or penitentiary reclusion in the case of
individuals guilty of major offenses. The loss of a franchise may happen in a variety of forms, which
sometimes disguise the true nature of the measure. For example, one possible case is when
22 Roberto J. Santillán-Salgado, Professor at EGADE Business School & Director of the Financial Markets, Valuation and Risk
Management Chair at Tecnologico de Monterrey, Monterrey Campus, Av. Fundadores esquina Rufino Tamayo, Valle Oriente, Garza Garcia, N.L., 66269, Mexico
Financial Aspects of Recent Trends in the Global Economy
93
government authorities do not respond to bail-out calls from institutions that have gone too far astray
and have fallen into financial distress, or even the tacit or explicit expropriation of troubled entities in
extreme cases.
Since the Great Depression of the decade of the 1930s, a period in which many financial
intermediaries’ franchises were lost, such extreme episodes occurred only sporadically, although they
were more likely to happen during severe recessions or periods of systemic stress23. However, during
the recent 2007-2009 financial crisis, they became extremely frequent again. Several implicit
“temporary” franchise expropriations, including different governments´ take-over of institutions (e.g.
the cases of the Royal Bank of Scotland in Great Britain24, the Bank of America and Citibank25 in the
US, Fortis Bank in Belgium, and Hypo Real Estate in Germany), made clear that the polemic doctrine
of “too-big-to-fail” was, after all, acceptable under extraordinary circumstances, and that the stability of
the banking system had the highest priority.
But bailouts have a limit, as evidenced during the extremely turbulent late summer weeks of
2008 when an icon of Wall Street, the 150 years old venerable Lehman Brothers, was subject to a
definitive franchise “expropriation”. Lehman was forced into bankruptcy26 and subsequent liquidation
when its anguished bailout claims were not answered by the US government (Treasury Department)
due to legal impediments, and industry efforts coordinated by the Fed and the Treasury Department
could not find a private sector buyer for the ailing institution.
As a corollary of the enormous economic costs and the dramatic loss of confidence that
resulted from the global financial crisis, the idea that an increasingly globalized financial industry
desperately needs a revamping of its regulatory framework became very frequently discussed.
Typically, short after episodes of financial crises, governments have responded with an encompassing
regulatory reform some time later called “exaggerated” by both private and public participants. That
was the case in the United States after the market crash that detonated the 1930s “Great
Depression”27, with the Glass-Steagall legislation; many years later, the scandals of the Savings and
Loans institutions during the late 1980s brought about more restrictive regulations on that sector; or
the Enron, Xerox, Tyco and others’ fraudulent scandals at the beginning of the 21st century that were
at the origin of the Oxley-Sarbanes legislation.
Recently, the “Subprime-Mortgages Financial Crisis” of 2007-2009 once again provoked an
encompassing financial sector regulatory revamp in major industrialized countries, home of the largest
23 The “Savings and Loans” crisis, which brought along the bankruptcy of a large number of S&L banking institutions and required
extensive government involvement to bail-out and build a new institutional framework to deal with that crisis. 24 In October 13, 2008, Royal Bank of Scotland announced that the British Government would take a stake of up to 58% in the
Group. The aim was to "make available new tier 1 capital to UK banks and building societies to strengthen their resources permitting them to restructure their finances, while maintaining their support for the real economy, through the recapitalisation scheme which has been made available to eligible institutions. HM Treasury (2008-10-13). Treasury statement on financial support to the banking industry, press release.
25 In October 2008 the US government was set to buy preferred equity stakes in Goldman Sachs Group Inc., Morgan Stanley, J.P. Morgan Chase & Co., Bank of America Corp. -- including the soon-to-be acquired Merrill Lynch -- Citigroup Inc., Wells Fargo & Co., Bank of New York Mellon and State Street Corp., and probably thousands of other banks. However, Bank of America, J.P. Morgan, Wells Fargo and Citibank were the largest recipients with 25 billion dollars each. During the first months of 2009, Citibank required additional resources. US to buy Stakes in Nation’s Largest Banks, Wall Street Journal, October 14, 2008. http://online.wsj.com/article/SB122390023840728367.html
26 Lehman filed for Chapter 11 bankruptcy protection on September 15, 2008. 27 The “Glass-Steagall Act”, named after its two authors, separated the investment banking activity from the commercial banking in
American banks during a little more than half a century.
Volume II, Chapter 5 Roberto J. Santillán-Salgado
94
multinational banks, which were the intermediaries most affected by the crisis, provoking ripple effects
across many other countries, and raising the odds that for the first time the financial industry’s
regulatory framework will finally achieve a supra-national status28.
It is unlikely that the new regulation or any other institutional measures will be capable of fully
eliminating the risks of new asset bubbles or financial crises occurring in the future, but there are good
reasons to believe that well-coordinated regulatory and supervisory measures can significantly reduce
the probability of their occurrence as well as to reduce the magnitude of their cost, whenever they
happen.
Economic history shows that financial institutions do not actively internalize the costs of risky
operational decisions, and that represents one of the major reasons why a good financial regulation is
deemed absolutely necessary. A “systemic risk” exists due to the financial system’s many extensive
and complex links with all other sectors in the economy such that the collapse of one or several large
financial institutions can detonate a chain reaction and may impact many others, as well as have more
encompassing effects on the domestic and the international financial markets. This sequence of
events is also likely to transmit dangerous contagion effects to the rest of the economy.
From the point of view of the individual citizen, regulatory protection is necessary because
there is asymmetry of information between the suppliers of financial products and savers. Regulation
is necessary to guarantee the flow of information on the financial health of the provider of financial
products and services, in particular when “the pay-off to the customer is contingent on the continued
health of the seller (e.g., in the market for deposits and insurance)” (Nier, 2009).
5.2 The European Union’s financial regulation framework: some antecedents
The creation of the European Common Market29 in 1957 represented an institutional platform
for the growing commercial integration of Western European countries. Almost four decades later,
very significant volumes of cross-border trade and investment justified a still more intense integration
of the different national financial markets. The constantly increasing volume of daily financial
transactions justified a centralized supervision and the support of information flows across borders,
ideally coordinated by national supervisory agencies. The institutional framework needed to organize
the harmonic coexistence of all member states’ economic activities originated new institutions and
regulations that, nowadays, define many different aspects of their social, political and economic
relations.
According to the legislative process principles in force within the EU the greater part of the
legislation that applies in the field of financial services is adopted at the European Commission level,
with the purpose to ensure that the same rules or, in some case, minimum standards prevail
throughout all member countries; however, some regulation and supervision areas still remain under
the control of the member states30. The European Commission can propose new legislative
28 One of the most recent encompassing initiatives to minimize not the probability but the cost of possible future banking crises has
been the imposition of a special tax on larger banks, that for their large assets fall in the category of “too big to fail” in order to create a reserve that may be used to bail them out, instead of resorting to the taxpayers’ pockets. (“Bank Tax gains momentum”, Wall Street Journal, March 29, 2010)
29 The European Common Market was formedby France, West Germany, Luxembourg, Italy, Belgium and Holland. 30 Mainly those referred to the sanctions imposed in cases of breach of rules in force.

Financial Aspects of Recent Trends in the Global Economy
95
measures, but only after the adoption of the Commission’s proposals by the member governments
and the European Parliament, do they become legally binding legislation.
There are two kinds of legislative acts in the EU, directives and regulations. The former are
more common and, once adopted by the member states, they must be implemented at the national
level, usually within two years; however, they leave member states a margin of maneuver to adapt the
contents of the directive to the specificities of their national environment. In the case of regulations,
once adopted, they apply directly in the legal order of the member states, i.e., there is no margin of
maneuver to adapt them31.
5.2.1 The first bank directive
The first antecedent of a common financial regulation for all EU member countries32 was the
“First Bank Directive”, issued on December 12, 1977, that established the principle that all banks
established in a member state had the freedom to start operations in other member states,
conditioned only by the scrupulous observance of the host country’s legislation and the national
authorities’ guidelines. Due to the fact that a number of obligatory rules substantially differed from one
country to another, notably in relation to minimum capital requirements, the First Directive had a
limited impact in terms of promoting the integration of a Single European Financial Market.
Many of the problems contained in the First Directive guidelines were addressed and
completely reformulated in the “White Book” of 1985. Among the most remarkable innovations, was
the introduction of the explicit intention to constitute a Single Financial Market in Europe. Such an
ambitious objective required the gradual elimination of differences across different domestic markets,
a complex challenge due to the inexistence of a unified conception of the regulatory frame that would
be desired to establish in all member countries, as well as the obvious inherent political implications.
The White Book would proof decisive towards the future financial integration of the region. Its
follow-up was the adoption of the “Single Act” of December 1989, where the principle that all national
legislations were inspired by the same set of concerns (consumers’ protection, savers safety, etc.)
justified the belief that with a minimal harmonization of rules and principles each member country
could trust in its communitarian partners and recognize the measures adopted by them as equivalent
to their own. This initiative avoided the need to attempt a replacement of the different national
regulations as a pre-condition to advance towards a unified financial market.
5.2.2 The second bank directive
In January of 1993, a Second Banking Directive modified and complemented the First
Directive in what regards the notion of freedom of establishments and the principle of mutual
recognition, by replacing them with the concept of “Single Communitarian License”.
31 http://ec.europa.eu/internal_market/top_layer/quick_en.htm 32 “European Community“ is a term that referred to the European Economic Community (EEC), the European Coal and Steel
Community (ECSC), and the European Atomic Energy Community (Euratom). The EC is now a separate legal entity within the European Union (EU), which was established under the Maastricht Treaty (1992) and includes intergovernmental cooperation on security and judicial affairs.
Volume II, Chapter 5 Roberto J. Santillán-Salgado
96
The Second Banking Directive included interest rate controls, the regulation of cross-border
movements of capital and restrictions on borrowing and reserve requirements that varied from one
country to another33. Among its main achievements was the definition of the exact meaning of
“banking”, as there were significant differences in the activities performed by banking institutions in
different countries of the EU, and in line with the so called “Continental” model, mainly present in
Germany, and which stood in stark contrast to the “Anglo-Saxon”34 model. With the Second Banking
Directive, the EU adopted the “universal banking model”35.
The Second Bank Directive also introduced the principle of “home-country control” or “mutual
recognition”, which means that each bank has to conform to the regulation and legislation of its home
country36. It also introduced the “Banking Passport”, enabling banks that were registered in any EU
member country to expand their business to all other member countries. This principle of mutual
recognition eliminated the bank’s need to obtain a local banking charter for branches or bank products
permitted by the regulations of the bank’s home country, and made cross-border banking and
branching easier37.
The intention of the new legal framework was to formalize the freedom of capital movements,
to establish some general rules for the provision of services in the banking sector, and the
preservation of stability of the financial system. Furthermore, it also aimed to prevent that financial
resources moved through the pipelines of the EU banking institutions could be used to finance
terrorist activities, and should serve as a significant component of the institutional infrastructure that
would support the creation of a single European payments area38.
The development of the legal framework was guided by three main principles. First, each
nation should retain its own banking supervisory and regulatory institutions. Second, a minimal
harmonization from a level above the national level should be achieved, i.e., individual countries
would maintain their own regulatory and supervisory regimes, but all member nations within the EU
should provide minimum standards. Third, directives would have to be issued at EU level, which
meant that individual nations would have to take legislative action to incorporate the directives’
intentions, but the exact content of the legislation was not be dictated to them39.
5.2.3 The Investment services directive
In 1996, the full enforcement of the Investment Services Directive (ISD) represented the
completion of the first stage of regulatory changes for the three major financial services (banking,
insurance and investment services). “The ISD created a European Passport for non-bank investment
firms to carry out in all Member States a wide range of investment business (i.e. order collecting,
33 EU Financial Services Market: From the idea of common market to financial services action plan: http://www.eestipank.info
/pub/en/dokumendid/publikatsioonid/seeriad/kroon_majandus/_2003_2/_50-58aarma.pdf?objId=314192 34 The Anglo-Saxon model of financial services separated banking and securities activities, while Germany had a tradition of
universal banking, making no distinction between banks and security firms. 35 European Financial Regulation: http://www.riskglossary.com/articles/european_financial_regulation.htm 36 European Union Financial Developments: The Single Market, the Single Currency and Banking: http://www.fdic.gov/
bank/analytical/banking/2000may/2_13n1.pdf 37 Integrating Banking Markets in the EC: http://www.frbsf.org/econrsrch/wklyltr/el9612.html 38 The legal framework for a single European Banking Market: http://www.hba.gr/4news/FYROM.pdf 39 European Union Financial Developments: The Single Market, the Single Currency and Banking: http://www.fdic.gov/bank/
analytical/banking/2000may/2_13n1.pdf

Financial Aspects of Recent Trends in the Global Economy
97
execution of orders on an agency basis, dealing, portfolio management and underwriting), as well as
certain additional services (such as investment advice, advice on mergers and acquisitions,
safekeeping and administration of securities and foreign exchange transactions) if mentioned
specifically in the authorization” 40. Since then, national financial authorities supervise the observance
of the country-of-origin’s regulations, and host countries’ regulators establish and supervise the rules
of conduct.
5.2.4 The capital adequacy directive
To minimize the probability that regulatory conflicts could hinder the stability of financial
institutions subject to different national capital requirements, in 1993 the EC also decided to
implement the Capital Adequacy Directive (CAD) to establish uniform capital requirements for
universal banks and security firms.
The European Union countries developed the CAD at the same time that the Basel Committee
was working on a model to establish adequate capitalization rules for banks that responded to market
risk conditions, but the Basel Accord was complete until 1996. The CAD, however, did not provide
internal Value at Risk (VAR) measures, putting European banks at a relative disadvantage with
respect to banks outside Europe. It was amended in 1998 to allow for the use of VAR models (CAD
2), and with the update of the Basel Standards, a new Capital Adequacy Directive (CAD 3), which
implemented Basel II principles, was developed. That directive had a much wider scope of application.
The new Basel Accord renewed and significantly improved the then existing rules: it provided
incentives for good risk management practices, increased risk sensitivity of calibration models and
reduced opportunities for regulatory arbitrage41.
5.2.5 Financial services action plan
The Financial Services Action Plan (FSAP) was presented by the European Commission in
May 1999, with the aim to achieve full integration of the EU banking and capital markets by 2005. The
plan was less radical compared to others proposed in the early 1990s, but rather improved on
achievements and adjusted the legal framework to fast changing market developments.
Its conception was developed with three strategic goals in mind:
Completing a single wholesale market for financial services;
Developing open and secure retail banking and retail insurance markets;
Ensuring state-of-the art prudential rules and supervision.42
The FSAP covered a vast area of financial services activity and comprised 41 separate
measures designed to complete the legislative framework for the internal market in what regards
financial services, related to wholesale as well as to retail markets. The measures that were
introduced by this instrument were categorized under a series of general priorities for action.
40 On the 1st of January, 1996. Source: European Commission, Single Market News, No. 2, February, 1996. Obtained from:
http://ec.europa.eu/internal_market/smn/smn02/s2mn13.htm#fn8 on February 16, 2010. 41 The transposition of the new Basel accord into legislation: http://www.hm-treasury.gov.uk/media/9D1/61/cad3condoc03.pdf 42 EU Financial Services Market: From the idea of common market to financial services action plan: http://www.eestipank.info/
pub/en/dokumendid/publikatsioonid/seeriad/kroon_majandus/_2003_2/_50-58aarma.pdf?objId=314192
Volume II, Chapter 5 Roberto J. Santillán-Salgado
98
Moreover, the FSAP contained measures that were either relevant to the prudential
supervision of an integrated financial system, or were designed to improve the general conditions for
financial efficiency, notably in the areas of corporate governance and taxation43.
5.2.6 The Commission of Wise Men and the Lamfalussy report
In July of 2000, Baron Alexander Lamfalussy, former President of the European Monetary
Institute in Frankfurt44, and co-founder of the European Central Bank (ECB), was appointed by the
council of Finance Ministers of the EU to chair a Commission that would be in charge to propose
regulatory measures aimed at developing the EU financial services industry (securities, banks and
insurance)45. The proposals were meant to achieve a more consistent interpretation of the EU
legislation, greater convergence among national supervisory practices and improve the technical
quality of the financial services legislation. The report of the Commission was delivered on February
2001, and the discussion, as well as the gradual adoption of the Committee’s recommendations,
known as the “Lamfalussy Process”, had the stated purpose to reinforce the European financial
regulatory and supervisory framework by working at four levels:
Level 1: Consisting of legislative acts, namely Directives or Regulations, proposed by the
Commission following consultation with all interested parties, and adopted under the "co-
decision" procedure by the Council and the European Parliament, in accordance with the EC
Treaty.
Level 2: The European Securities Committee, the future regulatory committee, would assist the
Commission in adopting the relevant implementing measures, and ensure that technical
provisions can be kept up to date with market developments.
Level 3: Improving the common and uniform implementation of Level 1 and 2 acts in the member
states, a process in which the Committee of European Securities Regulators would have a
particular responsibility.
Level 4: The Commission would strengthen the enforcement of Community law.
That four-level approach was fully endorsed by the European Council at Stockholm in March
2001. At that time, it was agreed that in those cases where implementing measures in the field of
securities markets were acknowledged to be particularly sensitive, the Commission would avoid going
against predominant views within the Council. The Lamfalussy Commission also proposed a set of
“best practices” that had the objective to reinforce the EU’s supervisory framework, especially during
market instability periods.
One of the most tangible institutional results of the Lamfalussy report’s recommendations was
the creation of two pan-European institutions, the European Securities Committee and the European
Securities Regulators’ Committee. The most generalized opinion about the Lamfalussy Process is that
it was positive and contributed to the advancement of the financial markets of the region. However,
although it’s positive aspects are undeniable (flexible regulation, convergence, cooperation, etc.)
43 Ibid 44 The European Monetary Institute was the immediate predecesor of the European Central Bank, before the introduction of the euro
in 1999. 45 The Lamlaussy Commission became known as the “Committee of Wise Men on the Regulation of the European Securities
Markets”.
Financial Aspects of Recent Trends in the Global Economy
99
several improvements were deemed necessary. During the following years the European Commission
and the European Parliament consistently worked in developing the organization and mechanisms to
facilitate the operation of an increasingly complex interlinked group of national financial markets.
5.3 The Basle agreements and a tentative explanation of why the existing regulations failed in
2007-2009
During the last three decades of the 20th century there was a dramatic increase in the relative
size of wholesale financial services firms, as well as a deepening of their links with other productive
sectors of the economy. The more globalized the world economy became, the more complex the
functioning of global banks, managing their own multinational treasury and helping corporate entities
to manage risks that naturally arise from global operations and from the continuous fluctuation of
exchange rates, interest rates and commodities prices.
The Bank for International Settlements (BIS) responded to the new environmental conditions
by promoting a profound revision of international standards to consolidate practices and reduce
systematic risk. That effort was conducted by a Committee, integrated by several nations that after the
1974 liquidation of the Cologne-based Bank Herstatt decided to form a cooperative council to
harmonize banking standards and regulations within and between all member states46.
The Basle Committee drafted its first version of quantitative and technical benchmarks, known
as the Basel I Accord, aimed to help harmonize banking supervision, regulation and capital adequacy
standards, in 1988. A later version of international prudential regulation, as set forth by the Basel II
Accord (2004), was drawn up as an improvement over the original Basel Accord. The main points
addressed were the need for risk-sensitive capital ratios, increasing risk mitigation practices by
addressing both operational and credit risk separately, and lastly, seeking for more supervision and
market discipline to reduce regulatory arbitrage. The main objective of Basel II was to standardize
international regulations with the purpose that national regulators can base on them for the design of
their own laws and regulations (how much capital banks need to put aside to guard against diverse
risks that banks face like market risk, operational risk and credit risk, etc.).
Basel II was blamed by some as one of the major culprits of the 2007-2009 financial crisis. In
our opinion, such an accusation is unfair since Basle II principles were introduced in the EU as late as
January 1, 2008, already in the middle of the Subprime Mortgages catastrophe, and were to be
incorporated in the US legislation as late as April 1st of 201047.
However, it is illustrative to briefly review what several authors have written about this issue.
For example, Danielsson et al. (2001) suggested that Basle II derived regulations failed to address
risk as an internal or endogenous factor. They argued that Value-at-Risk, Basle II’s preferred measure
of risk may destabilize the economy and induce a crisis fueled by itself. They also highlight the
significant reliance of Basle II on credit agencies as measures used in credit risk assessment by
banks for individual customer’s credit worthiness, and the lack of operational risk modeling due to the
lack of adequate technologies and comprehensive data bases. Cannata and Quagliariello (2009)
46 The Basle Committe founding countries were France, Germany, Italy, Japan, the Netherlands, Sweden, Switzerland the United
Kingdom, the United States and Luxembourg, also known as the G-10. 47 Several voices suggest there are strong reasons to believe that Basle II does need an extensive revision.
Volume II, Chapter 5 Roberto J. Santillán-Salgado
100
suggest that among several other responsibilities attributed to Basle II in connection with the financial
crisis, there are such aspects as the fact that the average level of capital required by the new
discipline is inadequate; that the new Capital Accord, interacting with fair-value accounting, has
caused remarkable losses in the portfolios of intermediaries; that capital requirements based on the
Basel II regulations are cyclical and therefore tend to reinforce business cycle fluctuations; that in the
Basel II framework, the assessment of credit risk is delegated to non-banking institutions, such as
rating agencies, which are potentially subject to conflicts of interest; that the key assumption that
banks’ internal models for measuring risk exposures are superior than any other has proved wrong;
and, finally, that the new framework provides incentives to intermediaries to deconsolidate from their
balance-sheets some very risky exposures. However, they recognized that in most cases it is not
appropriate to link the current financial crisis to Basel II, and that some of the main drivers of the crisis
simply cannot be entirely ascribed to the new regulation. Finally, Fees and Hege (2005) argue that
relying on external Credit Rating Agencies is not the best alternative to credit risk measuring, and
does not lead to efficient risk management practices or optimal capital requirements. If banks control
their own portfolios’ risk, they can increase its size and make the whole industry safer, by observing
high credit quality standards.
The advent of the crisis was for many but a confirmation of the belief that there yet existed
serious limitations in Basle II, instead of reevaluating the argument of an unfortunately inadequate
timing in its implementation, as we mentioned earlier, the Basle Committee on Banking Supervision
took for granted that the inability to anticipate what was coming and the extremely severe damages
that could not be prevented were due to the imperfections of Basle II. But, even when there is no
doubt that there were a number of improvement areas, it is also true that Basle II was a slowly crafted
agreement. In its development process its designers were careful enough as to take into account
many aspects affecting different parties and, for that reason, it was subject to extensive public
consultations. Notwithstanding the antecedents of such a careful and inclusive process, shortly after
the Subprime Mortgages market-originated crisis hit simultaneously so many banks in the developed
world, on December of 2010 and as a follow-up of the G20 endorsement during their November Seoul
summit, the Basle Committee issued the new Basle III rules text, “which presents the details of global
regulatory standards on bank capital adequacy and liquidity agreed by the Governors and Heads of
Supervision”. The rules of Basle III contained the details of the new crisis-driven Basel III Framework,
which encompasses both microprudential and macroprudential components.
The new Basle III framework sets out higher and better-quality capital, better risk coverage,
the introduction of a leverage ratio as a backstop to the risk-based requirement, measures to promote
the build up of capital that can be drawn down in periods of stress, and the introduction of two global
liquidity standards. It will mandate banks to shore up capital to meet tighter requirements, which can
be attained by either raising additional capital or rationalizing their lending portfolios. Incumbent
stockholders usually prefer to avoid the first alternative in order to prevent the dilution of ownership,
but it is a possibility in extreme conditions; and changes in a bank’s lending policies mean a profound
transformation of the relationship with its corporate customers. No simple one-fits-all seems likely, but
bankers must take this commitment seriously as so much is at stake.
From the banking industry perspective there is the feeling that, while the Basle III proposal
immediately gained adepts, it is not clear that all affected parties find the new rules pleasing. While it
Financial Aspects of Recent Trends in the Global Economy
101
took many years to develop the Basle II rules, the new Basle III version was finished in a very short
time and apparently didn’t have enough time for a careful evaluation of the potential effects of the new
requirements that will be applied to banks’ Balance Sheets. There is no doubt that the Financial Crisis
proved the need for a reform of the Solvency Ratio of Basle II, but a few threads remain loose like, for
example, the possibility that given higher capitalization requirements banking institutions will find it
more difficult to provide an urgently needed credit support for the recovery of the economy, or that in
its June 2010 version there was not a firm commitment to adopt all the new rules by large and
important countries, like the United States. It is true, however, that the Committee put in place a
number of mechanisms that ensure that Basle III gets rigorously and consistently implemented
worldwide, and that there is a plan for a gradual phasing-in, so that the banking sector can move
towards more solid capital and liquidity conditions without losing the ability to perform the important
role it must play in the economic recovery process. Besides, with respect to the leverage ratio, the
Committee will evaluate if its design and calibration is appropriate over a full credit cycle and for
different types of business models (Bank for International Settlements, 2010). Even while Basle II was
not fully enforced at the time the Global Financial Crisis hit the markets, it seems unlikely its
preventive mechanisms and rules could have kept under control the extension of the disaster. So, in
the absence of an official statement in that sense, one can infer from the actions of governments and
Central Banks that they found numerous areas of opportunity that deserved prompt and thorough
attention. That is the most likely explanation of why Basle II was replaced with Basle III.
5.4 The integration of the European Union financial markets, national regulations and the
convergence efforts
Since the first signs of the financial crisis were noticed during the early months of 2007 and all
along the following quarters, several national governments announced initiatives to implement
extensive bailout measures and recovery plans backed up with tax-payers money. The official
language was very similar in all countries; extraordinary measures were required to avoid a systemic
collapse that could endanger economic stability. But it was until November of 2008, during the Global
Finance summit that took place in London, that the most industrialized countries and the biggest
emerging economies agreed on the implementation of a global financial reform to close loopholes in
regulation and supervision.
After the initial meeting, the G20 leaders endorsed a document called “Framework for Strong,
Sustainable and Balanced Growth”, in which they committed to a timetable to achieve specific
objectives and initiated a new consultative mutual assessment to evaluate whether their policies
would collectively deliver the desired objectives. The implementation of that effort was delegated to
international organizations capable of developing in-depth studies to inform the Leaders on what the
policy alternatives were, as well as their pros and cons. They designated the International Monetary
Fund (IMF) and the World Bank (WB) to perform multiple analyses, supported with inputs from other
international organizations, including the Financial Standards Board, the Organization for Economic
Cooperation and Development, the International Labor Organization, the World Trade Organization
and the United Nations Conference on Trade and Development. The stated objective was to provide
technical and conceptual foundations required to:
Volume II, Chapter 5 Roberto J. Santillán-Salgado
102
Set out national and regional policy frameworks, programs and projections by the end of
January 2010;
Conduct the initial phase of a cooperative mutual assessment process, supported by
IMF and World Bank analyses, of the collective consistency of national and regional
policies;
Develop a basket of policy options to deliver those objectives, for Leaders to consider at
their Summit in June 2010; and,
Refine mutual assessments and develop more specific policy recommendations for
Leaders at their Summit in November 2010.
While the discussion about the origins and consequences of the recent financial crisis will
continue for many years to come, already at the present a number of national governments, regulatory
agencies and international financial organizations, have taken the initiative and started the
implementation of new regulatory frameworks as well as more robust supervision mechanisms of the
financial industry. Probably the most relevant move in that direction was the agreement of the EU
member countries to accept a single supervisor for all banks in the area, and that high responsibility
was awarded to the European Central Bank. It is nothing short from admirable that during a period of
turbulent financial markets rocked by the immediate possibility of a Greek sovereign debt default, by
and Irish, Portuguese and Spanish bailouts and the downgrading of France, one of the two strong
pillars for the European Financial Stability Facility (the other one was Germany), EU members could
reach an agreement and accept the compromises required to delegate that very important
responsibility to the ECB. Apparently, there is no doubt about the different national authorities’ great
interest to minimize the probability of a repetition of a systemic financial stress episode or, worse yet,
another fully fledged financial crisis.
5.4.1 The Larosière and Turner Reports
In October 2008, the Chancellor of the UK Exchequer and the President of the European
Commission, commanded the preparation of in depth analyses of the causes of the financial crisis and
recommendations to minimize the likeliness of its recurrence to Lord Turner, head of the Financial
Services Authority, and Jacques de Larosière, chairman of the de Larosière group (created for that
purpose), respectively.
Jacques de Larosière released his report on February 25, 2009, and Lord Turner on March,
2009. Both reports make an extensive and in-depth analysis of the origins of the financial crisis and
coincide in several points, but also have significant differences. Highly sophisticated analyses of the
causes of the financial crisis, they reflect the point of view of notable specialists on the more relevant
issues to consider towards the implementation of new regulations that better serve the needs of the
global financial industry, but particularly that of the UK and the EU Both shared in many aspects of the
diagnosis of the financial crisis, like the fact that it was macroeconomic imbalances which created the
conditions for excessive lending practices that eventually provoked a credit bubble in the United
States and other developed nations, or that massive growth in the scale and complexity of securitized
credits surpassed the ability of financial intermediaries to control their risk exposure.
Financial Aspects of Recent Trends in the Global Economy
103
They also hold supervisory authorities and bank management executives responsible for
relying on mathematical models and credit ratings to control their portfolios which, in an environment
of extensive deviations from “normality”, were likely to have resulted in lax decisions and recommend
reviewing Basel II in order to improve several aspects. The main point is to avoid procyclicality
measures in Basel II’s implementation, in order to reduce the extent to which lending capacity is
impaired in an economic downturn. However, what seems to be an original contribution of the reports
and a shared concern is the conviction that the members of the EU urgently need to have a consistent
set of national rules and regulations that eliminate existing inconsistencies.
The de Larosière group report emphatically argues that “an efficient single market should have
a harmonized set of core rules. In order to have this set of core rules the EU needs to harmonize rules
and regulations from country to country. The main problem is that each country has its own
regulations and it’s impossible to have an efficient market with these characteristics” (Larosière,
2009).
Among the most relevant proposals of the de Larosière report are:
A specific and detailed review of Basel II to increase the minimum capital requirements and
enforce a better set of rules for off-balance sheet items that reduce procyclicality. For better
results in Basel II, according to the de Larosière report, there need to be more strict rules
and laws for the internal control of the banks and to guarantee liquidity.
The idea that credit rating agencies need a fundamental review of their models to achieve a
better interpretation of what is the economic reality of securities issuers, and that with time
there needs to be a reduction in the use of ratings.
That there should be a standard accounting reporting methodology in order to achieve
better transparency in the valuation of assets in illiquid markets, where mark-to-market
mechanisms cannot be used.
That all financial firms should be subject to a common regulation that explicitly establishes
appropriate capital requirements.
That the risk management function needs to be independent of financial institutions in order
to have effectiveness. Risk monitoring within financial institutions evidently failed during the
recent crisis.
The need to develop an encompassing EU efficient regulatory framework.
That the Deposit Guarantee Schemes (DGS) in the EU need to provide an equal and high
level of protection to all bank customers, i.e., to set the same rules in all countries.
The de Larosière group also recommended that the European Central Bank (ECB) should play
a major role in the new European supervisory system in two aspects: macro-prudential supervision
and micro-prudential supervision. The following diagram, reproduced from the de Larosière report,
introduces the European Systemic Risk Council and the European System of Financial Supervision as
the instances responsible for both levels of supervision and continuous risk assessment.
The macro prudential supervision component aims to establish the European Systemic Risk
Council (ESRC) to replace the current Banking Supervision Committee (BSC). Its task would be to
form judgments and make recommendations on macro-prudential policy, issue risk warnings,
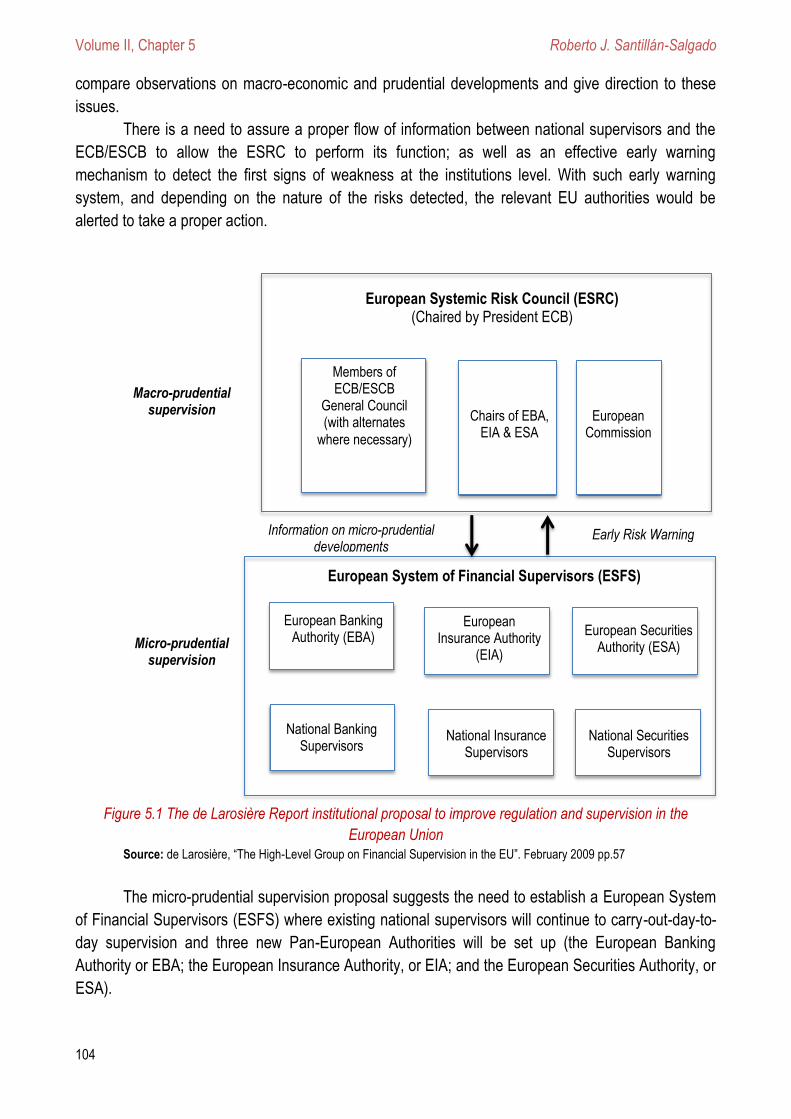
Volume II, Chapter 5 Roberto J. Santillán-Salgado
104
compare observations on macro-economic and prudential developments and give direction to these
issues.
There is a need to assure a proper flow of information between national supervisors and the
ECB/ESCB to allow the ESRC to perform its function; as well as an effective early warning
mechanism to detect the first signs of weakness at the institutions level. With such early warning
system, and depending on the nature of the risks detected, the relevant EU authorities would be
alerted to take a proper action.
Figure 5.1 The de Larosière Report institutional proposal to improve regulation and supervision in the
European Union Source: de Larosière, “The High-Level Group on Financial Supervision in the EU”. February 2009 pp.57
The micro-prudential supervision proposal suggests the need to establish a European System
of Financial Supervisors (ESFS) where existing national supervisors will continue to carry-out-day-to-
day supervision and three new Pan-European Authorities will be set up (the European Banking
Authority or EBA; the European Insurance Authority, or EIA; and the European Securities Authority, or
ESA).
Members of ECB/ESCB
General Council (with alternates
where necessary)
Chairs of EBA, EIA & ESA
European Commission
European Banking Authority (EBA)
National Banking Supervisors
National Insurance Supervisors
European Insurance Authority
(EIA)
European Securities Authority (ESA)
National Securities Supervisors
Macro-prudential supervision
Micro-prudential supervision
European Systemic Risk Council (ESRC) (Chaired by President ECB)
European System of Financial Supervisors (ESFS)
Information on micro-prudential developments
Early Risk Warning
Financial Aspects of Recent Trends in the Global Economy
105
Some of the main tasks of the Authorities are the legally required mediation between national
supervisors, adoption of obligatory supervisory standards, adoption of required technical decisions
applicable to individual institutions, oversight and coordination of colleges of supervisors, licensing
and supervision of specific EU-wide institutions, compulsory cooperation with the ESRC to ensure
adequate macro-prudential supervision, and strong coordinating role in crisis situations.
Baron Lamfalusy, who in 2009 advised the Belgian government on the reforming of financial
architecture, expressed wide support for the de Larosière report, and contributed to this discussion by
expressing that in his personal view, macro-prudential crisis prevention process comprises three
stages48:
1. The collection of information, signaling developments in banks, financial intermediaries
and markets that could give rise to crisis manifestations. The potentially most valuable
source for this kind of information is micro-prudential supervision; but, since micro-
prudential supervisors are neither trained nor mandated to detect such crisis signals,
macro-prudential supervisors - coming from ECB/Eurosystem - should be sufficiently
closely associated with the “traditional” supervisory activities to be able to identify any such
crisis signals.
2. The second stage includes (a) the pooling of the information collected at the level of
systemically significant individual banking groups and (b) the analysis of the aggregated
figures. The ECB would have to play a key role in setting up and organizing the work of
this team. According to the Recommendation 16 of the de Larosière Group: “A new body
called the European Systemic Risk Council (ESRC), to be chaired by the ECB President,
should be set up under the auspices and with the logistical support of the European
Central Bank” Without an effective pooling of information and a scrupulously independent
analysis, the European Systemic Risk Council will not be able to do its job (de Larosiere,
2009).
3. The third stage is the functioning of the risk warning system, under the auspices of the
ESCR. This is a crucial part of the proposals: what has been missing so far has not only
been the lack of information, of the pooling of information and of its analysis, but also the
lack of policy reaction.
5.4.2 Lord Turner’s Report
Published as “The Turner Review”49, the Financial Services Authority (FSA, the UK’s financial
markets supervisor) version of an encompassing effort to diagnose the causes of the recent financial
crisis and prevent something similar occurring again seeks to achieve five outcomes for the global
banking regulatory and supervisory framework:
That the global banking system is better capitalized and more resilient to liquidity shocks
throughout the business cycle;
48 IMF-NBB-Bruegel Conference, Policy Panel 2 on 24 March 2009. 49 The Turner Review was made public, along with the FSA Discussion Paper 09/2: A regulatory response to the global banking
crisis, on March 18, 2009.

Volume II, Chapter 5 Roberto J. Santillán-Salgado
106
That the regulatory framework in general, and its capital component in particular, are
explicitly counter-cyclical;
That the supervisory, crisis management and resolution arrangements for cross-border
financial services groups are effective and reflect the interests of host countries as well as
those of the home state;
That any material risks to financial stability posed by unregulated activities or firms are
identified and controlled to the extent possible; and
Those macro-prudential and other risks to financial stability are identified at both the
international and national levels and effective action is taken to mitigate them.
The Turner report aims to correct what went wrong in the recent crisis. To that end, it suggest
there has to be an increase in international cooperation in supervision through closer communication
of colleges of supervisors, as well as more intense international cooperation and coordination in crisis
management, and a use of host country powers to require strongly capitalized local subsidiaries, and
restrictions on intra-group exposures and flows.
The Turner’s Review is organized around eight central axes, as follows:
Increase quality of bank capital;
Increase in trading book capital;
Avoiding procyclicality in Basel II;
Gross leverage ratio backstop;
Contain liquidity risks;
Credit ratings agencies;
Remuneration in Banks;
Regulation and supervision of cross border banks.
Increase the quality of Bank Capital: According to the FSA, it is necessary to evaluate what
minimum ratios should be set for common equity, retained earnings and preferred stocks in banks.
Due to the analysis made by the FSA, the Total Capital (preferred stock + subordinated debt) must be
greater than 8% of the Weighted Risk Assets (WRA) and preferred stock must be at least 4% of the
WRA.
Increase in Trading Book Capital: As the crisis broke, the Value at Risk (VAR) measures of
risks proved that prices and market liquidity changed more rapidly than regulators had assumed.
Therefore, Turner’s Review suggests that a change in the trading book capital approach is necessary.
Proposals adopted by the Basel Committee, planned for the implementation by the end of 2010,
should make a major difference with requirements for VAR calculations, an incremental capital charge
to cover default and credit risk mitigation, and increased charges for securitizations.
Avoiding Pro-cyclicality: The Basel II regime is often criticized for having pro-cyclical effects.
This idea arises in practice depending on the design of the risk measurement models used by banks
in their assessments, and in particular, if risk models are based on “point in time” rather than “through
the cycle” estimates of loan losses. Basel II preferred “through the cycle” methodology because it is
less procyclical. The problem is that several banks didn’t develop effective “through the cycle”
estimates before the launch of Basel II because they didn’t have sufficient long historic records of past
losses.
Financial Aspects of Recent Trends in the Global Economy
107
Gross Leverage Ratio Backstop: Gross leverage ratio refers to total assets to capital. Turner
says there are 2 arguments for using a gross leverage ratio as a backstop control measure:
Assets which are thought to be low risk can become highly illiquid and risky when systemic
problems emerge, impacting asset sales related to the gross scale of the balance sheet
positions.
Calculating capital requirements based on internal models normally results in judgment
between bank management and regulators, so a backstop against the impact of regulatory
concessions is a good alternative.
Contain Liquidity Risks: Turner’s Review suggests there are some important considerations in
liquidity risk management, like the fact that during the current crisis, the simultaneous attempt by
multiple banks to improve their liquidity position by shortening the tenor of their placements in the
interbank market contributed to a collapse of liquidity. Also, that there has been a growth in the set of
potential sources of liquidity making it difficult to base good liquidity regulation based on one or few
standard ratios.
Credit Rating Agencies: The report suggests that regulation can solve issues relating to the
proper governance of rating agencies and the management of conflict of interest. The
recommendation in this case it that in the new legislation, European colleges ensure that appropriate
structures and procedures are in place to manage conflicts of interest.
There is always a danger that the use of credit rating within the Basel II capital adequacy rules may
introduce a new element of procyclicality in future: However, Turner’s Review comments that other
measures of assessing risk are more procyclical.
Remuneration in Banks: It is likely that remuneration policies, in combination with capital
requirements and accounting rules, created incentives for some executives and traders to take
excessive risks in the past. The Financial Services Authority (FSA) published a Code where it states a
set of principles which are expected to better align remuneration policies with appropriate risk
management. Some of the guiding principles included in the Code are:
Firms must ensure that remuneration policies are consistent with effective risk
management.
Remuneration committees should reach independent judgments on the implications of
remuneration for risk and risk management.
Remuneration should reflect an individual´s record of compliance with risk management
procedures, rules and appropriate culture, as well as financial measures for performance.
Financial measures used in remuneration policies should entail the adjustment of profit
measures to reflect the relative riskiness of different activities.
Regulation and Supervision of cross border banks: The effective supervision of large cross
border institutions can be improved by maximizing the flow of information between home and host
country supervisors. In order to do this, the Financial Stability Forum defined the objective that all
major cross border financial institutions should be covered by a “college of supervisors”.
Besides the Larosière and Turner reports, which represent the official position of the European
Commision and the Financial Sevices Agency respectively, the subject of new regulatory mechanisms
and institutions for the EU financial markets has been discussed extensively by academicians,

Volume II, Chapter 5 Roberto J. Santillán-Salgado
108
politicians and several multilateral financial institutions (IMF, BIS, OECD, World Bank, etc), and by the
ECB, of course. Most of the positions coincide in that banks should expect a far higher level of
regulatory intervention and that the transit to a new system is likely to take places sooner than later.
However, one of the areas of greater debate is centered on the issue of which regulators should
regulate what institutions. The Larosière report explicitly affirms that the current regulatory financial
framework of the EU lacks coherence, the main reason being the excess of discretion granted to
national authorities, a problem that was detected since the initial steps of the Single Financial Market,
but that has not found a satisfactory solution yet. There is no possible doubt that a single unified
economy requires a single financial regulatory framework, but at the same time there are important
political obstacles before a thorough reform of the current national regulations finally converges into a
single EU financial regulation and supervision. Even while the national regulations are not likely to be
replaced in their entireness in the short run, all regulated financial services firms, banks and non-
banks, must expect a significantly stricter regulatory overview. The enormous cost of the recent
financial crisis is a powerful argument to push through the reforms more quickly that would normally
be expected. At this stage, the question is no longer whether there will be significant changes in the
regulation of the EU financial industry, but in which areas will more intervention is most likely to occur
and what will be the timing for that.
5.5 Concluding remarks
The current financial regulation in the EU presents a number of inconsistencies due to national
regulatory schemes which, analyzed ex-post-facto, may help explain why the damages to European
financial institutions were so widely generalized. Among several other aspects that require closer
scrutiny, obligations reporting standards are very diverse from one country to another, especially for
non-listed firms because they have no obligation to make public their financial reports. The existence
of diverse accounting practices for pensions causes serious distortions in the calculation of fund in
different nations. Also, the utilization of different methodologies to calculate risks faced by financial
institutions makes it very difficult to achieve valid comparisons and establish prudential rules. Some
EU countries have an extended definition of credit institutions while other members have much more
limited definitions and such differences between members can lead to laxer supervision and
regulatory arbitrage.
The recent financial crisis showed that the very complex and uneven financial system gave
room to arbitrage opportunities, inefficiencies, and huge differences in the constraints that institutions
face in very similar economic activities. The most striking example is that of the shift in subprime
mortgage originations to less regulated institutions or the shift in risk to where accounting is more
favorable. A post-crisis financial framework should focus on simplifying and making the system more
uniform as a whole; rules should apply evenly to entities involved in similar functions.
The crisis proved there is an urgent need for better regulation on capital reserve requirements
and requirements on liquidity and reserves should be based more on future forecasts of economic
cycles. That is particularly important for institutions subject to risk-based capital requirements like
banks, so that it may act as a stabilizer in periods of economic crisis.
Financial Aspects of Recent Trends in the Global Economy
109
The re-regulation of the financial industry efforts are already present in most EU countries
(more so in those severely affected by the crisis) but, there are still important differences in the
approach each country is following. Although for several decades there has been a maybe too-slow
convergence process in regulation of financial activity among EU members, the post-crisis
convergence should move faster. However, we believe that even when convergence is a high priority,
resulting regulations should still reflect idiosyncratic considerations, given the significant development
differences that still exist among EU members. Although significant advances have been achieved,
greater cooperation among national authorities in the would promote more efficiency in the provision
of financial services, as well as greater stability and capacity to respond to unexpected volatility or
other exogenous factors.
5.6 References
[1] Cannata, F., Quagliariello, M. (2009). The role of Basel II in the Subprime Financial Crisis: Guilty or not Guilty? Milan: Center for Applied Research in Finance, Bocconi University, Working Paper 3/09; Electronic copy available at: http://ssrn.com/abstract=1330417.
[2] Danielsson, J., Embrechts, P., Goodhart, C., Keating, C., Muennich, F., Renault, O., et al. (2001). An Academic Response to Basle II. London: LSE Financial Markets Group.
[3] Feess, E., Hege, U. (2005). The Basle II Accord: Internal Rating and Bank Differentiation. HEC School of Management and CEPR.
[4] Grosse, R. (2010). The Global Financial Crisis: A Behavioral View. Monterrey, Nuevo León: EGADE-Technologico de Monterrey.
[5] Larosière, J.D. (February, 2009). The High Level Group on Financial Supervision in the EU. Brussels.
[6] Nier, E.W. (2009). Financial Stability Frameworks and the Role of Central Banks: Lessons from the Crisis. The Future of Banking Regulation. Frankfurt am Main: International Monetary Fund, WP/09/70.
[7] Ondo-Ndong, S., & Sialom, L. (2008). Northern Rock: the Anatomy of a Crisis. Paris: Université Paris X-Nanterrey.
[8] Santillán-Salgado, R. (2009). The Case of ABN-Amro Acquisition. Working Paper, EGADE Business School, Technology de Monterrey.
*** Bank for International Settlements. (2010). Basel III: International framework for liquidity risk measurement, standards and monitoring, Basle, Switzerland: Bank for International Settlements.
*** Bundesanstalt für Finanzdienstleistungsaufsicht (German Federal Supervisory Authority). (2008). Annual Report. Frankfurt: German Federal Financial Supervisory Authority, Bundesanstalt für Finanzdienstleistungsaufsicht.
*** International Monetary Fund. (2009). Global Financial Stability Report. International Monetary Fund.
*** The 2007-2009 Financial Crisis: Causes, Impacts and the Need for New Regulation, Richard Ivey School of Business, the University of Western Ontario, Case # 9B08N014 (2008).
Volume II, Chapter 6 Nemanja Stanisic, Snezana Popovcic-Avric, Vule Mizdrakovic and Marina Djenic
110
x
Chapter 6
MARK TO MARKET ACCOUNTING AS A MAGNIFIER OF FINANCIAL CRISES
by Nemanja Milovan STANISIC
Singidunum University, Faculty of Business in Belgrade, Serbia
Snezana Drago POPOVCIC-AVRIC
Singidunum University, Faculty of Economics, Finance and Administration, Serbia
Vule Miroljub MIZDRAKOVIC
Singidunum University, Faculty of Business in Belgrade, Serbia
and Marina Milan DJENIC
Singidunum University, Faculty of Economics, Finance and Administration, Serbia
6.1 Introduction
6.2 Literature review
6.3 Mark-to-market accounting and the great depression
6.4 Legislation on mark to market accounting in United States
6.5 The relation between the issuance of mark-to-market accounting standards with the
overvaluation of real estate
6.6 Mark-to-market accounting mechanism
6.7 Conclusions
6.8 References
Financial Aspects of Recent Trends in the Global Economy
111
MARK TO MARKET ACCOUNTING AS A MAGNIFIER OF FINANCIAL CRISES
Nemanja Milovan STANISIC50
Singidunum University
Faculty of Business in Belgrade, Serbia
Snezana Drago POPOVCIC-AVRIC51
Singidunum University
Faculty of Economics, Finance and Administration, Serbia
Vule Miroljub MIZDRAKOVIC52
Singidunum University
Faculty of Business in Belgrade, Serbia
Marina MILAN DJENIC53
Singidunum University
Faculty of Economics, Finance and Administration, Serbia
Abstract
The main objective of this chapter is to provide an analysis on whether mark-to-market accounting
magnifies financial crises. Even though the results of numerous studies on this topic offer various conclusions,
the majority of them conclude that fair value accounting, or mark-to-market accounting, does not cause
financial crises. Most studies that had similar conclusions dealt with the 2006-2008 period, whereas we focus
our research on period from 1881 to present day. Primarily, we will point out the historical context of the
implementation of mark-to-market accounting and consequences it had. We consider the long term
relationship between United States (US) GDP and the S&P 500 index values and key historical developments
to conclude that implementation of mark-to-market accounting contributes to creating of asset bubbles and
assets overestimations. Even though mark-to-market accounting does not cause financial crises, it does
magnify fundamental procyclicality which is inherent in efficient markets.
Keywords: financial crisis, mark-to-market accounting, procyclicality.
6.1 Introduction
For the last forty years we had more financial crises, since the end of the Bretton Woods
International monetary system in 1971. It is valuated that in US the subprime crisis alone since 2007
resulted in an 8 trillion dollar loss in share values. Crises are a product of powerful economic and non-
economic forces; however, when a financial crisis emerges there are some factors that may make it
50 Nemanja Milovan Stanisic, Assistant Professor at Singidunum University, Faculty of Business in Belgrade, Danijelova 32, 11000
Belgrade, Serbia 51 Snezana Drago Popovcic-Avric, Associate Professor at Singidunum University, Faculty of Economics, Finance and Administration,
Bulevar vojvode Misica 43, 11000 Belgrade, Serbia 52 Vule Miroljub Mizdrakovic, Assistant Professor at Singidunum University, Faculty of Business in Belgrade, Danijelova 32, 11000
Belgrade, Serbia 53 Marina Milan Djenic, Lecturer at Singidunum University, Faculty of Economics, Finance and Administration, Bulevar Vojvode
Misica 43, 11000 Belgrade, Serbia
Volume II, Chapter 6 Nemanja Stanisic, Snezana Popovcic-Avric, Vule Mizdrakovic and Marina Djenic
112
stronger and increase its impact and duration. In decision making, business and especially
accounting, faster and more available solutions may not be the safest, or the most fitting. In order to
increase liquidity, residential mortgages were packaged in financial instruments and resold in the
process of securitization, while at the same time being sold short by the same institutions that were
promoting them. These instruments were also provided with high rating by the three largest credit
rating agencies. Mark-to-market accounting has been used to disclose income in financial statements
sooner and without market verification. Assets have been revaluated upward, but the problem with
revaluations is that when write-offs occur they tend to exceed write-ups (Solomon, 1936:9). These
write-downs are a reflection of the obsolescence not accounted for by depreciation. As a result,
revaluations have an impact on capital and income. However, it seems that it has been cleared by
many authors and by the Securities and Exchange Commission (SEC) that mark-to-market
accounting didn’t contribute to the financial crisis of 2008 and fall of many financial institutions.
Nevertheless, in its defense, SEC and many authors noticed and pointed out that investors never
complained when mark-to-market accounting increased their earnings, but reacted when the opposite
occurred. There has been a growing consensus to revise the US Generally Accepted Accounting
Principles GAAP, and as a result the SEC has been obliged to condone the analysis on whether
mark-to-market accounting played a significant role and contributed to the financial crisis. The
aforementioned study concludes that this method is not responsible for the crisis based on the
following fact which is related to financial institutions: “The results of this analysis illustrate that the
adoption of SFAS No. 157 and SFAS No. 159 did not have a significant impact on the percentage of
assets that were measured at fair value, which changed from 42% as of year-end 2006 to 45% as of
first quarter-end 2008” (SEC, 2008:57). The effects of this change in accounting however did not start
in 2006, but much earlier in 1993. In order to come to a logical understanding of the implications of the
change in accounting principles, it is necessary to continuously analyze the entire period stemming
from it. We therefore define the main hypothesis of our investigation: Mark-to-market accounting has
through the history of its use magnified the effects of financial crises. We also note that the FED’s
regulation and maintenance of artificially low interest rates played a large role in the creation of the
crisis in the first place, but we take this fact as a constant in our analysis of this problem. Having in
mind that many authors mention in their research that mark-to-market accounting has been invented
just recently and that its implementation began in the seventies, we will first provide historical
information on the implementation of this method and its legislation.
6.2 Literature review
Significant number of scientific papers can be found that debate the role of mark-to-market
accounting in financial crises. This fascination does not fade even though it has been almost five
years since the first effects of the current crisis. Most authors (like Shaffer, Scott, Laux and Leuz)
came to the conclusion in their findings that fair value accounting had little or no effect on financial
crisis occurrence and its amplification. However, Wesbury and Stein in their research from 2009 point
out that mark-to-market accounting rules affect the economy and amplify financial market problems.
As two main stabilizing factors of the financial market they note: time and growth. By using this rule of
asset valuation we lose time because the market is pricing in more losses than they have actually, or
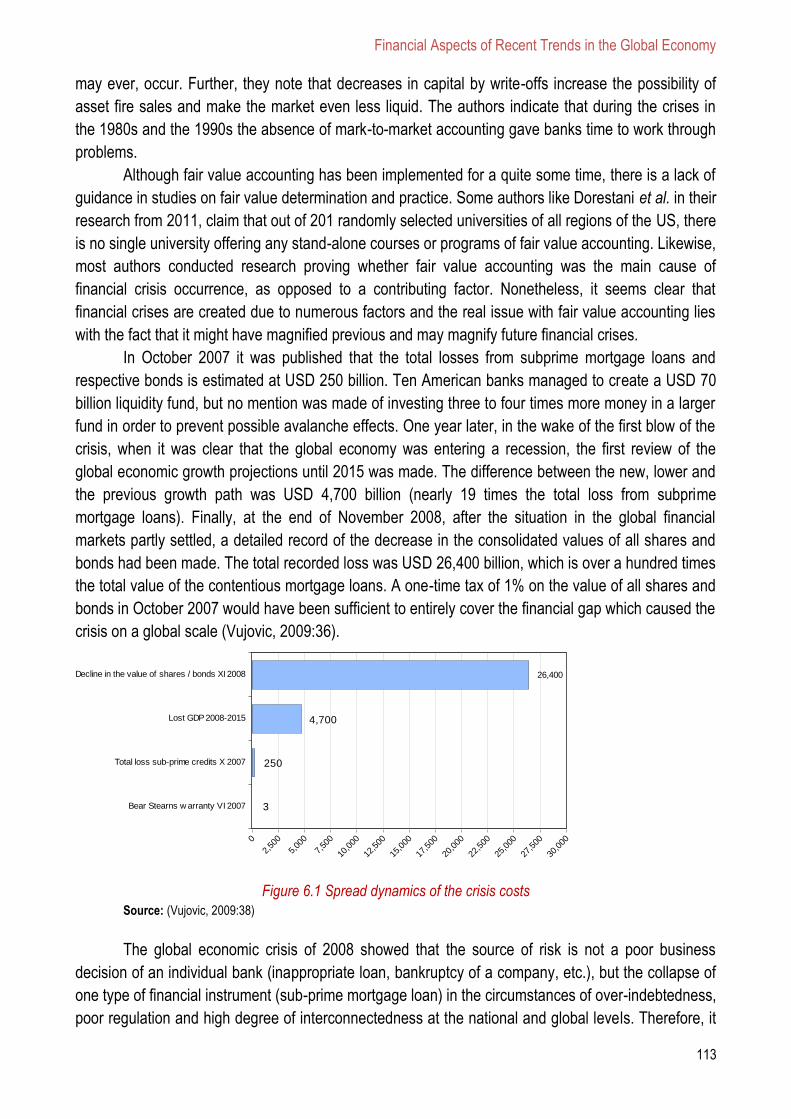
Financial Aspects of Recent Trends in the Global Economy
113
may ever, occur. Further, they note that decreases in capital by write-offs increase the possibility of
asset fire sales and make the market even less liquid. The authors indicate that during the crises in
the 1980s and the 1990s the absence of mark-to-market accounting gave banks time to work through
problems.
Although fair value accounting has been implemented for a quite some time, there is a lack of
guidance in studies on fair value determination and practice. Some authors like Dorestani et al. in their
research from 2011, claim that out of 201 randomly selected universities of all regions of the US, there
is no single university offering any stand-alone courses or programs of fair value accounting. Likewise,
most authors conducted research proving whether fair value accounting was the main cause of
financial crisis occurrence, as opposed to a contributing factor. Nonetheless, it seems clear that
financial crises are created due to numerous factors and the real issue with fair value accounting lies
with the fact that it might have magnified previous and may magnify future financial crises.
In October 2007 it was published that the total losses from subprime mortgage loans and
respective bonds is estimated at USD 250 billion. Ten American banks managed to create a USD 70
billion liquidity fund, but no mention was made of investing three to four times more money in a larger
fund in order to prevent possible avalanche effects. One year later, in the wake of the first blow of the
crisis, when it was clear that the global economy was entering a recession, the first review of the
global economic growth projections until 2015 was made. The difference between the new, lower and
the previous growth path was USD 4,700 billion (nearly 19 times the total loss from subprime
mortgage loans). Finally, at the end of November 2008, after the situation in the global financial
markets partly settled, a detailed record of the decrease in the consolidated values of all shares and
bonds had been made. The total recorded loss was USD 26,400 billion, which is over a hundred times
the total value of the contentious mortgage loans. A one-time tax of 1% on the value of all shares and
bonds in October 2007 would have been sufficient to entirely cover the financial gap which caused the
crisis on a global scale (Vujovic, 2009:36).
Figure 6.1 Spread dynamics of the crisis costs
Source: (Vujovic, 2009:38)
The global economic crisis of 2008 showed that the source of risk is not a poor business
decision of an individual bank (inappropriate loan, bankruptcy of a company, etc.), but the collapse of
one type of financial instrument (sub-prime mortgage loan) in the circumstances of over-indebtedness,
poor regulation and high degree of interconnectedness at the national and global levels. Therefore, it
0
2,50
0
5,00
0
7,50
0
10,0
00
12,5
00
15,0
00
17,5
00
20,0
00
22,5
00
25,0
00
27,5
00
30,0
00
Decline in the value of shares / bonds XI 2008
Lost GDP 2008-2015
Total loss sub-prime credits X 2007
Bear Stearns w arranty VI 2007 3
250
4,700
26,400
Volume II, Chapter 6 Nemanja Stanisic, Snezana Popovcic-Avric, Vule Mizdrakovic and Marina Djenic
114
is a systemic disruption which simultaneously affects a large number of banks in the country (US) and
in the world.
Today most banks provide liquidity by short-term borrowing on the financial markets. Banks
facing the problems with assets rapidly lose a rating, thus automatically losing access to the favorable
financing. Maturity of the existing short-term liabilities owed to the banks causes a gap in the sources
of funds which can be closed either by additional private financing sources or by capital increase. If it
fails, the only solution is sale of assets or use of reserves in order to settle maturing liabilities.
In the circumstances of systemic risks, none of these methods gives good results. In a
disrupted market there is no demand for risky assets, nor are additional capital sources or alternative
long-term private financing sources available. Since many banks offer plenty of assets for sale at the
same time, the price falls further and jeopardizes even the minimal provision of capital. It creates
additional selling pressure for even more assets in order to maintain at least minimum capital
coverage and basic solvency. These two mechanisms are mutually enhanced and cause further
deterioration of the conditions in the assets market. Capital coverage is very soon depleted and the
liquidity problem becomes a solvency problem.
To make things worse, financial markets respond to the crisis by excessive contraction and a
drastic credit crunch. Financial institutions that were not affected by the initial crisis of sub-prime
mortgage assets could be affected by a rapid decrease in available loans. In the circumstances of
high degrees of securitization, it is very often necessary to refinance considerable portions of short-
term funding sources. If it happens that sources in the financial markets fail due to entirely exogenous
factors, financial institutions may be involved in the whirlpool of the crisis without immediate
participation in the transactions that caused its first cycle (Vujovic, 2009:41).
Based on the above mechanisms, the toxic assets spread very fast from the specialized banks
and other financial organizations that were primarily dealing with sub-prime mortgage loans to all
other players in the financial markets of the US and other countries, as well as to the new markets.
Thanks to massive liquidity interventions taken by the Fed and other central banks of the developed
countries, in the following months the situation was partly improved and prices stabilized; however, it
was not sustainable in the long run. The asset price crash started with the outbreak of the global
financial crisis in September 2008. At that time, toxic assets spread not only to all segments of the
financial system of the developed countries, but also reached through credit channels the new market,
thus dominating all segments of the global financial system. A narrow definition of toxic assets
confines it to mortgage backed securities and related derivatives and has been estimated at USD 2
trillion. It has been proposed that the best solution for these assets should be reverse auction. This
method can be an effective way to buy homogeneous assets, but it does not work well with mortgage-
backed-securities because this market is much more fragmented than the market for corporate bonds
(Pozen, 2010: 243).
All of the above reasons for the occurrence of the global economic crisis had another key
consequence. A decrease in real interest rates caused an increase in prices of property, i.e. assets.
This means an increase in securities and real estate, which was made possible by the use of mark-to-
market value. Namely, this method, as a method of financial instruments valuation, contributed to an
increase in the asset value, because, as compared to the historical value, the mark-to-market value of
a financial instrument in the circumstances of economic prosperity is considerably higher. It allowed
Financial Aspects of Recent Trends in the Global Economy
115
further debt to be incurred, which consequently led to illiquidity, first of the banking sector and then of
the overall economy. However, in periods of turmoil, financial institutions are forced to write down the
value of trading assets below their true economic value. Therefore, mark-to-market accounting, while
well intended, could have unintended consequences of exacerbating economic downturns (Shaffer,
2010: 5).
6.3 Mark-to-market accounting and the great depression
Mark-to-market method, or fair value accounting, has been integrated in the US financial
reporting system for a long time. The first evidence of fair value implementation dates to before the
Great depression, long before the current crises. In 1921, the XXXI issue of the Journal of
Accountancy, the authors mention an implementation of fair values for measurement of taxable
income of buildings that had been sold and refer to established rules and principles that had been
established at the beginning of 1913 (Rusk, 1921). At that point in time, the balance sheet had
superiority over the income statement. However, at the end of the 1920s and at the beginning of the
1930s, the income statement had prevailed since shareholders demanded more information about
their investment. Significant utilization of fair value had been recorded at this point which was also
referred to as current value or appraised value, for asset evaluation (SEC, 2008:34). However, there
have been no accounting regulations or accounting standards issued that required the use of fair
value, still many entities used this method for evaluation of their assets. By 1920, the historical cost
model departed financial statements almost completely, and mark-to-market accounting took over.
The Great depression had almost the same symptoms as the 2008 crisis: implementation of fair value,
huge writes-up and writes-down, and great mortgage debts.
Following the Great depression, the implementation of mark-to-market accounting faded, and
after 1938 it had been almost completely abandoned. In fact, it had been practically forbidden by SEC
release No 4 in 1938, where it stated that financial statements should be considered misleading or
inaccurate if they lack significant authoritative support (Benston, 1973:133). By the end of 1940 the
write-ups of assets almost completely disappeared from financial reporting since they had been
unofficially banned. Conservative accounting methods had once again been embraced. However, the
revival of mark-to-market accounting began in 1970 with declaration of authoritative accounting
literature that proscribed the use of fair value in certain transactions. This announced a significant and
dominant use of mark-to-market valuations, having in mind that before this event accounting practices
had been diverse. The same year, FASB issued SFAS 12 that enforced all marketable equity
securities to be reported as the lower of cost, or fair value. Approximately from their point further,
financial crises lasted longer and had a stronger effect on the worldwide economy in comparison with
previous ones.
6.4 Legislation on mark to market accounting in United States
The primary users of financial statements are investors who seek the relevant information
about entities’ profitability, liquidity and financial situation. All entities that trade on stock exchanges
have the obligation to prepare financial statements according to specific rules and principles which
Volume II, Chapter 6 Nemanja Stanisic, Snezana Popovcic-Avric, Vule Mizdrakovic and Marina Djenic
116
provide the universality and objectivity in financial reporting for all participants. The availability and
preparation of financial statements; and the establishment of accounting standards are the main
responsibilities of the SEC. The Financial Standards Accounting Board (FASB) is the body
accountable for developing accounting standards and pronouncements. The chronology of standards
related to fair value issuance is presented in Table 6.1.
Table 6.1 Order of issuance of mark-to-market accounting related legislature
Issued on Effective from Legislative Description
1. December 1975 Superseded with SFAS 115
SFAS 12 Accounting for certain marketable securities
2. December 1991 December 15th, 1992 SFAS 107 Disclosures about fair value of financial instruments (amended by SFAS No. 126)
3. May 1993 December 15th, 199354 SFAS 115 Accounting for certain investments in debt and equity securities
4. October 1994 Superseded by FAS 133|
SFAS 119 Disclosure about derivative financial instruments and fair value of financial instruments
5. June 1998 June 15th, 1999 SFAS 133 Accounting for derivative instruments and hedging activities
6. February 2000 / Statement of financial accounting concepts 7
Using cash flow information and present value in accounting
7. June 2001 July 2001 SFAS 141 Business combinations
8. 2007 December 15th, 2008 SFAS 141 Revised Business combinations
9. June 2001 December 15th, 2001 SFAS 142 Goodwill and other intangible assets
10. August 2001 December 15th, 2001 SFAS 144 Accounting for impairment or disposal of long-lived assets
11. February 2006 September 15th, 2006 SFAS 155 Accounting for certain hybrid financial instruments
12. March 2006 September 15th, 2006 SFAS 156 Accounting for servicing of financial assets
13. September 2006 November 15th, 2007 SFAS 157 Fair value measurements
14. February 2007 November 15th, 2007 SFAS 159 The fair value option for financial assets and financial liabilities
15. March 2008 November 15th, 2008 SFAS 161 Disclosures about derivative instruments and hedging activities
16. October 2008 October 3rd, 2008
Report and recommendations pursuant to section 133 of the Emergency economic stabilization act of 2008
Study on Mark-to-market accounting
Source: Adapted from: http://www.fasb.org/home
6.5 The relation between the issuance of mark-to-market accounting standards with the
overvaluation of real estate
In an attempt to prove that there exists a relationship between using mark-to-market methods
and asset price inflation, we will chronologically analyze the S&P 500 index as the best reflection of
the regulatory changes. We will however use the Shiller Barclays CAPE Index which reflects cyclically
adjusted price-to-earnings ratios (CAPE) since it has been a key driver for the valuation of sectors.
The numerator of the CAPE index is the real (inflation-adjusted) price level of the S&P 500
index, whereas the denominator is the moving average of the preceding 10 years of S&P 500 real
54 For entities with total assets less than $150 million effective implementation of this standard began on December 15th, 1995.

Financial Aspects of Recent Trends in the Global Economy
117
reported earnings (Wilcox, 2011:1). The US Consumer Price Index is used to adjust for inflation and
the purpose of averaging 10 years of real reported earnings is to control for business cycle effects.
The aforementioned index has been defined by Robert Shiller and John Campbell in 1988 and is
generally used by investors with a buy and hold strategy and a multiyear time horizon. The Barclays
ETN+ Shiller CAPE ETN investment fund tracks the Shiler Barclays CAPE US Core Sector Index.
This fund invests in the four most undervalued sectors among the nine S&P 500 sectors, based on
their cyclically adjusted price to earnings ratios (Ho, 2012:1).
Table 6.2 shows the movement of the average values of the CAPE index for a period of 31
years, ending in 2012. For the analysis we have used Change-Point Analyzer, a shareware software
package for analyzing time ordered data to determine whether a change has taken place and when
the change occurred. This software detects multiple changes and provides both confidence levels
(that change occurred) and confidence intervals for each change; the results of analysis are clearly
displayed in table form.
Table 6.2 Significant changes for the CAPE index
Date Confidence Interval Conf. Level From To Level
3.1.1927 (3.1.1927, 3.1.1927) 100% 14,42 15,039
4.1.1995 (4.1.1995, 4.1.1995) 100% 15,039 25,605
6.1.1997 (6.1.1997, 6.1.1997) 100% 25,605 36,44
7.1.2002 (7.1.2002, 7.1.2002) 100% 36,44 25,223
10.1.2008 (10.1.2008, 10.1.2008) 100% 25,223 19,8
Source: Authors data
Note: Confidence Level for Candidate Changes = 50%, Confidence Level for Inclusion in Table = 90%, Confidence Interval =
95%, Bootstraps = 1000, Without Replacement, MSE Estimates, Level 1-3 Changes.
The results show that the largest differences in average CAPE index values appeared in 1927,
right before the onset of the great depression, when the use of mark-to-market methods was almost at
today's high levels. Subsequently, the first significant differences in average CAPE values appear in
1995 and 1997, which reflects the implementation of the accounting standards put in place in 1991,
1993 and 1994. These results are expected considering the fact that this method had been prohibited
before the 1990s, so an acclimatization period was expected. After that we notice a significant change
in average index values in 2002 as a result of the first bubble, and in 2008 as a result of the second,
and current world economic crisis. Figure 6.1 presents the changes in CAPE index averages from
1881 to 2012.
3
1
3
2
3
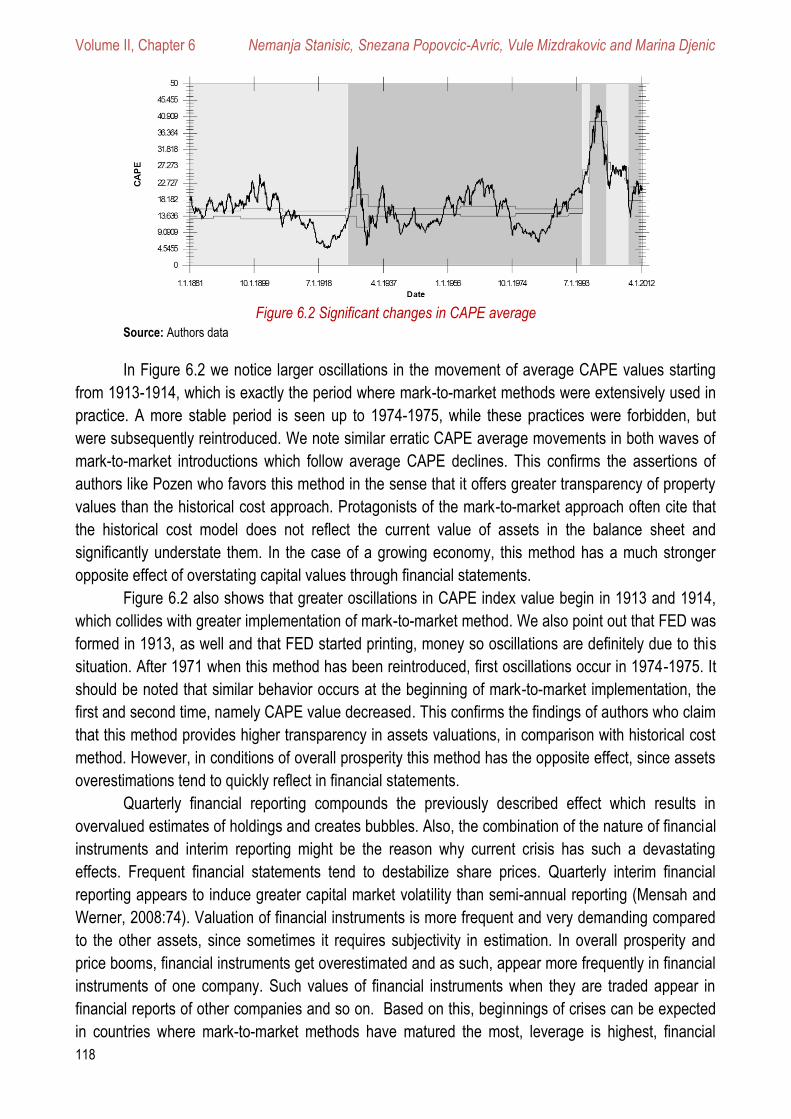
Volume II, Chapter 6 Nemanja Stanisic, Snezana Popovcic-Avric, Vule Mizdrakovic and Marina Djenic
118
Figure 6.2 Significant changes in CAPE average
Source: Authors data
In Figure 6.2 we notice larger oscillations in the movement of average CAPE values starting
from 1913-1914, which is exactly the period where mark-to-market methods were extensively used in
practice. A more stable period is seen up to 1974-1975, while these practices were forbidden, but
were subsequently reintroduced. We note similar erratic CAPE average movements in both waves of
mark-to-market introductions which follow average CAPE declines. This confirms the assertions of
authors like Pozen who favors this method in the sense that it offers greater transparency of property
values than the historical cost approach. Protagonists of the mark-to-market approach often cite that
the historical cost model does not reflect the current value of assets in the balance sheet and
significantly understate them. In the case of a growing economy, this method has a much stronger
opposite effect of overstating capital values through financial statements.
Figure 6.2 also shows that greater oscillations in CAPE index value begin in 1913 and 1914,
which collides with greater implementation of mark-to-market method. We also point out that FED was
formed in 1913, as well and that FED started printing, money so oscillations are definitely due to this
situation. After 1971 when this method has been reintroduced, first oscillations occur in 1974-1975. It
should be noted that similar behavior occurs at the beginning of mark-to-market implementation, the
first and second time, namely CAPE value decreased. This confirms the findings of authors who claim
that this method provides higher transparency in assets valuations, in comparison with historical cost
method. However, in conditions of overall prosperity this method has the opposite effect, since assets
overestimations tend to quickly reflect in financial statements.
Quarterly financial reporting compounds the previously described effect which results in
overvalued estimates of holdings and creates bubbles. Also, the combination of the nature of financial
instruments and interim reporting might be the reason why current crisis has such a devastating
effects. Frequent financial statements tend to destabilize share prices. Quarterly interim financial
reporting appears to induce greater capital market volatility than semi-annual reporting (Mensah and
Werner, 2008:74). Valuation of financial instruments is more frequent and very demanding compared
to the other assets, since sometimes it requires subjectivity in estimation. In overall prosperity and
price booms, financial instruments get overestimated and as such, appear more frequently in financial
instruments of one company. Such values of financial instruments when they are traded appear in
financial reports of other companies and so on. Based on this, beginnings of crises can be expected
in countries where mark-to-market methods have matured the most, leverage is highest, financial
Financial Aspects of Recent Trends in the Global Economy
119
market is developed and where financial reporting is done quarterly, which makes it understandable
that the financial crisis of 2008 hit the US harder than Europe.
The Figure 6.2 also shows that during periods of growth, the effects of mark-to-market
accounting are three times greater than during times of crisis. This indicates that the institution of this
type of accounting does not create crises, but only serves to amplify their negative effects once they
are already present compared to alternate methods. The following discussion will outline the more and
less obvious characteristics of mark-to-market accounting.
6.6 Mark-to-market accounting mechanism
6.6.1 Necessity of financial reporting
Financial statements present a traditional source of information in the decision making
process. However, this dependency is not absolute since a company may have high net income at the
same time may not be liquid, however the effect of data presented is far from irrelevant. Why do
people believe so much in financial statements? Why do they require financial statements so much?
The main goal of financial statement’s stakeholders’ is estimation of financial stability and profitability.
In these estimates “anchoring” plays important role, since people seem to be influenced by the
magnitude of cued numbers or actions. The initial value or the “anchor” presented in financial
statements can serve as a mental benchmark or starting point for estimating future earnings of
financial instruments (Poundstone, 2010). These adjustments are usually inadequate and it seems
that the anchor has a magnetic attraction, luring the estimates closer to them. Anchoring is
constrained by whatever people believe or want to believe to be true (Poundstone, 2010).
Now, imagine if initial values are biased, on whatever level, and add to that the adjustment the
investors will conduct; what would be the ultimate result? Would these estimates reflect the real
situation? There is another side of this effect as well, the investors would definitely deny the influence
of anchor information on their estimations and most likely would ignore the real data given, pointing
out that they are “skillful” enough to make the estimates by themselves. As it has been beforehand
stated, people tend to react to factors from surroundings. In the case of investors, those factors should
be the general trend of market earnings and the development of the economy. It is supposed that
people are inclined to risk more prosperous economies in, which could be connected to the
abovementioned statements that investors will estimate future earnings based on anchor information
with higher optimism. On the other hand, in difficult conditions investors will certainly decrease the
estimated earnings value even more than the upward value in prosperity, which has already been
shown.
Although it may sound unbelievable, accounting has been a stabilizing factor of world
economics for centuries. It seems that the Great depression and now World financial crisis both had
lesser effects on European countries than in the US Many authors point out the significance of
International Financial Reporting Standards (IFRS) and suggest that the US should implement IFRS
instead of, or as a supplement to Generally Accepted Accounting Principles (GAAP). Over 100
countries use IFRS in financial reporting of listed companies, the newest additions being: Brazil,
Canada, Korea, China and India (Ohlgart and Ernst, 2011: 41). Accounting principles are usually
considered as stabilizing factors in IFRS. GAAP are based on common law and thus define rules that
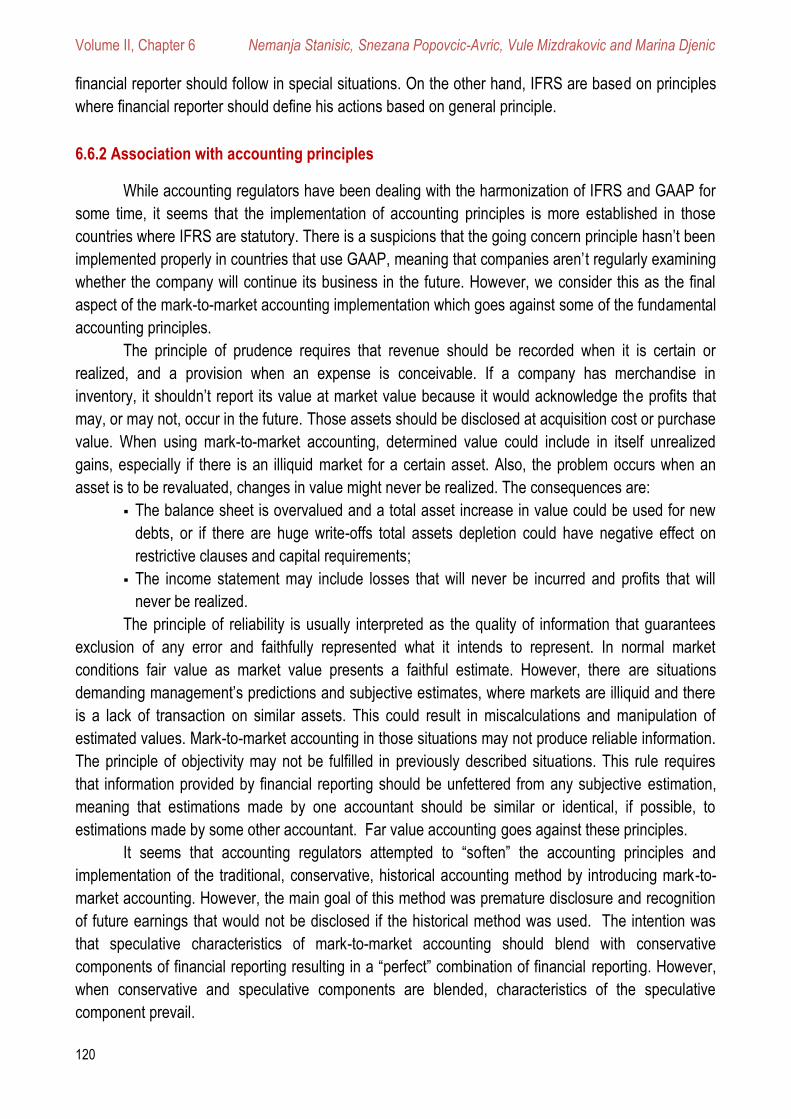
Volume II, Chapter 6 Nemanja Stanisic, Snezana Popovcic-Avric, Vule Mizdrakovic and Marina Djenic
120
financial reporter should follow in special situations. On the other hand, IFRS are based on principles
where financial reporter should define his actions based on general principle.
6.6.2 Association with accounting principles
While accounting regulators have been dealing with the harmonization of IFRS and GAAP for
some time, it seems that the implementation of accounting principles is more established in those
countries where IFRS are statutory. There is a suspicions that the going concern principle hasn’t been
implemented properly in countries that use GAAP, meaning that companies aren’t regularly examining
whether the company will continue its business in the future. However, we consider this as the final
aspect of the mark-to-market accounting implementation which goes against some of the fundamental
accounting principles.
The principle of prudence requires that revenue should be recorded when it is certain or
realized, and a provision when an expense is conceivable. If a company has merchandise in
inventory, it shouldn’t report its value at market value because it would acknowledge the profits that
may, or may not, occur in the future. Those assets should be disclosed at acquisition cost or purchase
value. When using mark-to-market accounting, determined value could include in itself unrealized
gains, especially if there is an illiquid market for a certain asset. Also, the problem occurs when an
asset is to be revaluated, changes in value might never be realized. The consequences are:
The balance sheet is overvalued and a total asset increase in value could be used for new
debts, or if there are huge write-offs total assets depletion could have negative effect on
restrictive clauses and capital requirements;
The income statement may include losses that will never be incurred and profits that will
never be realized.
The principle of reliability is usually interpreted as the quality of information that guarantees
exclusion of any error and faithfully represented what it intends to represent. In normal market
conditions fair value as market value presents a faithful estimate. However, there are situations
demanding management’s predictions and subjective estimates, where markets are illiquid and there
is a lack of transaction on similar assets. This could result in miscalculations and manipulation of
estimated values. Mark-to-market accounting in those situations may not produce reliable information.
The principle of objectivity may not be fulfilled in previously described situations. This rule requires
that information provided by financial reporting should be unfettered from any subjective estimation,
meaning that estimations made by one accountant should be similar or identical, if possible, to
estimations made by some other accountant. Far value accounting goes against these principles.
It seems that accounting regulators attempted to “soften” the accounting principles and
implementation of the traditional, conservative, historical accounting method by introducing mark-to-
market accounting. However, the main goal of this method was premature disclosure and recognition
of future earnings that would not be disclosed if the historical method was used. The intention was
that speculative characteristics of mark-to-market accounting should blend with conservative
components of financial reporting resulting in a “perfect” combination of financial reporting. However,
when conservative and speculative components are blended, characteristics of the speculative
component prevail.

Financial Aspects of Recent Trends in the Global Economy
121
6.6.3 Association with impairments
As with the Great depression, the current financial crisis highlighted a significant number of
impairments, especially in the area of intangible assets. Specific focus has been given to goodwill,
because it can linger in balance sheets forever. Why did write-offs in intangible assets (goodwill) occur
in both crises? Unlike other tangible and intangible assets, goodwill isn’t calculated for amortization. In
circumstances when stock price falls note worthily below book value, it’s time to do a balance sheet
makeover. This was a chance for many companies to toss out overvalued assets from their balance
sheets. And goodwill was that golden reserve for many companies.
At the end of 2008, the average amount of goodwill reported by 419 companies of the S&P500
was $1.2 billion, whereas median write-offs for the first half of 2008 were $211 million (Mintz,
2009:72). The transaction of goodwill impairment is non-cash in its nature, which is fortunate because
poorly governed companies usually don’t have any cash to back up this transaction. Nevertheless,
huge write-offs could have many consequences. Primarily, they can influence the behavior of
investors, since many CFO’s are afraid that disclosure of significant impairment can draw unwanted
attention of investors and decrease the stock value in the long run. On the other hand, there are
authors that claim that investors can discern difference between write-offs that will improve
performance and write-offs that will not. Also, disclosure of impairment doesn’t automatically mean tax
benefit, because tax deductions ordinarily occur when an asset becomes worthless and its value is
zero. In all other cases, tax benefits will be omitted (Mintz, 2009:74). Investors are not the only
stakeholders that companies should have on mind when deciding to conduct the impairment. Write-
offs affect the size of total assets and if they drop significantly to disrupt financial ratios that lenders
use as a main instrument to signal trouble in a company (debt-to-capitalization ratio), than
management should think twice. Aforementioned circumstances of huge write-offs underlines the
importance of accounting methods used for asset valuations.
6.6.4 Association with Gross Domestic Product
The earnings of a country could be measured by the Gross Domestic Product (GDP). The
basic assumption is that economic development will affect market earnings and the value of products
and services. The beneficial growth of an economy should lead to higher market earnings which will
be represented as higher GDP. This is what has been happening in US during the eighties and
nineties, up until 2006. Between 2001 and 2006, corporate profits explained around 98.4% of
domestic GDP growth (Mays, 2011:1). However, the stock market has been completely different story
for the last several years, since it has become very turbulent. In a bull market, earnings are
overvalued, and in a bear market earnings are overestimated. This is the main reason why S&P and
nominal GDP do not correlate, although they should. S&P 500 and GDP are not the same since S&P
generates about less than a half of the earnings outside of the US from overseas sales and
operations. Also, a quarter of the GDP (government earnings) of the US is not included in the S&P.
However, the long term correlation is obvious; GDP has a very strong correlation with a corporation’s
earnings. This correlation has been even more obvious before we entered the period of volatility. The
following chart presents the gap between S&P returns and nominal GDP growth.
Volume II, Chapter 6 Nemanja Stanisic, Snezana Popovcic-Avric, Vule Mizdrakovic and Marina Djenic
122
Figure 6.3 Gap between S&P returns and nominal GDP growth Source: Authors data
The observed period in Figure 6.3 is from January 1st 1950 to August 1st 2012. For analysis
purposes, we use the Change Point Model (CPM) in the R software package. The Segment
Neighborhood method is used with the assumption of a normal distribution of average CAPE index
values. We notice the point at which average CAPE index values changed in Figure 6.2. The change
point date is identified as March 1st, 1995, which coincides with the introduction of regular
implementation of mark-to-market accounting practices. The average CAPE value before this date
was 15.37024 and after this date is 27.32488. Even though it cannot be concluded that GDP and the
S&P 500 are not synonymous, an increase in GDP (under the assumption of stable net margins) is a
good indicator of increasing capital values. In situations of stable GDP growth (as seen in Figure 6.2),
it can be seen as the aggregated value of the market capitalization of the 500 largest companies.
Figure 6.2 also shows that the movement of the S&P 500 index behaves similarly after the reduction
of mark-to-market accounting practices (1975). We again notice a fall in index values compared to
GDP, which would again turn around after 1995 (after their reintroduction).
6.6.5 Association with pro-cyclical effect and leverage
Proponents of the mark-to-market accounting method often state that this methodology
improves transparency and reveals inherent volatility, but does this transparency create a new type of
feedback loop volatility as a byproduct. If this is true, we can argue that additional transparency comes
at an unjustifiable economic price.
When it comes to implications for investors, it is well known that investors and financial
institutions accept higher risk in order to achieve increased returns when an economy is in the high
phase of the cycle. However, this also leads to higher credit borrowing and leveraged expansions.
Also, a well-known phenomenon is the effect of the balance sheet. Implementation of mark-to-market
value leads to asset, namely financial instrument, overestimation during market growth. This results in
stronger balance sheets, higher amounts of assets and capital presented in balance sheets, which
raises the willingness of lenders to decrease the credit rate and extend credit. This ultimately leads to
0
200
400
600
800
1,000
1,200
1955 1960 1965 1970 1975 1980 1985 1990 1995 2000 2005 2010
US GDP index base year 1950 S&P 500 index base year 1950
Ind
ex v
alu
e =
ba
se
ye
ar
19
50
Financial Aspects of Recent Trends in the Global Economy
123
additional capital borrowing. Increased leverage causes higher earnings and equity presented as OCI,
which leads to stock price appreciation. It seems that risk evaluation by investors and financial
institutions is based on recent history of market trends, so in periods of prosperity their actions seem
to be over exaggerated.
Based on the investigation of the SEC of all assets that were reported at fair value, a majority
(76%) of the assets were Level 2 instruments for which inputs were observable, followed by Level 1
instruments (15%) which had quoted prices, and Level 3 instruments (9%) where significant market
information is not observable (SEC, 2008:60). In situations where management subjectively
ascertains values of capital possessions, it is logical to assume that these values tend to be inflated.
However, in a financial system in which balance sheets are continuously marked to market, asset
price changes appear immediately as changes in net worth, prompting financial intermediaries to
adjust the size of their balance sheets (Tobias and Song, 2010:418). On the other hand, as a reaction
to increased company capital, leverage is increased (especially in investment banks). In this situation,
leverage and total assets tend to move in lock-step (Tobias and Song, 2008:3). This happened not
only in 2008, but also in 1998. The early part of 1998 saw strong growth in total assets, with the
attendant increase in leverage. However, the third and fourth quarters of 1998 shows all the hallmarks
of financial distress and the attendant retrenchment in the balance sheet. For most banks, there were
very large contractions in balance sheet size in the fourth quarter of 1998, accompanied by large falls
in leverage (Tobias and Song, 2010:15).
We therefore underline that the consequences of mark-to-market accounting are greater
transparency in the declaration of capital values, but also greater volatility in business cycles.
Exaggerated profits in good times create the wrong incentives. Conversely, more uncertainty
surrounding valuation in downturns may translate into overly tight credit conditions, and negatively
affect growth at a time when credit expansion is most needed (IMF, 2008:123). To sum up, asset
appreciation momentum leads to institutional shareholders gain; this again leads to a positive
feedback loop. Nevertheless, when negative event occurs, like the Lehman Brothers crash, such
investor’s risk evaluation violently fluctuates. Previously stated are economic and psychological
factors that lead to pro-cyclical investor’s behavior during the recession. Furthermore, Chea noticed
some interesting manifestations of this method’s implementation: “fair value reflects the effects of
changes in market conditions and changes in fair value reflect the effect of changes in market
conditions when they take place” (Chea, 2011:15). It should be mentioned, as well, that rating
downgrades of one firm could create pressure for the downgrades of other firms, in a form of feedback
effect not studied in the current paper (Manso, 2011:4).
The fear from pro-cyclical behavior can be seen in Europe as well, where they already
examine the countercyclical regimes that would help banks to save capital in beneficial years. Many
authors believe that capital adequacy rules did not have a significant effect on the debris of big
financial institutions; however Europe’s national regulators suggest discretion when using these rules
in times of distress.

Volume II, Chapter 6 Nemanja Stanisic, Snezana Popovcic-Avric, Vule Mizdrakovic and Marina Djenic
124
6.6.6 Association with systematic risk
At first glance, valuating assets in financial statements does not have many points of contact
with systemic risks; however, valuating property does. As opposed to the risk that one company will
stop functioning, systemic risk entails the entire sector stops functioning (ex. the banking sector). The
implementation of this method has a doubly negative effect on systemic risk.
Overvaluing property in one company and changing the standards that allow this type of
reporting only shortsightedly reduces its bankruptcy risk. However, in the long run, systemic risk is
greatly increased. Stronger financial statements influence credit rating agencies to give more positive
scores, which influences financial institutions to offer more credit to such companies. The former is not
economically justified because such companies do not deserve this extension of credit that is created
due to mark-to-market accounting. Such occurrences not only impact the financial instruments market,
but have an effect on the overall economy.
An increase in the value of financial instruments overflows into the property market which
causes property bubbles. This breeds an additional impression of overall prosperity on the stock
market which is then spread to the whole economy including the real estate market and landing
activities. The real estate values played their role as well, since they use methods for valuation which
are comprised of general rate of return. The constant increase of these rates gradually and unduly
increases the value of real estates. The increase which was contained in financial instruments is now
set free on the market. The housing market was susceptible to a bubble because of the long period of
decreasing interest rates and lack of diligence and alertness exhibited by mortgage institutions. All of
this impacts the level of systemic risk.
There is another form of negative impact of mark-to-market accounting on systemic risk. For a
system to function properly there must be a balance between supply and demand. Companies,
especially banks, come into the possession of assets that are drastically overvalued. There are 2
solutions to this problem: selling assets at fire-sale prices, or keeping these assets on the books and
reporting amortization losses. The choice of the best solution depends on the style of management of
the company, but in both cases will result in increased systemic risk through oversupply or over-
demand. Systemic risk is increased, and firm specific risk is decreased in the short term, due to the
dumping of toxic assets.
6.7 Conclusions
We reaffirm that mark-to-market accounting did not cause the financial crises, but it enabled it
to happen and amplified its consequences. While the mark-to market-rule does not cause financial
crises on its own, it does magnify the underlying market volatility caused by the positive feedback
mechanism inherent in efficient market economies. Mark-to-market accounting does not only reveal
volatility, it is also generates it. It does deliver more of the market risk in every single portfolio. It tends
to stabilize market returns in periods of positive feedback, but doubly or triply destabilizes them in
periods of negative feedback. It breeds an additional impression of overall prosperity on the stock
market which is then spread to the whole economy including the real estate market and landing
activities. It also affects the level of systemic risk. It is clear that regulatory bodies notice the negative
consequences of the implementation of this method and the fact that it played a significant role in
Financial Aspects of Recent Trends in the Global Economy
125
financial crises through the history of its use, which makes it understandable that they wish to educate
accountants and auditors about its use. Since the beginning of the latest crisis most new standards or
changes in existing standards were made to mark-to-market principles. We also want to point out that
although we advise against mark-to-market implementation in certain situations, all of the above
mentioned arguments against mark-to-market method cannot be automatically translated into
arguments for historical cost accounting or any other methods. Therefore, we propose that official
financial statements should be disclosed at historical value, however we suggest that companies
should provide additional information for stakeholders using mark-to-market method for certain assets
which value could be confirmed on market without subjective premises. In that manner, greater
transparency would be obtained, without the negative effects of implementation of mark-to-market
accounting.
6.8 References
[1] Benston, G. (1973). Required disclosure and the stock market: an evaluation of the securities exchange
Act of 1934. American Economic Review, 63 (1): 132-155.
[2] Chea, A. (2011). Fair value accounting: its impacts on financial reporting and how it can be enhanced to
provide more clarity and reliability of information for users of financial statements. International Journal of
Business and Social Science, 2(20): 12-19.
[3] Dorestani, A., Aliabadi, S., Chen, H. (2011) Fair value determination: a conceptual framework. Journal of
Accounting-Business & Management, 18(1): 93-107.
[4] Fahnestock, T., Bostwick, E. (2011). An analysis of the fair value controversy. Proceedings of ASBBS,
18(1): 910-919.
[5] Ho, T. (2012). Shiller CAPE ETN Hits Market. Investor’s Business Daily. 10612890 on October 18th, 2012.
[6] Laux, C., Leuz, C. (2010.) Did Fair-Value Accounting Contribute to the Financial Crisis? Journal of
Economic Perspectives, 24 (1): 93-118.
[7] Manso, G. (2011). Feedback Effect of Credit Ratings [Internet]. Working Paper No DR 06016. Available at:
http://ideas.repec.org/p/ebg/essewp/dr-06016.html [08.08.2012]
[8] Mays, G. (2011). Corporate Profits as Percent of GDP Slumps First Time Since 2008 [Internet]. The Mays
Report. Available at: http://seekingalpha.com/article/283425-the-relationship-between-corporate-profits-
and-u-s-gdp-growth-appears-to-have-ended?source=feed [09.08.2012]
[9] Mensah, Y., Werner, R. (2008). The Capital Market Implications of the Frequency of Interim Financial
Reporting: An International Analysis. Review of Quantitative Finance and Accounting, 31(1): 71-104.
[10] Mintz, S. (2009). Goodwill Hunting. CFO, 25(1): 71-74.
[11] Ohlgart, C., Ernst, S. (2011). IFRS, Yes, No, Maybe. Financial executive, 27(8): 39-73.
[12] Poundstone, W. (2010). Priceless. Hill & Wang, New York.
[13] Pozen, R. (2010). Too Big to Save. John Wiley & Sons Inc., New Jersey.
[14] Scott, I. (2010). Fair Value Accounting: Friend or Foe? William & Mary Business Law Review, 1(2): 489-
542.
[15] Shaffer, S. (2010). Fair Value Accounting: Villain or Innocent Victim. FRB of Boston Quantitative Analysis
Unit Working Paper, No. 10-01, pp. 2-26.
Volume II, Chapter 6 Nemanja Stanisic, Snezana Popovcic-Avric, Vule Mizdrakovic and Marina Djenic
126
[16] Solomon, F., (1936). Revaluations of Fixed Assets, 1925-1934. National Bureau of Economic Research,
Bulletin 62, New York, pp. 1-11.
[17] Tobias, A., Song, H. (2008). Procyclical Leverage and Value-at-Risk. Federal Reserve Bank of New York,
staff reports, No. 338, pp. 1-25
[18] Tobias, A., Song, H. (2010). Liquidity and Leverage. Journal of Financial Intermediation, 19(3): 418-437.
[19] Rusk, S. (1921). Income-tax Department. Journal of Accountancy, 31(1): 368-378.
[20] Vujovic, D. (2009). Economic Policy in Times of Crisis: Challenges, Limitations and Paradoxes.
Economics of Enterprise, 57(1): 36-42.
[21] Wesbury, B., Stein, R. (2009). Why Mark-to-market Accounting Rules Must Die [Internet]. Forbes-money.
Available at: http://www.forbes.com/2009/02/23/mark-to-market-opinionscolumnists_recoverystimulus.
html (24.09.2011).
[22] Wilcox, S. (2011). A Cautionary Note About Robert Shiller’s CAPE [Internet]. AAII Journal. Available at:
http://www.aaii.com/journal/article/a-cautionary-note-about-robert-shillers-cape (24.06.2012).
*** IMF (2008). Chapter 3: Fair value accounting and procyclicality [Internet]. Global financial stability report.
Available at: http://www.imf.org/external/pubs/ft/gfsr/2008/02/pdf/chap3.pdf [19.08.2012]
*** SEC (2008). Report and Recommendations Pursuant to Section 133 of the Emergency Economic Stabilization Act of 2008: Study on Mark-to-Market Accounting. United States Securities and Exchange Commission [Internet]. Available at: http://www.sec.gov/news/studies/2008/marktomarket123008.pdf [05.08.2012]
Financial Aspects of Recent Trends in the Global Economy
127
x
Chapter 7
MARKET TIMING ABILITY OF SOCIALLY RESPONSIBLE INVESTING FUNDS IN LUXEMBOURG
by Wei Rong ANG
Universiti Sains Malaysia, School of Social Sciences, Malaysia [email protected]
by Hooi Hooi LEAN
Universiti Sains Malaysia, School of Social Sciences, Malaysia
7.1 Introduction
7.2 Literature review
7.3 Data and methodology
7.4 Result
7.5 Conclusion
7.6 References
Volume II, Chapter 7 Wei Rong Ang and Hooi Hooi Lean
128
MARKET TIMING ABILITY OF SOCIALLY RESPONSIBLE
INVESTING FUNDS IN LUXEMBOURG
Wei Rong ANG55
Universiti Sains Malaysia, School of Social Sciences, Malaysia [email protected]
Hooi Hooi LEAN56
Universiti Sains Malaysia, School of Social Sciences, Malaysia [email protected]
Abstract
Socially Responsible Investing (SRI) funds are funds that undergo screening processes which
satisfies the environmental, social and governance criterion for the benefit of all. This chapter investigates the
market timing ability of SRI funds in Luxembourg. Luxembourg is the largest fund investment center in Europe
and played an important role in promoting SRI funds. This study uses data from Eurekahedge database for
188 SRI funds in Luxembourg for the sample period of January 2001 to December 2011. We employ two
market timing models, i.e. the four-factor Treynor-Mazuy (1966) model and Henriksson-Merton (1981) model
for the analysis. We find that the SRI fund managers in Luxembourg are skillful. In other words, they are good
in forecasting the market trends. Moreover, there is no size and momentum effects found but value effect is
existed. We also find that the SRI funds have higher return during the financial crisis. Hence, we suggest that
the SRI funds can be used as a hedging instrument during the crisis.
Keywords: Luxembourg, SRI funds, performance measurement, market timing.
7.1 Introduction
Socially Responsible Investing (SRI) no longer a new term in the financial markets.
Rennebourg et al. (2008a) concluded that SRI not only provides the investors an attractive return but
also the opportunity to contribute to the society through investment. The objective of SRI is consistent
with the statement from Hamilton et al. (1993) that “doing well while doing good”. Thereafter, SRI has
a positive impact on the environment and society. In line with that, countries such as Belgium, Italy,
Sweden and United Kingdom required their own country’s pension funds to disclose the degree of
participation in the social, ethical and environmental aspects (Rennebourg et al., 2008a). However,
throughout the years, debating on the performance of SRI funds is continuing as people argue that
SRI funds tend to have lower returns than non-SRI funds due to lack of diversification. Although SRI
funds provide the opportunity for the investors to do good, SRI funds can be considered as a less
diversified portfolio that leads to higher risk.
The purpose of this study is to address the issue of whether the SRI fund managers have
market timing ability to predict the stock market’s movement and to change fund composition in
accordance to the market condition. This chapter intends to answer this question for the case of
Luxembourg. This is the first attempt that studies the market timing skill of fund managers in
55 Wei Rong Ang, Universiti Sains Malaysia, School of Social Sciences, 11800 USM Penang, Malaysia 56 Hooi Hooi Lean, Universiti Sains Malaysia, School of Social Sciences, 11800 USM Penang, Malaysia, Tel: 604-653 2663, Fax:
604-657 0918

Financial Aspects of Recent Trends in the Global Economy
129
Luxembourg. We choose Luxembourg for two reasons. First, Luxembourg is one of a leading
countries in Europe that actively developing SRI in the country recently. Evidence from the Foundation
De Luxembourg57 shows that Luxembourg is keen on developing and promoting the Philanthropy.
Henry and Brion (2009) showed that 75% of the SRI funds distributed in Europe are Luxembourg
domiciled. Second, favorable tax law in Luxembourg encourages funds managers to invest in
Luxembourg in order to achieve higher excess return (Rennebourg et al., 2011).
For investors, identifying fund managers with superior forecasting skill will be an important
objective (Comer, 2006). Market timing skill is important for fund managers in order to forecast the
general market movement in future and take necessary action to reap an attractive return of portfolio
for their client. If a fund manager is able to forecast the market successfully, he/she can change the
portfolio risk according to the market condition by altering the proportion of high and low risk securities
in the portfolio (Kon and Jen, 1979). If the fund manager successfully forecast the market, the investor
will earn abnormal returns relative to the respective benchmark.
The remainder of the chapter is organized as follows. Section 7.2 reviews the literature.
Section 7.3 describes the data and the methodology and Section 7.4 discusses the finding of studies.
Lastly, we conclude in Section 7.5.
7.2 Literature review
A considerable amount of literatures have been published to investigate the performance of
SRI funds against the conventional benchmarks or funds. Previous studies (Cortez et al., 2009;
Galema et al., 2008; Renneboog et al., 2008b) showed that there is no significant difference between
the performance of SRI funds and conventional funds or benchmarks. In other words, both
performances are actually the same. Studies of Europe mainly in United Kingdom due to data
availability (Gregory and Whittaker, 2007). More recently, literature has emerged in other European
countries such as Netherland (Scholtens, 2007), Spain (Fernandes-Izquierdo and Matallin-Saez,
2007), Italy (Signori, 2009) and Asia-Pacific (Humphrey and Lee, 2011; Jones et al., 2008).
Nonetheless, far too little attention has been paid to Luxembourg inspite of her active market.
There are only two studies on Luxembourg which are Rennebourg et al. (2008b) and Rennebourg
(2011). Rennebourg et al. (2008b) and Rennebourg et al. (2011) investigated the performance of SRI
funds for 17 countries including Luxembourg. Rennebourg et al. (2008b) found that SRI funds from
most of the countries were underperformed the market benchmarks significantly. Besides,
Rennebourg et al. (2008b) also found that inverse relationship between SRI fund’s return with
screening intensity. Lastly, larger fund size is found to have a lower return for conventional funds but
not for SRI funds. Rennebourg et al. (2008b) also found little market timing skill in the United
Kingdom, US and continental Europe but not in the Asia Pacific. However, the market timing skill has
not been examined for Luxembourg. To be more specific, we only discuss the finding for Luxembourg,
Rennebourg et al. (2008b) investigated the performance of 12 SRI funds against 360 conventional
funds in Luxembourg. The performance of 12 SRI funds is found to be underperformed the market.
However, the performance of SRI funds and conventional funds has no difference.
57 Fondation De Luxembourg is an independent body set up by the government that specializes in SRI in Luxembourg.
Volume II, Chapter 7 Wei Rong Ang and Hooi Hooi Lean
130
Rennebourg et al. (2011) focus on the investigation on the money flow into and out of SRI
funds and whether the SRI investors are able to select funds that will do well in the future. They found
that SRI investors from the US, United Kingdom and Asia Pacific regions care less about the past
return than the conventional investors. However, market timing skill has not been examined in
Rennebourg et al. (2011).
To the best of our knowledge, there is no single study in the literature focus on SRI funds in
Luxembourg. We intend to fill this research gap here. In addition, the previous studies used small
sample size. Rennebourg et al. (2008b) studied only 12 SRI funds and Rennebourg et al. (2011)
investigated 43 SRI funds only. Our study which uses 188 funds could provide a more robust and
comprehensive result than the above. Based on our literature search, there is no single study on
market timing skill for SRI funds in Luxembourg so far. To the best of our knowledge, this is the
attempt to investigate SRI funds in Luxembourg in a single country perspective.
7.3 Data and methodology
This study investigates 188 SRI funds in Luxembourg for the sample period of January 2001
to December 2011. The data is collected from Eurekahedge database. To minimize survivorship bias,
following Cortez et al. (2009) and Humphrey and Lee (2011), we include died funds which survive
throughout the sample period with at least 24 months return. Two reasons this sample period is
chosen. First, the number of SRI funds launched within this period is the highest. Second, this study
intends to study the effect of global financial crisis. Eurekahege is one of the world’s largest alternative
investment funds research house which specializes in hedge fund research. This database has an
advantage that enabled us to collect all the required SRI funds at once. Risk free rate used in this
study is Euribor 1 month and the market index is the Luxembourg stock market index, LUxX. Both
data are obtained from the Banque Centrale du Luxembourg website58. The data for size, value and
momentum factors are obtained from Style Research Pte Ltd.
We employ market timing model to determine whether the fund managers possess market
timing skill. Stock selection skill is the prediction of an individual stock movement while market timing
skill is the prediction of the general stock market movement. Stock selectivity skill of fund manager is
indicated by the alpha in the CAPM model. Ideally, significant and positive alpha indicates that the
stock selection skill of fund managers is excellent and vice versa. For market timing skill, as indicated
in Treynor and Mazuy (1966), the characteristic line relates the fund’s return and market return. Fund
managers who possess the market timing skill will have quadratic behavior of market return. Treynor
and Mazuy (1966) illustrated the market timing skill by including a quadratic term of excess market
return into the single index CAPM model as follow:
2( ) ( )it ft mt ft mt ft itR R R R R R
where
itR = Return of fund i at time t mtR = Return of market or benchmark
ftR = Return of risk free rate at time t itε = Error term
58 http://www.bcl.lu/en/statistics/series/03_Capital_markets/index.html
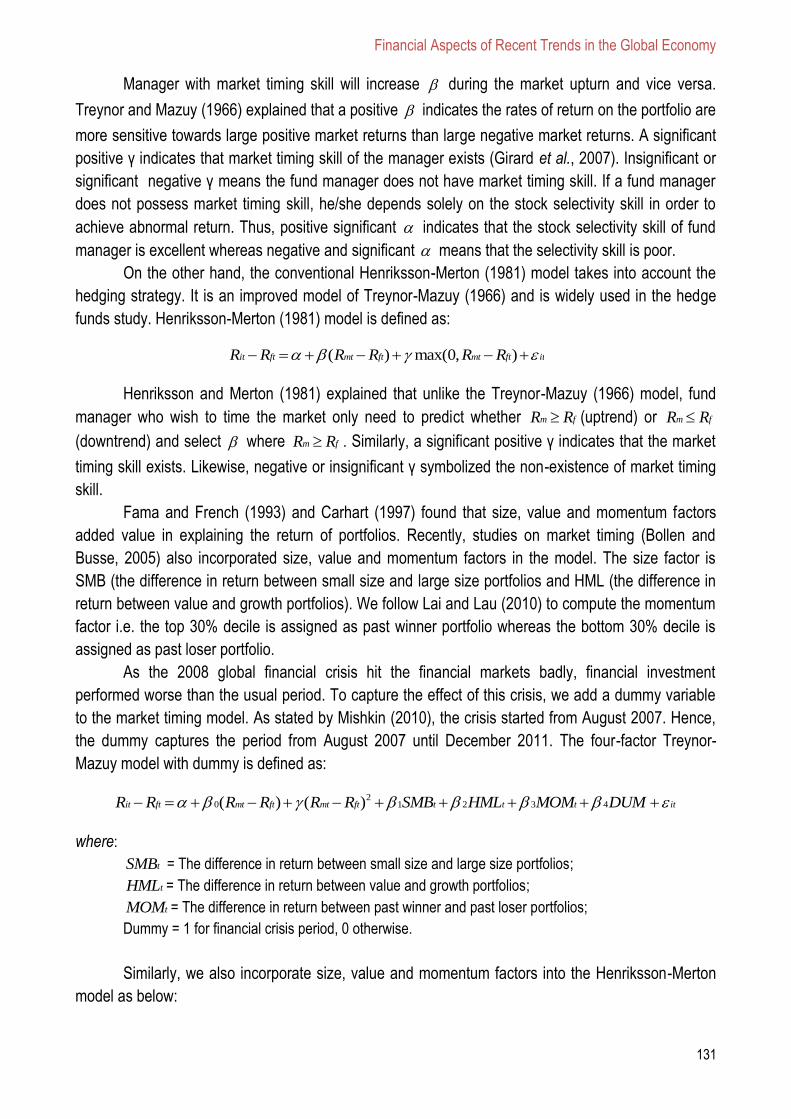
Financial Aspects of Recent Trends in the Global Economy
131
Manager with market timing skill will increase during the market upturn and vice versa.
Treynor and Mazuy (1966) explained that a positive indicates the rates of return on the portfolio are
more sensitive towards large positive market returns than large negative market returns. A significant
positive γ indicates that market timing skill of the manager exists (Girard et al., 2007). Insignificant or
significant negative γ means the fund manager does not have market timing skill. If a fund manager
does not possess market timing skill, he/she depends solely on the stock selectivity skill in order to
achieve abnormal return. Thus, positive significant indicates that the stock selectivity skill of fund
manager is excellent whereas negative and significant means that the selectivity skill is poor.
On the other hand, the conventional Henriksson-Merton (1981) model takes into account the
hedging strategy. It is an improved model of Treynor-Mazuy (1966) and is widely used in the hedge
funds study. Henriksson-Merton (1981) model is defined as:
( ) max(0, )it ft mt ft mt ft itR R R R R R
Henriksson and Merton (1981) explained that unlike the Treynor-Mazuy (1966) model, fund
manager who wish to time the market only need to predict whether m fR R (uptrend) or m fR R
(downtrend) and select where m fR R . Similarly, a significant positive γ indicates that the market
timing skill exists. Likewise, negative or insignificant γ symbolized the non-existence of market timing
skill.
Fama and French (1993) and Carhart (1997) found that size, value and momentum factors
added value in explaining the return of portfolios. Recently, studies on market timing (Bollen and
Busse, 2005) also incorporated size, value and momentum factors in the model. The size factor is
SMB (the difference in return between small size and large size portfolios and HML (the difference in
return between value and growth portfolios). We follow Lai and Lau (2010) to compute the momentum
factor i.e. the top 30% decile is assigned as past winner portfolio whereas the bottom 30% decile is
assigned as past loser portfolio.
As the 2008 global financial crisis hit the financial markets badly, financial investment
performed worse than the usual period. To capture the effect of this crisis, we add a dummy variable
to the market timing model. As stated by Mishkin (2010), the crisis started from August 2007. Hence,
the dummy captures the period from August 2007 until December 2011. The four-factor Treynor-
Mazuy model with dummy is defined as:
20 1 2 3 4( ) ( )it ft mt ft mt ft t t t itR R R R R R SMB HML MOM DUM
where:
tSMB = The difference in return between small size and large size portfolios;
tHML = The difference in return between value and growth portfolios;
tMOM = The difference in return between past winner and past loser portfolios;
Dummy = 1 for financial crisis period, 0 otherwise.
Similarly, we also incorporate size, value and momentum factors into the Henriksson-Merton
model as below:
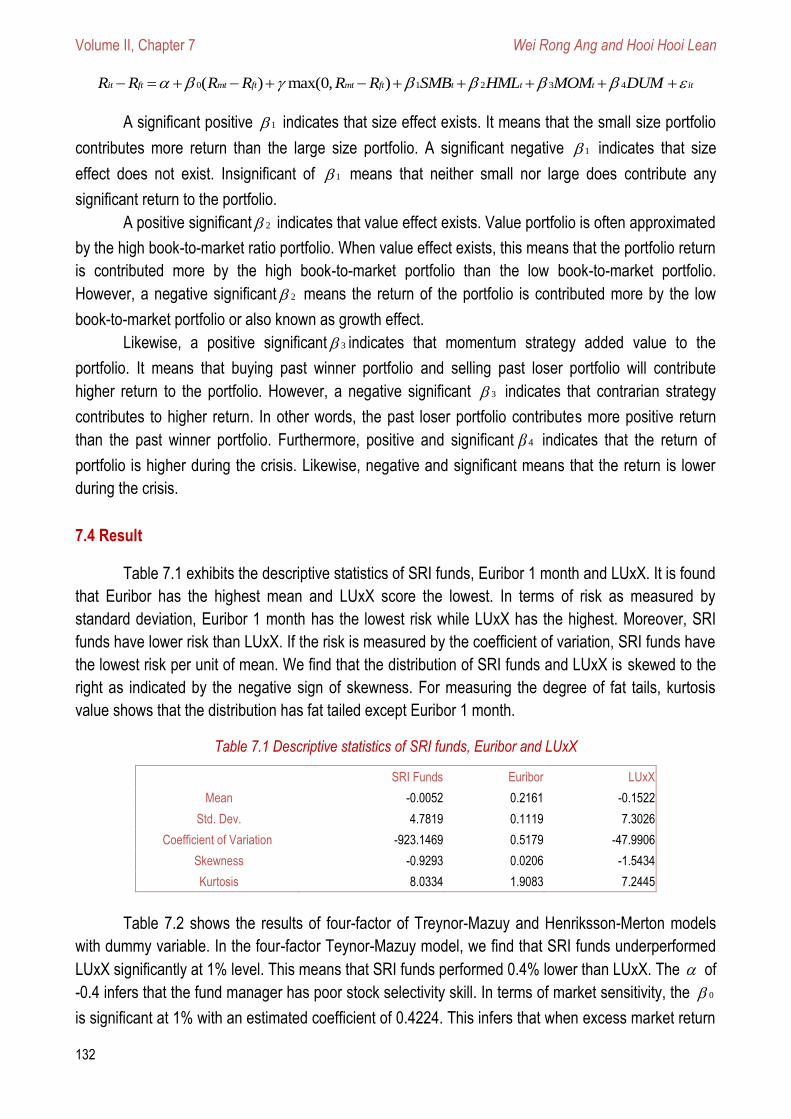
Volume II, Chapter 7 Wei Rong Ang and Hooi Hooi Lean
132
0 1 2 3 4( ) max(0, )it ft mt ft mt ft t t t itR R R R R R SMB HML MOM DUM
A significant positive 1 indicates that size effect exists. It means that the small size portfolio
contributes more return than the large size portfolio. A significant negative 1 indicates that size
effect does not exist. Insignificant of 1 means that neither small nor large does contribute any
significant return to the portfolio.
A positive significant 2 indicates that value effect exists. Value portfolio is often approximated
by the high book-to-market ratio portfolio. When value effect exists, this means that the portfolio return
is contributed more by the high book-to-market portfolio than the low book-to-market portfolio.
However, a negative significant 2 means the return of the portfolio is contributed more by the low
book-to-market portfolio or also known as growth effect.
Likewise, a positive significant 3 indicates that momentum strategy added value to the
portfolio. It means that buying past winner portfolio and selling past loser portfolio will contribute
higher return to the portfolio. However, a negative significant 3 indicates that contrarian strategy
contributes to higher return. In other words, the past loser portfolio contributes more positive return
than the past winner portfolio. Furthermore, positive and significant 4β indicates that the return of
portfolio is higher during the crisis. Likewise, negative and significant means that the return is lower
during the crisis.
7.4 Result
Table 7.1 exhibits the descriptive statistics of SRI funds, Euribor 1 month and LUxX. It is found
that Euribor has the highest mean and LUxX score the lowest. In terms of risk as measured by
standard deviation, Euribor 1 month has the lowest risk while LUxX has the highest. Moreover, SRI
funds have lower risk than LUxX. If the risk is measured by the coefficient of variation, SRI funds have
the lowest risk per unit of mean. We find that the distribution of SRI funds and LUxX is skewed to the
right as indicated by the negative sign of skewness. For measuring the degree of fat tails, kurtosis
value shows that the distribution has fat tailed except Euribor 1 month.
Table 7.1 Descriptive statistics of SRI funds, Euribor and LUxX
SRI Funds Euribor LUxX
Mean -0.0052 0.2161 -0.1522
Std. Dev. 4.7819 0.1119 7.3026
Coefficient of Variation -923.1469 0.5179 -47.9906
Skewness -0.9293 0.0206 -1.5434
Kurtosis 8.0334 1.9083 7.2445
Table 7.2 shows the results of four-factor of Treynor-Mazuy and Henriksson-Merton models
with dummy variable. In the four-factor Teynor-Mazuy model, we find that SRI funds underperformed
LUxX significantly at 1% level. This means that SRI funds performed 0.4% lower than LUxX. The of
-0.4 infers that the fund manager has poor stock selectivity skill. In terms of market sensitivity, the 0
is significant at 1% with an estimated coefficient of 0.4224. This infers that when excess market return

Financial Aspects of Recent Trends in the Global Economy
133
increases by 1%, the excess fund return increases by 0.4%. As the market sensitivity is less than one,
we can conclude that SRI funds are conservative. Our finding is consistent with Bello and Janjigian
(1997). We also find that positive market timing skill exist with the estimated γ of 0.002. This infers
that the SRI fund managers in Luxembourg are able to forecast the movement of stock market in
general. However, there is no size effect. The large size portfolio is found to be contributed more
return than the small size portfolio. Furthermore, we find value effect exists as the SRI funds is titled to
the value portfolio. Nonetheless, contrarian strategy is found to add value in the portfolio return and
the SRI funds produce 0.5% more in return during the financial crisis.
For robustness checking, the four-factor Henriksson-Merton model with dummy is employed
for estimation. The same conclusion can be drawn from this model. In a nutshell, the fund managers
are good macro forecasters in which the managers are good in predicting the general market
movement. However, the fund managers are not good stock pickers. This situation happened might
be due to the nature of SRI funds because the stock has to undergo the screening process before it
can be included in the portfolio. Due to the limited investment opportunity after screening, the fund
managers are left with limited option to forming optimal portfolio.
Table 7.2 Results of four-factor Treynor-Mazuy and Henriksson-Merton Models
Model Four-Factor Treynor-Mazuy Four-Factor Henriksson-Merton
-0.4292*** -0.4497***
0 0.4224*** 0.3796***
0.0020*** 0.0487***
1 -0.0324*** -0.0367***
2 0.0700*** 0.0697***
3 -0.0033*** -0.0031***
4 0.5157*** 0.5079***
7.5 Conclusion
This chapter investigates the market timing skill of SRI fund managers in Luxembourg. The
performance of SRI funds is lower than Euribor in term of mean returns. Moreover, SRI funds are
conservative and underperformed the LUxX. Fund managers are found to possess market timing skill
and able to forecast the stock market movement in general. They are able to shift the composition of
funds according to market condition. On the other hand, there are no size and momentum effects but
value effect exists. Nonetheless, SRI funds have higher return during the 2008 financial crisis. Hence,
we suggest that the SRI funds can be used as a hedge against crisis. Our study reveals an interesting
finding that market timing skill exists with poor stock selectivity skill. With the market timing skill that
the fund managers possessed, they can forecast the future general market movement. Therefore, the
investors will have more confident to invest in SRI funds in Luxembourg.
Acknowledgement
The authors thank Style Research Ltd for providing free access to the data of SMB, HML and
MOM. The first author would like to acknowledge the USM fellowship.
Volume II, Chapter 7 Wei Rong Ang and Hooi Hooi Lean
134
7.6 References
[1] Bello, Z.Y., Janjigian, V. (1997). A Reexamination of the Market-Timing and Security-Selection Performance of Mutual Funds. Financial Analysts Journal, 53(5): 24-30.
[2] Bollen, N.P.B., Busse, J.A. (2005). Short Term Persistence in Mutual Fund Performance. Review of Financial Studies, 18(2): 569-597.
[3] Carhart, M.M. (1997). On Persistence in Mutual Fund Performance. Journal of Finance, 52(1): 57-82.
[4] Comer, G. (2006). Hybrid Mutual Funds and Market Timing Performance. Journal of Business, 79(2): 771-797.
[5] Cortez, M., Silva, F., Areal, N. (2009). The Performance of European Socially Responsible Funds. Journal of Business Ethics, 87(4): 573-588.
[6] Fama, E.F., French, K.R., (1993). Common Risk Factors in the Returns on Stocks and Bonds. Journal of Financial Economics, 33(1): 3-56.
[7] Fernandez-Izquierdo, A., Matallin-Saez, J. (2008). Performance of Ethical Mutual Funds in Spain: Sacrifice or Premium? Journal of Business Ethics, 81(2): 247-260.
[8] Galema, R., Plantinga, A., Scholtens, B., (2008). The Stocks at stake: Return and risk in Socially Responsible Investment. Journal of Banking & Finance, 32(12): 2646-2654.
[9] Girard, E., Rahman, H., Stone, B., (2007). Socially Responsible Investments: Goody-Two-Shoes or Bad to the Bone. Journal of Investing, 16(1): 96-110.
[1] Gregory, A., Whittaker, J., (2007). Performance and performance persistence of ‘Ethical’ unit trusts in the UK. Journal of Business Finance & Accounting, 34(7-8): 1327-1344.
[2] Hamilton, S., Jo, H., and Statman, M., (1993). Doing Well While Doing Good? The Investment Performance of Socially Responsible Mutual Funds. Financial Analysts Journal, 49(6): 62.
[3] Henriksson, R.D., and Merton, R.C., (1981). On Market Timing and Investment Performance. II. Statistical Procedures for Evaluating Forecasting Skills. Journal of Business, 54(4): 513-533.
[4] Henry, C., Brion, I. (2009). Socially Responsible Investment: Towards Sustainable Growth, Luxembourg for Finance, [online]. Available at: http://www.luxembourgforfinance.lu/sites/luxembourgforfinance/files/ lff_ newsletter_en_nr1j09.pdf [Assessed 15 November 2012].
[5] Humphrey, J., Lee, D. (2011). Australian Socially Responsible Funds: Performance, Risk and Screening Intensity. Journal of Business Ethics, 102(4): 519-535.
[6] Kon, S.J., Jen, F.C. (1979). The Investment Performance of Mutual Funds: An Empirical Investigation of Timing, Selectivity, and Market Efficiency. Journal of Business, 52(2): 263-289.
[7] Jones, S., van der Laan, S., Frost, G., Loftus, J. (2008). The Investment Performance of Socially Responsible Investment Funds in Australia. Journal of Business Ethics, 80(2): 181-203.
[8] Lai, M.M., Lau, S.H. (2010). Evaluating Mutual Fund Performance in an Emerging Asian Economy: The Malaysian Experience. Journal of Asian Economics, 21(4), 378-390.
[9] Lee, D.D., Humphrey, J.E., Benson, K.L., Ahn, J.Y.K., (2010). Socially Responsible Investment Fund Performance: The Impact of Screening Intensity, Accounting & Finance, 50(2): 351-370.
[10] Mishkin, F.S. (2010). The Economics of Money, Banking and Financial Markets, 2nd edition, Boston: Pearson Education, Inc.
[11] Renneboog, L., Ter Horst, J., Zhang, C. (2008a). Socially Responsible Investments: Institutional Aspects, Performance, and Investor Behavior, Journal of Banking & Finance, 32(9): 1723-1742.
[12] Renneboog, L., Ter Horst, J., Zhang, C. (2008b). The price of Ethics and Stakeholder Governance: The Performance of Socially Responsible Mutual Funds, Journal of Corporate Finance, 14(3): 302-322.
[13] Renneboog, L., Ter Horst, J., Zhang, C. (2011). Is Ethical Money Financially Smart? Nonfinancial Attributes and Money Flows of Socially Responsible Investment Funds. Journal of Financial Intermediation, 20(4): 562-588.
Financial Aspects of Recent Trends in the Global Economy
135
[14] Scholtens, B. (2007). Financial and Social Performance of Socially Responsible Investments in the Netherlands. Corporate Governance: An International Review, 15(6): 1090-1105.
[15] Signori, S. (2009). Ethical (SRI) Funds in Italy: a Review. Business Ethics: A European Review, 18(2): 145-164.
[16] Treynor, J.L., Mazuy, K.K., (1966). Can Mutual Funds Outguess the Market? Harvard Business Review, 44(4): 131-136.

Volume II, Chapter 8 Jacek Binda and Paweł Mrowiec
136
x
Chapter 8
THE MARKET OF HIGH RISK FINANCIAL SERVICES
by Jacek BINDA
Bielsko-Biała School of Finance and Law, Poland
by Paweł MROWIEC
Bielsko-Biała School of Finance and Law, Poland
8.1 Introduction
8.2 The notion of ‘near banks’ market
8.3 Protection of financial resources
8.4 'Loans' costs offered by ‘near banks’
8.5 The customer and financial services market
8.6 Summary
8.7 References
Financial Aspects of Recent Trends in the Global Economy
137
THE MARKET OF HIGH RISK FINANCIAL SERVICES
Jacek BINDA59
Bielsko-Biała School of Finance and Law, Poland
Paweł MROWIEC60
Bielsko-Biała School of Finance and Law, Poland
Abstract
It is really difficult to arrive at a precise definition of the term ‘near bank’, it is equally difficult to
regulate the scope of financial services that ‘near banks’ render. Shadow banking, as the sector of ‘near
banks’ is often referred to, came into play after the year 2000. In 2011, in the United States alone this sector
was worth 24 trillion dollars61, and globally it reached the value of about 60 trillion62 dollars. Despite high level
of risk related to shadow banking services offered by unsupervised and unauthorized entities, those services
enjoy a considerable popularity also in Poland. Amber Gold Ltd. may be a good example of a Polish shadow
financial institution which left thousands of its customers facing financial ruin. On 20 th September 2012 the
District Court of Gdansk declared Amber Gold’s liquidation bankruptcy. By the end of September the total sum
of Amber Gold investors amounted to 16,000 people, and the value of the company’s due liabilities exceeded
700 million zlotys. The value of unprotected company assets, on the other hand, was on the level as low as
about 50 million zlotys.
Currently, the black list of entities which do not hold a permission to render bank services, especially
such as receiving money deposits in order to charge them with risk, is getting longer and longer. In the end of
November the list, prepared by Polish Financial Supervision Authority (KNF) had 33 entries, which constitutes
a 43% increase compared to the end of September. The reason for this may be the introduction by KNF of
tightened criteria for loan availability in the form of T recommendation. Implementation of T recommendation
shifted the demand for bank services towards non-bank entities.
The subject of this chapter is an analysis of the market of high risk financial services, the reasons of its
fast growth as well as supervisory activities undertaken by Polish Financial Supervision Authority (KNF) related
to this phenomenon.
Keywords: shadow banking, financial pyramid, T recommendation, high risk financial services.
8.1 Introduction
History of both saving and lending is as long as the history of humanity. The first humans
already knew that they could not eat the whole food they had and they realized they needed to spare
some of it for later63. The processes of saving and lending money constitute one of the most important
financial behaviors which are closely related to certain aims and motives such as: increase of
59 Jacek Binda, Associate Professor at Bielsko-Biała School of Finance and Law, ul. Tańskiego 5, 43-382 Bielsko Biała Poland 60 Paweł Mrowiec, Bielsko-Biała School of Finance and Law, Tańskiego 5, 43-382 Bielsko Biała Poland 61 Financial Times, „Shadow banking surpasses pre-crisis level”, October 27th 2011, http://www.ft.com/cms/s/0/39c6a414-00b9-
11e1-930b-00144feabdc0.html#axzz1zNL3SjGW 62 Masters, Brook, Shadow banking surpasses pre-crisis level, The Financial Times, October 27th 2011, available 16.01.2012[in:]
ft.com 63 M. Pachucki, Piramidy i inne oszustwa na rynku finansowym, KNF, Warsaw 2012, p. 6.
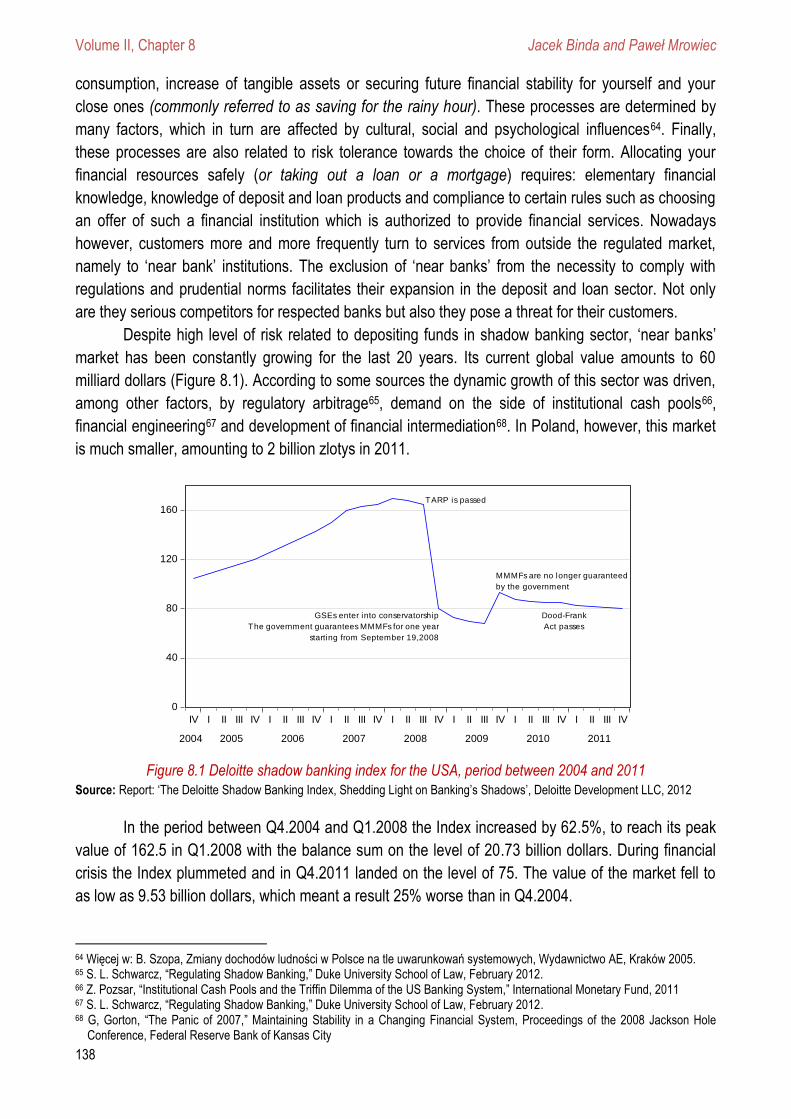
Volume II, Chapter 8 Jacek Binda and Paweł Mrowiec
138
consumption, increase of tangible assets or securing future financial stability for yourself and your
close ones (commonly referred to as saving for the rainy hour). These processes are determined by
many factors, which in turn are affected by cultural, social and psychological influences64. Finally,
these processes are also related to risk tolerance towards the choice of their form. Allocating your
financial resources safely (or taking out a loan or a mortgage) requires: elementary financial
knowledge, knowledge of deposit and loan products and compliance to certain rules such as choosing
an offer of such a financial institution which is authorized to provide financial services. Nowadays
however, customers more and more frequently turn to services from outside the regulated market,
namely to ‘near bank’ institutions. The exclusion of ‘near banks’ from the necessity to comply with
regulations and prudential norms facilitates their expansion in the deposit and loan sector. Not only
are they serious competitors for respected banks but also they pose a threat for their customers.
Despite high level of risk related to depositing funds in shadow banking sector, ‘near banks’
market has been constantly growing for the last 20 years. Its current global value amounts to 60
milliard dollars (Figure 8.1). According to some sources the dynamic growth of this sector was driven,
among other factors, by regulatory arbitrage65, demand on the side of institutional cash pools66,
financial engineering67 and development of financial intermediation68. In Poland, however, this market
is much smaller, amounting to 2 billion zlotys in 2011.
Figure 8.1 Deloitte shadow banking index for the USA, period between 2004 and 2011 Source: Report: ‘The Deloitte Shadow Banking Index, Shedding Light on Banking’s Shadows’, Deloitte Development LLC, 2012
In the period between Q4.2004 and Q1.2008 the Index increased by 62.5%, to reach its peak
value of 162.5 in Q1.2008 with the balance sum on the level of 20.73 billion dollars. During financial
crisis the Index plummeted and in Q4.2011 landed on the level of 75. The value of the market fell to
as low as 9.53 billion dollars, which meant a result 25% worse than in Q4.2004.
64 Więcej w: B. Szopa, Zmiany dochodów ludności w Polsce na tle uwarunkowań systemowych, Wydawnictwo AE, Kraków 2005. 65 S. L. Schwarcz, “Regulating Shadow Banking,” Duke University School of Law, February 2012. 66 Z. Pozsar, “Institutional Cash Pools and the Triffin Dilemma of the US Banking System,” International Monetary Fund, 2011 67 S. L. Schwarcz, “Regulating Shadow Banking,” Duke University School of Law, February 2012. 68 G, Gorton, “The Panic of 2007,” Maintaining Stability in a Changing Financial System, Proceedings of the 2008 Jackson Hole
Conference, Federal Reserve Bank of Kansas City
0
40
80
120
160
IV I II III IV I II III IV I II III IV I II III IV I II III IV I II III IV I II III IV
2004 2005 2006 2007 2008 2009 2010 2011
GSEs enter into conservatorship
The government guarantees MMMFs for one year
starting from September 19,2008
TARP is passed
MMMFs are no longer guaranteed
by the government
Dood-Frank
Act passes
Financial Aspects of Recent Trends in the Global Economy
139
The global financial crisis and its influence on Polish financial market brought about tightening of rules
concerning granting loans and mortgages. Prudential recommendations introduced by Polish
Financial Supervision Authority (KNF) within its supervisory activities have double nature: T
recommendations (on good practices in risk management of retail credit exposures) and S
recommendations (on good practices in managing credit exposures for financing real estate
investments and mortgages). These new regulations effectively limited the access to loans and
mortgages and caused instant boom on services offered by ‘near banks’ institutions. Bank customers
with bad credit standing and with no proper securities turned to parallel financial market and started to
borrow money in the shadow zone, outside the reach of regulators and supervisors.
8.2 The notion of ‘near banks’ market
‘Near banks’ are most frequently defined as non-bank financial institutions operating without
permission of Financial Supervisory Authority or a valid bank license but granting loans and pooling
financial deposits as if they were real banks69,70. Polish Financial Supervisory Authority (KNF) points
to the basis of ‘near banks’ activities which includes: accepting money contributions from customers
and promising high interest rates and high returns from investments through making profitable but
very risky deals and investments71,72. ‘Near banks’ do not need to comply with prudential regulations,
capital restrictions or guarantee requirements to protect the accumulated financial resources which
makes their activity extremely risky for customers. Shadow banking is also defined as a group of
institutions and markets performing traditional banking functions but standing outside the system of
regulated deposit institutions73.
In literature there are also other definitions which refer to ‘near banks’ as financial institutions
rendering services similar to bank services and acting upon specific acts74. A good example of such
an institution is the Polish credit union SKOK - a cooperative insurance and credit intermediation
company75, 76. Because of high demand for financial services offered by SKOK outlets, the company’s
market share considerably increased. Thus it became necessary to embrace it by a net of regulations
to avoid the situation as in Great Britain, where competitive imbalance led to the transfer of credit
demand towards unregulated loan market77. The supervisory changes over SKOK system are aimed
at the protection of depositors78 as well as assurance of security and stability of the company’s
operations.
69 See for example: K. Kliger, Parabanki nie zarobią na fikcyjnych kredytach, Dziennik Gazeta Prawna, 8 April 2010 (nr 68), p. 1; E.
Stępień, Łatwiej będzie zaciągnąć kredyt Parabanki uzyskają dostęp do tajemnicy bankowej, Dziennik Gazeta Prawna, 2-3 May 2011 (nr 84); R. Grzyb Pożyczka na 31 tysięcy procent, Dziennik Gazeta Prawna, 6 July 2011(nr 129).
70 L. Góral, Instytucje „parabankowe” w ustawodawstwie wybranych krajów Unii Europejskiej w Polsce, PUG 1997, nr 10, p.7. 71 http://www.knf.gov.pl/Images/Piramidy_i_oszustwa_16_12_2011_tcm75-28815.pdf 72 http://www.mf.gov.pl/_files_/aktualnoci/2012/sierpien/20120816_ksf.pdf 73 B. Bernanke, Russell Sage Foundation and the Century Foundation Conference on "Rethinking Finance," New York, April 13,
2012 74 Act of 5 December 2009 on Collective Credit Unions, Journal of Laws 2009, Nr 77, item 649. 75 W. Szpringer, Problem parabanków na tle pojęcia banku, jako instytucji kredytowej w Unii Europejskiej, Prawo Bankowe 2004, nr
11, p. 49 76 W. Szpringer, Wpływ instytucji parabankowych na bezpieczeństwo i stabilność rynków finansowych, Bezpieczny Bank 1998, nr 4,
p. 24 77 More in: S. Kasiewicz, L. Kurkliński (red.), Szok regulacyjny a konkurencyjność i rozwój sektora bankowego, Warszawski Instytut
Bankowości, Warsaw 2012. 78 Deposits placed in SKOK: data for the end of 2Q 2012 amounted to 15 319 864 zlotys
Volume II, Chapter 8 Jacek Binda and Paweł Mrowiec
140
Extending Polish Financial Supervisory Authority’s control over SKOK credit union assures its stability
and the benefits coming from stable cooperative credit sector can be felt by all: for SKOK itself (lack of
disturbances in company’s operations), for members of this cooperative union (safer financial offer)
and for the state (SKOK plays an important role in counteracting financial exclusion).
The advantage of state supervision relies on following aspects79:
Rule of independence (objective evaluation) - public supervisor has no interest whatsoever
to affect the image of supervised entities. In case of public supervision we can notice lack of
direct relation with the supervised entity;
Rule of equal treatment - each and every entity receives identical treatment and is subject to
identical supervisory regulations;
Rule of transparency - transparent and supervisory activities so that supervised entities
could be aware of objectives of these activities;
Rule of formalized actions - decisions are taken in accordance with administrative code.
Supervised entities have the right to appeal from supervisory decisions;
Rule of proportionality - taking into consideration the size and profile of entities operating on
different markets. Unconditional application of agreed norms but recommendations and
requirements of realization dependent on the scope of activity of the supervised entity;
Rule of collaboration - supervisors engage in extensive collaboration with entities both while
agreeing on specific activities for a single entity and while preparing guidelines and
recommendations for the whole financial sector. Supervisors meet regularly with the
participants of the financial market;
Rule of discretion and non-disclosure of information concerning the condition of a particular
entity - the supervisory body does not speak publicly about individual entities under its
supervision only about the issues relating to the situation of financial sectors as a whole.
The data are presented in an aggregated way and no ratings are ever prepared.
Supervisory changes also create new obligations on the part of SKOK –to name just a few:
conducting an external audit and passing the results on to KNF (within 3 months from the
date of entry into force of the act);
updating the statutes and applying to Polish Financial Supervisory Authority (KNF) for
approval of their content (within 9 months from the date of entry into force of the act);
applying to KNF for approval of presidents of the board (within 9 months from the date of
entry into force of the act);
maintaining the capital adequacy ratio on the level of 5% (entry into force of this regulations
after 18 months from passing of the act);
obligation to keep the resources on stabilization fund and to maintain liquid reserve in the
form determined by KNF.
From the author’s point of view the supervisory changes should also include:
access to the national system of guaranteed deposits, currently the deposits are insured by
mutual insurance companies, however, the sum of resources is limited when compared to
the system of deposit protection guaranteed by the state,
79 K. Broda, Zasady działania nadzoru publicznego, http://www.knf.gov.pl/Images/KNF_SKOKi _13-09-2011_tcm75-27669.pdf
Financial Aspects of Recent Trends in the Global Economy
141
verification of minimal capital adequacy ratios for SKOK, at the moment the level of this
ratio equals about 3%, while the new act introduces minimum threshold at 5%. Both values
are much below international standards which prescribe maintaining the capital ratio on the
level of at least 8%, however the method of its calculation is different, thus there is a strong
need to unify the methods,
verification of capital sources, nowadays the only source of SKOK’s capital are: net income,
entry fees and shares of the union members, in order to increase the capital other sources
should be considered, for example deferred shares (they can be sold but not withdrawn)
and/or subordinated debt80.
The catalogue of financial institutions offering services similar to bank services was enlarged
upon the Act on Payment Services by national payment institutions and payment service centers81.
The first one acts upon permission granted by Financial Supervision Authority (KNF), the second is
registered in the records of Financial Supervision Control Office.
Regardless of definitions quoted herein, shadow banking institutions shall be treated here as
business entities other than banks and SKOK outlets whose catalogue of basic activities embraces
pooling money contributions from general public but with assured provision liquidity on demand.
The processes of deregulation, liberalization and bigger scope of activities conducted by
entities led to a situation in which non-bank organizations develop and offer bank services to general
public. Thus, it becomes vital to cover the shadow banking sector with an efficient network of
supervision. The main objectives of the supervisory activities should be: assuring high level of security
of deposited money, making sure that all activities are conducted in accordance with banking law
regulations and, in case of irregularities, implementation of remedial actions.
8.3 Protection of financial resources
‘Near banks’ may attract customers by offering them opportunity to invest money in potentially
profitable but very risky ventures. These may include investment in gold, real estate or precious
metals. It should also be noted that shadow banking institutions, for some reason, are trusted and
respected by a lot of people and are treated as regular public trust organizations such as real banks.
Security of ‘deposits’ in ‘near banks’ is very often unjustifiably emphasized using terminology reserved
for core banking activities. These activities range from pooling money contributions with liquidity on
demand or after a fixed date, to granting cash loans and credits. It should also be noted here that
using such wording is regulated in the Banking Law Act, article 5, item 1 on core banking activities
and requires permission from KNF82. Another commonly used practice of ‘near banks’ aimed at
increasing security of deposits is covering them by an insurance policy issued by an insurer acting
upon Financial Supervision Authority’s permission. Such a solution is apparently satisfying for the
customer as it gives him or her an impression that his or her financial resources entrusted to ’near
bank’ are safe and well protected. However, provisions of most insurance policies exclude the
insurer’s liability in case when the entity whose customers are to be covered, conducts activities which
80 World Bank Report Credit Unions in Poland: Diagnostic and Proposals on Regulation and Supervision, http://www.knf.gov.pl 81 Act of 19 August 2011 on Payment Services (Journal of Laws 2011, Nr 199, item 1175.) 82 Journal of Laws 1997 Nr 140 item 939, of 29 August 1997, Banking Law
Volume II, Chapter 8 Jacek Binda and Paweł Mrowiec
142
are unlawful. It refers to situations when business activity is conducted without valid permission to, for
example, render credit services or open deposit accounts. Taking into consideration all what was
stated above, we can assume that the security of funds deposited in ‘near banks’ which remain
outside any control of financial supervision bodies, is only guaranteed through mutual trust between
both parties based on client-institution relation.
The fundamental difference in the level of security of funds placed in shadow banking sector
and in respected banks is the guarantee of Bank Guarantee Fund. This guarantee extends the capital
accumulated in clients’ personal accounts and receivables resulting from other bank activities as for
the day of fulfillment of guarantee conditions proved by all necessary documents issued by the bank in
the client’s name (art. 2 point 2)83.
The provisions of Bank Guarantee Fund Act assure the return of all capital together with
interest rate earned up to the value of 100,000 Euro within 20 working days. This regulation applies
also to the capital accumulated in joint accounts by each of the co-holders of this account84. The
compensation rule does not apply here, which means that the customer is paid all accumulated funds
up to the guaranteed limit without diminishing them by the value of credits contracted in a given bank.
The time of payment of guaranteed funds is determined after guarantee condition is fulfilled (art. 26g,
paragraph 1, point1. of Bank Guarantee Fund Act) according to the art. 2 point 4a of the Act i.e. upon
issue of Financial Supervision Authority (KNF) decision on suspending bank operations and setting up
litigation trust and upon application for commencing bankruptcy proceedings to the court of local
jurisdiction85.
The deposit guarantee schemes constitute an important instrument safeguarding financial
system against crisis situations (for instance announcing bank bankruptcy or mass deposit pay-outs)
and loss of trust. It takes on a new meaning with respect to deposit market which is an important
source financing credit institutions, and in social aspect-ensuring financial security of individual and
corporate customers. For this reason the guidelines for EU deposit guarantee schemes were unified
(directive 2009/14/EC of 11 March 2009 amending Directive 94/19/EC on deposit-guarantee
schemes). The coverage level was raised to 100,000 euro, the provision on own contribution of
depositors was deleted, the time of pay out of deposits was shortened to 20 days, and the group of
entities covered by the guarantees was extended. The practice of raising the guarantees of deposit
protection by some member states was thus stopped what resulted in reduction in the number of
deposits in countries with lower guarantee requirements. The regulatory and supervisory activities
over bank system are aimed at limiting excessive competitive practices (for example moral hazard)
between banks. The victim of such practices would, of course, be customers. Another goal here is
protection of ‘weaker entities’ – the service buyers against putting on them the risk related to financial
operations86.
Since the introduction of Bank Guarantee Fund Act in 1995, the Fund has accomplished
guarantees for depositors of 94 banks in bankruptcy (5 commercial banks and 89 cooperative banks).
Made by BGF payments of guarantees represented 814.4 million zlotys and accounted for almost 319
83 Journal of Laws 2009 no 84 item 711, Text valid from 14 July 2011 84 Journal of Laws 2010 Nr 257,item 1724 85 Journal of laws 2009 no 84 poz. 711, Text valid from 14 July 2011 86 R. Kaszubski, A.Tupaj-Cholewa, Prawo bankowe, Warsaw 2010, p. 166.

Financial Aspects of Recent Trends in the Global Economy
143
thousand of authorized depositors87. The number of banks in bankruptcy between 1992-2011 shows
Table 8.1.
Table 8.1 Number of banks in bankruptcy between 1992-2011
Year Commercial banks Cooperative banks
1992 0 1
1993 0 10
1994 0 23
1995 before BGF Regulation 1 9
1995 after BGF Regulation 2 48
1996 1 30
1997 0 6
1998 0 4
1999 1 0
2000 1 0
2001 0 1
2002 -2011 0 0
Total: 6 132
Source: http://www.bfg.pl
SKOK Credit Union owns savings protection system set up as supervisory activities carried
out by Safe National. The objective of Safe National activity is to ensure the financial stability of all the
associated cash departments and supervise their activity in order to guarantee security of the
accumulated savings. It also monitors compatibility of SKOK activity with Act Regulations. In order to
reach this objective Savings Protection Scheme has been formulated which secures the savings of
SKOK members up to 100,000 Euros. Moreover, SKOK Credit Unions are obliged to keep in Safe
National the stabilization fund consisting of deposits made by affiliated safes representing at least 1 %
in value of all the assets and increased by balance surplus of Safe National88. The stabilization fund
according to Safe National's statute can be allocated to stabilization loans that are granted to SKOK
Credit Unions on preferential terms, providing safes with grants to cover their financial issues and
offer other assistance for example covering the costs of preparation and realisation of recovery
programs. None of ''shadow zone'' institutions guarantees such level of security; the example is
bankruptcy of Secure Safe Savings (BKO) functioning between 1989-1990. As a result of this activity
the trustee paid to the clients only 1/4 of the amount invested. Shadow banking institutions cannot
offer attractive high interest rate investments or guarantee return on capital with interest earned.
However using loopholes they can offer 'deposit contracts' which are a type of civil contract similar to
a private loan. The mentioned contracts 'work' in the same way as deposits however they are not
called ''deposits''. These investments can be misleading for customers, and wrongly mistaken for
secure deposits that banks offer. The investment is not regarded as a deposit according to the
banking law, and ''shadow banking'' is not covered by national guarantee money return. Additionally,
87 http://www.bfg.pl 88 Value of stabilisation fund on 31th December 2010 was equal to 425,907,923.52 zlotys. Out of the fund in 2010 there were
stabilisation credits granted in the total amount of 20,030,126.00 zlotys, and total involvement in stabilisation service was equal to 70,930,311.86 zlotys, www.skok.pl
Volume II, Chapter 8 Jacek Binda and Paweł Mrowiec
144
money allocation can be very risky which means the possibility of losing the part of it or even the
whole of invested capital by the depositor.
The employment of deposit contracts by near banks does not conflict with Bank Law Acts, due
to lack of regulations that would forbid the public to lend money to companies particularly whose that
do not have any guarantees of Bank Guarantee Fund. The future of entrusted money depends on
near banks activities and market fluctuations. It is worth mentioning that if the entity receives funds for
deposits or deposit contract, which poses risk on them, the bank requires obtaining permission for
banking activity from Polish Financial Supervision Authority. Otherwise the regulations of criminal
liability are employed The Banking Act 1 Article 171.'Whoever carries out, without authorization, the
business of accepting funds from other natural or legal persons or organizations without legal
personality in order to extend loans or cash advances or expose such funds to risk in another way
shall be liable to a fine of up to 5.000,000 zlotys and to imprisonment for a term of up to 3 years'89.
The fact of lending money to institutions (including near banks) by the public is questionable
as well as the way of allocating funds by businesses. Near banks within their basic activity not only
invest in precious metals, foreign exchange or real estate but also grant cash loans and consolidated
loans to their customers. Here we can talk about some discrepancies with Banking Law Regulations.
Summing up, the high risk of 'shadow banking system' activity is mostly connected with
shortage of law regulation concerning financial supervision, often lack of current financial reports and
guarantee scheme, finally insufficient capital to the scale of business operations.
8.4 'Loans' costs offered by ‘near banks’
Near banks' flexible approach to the customers as well as attractive offers with much higher
deposit interest compared to other banks, attract attention to this form of banking. There is a dynamic
increase observed not only in the number of shadow banking institutions but also in the number of
people using shadow banking offers. In Profi Credit Poland, company limited by guarantee, the
number of granted loans and credits rose in a third quarter of 2011 from 16,876 thousand to 26,276
thousand in a third quarter of 2012 which indicates percentage increase of 156%. Value at par of
granted credits and loans increased by about 164% in that time90.
According to Polish Financial Supervision Authority report, there are 33 companies on Polish
market that conduct banking activities without permission for accepting deposits and risk exposure
(including Amber Gold and FinRoyal FRL Ltd , both declared bankruptcy). The businesses employ the
latest ways of reducing the distance between business - customer, for example by granting loans by
phone or via Internet. To use such business services generally the customer's registration on the
banking site is necessary as well as transfer from customer's bank in order to confirm the identity.
Other loan activities such as amount of loan are set by phone, text massage or web site. Positive
lender's acceptance is demonstrated by the funds transfer to the appointed during registration bank
account.
Despite using cheap and common communication channels (text message, phone, Internet),
incurred costs of shadow banking institutions loans are fairly high. Though interest does not exceed
89 Act of 29 August 1997 Bank Law, Journal of Laws. year 1997 , No 140, item. 939. 90 http://profirealgroup.com/images/Financni_zpravy/EN/credit_pl/2012/Raport%20kwartalny%20na%2030%20wrzesie%202012.pdf
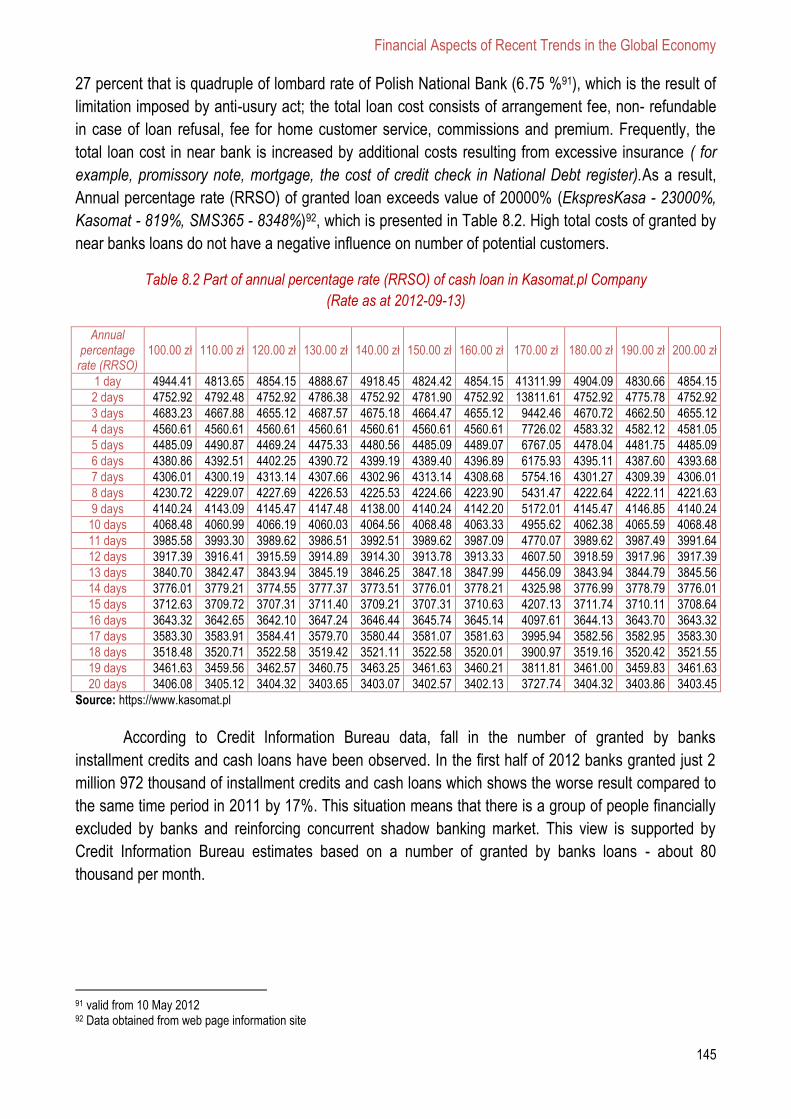
Financial Aspects of Recent Trends in the Global Economy
145
27 percent that is quadruple of lombard rate of Polish National Bank (6.75 %91), which is the result of
limitation imposed by anti-usury act; the total loan cost consists of arrangement fee, non- refundable
in case of loan refusal, fee for home customer service, commissions and premium. Frequently, the
total loan cost in near bank is increased by additional costs resulting from excessive insurance ( for
example, promissory note, mortgage, the cost of credit check in National Debt register).As a result,
Annual percentage rate (RRSO) of granted loan exceeds value of 20000% (EkspresKasa - 23000%,
Kasomat - 819%, SMS365 - 8348%)92, which is presented in Table 8.2. High total costs of granted by
near banks loans do not have a negative influence on number of potential customers.
Table 8.2 Part of annual percentage rate (RRSO) of cash loan in Kasomat.pl Company
(Rate as at 2012-09-13)
Annual percentage
rate (RRSO) 100.00 zł 110.00 zł 120.00 zł 130.00 zł 140.00 zł 150.00 zł 160.00 zł 170.00 zł 180.00 zł 190.00 zł 200.00 zł
1 day 4944.41 4813.65 4854.15 4888.67 4918.45 4824.42 4854.15 41311.99 4904.09 4830.66 4854.15
2 days 4752.92 4792.48 4752.92 4786.38 4752.92 4781.90 4752.92 13811.61 4752.92 4775.78 4752.92
3 days 4683.23 4667.88 4655.12 4687.57 4675.18 4664.47 4655.12 9442.46 4670.72 4662.50 4655.12
4 days 4560.61 4560.61 4560.61 4560.61 4560.61 4560.61 4560.61 7726.02 4583.32 4582.12 4581.05
5 days 4485.09 4490.87 4469.24 4475.33 4480.56 4485.09 4489.07 6767.05 4478.04 4481.75 4485.09
6 days 4380.86 4392.51 4402.25 4390.72 4399.19 4389.40 4396.89 6175.93 4395.11 4387.60 4393.68
7 days 4306.01 4300.19 4313.14 4307.66 4302.96 4313.14 4308.68 5754.16 4301.27 4309.39 4306.01
8 days 4230.72 4229.07 4227.69 4226.53 4225.53 4224.66 4223.90 5431.47 4222.64 4222.11 4221.63
9 days 4140.24 4143.09 4145.47 4147.48 4138.00 4140.24 4142.20 5172.01 4145.47 4146.85 4140.24
10 days 4068.48 4060.99 4066.19 4060.03 4064.56 4068.48 4063.33 4955.62 4062.38 4065.59 4068.48
11 days 3985.58 3993.30 3989.62 3986.51 3992.51 3989.62 3987.09 4770.07 3989.62 3987.49 3991.64
12 days 3917.39 3916.41 3915.59 3914.89 3914.30 3913.78 3913.33 4607.50 3918.59 3917.96 3917.39
13 days 3840.70 3842.47 3843.94 3845.19 3846.25 3847.18 3847.99 4456.09 3843.94 3844.79 3845.56
14 days 3776.01 3779.21 3774.55 3777.37 3773.51 3776.01 3778.21 4325.98 3776.99 3778.79 3776.01
15 days 3712.63 3709.72 3707.31 3711.40 3709.21 3707.31 3710.63 4207.13 3711.74 3710.11 3708.64
16 days 3643.32 3642.65 3642.10 3647.24 3646.44 3645.74 3645.14 4097.61 3644.13 3643.70 3643.32
17 days 3583.30 3583.91 3584.41 3579.70 3580.44 3581.07 3581.63 3995.94 3582.56 3582.95 3583.30
18 days 3518.48 3520.71 3522.58 3519.42 3521.11 3522.58 3520.01 3900.97 3519.16 3520.42 3521.55
19 days 3461.63 3459.56 3462.57 3460.75 3463.25 3461.63 3460.21 3811.81 3461.00 3459.83 3461.63
20 days 3406.08 3405.12 3404.32 3403.65 3403.07 3402.57 3402.13 3727.74 3404.32 3403.86 3403.45
Source: https://www.kasomat.pl
According to Credit Information Bureau data, fall in the number of granted by banks
installment credits and cash loans have been observed. In the first half of 2012 banks granted just 2
million 972 thousand of installment credits and cash loans which shows the worse result compared to
the same time period in 2011 by 17%. This situation means that there is a group of people financially
excluded by banks and reinforcing concurrent shadow banking market. This view is supported by
Credit Information Bureau estimates based on a number of granted by banks loans - about 80
thousand per month.
91 valid from 10 May 2012 92 Data obtained from web page information site
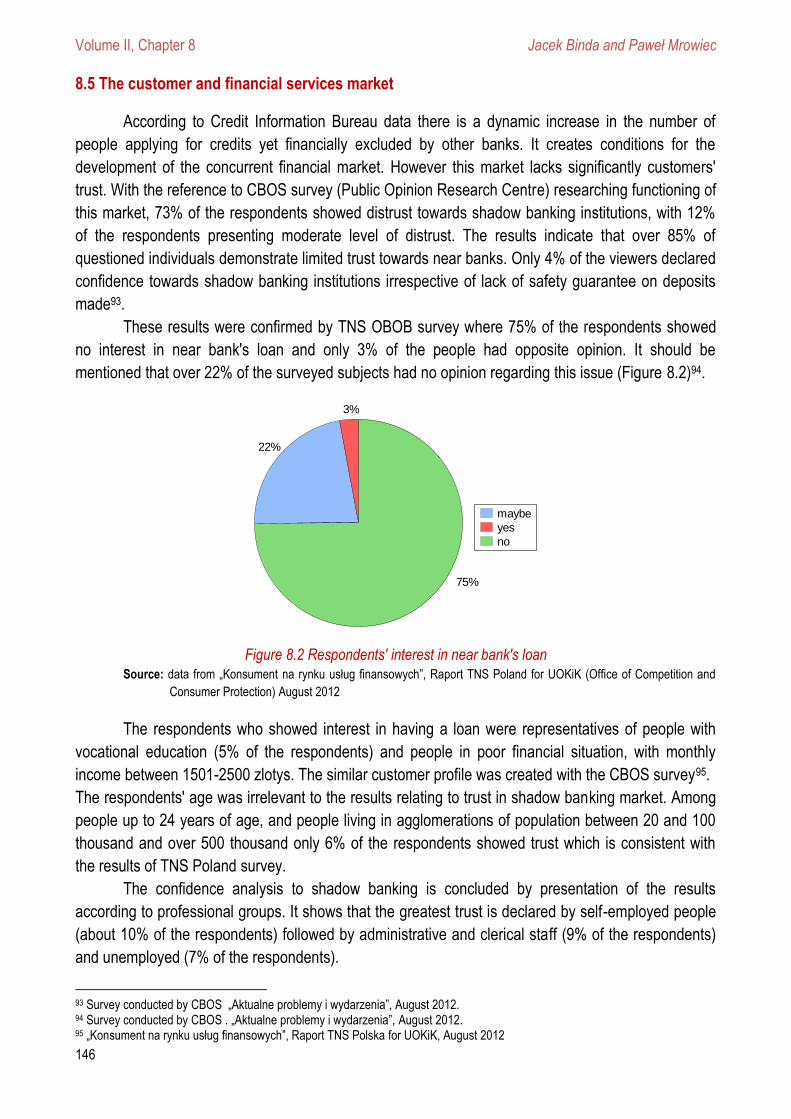
Volume II, Chapter 8 Jacek Binda and Paweł Mrowiec
146
8.5 The customer and financial services market
According to Credit Information Bureau data there is a dynamic increase in the number of
people applying for credits yet financially excluded by other banks. It creates conditions for the
development of the concurrent financial market. However this market lacks significantly customers'
trust. With the reference to CBOS survey (Public Opinion Research Centre) researching functioning of
this market, 73% of the respondents showed distrust towards shadow banking institutions, with 12%
of the respondents presenting moderate level of distrust. The results indicate that over 85% of
questioned individuals demonstrate limited trust towards near banks. Only 4% of the viewers declared
confidence towards shadow banking institutions irrespective of lack of safety guarantee on deposits
made93.
These results were confirmed by TNS OBOB survey where 75% of the respondents showed
no interest in near bank's loan and only 3% of the people had opposite opinion. It should be
mentioned that over 22% of the surveyed subjects had no opinion regarding this issue (Figure 8.2)94.
Figure 8.2 Respondents' interest in near bank's loan
Source: data from „Konsument na rynku usług finansowych”, Raport TNS Poland for UOKiK (Office of Competition and
Consumer Protection) August 2012
The respondents who showed interest in having a loan were representatives of people with
vocational education (5% of the respondents) and people in poor financial situation, with monthly
income between 1501-2500 zlotys. The similar customer profile was created with the CBOS survey95.
The respondents' age was irrelevant to the results relating to trust in shadow banking market. Among
people up to 24 years of age, and people living in agglomerations of population between 20 and 100
thousand and over 500 thousand only 6% of the respondents showed trust which is consistent with
the results of TNS Poland survey.
The confidence analysis to shadow banking is concluded by presentation of the results
according to professional groups. It shows that the greatest trust is declared by self-employed people
(about 10% of the respondents) followed by administrative and clerical staff (9% of the respondents)
and unemployed (7% of the respondents).
93 Survey conducted by CBOS „Aktualne problemy i wydarzenia”, August 2012. 94 Survey conducted by CBOS . „Aktualne problemy i wydarzenia”, August 2012. 95 „Konsument na rynku usług finansowych”, Raport TNS Polska for UOKiK, August 2012
maybe
yes
no
75%
3%
22%
Financial Aspects of Recent Trends in the Global Economy
147
TNS Poland survey indicated respondents' main interest reasons in having a bank loan. 36%
of the respondents pointed out to the possibility of obtaining credit rating faster compared to other
banks, 16% of the surveyed subjects specified lack of fixed income or illegal work, bank credit refusal
due to low income was mentioned by 12% of the respondents ,and 8% of people listed former debts
as reasons.
It was also confirmed that society presents poor knowledge regarding future of deposited
funds in case of bank bankruptcy. Half of the respondents were not able to provide an answer, 7% of
people claimed that deposits with earned interest would be paid by Banking Guarantee Fund, 4% of
subjects believed they would recover funds without interest. Only 39% of the respondents provided
the right answer. The last group was represented by individuals between 40-49 years of age (47%),
people with higher education (53%) and active population (46%).
8.6 Summary
Summing up it should be mentioned that the shadow banking system has indicated the need
for modification of Polish banking system and sealing Polish Law regulations. In case of banking
system excessive security measures for example S and T recommendations created space for near
banks activities. The modification of Law system is connected with removal of loopholes in the control
area (range of activities), competence area (appointment of authorities responsible for this part of
financial market) and organizational (effective supervision)96. Particularly, the last area requires
immediate changes, lack of possible interference of Polish Financial Supervision Authority in relation
to shadow banking system supports this point.
Polish Law and European Union Law harmonization leads to integrated supervision of all the
institutions that have repayable funds assigned. This fact obliges all near banks 97 to obtain
permissions for their activity. Such course of action not only influences public safety improvement and
the savings but also the whole financial system. Due to recent events concerning Amber Gold,
company limited by guarantee, creating supervisory body seems necessary. However it is essential to
develop uniform and detailed regulations concerning ‘near banks' range of authorizations or type of
offered instruments. This course of action corresponds with European Union Policy and actual
integration of financial market.
8.7 References
[1] Bernanke B. (2012). Russell Sage Foundation and the Century Foundation Conference on "Rethinking Finance," New York, April 13, 2012.
[2] Ciepiela I. (2010). Czynności bankowe jako przedmiot działalności banków, Warsaw 2010.
[3] Gorton G. (2007). The Panic of 2007. Maintaining Stability in a Changing Financial System, Proceedings of the 2008 Jackson Hole Conference, Federal Reserve Bank of Kansas City.
[4] Góral, L. (1997). Instytucje parabankowe w ustawodawstwie wybranych krajów Unii Europejskiej w Polsce, PUG 1997, nr 10.
[5] Grzyb, R. (2011). Pożyczka na 31 tysięcy procent, Dziennik Gazeta Prawna, 6 lipca 2011(nr 129).
96 A.M. Jurkowska, Instytucje parabankowe w polskim systemie bankowym, GSP ,v. VII, 2000, p. 230-233 97 Payment Service offices excluded
Volume II, Chapter 8 Jacek Binda and Paweł Mrowiec
148
[6] Jurkowska, A.M. (2000). Instytucje parabankowe w polskim systemie bankowym, GSP, v. VII, 2000,
[7] Kaszubski, R.A. (2010). Tupaj-Cholewa, Prawo bankowe, Warsaw 2010,
[8] Kliger, K. (2010). Parabanki nie zarobią na fikcyjnych kredytach, Dziennik Gazeta Prawna, 8 April 2010 (nr 68),
[9] Schwarcz, S.L. (2012). Regulating Shadow Banking, Review of Banking & Financial Law 31: 619-642.
[10] Stępień, E. (2011). Łatwiej będzie zaciągnąć kredyt Parabanki uzyskają dostęp do tajemnicy bankowej, Dziennik Gazeta Prawna, 2-3 May 2011 (nr 84).
[11] Szpringer, W. (2004). Problem parabanków na tle pojęcia banku, jako instytucji kredytowej w Unii Europejskiej. Prawo Bankowe 2004, nr 11.
[12] Szpringer, W. (1998). Wpływ instytucji parabankowych na bezpieczeństwo i stabilność rynków finansowych. Bezpieczny Bank 1998, nr 4.
[13] Zoltan, P. (2011). Institutional Cash Pools and the Triffin Dilemma of the US Banking System, International Monetary Fund.
*** Financial Times, Shadow banking surpasses pre-crisis level, October 27th 2011.
*** Masters, Brook, Shadow banking surpasses pre-crisis level, The Financial Times, October 27th 2011, Dost. 16.01.2012[w:] ft.com.
*** http://www.knf.gov.pl
*** http://www.mf.gov.pl
*** http://www.serwisy.gazetaprawna.pl
*** https://www.kasomat.pl
*** http://www.skok.pl
Financial Aspects of Recent Trends in the Global Economy
149
x;
IV.
Eurozone Perspectives
Volume II, Chapter 9 Daniele Schilirò
150
x
Chapter 9
THE CRISIS OF EURO’S GOVERNANCE: INSTITUTIONAL ASPECTS AND POLICY ISSUES
by Daniele SCHILIRÒ
University of Messina, Faculty of Education Sciences, Italy
9.1 Introduction
9.2 Rules and discretion in the governance of the Euro
9.3 The crisis of the Euro and the remedies put in place
9.4 What’s wrong in the governance of the Euro: institutional aspects and economic policy
issues
9.5 Conclusions
9.6 References
Financial Aspects of Recent Trends in the Global Economy
151
THE CRISIS OF EURO’S GOVERNANCE:
INSTITUTIONAL ASPECTS AND POLICY ISSUES
Daniele SCHILIRÒ98
University of Messina, Faculty of Education Sciences, Italy
Abstract
The European Monetary Union is characterized by a crisis of governance, this has become more
evident with the crisis of the euro which has shown the weaknesses of the European institutions and stressed
the heterogeneity of member countries.
The global financial crisis struck the euro area very severely because it coincided with the lack of
appropriate policy tools to handle it and with a period of weak political leadership which have made crisis
management even harder. Europe needs to build the institutions of its monetary union to avoid similar crises in
the future. But it is necessary a greater European integration, with a central fiscal entity at European level
which requires a transfer of sovereignty from the individual Member States. This contribution first discusses
the issue concerning rules and discretion in the governance of the euro. In the following section it describes
the euro crisis and examines the remedies put in place, noting that despite the statements and the efforts of
the European authorities the confidence in the euro is diminishing. Thus the exit of Greece from the euro or
even the breakdown of the single currency has become a hypothesis discussed more frequently among
economists, politicians, central bankers and businessmen. The last section of the chapter focuses on what’s
wrong in the governance of the euro and examines the institutional aspects and the economic policy issues
suggesting that the European integration allows to ensure the European citizens independence and protect
their historical freedom, but also to influence and thus affect the choices from which may depend the future
prosperity of European nations involved.
Keywords: Euro, crisis of governance, European integration, European institutions, economic policies.
9.1 Introduction
The European Monetary Union is characterized by a crisis of governance, this has become
more evident with the crisis of the euro which has shown the weaknesses of the European institutions
and stressed the heterogeneity of member countries; heterogeneity - according to Martin Feldstein
(2011) - that includes not only economic structures but also fiscal traditions and social attitudes.
The members of the European Monetary Union are independent states which have given up
their own currencies in favor of a joint currency, the euro. Stability of the euro can be assured if the
economies of the member states tend to be similar in competitiveness, economic growth and fiscal
policies. Otherwise imbalances between these countries tend to occur, create tensions in the currency
area and, in the end, endanger the currency union, as Mundell (1961) had already maintained. In any
case, since its inception the European Monetary Union has shown a preference for a political
approach to decisions to admit a country as a member of the euro area instead of looking exclusively
to its economic fundamentals.
98 Daniele Schilirò, Associate Professor at University of Messina, Faculty of Education Sciences, Dipartimento di Scienze
Economiche, Aziendali, Ambientali e Metodologie Quantitative (SEAM), Piazza Pugliatti, 1 - 98122 Messina, Italy
Volume II, Chapter 9 Daniele Schilirò
152
Undoubtedly, the global financial crisis struck the euro area severely because it coincided with
the lack of appropriate policy tools to manage the crisis and with a period of weak political leadership
which have made crisis management even harder.
Barry Eichengreen (2009) has correctly underlined the need for Europe to build out the
institutions of its monetary union that can avoid similar crises in the future, because the economic
governance of the European Monetary Union has remained incomplete and weak.
But apart from building the appropriate institutions and complete the architecture of the
system, it is necessary a greater European integration, which inevitably has a political character.
However, the European integration serves to ensure the European citizens - at a time when only the
giants make the law and have political power and wealth - that they can enjoy independence and
protect their historical freedom, but also to influence and thus affect the choices from which may the
future prosperity of European nations involved may be dependent.
This contribution first discusses the issue concerning rules and discretion in the governance of
the euro. In the following section it describes the euro crisis and examines the remedies put in place,
noting that despite the statements and the efforts of the European authorities the confidence in the
euro is diminishing. Thus the exit of Greece from the euro or even the breakdown of the single
currency has become a hypothesis discussed more frequently among economists, politicians, central
bankers and businessmen. The last section of the work focuses on what’s wrong in the governance of
the euro and examines the institutional aspects and the changes required and the economic policy
issues. All proposals require a stronger European political integration, in which the European
institutions are able to implement the economic policy for the entire euro area.
9.2 Rules and discretion in the governance of the Euro
The governance of the euro has been characterized by the centralization of monetary policy
and by decentralization of fiscal policy. The advent of the single currency has involved the transfer of
monetary sovereignty to the European Central Bank (ECB). The ECB has in any case a limited liability
and a very narrow remit, which is to look after the stability of the euro. In order to fulfill the
maintenance of stability of prices, the Maastricht Treaty, signed in 1992, has given to the ECB a
complete institutional independence99. This institutional independence is, according to mainstream
economic theory (e.g. Barro and Gordon, 1983), a prerequisite to ensure the credibility of monetary
policy.
Thus the peculiar feature of the setting of the European Monetary Union is that in the face of a
single monetary policy, which is established at the level of the euro area as a whole, the fiscal policy
remains under the direct responsibility of individual member states and is, therefore, inevitably
fragmented. In fact, the EMU has followed an original design: it has a common currency, the euro, but
does not have a federal budget and a major form of integrated financial supervision. This because the
Maastricht Treaty has embodied a conscious political choice not to create a fully-fledged economic
union to accompany monetary union, thus creating a fundamental asymmetry in the institutional
structure (Schilirò, 2006). For this Eichengreen and von Hagen (1996) argued that EMU is an
incomplete system, as it is based on a monetary union without fiscal union.
99 The independence of ECB derives from Art. 282 of the EU Treaty.
Financial Aspects of Recent Trends in the Global Economy
153
It is well known that due to strong economic heterogeneity among member states of the
European Monetary Union being formed, the Maastricht Treaty made the participation of a country
into the European Monetary Union to a sufficient degree of convergence, compared to other countries,
of certain financial and fiscal criteria. Actually the Maastricht criteria constrained governments in few
aspects of heterogeneity only. More specifically, the sovereign debt of a country should not be more
than 60 percent of its GDP and the annual increase in debt should not exceed 3 percent of GDP. In
addition, the inflation rate should not be higher than that of the three most stable countries by more
than 1.5 percent, the yield to maturity of long term-government bonds should not exceed that of the
three most stable countries by more than 2 percent and the country should have been a member of
the European Currency System for at least two years without devaluation of its currency. Of course,
the creation of the single currency has led to the loss of exchange rate flexibility.
Another essential rule of this institutional setting was the no-bailout clause, so that a member
state in heavy financial difficulty or with liquidity problems could not be helped by other member states
or by the European Central Bank. This no-bailout clause, which precludes the sharing of liability for
government debt across Member States, has been codified in Art. 125 of the Treaty on the functioning
of the European Union (TFEU)100 and by Art. 104, which rules out that national central banks or the
ECB provide direct credit to public authorities, defined in a comprehensive sense. Once a country has
joined the EMU, the two essential criteria became the 3 percent criterion regarding the deficit and the
sovereign debt criterion101. Furthermore, to establish specific constraints to individual member states
and precise rules that restrict the actions of the national governments in addition to the fiscal criteria of
the Maastricht Treaty, it was introduced the Stability and Growth Pact102, which would have further
limited the discretionary action of the member states of European Monetary Union. But in the
subsequent revision of the Pact in 2005 the strictness of the 3% limit and the time frame for correcting
excessive deficits were relaxed, while procedural deadlines were extended (Schilirò, 2006). This
revision of the Pact has shown the operative difficulties to reconcile strict and flexible rules.
Yet, the European monitoring mechanism focused itself exclusively on sovereign
indebtedness, whereas other warning signals like wage increases, international competitiveness, etc.
were ignored. This was probably due to the prevailing conviction that the convergence between
national economies would be enforced by the market mechanism and by European directives which
then would homogenize laws of the member states.
The theoretical foundations that have justified the presence of specific criteria of fiscal
discipline in the design of the EMU are not strictly related to the theoretical paradigm of optimum
currency areas (Mundell, 1961). An important aspect concerns the fact that the existence of
independent monetary policy authority from political power is a necessary and sufficient condition to
ensure stable prices, but that this condition is actually strictly related to the behavior of fiscal
100 However, Art. 122 provides an exception to this clause. When a member state is in difficulties or is seriously threatened by natural
disasters or exceptional occurrences beyond its control, on a proposal from the Commission, the Council of the Heads of the national governments may grant financial assistance to the member state under certain conditions. This clause is a way to make enter the political discretion in a crisis resolution.
101 If new debt is likely to exceed 3 percent of GDP, then the European Commission issues an early warning. If it actually exceeds 3 percent, then the Commission starts a deficit procedure. (For more details see Schilirò, 2006).
102 The Pact was established by the Resolution of the European Council held in Amsterdam on 17 June 1997. Later in the EU Council in Brussels on 22 and 23 March 2005 the Stability and Growth Pact was amended (Schilirò, 2006).
Volume II, Chapter 9 Daniele Schilirò
154
authorities. Thus, to avoid problems of fiscal dominance or avoid adverse effects on the price level of
potentially expansive fiscal policy is necessary to introduce a discipline with strong ties in the conduct
of fiscal policy (Schilirò, 2006, 2011). Another aspect, already highlighted by Tabellini and Alesina
(1990), concerns the opportunistic behavior of democratic governments elected in office that, following
fiscal policies inconsistent and shortsighted, might prefer to leave excessive deficit to potential
successors who will come to power, thus creating imbalances in debt policies among member
countries of the EMU. Such opportunistic behavior makes it hard for the ECB to ensure stability. The
Stability and Growth Pact has been designed just to ensure a supranational budgetary discipline, and
that short-sighted and opportunistic behaviors of the member States should be avoided or otherwise
sanctioned. On the other side, Krogstrup and Wyplosz (2010) pointed out that although theoretically
supra-national rules are welfare improving relative to merely national regimes, they cannot fully
eliminate the deficit bias, which calls for strong national rules in addition to the supra-national ones.
Yet the literature argues that the effectiveness of fiscal rules with respect to fiscal performance is not
assured (von Hagen and Eichengreen, 1996). Some authors have shown that such effectiveness
depend on the mechanisms established to enforce conformity with the rule and on the type of rule.
Others, in particular Buti et al. (2007), have shown fiscal rules to be effective, but also to lead to
significant creative accounting aimed at their circumvention.
Regarding the sanctions in case of violation of the debt criteria, the implicit assumption of the
Maastricht Treaty appears to be that the sanctions are sufficient to force states back on a trajectory
satisfying the Maastricht criteria, although there was a weak enforcement mechanism, even in the
Stability and Growth Pact103. The weakness of the Pact was due, however, to its weak enforcement
provisions (ECB, 2008). Just consider that the provision of a qualified majority was required in the
ECOFIN Council in order to approve further procedural steps. So countries with excessive deficits
retained the right to vote and needed only a few additional countries - prospective deficit countries
among them - to block such steps.
In a monetary union such the EMU is obvious that coordination problems arise among
member states, since these member States are independent states that must decide about their wage
and labor market policy, their industrial policy, the monitoring of their banking system, etc. The
coordination is doomed to be ineffective if there are conflicts of interest among the States, thus
leading to imperfections in internal coordination. Actually, the institutional framework of the EMU is
based on decentralized policymaking, soft coordination and an insufficiently stringent enforcement of
common rules. So the institutional framework established in the European monetary union has given
the national policy a wide range of discretion, despite the Maastricht criteria and the Stability and
Growth Pact. For instance, wage and price increases can be much higher in one state relative to the
others. Another case is that a State may run a strong currency account deficit. Furthermore, the issue
of monitoring by capital markets is never mentioned in the Maastricht Treaty. Therefore, if a State has
a bad debt rating, no political action needs to be taken. Lastly, the issue of financial stability was not
included in the governance of the euro, while all the emphasis has been placed by the ECB with
regard to price stability.
103 The 2005 reform of the Stability and Growth Pact has increased the degree of discretion of the national governments of the euro
members, since it implicitly accepted to tolerate possible fiscal deficits systematically higher in all countries of the euro area, but it also undermined the role of institutions.
Financial Aspects of Recent Trends in the Global Economy
155
9.3 The crisis of the Euro and the remedies put in place
In 2007, when the global financial crisis broke, the European Monetary Union had already
deprived member governments of the monetary and exchange-rate instruments of macroeconomic
management and, through the Stability Pact, it also tried to constrain the adoption of fiscal
instruments. But since the euro area was not an optimal currency area, the imposition of one-size-fits-
all ECB interest rates produced asymmetric impulses in EMU economies, with effects above- average
or below-average in terms of rates of growth and inflation. In particular, the economies of the “GIPS”
(Greece, Ireland, Portugal and Spain), taking advantage of very low real interest rates, have spent
and lived beyond their means by accumulating private and/or public debt and running large current
account deficits. In fact they have relied on state spending to drive growth, so they have recorded high
deficit/GDP ratio and rising public debt, in addition “GIPS” countries have fueled credit-financed
economic growth and employment, but also rapid increases in unit labor costs that reduced export
competitiveness (Baldwin et al., 2010; Schilirò, 2011). The resulting rise of current-account deficits
was accommodated by equally rising capital inflows from investors in surplus economies leading to
rising external debts accumulated primarily in the private sector. As a consequence, the economies of
the “GIPS” were becoming extremely vulnerable to potential disturbances in international financial
markets that might induce capital flight - followed by potential liquidity and solvency crises.
This has created deep concerns about the fiscal sustainability and the credibility of whole euro
area, especially because the GDP in the euro area has been growing much less than budget deficit
and public debt, in fact over 2011, GDP increased only by 1.4 per cent.
Table 9.1 shows that the average value of deficit/GDP ratio for the whole Eurozone was 6.0
per cent in 2010 double than the 3 per cent fixed in the Maastricht Treaty, whereas the average value
of debt/GDP was 86.1 per cent, much higher than the 60 per cent benchmark.
In particular, Greece has accumulated a huge sovereign debt, mainly due to public finance
mismanagement104, so that its financial exposition prevented the Greek government to find capital in
the financial markets, therefore Greece has become at risk of sovereign default. Also Ireland has
become at risk because of the large private debt due to the mismanagement of its banks, thus the
country cannot find finance in the markets. Portugal was the third country of the euro area with an
high deficit, for whom the access to liquidity in financial markets was denied. These countries were
forced to seek financial support. Lastly, Spain (like Ireland) is now suffering the most serious
recession, since its real estate bubble is deflating with the related problems that ramify through the
financial systems, while its budget deficit has greatly worsened. In this situation international capital
markets reacted by demanding higher risk premiums for continuing holding public debt of “GIPS”, but
also of Italy, so the bond spreads have shot up.
Growing current account imbalances were recorded between the countries of North and South
of the euro area over time (Holinski et al. 2010). The crisis, actually, has exposed flaws in the peer
review process which put disproportionate emphasis on fiscal discipline at the expense of equally
relevant criteria such as current account deficits.
104 Greece has reported incorrectly the data on government finances, which have aggravated concerns.
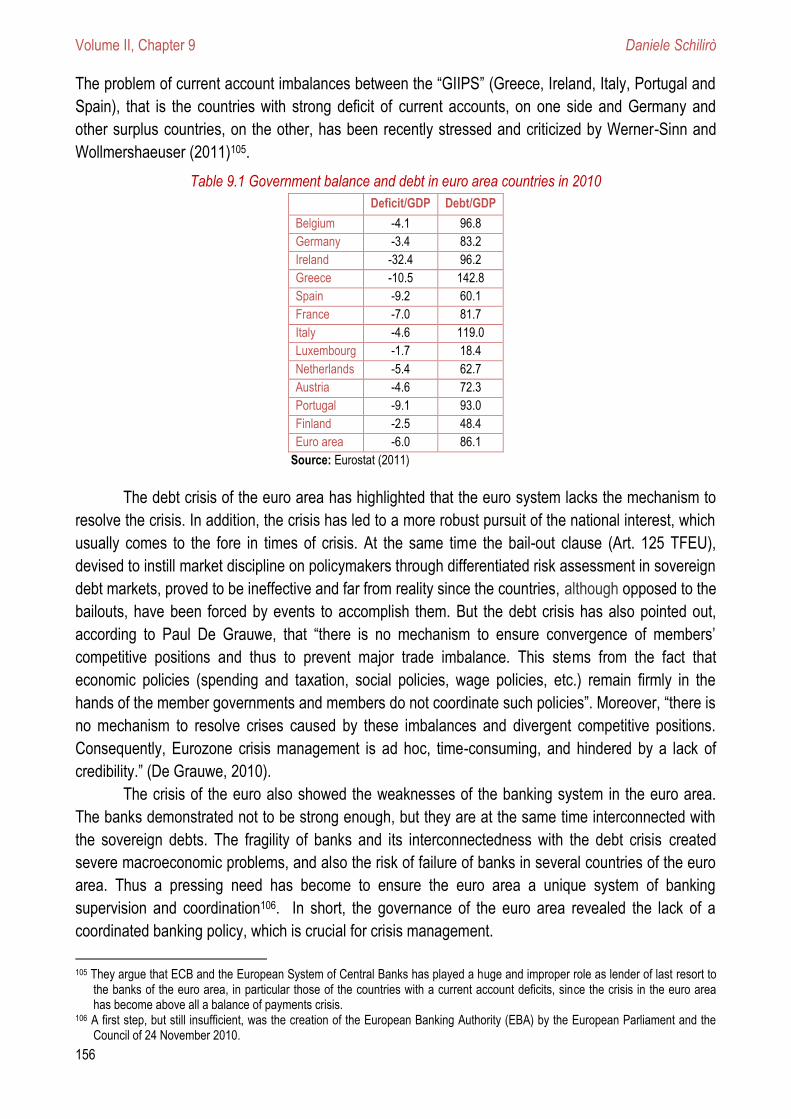
Volume II, Chapter 9 Daniele Schilirò
156
The problem of current account imbalances between the “GIIPS” (Greece, Ireland, Italy, Portugal and
Spain), that is the countries with strong deficit of current accounts, on one side and Germany and
other surplus countries, on the other, has been recently stressed and criticized by Werner-Sinn and
Wollmershaeuser (2011)105.
Table 9.1 Government balance and debt in euro area countries in 2010
Deficit/GDP Debt/GDP
Belgium -4.1 96.8 Germany -3.4 83.2
Ireland -32.4 96.2 Greece -10.5 142.8 Spain -9.2 60.1 France -7.0 81.7 Italy -4.6 119.0 Luxembourg -1.7 18.4 Netherlands -5.4 62.7 Austria -4.6 72.3 Portugal -9.1 93.0 Finland -2.5 48.4 Euro area -6.0 86.1
Source: Eurostat (2011)
The debt crisis of the euro area has highlighted that the euro system lacks the mechanism to
resolve the crisis. In addition, the crisis has led to a more robust pursuit of the national interest, which
usually comes to the fore in times of crisis. At the same time the bail-out clause (Art. 125 TFEU),
devised to instill market discipline on policymakers through differentiated risk assessment in sovereign
debt markets, proved to be ineffective and far from reality since the countries, although opposed to the
bailouts, have been forced by events to accomplish them. But the debt crisis has also pointed out,
according to Paul De Grauwe, that “there is no mechanism to ensure convergence of members’
competitive positions and thus to prevent major trade imbalance. This stems from the fact that
economic policies (spending and taxation, social policies, wage policies, etc.) remain firmly in the
hands of the member governments and members do not coordinate such policies”. Moreover, “there is
no mechanism to resolve crises caused by these imbalances and divergent competitive positions.
Consequently, Eurozone crisis management is ad hoc, time-consuming, and hindered by a lack of
credibility.” (De Grauwe, 2010).
The crisis of the euro also showed the weaknesses of the banking system in the euro area.
The banks demonstrated not to be strong enough, but they are at the same time interconnected with
the sovereign debts. The fragility of banks and its interconnectedness with the debt crisis created
severe macroeconomic problems, and also the risk of failure of banks in several countries of the euro
area. Thus a pressing need has become to ensure the euro area a unique system of banking
supervision and coordination106. In short, the governance of the euro area revealed the lack of a
coordinated banking policy, which is crucial for crisis management.
105 They argue that ECB and the European System of Central Banks has played a huge and improper role as lender of last resort to
the banks of the euro area, in particular those of the countries with a current account deficits, since the crisis in the euro area has become above all a balance of payments crisis.
106 A first step, but still insufficient, was the creation of the European Banking Authority (EBA) by the European Parliament and the Council of 24 November 2010.

Financial Aspects of Recent Trends in the Global Economy
157
In order to establish a new institutional framework to manage the crisis of the “GIIPS” but also
and more generally the crisis of the euro, the European institutions have taken several decisions
during 2010 and 2011. First, in Spring 2010, the EU together with the IMF have decided a program of
financial aids to help Greece since the country was on the verge of insolvency. To overcome the no
bail-out clause the European Council approved the financial aids in the form of “coordinated bilateral
loans” at non-discounted interest rates107.
Second, ECB adopted an important measure, called “securities market programme” (SMP) by
which ECB decided to buy government debt of fiscally challenged countries; in this way the ECB
purchases government bonds, in secondary markets, in order to provide liquidity to alleviate pressures
from sovereign debt risk 108. Also the member banks of the European System of Central Banks started
buying government debt. This measure aimed at improving liquidity, reducing volatility in the financial
markets so to reduce the spreads on the sovereign bonds109. The SMP was mainly active during 2
periods. The first started after the ECB Governing Council meeting on May 14, 2010 and lasted until
the week of July 9, 2010. The second period began the week of August 15, 2011 and at the end of
2011 was still underway.
Third, another very important decision to shape a new institutional framework to manage the
crises was taken on May 9, 2010 when the 27 Member States of European Union agreed to create a
comprehensive rescue package, a legal instrument aimed at ensuring financial stability in Europe: the
European Financial Stability Facility (EFSF), a Luxembourg-registered company owned by Euro Area
Member States, that has become operative in August 2010 and started to give credits to countries in
financial difficulties110. But EFSF can also intervene in the debt primary and secondary markets; in
particular, the intervention in the secondary market will be only on the basis of an ECB analysis
recognizing the existence of exceptional financial market circumstances and risks to financial stability.
The ESFF is devised in the form of a special purpose vehicle that will sell bonds and use the money it
raises to make loans to Eurozone nations in need. In practice the EFSF may issue bonds or other
debt on the market in order to accumulate funds with whom to lend to Eurozone countries in economic
difficulties, recapitalizing banks, or buying government bonds. EFSF is backed by guarantee
commitments from the euro area Member States (in proportion to their paid-in capital to the European
Central Bank) for a total of €780 billion and has a lending capacity of €440 billion111. The bonds also
will be backed by guarantees given by the European Commission representing the whole EU and the
IMF (that can provide loans up to a maximum of €250 billion). The EFSF will sell debt only after an aid
107 Actually the interest rate paid on the loans to Greece (loans approved by the European Council in April 2010) by the Members
States was 5 per cent, lower than the 7 per cent demanded by the markets. 108 To sterilize this move the ECB conducts liquidity absorbing operations of the same magnitude. In fact, the ECB is buying risky
assets issued by a fiscally troubled government of the Eurozone and, via its sterilization operations, selling its claims on banks, which is equivalent of selling new assets, a move that has been viewed by some economists and financial analysts as an improper risk transfer.
109 The creation of the SMP was closely related to the Greek debt crisis, but then it was helpful for sovereign debts of Spain and Italy. 110 The EFSF has been used to help the governments of Greece, Ireland and Portugal. The Fund bases its rules of the crisis
management regime on the principles and procedures of the “IMF doctrine”. The EFSF operates in case of unattainable fiscal policies and sovereign debt crises.
111 EFSF has been assigned the best possible credit rating by Moody’s (Aaa) and Fitch Ratings (AAA). EFSF has been assigned a AA+ rating by Standard & Poor’s. The capacity of EFSF of achieving these “good” ratings depends on overcollateralization (that is by a shared assumption about the distribution of possible outcomes), which takes the form of guarantees by other Eurozone countries. However, only France and Germany have a rating of AAA.
Volume II, Chapter 9 Daniele Schilirò
158
request is made by a country. In 2011 the EFSF issued securities for about €18.0 billion and granted
loans to Ireland and Portugal, respectively, for €7.6 and € 6.9 billion. The EFSF has also issued € 35
billion of bonds for the activation of the scheme repurchase designed to support the quality of
securities issued or fully guaranteed from Greece. The EFSF is tasked to provide emergency
financing until 2013 (Schilirò, 2011). At the same in 2013 it should become operative the European
Stability Mechanism (ESM) a permanent organization that will provide financial assistance to
members of the euro area in financial difficulty, replacing the existing temporary funding programmes
such as EFSF and EFSM (the European Financial Stabilization Mechanism). The agreement reached
by the leaders of the euro area concerning the EFSF was a typical political compromise.
Unfortunately, compromise could not necessarily work in a debt crisis. There are, in essence, two
ways to solve a debt crisis: through a bail-out or through default. The leaders of the euro area got
itself an arrangement that represents only an emergency facility and constitutes a scarcely credible
intermediate solution between bail-out and default112.
On 16 December 2010 the European Council agreed an amendment to Article 136 of the
TFEU113 that says: “The member states whose currency is the euro may establish a stability
mechanism to be activated if indispensable to safeguard the stability of the euro area as a whole. The
granting of any required financial assistance under the mechanism will be made subject to strict
conditionality.” Later, on 11 July 2011 the European Stability Mechanism itself has been established
by a treaty among the Member States of the euro area: the Treaty Establishing the European Stability
Mechanism. The European Stability Mechanism becomes an intergovernmental organization under
public international law, located in Luxembourg. It would be led by a Board of Governors. Each
Member States would appoint a governor and the board would either be chaired by the President of
the Euro Group or by a separate elected chair from amongst the governors themselves. There is a
disagreement among member States concerning the funding of ESM, since for the rescue of three
countries Greece, Ireland and Portugal over two years of crisis between 2010 and 2011, euro area
countries (Germany above all) have had to intervene for a total of 273 billion euros, plus other 130
billion for the second loan to Athens. However, the worsening of the crisis of the euro, the risk that
Greece could leave the euro area, seem to influence a decision to bring forward to 2012 the birth of
the ESM, but nothing looks taken for granted.
Fourth, again in March 2011 the European Council agreed on a new plan, named the ‘Pact for
the Euro’, which tries to design a new governance of the EMU and to achieve a better economic policy
coordination for leading to a higher degree of convergence. The plan was advocated by the French
and German governments and it is firstly designed as a more stringent successor to the Stability and
Growth Pact, which has not been implemented consistently. In fact the ‘Pact for the Euro’ constitutes
an attempt to give new and effective national budgetary rules. Actually the Pact has come out with
four broad strategic goals along with more specific strategies for addressing these goals. The four
goals are: fostering competitiveness, fostering employment, contributing to the sustainability of public
finances, reinforcing financial stability. So this ‘Pact’ contains crisis management and resolution
principles and procedures, that did not exist before, but also a wider economic policy framework to the
112 To deepen the technical aspects of the financial rescue mechanisms and their ineffective solutions see Schilirò (2011). 113 The amendment will not come into force until it has been ratified by each member state according to their respective constitutional
requirements, and cannot come into force until 1 January 2013.

Financial Aspects of Recent Trends in the Global Economy
159
Member States of the euro area. While the ‘Pact’ comes with specific strategies, these are not seen
as compulsory, the choice of the specific policy actions necessary to achieve the common objectives
remains under the responsibility of each country. The aims and strategies of the ‘Pact’ are to be
updated yearly with the following procedure: each year participating Member States will agree at the
highest level on a set of concrete actions to be achieved within 12 months.
A positive aspect included in this new economic policy framework is the recognition that not all
crises are rooted in a lack of budgetary discipline. It is now agreed that financial stability and
macroeconomic stability also matter. Yet several questions remain open, as for instance the true
capacity and the will of each Member State to adopt the necessary measure to fulfill the requirements
of the ‘Pact’, thus it remains an agreement on principles without a real enforcement. Daniel Gros
(2011) correctly pointed out that the ‘Pact’ contains a list of desirable policy goals but no means to
implement them. In particular, the employment and competitiveness goals remain too vague, and are
not really embedded in a framework which is clearly oriented to growth. As Darvas, Pisany-Ferry and
Sapir (2011) have argued a success of any program to overcome a debt crisis is conditioned by the
capacity of a country (like Greece) to meet the fiscal adjustment targets and also by the ability of the
country’s economy of triggering the growth, since without stimulating growth any fiscal consolidation
program will not succeed114.
Finally, it is well known that the ECB has the restricted mandate of look after to price stability
in the euro area and has not the possibility of printing money to help the member countries in financial
difficulties, so that it cannot be a lender of last resort as the Federal Reserve in the United States.
However, in December 2011 ECB has launched a Long Term Refinancing Operation (LTRO), a
program of making low-interest loans with a term of 3 years (36 months) and 1 per cent interest to
European banks accepting loans from the portfolio of the banks as collateral115. This is unconventional
measure taken by ECB to offset the lack of liquidity that has occurred in the credit market.
Despite the quite frequent meetings of the European Council in 2010 and 2011 (the Heads of
the Government of the euro area made 13 meetings over the two years) and the three Euro Summits
(one in 2010 and two in 2011), which produced the set of decisions above cited, the confidence in the
euro is diminishing, because the markets and many observers (economists, opinion makers,
businessmen, etc.) have the feeling that the European authorities still do not have governance
mechanisms capable of making important decisions and also implementing them. Moreover, the
single currency, that should force the countries of the euro area to respond to the crisis in a unitary
manner, has created, on the opposite, a situation in which all countries seem unwilling to act. Thus the
hypothesis of breaking the euro has become real, despite the constant reassuring statements of
European authorities that deny this hypothesis.
In the next section I examine the institutional aspects and the economic policy issues that
have determined the crisis of the governance of the euro area.
114 Greece is an economy which is recession since four years and the fiscal consolidation does not seem to lead the country on a
virtuous path that allows the economy to get out of debt crisis and absence of growth. 115 In particular, on December 21 2011, the ECB has placed an auction with about 489.19 billion euros expiring on January 29, 2015
(and early payment option in a year) at an audience of 523 bidders in Europe. The rate of supply of liquidity was fixed on the reference 1 per cent and was expanded the range of assets that European banks could put as collateral for these loans. This LTRO is primarily designed to provide greater bank liquidity, but it should also lower sovereign yields since euro area countries can use their own sovereign debt as collateral, which, in turn, increases demand for the bonds and lowers yields.
Volume II, Chapter 9 Daniele Schilirò
160
9.4 What’s wrong in the governance of the Euro? Institutional aspects and economic policy
issues
The euro area is characterized by a crisis of governance. This is caused by many factors, but
an important role has been played by the European authorities, who have pursued a strategy of small
steps and not short times in the management of the crisis of the euro area. But now that the times of
the economy and financial markets have become even more fast it is necessary to think about a
different method. From this consideration it follows that the timing of the policy and its procedures, at
European level but also at the level of the individual Member States, are too long compared to those
of the economy and the markets. Moreover, there were two ways to proceed in the face of crisis:
muddling through or adopting radical solutions. The European institutions have preferred to follow the
first, thus following their traditional way of proceeding. In addition, the new governance of the euro,
which is laboriously carried out by the European institutions and by the individual Member States,
takes time; however, the path has been characterized by the statements of the European authorities
that are often contradictory and contribute to uncertainty. This behavior has caused negative reactions
in the markets and makes more difficult to resolve the crisis. The European authorities showed
instability in their decisions. At first they were very patient in financial terms, after too they became too
much demanding with financial discipline. At the same time all the countries of the euro area seem
unwilling to act against the crisis. The virtuous members States do not want to pay for those in
difficulty, while the weaker countries are certainly not pleased with the sacrifices that Europe asks.
The crisis also revealed some new facts about the governance of the euro area. Firstly, a
greater intrusion of European institutions (European Council, Ecofin, Eurogroup, ECB) in the lives of
citizens of the Member States. Secondly, the crisis has caused the de-commissioning of the European
Union: in fact, the European Council decides on its own the political and economic strategies without
answering before the Commission and the European Parliament. Another aspect of the emptying of
the role of the Commission is represented by the fact that the Commission counts less while France
and Germany are more influential. Thus, it has been established a kind of duopoly in the European
governance. The France-Germany duopoly that has characterized the management of this crisis in
the euro area has, de facto, changed the rules of governance116.
A governance of the euro area that is effective requires that the member states should adopt a
coherent strategy made of three steps: coordination, decisions and actions. Coordination problems
obviously arise among member states of a currency union, however a policy in which there is a high
degree of coordination is crucial in the governance of the euro. But coordination must be followed by
appropriate decisions where the cooperative attitude should prevail. Actions are also necessary,
otherwise decisions remain wishes without effects, consequently, effective mechanisms of
enforcement of decisions are needed.
Unfortunately the EU is a hybrid system, on some issues the governments of various countries
are willing to accept the decisions at European level, on the other they claim national sovereignty. The
institutional framework of the European Monetary Union, in particular, appeared, since its inception, 116 One consequence of this duopoly could lead to a change of governance of the ECB, where the vote of the governors should be
weighted by their GDP. This implies a shift from democratic governance to management based on the credit strength of the member countries.
Financial Aspects of Recent Trends in the Global Economy
161
clearly incomplete and inadequate. Examples of inadequacy of the institutional architecture are: the
relationship between the Member States of the euro area and the EU institutions is unclearly defined,
because of the strong interests of the Member States. Thus, national interests still prevail over the
interest of Europe and within the European institutions. But also important problems are the mismatch
between the growing number of policies decided by the European Union and the policies carried out
at national level, and also the lack of a effective policy at European level that is able to decide on
economic issues and to implement them. These problems create an unstable environment and
negative consequences, which have become more evident in the euro crisis.
And yet, it looks awkward the position of the ten Member States of non-euro area, who sit in
the European Council but do not express themselves on the issues concerning the euro area.
Although such decisions influence as well the non-euro area members. There is, therefore, a problem
of transparency and legitimacy in the decision process at institutional level (Schilirò, 2011).
I firmly believe that a set of policy measures should be taken to enable the euro area to
survive. First, an immediate and credible program to deal with excessive sovereign debt and achieve
debt sustainability particularly in the economies of the PIIGS, since the creation of EFSF or of ESM do
not appear in the current state a convincing answer to solve the problem. Moreover, the eurobonds
may be not the correct solution to the sovereign debt crisis since they tend to solve the problem
through the socialization of the debt117. Instead it is more appropriate to adopt a policy, based on
coordination, to overcome the dysfunctional politics across the Member States and to avoid the
negative external effects of the macroeconomic imbalances. This policy, aiming at the creation of a
fiscal union in the euro area, should offer reciprocal insurance to Member States and reduce income
volatility within the region, so to affect the root of the problem. In any case, it is necessary a far more
aggressive plan to reduce budget deficits with binding fiscal rules for the Member States, that even
the ‘Pact for the Euro’ does not guarantee, therefore it is required the introduction of mechanisms that
credibly achieve medium-term fiscal sustainability. But it is very crucial, make the economies of the
“PIIGS” more competitive in the near future with structural reforms that are framed or bound at EU
level. In fact - as Kirkegaard (2011) also emphasized - “without improving external competitiveness
and, at the same time, increasing exports/reducing imports, the euro area periphery will not be able to
restore domestic economic growth during their prolonged period of fiscal consolidation”. Of course, a
supportive monetary policy from the ECB is needed, while the ECB should become de jure or de facto
a lender of last resort with respect to the governments and the banks. This wider role of the ECB will
allow a more strong and effective monetary policy and economic policy of the euro area on the whole.
Furthermore, it is very important the good health of the banking system, since many European banks
still have in their balance sheet too many “toxic assets” and risky sovereign bonds. Lastly, an
institutional change must be implemented, that reduces the instability in the financial sector.
I also believe that, since the euro area have shown during its crisis strong macroeconomic
imbalances, it can be helpful to envisage a new economic policy strategy. To avoid that the euro area
becomes a transfer union, Carfì and Schilirò (2011) have suggested a policy strategy based on
competition. First, they have pointed out the primary role of competitiveness in determining growth
and the relation between competitiveness and macroeconomic imbalances. Carfì and Schilirò have
117 Although the “Blue Bond” proposed by Delpla and von Weizsäcker (2011) is a sensible proposal.
Volume II, Chapter 9 Daniele Schilirò
162
argued that to overcome macroeconomic imbalances it is necessary a medium term strategy for
competitiveness and growth, based on innovative investments and a process of structural change of
the production system. Within this broad strategy, current account imbalances, in particular, can be
addressed through a competitive strategy, which implies a cooperative attitude aiming at growth
among the member countries of the euro area, despite their divergent interests. The competitive
strategy will provide a win-win solution to the actors of the game and can constitute a new
macroeconomic policy tool to help solving the imbalances problems and contribute to overcome the
economic crisis in a medium-run perspective.
The euro area is therefore characterized by strong imbalances, and the governance of the
euro appears inadequate to address these imbalances. The experience of the current crisis where
every Member State fights alone against its disequilibrium in sovereign debt or in current account
demonstrates the failure of this policy strategy. The competitive strategy is a viable and effective way
to overcome the isolation of individual countries before the crisis. However, a more stable and
comprehensive solution for the governance of the euro area requires a deep change at institutional
level. This change of governance demands a greater European integration, with a central fiscal entity
at European level which requires a transfer of sovereignty from the individual Member States and the
European Central Bank that becomes lender of last resort. But also a different relationship between
the member countries of the euro zone that, barring the duopoly France and Germany and, de facto,
the German leadership, give to the Commission the role of coordinator and of third party, return to the
European institutions such ECB, Ecofin, Eurogroup their proper and independent role and give to the
European Parliament its centrality.
9.5 Conclusions
The euro crisis has made the pessimism regarding the euro area more prevalent. For over
two years European authorities and political leaders have promised to do whatever it is needed to
save the euro area, but problems remain unsolved and solutions seem quite far. The euro area is
currently in recession with high unemployment and strong macroeconomic imbalances between the
various Member States. Moreover, the prolonged stand-off over the rescue plan for Greece, the
corresponding risk of a sovereign default which could spread to Portugal, Spain and Ireland and the
financial difficulties of Italy have definitely brought a gloomy picture of the European currency union.
All this, in turn, highlighted the profound weaknesses in the governance of the euro area, the
uncertainties of the European authorities, and posed the issue of German leadership.
In this work I have analyzed the institutional framework of the euro area, discussing the issue
of the rules and of the discretion in the governance of the euro. I have also examined the remedies
put in place by the European authorities to overcome the crisis and their flaws. The last section of the
work has focused on institutional aspects of the governance of the euro and on economic policy
issues that the crisis in the euro area have stressed, suggesting some basic outline for the new
institutional architecture and feasible economic policy solutions. These solutions imply a more strong
European political integration where the European institutions coordinate and are capable of
implementing the economic policy for the whole euro area, with a central fiscal entity at European
level and the European Central Bank that becomes lender of last resort. Only in this way it is possible

Financial Aspects of Recent Trends in the Global Economy
163
to restore credibility in the euro area, create a stable macroeconomic environment, stimulate the
economic growth so to overcome this long and hard crisis.
9.6 References
[1] Baldwin, R., Gros, D., Laeve, L. (eds.) (2010). Completing the Eurozone Rescue: What More Needs to be Done? London, Centre for Economic Policy Research, June.
[2] Barro, R., Gordon, D. (1983). A Positive Theory on Monetary Policy in a Natural Rate Model, Journal of Political Economy, 91(4): 589-610.
[3] Buti, M., Nogueira Martins, J., Turrini A. (2007). From Deficits to Debt and Back: Political Incentives under Numerical Fiscal Rules. CESifo Economic Studies, 53(1): 115-152.
[4] Carfì, D., Schilirò, D. (2011). Crisis in the Euro area: Competitive Game Solutions as New Policy Tools. Theoretical and Practical Research in Economic Fields, II (1): 23-36.
[5] Darvas, Z., Pisany-Ferry J., Sapir A. (2011). A Comprehensive Approach to the Euro-area Debt Crisis. Bruegel Policy Brief, Bruegel, n.2, February.
[6] De Grauwe, P. (2010). How to Embed the Eurozone in a Political Union, VoxEU.org, 17 June.
[7] Delpla, J., von Weizsäcker, J. (2011). Eurobonds: The Blue Bond Concept and its Implications, Bruegel Policy Contribution, issue 2011/02, March.
[8] Eichengreen, B. (2009). Was the Euro a Mistake? VoxEU.org, 20 January.
[9] Feldstein, M.S. (2011). The Euro and European Economic Conditions, NBER Working Paper No. 17617, November.
[10] Gros, D. (2011). Pact for the Euro: Tough Talk, Soft Conditions? VoxEU.org, 14 March.
[11] Holinski, N., Kool, C., Muysken, J. (2010). Origins of Persistent Macroeconomic Imbalances in the Euro Area. Discussion Paper series n. 10-12, Tjalling C. Koopmans Research Institute, May.
[12] Kirkegaard, J.F. (2011). The Euro Area Crisis: Origin, Current Status, and European and US Responses,
[13] Krogstrup, S., Wyplosz, C. (2010). A Common Pool Theory of Supranational Deficit Ceilings. European Economic Review, 54(2): 269-278.
[14] Mundell, R.A. (1961). A Theory of Optimum Currency Areas. American Economic Review, 51: 657-665.
[15] Schilirò, D. (2006). L’euro, il Patto di Stabilità e di Crescita e la Sua Riforma, MPRA Paper 37333, University Library of Munich, Germany.
[16] Schilirò, D. (2011). A New Governance for the EMU and the Economic Policy Framework, MPRA Paper 32235, University Library of Munich, Germany, July.
[17] Tabellini, G., Alesina, A. (1990). Voting on the Budget Deficit, American Economic Review, 80 (1): 37 - 49.
[18] von Hagen, J., Eichengreen, B. (1996). Federalism, Fiscal Restraints, and European Monetary Union, American Economic Review 86(2): 134-138.
[19] Werner-Sinn, H., Wollmershaeuser, T. (2011). Target Loans, Current Account Balances and Capital Flows: The ECB’s Rescue Facility, NBER Working Paper 17626, November.
*** European Central Bank, 2008. Ten Years of the Stability and Growth Pact, Monthly Bulletin, October.
*** Eurostat 2011. News Release, Euro Indicators. Bruxelles: 1-14, April.
Volume II, Chapter 10 Rastislav Kotulič, Jaroslava Hečková and Alexandra Chapčáková
164
x
Chapter 10
MONETARY UNION AND THE ROLE OF THE MONETARY POLICY FROM THE POINT OF VIEW OF SELECTED THEORETICAL APPROACHES
by Rastislav KOTULIČ
University of Prešov in Prešov, Faculty of Management, Slovak republic
Jaroslava HEČKOVÁ
University of Prešov in Prešov, Faculty of Management, Slovak republic
and Alexandra CHAPČÁKOVÁ
University of Prešov in Prešov, Faculty of Management, Slovak republic
10.1 Monetary Union
10.2 The aspects of the secession from the European Monetary Union
10.3 The position of the Central Bank and the role of the monetary policy from the point of view
of selected theoretical approaches
10.4 Integration process of Slovakia into the European Monetary Union in perspective of
selected macrO-economic theories
10.5 References
Financial Aspects of Recent Trends in the Global Economy
165
MONETARY UNION AND THE ROLE OF THE MONETARY POLICY FROM THE POINT OF VIEW OF SELECTED THEORETICAL APPROACHES
Rastislav KOTULIČ118
University of Prešov in Prešov, Faculty of Management, Slovak republic
Jaroslava HEČKOVÁ119
University of Prešov in Prešov, Faculty of Management, Slovak republic
Alexandra CHAPČÁKOVÁ120
University of Prešov in Prešov, Faculty of Management, Slovak republic
Abstract
The effective international monetary system is an important precondition to a successful fulfillment of
international economic transactions. The existing development of international monetary systems indicates the
need of one strong currency, at most a small number of national currencies to ensure international
transactions. It has to be a currency (currencies) that would be based on a strong national economy,
especially in the current period that is marked by the strengthening of the long duration of international
economic transactions. The instability of the national currency that would take place of the international (world)
currency is connected to depreciative as well as revaluation processes, which does not contribute to the
development of the world economy. In the chapter we provide a brief overview of key milestones in the
process of the European monetary integration. We also evaluate positive and negative aspects of this process
in the view of selected theoretical approaches.
Keywords: monetary union, monetary integration, euro.
10.1 Monetary Union
The effective international monetary system is an important precondition to a successful
fulfillment of international economic transactions. The existing development of international monetary
systems indicates the need of one strong currency, at most a small number of national currencies to
ensure international transactions. It has to be a currency (currencies) that would be based on a strong
national economy, especially in the current period that is marked by the strengthening of the long
duration of international economic transactions. The instability of the national currency that would take
place of the international (world) currency is connected to depreciative as well as revaluation
processes, which does not contribute to the development of the world economy.
A form of the economic integration of two or more states with the free movement of goods,
services, capital and labor force in which national currencies are replaced by one single currency
118 Rastislav Kotulič, Associate Professor at University of Presov in Presov, Faculty of Management, Department of Economic
Sciences and Economy, 17. Novembra 1, Prešov, Slovak republic 119 Jaroslava Hečková, Associate Professor at University of Presov in Presov, Faculty of Management, Department of Economic
Sciences and Economy, Konštantínova 16, 080 01 Prešov 08001, Slovak republic 120 Alexandra Chapčáková, Associate Professor at University of Presov in Presov, Faculty of Management, Department of Economic
Sciences and Economy, Konštantínova 16, 080 01 Prešov 08001, Slovak republic
Volume II, Chapter 10 Rastislav Kotulič, Jaroslava Hečková and Alexandra Chapčáková
166
effective in the whole territory and the national currency sovereignty of member states is fully shifted
to the supranational level is the Monetary Union.
The establishment of the monetary union results according to Kunešová and Cihelková et al.
(2006) following advantages:
Improvement of the budgetary discipline of member states;
Decrease of the level of inflation;
Savings of direct transaction costs related to the conversion of national currencies and
hastening of bank transfers;
Savings of indirect transaction costs (simplifying of accounting, decrease of the possession
of different foreign currencies);
Decrease of the exchange rate risk;
A stronger currency stability on international financial markets;
Decrease of the average unemployment rate assuming a higher mobility of the labor force,
Decrease of the amount of required foreign currency reserves.
Basic reasons for favorable attitudes towards the single currency are according to Šíbl and Šáková
(2002) and Baláž et al. (2010) the following:
Economic advantages (decrease of the inequality between national currencies, the economic
convergence, the economic stability and development, the growth of productivity and
competitiveness to the rest of the world, the growth of esprit de corps and the economic
integration);
Political advantages (the need of the monetary union as a support of the European unification,
the growth of the cooperation among member states, the reduction of nationalism and the
development of ľ esprit communautaire, the decrease of the dominance of one state of currency
above others);
Commercial advantages (limiting or exclusion of exchange rate fluctuations, the need to
completely establish the joint market);
Monetary reasons (the exclusion of monetary speculation, the decrease of inflation and interest
rate, the increase of the financial and monetary discipline, stable currency rates and the
improvement of the control of capital markets).
Disadvantages of the establishment of the monetary union are according to Kunešová and
Cihelková et al. (2006):
The loss of the national monetary sovereignty (member states of the monetary union have no
opportunity to enact independent monetary policy);
The loss of the currency rate as a means of the economic policy;
The loss of the possibility to regulate the economy through interest rates;
The loss of a certain autonomy in the field of the fiscal policy (the fiscal policy is still realized by
national governments but the country is required to exercise such fiscal policy that ensures the
abidance of fiscal convergence criteria);
Huge financial costs related to the introduction of the single currency.
According to Šíbl and Šáková (2002) it is possible to classify arguments of those opposing the
single currency to the same groups as the supporting ones. Stated are mostly practical problems,
including the lack of convergence between member states, the unpreparedness of the country for the
Financial Aspects of Recent Trends in the Global Economy
167
single currency and the existence of huge technical problems with its introduction. Among economic
problems, there are: the imbalance between national economies, the impairment of individual national
economies and risks that it will result in the “too centralized and socialist economy”. Political
arguments of opponents of the single currency include the loss of countries to maintain the control of
their own economy and the fiscal policy and the loss of sovereignty.
10.1.1 Convergence criteria
In order to approximate the economic development of countries of the monetary union it is
necessary to fulfill convergence criteria by these states. In the case of the European Monetary Union,
they are the following convergence (the so-called Maastricht) criteria formed by specific monetary and
fiscal criteria. The common characteristic is the closer mutual interrelatedness of economies that will
participate in the single currency.
Monetary criteria:121
Criterion of the price stability.
The average inflation rate monitored during one year must not exceed more than 1.5 percent of the
average annual inflation rate of three most price stable countries (countries with the lowest rate of
inflation). The inflation is measured according to the harmonized index of consumer prices on a
comparable basis that takes into account differences in national definitions.
Criterion of the convergence of interest rates.
The average long-term nominal interest rate must not during one monitored year exceed more than
2 percent of the average interest rate in three most price stable countries. Interest rates are
surveyed on the basis of the long-term state bonds or comparable obligations allowing for different
definition in individual member states.
Criterion of the membership on the mechanism of exchange rates of the European
Monetary System.
The exchange rate of the national currency is necessary to be kept in the allowed fluctuation zone
in the mechanism of exchange rates (Exchange Rate Mechanism II – ERM II) without devaluation
during the period of 2 years. The exchange rate can fluctuate in the zone of ±15 per cent but close
to the central parity of the Euro without the devaluation to any currency of any member state.
Fiscal criteria:122
Criterion of the deficit of public finances.
The planned or the actual deficit of public finances must not exceed 3 per cent of the GDP in
market prices with exceptions when:
o The proportion decreased significantly or was constantly decreasing till the level that is
approximating the recommended value,
o The exceeding of the recommended value was only exceptional and temporary and the
proportion still approximates the recommended value.
Criterion of the public debt.
121 Article 109j, Title VI of the Treaty establishing the European Community and the Protocol on the convergence criteria. 122 Article 104, Title VI of the Treaty establishing the European Community and the Protocol on the excessive deficit procedure.
Volume II, Chapter 10 Rastislav Kotulič, Jaroslava Hečková and Alexandra Chapčáková
168
The proportion of the public debt to the GDP in market prices must not exceed 60 per cent
except for cases when the proportion is decreased significantly and approximates by at a
satisfactory rate the recommended value.
The term debt is understood as the gross sum of debts in nominal values at the end of the year
consolidated within the state sector and between individual branches (government, regional
and local authorities or social security funds) with the exception of commercial transactions.
During the unfavorable progress of public finances, the European Council issues a
recommendation for the improvement of proportions in the field. If these are not implemented
into the economy of the state it can result in the reassessment of the credit policy of the
European Investment Bank (EIB) towards the member state or the infliction of an interest rate-
free deposit in the EIB for the period of the excessive deficit, or there can be established
appropriate penalties (Kotlebová & Chovancová, 2010)
Maastricht criteria represent the so-called nominal convergence, i. e. the fulfillment of criteria
mentioned in the Maastricht Treaty. From the perspective of member states, the actual convergence
is also important, i.e. the approximation of the standard of living of the population to developed
member states of the European Union. From the perspective of the process of the introduction of the
Euro, the key factor was the inflation rate since the country with significantly lower prices would rapidly
close onto neighboring countries with higher prices. The actual convergence is measured mainly
according to the indicator of the GDP per inhabitant in the Purchasing Power Parity (PPP). The
process of approximation of the price level between countries with different standards of living was
studied by Balassa, B. and Samuelson, P.A. Their studies indicate a thesis according to which the
growth of prices in the marketable sector is cause mainly by the growth of the labor productivity, and
in the unmarketable sector it is caused by the growth of salaries and prices and thus the inflation. This
phenomenon is labeled as the Balassa-Samuelson Effect and the established inflation differential is
also called a dual inflation (Benčík at al., 2005; Vladová, 2007; Vincúr, 2008; Muchová, 2008).
10.1.2 Process of the establishment of the European Monetary Union
The process of the establishment of the European Monetary Union can be divided into three
phases. The first phase that lasted from July 1, 1990 to December 31, 1993 started the first stage of
the economic and monetary union. Its aim was to eliminate last barriers of the free movement of the
capital within the European Community. Member states narrowed the fluctuation zone of national
currencies and strengthened the cooperation of individual national banks during this stage. Capital
movements started to be fully liberalized in the member states of the European Union. The decision of
the introduction of the single currency was passed by member states of the European Union in
Maastricht in February 1992.
The Treaty of the establishment of the European Community (Treaty of the European Union)
signed in the Dutch Maastricht in 1991 that came into effect on November 1, 1993 started the second
phase. The second phase lasted from January 1m 1994 to December 31, 1998 aimed at the
establishment of the European Monetary Institution, to strengthen procedures focused on the
coordination of economic policies on the European level and to fulfill convergence criteria that
conditioned the acceptance into the European Monetary Union. Member states of the European Union
Financial Aspects of Recent Trends in the Global Economy
169
decide to confront the “applicable deficit” and reach the economic convergence. The European Union
Commission passed on May 31, 1995 the Green Paper on the Single Currency that represented the
script of the transition to the single currency. The European Council agreed upon the fact that the
new currency will be called the “Euro” and passed the definite script of its introduction in Madrid on
December 15 -16, 1995. The Treaty on the European Union obliged the Council to at latest till
December 31, 1996 decide by a qualified majority whether:
The majority of member states fulfills conditions of the introduction of the single currency;
It is convenient for the European Union to enter the third phase and if yes, to set the date for the
start of the third phase. The Treaty of the European Union stated that if the date of the third
phase will not be set till the end of the 1997, the third phase will start on January 1, 1999 for
those member states that would fulfill convergence criteria. In this case, the Council is obliged to
confirm in the structure of heads of states or leaders of governments which member state fulfills
conditions of the introduction of the single currency until July 1, 1998 (based on convergence
criteria and in the light of economic data for the year 1997).
Since by the end of 1996 the majority of member states did not fulfill convergence criteria, the
start of the third phase was set on January 1, 1999.
The third phase started on January 1, 1999 by the establishment of the European Monetary
Union. Its members became 11 of member states of the European Union (Belgium, Finland, France,
the Netherlands, Ireland, Luxembourg, Germany, Portugal, Austria, Spain, Italy) with exceptions of the
Great Britain, Denmark, Sweden and Greece. The Great Britain and Denmark opted-out of the
entrance into the third phase and negotiated the so-called opt-clause in the Maastricht negotiations.
Sweden refused to participate in the third phase (without negotiating the opt-clause) because of
political reasons. Greece that at that time did not fulfill required convergence criteria entered the
European Monetary Union on January 1, 2001.
On January 1, 1999 fixed exchange rates of national currencies of member states were
established. The Euro was established as an independent currency and the ECU was exchanged to
Euro in the ratio of 1:1. The European Central Bank started its function and became responsible for
the single currency policy, the European system of central banks was established.
The third phase of the process of the establishment of the European Monetary Union was
divided into two stages. In the scope of the first stage (January 1, 1999 to December 31, 2001) the
Euro was used exclusively as a cashless currency. National banknotes and coins of member states of
the European Monetary Union stayed in circulation and were used in the cash payments. Each
subject could decide for the cashless payments whether the national currency or the Euro will be
used. Since January 1, 1999, transactions on capital markets and financial transactions of Institutions
of the European Union were made exclusively in the Euro. Since January 1, 2002, when the second
stage of the third phase started, the Euro banknotes and coins were introduced into circulation and
gradually national currencies of member states were moved from the circulation. In this stage, each
subject could decide whether the Euro or the national currency will be used in cash transactions.
Cashless transactions were realized exclusively in the Euro. The Euro was supposed to be introduced
in all market transactions in January 2002 and national banknotes and coins should have been moved
from the circulation at latest on February 28, 2002. Since March 1, 2002, there is only the Euro in the
Volume II, Chapter 10 Rastislav Kotulič, Jaroslava Hečková and Alexandra Chapčáková
170
circulation in member countries of the European Monetary Union and the process of the establishment
of the fully operational monetary union was completed.
Table 10.1 Conversion rates of national currencies of the Eurozone member states to the Euro
EMU Member state Conversion rate
(national currency /1 EUR)
Year of the introduction
of the Euro
Belgium 40.3399 BEF 1999
Cyprus 0.585274 CYP 2008
Finland 5.94573 FIM 1999
Estonia 15.6466 EEK 2011
France 6.55957 FRF 1999
Greece 340.750 GRD 2001
The Netherlands 2.20371 NLG 1999
Ireland 0.787564 IEP 1999
Luxembourg 40.3399 LUF 1999
Malta 0.429300 MTL 2008
Germany 1.95583 DEM 1999
Portugal 200.482 PTE 1999
Austria 13.7603 ATS 1999
Slovakia 30.1260 SKK 2009
Slovenia 239.640 SIT 2007
Spain 166.386 ESP 1999
Italy 1 936.27 ITL 1999
Source: European Central Bank. Available at: http://www.ecb.int, 12.6.2012.
The Euro as the single currency of the European Monetary Union received an established a
three-figure IOS (International Organization for Standardization) code EUR. As the symbol for the
Euro a double horizontally crossed out Greek letter epsilon (€) is used. The letter epsilon should
symbolize Greece as the cradle of the European civilization and the letter E as the initial letter of the
European continent. The double crossing of the letter should symbolize the stability and the strength
of the Euro.
While the original member states (the old 11 states and Greece) the Euro was introduced into
circulation through gradual transition at first in cashless transaction (since 1999) and later in cash
payments (since 2002), the Big Bang Method - the simultaneous introduction of the Euro in cash and
cashless payments - was used in countries that were accepted in the European Monetary Union and
introduced the Euro on January 1, 2007 - Slovenia, a year later January 1, 2008 - Cyprus and Malta,
on January 1, 2009 Slovakia as the 16th member of the European Monetary Union and on January 1,
2011 - Estonia.
10.2 The aspects of the secession from the European Monetary Union
The European Monetary Union is considered, according to the rule of law, to be a permanent
union and the Maastricht Treaty does not reckon on secession or exclusion of a member state. The
Article 56 of the Vienna Convention coming under the international contract law valid since January,
1980 states that such termination or withdrawal from the contract that does not include this measure is
possible only after being proven that during the signing of the contract the parties involved intended to
Financial Aspects of Recent Trends in the Global Economy
171
allow such measure, or if the nature of the contract allows this possibility. Based on this treaty,
countries assenting to it might state that at the time of the signing of the Maastricht Treaty they
intended to allow the secession from the European Monetary Union. They could possibly requisite the
right to secede from the Eurozone based on substantial changes in circumstance. However, the legal
resolution of the problem would probably not simple. Based on this, it is possible to assume that
countries would aim for the secession from the Monetary Union only in extreme cases of
unsustainability of the current situation. According to Palacková (2007, pp. 126-127) this problem is
linked with the German Supreme Court decision from 1993 according to which Germany is allowed to
secede from the European Monetary Union in the case of not achieving the aim of stability (see
further: Cornelius, Trimbur, 2000). Contrary to the non-existence of the defined plan of the dissolution
of the European Monetary Union, the risk of the dissolution is high enough for serious consideration.
According to Scott (1998, pp. 207-228), there existed an assumption of not negligible probability of the
dissolution of the EMU even during the third phase of its introduction. Scott considered the three-year
period during 1999-2002 as a kind of probation period with the Euro being introduced only in the
cashless form with national currencies in parallel circulation.
10.2.1 Economic reasons for the secession of the European Monetary Union
In spite of the fact that the dissolution of the European Monetary Union is legally disputable, the
monetary disintegration is theoretically conceivable. In relation to the monetary disintegration, there
are following scenarios categorized as (see further: Cornelius, Trimbur, 2000):
Specific country secedes from the European Monetary Union;
Specific country is excluded from the European Monetary Union;
Dissolution of the whole European Monetary Union.
A specific country can decide to secede from the European Monetary Union on several
grounds. Among them, the perception that according to its own interests the economic policy in the
common monetary area is too restrictive (hypothesis of excess demand); or it is disappointed with the
lack of stabilization efforts of other member states of the Monetary Union (dissatisfaction hypothesis).
Similarly to the decision on the admission to the Monetary Union, the decision of secession
from the Monetary Union is based on the evaluation of relative advantages and costs resulting from
this measure (Palacková, 2007, pp. 130-132). That means that for the country to remain in the
Monetary Union, advantages of the continuing membership have to outweigh advantages of its
possible secession. The secession of the Monetary Union advantage is the regaining of the control
over the own monetary policy as an instrument of protection from outer economic shocks as well as
the regaining of control of incomes from money issues that would to a certain extent lighten the state
budget of the country. The disadvantage of the secession would be the loss of benefits in the form of
decreased transaction costs and the elimination of the exchange rate risk and similarly in the form of
the price stability.
In the case of the dissatisfaction hypothesis, the insufficient efforts for stability in many
countries of the Monetary Union would result in the disproportionate growth of the debt, which would
raise the pressure on the European Central Bank to loosen the inflation and thus indirectly reduce the
value of the debt. The acceleration of the inflation could, in countries of the European Monetary Union
Volume II, Chapter 10 Rastislav Kotulič, Jaroslava Hečková and Alexandra Chapčáková
172
long accustomed to a monetary stability, raise a general disappointment and disapproval. In that case,
according to Fels (2005) it would be only a question of time for some political party to come with the
agenda to lead the country out of the inflation and back to the monetary stability of its own national
currency.
The return to the national currency would not be entirely possible mainly for small open
economies. The monetary policy of these countries cannot afford to be completely independent not
even in the case of the country not participating in any of monetary unions. Anyways, the secession of
the country from the Monetary Union would not represent a simple return to the original state before
the admission concerning the difficulties with the re-introduction of the national currency, with the legal
uncertainty concerning the denomination of existing obligations, with the unexpected “strength” of the
new currency, with the control of the money supply, with the reluctance of other countries to officially
recognize the newly established currency, and relating to, according to Scott (1998, pp. 207-228) the
so-called “Euroization” as the effort to suppress the use of the common currency in the process of the
introduction of the new weaker currency, which would isolate the seceding country even further.
A successful secession from the Monetary Union would require a certain form of cooperation
with other countries remaining in the Monetary Union. Similarly, the exclusion of a country from the
Eurozone would not be possible without the cooperation; the exclusion can result from the constant
disregard of the budgetary discipline. Without the consent of the country concerned with its exclusion
from the Monetary Union, this country could continue to create the deficit payable in the common
currency, thus constantly affecting all states of the Monetary Union. The probable solution would only
be the introduction of a new common currency for remaining countries, which would result in the
exclusion of the non-cooperating country of the original Monetary Union.
In the case of a strong country’s effort to secede from the Monetary Union (e.g. Germany or
France), it can be assumed that this could lead to the dissolution of the whole Monetary Union. In this
case, the re-introduction of national currencies would be easier mostly for countries with weaker
currencies. Inflationary pressures could threaten countries with stronger currencies. Indeed, if the
dissolution of the Monetary Union was realized through the introduction of fixed exchange rates of
new national currencies to the Euro, subjects would try to sell Euros for the highest price possible,
which would result, according to Scott (1998, pp. 207-228) in the fact that the specific Central Bank
would be pressured to increase the amount of the money in circulation.
Despite the absence of a defined plan of the dissolution of the European Monetary Union, the
risk of the dissolution is according to several authors significant enough to be considered seriously.
The preservation of national payment systems, as well as the preservation of national central banks
and debt instruments of national governments is considered by these authors as an “insurance” in
case of the failure of the Monetary Union.
In the scope of the widely used principle of subsidiarity, the creation of common foreign
reserves was limited. National central banks surrendered only a part of their reserves to the ECB;
however, they still maintain the right for these reserves. In the case of the dissolution of the European
Monetary Union, national central banks would have a share of foreign reserves directly and the rest
would have to try to be recovered from the ECB. According to Scott (1998, pp. 207-228), the question
is whether it was really the principle of subsidiarity or, in fact, the intended protection of individual
Financial Aspects of Recent Trends in the Global Economy
173
states in the case of the failure if the Monetary Union through retaining of all required structures for
the possible return to their own currencies.
10.2.2 Negative consequences of the secession from the European Monetary Union
The following problems would have to be addressed in case of the secession of the country from
the European Monetary Union, or its dissolution (Palacková, 2007, pp. 132-133):
Contracts continuity - the enforcement of the fulfillment of contracts in newly denominated
national currencies might be problematic, mainly in combinations of: debtor from seceding
countries and foreign creditor. The conversion of Euro liabilities to the new currency would
surely be recognized by domestic courts. However, foreign courts could hold a different opinion,
most probably based on the lex monetae legal maxim. It is a rule based on which it was possible
to replace the Mark for the Reichsmark in Germany, since Germany was their issuer. The
application of the said legal maxim results in the fact that governments of countries seceding
from the European Monetary Union would not be allowed to simply exchange the Euro for the
new currency, since they were not its issuers. This means that regardless of the decision of
national governments, all contracts denominated in Euros issued in individual countries prior to
their secession from the European Monetary Union would remain payable in Euros. The lex
monetae legal maxim would not be possible to apply reliably even in the case of the dissolution
of the European Monetary Union as a whole. In this case, the original issuer of the Euro as the
common currency would cease to exist. This would result in the problem of who should be
considered as the original issuer since all countries would try to introduce own currencies at the
same time. The issues would arise concerning the enforcement of liabilities, mostly concerning
their denomination.
Conversion of debts - the differences of opinions on conversion of Euro debts to the new
national currency lies in the fact whether these are public or private debts. If the government of
the country wields an unlimited power over the management of the public debt, it could decide to
convert the public debt into the new currency, in case its new currency after the secession of the
Monetary Union would be weaker. This would result in the decrease of the public debt. Creditors
would consider this measure as a breach of the obligation - the so-called default.
Country’s rating - the secession from the European Monetary Union or its dissolution would be
visible in the rating of individual countries, thus, in the cost of their future debt. The confidence of
investors in the new currency would not be too high in the beginning, which means that the cost
of the debt would reflect the risk of the possible inflation.
Operation of business systems - threats of representatives of some countries on possible efforts
in the secession from the Eurozone results in apprehensions of many software engineers. The
introduction of the Euro required a re-programming of the software to operate with the new
currency. This was the change between countries and their currencies. Prior to the introduction
of the Euro, the valid rule stated that one country = one currency that had to be replaced by the
rule - several countries = one currency. The transition of business systems to the Euro was
planned and introduced gradually, in case of a country’s secession from the Eurozone the
operation of business systems might be disrupted.
Volume II, Chapter 10 Rastislav Kotulič, Jaroslava Hečková and Alexandra Chapčáková
174
10.3 The position of the Central Bank and the role of the monetary policy from the point of view
of selected theoretical approaches
The European Central Bank's representatives declare that the European Central Bank does not
monitor more objectives, the key objective is just provision of the price stability in the medium-term
horizon. The first pillar does not represent the objective for the growth of money stock, the second
pillar does not represent the inflation targeting. Both pillars represent just two different aspects of the
inflation analysis, namely the monetary and nonmonetary approach. The first pillar of the monetary
analysis becomes the subject of the criticism of quite a number of experts, predominantly by the
reason that the European Central Bank did not explained the formal connection of money in the
inflation process nor the causality of money and prices more particularly (see in research studies of
Svensson, L.E.O., Bean, Ch., Bofinger, P., Eijffinger, S., Wyplosz, Ch. and others).
Baldwin and Wyplosz (2008) promote the opinion that the monetary policy of the European
Central Bank carried out on the basis of the principle “one size fits all“ that does not have to suit all
countries at the same time in such heterogeneous economic field as the euro area actually is (and
upon the enlargement in the larger extent it really will be). This “one size“ is represented by a single
nominal (short-term) interest rate for the whole euro area. The problem is that the monetary policy
does not influence the economy by a nominal interest rate, the essence is a real interest rate (i.e. the
nominal rate without expected inflation). As well, they restore the question why the team of experts
preparing the Maastricht Treaty did not pay attention to the Optimum Currency Area Theory (OCA).
According to Sojka (2010), the common requirement of the independency of the central bank,
along with the transparency and trustworthiness of its monetary policy based on the "new consensus"
applied by the European Central Bank, resulted in the inappropriate accent of the antiinflation
monetary policy (which is, in addition, equipped by high level of independency at monitoring of
currency objectives) at the expense of economic growth and employment.
Korda (2010) points out the fact that the relation of a growth of monetary aggregate M3 and
the reactions of the European Central Bank is not clear by its basic interest rate. The annual growth of
M3 exceeding 4.5% is interpreted repeatedly by the European Central Bank as non-risky for price
stability123. It is questionable, to what extent the monetary analysis is relevant in the European Central
Bank. It is possible to consider the revision of the monetary pillar of May 2003 as the decrease of its
significance. In addition to the shift of the monetary analysis to the second place in introductory
statements of the European Central Bank's governor, the periodical annual revisions of the reference
value for M3 growth have been cancelled. It is possible to state that the active task of money is not the
matter either in the European Central Bank, only a paradox is confirmed that the inflation is a
monetary phenomenon in the long-term period (which the monetary analysis is focused on), while in
the short-term period (which the monetary analysis is dealt with) money is not used in the explanation
of the inflation at all. The use of money in the monetary policy of the European Central Bank thus
corresponds rather to pragmatic use of information provided by monetary aggregates (similarly as for
other central banks) while it differs rather just by a detachment of monetary analysis into a special
123 Authors' remark: The European Central Bank regularly releases more detailed M3 development in its quarterly bulletins since
January 1999.
Financial Aspects of Recent Trends in the Global Economy
175
pillar, the generation of which can be regarded as a heritage from German Bundesbank, where the
effort apparently consisted in a transfer of its reputation to the European Central Bank.
According to Iša and Okáli (2008), it is not possible to ignore a slow growth of economic
performance of the euro area and lagging in the dynamics of its key indicators of the supply side (i.e.
labor productivity, employment and potential product) which are often assigned to a rigid economic
and political and social environment. After all, not all members of the European Monetary Union are
satisfied with a single monetary policy which cannot take needs and interests of particular Member
States into account. Some difficulties of the European monetary Union have their roots in the very
process of its origination and other are connected with its asymmetric architecture and with
considerable economic heterogeneity. In addition, Iša and Okáli (2008) call attention to the fact that a
special significance has, from the point of view of forming of monetary policy and its expected effects,
the disputes about foreign exchange rate and "trade-off" inflation - unemployment. The Eurosystem
does not directly intervene the managing of these thorny problems, however its decisions are one of
the keys to the macroeconomic stability, sustainable growth and thus to the managing of specific
economic and political questions. According to authors, the Eurosystem has no (as opposed to the
American Fed) strong support in the aims included in the Maastricht Treaty. While Fed is
characterized by a balance of basic macroeconomic objectives, the European system of central banks
define the price stability as the primary objective and very equivocate about the secondary objectives
(economic and social advance, high unemployment). The price stability takes high priority over the
secondary objectives, which are more or less ignored by the European Central Bank. In practical
decision-making, it may be expressed by a motto "Price stability by all means". Therefore it is not
surprising that not all members of the euro area agree with such an approach.
10.3.1 The position of the Central Bank and the role of the monetary policy from the point of
view of the new classical macroeconomics
The new classical macroeconomics, in both its development stages, has significantly
influenced the formulation of the requirement for independency of the central bank. The important
theoretical argument was the Lucas' interpretation of the Phillips which implies the non-existence of
substitution relation between inflation and unemployment. According to Lucas, the economic subjects
that create their expectations take into account all available information which can influence the given
variable influence in the future so as to benefit as much as possible. On the basis of this fact, it is
possible to suppose a correctness of their forecasts and non-recurrence of the systematic errors. The
economic subjects try to include the information into their decisions, what is reflected by relative
economic variables (wages and prices) and inflation. The representatives of the classical
macroeconomics suppose that as a result of influence of market forces, economy generates, in the
formation of the rational expectations, a natural rate of unemployment in the long term. The
unemployment is (considering the unexpected changes of money supply) higher or lower in the short
term than the natural rate of unemployment. If the central bank increases the aggregate demand by
the monetary policy, the economic subjects will immediately adjust their rational expectations and take
the expected rate of inflation into account by making the changes of prices and wages. Thus, the
expected rate of inflation shall be the same as the real inflation rate. The real product and
Volume II, Chapter 10 Rastislav Kotulič, Jaroslava Hečková and Alexandra Chapčáková
176
unemployment rate remain unchanged. In the case of the rational expectation, there is no short-term
Phillips curve (or it is the same with the long-term one). In this case, it is not possible to conclude a
substitution relation between the inflation and unemployment rate (Koderová, Sojka & Havel, 2008;
Soukup, 2007).
The argument of the independency of the central bank has been further supported by the
matter of time inconsistency124 of the discrete economy policy (Kydland and Prescott), which is
generated by the reason that the creator of the monetary policy has a certain benefit from the strategy
at which the announced procedure does not correspond with the procedure later really applied. So as
to avoid this phenomenon (decreasing the economy performance), the economy policy must have the
form of rules and to be as transparent as possible. The central bank must be independent so that not
to be subject to political influences and the monetary policy is to be based on a simple and clear rule.
The independent central bank would consistently use the given rule and not to deviate from it under
any circumstances. Thus, the monetary policy would become sufficiently trustworthy and create the
conditions for the formation of correct rational expectations in short as well as in long terms
(Koderová, Sojka & Havel, 2008).
10.3.2 The position of the Central Bank and the role of the monetary policy from the point of
view of the post-keynesian theory of the endogeneity of money
The post-Keynesian money theory has arisen in the 1970s as the critical response to the
monetarist counterrevolution. At the turn of the 20th and 21st century, it was already developed in the
form of the full-valued alternative of the monetarist theory of neoclassic as well as new Keynesian
direction in the mainstream economy (Sojka, 2010).
The basis of the post-Keynesian money theory consists in the thesis there is no general
theoretical model that can solve all economic problems for all historical periods and all situations. The
significant role belongs, in this relation, to monetary institutions and their evolution. The development
of institutions reflects the major characteristic features of money, since the monetary institutions and
the banking ones are closely interconnected. In this relation, the role of credit is significant (money is
credit-driven) and a demand determination of money (Sojka, 2002).
Money plays the significant stabilizing role in the post-Keynesian money theory as an
instrument for overcoming the uncertainty. It is credit-driven and demand-determined. The thesis that
money is determined by demand for credits means that, according to the post-Keynesians, the
124In general, time inconsistency in economy means a situation where the preferences change over time, i.e. the preferences of a
politician at one point in time is inconsistent with he/she prefers at another point in time. A discrete decisions policy (the selection of the best decision in the given situation at correct assessment of status at the end of given period) does not lead to the optimization of a purpose-built function of the society. The reason of the paradox is the fact that the agents with rational expectations enter the game and that in that case there is no explicit manner of application of the management theory in economics. More exactly, the optimum management can be used only under the condition that only current and past policy is taken into account and the expectations of agents do not depend on future plans. It is possible to say that as a result of the fact that a politician feels a temptation to communicate the policy of monetary rule to public but to abandon it in the practice, the problem of time inconsistency and inflation deviation occurs. The solution of the problem of time inconsistency is to entrust an institution which works with longer time horizon than politicians and is not so exposed to similar problems and temptations to use the monetary policy for short-term influencing of real economic quantities with the implementation of the monetary policy. This institution shall be an independent central bank. Governor and members of the central bank management are usually appointed the periods that are longer than terms of office of politicians so as to be protected against possible political pressure and efforts to use the monetary policy for long-term political objectives.

Financial Aspects of Recent Trends in the Global Economy
177
demand for credits is the source of supply of money that is either, during the economic cycle,
endogenously generated (during a conjuncture) or destroyed (during a recession). The thesis that
money is credit-driven formulates the manner in which money is created by the process of credit
creation in response to the development of the demand for credits incurred by the investment goals or
by the increase of demand for working capital and destructed in the case of a decrease of the demand
for credits. These create the basis of the theory of so called endogenous nature of money supply,
according to which money is generated and destroyed as a response to the aggregate demand
changes and related demand for credits. The basis of considering the endogenous money nature for
the post-Keynesian economists was the thoughts of John Maynard Keynes developed in his work
Treatise on Money, in which Keynes emphasizes the role of bank money, which has developed from
money proper (Sojka, 2002; Svoboda, 2001). Theoretical working out of endogenous money within
the post-Keynesian stream was comparatively careful, the empirical literature lacks. The most
important contributions in this respect were from Lavoie, Fontana and Palacio-Vera, Arestis
and Sawyer (Korda, 2010).
The theory of the endogenous money has considerable consequences for formulation of a
monetary and credit policy as well as for the position of the central bank in the market capitalistic
economy. In this concept, the money multiplier is not stable and causal relations are not directed
unambiguously from the money basis to bank money (even the contrary relation is more important).
Under these conditions, the central bank is not able to directly determine the amount of money in
circulation, it is able, at the most, to influence it, however, the effectiveness of the monetary and credit
policy is limited and has rather asymmetric consequences. The restrictive policy is usually more
effective.
In the post-Keynesian view, the main goal of the central bank is not the currency stability,
since the central bank is not able to enforce adequately this goal and its appropriate effectiveness in
the battle against inflation is used to be paid by high price of a loss of macroeconomic
performance.125. In this respect, the main problem is a fact that instruments, the central bank has at
disposal are suitable for the battle against demand inflation only. Taking into account the fact that after
the World War II the advanced capitalistic economies face predominantly cost inflation, this policy has
very problematic impacts. In the post-Keynes concept, similarly as for the European version of new
Keynesian economics (theoretical conceptions of so called negotiated economy), the income policy
has become the effective instrument of the battle against the cost inflation. The role of the central
bank consists in the attention paid to stability and sound development of the banking sector. The
monetary and credit policy, as well as all administrative instruments used by the central bank to
control the banking sector, would be as much as possible coordinated with other economic and
political measures oriented to full employment (Koderová, Sojka & Havel, 2008).
According to current post-Keynesian authors of theory of relative money endogeneity (Dow,
Rodríguez-Fuentes, Lavoie, Monvoison, Rochon, Palley and others) there is a certain interval of the
credit creation. It is given by the conduct of the central bank and of the commercial banks. In this
125 The key role of the monetary policy in the post-Keynesian theory is represented by control and supervision of the banking (more
widely also financial) system. Post-Keynesians always draw the attention to the fact that the central bank is to fulfil especially its microeconomic function. This approach penetrates into the monetary policy. It is possible to observe in recent years that the central banks pay increased attention to stability of financial system in addition to inflation and economic growth.

Volume II, Chapter 10 Rastislav Kotulič, Jaroslava Hečková and Alexandra Chapčáková
178
approach, the central bank plays more active role in the existence of the endogenous nature of money
supply as well. According to the supporters of this conception, the monetary policy does not include
just quantitative (traditional) instruments (open-market operations, determination of obligatory
reserves, discount rate and so on), but also qualitative (administrative) control instruments (bank
control and supervision). According to their opinion, the significance of quantitative instruments is
even decreasing and on the contrary, the role of administrative instruments in the stabilization of bank
sector that have behavioral impacts on economic subjects increases (Sojka, 2010).
10.3.3 The position of the Central Bank and the role of monetary policy from the point of view
of New Keynesian Economics ("New Consensus")
The new Keynesian economics has arisen during 20th century as a response to the emerging
of neoconservative orientations (especially of the monetarism and new classical macroeconomics)
and the crisis of neo-Keynesian macroeconomics (large neoclassical synthesis). In the area of the
monetary policy and the theory of money, the theoretical conceptions become the basis of the "new
consensus", which is the basis of the monetary policy focused to the inflation targeting. The changes
of interest rates are, according to the theory, to provide non-inflation development of the aggregate
demand, therefore it is possible to understand the inflation targeting also as the monetary policy of
fine-tuning of the aggregate demand in the interest of reaching the determined inflation target. The
given fine-tuning is based on the Phillips curve interpreted as a relation of the inflation and the
production gap and including the inflation expectation. In a simplified fashion, the explanation of the
new consensus can be interpreted as the model with three equations, by which it is possible to identify
main differences between the new Keynesian theory of money and the post-Keynesian monetary
theory of production. For the purpose of a simplification, the instants of time are provided. It is
possible to encounter its various options. The following model describes the closed economy
(Koderová, Sojka & Havel, 2008; Sojka, 2010).
Equation (10.1) is the equation of the aggregate demand, in which the output gap is given by
the past and expected output gaps and real interest rate. It is based on the inverse-proportional
relation of the aggregate demand and real interest rate (modified Fisher equation).
Equation (10.2) is an equivalent of the Phillips curve, in which the inflation is based on the
common output gap and on the past and future inflation rate.
Equation (10.3) represents the central bank monetary policy rule (commonly used term for so
called Taylor rule), in which the nominal interest rate is set as the response to deviation of inflation
and product from their requested levels. In this equation, the creation of expectations is based on the
rational expectations (Sojka, 2010) in the original versions of the "new consensus" (e.g. Clarida, Gall
and Gertler, Taylor and others).
yg = a0 + a1 yg -1 + a2 (Et yg +1) – a3 [i – Et (π+1)] + s1 (10.1)
π = b1 yg + b2 π-1 + b3 Et (π+1) + s2 (with b2 + b3 = 1) (10.2)
i = r0 + Et (π+1) + c1 yg -1 + c2 (π-1– πT) (10.3)
where:
yg - output gap,
i - nominal interest rate,
Financial Aspects of Recent Trends in the Global Economy
179
π - inflation rate,
πT - inflation target,
r0 - „equilibrium real interest rate", which is compatible with a zero output gap,
s1, s2 - stochastic shocks,
Et - expectations in time t.
In the "new consensus" models, it is formally working with the cost-push inflation, but the
conclusions for the monetary policy are made in such a way as only demand-pull inflation was
relevant. The fact that money contained in them are not neutral in the short-time, is the result of small
adjusting of nominal and real variables, what represents the characteristic feature of microeconomic
bases of the new Keynesian economics. However, in the long term, the quantitative theory of money
and resulting money neutrality remain valid. Actually, the inflation targeting supposes that low inflation
rate is also harmful to economic development and that only very low inflation rate will provide the
successful macroeconomic performance (the inflation rates amounted to 1 to 2% are regarded to be
acceptable). According to new Keynesians, the introduction of the rule of monetary policy changes the
behavior of the economic subjects (Koderová, Sojka & Havel, 2008).
In these models, there is no room for cost or wage inflation, despite the fact that the entire
majority of inflation pressures after the World War II has been caused just by the increase of wage
costs or oil prices and the demand inflation practically did not occur. The utilization of equilibrium real
interest rate points out so called wicksell roots of the "new consensus" (Koderová, Sojka & Havel,
2008; Korda, 2010).
10.3.4 The European Central Bank, the example of its dual strategy
The European system of the central banks has two levels from the formal point of view, the
European Central Bank and national central banks of particular Member States of the European
Union. The statute of the European Central Bank and the European system of the central banks was
established by the Treaty on European Union of 1992 and the Protocol on Statute of the European
system of the central banks and the European Central Bank.
Thus, the European Central Bank became the component part of the specific legal and
institutional framework of the European Community. The legislation, statutes and frameworks of the
monetary policy of the American Federal reserve system and the German central banking based
especially on the traditions of the German ordoliberalism become the source of inspiration of these
documents. The European system of central banks has no legal personality (the legal entity is the
European Central Bank and the national central banks), the participants of the monetary policy is the
European Central Bank and the national central banks of the Euro area countries, which, on the basis
of the Decision of the Board of Governors is called Eurosystem. The European Central Bank
commenced its operation on July 1, 1998. The mandate of the central bank has also been influenced
by the residues of the monetarism which could be found in the "new consensus" and its theoretical
bases (Sojka, 2010).
Volume II, Chapter 10 Rastislav Kotulič, Jaroslava Hečková and Alexandra Chapčáková
180
Owing to these influences, the European Central Bank primarily focuses on the maintaining of
the currency stability (Art. 105 of the Treaty and so called Maastricht criteria)126. While, it is based on
the fact, that the European Central Bank can best contribute to "balanced and sustainable
noninflationary growth" and "high level of employment" by monitoring of the monetary policy focused
to the price stability. The ability of the monetary policy to ensure the price stability in the medium-term
horizon is based on the dependency of the bank system on money issued by the central bank
(identified as the "currency basis"), which is needed for:
satisfaction of demand for money in circulation;
settlement of interbank balances;
keeping the obligatory minimum reserves at which their deposition in the central bank could
be requested.
Taking into account the monopoly for the formation of the currency basis, the Eurosystem
dominantly influences the conditions and interest rates at the money market. The changes of the
interest rates on the money market produced by the central bank, initiated a whole series of
mechanisms and reactions of economic subjects, which, in the upshot, influence the economic
indicators, such as production or prices. This process is called as the "transmission mechanism of the
monetary policy" (Scheller, 2006).
The European system of central Banks may support "general economy policies in the
European Community with the intention to contribute to achieve the Community objectives" specified
in the Treaty (economic and social advance, its balance and stability, improvement of economic and
social cohesion, high level of employment).
According to Scheller (2006), there are three main political and economic reasons, why the
function of the central bank for euro is held by the system of banks instead one central bank:
establishment of one central bank for whole euro area (with the possibility to concentrate the
functions of the central bank into one place) would be unacceptable by political reasons;
conception of the Eurosystem is based on the skills of the national central banks, preserves
their institutional arrangement, infrastructure and operating capacities and relies on their
professional knowledge. In addition, the national central banks also performs the tasks, which
do not directly relate to the Eurosystem;
taking the expanse of the euro area into account, it was needed to enable the credit institutions
to access the central bank in every participating Member State. Taking the fact into account
that there are many countries and cultures in the euro area, the domestic institutions
considered to be better access point to the Eurosystem than one multinational institution.
Based on the Treaty on European Union and the Statute of the European system of central banks
and the European central bank, the European Central Bank fulfills the following basic tasks:
forming and implementation of single monetary policy of the euro area;
implementation of foreign-currency operations;
126 Despite the fact that the Maastricht Treaty establishes unambiguously the main objective of the European Central Bank –
maintaining of price stability – it did not define, what the price stability in fact means. Therefore, the Board of Governors of the European Central Bank has published a quantitative definition of price stability in October 1998 where it is defined as "interim increase of harmonized index of consumer prices (HICP) in the euro-currency area by less than 2%". At the same time it established that the price stability is "maintained in a medium-term horizon".
Financial Aspects of Recent Trends in the Global Economy
181
holding and administration of official monetary reserves of the countries of the euro area;
provision of continuous operation of payment systems;
exclusive rights to permit the euro notes emissions;
compilation of monetary and financial statistics;
consulting activity for national central banks in the matters falling into its competence.
The Eurosystem is distinguished by high degree of independency (now probably highest
degree of independency in the world). The European Central Bank as well as national central banks of
the euro area are strictly protected against any political influence. The institutional independence of
the European Central Bank from any influences (including influences from the part of governments) is
guaranteed in Article 108 in the Treaty. This provision specifically provides that the European Central
Bank or any member or his decision-making bodies will not ask for instructions or receive the
instructions from other institutions or bodies of the Community, or from any government of a Member
State or from any other body. The institutional independency of the European Central Bank is
supplemented by its own legislation powers and consulting task at proposing the national legislation
provisions.
According to the European Central Bank, money has a privileged role in its monetary policy.
The decision to assign money the special position was based on the recognition of the fact that the
money stock and inflation increases are closely related in the medium- and long-term horizons. The
monetary and political strategy of the European Central Bank is based on two, mutually
complementing analytical views, called pillars:
economic analysis
and
monetary analysis.
Economic analysis (the first pillar) - for evaluation of short-term and medium-term factors of
development emphasizing the real economic activity and terms of financing in the particular
economies of the Union. This approach considers the fact that price development in these time
horizons is influenced to considerable extent by mutual influencing of demand and offer on the market
of goods, services and production factors.
Within the economic analysis, the European Central Bank periodically evaluates the following:
development of total production;
demand and conditions at the labor market;
wide scope of price and cost indicators (e.g. influence of economic shocks on cost and price
formation influence);
fiscal policy;
balance of payment of the euro area.
Also other indicators are monitored - the indicators of financial market, real estate prices,
exchange rates of shares and movements of currency exchange rates. The macroeconomic projection
elaborated by the Eurosystem's experts plays the important role in the economic analysis. The
projections assist to classify and synthesize economic data with the aim to provide their consistency.
In this respect, the projections have the key significance in specification of assessment of prospects of
Volume II, Chapter 10 Rastislav Kotulič, Jaroslava Hečková and Alexandra Chapčáková
182
economic development and short-term up to medium-term fluctuations of the inflation from its general
trend.
Monetary analysis (second pillar) is focused on a long-term perspective and uses the long-
term relation between money and prices. It is based on the assumptions that the inflation is a money
phenomenon in the medium-term and long-term periods and the increase of money stock and inflation
are closely interconnected in the medium-term and long-term horizon. The monetary analysis
predominantly applies as the comparison device (from the part of development in the medium-term up
to long-term horizon) of short-term up to medium-term indicators of the monetary policy resulting from
the results of the economic analysis. It is focuses on the estimations of the money demand equations,
real and nominal money gap, money overhang, utilization of money aggregates127 as the advance
indicators and their counter-entries. According to the research of the European Central Bank, the
money aggregates include information about future price development. The subject of the analysis
also includes the counterparties (counter-entries) M3, especially credits (Iša, 2008).
The aim of two-pillar approach is to ensure so that not to forget any relevant information in the
risk assessment for price stability and to pay appropriate attention to various points of view and
comparison of information, in the effort to come to general conclusion about the existence or risks for
price stability. Two-pillar approach represents and appears to be as a system of diversified analysis,
which is to provide, according to the European Central Bank, so as any relevant information to be
omitted in the assessment of the risks influencing the inflation. The analysis of the development and
mutual control of economic and monetary indicators (cross-check) is to provide the diversified analysis
and to guarantee the consistency of the decision-making based on various analytical approaches.
10.4 Integration process of Slovakia into the European Monetary Union in perspective of
selected macro-economic theories
The future of the national currencies of the European Union members is linked to the
development of the European economy at present time. The single currency “Euro” (EUR) was
introduced to world markets on January 1, 1999 and currently represents the main component of the
Economic and Monetary Union (EMU) of the EU member states, the so-called Eurozone.
The single currency and Eurozone create many economic advantages for all economic
subjects effective in member states of the EMU, but on the other hand, they represent considerable
risks affecting macro-economic or micro-economic sphere. These risks are connected to the degree of
preparedness of a new member to introduce the single currency and thus accept commitments arising
from the membership in the Eurozone. The minimization of these risks is assisted by the high level of 127 The key element of the monetary analysis is the analysis of money aggregate M3, which includes an amount of money in
circulation, demand deposits, deposits with agreed maturity within two years including and deposits redeemable at notice up to three months including, repurchase agreements, units/shares of mutual funds of money market and debt debt securities with maturity within two years including. Selection of M3 aggregate is base on the evidences based by several empirical studies that just this aggregate fulfils the requirement of stable demand for money and is relevant indicator of future price development in the euro-area. The reference value of M3 growth was deduced in such a way so that to comply with reaching the price stability in the medium-term period and it was established on the level of 4.5%. A deduction of M3 is based on the quantitative equation of exchange (a change of money stock in economy (∆M), inflation (∆P), growth of real product (∆ YR) and velocity of money circulation (∆V)). There was considered the growth rate of real GDP around 2 - 2.5%, the growth of price level below 2% and the decrease of money circulation velocity to 0.5 - 1% per year. The reference value is not the objective for M3 growth it should serve as equilibrium value of the growth of money aggregate and for identification of possible variations with possible risks influencing the development of inflation.
Financial Aspects of Recent Trends in the Global Economy
183
convergence of the economy of the country to the economy of countries of the Eurozone (Lebiedzik,
Tuleja & Pauhofová, 2008).
The admission to the EU pushed the question of forming of the basic monetary and exchange
framework into the forefront of economic and political decision-making in the transitive economies.
The question of admission of candidate countries to the EMU is closely related to the future formation
of the basic framework to sustain the macro-economic stability. With a high capital mobility and
significantly limited conditions of execution of an independent interest policy, the decision on joining
the euro is connected to accounting for potential consequence of relinquishing of the flexible
exchange rate as a stabilizing instrument, e.g. for absorption of macro-economic shocks (Mirdala,
2008).
The admission of Slovakia into the Exchange Rate Mechanism (ERM II) in the late 2005 was
perceived rather positively. It was mostly positively received by bank analysts, members of the Club
500 and then government officials. Entrepreneurs anticipated mostly the elimination of exchange rate
risks and costs connected to insurance thereof as well as the reduction of costs of currency
conversion. However, there were voices that pointed out that the accelerated admission to the ERM II
was motivated more politically than economically. When discussing the admission to the Euro in
Slovakia, the discussions usually narrowed down to whether Slovakia fulfills convergence criteria. A
little attention was paid to their sustainable fulfillment, a sound concept of the optimum conversion rate
of the Slovak crown was absent, even the key issue of the actual convergence was pushed to the
background (Iša & Okáli , 2008).
The outbreak of the economic crisis in the end of 2008 significantly affected Slovakia and
facilitated the emergence of a legitimate question whether the situation would be different in certain
European economies if they were or were not members of the EMU at that time. The answer is not
universally applicable to all countries of the EU that have not joined the single currency.
A reliable answer has to take into consideration possible advantages as well as disadvantages
of such admission to the Eurozone with subsequent specifications of the monetary policy and its
impact on the economy.
10.4.1 Impacts of the Eurozone admission
History shows that if the Slovak Republic wanted to join the single currency it had to fulfill the
so-called Maastricht convergence criteria (the stability criterion, the long-term interest rate criterion,
the public deficit criterion, the public debt criterion and national currency stability in the European
Exchange Rate Mechanism ERMII criterion).
Concerning the joining of the single currency, the often-mentioned fact is the need to gain on
the economic as well as price level of the developed member states of the EU prior to the admission
to the Eurozone.
The economic level is the process of the actual convergence that is possible to acquire
through a higher rate of the real GDP growth or the real valorization of the national currency, or the
combination of both above-mentioned variables.
The price level is the process of the nominal convergence the country is possible to reach through
two different methods, either through the nominal valorization of the national currency (the so called
Volume II, Chapter 10 Rastislav Kotulič, Jaroslava Hečková and Alexandra Chapčáková
184
exchange rate channel) or through a higher inflation of the national economy (the so called inflation
channel), or through combination of both above-mentioned variables.
The inflation targeting with the flexible exchange rate is considered according to Komárek et
al. (2010) as the most suitable and safest monetary-political regime for rapidly converging countries.
Since if the real appreciation of the currency is administered exclusively through the channel of the
higher inflation it results in low real interest rates, growth of inner and outer imbalance, which further
results in a higher vulnerability of such a country during the time of crisis or turbulence. Other
economic policies are overextended or are unable to balance this disequilibrium.
Each national economy anticipates mostly positive effects after joining the Euro. Positive
expectations are logical, since every new country admitted to the EU pledges to join the Monetary
Union and till the admission has the status of a member state with a temporal exemption for the
joining of the Euro.
Slovakia joined the single currency on January 1, 2009. The admission of the Slovak Republic
to the European Monetary Union resulted in termination of the national currency – the Slovak crown,
which in principle resulted in the termination of the autonomous monetary policy. The loss of the
autonomous monetary policy is a cost of a country’s admission to the Monetary Union.
The passing of the monetary sovereignty by the admission of the EMU does not necessarily result
in a heightened risk of the negative impact of macro-economic shocks on the progress of the output.
The use of flexible exchange rates as a stabilizing mechanism for the absorption of negative impacts
of macro-economic shocks is presented as less effective in the research of Mirdala (2008).
It is important to state that the admission to the Union and joining of the single currency has its
benefits. One of the significantly positive effects is the elimination of risks of the exchange rate
towards the Eurozone countries, which usually results in decreased transactional costs and lessening
of the investment insecurity; another positive effect is the stabilization of the long-term interest rates
on the lowest level and the access to more liquid Eurozone markets; the next important advantage is
the heightened stability of the financial sector and lessening of risks of monetary turbulence; at last
and in my opinion the most valuable advantage is the requirement to fulfill the demand of the
balanced public budget, which at present represents one of the most important problems of the
Eurozone countries.
The admission to the Monetary Union will always be accompanied by advantages and
disadvantages. What will prevail in the time of the economic crisis cannot be generalized for each and
every member state of the European Union, only time will show what represents an advantage
(assets) and disadvantage (costs) for the Slovak Republic.
The existence of the single currency anticipates the unified monetary policy which direction is
determined by the European System of Central Banks implemented by the European Central Bank in
Frankfurt on the Main. Since national central banks are only implementing the policy of the European
Central Bank, they are unable to lower interest rates during the time of crisis (recession) or raise
these rates as an attempt to prevent inflation. As a supranational authority, the European Central
Bank has to consider broad and wide-ranging objectives of the Monetary Union, the most important
objective from the perspective of a national economy is to synchronize the national economic cycle
with objectives of main trade partners in the Eurozone.
Financial Aspects of Recent Trends in the Global Economy
185
In case of such synchronization on the highest possible level, there is a high probability that
objectives of the national economy will not be in contrast with the monetary policy of the European
Central Bank.
10.4.2 Restrictions and obstacles of monetary policies
In the time of the current economic crisis, central banks lower their interest rates in an
unprecedented extent, indicated by historical minimums (USA the level of 0 – 0.25 per cent) trusting
that such inexpensive finances will lead to a higher lending which should result in higher spending and
investments.
Main aims of the monetary policy are conflicting in a sense that the accomplishment of one
prevents the accomplishment of another objective. The effort for the price stability in the time of a
rapid economic growth or in the time of the economic crisis (recession) elicits the so-called central
bank dilemma. This dilemma consists of the decision-making process and whether it will follow the
stability of the money offer (the interest rate has to change) or the stability of the interest rate (the
money offer has to change).
On the other hand, politicians as well as economic subjects ascribe a massive emphasis on
effects of the monetary policy that not always fulfills these expectations. Among basic but fundamental
restrictions of the monetary policy belong:
The control of the amount of money in the economy is not an easy task (the control is not as
accurate and finite because of the free movement of finances across borders and a relatively
easy conversion from one national currency to other);
Effects of changes in the discount rates have only anticipated and not absolutely certain
impact, this being influenced by either pessimistic expectations (negative influence of the
lowered interest rate) or positive expectations (weakening of absorbing influence of the
heightened interest rate);
The increasing of the interest rate (in order to confront the inflation pressure) usually results in
the widening of the interest differential which leads to influx of speculative capital from foreign
countries that depreciates the effort of the central bank in a restrictive monetary policy;
The decreasing of the interest rate in order to stimulate investments can lead to reflux of the
capital to foreign countries that depreciates the effort of the central bank in an expansive
monetary policy;
The self-financing of investments by companies also contributes to the weakening of the
monetary policy with large companies usually self-financing their investments – i.e. out of the
undivided profit resulting in the part of economy spraining free from the immediate influence of
the monetary policy (in Czech, as well as in the Slovak Republic this factor was not very
important in the latter years since companies do not dispose of large amounts of capital);
The influence of the monetary policy have almost always delayed impact on the real product
and employment/unemployment in the economy (2-18 months), which is a strong argument
against the use of monetary instruments in the anti-cyclic policy.
The failure of the monetary policy in the time of recession can be imputed on one of the most
probable scenarios, this being the lowering of interest rates to such an extent that they become
Volume II, Chapter 10 Rastislav Kotulič, Jaroslava Hečková and Alexandra Chapčáková
186
completely insensitive to heightening of the money supply which is in theory usually labeled as the so
called “liquidity trap”. In this situation, economic subjects are willing to sustain all finances until their
real valorization or effective use. In such environment, the traditional expansive monetary policy is
ineffective according to the economic theory.
In the last 30 years of the 20th century, the relatively strong position in the economic policy
was held by monetarism. Currently, there is the view that precisely the effectively implemented
monetarist experiment of the USA during 1979-1982 which main goal was to determine the stable
growth of the money supply (the so called monetary rule) regardless of changeable conditions of
economy undermined the very effectiveness of the monetarism in the future. The speed of money in
circulation changed, thanks to the experiment, and became highly unstable till the point in the early
2000 when the Federal Reserve Fund in the USA ceased to implement “the monetary rule” for its
monetary policy (since monetarism anticipates a constant level of speed of money circulation, which is
unable to be ensured at present resulting in the shifting of the relatively compact theory into the
sphere of dead ideas).
In spite of the above-mentioned restrictions, the monetary policy is in principle the primary
instrument used in balancing economic cycles. The monetary policy uses other key macro-economic
variables, e.g. the progress of real and nominal production (the real and nominal GDP),
unemployment and the labor force indicator that significantly expose the state of the economy.
According to the macro-economic results, there is usually an illusion present that the
membership in the Eurozone itself absorbs the progress of the global recession. The successfulness
of the monetary policy in the solution of cyclic fluctuations of economy can encounter the above-
mentioned restrictions and other obstacles whether it is the national central bank or the European
Central Bank the one responsible for the monetary policy.
The admission to the Monetary Union will always be accompanied by discussions on
advantages and disadvantages of such country’s integration into the protection and monetary policy of
the European Central Bank. What prevails in the time of the current economic crisis cannot be
generalized and only time will show what formed an advantage (assets) and disadvantage (costs) for
the Slovak Republic.
In favor of the membership in the Eurozone speaks the fact that all countries admitted had to
rigidly fulfill the Maastricht Convergence Criteria leading to the medium-term guarantee of a healthy
and long-term sustainable economy.
10.5 References
[1] Baláž, P. et al. (2010). Medzinárodné podnikanie: Na vlne globalizujúcej sa svetovej ekonomiky. Bratislava: Sprint vfra, 2010, p. 465.
[2] Baldwin, R., Wyplosz, CH. (2008). Ekonomie evropské integrace. Praha: Grada Publishing, 2008. ISBN 978-80-247-1807-1.
[3] Benčík, M., Hajnovič, F., Strachotová, A., Šuster, M., Tözsér, T., Zeman, J. (2005). Odhad Balassa-Samuelsonovho efektu v ekonomike SR. Výskumná štúdia NBS, 2005.
[4] Boros, K. Čo prinesú svetu extrémne nízke úrokové sadzby? Finančný portál Hospodárskych novin [online]. [cit.5.9.2009]. Available at: http://boros.blog.hnonline.sk/c1-34391520-co-prinesu-svetu-extremne -nizke-urokove-sadzby.
Financial Aspects of Recent Trends in the Global Economy
187
[5] Cmorej, P. (2011). New Shape of Global Financial System (Selected Connections with a Wealth Polarization in the Globalized World). [Edícia Working Papers, WP no. 29]. Bratislava: Ekonomický ústav
SAV, 2011. ISSN 1337‐5598.
[6] Cornelius, P., Trimbur, T. (2000). Heterogeneous Policy Responses and the Risk of Monetary Disintegration in Europe. Deutsche Bank Research. RN-00-1 Frankfurt am Main: Deutsche Bank AG, January 2000.
[7] Fels, J. (2005). Euro at Risk. New York: Morgan Stanley - Global Economic Forum, 2005.
[8] Hečková, J. Chapčáková, A. (2012). Súčasnosť a perspektívy svetovej ekonomiky. 1st Edition. Košice: EQUILIBRIA, s. r. o., 2012. ISBN 978-80-8143-005-3.
[9] Frank, R., Bernanke H., B. S. (2003). Ekonomie. Praha: Grada Publishing, 804 p. ISBN 80-247-0471-4.
[10] Iša, J. (2008). Global Central Banking Systems - The Federal Reserve System and the Eurosystem. [Working Papers, WP no. 8]. Bratislava: Ekonomický ústav SAV, 2008.
[11] Iša, J., Okáli, I. (2008). European Monetary Union, Optimum Currency Area and Possible Effects of Slovakia’s Joining the Euro Area. In: Politická ekonomie, LVI (3): 318-344.
[12] Jurečka, V., Jánošíková, I. (2006). Makroekonómie. Ostrava: VŠB – TU Ostrava, 312 p. ISBN 80-248-530-8.
[13] Koderová, J., Sojka, M., Havel, J. (2008). Teorie peněz. Praha: ASPI, ISBN 978-80-7357-359-1.
[14] Komárek, L., Koprnická, K., Král, P. (2010). Long-Term Real Appreciation as the Phenomenon of Phenomenon of Economic Convergence. Politická ekonomie, 58(1): 70-91.
[15] Korda, J. (2010). Nonequilibrium on Money Market in the Endogenous Money Theory. Doktorská disertační práce. Praha: Vysoká škola ekonomická v Praze, 2010.
[16] Korda, J. (2010). Comparison of New Consensu as the Theoretical Framework of Inflation Targeting with Post-Keynesian Economics. Politická ekonomie, 5: 92 – 104.
[17] Kotlebová, J., Chovancová, B. (2010). Medzinárodné finančné centrá. Bratislava: Iura Edition, 2010, p. 150.
[18] Kotulič, R. (2010). Národná mena verzus európska menová únia v súčasnej hospodárskej kríze očami indikátorov trhu práce v Českej republike a Slovenskej republike. In: Zborník príspevkov z konferencií a seminárov Národného konventu o Európskej únii: Úrad vlády Slovenskej republiky, „Prvý rok SR v eurozóne“. Bratislava: Ševt, a.s., pp. 39-46. ISBN 978-80-8106-018-2.
[19] Krugman, P. Chvála veľkého štátu a veľkej vlády. In: Finančný portál Hospodárskych novin [online]. [cit. 5.9.2009]. Available at: http://m.hnonline.sk/c3-38096670-kw0000_d-krugman-chvala-velkeho-statu-a-velkej-vlady
[20] Kunešová, H., Cihelková, E. et al. (2006). Světová ekonomika: nové jevy a perspektivy. Praha: C. H. Beck, 2006, pp. 201 – 202.
[21] Lebiedzik, M. Tuleja, P., Pauhofová, I. (2008). The Comparison of Preparedness of the Czech Republic and Slovakia to Introduction of Euro. Ekonomický Časopis, 56(1): 22-38.
[22] Mirdala, R. (2008). Exchange Rate and output Vulnerability to Macroeconomic Shocks in Selected CEECs (SVAR Approach). Ekonomický Časopis, 56(8): 745-763.
[23] Muchová, E. (2008). Konvergencia v kontexte Hospodárskej a menovej únie. Nová Ekonomika, I(1– 2): 11–20.
[24] Palacková, D. (2007). Je Európska menová únia nezvratným projektom? Ekonomické Rozhľady, XXXVI(1): 124-135.
[25] Prescott, E.C. Transformation of Macroeconomic Policy and Research. Lesson of Nobel Prize holder of December 8, 2004. [online]. [cit. 24.11.2011]. Available at: http://www.nadaciatatrabanky.sk/files /upload/Prednaska%20prof%20 Prescotta.pdf.
[26] Scheller, H.K. (2006). The European Central Bank - History, Tasks and Functions. Frankfurt nad Mohanom: European Central Bank, 2006. ISBN: 978-92-899-0357-8.
Volume II, Chapter 10 Rastislav Kotulič, Jaroslava Hečková and Alexandra Chapčáková
188
[27] Samuelson, P.A., Nordhaus, W.D. (2004). Economics. New York: Mcgraw-Hill Education, 18 Ed. 2004, 832 p. ISBN 9780071239325.
[28] Scott, H.S. (1998). When the Euro falls apart. International Finance, 1(2): 207-228.
[29] Sojka, M. (2000). Post-Keynesian Economics. Politická Ekonomie, 5: 703-722.
[30] Sojka, M. (2010). Monetary policy of the European central bank and its theoretical bases from the point of view of Post-Keynesian economics. Politická Ekonomie, 1: 3–19.
[31] Sojka, M. Post-Keynesian Money Theory, Money and Credit Policy and the Position of Central Bank. Working paper No. 20. Praha: UK FSV – IES, 2002. [online]. [cit. 25.11.2011]. Available at: http://ies.fsv.cuni.cz/default/ file/download/id/683.
[32] Soukup, J. et al. (2007). Makroekonomie: Moderní přístup. (Macroeconomics: Modern approach). Praha: Management Press, ISBN 978-80-7261-174.
[33] Svoboda, M. (2001). Options of monetary control from the point of view of Post-Keynesian economics. Politická Ekonomie, 6: 797-811.
[34] Šíbl, D., Šáková, B. (2002). Svetová ekonomika. Bratislava: Spint vfra, 2002, p. 342, 343.
[35] Tomšík, V. 2009. Euro by Čechom v kríze nepomohlo. In: Finančný portál Hospodárskych novin [online]. [cit. 5.9.2009]. Available at: http://finweb.hnonline.sk/c3-38141700-kP0000_d-euro-by-cechom-v-krize-nepomohlo.
[36] Vladová, A. (2007). Pôsobenie Balassa-Samuelsonovho efektu v slovenskej ekonomike. Biatec, 15(11): 18 – 26.
[37] Vincúr, P. (2008). Vstup do menovej únie - vybrané aspekty a dôsledky pre hospodársku politiku Slovenskej republiky. Nová Ekonomika, I (1–2): 6–10.
*** European Central Bank: Annual Report 2010 [online]. [cit. 25.11.2011]. ISSN 1830-3005. Available at: http://www.nbs.sk/img/Documents/ecbpub/vs/ar2010sk.pdf .
*** European Central Bank: Convergence Report 2008 [online]. [cit.12.6.2012]. Available at: http://www.ecb. int/pub/convergence/html/index.en.html.
*** European Central Bank: Monthly bulletin September 2011 [online]. [cit.27.11.2011]. Available at: http://www.nbs.sk/img/Documents/ecbpub/vs/ar2010sk.pdf.

Financial Aspects of Recent Trends in the Global Economy
189
x
Chapter 11
FORCED CHANGES IN BANKS FINANCING GROWTH IN EAST EUROPEAN COUNTRIES
by Nebojsa SAVIC
University of Singidunum in Belegrade, Faculty of Economics, Finance and Administration,
Serbia
by Goran PITIC
University of Singidunum in Belegrade, Faculty of Economics, Finance and Administration,
Serbia
by Lidija BARJAKTAROVIC
University of Singidunum in Belegrade, Faculty of Economics, Finance and Administration,
Serbia
11.1 Introduction
11.2 Literature review
11.3 Methodology
11.4 Empirical results
11.5 References
Volume II, Chapter 11 Nebojsa Savic, Goran Pitic and Lidija Barjaktarovic
190
FORCED CHANGES IN BANKS FINANCING GROWTH IN EAST EUROPEAN COUNTRIES
Nebojsa SAVIC128
University of Singidunum in Belgrade
Faculty of Economics, Finance and Administration, Serbia
Goran PITIC129
University of Singidunum in Belgrade
Faculty of Economics, Finance and Administration, Serbia
Lidija BARJAKTAROVIC130
University of Singidunum in Belgrade
Faculty of Economics, Finance and Administration, Serbia
Abstract
The effects of the Great Recession so far had numerous negative consequences reflected primarily in
strong recession and rising unemployment. They have varied from country to country and from region to
region. The sample of the analyzed countries includes: the group of eight Central and East European (CEE-8)
countries (the Czech Republic, Estonia, Hungary, Latvia, Lithuania, Poland, Slovakia and Slovenia) and the
group of eight South East European (SEE-8) countries (Albania, Bosnia and Herzegovina, Bulgaria, Croatia,
FYR Macedonia, Montenegro, Romania and Serbia). The experience during the Great Recession shows that
excessive reliance on foreign capital inflows makes a country vulnerable. For CEE-8 and SEE-8 it is very
important to increase domestic savings. Due to the lack of domestic sources of financing banks in CEE-8 and
SEE-8 were faced with the following alternatives: to opt for the equity financing of their subsidiaries or for debt
financing arrangements through cross-border credits (CBCs). Banks opted for CBCs, because it was not
covered by the provision to deposit required reserves (RR). This also suited banks’ head offices because, due
to the crisis, they also had to consolidate their balances and ensure the appropriate level of capital adequacy.
The analyses show that CEE-8 and, in particular, SEE-8 are heavily dependent on the availability of
foreign sources of finance. During the crisis lending interest rates (LIRs) in CEE-8 declined from 8.24% to
6.64% and in SEE-8 countries from 11.50% to 11.00%. In each group are five countries which succeeded in
reducing LIRs during the crisis period and the two ones which increased them (Slovenia and Slovakia in CEE-
8, and Serbia and Bosnia and Herzegovina in SEE-8. During the Great Recession, changes of LIRs were
mostly influenced by credit risk, required reserves and withholding tax.
Keywords: country risk, interest rate, foreign source of financing, European emerging markets
128 Nebojsa Savic, Professor at University of Singidunum in Belegrade, Faculty of Economics, Finance and Administration, Bulevar
Vojvode Mišića 43, Beograd, Serbia 129 Goran Pitic, Professor at University of Singidunum in Belegrade, Faculty of Economics, Finance and Administration, Bulevar
Vojvode Mišića 43, Beograd, Serbia 130 Lidija Barjaktarovic, Professor at University of Singidunum in Belegrade, Faculty of Economics, Finance and Administration,
Bulevar Vojvode Mišića 43, Beograd, Serbia
Financial Aspects of Recent Trends in the Global Economy
191
11.1 Introduction
The effects of the Great Recession affecting the world economy since 2008 have so far had
numerous negative consequences reflected primarily in strong recession and rising unemployment.
They have varied from country to country and from region to region.
In those processes, Central (CEE) and South East Europe (SEE), as the European emerging
markets (EEM), have experienced very difficult times. Although CEE and SEE countries recorded a
GDP growth of 3.56% during the analyzed period (2001-2011), their GDP declined by -0.72% during
the crisis (2009-2011).
The sample of the analyzed countries includes two groups of countries: the group of eight
Central and East European (CEE-8) countries (the Czech Republic, Estonia, Hungary, Latvia,
Lithuania, Poland, Slovakia and Slovenia) and the group of eight South East European (SEE-8)
countries (Albania, Bosnia and Herzegovina, Bulgaria, Croatia, FYR Macedonia, Montenegro,
Romania and Serbia).
In these countries, during the analyzed period the level of gross national savings was about
15% of GDP on average, while the level of gross domestic savings was about 8% of GDP or, in other
words, it was lower by about 7 percentage points (pp). Since CEE-8 and SEE-8 countries were trying
to catch up with the EU, it was necessary to achieve high GDP growth rates and thus there was a
pronounced need for investment. According to the IMF (2012) and UNCTAD (2011) data, the rate of
capital formation in these countries was about 25-30% of GDP. Thus, the difference between
available savings and investments had to be covered using foreign sources of finance, primarily the
inflow of foreign direct investments (FDIs), cross-border credits (CBCs), portfolio investment (PIs) and
workers’ remittances (REMs).
Since both groups of countries relied on foreign sources of finance during the past decade, the
aim of this chapter was to analyze the causes of changes of importance of various foreign sources of
financing in the analyzed period. The need to analyze CBCs, in particular, was derived from the fact
that they represented the largest source used by banks to grant credit (Savić, Barjaktarović and S.
Konjikušić, 2012). In this regard, we will especially analyze the levels of deposit and lending interest
rates, and their structures.
11.2 Literature review
The sudden stops of foreign capital inflow exposed these countries to the unexpected risks of
asymmetric reduction in their access to credit and uneven availability of government policy and fiscal
support during the crisis (Vujovic et al. 2011). According Josifidis et al. (2011), CEE countries with
rigid exchange rate regimes (Baltic countries) were forced to accept internal devaluation,
accompanied by significant output and employment losses. On the other hand, CEE countries with
flexible regimes allowed significant currency depreciations, thus accepting the role of exchange rate
as a shock absorber. Savić (2012) argued that the current economic crisis pointed to an even greater
need to improve competitiveness on the road to increase employment and GDP per capita.
Allen and associates (2011) argued that the key benefit of CBCs was reflected in the effects of
the diversification of bank assets, so that they were increasingly less exposed to country-specific
Volume II, Chapter 11 Nebojsa Savic, Goran Pitic and Lidija Barjaktarovic
192
shocks. This also reduced the risks caused by non-performing loans (NPL). When domestic banks are
hit by some shock, foreign bank presence can have a stabilizing effect on the credit market. All things
considered, foreign banks and CBCs were the drivers of financial deepening and credit boom. CBCs
in the euro zone amounted to €152 billion in 1999 and to €361 billion in 2006, thus accounting for
about 5% of GDP in CBCs lender countries and for 10% of GDP in CBCs borrower countries.
Revoltella and Mucci (2011: 67-68) argued that the evolution of cross-border lending revealed
that the group of countries characterized by a high degree of foreign ownership and presence of large
international players, experienced a relatively higher stability of CBCS inflows relative to countries with
a smaller presence of foreign banks (e.g. Russia, Turkey and Kazakhstan). It is an indirect proof that
international banks generally do have a long-term horizon in funding their local CEE-8 and SEE-8
subsidiaries.
According to Calvo (2006: 2), the reason why banking crises have greater and more persistent
effects on developing economies and countries in Eastern Europe lies in the fact that these countries
are more vulnerable to a sudden stop of capital inflows.
Simor (2011: 27) gave evidence that the inflow of CBCs offered tremendous opportunities for
Western banks to earn outstanding profits across Eastern Europe. During the period 2004-2008, the
average ROE of banks in the EU was 15%; in some East European countries (the Czech Republic,
Bulgaria, Estonia, Poland, Hungary, Latvia), it was higher than 20%, while in some other ones
(Lithuania, Romania and Slovakia) it was higher than 15%.
According to Takáts (2010: 49-51), supply factors drove a fall in CBCs to emerging markets
during the crisis. The demand for CBCs also declined, but it played a much smaller role. This
contrasts to a much more balanced impact before the crisis. A 1% increase in output is associated
with about 0.2% higher CBCs.
Countries that relied to a greater extent on external funding seemed to grow faster than other
East European Countries. However, the crisis showed that countries with higher debt suffered much
more severely during the crisis and that they would continue to do so after the crisis, as opposed to
countries that had not built up such a large debt (Simor, 2011:29).
The experience during the Great Recession shows that excessive reliance on foreign capital
inflows makes a country vulnerable. For CEE-8 and SEE-8 it is very important to increase domestic
savings, reduce fiscal expenditures, eliminate crowding-out effects and deepen the domestic capital
market, so that commercial banks can rely to a greater extent on long-term funding in local market.
Before the start of the Great Recession financial markets were characterized by the presence
of strong CBC flows to Europe’s emerging markets just due to the described lack of savings in those
countries. When the crisis started in 2008, banks opted to a greater extent for an increase in deposit
interest rates (DIRs) with a view to encouraging savings and collecting the greatest possible amount
of deposits. However, since they were increasing DIRs, they were forced to increase lending interest
rates (LIRs) as well. This increase in LIRs under crisis conditions, which implies a decrease in
aggregate demand and lower capacity utilization, coupled with an increase in speculative investments,
brought about an increase in non-performing loans (NPLs) and standard risk cost (SRC), which was
also reflected in a decrease on the return on equity (ROE), coupled with an increase in the cost of
income. The result was a significant aggravation of the performance of the banking industry. Since
Financial Aspects of Recent Trends in the Global Economy
193
such a situation was unsustainable, the banking industry nowadays embarks on the adjustment
process by decreasing DIRs so as to confine the operating costs within long-term sustainable limits.
Due to the lack of domestic sources of development finance, banks in CEE-8 and SEE-8 were
faced with the following decision alternatives: to opt for the equity financing of their subsidiaries or for
debt financing arrangements through CBCs. Banks opted for the latter channel, through CBCs,
because it was not covered by the provision to deposit required reserves. This also suited banks’
head offices because, due to the crisis, they also had to consolidate their balances and ensure the
appropriate level of capital adequacy.
Bearing all this in mind, we tested the following two hypotheses in our chapter:
H1: Due to insufficient savings, CEE-8 and SEE-8 were forced to attract the foreign sources of
financing, including CBCs, and
H2: Apart from the EB, the levels of country risk (CR), required reserves (RR) and withholding tax
(WHT) had the greatest influence on changing the sources of financing in CEE-8 and SEE-8.
11.3 Methodology
The sample of the analyzed EEM countries consists of eight Central and East European
countries (CEE-8) and eight South East European countries (SEE-8). The data used in this chapter
were taken from the World Bank, IMF, central banks of the observed countries, Euromoney,
Bloomberg, Reuters and Deloitte. The following series were analyzed: lending interest rates (LIR),
deposit interest rates (DIR), Euribor (EB) as the ECB refinancing rate - minimum bid rate which banks
have to pay when they borrow money from the ECB, country risk (CR) - a collection of risks
associated with investing in a foreign country, which include political risk, exchange rate risk,
economic risk, sovereign risk and transfer risk (the risk of capital being locked up or frozen by
government action), withholding tax (WHT) - tax paid directly to the government, and non-performing
loans (NPL).
For purposes of this analysis the structure of CBC interest rates consists of the basic part (BP)
and spread, i.e. credit margin (CM), which is the portion of the interest rate retained as profit by the
CBC lender country:
LIR = BP + CM (11.1)
The basic part (BP) consists of:
BP = EB + FS + CR (11.2)
or, more precisely, the sum of the Euribor (EB), funding spread (FS), which represents the bank’s
profit from which the inflow of CBCs is generated, and country risk (CR) of the country for which CBCs
are intended.
The credit margin (CM) consists of:
CM = WHT + RR + SRC + PM (11.3)
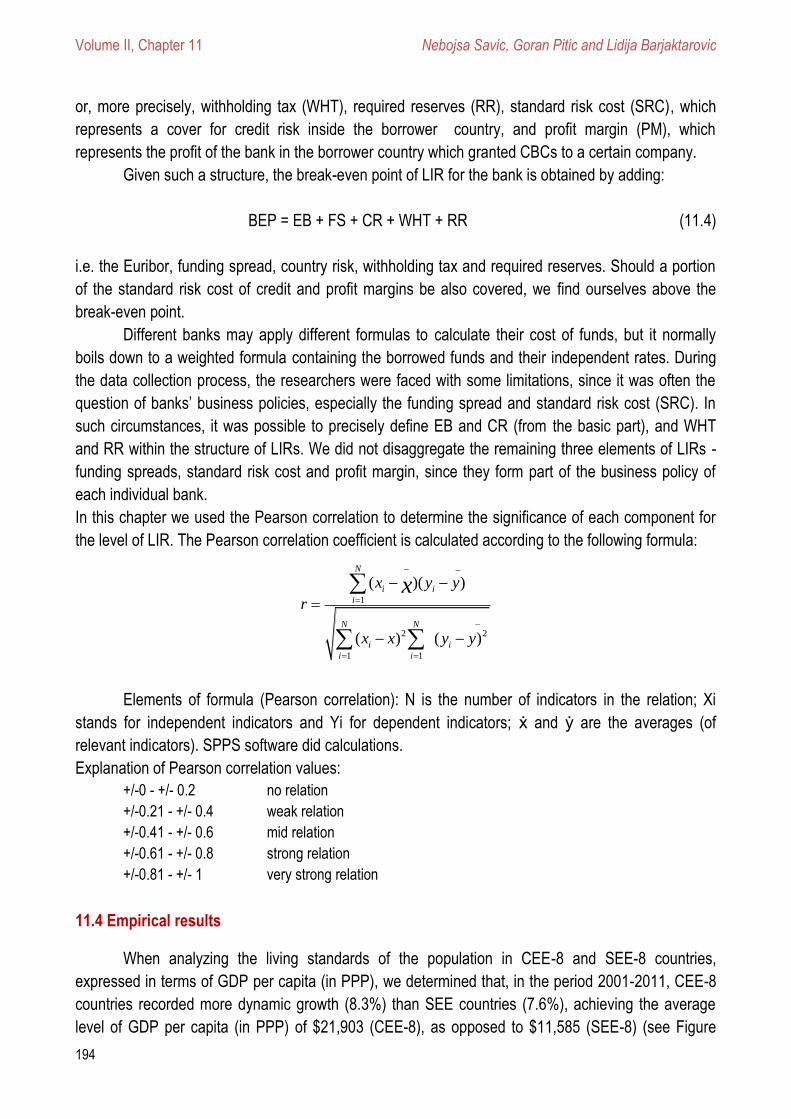
Volume II, Chapter 11 Nebojsa Savic, Goran Pitic and Lidija Barjaktarovic
194
or, more precisely, withholding tax (WHT), required reserves (RR), standard risk cost (SRC), which
represents a cover for credit risk inside the borrower country, and profit margin (PM), which
represents the profit of the bank in the borrower country which granted CBCs to a certain company.
Given such a structure, the break-even point of LIR for the bank is obtained by adding:
BEP = EB + FS + CR + WHT + RR (11.4)
i.e. the Euribor, funding spread, country risk, withholding tax and required reserves. Should a portion
of the standard risk cost of credit and profit margins be also covered, we find ourselves above the
break-even point.
Different banks may apply different formulas to calculate their cost of funds, but it normally
boils down to a weighted formula containing the borrowed funds and their independent rates. During
the data collection process, the researchers were faced with some limitations, since it was often the
question of banks’ business policies, especially the funding spread and standard risk cost (SRC). In
such circumstances, it was possible to precisely define EB and CR (from the basic part), and WHT
and RR within the structure of LIRs. We did not disaggregate the remaining three elements of LIRs -
funding spreads, standard risk cost and profit margin, since they form part of the business policy of
each individual bank.
In this chapter we used the Pearson correlation to determine the significance of each component for
the level of LIR. The Pearson correlation coefficient is calculated according to the following formula:
1
2 2
1 1
( )( )
( ) ( )
N
i i
i
N N
i i
i i
x y y
r
x x y y
x
Elements of formula (Pearson correlation): N is the number of indicators in the relation; Xi
stands for independent indicators and Yi for dependent indicators; ẋ and ẏ are the averages (of
relevant indicators). SPPS software did calculations.
Explanation of Pearson correlation values:
+/-0 - +/- 0.2 no relation
+/-0.21 - +/- 0.4 weak relation
+/-0.41 - +/- 0.6 mid relation
+/-0.61 - +/- 0.8 strong relation
+/-0.81 - +/- 1 very strong relation
11.4 Empirical results
When analyzing the living standards of the population in CEE-8 and SEE-8 countries,
expressed in terms of GDP per capita (in PPP), we determined that, in the period 2001-2011, CEE-8
countries recorded more dynamic growth (8.3%) than SEE countries (7.6%), achieving the average
level of GDP per capita (in PPP) of $21,903 (CEE-8), as opposed to $11,585 (SEE-8) (see Figure
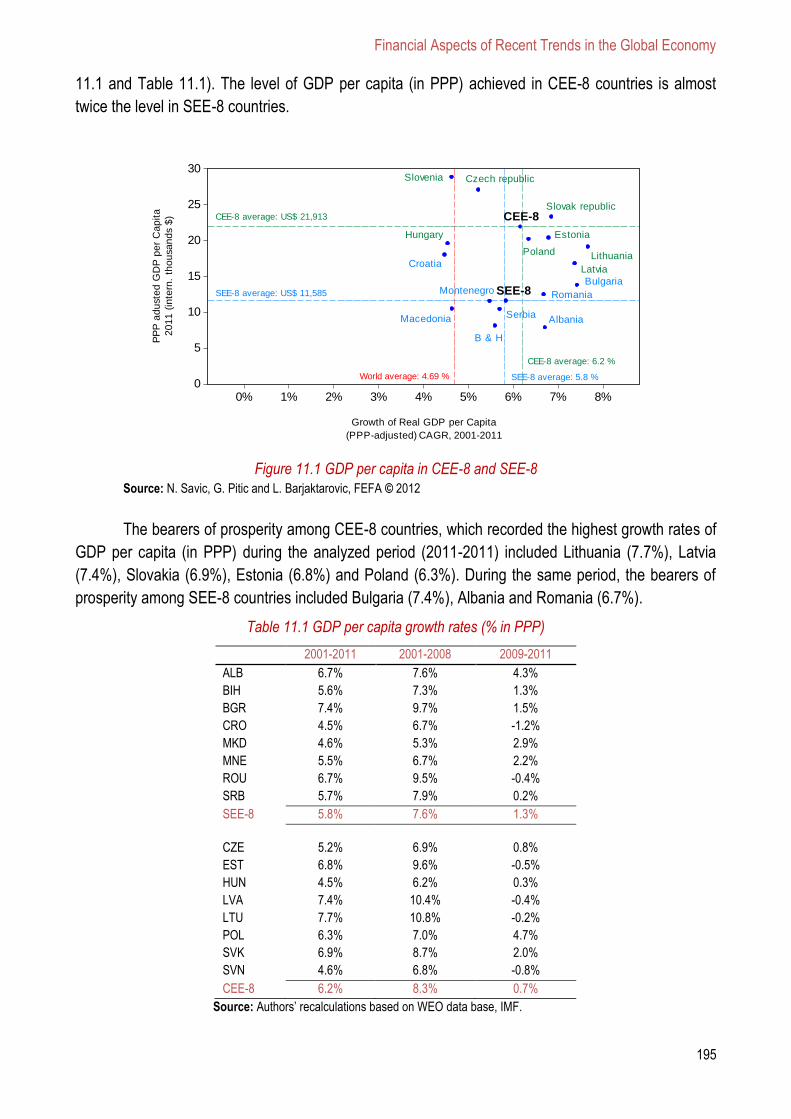
Financial Aspects of Recent Trends in the Global Economy
195
11.1 and Table 11.1). The level of GDP per capita (in PPP) achieved in CEE-8 countries is almost
twice the level in SEE-8 countries.
Figure 11.1 GDP per capita in CEE-8 and SEE-8
Source: N. Savic, G. Pitic and L. Barjaktarovic, FEFA © 2012
The bearers of prosperity among CEE-8 countries, which recorded the highest growth rates of
GDP per capita (in PPP) during the analyzed period (2011-2011) included Lithuania (7.7%), Latvia
(7.4%), Slovakia (6.9%), Estonia (6.8%) and Poland (6.3%). During the same period, the bearers of
prosperity among SEE-8 countries included Bulgaria (7.4%), Albania and Romania (6.7%).
Table 11.1 GDP per capita growth rates (% in PPP)
2001-2011 2001-2008 2009-2011
ALB 6.7% 7.6% 4.3%
BIH 5.6% 7.3% 1.3%
BGR 7.4% 9.7% 1.5%
CRO 4.5% 6.7% -1.2%
MKD 4.6% 5.3% 2.9%
MNE 5.5% 6.7% 2.2%
ROU 6.7% 9.5% -0.4%
SRB 5.7% 7.9% 0.2%
SEE-8 5.8% 7.6% 1.3%
CZE 5.2% 6.9% 0.8%
EST 6.8% 9.6% -0.5%
HUN 4.5% 6.2% 0.3%
LVA 7.4% 10.4% -0.4%
LTU 7.7% 10.8% -0.2%
POL 6.3% 7.0% 4.7%
SVK 6.9% 8.7% 2.0%
SVN 4.6% 6.8% -0.8%
CEE-8 6.2% 8.3% 0.7%
Source: Authors’ recalculations based on WEO data base, IMF.
0
5
10
15
20
25
30
0% 1% 2% 3% 4% 5% 6% 7% 8%
Growth of Real GDP per Capita
(PPP-adjusted) CAGR, 2001-2011
PP
P a
du
ste
d G
DP
pe
r C
ap
ita
20
11
(in
tern
. th
ou
sa
nd
s $
) CEE-8 average: US$ 21,913
SEE-8 average: US$ 11,585
World average: 4.69 % SEE-8 average: 5.8 %
CEE-8 average: 6.2 %
Slovenia Czech republic
Slovak republicCEE-8
Poland
Estonia
Lithuania
Latvia
Hungary
Croatia
Macedonia
Montenegro SEE-8 Romania
Bulgaria
Albania
B & H
Serbia
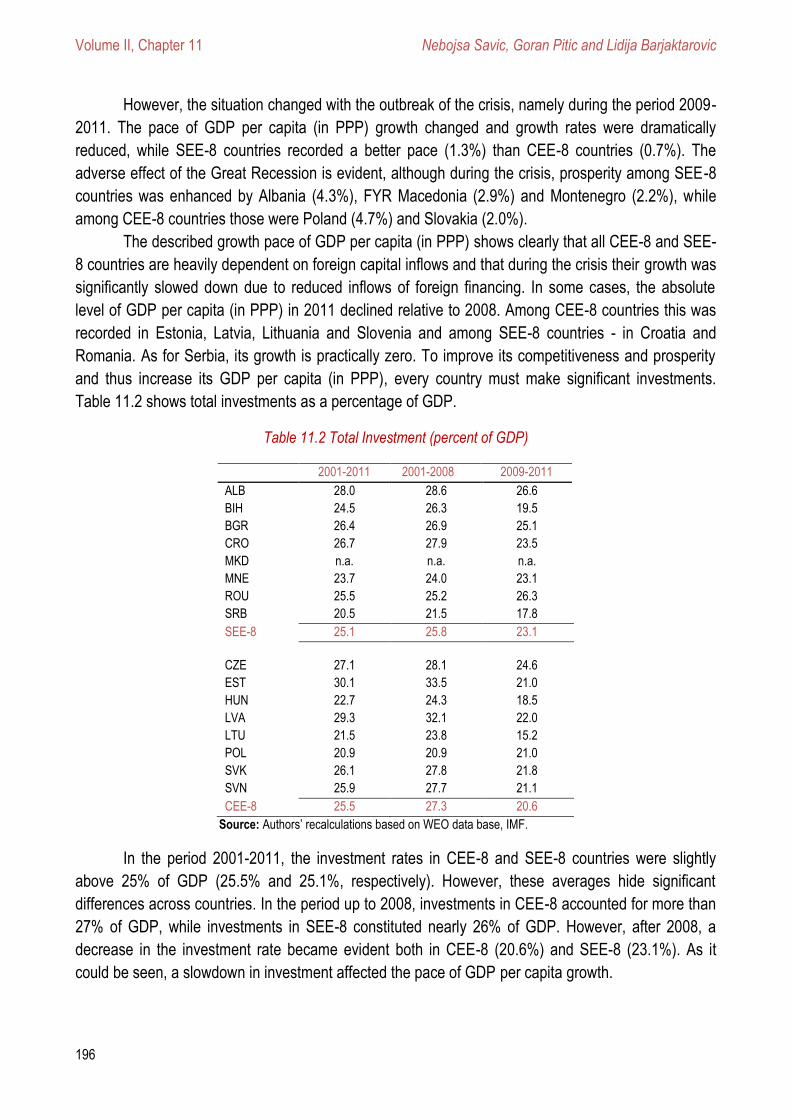
Volume II, Chapter 11 Nebojsa Savic, Goran Pitic and Lidija Barjaktarovic
196
However, the situation changed with the outbreak of the crisis, namely during the period 2009-
2011. The pace of GDP per capita (in PPP) growth changed and growth rates were dramatically
reduced, while SEE-8 countries recorded a better pace (1.3%) than CEE-8 countries (0.7%). The
adverse effect of the Great Recession is evident, although during the crisis, prosperity among SEE-8
countries was enhanced by Albania (4.3%), FYR Macedonia (2.9%) and Montenegro (2.2%), while
among CEE-8 countries those were Poland (4.7%) and Slovakia (2.0%).
The described growth pace of GDP per capita (in PPP) shows clearly that all CEE-8 and SEE-
8 countries are heavily dependent on foreign capital inflows and that during the crisis their growth was
significantly slowed down due to reduced inflows of foreign financing. In some cases, the absolute
level of GDP per capita (in PPP) in 2011 declined relative to 2008. Among CEE-8 countries this was
recorded in Estonia, Latvia, Lithuania and Slovenia and among SEE-8 countries - in Croatia and
Romania. As for Serbia, its growth is practically zero. To improve its competitiveness and prosperity
and thus increase its GDP per capita (in PPP), every country must make significant investments.
Table 11.2 shows total investments as a percentage of GDP.
Table 11.2 Total Investment (percent of GDP)
2001-2011 2001-2008 2009-2011
ALB 28.0 28.6 26.6
BIH 24.5 26.3 19.5
BGR 26.4 26.9 25.1
CRO 26.7 27.9 23.5
MKD n.a. n.a. n.a.
MNE 23.7 24.0 23.1
ROU 25.5 25.2 26.3
SRB 20.5 21.5 17.8
SEE-8 25.1 25.8 23.1
CZE 27.1 28.1 24.6
EST 30.1 33.5 21.0
HUN 22.7 24.3 18.5
LVA 29.3 32.1 22.0
LTU 21.5 23.8 15.2
POL 20.9 20.9 21.0
SVK 26.1 27.8 21.8
SVN 25.9 27.7 21.1
CEE-8 25.5 27.3 20.6
Source: Authors’ recalculations based on WEO data base, IMF.
In the period 2001-2011, the investment rates in CEE-8 and SEE-8 countries were slightly
above 25% of GDP (25.5% and 25.1%, respectively). However, these averages hide significant
differences across countries. In the period up to 2008, investments in CEE-8 accounted for more than
27% of GDP, while investments in SEE-8 constituted nearly 26% of GDP. However, after 2008, a
decrease in the investment rate became evident both in CEE-8 (20.6%) and SEE-8 (23.1%). As it
could be seen, a slowdown in investment affected the pace of GDP per capita growth.
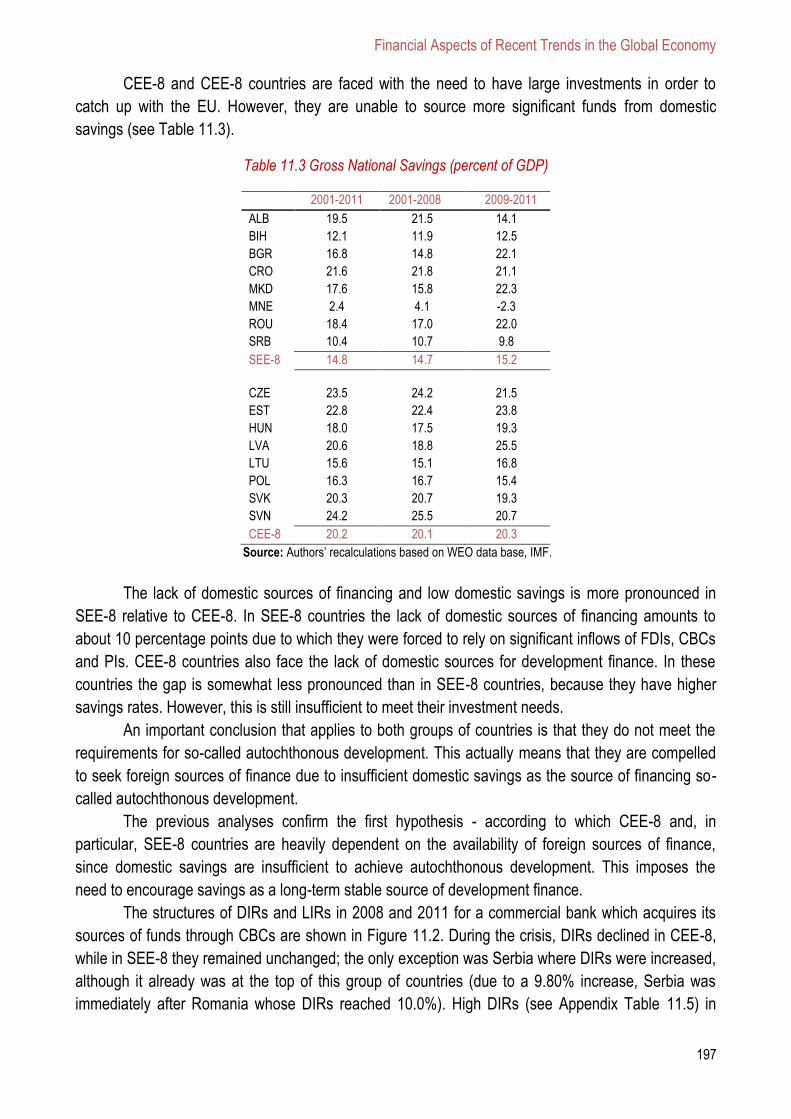
Financial Aspects of Recent Trends in the Global Economy
197
CEE-8 and CEE-8 countries are faced with the need to have large investments in order to
catch up with the EU. However, they are unable to source more significant funds from domestic
savings (see Table 11.3).
Table 11.3 Gross National Savings (percent of GDP)
2001-2011 2001-2008 2009-2011
ALB 19.5 21.5 14.1
BIH 12.1 11.9 12.5
BGR 16.8 14.8 22.1
CRO 21.6 21.8 21.1
MKD 17.6 15.8 22.3
MNE 2.4 4.1 -2.3
ROU 18.4 17.0 22.0
SRB 10.4 10.7 9.8
SEE-8 14.8 14.7 15.2
CZE 23.5 24.2 21.5
EST 22.8 22.4 23.8
HUN 18.0 17.5 19.3
LVA 20.6 18.8 25.5
LTU 15.6 15.1 16.8
POL 16.3 16.7 15.4
SVK 20.3 20.7 19.3
SVN 24.2 25.5 20.7
CEE-8 20.2 20.1 20.3
Source: Authors’ recalculations based on WEO data base, IMF.
The lack of domestic sources of financing and low domestic savings is more pronounced in
SEE-8 relative to CEE-8. In SEE-8 countries the lack of domestic sources of financing amounts to
about 10 percentage points due to which they were forced to rely on significant inflows of FDIs, CBCs
and PIs. CEE-8 countries also face the lack of domestic sources for development finance. In these
countries the gap is somewhat less pronounced than in SEE-8 countries, because they have higher
savings rates. However, this is still insufficient to meet their investment needs.
An important conclusion that applies to both groups of countries is that they do not meet the
requirements for so-called autochthonous development. This actually means that they are compelled
to seek foreign sources of finance due to insufficient domestic savings as the source of financing so-
called autochthonous development.
The previous analyses confirm the first hypothesis - according to which CEE-8 and, in
particular, SEE-8 countries are heavily dependent on the availability of foreign sources of finance,
since domestic savings are insufficient to achieve autochthonous development. This imposes the
need to encourage savings as a long-term stable source of development finance.
The structures of DIRs and LIRs in 2008 and 2011 for a commercial bank which acquires its
sources of funds through CBCs are shown in Figure 11.2. During the crisis, DIRs declined in CEE-8,
while in SEE-8 they remained unchanged; the only exception was Serbia where DIRs were increased,
although it already was at the top of this group of countries (due to a 9.80% increase, Serbia was
immediately after Romania whose DIRs reached 10.0%). High DIRs (see Appendix Table 11.5) in
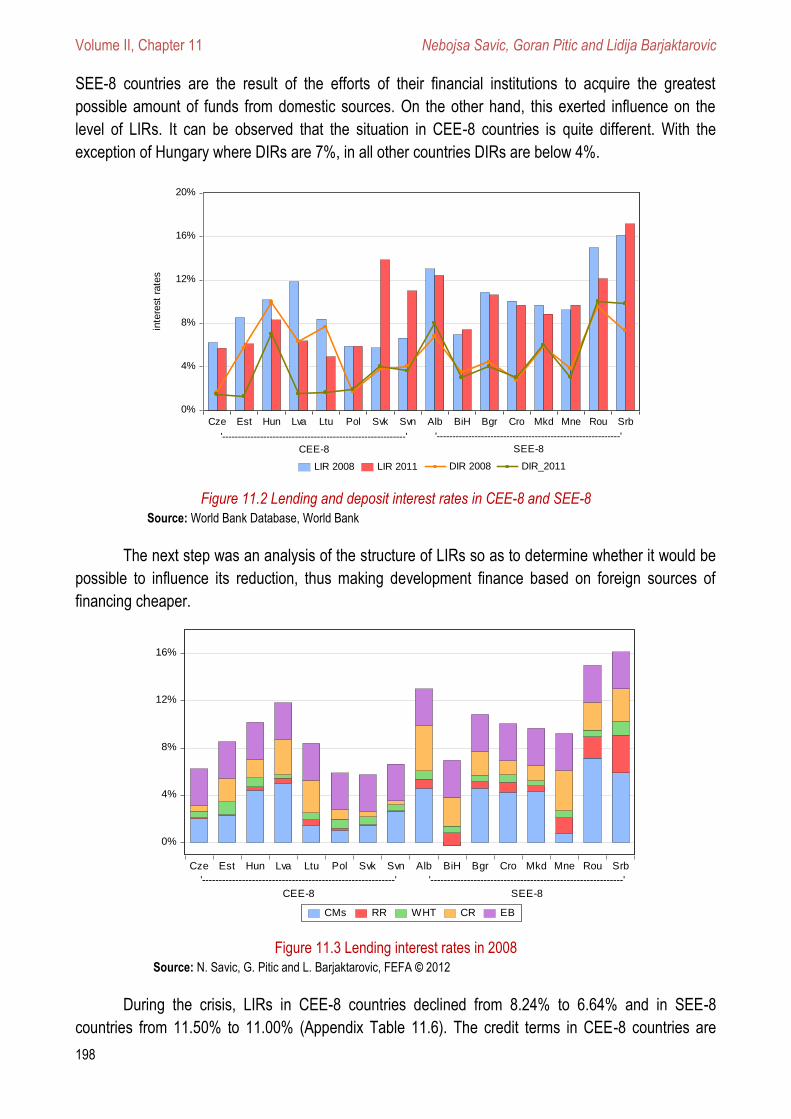
Volume II, Chapter 11 Nebojsa Savic, Goran Pitic and Lidija Barjaktarovic
198
SEE-8 countries are the result of the efforts of their financial institutions to acquire the greatest
possible amount of funds from domestic sources. On the other hand, this exerted influence on the
level of LIRs. It can be observed that the situation in CEE-8 countries is quite different. With the
exception of Hungary where DIRs are 7%, in all other countries DIRs are below 4%.
Figure 11.2 Lending and deposit interest rates in CEE-8 and SEE-8
Source: World Bank Database, World Bank
The next step was an analysis of the structure of LIRs so as to determine whether it would be
possible to influence its reduction, thus making development finance based on foreign sources of
financing cheaper.
Figure 11.3 Lending interest rates in 2008 Source: N. Savic, G. Pitic and L. Barjaktarovic, FEFA © 2012
During the crisis, LIRs in CEE-8 countries declined from 8.24% to 6.64% and in SEE-8
countries from 11.50% to 11.00% (Appendix Table 11.6). The credit terms in CEE-8 countries are
0%
4%
8%
12%
16%
20%
Cze Est Hun Lva Ltu Pol Svk Svn Alb BiH Bgr Cro Mkd Mne Rou Srb
LIR 2008 LIR 2011
inte
rest
rate
s
'----------------------------------------------------------'
CEE-8
'----------------------------------------------------------'
SEE-8
DIR 2008 DIR_2011
0%
4%
8%
12%
16%
Cze Est Hun Lva Ltu Pol Svk Svn Alb BiH Bgr Cro Mkd Mne Rou Srb
CMs RR WHT CR EB
'----------------------------------------------------------'
CEE-8
'----------------------------------------------------------'
SEE-8
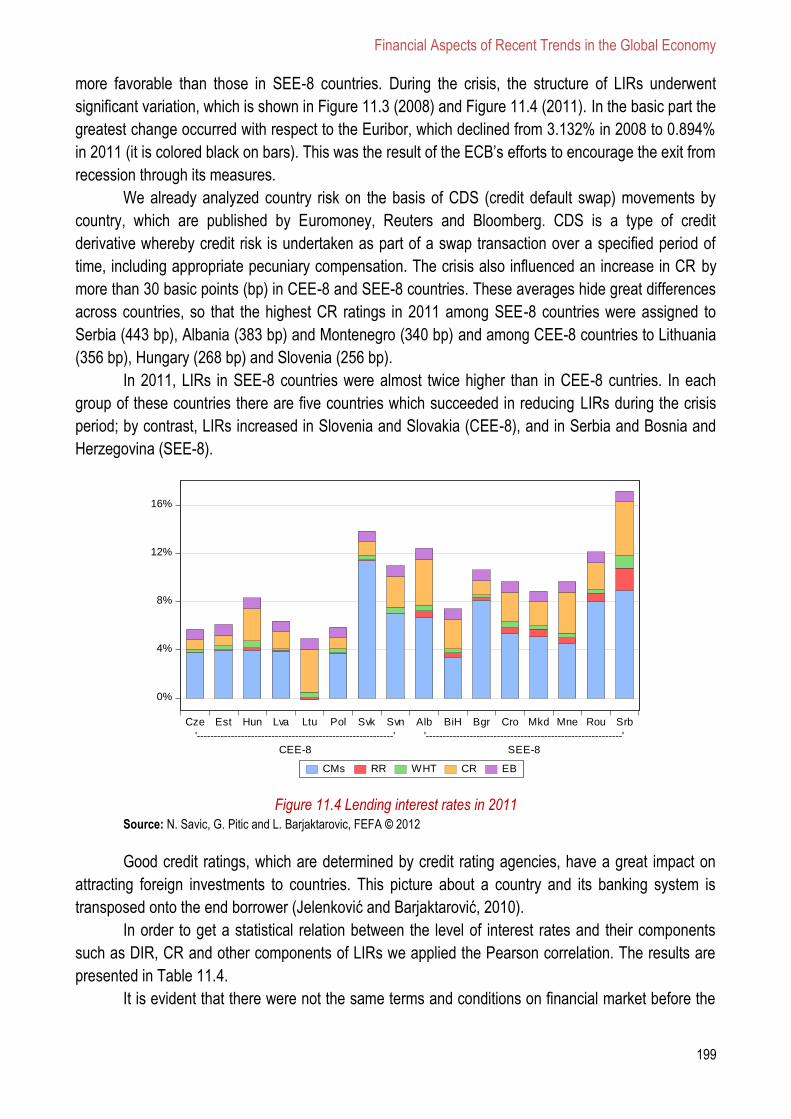
Financial Aspects of Recent Trends in the Global Economy
199
more favorable than those in SEE-8 countries. During the crisis, the structure of LIRs underwent
significant variation, which is shown in Figure 11.3 (2008) and Figure 11.4 (2011). In the basic part the
greatest change occurred with respect to the Euribor, which declined from 3.132% in 2008 to 0.894%
in 2011 (it is colored black on bars). This was the result of the ECB’s efforts to encourage the exit from
recession through its measures.
We already analyzed country risk on the basis of CDS (credit default swap) movements by
country, which are published by Euromoney, Reuters and Bloomberg. CDS is a type of credit
derivative whereby credit risk is undertaken as part of a swap transaction over a specified period of
time, including appropriate pecuniary compensation. The crisis also influenced an increase in CR by
more than 30 basic points (bp) in CEE-8 and SEE-8 countries. These averages hide great differences
across countries, so that the highest CR ratings in 2011 among SEE-8 countries were assigned to
Serbia (443 bp), Albania (383 bp) and Montenegro (340 bp) and among CEE-8 countries to Lithuania
(356 bp), Hungary (268 bp) and Slovenia (256 bp).
In 2011, LIRs in SEE-8 countries were almost twice higher than in CEE-8 cuntries. In each
group of these countries there are five countries which succeeded in reducing LIRs during the crisis
period; by contrast, LIRs increased in Slovenia and Slovakia (CEE-8), and in Serbia and Bosnia and
Herzegovina (SEE-8).
Figure 11.4 Lending interest rates in 2011 Source: N. Savic, G. Pitic and L. Barjaktarovic, FEFA © 2012
Good credit ratings, which are determined by credit rating agencies, have a great impact on
attracting foreign investments to countries. This picture about a country and its banking system is
transposed onto the end borrower (Jelenković and Barjaktarović, 2010).
In order to get a statistical relation between the level of interest rates and their components
such as DIR, CR and other components of LIRs we applied the Pearson correlation. The results are
presented in Table 11.4.
It is evident that there were not the same terms and conditions on financial market before the
0%
4%
8%
12%
16%
Cze Est Hun Lva Ltu Pol Svk Svn Alb BiH Bgr Cro Mkd Mne Rou Srb
CMs RR WHT CR EB
'----------------------------------------------------------'
CEE-8
'----------------------------------------------------------'
SEE-8
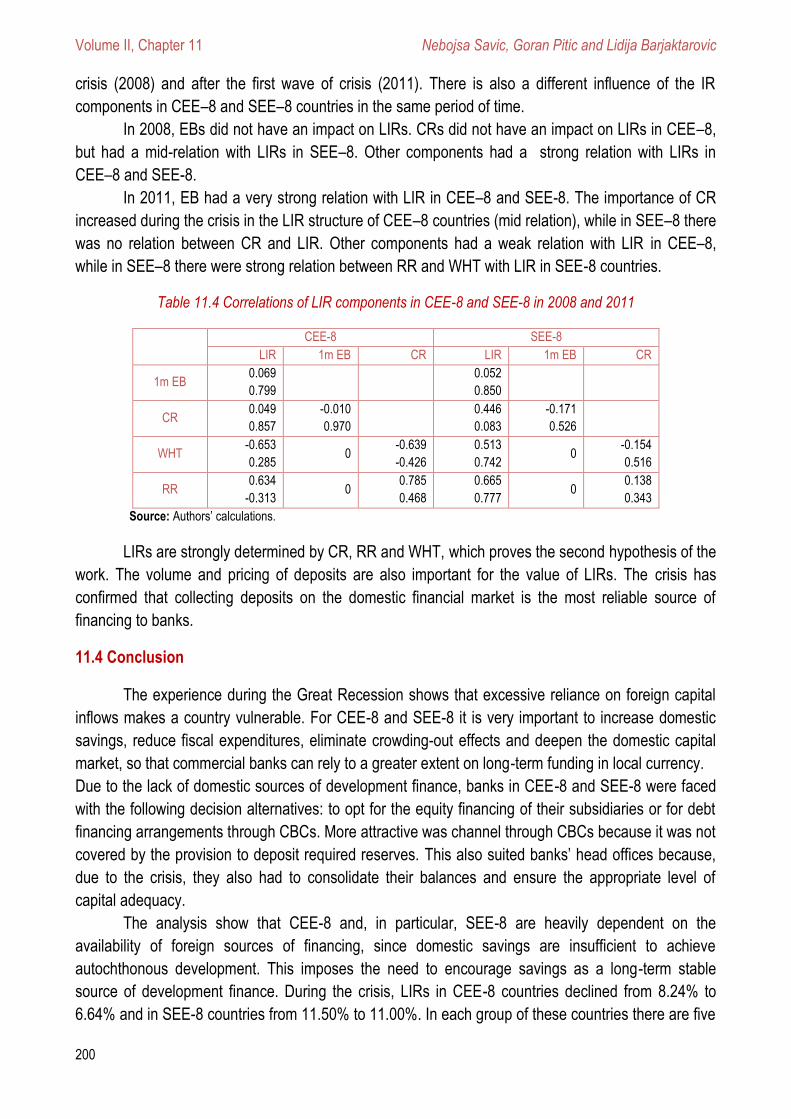
Volume II, Chapter 11 Nebojsa Savic, Goran Pitic and Lidija Barjaktarovic
200
crisis (2008) and after the first wave of crisis (2011). There is also a different influence of the IR
components in CEE–8 and SEE–8 countries in the same period of time.
In 2008, EBs did not have an impact on LIRs. CRs did not have an impact on LIRs in CEE–8,
but had a mid-relation with LIRs in SEE–8. Other components had a strong relation with LIRs in
CEE–8 and SEE-8.
In 2011, EB had a very strong relation with LIR in CEE–8 and SEE-8. The importance of CR
increased during the crisis in the LIR structure of CEE–8 countries (mid relation), while in SEE–8 there
was no relation between CR and LIR. Other components had a weak relation with LIR in CEE–8,
while in SEE–8 there were strong relation between RR and WHT with LIR in SEE-8 countries.
Table 11.4 Correlations of LIR components in CEE-8 and SEE-8 in 2008 and 2011
CEE-8 SEE-8
LIR 1m EB CR LIR 1m EB CR
1m EB 0.069
0.799
0.052
0.850
CR 0.049
0.857
-0.010
0.970
0.446
0.083
-0.171
0.526
WHT -0.653
0.285 0
-0.639
-0.426
0.513
0.742 0
-0.154
0.516
RR 0.634
-0.313 0
0.785
0.468
0.665
0.777 0
0.138
0.343
Source: Authors’ calculations.
LIRs are strongly determined by CR, RR and WHT, which proves the second hypothesis of the
work. The volume and pricing of deposits are also important for the value of LIRs. The crisis has
confirmed that collecting deposits on the domestic financial market is the most reliable source of
financing to banks.
11.4 Conclusion
The experience during the Great Recession shows that excessive reliance on foreign capital
inflows makes a country vulnerable. For CEE-8 and SEE-8 it is very important to increase domestic
savings, reduce fiscal expenditures, eliminate crowding-out effects and deepen the domestic capital
market, so that commercial banks can rely to a greater extent on long-term funding in local currency.
Due to the lack of domestic sources of development finance, banks in CEE-8 and SEE-8 were faced
with the following decision alternatives: to opt for the equity financing of their subsidiaries or for debt
financing arrangements through CBCs. More attractive was channel through CBCs because it was not
covered by the provision to deposit required reserves. This also suited banks’ head offices because,
due to the crisis, they also had to consolidate their balances and ensure the appropriate level of
capital adequacy.
The analysis show that CEE-8 and, in particular, SEE-8 are heavily dependent on the
availability of foreign sources of financing, since domestic savings are insufficient to achieve
autochthonous development. This imposes the need to encourage savings as a long-term stable
source of development finance. During the crisis, LIRs in CEE-8 countries declined from 8.24% to
6.64% and in SEE-8 countries from 11.50% to 11.00%. In each group of these countries there are five
Financial Aspects of Recent Trends in the Global Economy
201
countries which succeeded in reducing LIRs during the crisis period; by contrast, LIRs increased in
Slovenia and Slovakia (CEE-8), and in Serbia and Bosnia and Herzegovina (SEE-8). During the Great
Recession, changes of LIRs were mostly influenced by credit risk, required reserves and withholding
tax.
11.5 References
[1] Dusan, V., Djenic, M., Popovcic-Avric, S., Konjikusic, S. (2011). Assessing the Impact of Global Crisis on
European Transition Economies: The Role of Institutional Vulnerability and Resilience, Proceedings of
the 7th International Conference of Associations of Economic Universities of South and Eastern Europe
and the Black Sea Region (ASECU): Recent Economic Crisis and Future Development Tendencies,
October 6-8. Rostov-on-Don: Rostov State University of Economics, pp. 316-328.
[2] Franklin, A., Beck, T. Carletti, E., Lane P.R., Schoenmaker, D., Wagner, W. (2011). Cross-Border
Banking in Europe: Implications for Financial Stability and Macroeconomic Policies.Centre for Economic
Policy Research (CEPR), London.
[3] Guillermo, C. (2006). Monetary Policy Challenges in Emerging Markets: Sudden Stop, Liability
Dollarization and Lender of Last Resort, NBER Working Paper 12788. December 2006. National Bureau
of Economic Research.
[4] Jelenkovic, Z., Barjaktarovic, L. (2011). Cross Border Loans during the World’s Economic Crisis,
Proceedings of the 7th International Conference of Associations of Economic Universities of South and
Eastern Europe and the Black Sea Region (ASECU): Recent Economic Crisis and Future Development
Tendencies, October 6-8, 2011. Rostov-on-Don Rostov: State University of Economics, pp. 151-163.
[5] Kosta J., Allegret J.P., Beker Pucar E. (2011). Exchange Rate Regimes During Crisis: The Case of
Emerging Europe”. 15th International Conference on Macroeconomic Analysis and International Finance,
Rethymno 26-28 May. Retrieved from: economics.soc.uoc.gr/macro/docs/year/2011/papers/paper.pdf.
[6] Revoltella D., Mucci, F. (2011). The Prospects for the Banking Market in CESEE Beyond the Crisis, in:
Csajbok, Attila and Ernest Gnan. The Future of Banking in CESEE after the Financial Crisis, Vienna:
SUERF - The European Money and Finance Forum: pp. 65-78.
[7] Savić, N. (2012). Comparative Analysis Based on New Competitiveness Index, Panoeconomicus, 59(1):
105-115; doi: 10.2298/PAN1201105S.
[8] Savić N., Barjaktarović, L., Konjikušić, S. (2012). Foreign Capital Inflow and GPDpc in CEE Countries,
not published yet.
[9] Sever, I. et al. (2009). The Starting Points of New Economic Policy in the Conditions of Recession,
Zbornik radova Ekonomskog fakulteta u Rijeci - Proceedings od Rijeka Faculty of Economics, 27(2): 217-
262.
[10] Simor, A. (2011). Macro to Micro: New Focus in Financial Stability, in: Csajbok, Attila and Ernest Gnan,
Eds. The Future of Banking in CESEE after the Financial Crisis, Vienna: SUERF – The European Money
and Finance Forum: pp. 15-29.
*** World Bank, World Bank Database, Washington, DC.
*** IMF. (2012). World Economic Outlook Databases, Washington, DC: IMF.
*** UNCTAD. (2011). World Investment Report 2011 - Non-Equity Modes of International Production and
Development. New York and Geneva: United Nations.
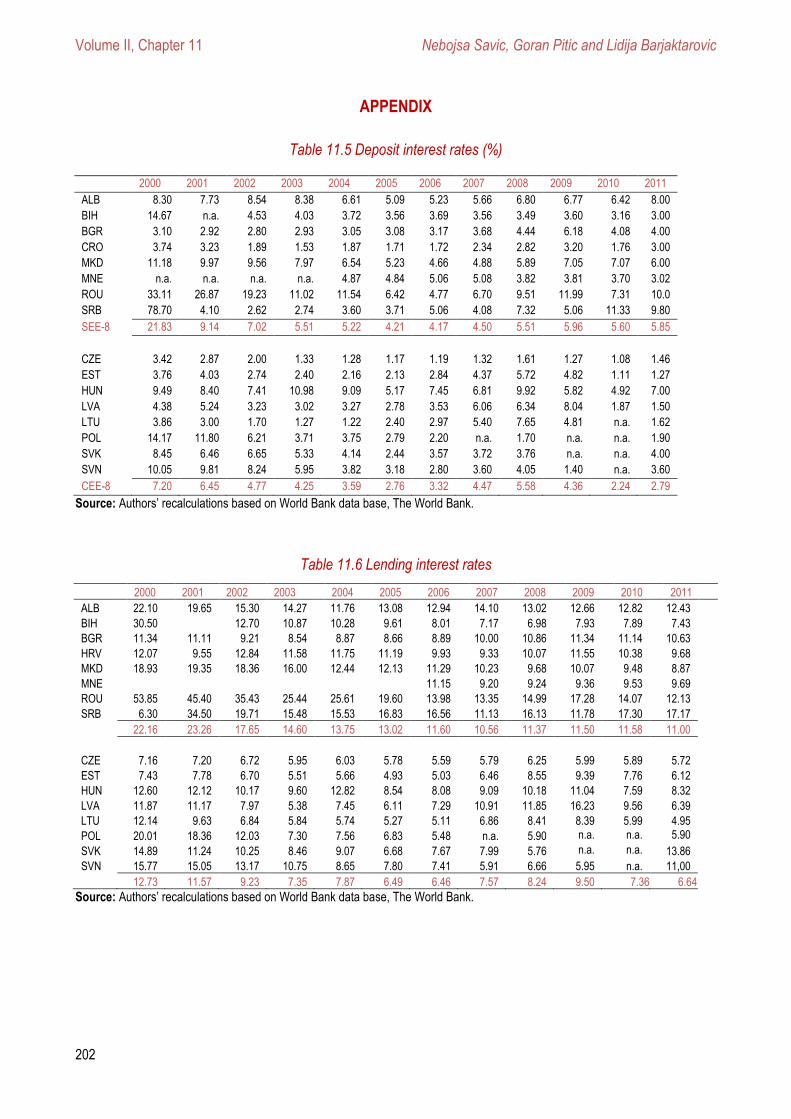
Volume II, Chapter 11 Nebojsa Savic, Goran Pitic and Lidija Barjaktarovic
202
APPENDIX
Table 11.5 Deposit interest rates (%)
2000 2001 2002 2003 2004 2005 2006 2007 2008 2009 2010 2011
ALB 8.30 7.73 8.54 8.38 6.61 5.09 5.23 5.66 6.80 6.77 6.42 8.00
BIH 14.67 n.a. 4.53 4.03 3.72 3.56 3.69 3.56 3.49 3.60 3.16 3.00
BGR 3.10 2.92 2.80 2.93 3.05 3.08 3.17 3.68 4.44 6.18 4.08 4.00
CRO 3.74 3.23 1.89 1.53 1.87 1.71 1.72 2.34 2.82 3.20 1.76 3.00
MKD 11.18 9.97 9.56 7.97 6.54 5.23 4.66 4.88 5.89 7.05 7.07 6.00
MNE n.a. n.a. n.a. n.a. 4.87 4.84 5.06 5.08 3.82 3.81 3.70 3.02
ROU 33.11 26.87 19.23 11.02 11.54 6.42 4.77 6.70 9.51 11.99 7.31 10.0
SRB 78.70 4.10 2.62 2.74 3.60 3.71 5.06 4.08 7.32 5.06 11.33 9.80
SEE-8 21.83 9.14 7.02 5.51 5.22 4.21 4.17 4.50 5.51 5.96 5.60 5.85
CZE 3.42 2.87 2.00 1.33 1.28 1.17 1.19 1.32 1.61 1.27 1.08 1.46
EST 3.76 4.03 2.74 2.40 2.16 2.13 2.84 4.37 5.72 4.82 1.11 1.27
HUN 9.49 8.40 7.41 10.98 9.09 5.17 7.45 6.81 9.92 5.82 4.92 7.00
LVA 4.38 5.24 3.23 3.02 3.27 2.78 3.53 6.06 6.34 8.04 1.87 1.50
LTU 3.86 3.00 1.70 1.27 1.22 2.40 2.97 5.40 7.65 4.81 n.a. 1.62
POL 14.17 11.80 6.21 3.71 3.75 2.79 2.20 n.a. 1.70 n.a. n.a. 1.90
SVK 8.45 6.46 6.65 5.33 4.14 2.44 3.57 3.72 3.76 n.a. n.a. 4.00
SVN 10.05 9.81 8.24 5.95 3.82 3.18 2.80 3.60 4.05 1.40 n.a. 3.60
CEE-8 7.20 6.45 4.77 4.25 3.59 2.76 3.32 4.47 5.58 4.36 2.24 2.79
Source: Authors’ recalculations based on World Bank data base, The World Bank.
Table 11.6 Lending interest rates
2000 2001 2002 2003 2004 2005 2006 2007 2008 2009 2010 2011
ALB 22.10 19.65 15.30 14.27 11.76 13.08 12.94 14.10 13.02 12.66 12.82 12.43
BIH 30.50
12.70 10.87 10.28 9.61 8.01 7.17 6.98 7.93 7.89 7.43
BGR 11.34 11.11 9.21 8.54 8.87 8.66 8.89 10.00 10.86 11.34 11.14 10.63
HRV 12.07 9.55 12.84 11.58 11.75 11.19 9.93 9.33 10.07 11.55 10.38 9.68
MKD 18.93 19.35 18.36 16.00 12.44 12.13 11.29 10.23 9.68 10.07 9.48 8.87
MNE
11.15 9.20 9.24 9.36 9.53 9.69
ROU 53.85 45.40 35.43 25.44 25.61 19.60 13.98 13.35 14.99 17.28 14.07 12.13
SRB 6.30 34.50 19.71 15.48 15.53 16.83 16.56 11.13 16.13 11.78 17.30 17.17
22.16 23.26 17.65 14.60 13.75 13.02 11.60 10.56 11.37 11.50 11.58 11.00
CZE 7.16 7.20 6.72 5.95 6.03 5.78 5.59 5.79 6.25 5.99 5.89 5.72
EST 7.43 7.78 6.70 5.51 5.66 4.93 5.03 6.46 8.55 9.39 7.76 6.12
HUN 12.60 12.12 10.17 9.60 12.82 8.54 8.08 9.09 10.18 11.04 7.59 8.32
LVA 11.87 11.17 7.97 5.38 7.45 6.11 7.29 10.91 11.85 16.23 9.56 6.39
LTU 12.14 9.63 6.84 5.84 5.74 5.27 5.11 6.86 8.41 8.39 5.99 4.95
POL 20.01 18.36 12.03 7.30 7.56 6.83 5.48 n.a. 5.90 n.a. n.a. 5.90
SVK 14.89 11.24 10.25 8.46 9.07 6.68 7.67 7.99 5.76 n.a. n.a. 13.86
SVN 15.77 15.05 13.17 10.75 8.65 7.80 7.41 5.91 6.66 5.95 n.a. 11,00
12.73 11.57 9.23 7.35 7.87 6.49 6.46 7.57 8.24 9.50 7.36 6.64
Source: Authors’ recalculations based on World Bank data base, The World Bank.
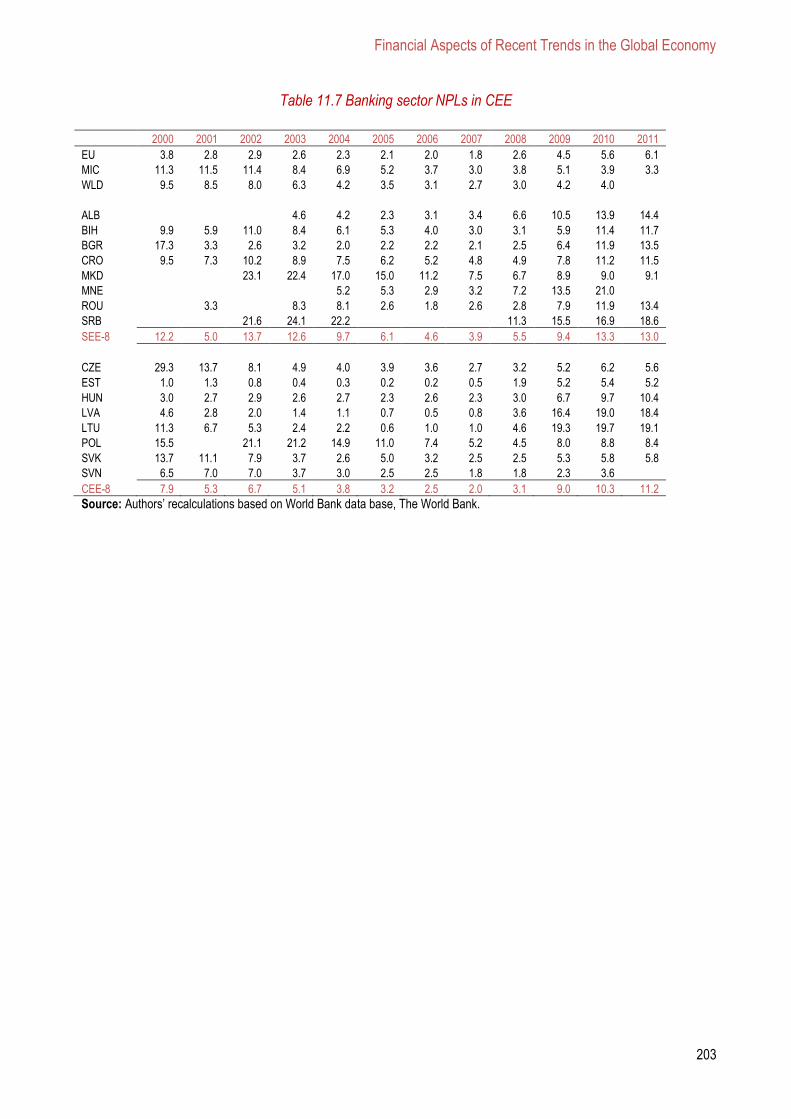
Financial Aspects of Recent Trends in the Global Economy
203
Table 11.7 Banking sector NPLs in CEE
2000 2001 2002 2003 2004 2005 2006 2007 2008 2009 2010 2011
EU 3.8 2.8 2.9 2.6 2.3 2.1 2.0 1.8 2.6 4.5 5.6 6.1
MIC 11.3 11.5 11.4 8.4 6.9 5.2 3.7 3.0 3.8 5.1 3.9 3.3
WLD 9.5 8.5 8.0 6.3 4.2 3.5 3.1 2.7 3.0 4.2 4.0
ALB
4.6 4.2 2.3 3.1 3.4 6.6 10.5 13.9 14.4
BIH 9.9 5.9 11.0 8.4 6.1 5.3 4.0 3.0 3.1 5.9 11.4 11.7
BGR 17.3 3.3 2.6 3.2 2.0 2.2 2.2 2.1 2.5 6.4 11.9 13.5
CRO 9.5 7.3 10.2 8.9 7.5 6.2 5.2 4.8 4.9 7.8 11.2 11.5
MKD
23.1 22.4 17.0 15.0 11.2 7.5 6.7 8.9 9.0 9.1
MNE
5.2 5.3 2.9 3.2 7.2 13.5 21.0 ROU
3.3
8.3 8.1 2.6 1.8 2.6 2.8 7.9 11.9 13.4
SRB
21.6 24.1 22.2
11.3 15.5 16.9 18.6
SEE-8 12.2 5.0 13.7 12.6 9.7 6.1 4.6 3.9 5.5 9.4 13.3 13.0
CZE 29.3 13.7 8.1 4.9 4.0 3.9 3.6 2.7 3.2 5.2 6.2 5.6
EST 1.0 1.3 0.8 0.4 0.3 0.2 0.2 0.5 1.9 5.2 5.4 5.2
HUN 3.0 2.7 2.9 2.6 2.7 2.3 2.6 2.3 3.0 6.7 9.7 10.4
LVA 4.6 2.8 2.0 1.4 1.1 0.7 0.5 0.8 3.6 16.4 19.0 18.4
LTU 11.3 6.7 5.3 2.4 2.2 0.6 1.0 1.0 4.6 19.3 19.7 19.1
POL 15.5
21.1 21.2 14.9 11.0 7.4 5.2 4.5 8.0 8.8 8.4
SVK 13.7 11.1 7.9 3.7 2.6 5.0 3.2 2.5 2.5 5.3 5.8 5.8
SVN 6.5 7.0 7.0 3.7 3.0 2.5 2.5 1.8 1.8 2.3 3.6 CEE-8 7.9 5.3 6.7 5.1 3.8 3.2 2.5 2.0 3.1 9.0 10.3 11.2
Source: Authors’ recalculations based on World Bank data base, The World Bank.
Volume II, Chapter 12 Rosaria Rita Canale
204
x
Chapter 12
FISCAL POLICY AND EXTERNAL CONSTRAINT IN THE EUROPEAN MONETARY UNION
by Rosaria Rita CANALE
University of Naples “Parthenope”, Faculty of Economics, Italy
12.1 Introduction
12.2 Does deficit spending increase growth?
12.3 Theoretical issues about fiscal policy and external balance: the special case of the Euro
12.4 The model
12.5 Effects of fiscal expansions in the European Monetary Union
12.6 Conclusions
12.7 References
Financial Aspects of Recent Trends in the Global Economy
205
FISCAL POLICY AND EXTERNAL CONSTRAINT IN THE EUROPEAN MONETARY UNION
Rosaria Rita CANALE131
University of Naples “Parthenope”, Faculty of Economics, Italy
Abstract
The European policy model was built upon the idea that state intervention has just a destabilizing role.
The chapter puts in doubt this conclusion and connects fiscal crises with the balance of payments. A stylized
model is presented. Its results are: 1) public expenditure can have positive effects not only on growth but also
on deficit and debt if it is not accompanied by an a interest rate increase by the Central Bank; 2) when an
external constraint is introduced fiscal policy can have negative effects if it comes with a balance of payment
deficit. The same negative effects result from whatever shock causing negative expectation about the future
growth of the national economy. The results suggest that to make a currency union work it is necessary to
overcome national boundaries.
Keywords: fiscal policy, debt crisis, European Monetary Union.
12.1 Introduction
The creation of the European Monetary Union has deeply changed how economic policy is
managed. The main idea is that monetary policies can be efficient only if there are rigid rules in single
state interventions. The result is a subordination of fiscal policies to the wider objective of the stability
of the Euro. This stability has been considered the necessary condition for long-run convergence
towards the natural unemployment rate.
However the existence of divergences in growth rates after the shock of crisis, has
dramatically shown the trade-off - at least in the short run - between the reduction in public
expenditure and the interventions required to sustain income. Mainstream economists assert that
there is a single strategy to reach both goals: the free operating of market forces, which, in the long
run, lead to steady growth, national convergence and sound public budgets.
The theoretical underpinnings of this conclusion can be generally referred to the limits of
discretionary policies and to the phenomenon of time inconsistency (Kydland and Prescott 1977) both
in the field of monetary and fiscal policy. In fact - following the rational expectation hypothesis - “only
unanticipated money matters” (Lucas 1972, Sargent and Wallace 1975) and therefore the monetary
policy cannot have any active role in stabilizing output.
In the field of fiscal policy Barro (1974) demonstrated that public expenditure just creates
expectations for greater future taxation and public debt. The intertemporal equilibrium between
present and future consumption - the so-called Ricardian equivalence - tells us that there will be no
increase in demand following the greater public deficit.
131 Rosaria Rita Canale, Professor at University of Naples “Parthenope”, Faculty of Economics, Department of Economic Studies
“Salvatore Vinci”, Via Generale Parisi, 13 - 80132 - Napoli, Italy
Volume II, Chapter 12 Rosaria Rita Canale
206
These analytical conclusions have been reinforced by studies underlining the immoral
behaviour of politicians. Their rarely aim to serve the public interest, but often just to be re-elected:
therefore they subordinate decisions on the optimal policy to the consensus mechanism (for example
Buckanan and Tullok 1962)132.
These theoretical results have widely contributed to form what has been called
“macroeconomic consensus” (see for example Arestis and Sawyer 2003 and 2005 and Arestis,
McCauley and Sawyer 2001) upon which the economic and monetary union has been based.
According to this “macroeconomic consensus”:
short-term policies are not desirable because even if they could have positive effects in the
short-run, the final result is just an increase of inflation;
inflation is a monetary phenomenon. It is possible to control the quantity of money in
circulation to control the inflation rate;
gross domestic product and unemployment fluctuate around their long run value. This last
one is independent from active fiscal and monetary policies;
These principles are the theoretical foundation of economic policy in Europe, whose general
content is to assure that monetary variables do not alter the spontaneous convergence toward the
NAIRU and to help the European Central Bank to reach the task of price stability.
However, in current recessive conditions, these constraints are likely to be counterproductive:
national governments in EMU are obliged to respect rigid parameters and cannot use fiscal policy to
off-set real effects coming from the crisis: deficit spending and public debt are now a policy objective
rather than a policy instrument.
A huge amount of literature has been written to criticize the architecture of economic policy in
Europe133. The common ground of it is that equilibrium income and employment is not just supply-side
determined134. In the light of current crisis the debate has received a renewed interest, the active role
of fiscal policy has been recuperated (De Long 2012, Batini, Callegari and Melina 2012) and the
positive effects of austerity have been questioned (for a review of the debate in Europe see Corsetti
2012).
Beside the limits imposed to fiscal policy, the European Union shows a further flaw economists
have been assigning an increasing attention: the asymmetries in the balance of payments
disequilibria. Countries in difficulty are experiencing an ever increasing deficit in current account
accompanied by sharp capital out-flows while virtuous countries are experiencing the opposite.
132 These results have been questioned and some economists have shown, also empirically, that monetary policy can be effective to
reduce unemployment, without leading to higher inflation. A review of the empirical literature on the multiplier value is in Canale et al. (2008). The debate has been prompted further till to consider the expansionary effects of fiscal contraction, for opposite positions see Perotti (2011) and Alesina and Ardagna (2012). Therefore the question whether fiscal expansion increases or decreases growth did not find an univocal empirical support.
133A big group of economists – European economists for an alternative economic policy in Europe - each year writes down a memorandum to summarize the contents of the alterative economic policy and to collect new consensus around it. See for instance Euromemorandum Group (2012) See also Fitoussi and Saraceno (2004). Many critiques can be found on also on a special number of Oxford Review of Economic Policy (vol.21 n°4, 2005) entirely dedicated to the macroeconomic role of fiscal policy. See in particular Allsopp and Vines (2005), Krugmann (2005), Solow (2005).
134 The NAIRU (non accelerate inflation rate of unemployment) is generally viewed as supply-side determined equilibrium rate of unemployment. In most presentations of the NAIRU, aggregate demand plays no essential role in the determination of such an equilibrium rate of unemployment. In those macroeconomic models from which a NAIRU is derived as an appearance, the nature of the models is such that the level of aggregate demand has to adjust to the level of unemployment as set by the supply-side factors” Sawyer (2002).
Financial Aspects of Recent Trends in the Global Economy
207
The reduction of liquidity resulting from this mechanism increases interest rates and provokes,
in times of crisis, a downward spiral of GDP reduction and unsound public finance.
Fiscal policy necessary to counteract the effect of crisis can be considered to be effective as
soon as the country belonging to EMU is not external constrained. The effects on interest rates of the
balance of payments deficit crowds out fiscal policy and forces governments to reduce public
expenditure and liquidity needs.
The chapter is organized as follows: the second paragraph refers about the theory of the
inefficacy of fiscal policy; the third paragraph contains the issues about the relation of fiscal policy with
the external balance with particular attention to EMU. The fourth paragraph presents a stylized model
about the efficacy of fiscal policy in EMU countries and the eventual presence of an external
constraint. As first step the efficacy of fiscal policy is evaluated as a policy instrument: state
intervention can have positive effects not only on growth but also on deficit and debt if it is not
accompanied by an a interest rate increase by the Central Bank. In a second stage an external
constraint is introduced defined as the single country balance of payment equilibrium: fiscal policy can
have negative effects if it comes with a balance of payment deficit. The final section concludes
underlying the fact that to make the currency union work it is necessary to overcome national
boundaries.
12.2 Does deficit spending increase growth?
The ineffectiveness of economic policy in changing the value of equilibrium income has been
widely maintained in the economic literature: the intervention of fiscal authorities through deficit
spending increases debt and inflation without affecting growth. This conclusion is based on three main
pillars:
1) The crowding-out effect
2) The inflationary effect
3) The Ricardian equivalence extended to the non-Keynesian effects of Keynesian policies
As regards these effects on the macroeconomic equilibrium, the mainstream literature starts
from a full employment equilibrium and concludes that monetary and fiscal policies only affect prices.
Therefore the first general limit to be noted is that what has still to be proved is assumed as a
hypothesis135. Indeed, if we remove the hypothesis that the starting point is the full employment
equilibrium, the effects of policy intervention listed above become very weak and uncertain.
Let us examine them one by one.
1) The crowding-out effect
In a monetary union, the single states lose their control on monetary policy and are forced to
finance public deficits through the emission of public debt. To convince the public to buy these bonds
it is necessary to raise interest rates. The increase in interest rates crowds out private investment, and
causes a reduction in the equilibrium income. The final result is a total or partial offsetting of the
effects of the increase in public expenditure.
135Arestis and Sawyer (2003).

Volume II, Chapter 12 Rosaria Rita Canale
208
However market interest rates have as reference value the interest rates the Central bank sets
so that the higher cost of refinancing the deficit with additional debt largely depends on the action of
monetary policy.
In a Monetary Union, consisting of many countries with different economic weights and
perceived risk could happen two further circumstances: 1) a first, during normal times, in which deficit
spending in one country does not necessarily trigger a reaction of the monetary authority due to the
absence of effects on inflation in the whole area and 2) a second in which, in times of crisis, single
countries are subject to the external constraint of the balance of payments. In this case the crowding-
out effect is determined by capital outflows: private investors request for an ever-increasing return to
finance the additional debt entangling national countries, without autonomous monetary policy
instruments, in a self-fulfilling process of GDP reduction and interest rates increase.
2) the inflationary effects of public expenditure.
Public expenditure is said to cause inflation because of its effect on aggregate internal
consumption and absorption. Indeed, the injection of additional resources in the system causes an
increase in private demand for both domestic goods and foreign ones. By increasing the demand for
domestic goods, public expenditure directly increases internal prices and increasing demand for
foreign goods imports inflation and worsens the current account balance. If the exchange rate is
flexible, the second effect disappears in the long run due to both the direct increase in foreign prices
and the increase in the relative prices of currencies.
However, the first effect is of major importance and requires deeper reflection. In order to state
that an increase in demand causes an increase in prices - even accepting the perfect flexibility of
money values - we have to formulate some additional hypotheses: a) the supply curve has a positive
slope or is vertical and if so b) the increase in public expenditure does not cause a shift in the supply
curve as well.
In time of crisis, the supply curve is neither positive sloped nor vertical but rather horizontal136:
in the presence of unemployment, firms can employ the quantity of labour they want at the current
wage. The average cost of production is therefore constant, as are the prices following the mark-up
mechanism. Under these circumstances, inflation derives from institutional mechanisms of bargaining
in the labour market, where wages and prices compete to distribute income in the way labourers and
firms prefer. The potential inflationary effects of deficit spending could, in this way, become null.
3) Ricardian equivalence
Robert Barro, revisiting Ricardian conclusions about the intertemporal equilibrium between
income and expenditure, have postulated that public expenditure in the present causes expectation of
greater taxation, higher interest rates and greater public debt. These expected effects reduce current
consumption, offsetting the increase in income generated by the increase in autonomous demand. In
other words, in order to avoid the future decrease in consumption caused by a very probable increase
in taxation and interest rates, consumers and firms save more and reduce their expenditure in the
present. In the light of such argumentation, public intervention would be useless and devoid of any
stabilising role.
136 See DeLong and Summers (2012) and Batini, Callegari and Melina (2012)
Financial Aspects of Recent Trends in the Global Economy
209
Despite the extensive empirical literature on the subject, an unambiguous conclusion has not
yet been found. Indeed, there are many shortcomings to be considered in this intertemporal
equilibrium. The first is that life in a long-term horizon is uncertain and people may be influenced in
their expenditure decision by the desire to satisfy an immediate need or pleasure. Secondly, due to
life’s uncertainties they might decide not to behave altruistically and shift onto future generations the
burden of a greater present public debt. Thirdly, public debt could have wealth effects, thereby
offsetting the expected reduction in disposable income.
Finally - in conditions of underemployment, when it is not possible to choose whether or not to
work and therefore whether or not to increase consumption - the present expenditure could cause an
increase in equilibrium income and thus an increase in tax flow without the need to increase the share
of fiscal incomings as well. In recent times contributions states that the value of the income multiplier
in times of crisis is positive and high (Batini, Callegari and Melina 2012 and Farhi Werning 2012).
12.3 Theoretical issues about fiscal policy and external balance: the special case of the Euro
The identities of national accounts state that the sum of private ( )pY C S and
( )T G D public saving equals investments ( )I plus the net value of current account ( )CA :
( ) ( )Y C T G I CA
or
pS D I CA
So that the current account deficit covers the difference between saving (public and private)
and investment.
According to the intertemporal approach to the balance of payments (Obstfeld and Rogoff
1995 which represent an extension of the Ricardian equivalence to the external balance) the external
debt financed consumption today is the substitute of a current account surplus in the future. Under the
rational expectation hypothesis debt or tax financed deficit spending does not alter the current account
intertemporal path. Budget deficit could alter the intertemporal internal and external equilibrium if there
is a lack of information about the future trend of the national economy. The increase in interest rates is
therefore caused by an excess of debt that cannot be financed by internal saving.
On the other side there is the twin deficit hypothesis, related to the Keynesian framework: an
increase in the budget deficit would induce domestic absorption (an expansion of aggregated
demand) and hence, an increase in imports, causing a worsening of the current account deficit. Along
the Keynesian framework also the reverse causality works: a lost of competitiveness worsens current
account and reduces aggregate demand, increasing the needs for deficit spending and the amount of
debt issued. This would alter interest rates and cause a further deterioration of the external position.
This twin deficit issue is also related to the degree of international capital mobility and to the
Feldstein and Horioka (1980) puzzle according to which domestic savings and domestic investments
are highly uncorrelated. Reflecting high capital mobility, budget and current account deficits are
Volume II, Chapter 12 Rosaria Rita Canale
210
therefore expected to move together, and it is not possible to define univocally the direction of
causality.
As a matter of fact the difference between saving and investment can be financed through the
inflow of capital as the balance of payment account states. In particular, under a pure floating
exchange rates regime, the relative price of currency automatically puts the balance of payments in
equilibrium so that:
0BP CA MC
While under fixed exchange rate regimes it holds:
BP CA MC RU
It means that the decrease (increase) in foreign reserve currency covers the current account
deficit (surplus) private capital does not finance. As a huge amount of literature states, a currency
crisis occurs when foreign reserves exhaust (first generation models) and the monetary policy attempt
to attract capital via interest rates increase becomes too costly for the internal equilibrium (second and
third generation models).
The Eurosystem is comparable to a fixed exchange rate regime. However because the
currency is the same there is a settlements mechanism called TARGET (evolved in recent times in
TARGET2), as an alternative to the variation of foreign exchange reserves. Following TARGET2
countries with a balance of payment surplus receive, via their national central bank, the net credit
coming from balance of payment deficit countries. Deficit countries, in turn, have a net debt with
surplus countries whose cost is determined by interest rates ECB sets with the European Banking
system. Before the 2007 financial crisis it worked as a settlement mechanism among Euro area
banks, in a perfectly integrated capital market. As the framework of the Mundell-Fleming model
describes, capital flew from one country to another according to interest rates differential, under the
umbrella of trust in the common currency. Until the 2007 financial crisis, the difference between saving
and investment was considered a good opportunity for capitals coming from surplus countries and
going toward deficit ones to gain additional returns. In other terms the current account imbalances
were considered to be a predictor of a uniform rate of growth (Blanchard and Giavazzi 2004). Public
bonds were not considered risky and the spread were absolutely negligible.
Figure 12.1 depicts the relation between the average values 2004-2007 of ten years
government bond yields and current account position as a percentage of GDP for countries
considered relevant for the imbalances: Portugal, Ireland, Italy, Greece and Spain (PIIGS) for vicious
ones, Finland, Germany, Netherland and Austria as representative of virtuous countries; France and
Belgium as borderline.
The range of long term government bond yields is between 3.85 and 4.1 percent while the
current account varies from +8% to -10%. The intuition associated with figure 1 suggests that there is
not any explicit relation between long term interest rates and current account
Once the crisis hit the aggregate demand and revealed the lack of structural differences
among euro-zone countries the value of current account became the proxy for financial markets to
evaluate the ability to repay the debts. The direction of causality reverted: countries experiencing
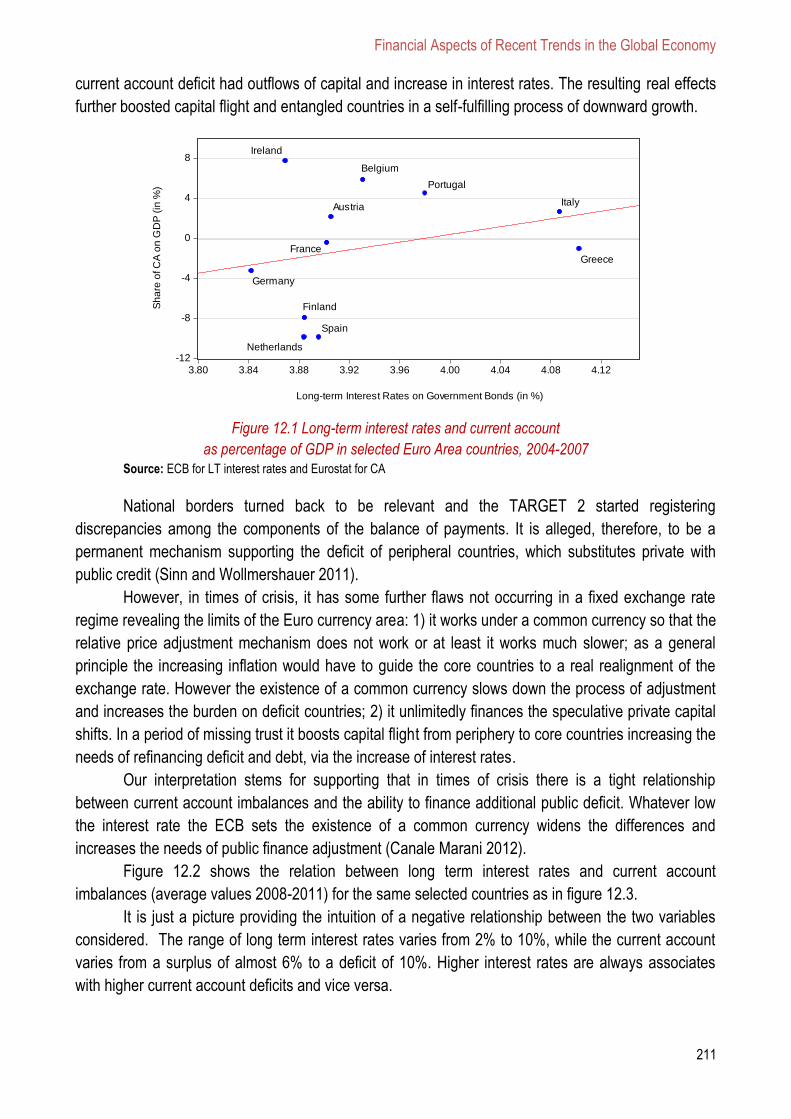
Financial Aspects of Recent Trends in the Global Economy
211
current account deficit had outflows of capital and increase in interest rates. The resulting real effects
further boosted capital flight and entangled countries in a self-fulfilling process of downward growth.
Figure 12.1 Long-term interest rates and current account
as percentage of GDP in selected Euro Area countries, 2004-2007
Source: ECB for LT interest rates and Eurostat for CA
National borders turned back to be relevant and the TARGET 2 started registering
discrepancies among the components of the balance of payments. It is alleged, therefore, to be a
permanent mechanism supporting the deficit of peripheral countries, which substitutes private with
public credit (Sinn and Wollmershauer 2011).
However, in times of crisis, it has some further flaws not occurring in a fixed exchange rate
regime revealing the limits of the Euro currency area: 1) it works under a common currency so that the
relative price adjustment mechanism does not work or at least it works much slower; as a general
principle the increasing inflation would have to guide the core countries to a real realignment of the
exchange rate. However the existence of a common currency slows down the process of adjustment
and increases the burden on deficit countries; 2) it unlimitedly finances the speculative private capital
shifts. In a period of missing trust it boosts capital flight from periphery to core countries increasing the
needs of refinancing deficit and debt, via the increase of interest rates.
Our interpretation stems for supporting that in times of crisis there is a tight relationship
between current account imbalances and the ability to finance additional public deficit. Whatever low
the interest rate the ECB sets the existence of a common currency widens the differences and
increases the needs of public finance adjustment (Canale Marani 2012).
Figure 12.2 shows the relation between long term interest rates and current account
imbalances (average values 2008-2011) for the same selected countries as in figure 12.3.
It is just a picture providing the intuition of a negative relationship between the two variables
considered. The range of long term interest rates varies from 2% to 10%, while the current account
varies from a surplus of almost 6% to a deficit of 10%. Higher interest rates are always associates
with higher current account deficits and vice versa.
-12
-8
-4
0
4
8
3.80 3.84 3.88 3.92 3.96 4.00 4.04 4.08 4.12
Long-term Interest Rates on Government Bonds (in %)
Sh
are
of C
A o
n G
DP
(in
%)
Ireland
Belgium
Portugal
Italy
Greece
Spain
Netherlands
Finland
Germany
Austria
France

Volume II, Chapter 12 Rosaria Rita Canale
212
Figure 12.2 Long-term interest rates and current account
as percentage of GDP in Selected Euro Area countries, 2008-2011 Source: ECB for LT interest rates and Eurostat for CA
12.4 The model
We consider the economy of a single country of the EMU and therefore that the fiscal policy is
national, while the monetary policy is supranational. Furthermore the country can be subject to an
external constraint due to the (un)willingness of capital markets to provide liquidity to sustain internal
equilibrium.
Below the usual equations representing the equilibrium in the goods market at time t are
written. We make the hypothesis that the country imports and exports from other countries of the Euro
zone, but for the sake of simplicity, that the whole currency area is a closed economy. This allows us
to not consider the exchange rates. We assume to be in times of crisis so that the economy is below
the full capacity utilization and the supply curve is horizontal and not explicitly introduced in the model.
0 1 1
0
1
t t t t t t t
t t
t t
t
t
t
t t
Y C I G T E M
C c c Y
I I br
G G
T T
E E
M xY
According to these simple equations the consumption function Ct has an autonomous part c0 and
depends on the income of the preceding year Yt-1. Investments consist of an autonomous part (I0) and
a negative part related to the rate of interest rt following parameter b. Taxes and public expenditure, in
the current year - Gt and Tt - are, again for the sake of simplicity, considered autonomous. Exports at
-15
-10
-5
0
5
10
0 1 2 3 4 5 6 7 8 9 10 11 12
Long-term Interest Rates on Government Bonds (in %)
Sh
are
of C
A o
n G
DP
(in
%)
NetherlandsGermany
Austria
Finland
FranceBelgium
Spain
ItalyIreland
PortugalGreece
Financial Aspects of Recent Trends in the Global Economy
213
time t depends on foreign income and are therefore autonomous. Imports depend on the income of
preceding year.
Substituting each component of aggregate demand in the initial equilibrium equation, we have:
0 1 1 0 1t t t t t tY c c Y I br G T E xY
Dividing both sides of the equation by Yt, indicating Gt- Tt with Dt and c0, I0 and E , with At we
have:
11( )
t t t t
t t t t t
Y Y A r Dtc x b
Y Y Y Y Y
due to the fact that 1 1 (1 )t tY Y g where g is the income rate of growth. Solving for r we can
finally write a dynamic equilibrium in the goods market:
11 1
( ) 11
t t ty
r c x a db g
(12.1)
or in terms of g
11
1y t t t
c xg
b r d a
(12.1’)
where, of course, dt is the deficit/income ratio and at is At related to GDP.
Equations (12.1) and (12.1’) indicate as usual that the growth rate of income is related to the
interest rate and that the public deficit influences r and g.
The second step is to detect how the rate of interest is determined.
A Central Bank sets according to a monetary policy rule known as Taylor’s rule. Here it is in a
very simple form:
1 2
1 2
*
0; 0
er r a g a
r ra a
g
where 1a and 2a represent the weight the Central Bank assigns to growth and inflation respectively.
For a country belonging to a monetary union the rate of interest has two components: the first is the
rate ECB sets and can be considered as an exogenous value; the second is that related to the
balance of payment equilibrium expressed in term of ratio to GDP:
*tr r bp (12.2)
as a monetary policy rule for a single marginal country, deriving from the Taylor rule and from the
balance of payment constraint. The term bp describes the necessity of a single country belonging to
Volume II, Chapter 12 Rosaria Rita Canale
214
a currency union to preserve the national balance of payment equilibrium. If the country is considered
unrisky the last term is zero as proof of the perfect substitutability of internal and external assets. On
contrary if there is an asymmetry among EMU countries the term bp describes the additional or
reduced returns asked to buy national bonds. In times of crisis the greater the balance of payment
deficit - current account and capital flows - the greater the interest rate.
Once fixed the rate of interest we can substitute the equation determining the means of
payment in circulation in the goods market equilibrium and solve for dt. We have therefore
1
1 *1
t t yc x
d a b r bpg
(12.3)
Equation (12.3) indicates that the deficit dt generates, other things being equal, the income
rate of growth g and that there is a positive relation between the two. It depends negatively also on
marginal propensity to consume and the other autonomous components of demand - because of the
direct effect on income growth, but positively on the sensitiveness of investments to the rate of interest
and to the propensity to import. Fiscal balance varies also - given the rate of interest the ECB sets -
with external imbalances: negatively (reduces) with a balance of payment surplus, positively
(increases) with a balance of payment deficit.
The third step is to reproduce the equation describing the public sector constraint.
1(1 )t t t tB r B D BM
In the EMU the monetary policy is centralized and it is very unlikely to happen that the Central Bank
purchases public bonds of a single country. If it happens the additional high powered money created
will be completely sterilized137. The public sector constraint therefore becomes
1(1 )t t tB r B D
This equation states that the public sector deficit in the EMU can be financed just through
debt. Hence the current debt tB , is equal to the debt received from the past Bt-1, plus interest on it
1trB , plus the primary deficit tD .
Dividing all by Yt, and recalling again that 1 1 (1 )t tY Y g , we have the usual equation
describing the dynamic of the debt/GDP ratio tb through time.
1(1 )
(1 )t t t
rb b d
g
(12.4)
It is obvious moreover that the single country rate of interest on public bonds assumes as
reference value the Central Bank repurchase rate but is hardly influenced by the specific risk
conditions of the country measured as described above by the balance of payment surplus or deficit.
137 Recent institutional agreements in EMU (European Stability Mechanism into force from October 2012) have allowed the birth of a
program of public bonds purchase on behalf of the central bank on the primary market for countries in difficulty. This program however provides the complete sterilization of money issued and the acceptance of fiscal retrenchment programs.
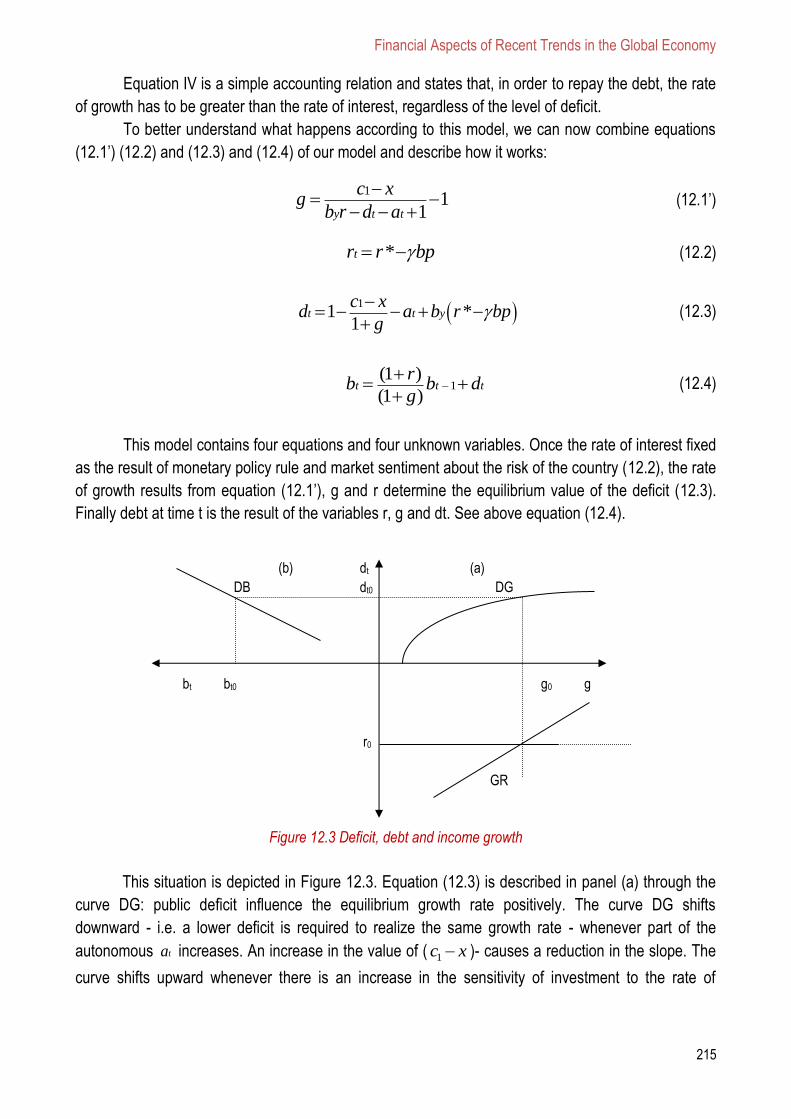
Financial Aspects of Recent Trends in the Global Economy
215
(b) dt (a)
DB dt0 DG
bt bt0 g0 g
r0
GR
r (d)
Equation IV is a simple accounting relation and states that, in order to repay the debt, the rate
of growth has to be greater than the rate of interest, regardless of the level of deficit.
To better understand what happens according to this model, we can now combine equations
(12.1’) (12.2) and (12.3) and (12.4) of our model and describe how it works:
11
1y t t
c xg
b r d a
(12.1’)
*tr r bp (12.2)
1
1 *1
t t yc x
d a b r bpg
(12.3)
1(1 )
(1 )t t t
rb b d
g
(12.4)
This model contains four equations and four unknown variables. Once the rate of interest fixed
as the result of monetary policy rule and market sentiment about the risk of the country (12.2), the rate
of growth results from equation (12.1’), g and r determine the equilibrium value of the deficit (12.3).
Finally debt at time t is the result of the variables r, g and dt. See above equation (12.4).
Figure 12.3 Deficit, debt and income growth
This situation is depicted in Figure 12.3. Equation (12.3) is described in panel (a) through the
curve DG: public deficit influence the equilibrium growth rate positively. The curve DG shifts
downward - i.e. a lower deficit is required to realize the same growth rate - whenever part of the
autonomous ta increases. An increase in the value of ( 1c x )- causes a reduction in the slope. The
curve shifts upward whenever there is an increase in the sensitivity of investment to the rate of
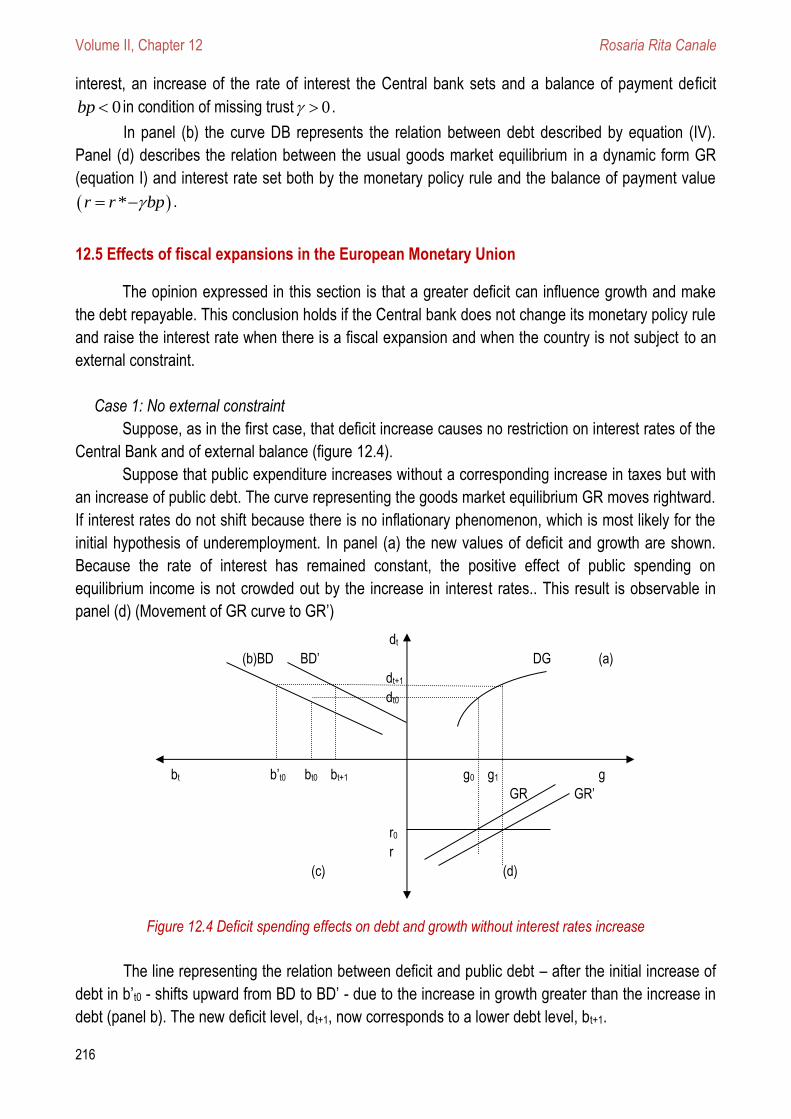
Volume II, Chapter 12 Rosaria Rita Canale
216
interest, an increase of the rate of interest the Central bank sets and a balance of payment deficit
0bp in condition of missing trust 0 .
In panel (b) the curve DB represents the relation between debt described by equation (IV).
Panel (d) describes the relation between the usual goods market equilibrium in a dynamic form GR
(equation I) and interest rate set both by the monetary policy rule and the balance of payment value
*r r bp .
12.5 Effects of fiscal expansions in the European Monetary Union
The opinion expressed in this section is that a greater deficit can influence growth and make
the debt repayable. This conclusion holds if the Central bank does not change its monetary policy rule
and raise the interest rate when there is a fiscal expansion and when the country is not subject to an
external constraint.
Case 1: No external constraint
Suppose, as in the first case, that deficit increase causes no restriction on interest rates of the
Central Bank and of external balance (figure 12.4).
Suppose that public expenditure increases without a corresponding increase in taxes but with
an increase of public debt. The curve representing the goods market equilibrium GR moves rightward.
If interest rates do not shift because there is no inflationary phenomenon, which is most likely for the
initial hypothesis of underemployment. In panel (a) the new values of deficit and growth are shown.
Because the rate of interest has remained constant, the positive effect of public spending on
equilibrium income is not crowded out by the increase in interest rates.. This result is observable in
panel (d) (Movement of GR curve to GR’)
Figure 12.4 Deficit spending effects on debt and growth without interest rates increase
The line representing the relation between deficit and public debt – after the initial increase of
debt in b’t0 - shifts upward from BD to BD’ - due to the increase in growth greater than the increase in
debt (panel b). The new deficit level, dt+1, now corresponds to a lower debt level, bt+1.
dt
(b)BD BD’ DG (a)
dt+1
dt0
bt b’t0 bt0 bt+1 g0 g1 g
GR GR’
r0
r
(c) (d)

Financial Aspects of Recent Trends in the Global Economy
217
Case 2. Existence of an external constraint
The second case is that of the increase in deficit associated with a rise in interest rates due to
both the unwillingness of financial markets to finance the additional current account deficit and to
capital out-flows for the perceived increasing default risk (this case can be re-conduced to the case of
a restrictive monetary policy rule, (Figure 12.5).
To grasp this point better, suppose that the increase in interest rates is greater than the
increase in growth and such as to offset the positive effects of public spending. In panel (d) the curve
representing the equilibrium in the goods market moves rightward from GR to GR’, and the interest
rate moves upward as a consequence of capital out-flows from r0 to r1. The increase in interest rates
causes a reduction of growth and an upward movement of the DG curve in DG’ (panel (a)).
Equilibrium growth so reduces (panel a). in this case the greater deficit dt+1 causes a reduction in
equilibrium income growth from g0 to g1. Debt has increased from bt0 to bt+1 and, due to the higher
interest rate r1 and to the lower growth g1, this increase is more than proportional to the deficit
increase. This circumstance is shown in panel (b) with a downward shift of the curve BD in BD’.
Figure 12.5 Deficit spending effects on debt and growth in presence of an external constraint
In short, if the increase in public spending is associated with a balance of payment deficit and
to an increased perceived risk (the same happens if Central Bank increases interest rates), limits the
positive effects of deficit. Furthermore, if this increase exceeds that of the equilibrium income, the debt
increases to ever greater levels. Therefore despite a first positive effect of deficit spending on growth -
the fast and faster debt increase - causes financial instability, expectations of increasing taxes and
reduction consumption and income in a longer period. Opposite results are registered in countries with
balance of payment surplus: the reduction effects on interest rates widen the positive effects of public
spending and further reduce public debt.
dt
(b) (a)
BD’ BD dt+1 DG’ DG
dt0
bt bt+1 bt0 g1 g0 g
r0
GR GR’
r1
r (d)
Volume II, Chapter 12 Rosaria Rita Canale
218
12.6 Conclusions
The starting point of this chapter has been the critique to the idea that economic policy is
useless. Looking at events from a different perspective, it has been concluded that deficit spending
causes an increase in growth and helps to reduce debt provided that there is not an increase in
interest rates coming from the external constraint. The general conclusions to draw from the model
presented are: 1) fiscal policy can still be considered an instrument of economic policy and 2)
monetary and fiscal policy co-ordination is desirable to achieve growth.
In addition the model, despite the limits of a stylized representation, brings the reader to reflect
on the circumstance that peripheral countries, whatever their original sin, must bear in times of crisis
huge costs because of their inability to reduce interest rates. EMU asymmetries cannot be solved
without a shared policy action and without taking into account the systemic shock coming from the
crisis. In this context, a jump of quality toward a political union is required: the absence of a shared
project will pave the way to those who are convinced that rather than bear such high social costs, it
would be better to grant autonomy to the national economic policy. However in the globalization era
this would likely be– following the “Rodrick’s trilemma"138 (Rodrick 2011), a loser choice.
12.7 References
[1] Alesina, A., Ardagna, S. (2012). The design of fiscal adjustments, NBER Working Papers 18423, National
Bureau of Economic Research, Inc.
[2] Allsopp, C., Vines, D. (2005). The macroeconomic role of fiscal policy” in Oxford Review of Economic
Policy, 21 (4): 485-508, doi: 10.1093/oxrep/gri027.
[3] Arestis, P., Sawyer, M. (2003). Macroeconomic Policies of the Economic Monetary Union: Theoretical
Underpinnings and Challenge, The Levy Economic Institute, WP no.385.
[4] Arestis, P., Sawyer, M. (2005). Aggregate demand, conflict and capacity in the inflationary process,
Cambridge Journal of Economics, 29 (6): 959-974, doi: 10.1093/cje/bei079.
[5] Arestis, P., McCauley, K., Sawyer, M. (2001). Commentary. An alternative stability pact for the European
Union, Cambridge Journal of Economics, 25 (1): 113-130, doi: 10.1093/cje/25.1.113.
[6] Arestis, P., Sawyer, M. (2005). What is the New Consensus in Macroeconomics? Paper given at the HM
Treasury/GES Conference, entitled Is there a New Consensus in Macroeconomics?, 30 November. The
proceedings of the conference will be published in P. Arestis (ed.), Is There a New Consensus in
Macroeconomics, Houndmills, Basingstoke: Palgrave Macmillan.
[7] Barro, R. (1974). Are government bonds net wealth? Journal of Political Economy, 82(6): 1095-1117.
[8] Batini, N., Callegari, G., Melina, G. (2012). Successful Austerity in the United States, Europe and Japan,
IMF Working Paper, July.
[9] Blanchard, O., Giavazzi, F. (2002). Current Account Deficits in the Euro Area.The End of the Feldstein
Horioka Puzzle? MIT, department of Economics, Working Paper 03-05, September.
138 The “old” trilemma states that perfect capital mobility, fixed exchange rates and autonomous managment of monetary policy are
not reconcilable (Obstfeld 1995), while the Rodrick’s trilemma states that it is impossible to have at the same time globalization, democracy and autonomous policy management.
Financial Aspects of Recent Trends in the Global Economy
219
[10] Buchanan, J.M., Tullock, G. (1962). The Calculus of Consent: Logical Foundation of Constitutional
Democracy, University of Michigan Press, Ann Arbor, Mich.
[11] Canale, R.R., Marani, U. (2012). Current account and fiscal imbalances in the Euro-area: Siamese twins
in an asymmetrical currency union, Quaderni del Dipartimento di Economia Politica e Statistica”
Università di Siena, n. 659, October.
[12] Corsetti, G. ed. (2012). Austerity: Too much of a good thing? CEPR.
[13] De Grauwe, P. (2011). Managing A Fragile Eurozone, CeSifo Forum 2/2011
[14] De Long, B., Summers, L. (2012). Fiscal Policy in Depressed Economies, Brooking Papers in Economic
Activity, March.
[15] Farhi, E., Werning, I. (2012). Fiscal Multipliers: Liquidity Traps and Currency Unions, Dept of Economics,
MIT, Working paper 12-23.
[16] Feldstein, M., Horioka, C. (1980). Domestic Saving and International Capital Flows, The Economic
Journal, 90(358): 314-329.
[17] Krugmann, P. (2005). Is fiscal policy poised of a comeback? Oxford Review of Economic Policy, 21(4):
515-523, doi: 10.1093/oxrep/gri029.
[18] Kydland, E.F., Prescott, E.C. (1977). Rules rather than discretion: the inconsistency of optimal plans,
Journal of Political Economy, 85(4): 473-491.
[19] Lugas, R.E. (1972). Expectations and Neutrality of Money, Journal of Economic Theory, 4: 103-124.
[20] Obstfeld, M., Rogoff, K. (1995). Exchange rate dynamics redux, Journal of Political Economy, 103: 624-
60.
[21] Obstfeld, M. (1995). International capital mobility in the l990s,' in P.B. Kenen, ed., Understanding
interdependence: The macroeconomics of the open economy. Princeton, NJ: Princeton University Press.
[22] Perotti, R. (2011). The "Austerity Myth": Gain without Pain? NBER Working paper, 17571, National
Bureau of Economic Research, Inc.
[23] Rodrick, D. (2011). The Globalization Paradox: Democracy and the Future of the World Economy, W.W.
Norton, New York and London.
[24] Sargent, T., Wallace, N. (1975). Rational expectations’ the optimal monetary instrument and the optimal
money supply rule, Journal of Political Economy, 83(2): 241-254.
[25] Sawyer, M.C. (2002). The NAIRU, Aggregate Demand and Investment, Metroeconomica, 53(1): 66-94.
*** Euromemorandum Group (2006). A Democratic Economic Policy Alternative to the Neo-liberal
Transformation of Europe, Euromemorandum 2006, December.

Volume II, Chapter 13 Radovan Dráb and Lucia Mihóková
220
x
Chapter 13
DETERMINANTS OF FISCAL CONSOLIDATION SUCCESS IN V4 COUNTRIES
by Radovan DRÁB
Pavol Jozef Šafárik University in Košice, Faculty of Public Administration, Slovak republic
and Lucia MIHÓKOVÁ
Technical university in Košice, Faculty of Economics, Slovak republic
13.1 Introduction
13.2 Literature overview
13.3 The characteristics of the Southeast Europe
13.4. Research
13.5 Conclusion
13.6 References
Financial Aspects of Recent Trends in the Global Economy
221
DETERMINANTS OF FISCAL CONSOLIDATION SUCCESS IN V4 COUNTRIES
Radovan DRÁB139
Pavol Jozef Šafárik University in Košice
Faculty of Public Administration, Slovak republic
Lucia MIHÓKOVÁ140
Technical University in Košice
Faculty of Economics, Slovak republic
Abstract
The crisis of public finance negatively affected the overall economic development in all EU Member
States, and therefore issues related to the regulatory mechanism not only of the financial sector, but the
economy as a whole, are more than justified. The focus of fiscal consolidation is to a certain extent a
"stumbling block" among the indebted countries. Issues aimed at defining the type of fiscal consolidation, the
determination of the specific components of one sided oriented consolidation, and not least the determinants
of individual components come into the spotlight. All these issues are important in order to help reduce public
debt and to support persistent long-term fiscal balance in the EU. This chapter focuses on the identification
and comparison of revenue and expenditure based consolidation, which would substantially contribute to the
reduction of public debt in the V4 countries for the period 1996 to 2014.
Keywords: debt crisis, foreign debt, Southeast Europe, current account deficits, PIIGS.
Motto: “We don´t care for the debt! It´s big enough, to care for itself.”
13.1 Introduction
The crisis of public finance negatively affected the overall economic development in all EU
Member States, and therefore issues related to the regulatory mechanism not only of the financial
sector, but the economy as a whole, are more than justified. The focus of fiscal consolidation is to a
certain extent a "stumbling block" among the indebted countries. Issues aimed at defining the type of
fiscal consolidation, the determination of the specific components of one sided oriented consolidation,
and not least the determinants of individual components come into the spotlight. All these issues are
important in order to help reduce public debt and to support persistent long-term fiscal balance in the
EU. Preliminary research data from the AMECO database identifies factors, which have significantly
reduced the country's debt, on average, by 37 percentage points. Previous research has analysed the
situation of accumulation and decreases of public debt in the Slovak and Czech Republic
(Jakubíková, Mihóková, 2011). The topic of fiscal consolidation and its success was also dealt within
139 Radovan Dráb, Assistant Professor at Pavol Jozef Šafárik University in Košice, Faculty of Public Administration, Department of
Public Administration Economics and Management, Popradská 66, P.O. BOX C-2, 04132 Košice, Slovak republic 140 Lucia Mihóková, Researcher at Technical university in Košice, Faculty of Economics, Department of Finance, Nemcovej 32,
04001 Košice, Slovak republic
Volume II, Chapter 13 Radovan Dráb and Lucia Mihóková
222
institutions such as the IMF and OECD. In 2003, the IMF conducted an analysis on a sample of 79
industrial and developing countries over the period of 1970-2002, based on the analysis of major
public debt reduction according to previous research by Reinhart, Rogoff and Savastano (2003).
This chapter focuses on the identification and comparison of revenue and expenditure based
consolidation, which would substantially contribute to the reduction of public debt in the V4 countries
for the period 1996 to 2014. This analysis was performed in several stages. The first part focuses on
the determination of the debt accumulation and debt reduction periods by using year-on-year
comparisons with a debt-to-GDP ratio indicator. The second part of the analysis was focused on
model specification based on theoretical and empirical evidence in order to identify factors, which in
related periods influenced the major part of debt reduction and debt accumulation in Visegrad
countries. The probability of success in fiscal consolidation described in the last part has been derived
based on a logistic probabilistic model with two different equations for revenue and expenditure
consolidation.
The empirical results of models are presented in two basic levels. The first level is focused on
the identification of the type of fiscal consolidation, which has most successfully contributed to debt
reduction. The second level is aimed at identifying factors, which determine the probability of success
of major debt reduction. Several issues regarding potential future research could mainly cover the
topics for the identification of described fiscal consolidation component types, which contribute to the
increase of debt reduction probability in countries V4.
13.2 Theoretical and empirical aspects of systemic financial crisis and fiscal consolidation
Soros (2009) at the beginning of the crisis said, that the world has been in the middle of the
worst financial crisis since 1930s of the last century. The current global crisis is mostly compared with
the “Great Depression”, as is also confirmed by the European Commission in Public Finance in EMU
2012 with the addition that the current sluggish economic development, despite the strengthening of
institutional frameworks of all Member States, raises concerns also about re-slump and problems in
the financial markets.
Dealing with the consequences of systemic crisis, as it is called in academic and expert
circles, is the “top theme“ of most countries in the world. The academic and experts economic
community, as well as, government policies supported by fundamental decisions of EU are looking for
solutions to persist or slow down the negative trend marked by high levels of public debt. The need for
solutions of public finance crisis, which has adversely affected the overall economic development,
enhanced issues associated with regulatory mechanism, not only in the financial sector but in the
economy as a whole. Therefore these issues are more than justified. International institutions,
academic and economic communities are increasingly paying attention to the issue of identifying the
fundamental determinants and ways of solving this problem. Empirical studies and real national
governments focus on the implementation of fiscal consolidation that would reduce public debt as
much as possible.
The term financial crisis is defined by a wide range of domestic and foreign authors
(Goldsmith, 1982; Bordo, 1987; Mishkin, 1996; Musílek, 2004; etc.). In the theoretical analysis the
definition “financial crisis” includes some basic failures of financial system, based on the theory which
Financial Aspects of Recent Trends in the Global Economy
223
defines the basic types of crises. Typology of financial crises and their characteristics are also stated
in the IMF World Economic Outlook (1998), and Dvořák (2008) this typology refers to the traditional
typology of financial crises.
The total number of financial crises in practice is relatively high. 69 cases of financial crises
took place since 1979 in developing countries (Caprio and Klinngbeil, 1999), and a total 71 cases of
financial crises took place from 1970-1995 (Kaminsky and Reinhart, 1999). 77 crises identified by
Eichengreen, Rose, Wyplosz (1996) occurred in years 1959-1993 in industrialized countries.
Eichengreen and Bordo (2002) identified the existing crises in industrialized and developing countries,
and their total number from 1880-1997 numbered 108 in industrialized countries and 150 in
developing countries. The largest number was concentrated in the same period 1973-1997.
These researches confirmed that history is full of financial and economic crises, but most of
them have in terms of analysis national or local character. Only a few of these crises were attributed
as systemic.
The current crisis, however, represents a historical milestone in the development of human
society, which requires new approaches and recognizing connections when analyzing the causes,
consequences, and especially methods of dealing with a crisis. Stanek (2010, p.7) stated: "The
processes of globalization, transnational corporations, financial sector virtualization, process of
outsourcing, offshoring, income stratification, but also sovereign wealth funds and the new leaders of
the global economy, creating an entirely new combination of global and local systemic phenomena."
The fact, that this is one of the most important historical crises confirms an increasing number of
authors (Krugman, 2008; Petras, 2008; Dvořák, 2008; Vitek, 2011) and Foster and Magdoff (2009),
who showed even the possibility of radical social change, as result of the crisis.
New characteristics, specific to the current crisis, categorize it to models of financial crises of
the fourth generation, which are characterized by terms such as "full-fledged financial crisis"141,
"systemic financial crisis"142 and "general financial crisis143."
IMF (2011) focused on identification of systemic crises in its publication Analytics of Systemic
Crises and the Role of Global Financial Safety Nets. Based on the specifications by which
idiosyncratic crisis differs from the systemic crisis, authors developed a methodology to identify
systemic crisis. In this analysis they developed systemic crisis indicator, which includes financial and
economic aspects of each country. Using this indicator they identified four clusters of systemic crises
ranging from the crisis in 1980 and 1982 in Latin America, 1992-1993 European ERM crisis, at the
end of 1990 Asian crisis, Russia's long-term capital to the current crisis. Systemic crisis is
characterized by two main elements - the importance of financial and economic stress and the extent
of their exposure (IMF, 2011). During a systemic crisis, the financial markets are under pressure and
characterized by massive panic and investor decisions that create a general acute liquidity crisis that
spreads rapidly from the center. The real impact of this shock is quickly realized by the loss of output
and disruption of financial and trade ties between the countries, what will pull country trough macro
financial cycles into a vicious circle (IMF, 2011).
141 More details in Radelet Sachs(1998b) 142 More details in Mishkin (2001)
143 More details in Krugman (2001)
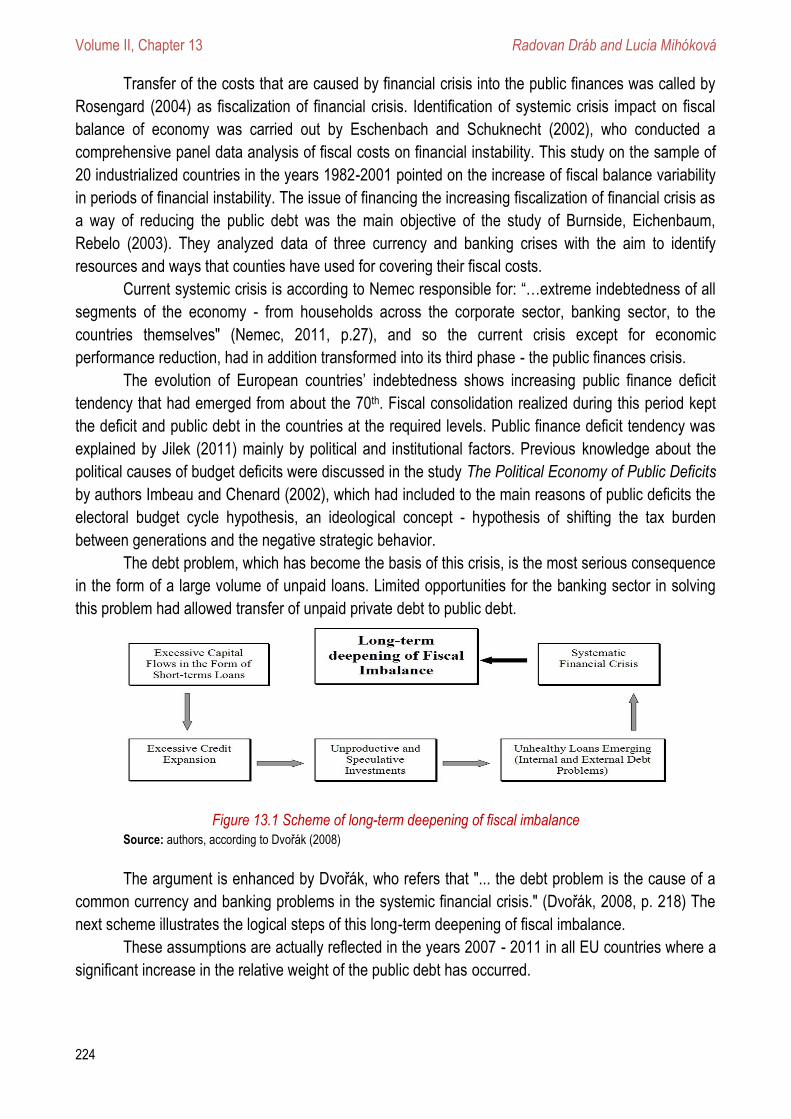
Volume II, Chapter 13 Radovan Dráb and Lucia Mihóková
224
Transfer of the costs that are caused by financial crisis into the public finances was called by
Rosengard (2004) as fiscalization of financial crisis. Identification of systemic crisis impact on fiscal
balance of economy was carried out by Eschenbach and Schuknecht (2002), who conducted a
comprehensive panel data analysis of fiscal costs on financial instability. This study on the sample of
20 industrialized countries in the years 1982-2001 pointed on the increase of fiscal balance variability
in periods of financial instability. The issue of financing the increasing fiscalization of financial crisis as
a way of reducing the public debt was the main objective of the study of Burnside, Eichenbaum,
Rebelo (2003). They analyzed data of three currency and banking crises with the aim to identify
resources and ways that counties have used for covering their fiscal costs.
Current systemic crisis is according to Nemec responsible for: “…extreme indebtedness of all
segments of the economy - from households across the corporate sector, banking sector, to the
countries themselves" (Nemec, 2011, p.27), and so the current crisis except for economic
performance reduction, had in addition transformed into its third phase - the public finances crisis.
The evolution of European countries’ indebtedness shows increasing public finance deficit
tendency that had emerged from about the 70th. Fiscal consolidation realized during this period kept
the deficit and public debt in the countries at the required levels. Public finance deficit tendency was
explained by Jilek (2011) mainly by political and institutional factors. Previous knowledge about the
political causes of budget deficits were discussed in the study The Political Economy of Public Deficits
by authors Imbeau and Chenard (2002), which had included to the main reasons of public deficits the
electoral budget cycle hypothesis, an ideological concept - hypothesis of shifting the tax burden
between generations and the negative strategic behavior.
The debt problem, which has become the basis of this crisis, is the most serious consequence
in the form of a large volume of unpaid loans. Limited opportunities for the banking sector in solving
this problem had allowed transfer of unpaid private debt to public debt.
Figure 13.1 Scheme of long-term deepening of fiscal imbalance Source: authors, according to Dvořák (2008)
The argument is enhanced by Dvořák, who refers that "... the debt problem is the cause of a
common currency and banking problems in the systemic financial crisis." (Dvořák, 2008, p. 218) The
next scheme illustrates the logical steps of this long-term deepening of fiscal imbalance.
These assumptions are actually reflected in the years 2007 - 2011 in all EU countries where a
significant increase in the relative weight of the public debt has occurred.
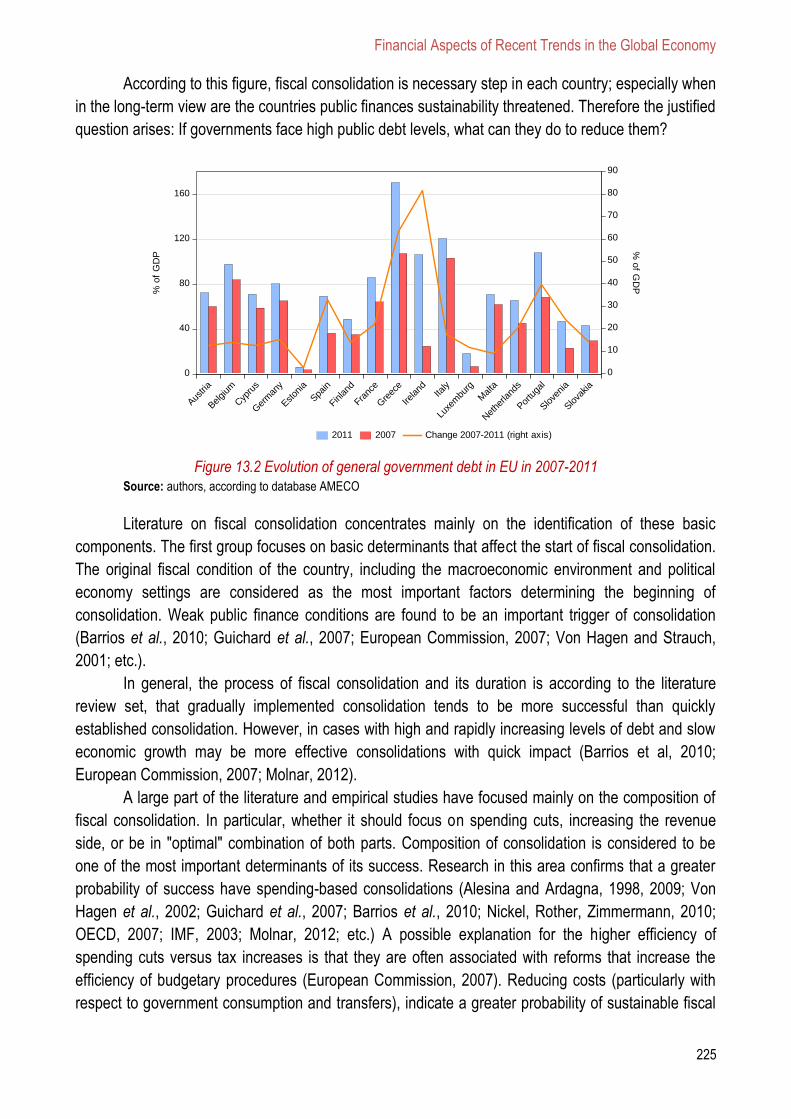
Financial Aspects of Recent Trends in the Global Economy
225
According to this figure, fiscal consolidation is necessary step in each country; especially when
in the long-term view are the countries public finances sustainability threatened. Therefore the justified
question arises: If governments face high public debt levels, what can they do to reduce them?
Figure 13.2 Evolution of general government debt in EU in 2007-2011
Source: authors, according to database AMECO
Literature on fiscal consolidation concentrates mainly on the identification of these basic
components. The first group focuses on basic determinants that affect the start of fiscal consolidation.
The original fiscal condition of the country, including the macroeconomic environment and political
economy settings are considered as the most important factors determining the beginning of
consolidation. Weak public finance conditions are found to be an important trigger of consolidation
(Barrios et al., 2010; Guichard et al., 2007; European Commission, 2007; Von Hagen and Strauch,
2001; etc.).
In general, the process of fiscal consolidation and its duration is according to the literature
review set, that gradually implemented consolidation tends to be more successful than quickly
established consolidation. However, in cases with high and rapidly increasing levels of debt and slow
economic growth may be more effective consolidations with quick impact (Barrios et al, 2010;
European Commission, 2007; Molnar, 2012).
A large part of the literature and empirical studies have focused mainly on the composition of
fiscal consolidation. In particular, whether it should focus on spending cuts, increasing the revenue
side, or be in "optimal" combination of both parts. Composition of consolidation is considered to be
one of the most important determinants of its success. Research in this area confirms that a greater
probability of success have spending-based consolidations (Alesina and Ardagna, 1998, 2009; Von
Hagen et al., 2002; Guichard et al., 2007; Barrios et al., 2010; Nickel, Rother, Zimmermann, 2010;
OECD, 2007; IMF, 2003; Molnar, 2012; etc.) A possible explanation for the higher efficiency of
spending cuts versus tax increases is that they are often associated with reforms that increase the
efficiency of budgetary procedures (European Commission, 2007). Reducing costs (particularly with
respect to government consumption and transfers), indicate a greater probability of sustainable fiscal
0
40
80
120
160
Austri
a
Belgi
um
Cyp
rus
Ger
man
y
Eston
ia
Spain
Finland
Franc
e
Gre
ece
Ireland
Italy
Luxe
mbu
rg
Malta
Net
herla
nds
Portu
gal
Slove
nia
Slova
kia
2011 2007
% o
f G
DP
0
10
20
30
40
50
60
70
80
90
Change 2007-2011 (right axis)
% o
f GD
P
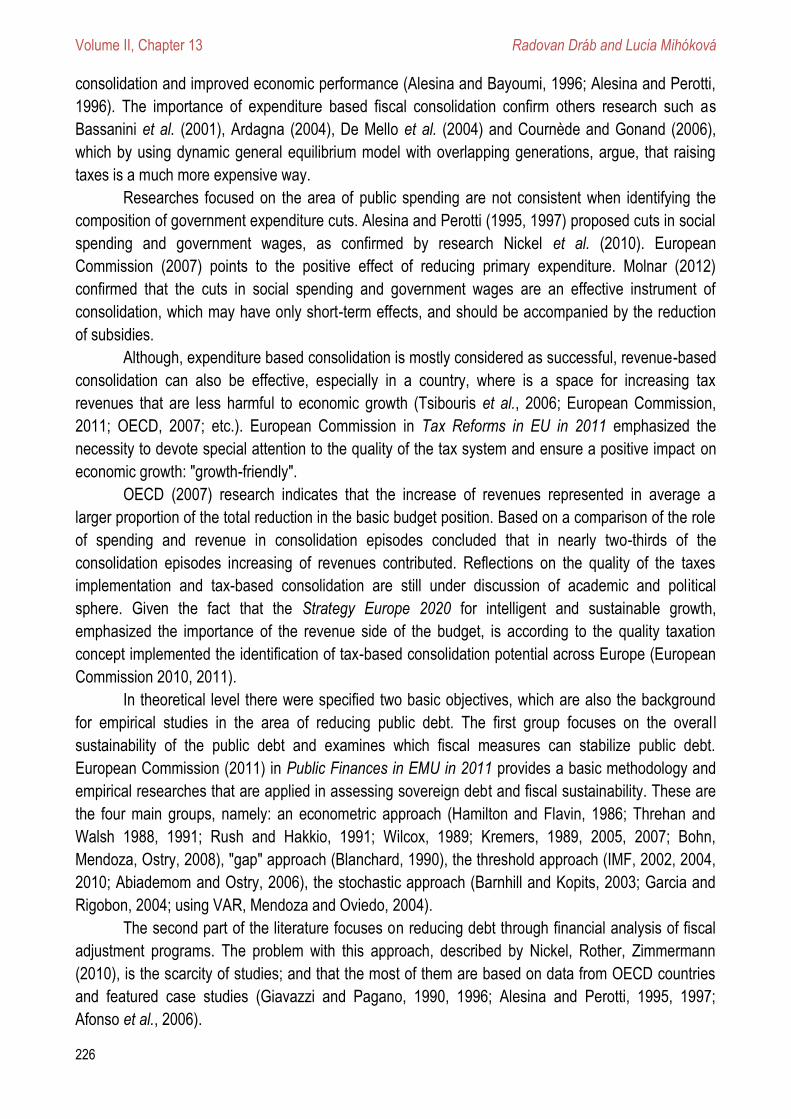
Volume II, Chapter 13 Radovan Dráb and Lucia Mihóková
226
consolidation and improved economic performance (Alesina and Bayoumi, 1996; Alesina and Perotti,
1996). The importance of expenditure based fiscal consolidation confirm others research such as
Bassanini et al. (2001), Ardagna (2004), De Mello et al. (2004) and Cournède and Gonand (2006),
which by using dynamic general equilibrium model with overlapping generations, argue, that raising
taxes is a much more expensive way.
Researches focused on the area of public spending are not consistent when identifying the
composition of government expenditure cuts. Alesina and Perotti (1995, 1997) proposed cuts in social
spending and government wages, as confirmed by research Nickel et al. (2010). European
Commission (2007) points to the positive effect of reducing primary expenditure. Molnar (2012)
confirmed that the cuts in social spending and government wages are an effective instrument of
consolidation, which may have only short-term effects, and should be accompanied by the reduction
of subsidies.
Although, expenditure based consolidation is mostly considered as successful, revenue-based
consolidation can also be effective, especially in a country, where is a space for increasing tax
revenues that are less harmful to economic growth (Tsibouris et al., 2006; European Commission,
2011; OECD, 2007; etc.). European Commission in Tax Reforms in EU in 2011 emphasized the
necessity to devote special attention to the quality of the tax system and ensure a positive impact on
economic growth: "growth-friendly".
OECD (2007) research indicates that the increase of revenues represented in average a
larger proportion of the total reduction in the basic budget position. Based on a comparison of the role
of spending and revenue in consolidation episodes concluded that in nearly two-thirds of the
consolidation episodes increasing of revenues contributed. Reflections on the quality of the taxes
implementation and tax-based consolidation are still under discussion of academic and political
sphere. Given the fact that the Strategy Europe 2020 for intelligent and sustainable growth,
emphasized the importance of the revenue side of the budget, is according to the quality taxation
concept implemented the identification of tax-based consolidation potential across Europe (European
Commission 2010, 2011).
In theoretical level there were specified two basic objectives, which are also the background
for empirical studies in the area of reducing public debt. The first group focuses on the overall
sustainability of the public debt and examines which fiscal measures can stabilize public debt.
European Commission (2011) in Public Finances in EMU in 2011 provides a basic methodology and
empirical researches that are applied in assessing sovereign debt and fiscal sustainability. These are
the four main groups, namely: an econometric approach (Hamilton and Flavin, 1986; Threhan and
Walsh 1988, 1991; Rush and Hakkio, 1991; Wilcox, 1989; Kremers, 1989, 2005, 2007; Bohn,
Mendoza, Ostry, 2008), "gap" approach (Blanchard, 1990), the threshold approach (IMF, 2002, 2004,
2010; Abiademom and Ostry, 2006), the stochastic approach (Barnhill and Kopits, 2003; Garcia and
Rigobon, 2004; using VAR, Mendoza and Oviedo, 2004).
The second part of the literature focuses on reducing debt through financial analysis of fiscal
adjustment programs. The problem with this approach, described by Nickel, Rother, Zimmermann
(2010), is the scarcity of studies; and that the most of them are based on data from OECD countries
and featured case studies (Giavazzi and Pagano, 1990, 1996; Alesina and Perotti, 1995, 1997;
Afonso et al., 2006).
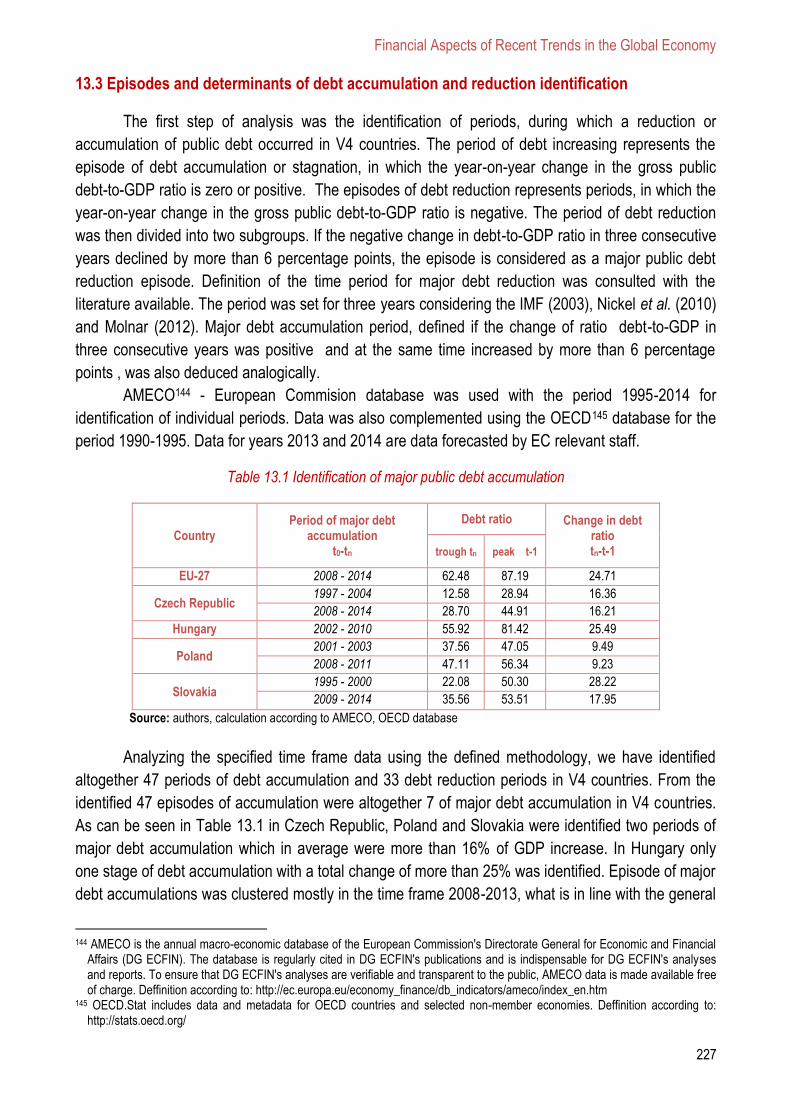
Financial Aspects of Recent Trends in the Global Economy
227
13.3 Episodes and determinants of debt accumulation and reduction identification
The first step of analysis was the identification of periods, during which a reduction or
accumulation of public debt occurred in V4 countries. The period of debt increasing represents the
episode of debt accumulation or stagnation, in which the year-on-year change in the gross public
debt-to-GDP ratio is zero or positive. The episodes of debt reduction represents periods, in which the
year-on-year change in the gross public debt-to-GDP ratio is negative. The period of debt reduction
was then divided into two subgroups. If the negative change in debt-to-GDP ratio in three consecutive
years declined by more than 6 percentage points, the episode is considered as a major public debt
reduction episode. Definition of the time period for major debt reduction was consulted with the
literature available. The period was set for three years considering the IMF (2003), Nickel et al. (2010)
and Molnar (2012). Major debt accumulation period, defined if the change of ratio debt-to-GDP in
three consecutive years was positive and at the same time increased by more than 6 percentage
points , was also deduced analogically.
AMECO144 - European Commision database was used with the period 1995-2014 for
identification of individual periods. Data was also complemented using the OECD145 database for the
period 1990-1995. Data for years 2013 and 2014 are data forecasted by EC relevant staff.
Table 13.1 Identification of major public debt accumulation
Country Period of major debt
accumulation t0-tn
Debt ratio Change in debt ratio tn-t-1 trough tn peak t-1
EU-27 2008 - 2014 62.48 87.19 24.71
Czech Republic 1997 - 2004 12.58 28.94 16.36
2008 - 2014 28.70 44.91 16.21
Hungary 2002 - 2010 55.92 81.42 25.49
Poland 2001 - 2003 37.56 47.05 9.49
2008 - 2011 47.11 56.34 9.23
Slovakia 1995 - 2000 22.08 50.30 28.22
2009 - 2014 35.56 53.51 17.95
Source: authors, calculation according to AMECO, OECD database
Analyzing the specified time frame data using the defined methodology, we have identified
altogether 47 periods of debt accumulation and 33 debt reduction periods in V4 countries. From the
identified 47 episodes of accumulation were altogether 7 of major debt accumulation in V4 countries.
As can be seen in Table 13.1 in Czech Republic, Poland and Slovakia were identified two periods of
major debt accumulation which in average were more than 16% of GDP increase. In Hungary only
one stage of debt accumulation with a total change of more than 25% was identified. Episode of major
debt accumulations was clustered mostly in the time frame 2008-2013, what is in line with the general
144 AMECO is the annual macro-economic database of the European Commission's Directorate General for Economic and Financial
Affairs (DG ECFIN). The database is regularly cited in DG ECFIN's publications and is indispensable for DG ECFIN's analyses and reports. To ensure that DG ECFIN's analyses are verifiable and transparent to the public, AMECO data is made available free of charge. Deffinition according to: http://ec.europa.eu/economy_finance/db_indicators/ameco/index_en.htm
145 OECD.Stat includes data and metadata for OECD countries and selected non-member economies. Deffinition according to: http://stats.oecd.org/
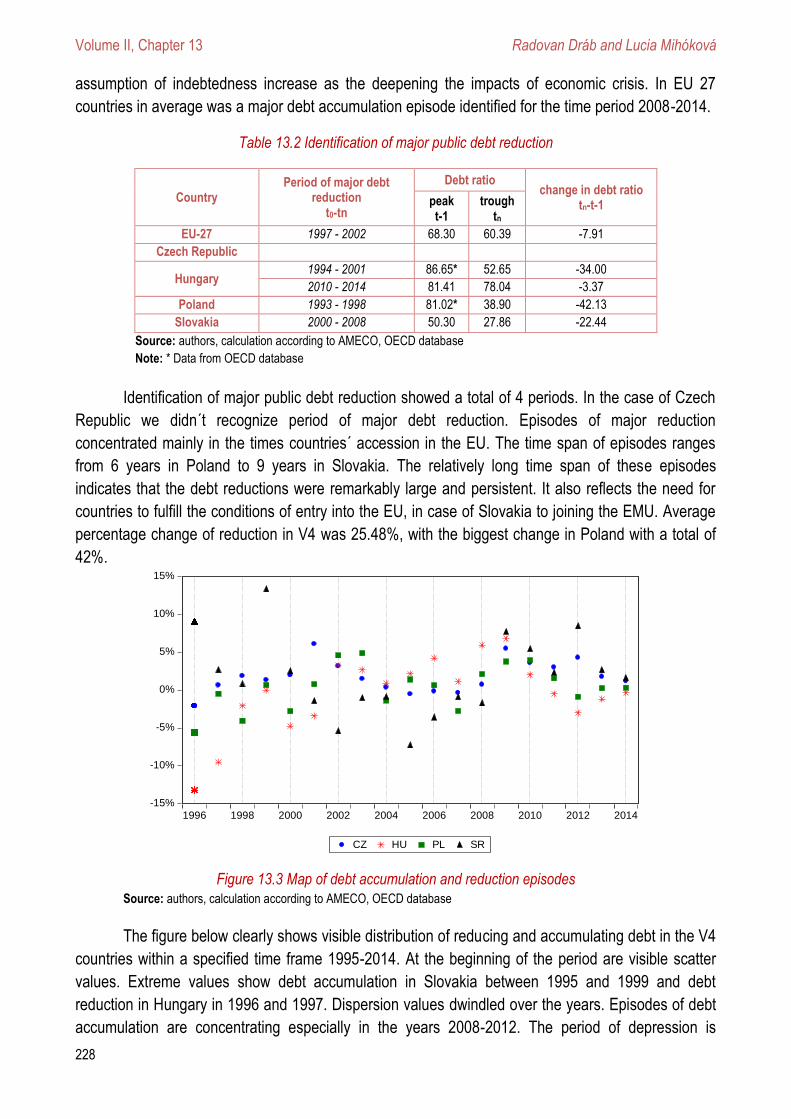
Volume II, Chapter 13 Radovan Dráb and Lucia Mihóková
228
assumption of indebtedness increase as the deepening the impacts of economic crisis. In EU 27
countries in average was a major debt accumulation episode identified for the time period 2008-2014.
Table 13.2 Identification of major public debt reduction
Country Period of major debt
reduction t0-tn
Debt ratio change in debt ratio
tn-t-1 peak t-1
trough tn
EU-27 1997 - 2002 68.30 60.39 -7.91
Czech Republic
Hungary 1994 - 2001 86.65* 52.65 -34.00
2010 - 2014 81.41 78.04 -3.37
Poland 1993 - 1998 81.02* 38.90 -42.13
Slovakia 2000 - 2008 50.30 27.86 -22.44
Source: authors, calculation according to AMECO, OECD database
Note: * Data from OECD database
Identification of major public debt reduction showed a total of 4 periods. In the case of Czech
Republic we didn´t recognize period of major debt reduction. Episodes of major reduction
concentrated mainly in the times countries´ accession in the EU. The time span of episodes ranges
from 6 years in Poland to 9 years in Slovakia. The relatively long time span of these episodes
indicates that the debt reductions were remarkably large and persistent. It also reflects the need for
countries to fulfill the conditions of entry into the EU, in case of Slovakia to joining the EMU. Average
percentage change of reduction in V4 was 25.48%, with the biggest change in Poland with a total of
42%.
Figure 13.3 Map of debt accumulation and reduction episodes
Source: authors, calculation according to AMECO, OECD database
The figure below clearly shows visible distribution of reducing and accumulating debt in the V4
countries within a specified time frame 1995-2014. At the beginning of the period are visible scatter
values. Extreme values show debt accumulation in Slovakia between 1995 and 1999 and debt
reduction in Hungary in 1996 and 1997. Dispersion values dwindled over the years. Episodes of debt
accumulation are concentrating especially in the years 2008-2012. The period of depression is
-15%
-10%
-5%
0%
5%
10%
15%
1996 1998 2000 2002 2004 2006 2008 2010 2012 2014
CZ HU PL SR
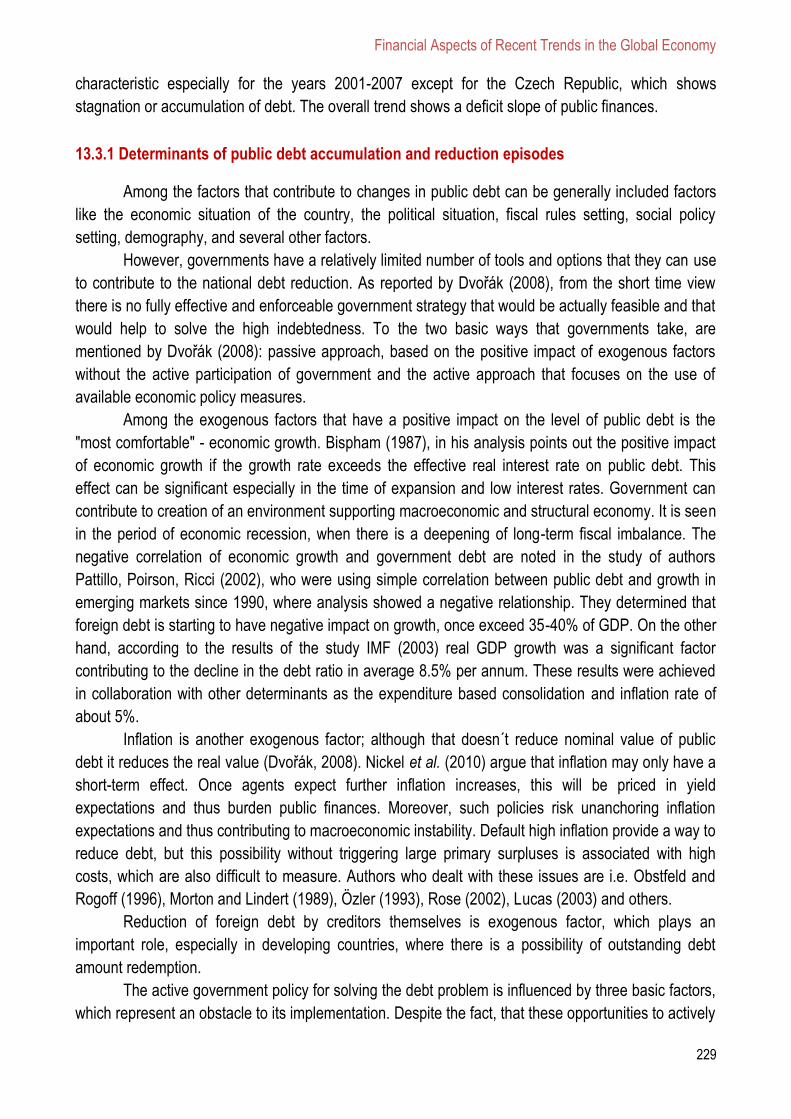
Financial Aspects of Recent Trends in the Global Economy
229
characteristic especially for the years 2001-2007 except for the Czech Republic, which shows
stagnation or accumulation of debt. The overall trend shows a deficit slope of public finances.
13.3.1 Determinants of public debt accumulation and reduction episodes
Among the factors that contribute to changes in public debt can be generally included factors
like the economic situation of the country, the political situation, fiscal rules setting, social policy
setting, demography, and several other factors.
However, governments have a relatively limited number of tools and options that they can use
to contribute to the national debt reduction. As reported by Dvořák (2008), from the short time view
there is no fully effective and enforceable government strategy that would be actually feasible and that
would help to solve the high indebtedness. To the two basic ways that governments take, are
mentioned by Dvořák (2008): passive approach, based on the positive impact of exogenous factors
without the active participation of government and the active approach that focuses on the use of
available economic policy measures.
Among the exogenous factors that have a positive impact on the level of public debt is the
"most comfortable" - economic growth. Bispham (1987), in his analysis points out the positive impact
of economic growth if the growth rate exceeds the effective real interest rate on public debt. This
effect can be significant especially in the time of expansion and low interest rates. Government can
contribute to creation of an environment supporting macroeconomic and structural economy. It is seen
in the period of economic recession, when there is a deepening of long-term fiscal imbalance. The
negative correlation of economic growth and government debt are noted in the study of authors
Pattillo, Poirson, Ricci (2002), who were using simple correlation between public debt and growth in
emerging markets since 1990, where analysis showed a negative relationship. They determined that
foreign debt is starting to have negative impact on growth, once exceed 35-40% of GDP. On the other
hand, according to the results of the study IMF (2003) real GDP growth was a significant factor
contributing to the decline in the debt ratio in average 8.5% per annum. These results were achieved
in collaboration with other determinants as the expenditure based consolidation and inflation rate of
about 5%.
Inflation is another exogenous factor; although that doesn´t reduce nominal value of public
debt it reduces the real value (Dvořák, 2008). Nickel et al. (2010) argue that inflation may only have a
short-term effect. Once agents expect further inflation increases, this will be priced in yield
expectations and thus burden public finances. Moreover, such policies risk unanchoring inflation
expectations and thus contributing to macroeconomic instability. Default high inflation provide a way to
reduce debt, but this possibility without triggering large primary surpluses is associated with high
costs, which are also difficult to measure. Authors who dealt with these issues are i.e. Obstfeld and
Rogoff (1996), Morton and Lindert (1989), Özler (1993), Rose (2002), Lucas (2003) and others.
Reduction of foreign debt by creditors themselves is exogenous factor, which plays an
important role, especially in developing countries, where there is a possibility of outstanding debt
amount redemption.
The active government policy for solving the debt problem is influenced by three basic factors,
which represent an obstacle to its implementation. Despite the fact, that these opportunities to actively
Volume II, Chapter 13 Radovan Dráb and Lucia Mihóková
230
reduce the debt to GDP ratio are limited, some countries have made in the past some surprising
results. IMF study (2003) provides concrete examples of countries, where there has been a significant
reduction in the public debt, as well as an overview of the instruments and the factors that contributed
to its reduction. As IMF (2003) explained, when the government faced high levels of public debt, they
have mainly political means to reduce it. These include in particular the setting of fiscal policy and
running primary budget surpluses, the efforts of economic growth increase, or sell assets to repay the
debt gradually. All these options have their advantages and disadvantages.
The IMF study (2003), OECD study (2007), Nickel et al. (2010), Molnar (2012) econometric
analysis confirms that the primary balance plays an important role at the beginning, the size, duration,
and especially success of consolidation for achieving fiscal sustainability.
Regarding the size of fiscal consolidation, analysis confirmed the importance of the initial
budgetary conditions. The higher initial primary deficit means the greater overall consolidation
achieved during the episode. Higher values of initial deficit were also associated with a longer period
of consolidation (OECD, 2007). Analysis of Nickel et al. (2010) in the EU has shown that debt
reduction occurred mainly in periods of strong economic growth and was due to a high level of primary
balances supported by spending cuts. Primary surpluses were twice as large as in the major and
modest debt reducing episodes, indicating that the fiscal cuts have been responsible for the most of
major changes. On the other hand, an increase in revenues did not result to debt reduction.
Indispensable factor is the composition of fiscal consolidation. Research Alesina and Perotti
(1996), Alesina and Ardagna (1998), Alesina and Bayoumi (1996) and Von Hagen et al. (2002) shows
that it is more likely to achive sustaining fiscal consolidation and enhance economic performance by
restrictions on spending (especially government consumption and transfers) and by solving politically
sensitive items on the budget (transfers, subsidies and government wages) support permanent fiscal
consolidation and support the economic performance. On the expenditure consolidation and greater
emphasis on cuts in social spending points out the study by OECD (2007). Further research carried
out in the success of fiscal consolidation is given in first section.
Fiscal consolidation may not be focused on just one area. This argument confirms previous
research by Von Hagen et al. (2002), which states that some countries have relied on the so-called
"switching strategies". It means that the government begins the fiscal consolidation by raising taxes
and / or reducing the investments and later this strategy is extended, which means reducing current
expenditures.
OECD (2007) emphasizes and empirically derives the importance of the next determinants,
which are the setting of fiscal rules, containing political mechanisms to prevent excessive spending of
state budgets. Based on the empirical analysis, suggests that fiscal rules with embedded expenditure
targets tended to be associated with larger and longer adjustments, and higher success rates. Fiscal
rules influenced the size of fiscal consolidation as well as intensity and its duration. The results of this
study also indicate that combined spending and budget balance rules helped to achieve balance that
stabilized to the debt-to-GDP ratio.
Factors that are involved in influencing the debt reduction periods we consider also as the
determinants of the debt accumulation period. Dvořák (2008) draws attention to four key
determinants, which include: the default value of the share of public debt due to interest rate and the
growth rate of GDP at the beginning of the financial year, the size of the primary deficit in the budget
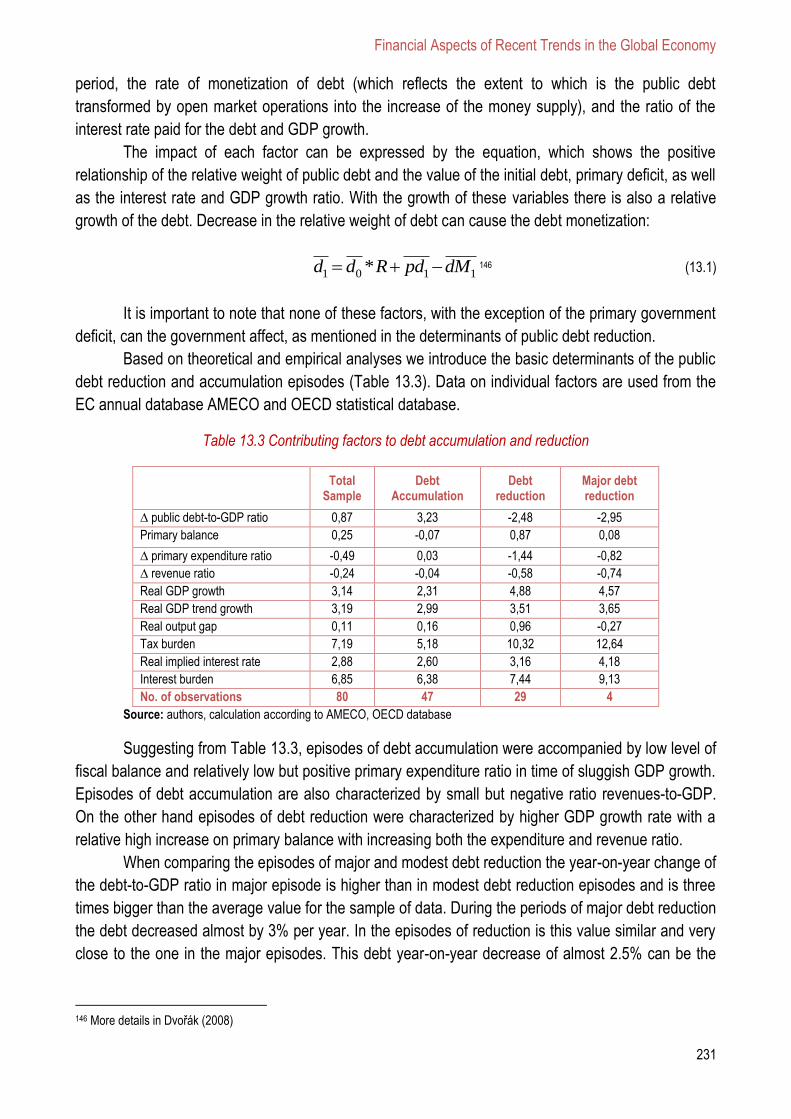
Financial Aspects of Recent Trends in the Global Economy
231
period, the rate of monetization of debt (which reflects the extent to which is the public debt
transformed by open market operations into the increase of the money supply), and the ratio of the
interest rate paid for the debt and GDP growth.
The impact of each factor can be expressed by the equation, which shows the positive
relationship of the relative weight of public debt and the value of the initial debt, primary deficit, as well
as the interest rate and GDP growth ratio. With the growth of these variables there is also a relative
growth of the debt. Decrease in the relative weight of debt can cause the debt monetization:
1 0 1 1*d d R pd dM 146 (13.1)
It is important to note that none of these factors, with the exception of the primary government
deficit, can the government affect, as mentioned in the determinants of public debt reduction.
Based on theoretical and empirical analyses we introduce the basic determinants of the public
debt reduction and accumulation episodes (Table 13.3). Data on individual factors are used from the
EC annual database AMECO and OECD statistical database.
Table 13.3 Contributing factors to debt accumulation and reduction
Total
Sample Debt
Accumulation Debt
reduction Major debt reduction
∆ public debt-to-GDP ratio 0,87 3,23 -2,48 -2,95
Primary balance 0,25 -0,07 0,87 0,08
∆ primary expenditure ratio -0,49 0,03 -1,44 -0,82
∆ revenue ratio -0,24 -0,04 -0,58 -0,74
Real GDP growth 3,14 2,31 4,88 4,57
Real GDP trend growth 3,19 2,99 3,51 3,65
Real output gap 0,11 0,16 0,96 -0,27
Tax burden 7,19 5,18 10,32 12,64
Real implied interest rate 2,88 2,60 3,16 4,18
Interest burden 6,85 6,38 7,44 9,13
No. of observations 80 47 29 4
Source: authors, calculation according to AMECO, OECD database
Suggesting from Table 13.3, episodes of debt accumulation were accompanied by low level of
fiscal balance and relatively low but positive primary expenditure ratio in time of sluggish GDP growth.
Episodes of debt accumulation are also characterized by small but negative ratio revenues-to-GDP.
On the other hand episodes of debt reduction were characterized by higher GDP growth rate with a
relative high increase on primary balance with increasing both the expenditure and revenue ratio.
When comparing the episodes of major and modest debt reduction the year-on-year change of
the debt-to-GDP ratio in major episode is higher than in modest debt reduction episodes and is three
times bigger than the average value for the sample of data. During the periods of major debt reduction
the debt decreased almost by 3% per year. In the episodes of reduction is this value similar and very
close to the one in the major episodes. This debt year-on-year decrease of almost 2.5% can be the
146 More details in Dvořák (2008)
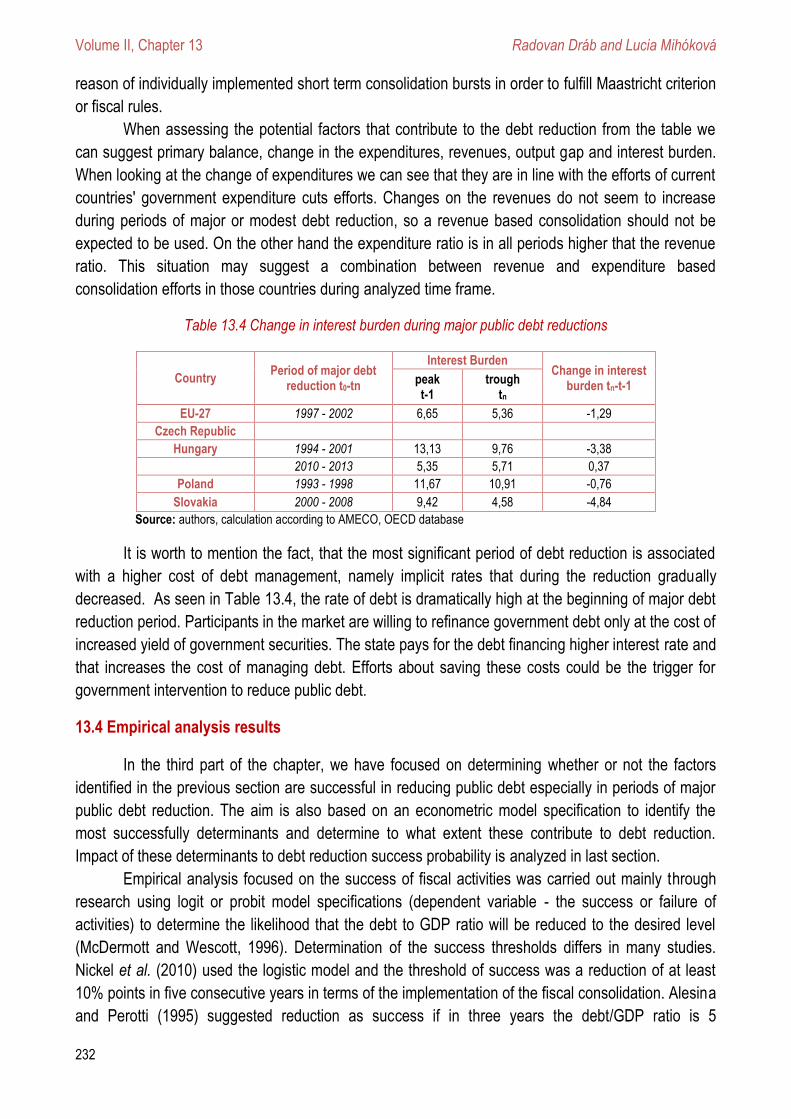
Volume II, Chapter 13 Radovan Dráb and Lucia Mihóková
232
reason of individually implemented short term consolidation bursts in order to fulfill Maastricht criterion
or fiscal rules.
When assessing the potential factors that contribute to the debt reduction from the table we
can suggest primary balance, change in the expenditures, revenues, output gap and interest burden.
When looking at the change of expenditures we can see that they are in line with the efforts of current
countries' government expenditure cuts efforts. Changes on the revenues do not seem to increase
during periods of major or modest debt reduction, so a revenue based consolidation should not be
expected to be used. On the other hand the expenditure ratio is in all periods higher that the revenue
ratio. This situation may suggest a combination between revenue and expenditure based
consolidation efforts in those countries during analyzed time frame.
Table 13.4 Change in interest burden during major public debt reductions
Country Period of major debt
reduction t0-tn
Interest Burden Change in interest
burden tn-t-1 peak t-1
trough tn
EU-27 1997 - 2002 6,65 5,36 -1,29
Czech Republic
Hungary 1994 - 2001 13,13 9,76 -3,38
2010 - 2013 5,35 5,71 0,37
Poland 1993 - 1998 11,67 10,91 -0,76
Slovakia 2000 - 2008 9,42 4,58 -4,84
Source: authors, calculation according to AMECO, OECD database
It is worth to mention the fact, that the most significant period of debt reduction is associated
with a higher cost of debt management, namely implicit rates that during the reduction gradually
decreased. As seen in Table 13.4, the rate of debt is dramatically high at the beginning of major debt
reduction period. Participants in the market are willing to refinance government debt only at the cost of
increased yield of government securities. The state pays for the debt financing higher interest rate and
that increases the cost of managing debt. Efforts about saving these costs could be the trigger for
government intervention to reduce public debt.
13.4 Empirical analysis results
In the third part of the chapter, we have focused on determining whether or not the factors
identified in the previous section are successful in reducing public debt especially in periods of major
public debt reduction. The aim is also based on an econometric model specification to identify the
most successfully determinants and determine to what extent these contribute to debt reduction.
Impact of these determinants to debt reduction success probability is analyzed in last section.
Empirical analysis focused on the success of fiscal activities was carried out mainly through
research using logit or probit model specifications (dependent variable - the success or failure of
activities) to determine the likelihood that the debt to GDP ratio will be reduced to the desired level
(McDermott and Wescott, 1996). Determination of the success thresholds differs in many studies.
Nickel et al. (2010) used the logistic model and the threshold of success was a reduction of at least
10% points in five consecutive years in terms of the implementation of the fiscal consolidation. Alesina
and Perotti (1995) suggested reduction as success if in three years the debt/GDP ratio is 5
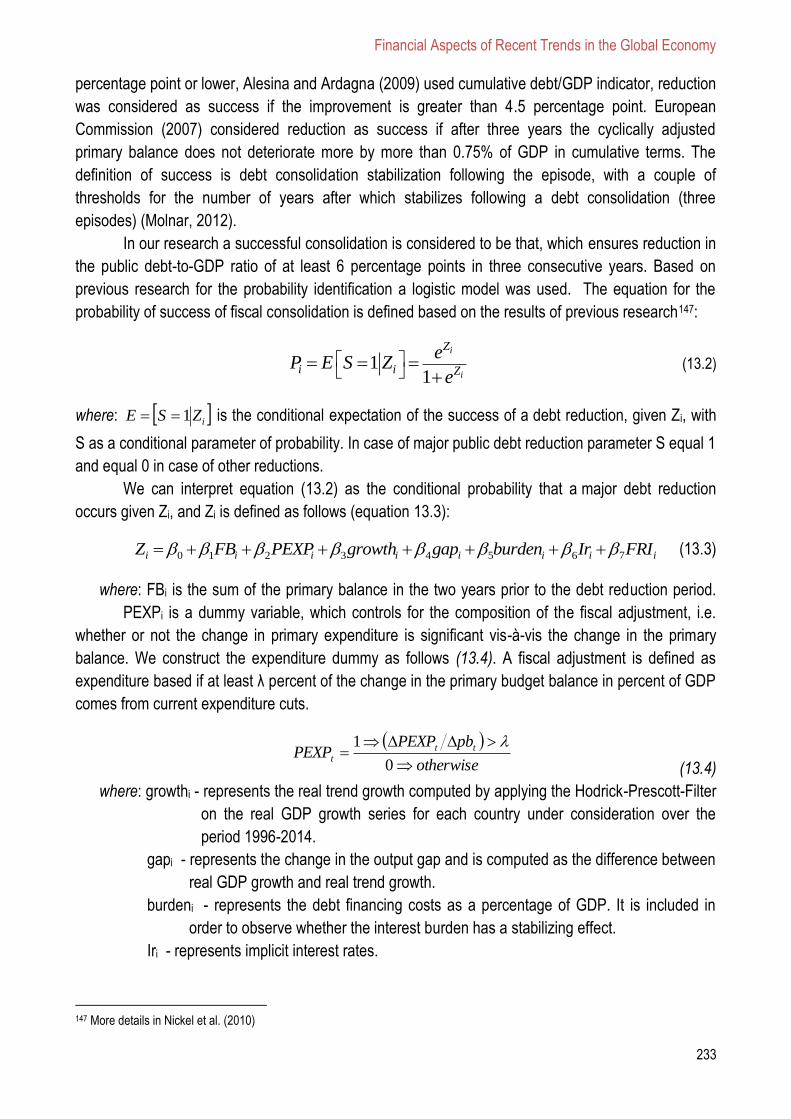
Financial Aspects of Recent Trends in the Global Economy
233
percentage point or lower, Alesina and Ardagna (2009) used cumulative debt/GDP indicator, reduction
was considered as success if the improvement is greater than 4.5 percentage point. European
Commission (2007) considered reduction as success if after three years the cyclically adjusted
primary balance does not deteriorate more by more than 0.75% of GDP in cumulative terms. The
definition of success is debt consolidation stabilization following the episode, with a couple of
thresholds for the number of years after which stabilizes following a debt consolidation (three
episodes) (Molnar, 2012).
In our research a successful consolidation is considered to be that, which ensures reduction in
the public debt-to-GDP ratio of at least 6 percentage points in three consecutive years. Based on
previous research for the probability identification a logistic model was used. The equation for the
probability of success of fiscal consolidation is defined based on the results of previous research147:
11
i
i
Z
i i Z
eP E S Z
e
(13.2)
where: iZSE 1 is the conditional expectation of the success of a debt reduction, given Zi, with
S as a conditional parameter of probability. In case of major public debt reduction parameter S equal 1
and equal 0 in case of other reductions.
We can interpret equation (13.2) as the conditional probability that a major debt reduction
occurs given Zi, and Zi is defined as follows (equation 13.3):
5 70 1 2 3 4 6i i i i i i i iZ FB PEXP growth gap burden Ir FRI (13.3)
where: FBi is the sum of the primary balance in the two years prior to the debt reduction period.
PEXPi is a dummy variable, which controls for the composition of the fiscal adjustment, i.e.
whether or not the change in primary expenditure is significant vis-à-vis the change in the primary
balance. We construct the expenditure dummy as follows (13.4). A fiscal adjustment is defined as
expenditure based if at least λ percent of the change in the primary budget balance in percent of GDP
comes from current expenditure cuts.
otherwise
pbPEXPPEXP tt
t
0
1
(13.4)
where: growthi - represents the real trend growth computed by applying the Hodrick-Prescott-Filter
on the real GDP growth series for each country under consideration over the
period 1996-2014.
gapi - represents the change in the output gap and is computed as the difference between
real GDP growth and real trend growth.
burdeni - represents the debt financing costs as a percentage of GDP. It is included in
order to observe whether the interest burden has a stabilizing effect.
Iri - represents implicit interest rates.
147 More details in Nickel et al. (2010)

Volume II, Chapter 13 Radovan Dráb and Lucia Mihóková
234
FRIi - a comprehensive time-varying fiscal rule index for each state was constructed by
summing up all fiscal rule strength indices in force in the respective State weighted
by the coverage of general government finances of the respective rule. Fiscal rules
represent numerical fiscal rules, which specify numerical targets for key budgetary
aggregates such as annual budget balance, expenditure, revenue, or debt.
Similarly was derived fiscal consolidation focused on the revenue side. By equation we have used
similar manner defining revenue dummy variable REVi, which is described as follows (equation 13.6):
iiiiiiii FRIIrburdengapgrowthREVFBZ 76543210 (13.5)
where: REVi is a dummy variable which controls for the composition of the fiscal adjustment, whether
or not the change in primary revenue is significant in the vis-à-vis the change in the primary balance.
We construct dummy as follows:
1
0
t t
t
REV pbREV
otherwise
(13.6)
In the assessment of impact of fiscal consolidation, based on expenditure respectively
revenue side, literature often indicates the existence of a combination of expenditure and revenue
based consolidation. These are so called switching strategies, in which one type of consolidation may
change over time to the second. In the model, we consider the existence of this type of strategy with a
slight difference. We have defined the switching strategy as a combination of both revenue and
expenditure based consolidation that can be applied at once, or can switch according the former
definition. To identify the period with this switching strategy we have used a dummy variable. The first
step by its construction was setting up the optimal threshold for the two dummy indicators
responsible for consolidation type: PEXPi and REVi. These values were identified using an
optimization process applied to panel data of countries in the analysed period. Dummy variable switch
strategy was then set as follows:
0
11
11
111
22112,1
22112,1
t
iiiitt
iiiitt
iit
SWITCH
else
REVPEXPREVPEXPSWITCH
REVPEXPREVPEXPSWITCH
REVPEXPSWITCH
(13.7)
A. Empirical results
The estimation results of the equations (13.3), (13.5) and (13.7) are reported in this section.
We have divided the estimations of model coefficients in several tables, depending on the specified
threshold and also the analysis of the consolidation type. In this section we have analyzed the
impact and significance of factors for debt reduction defined by the debt-to-GDP ratio.
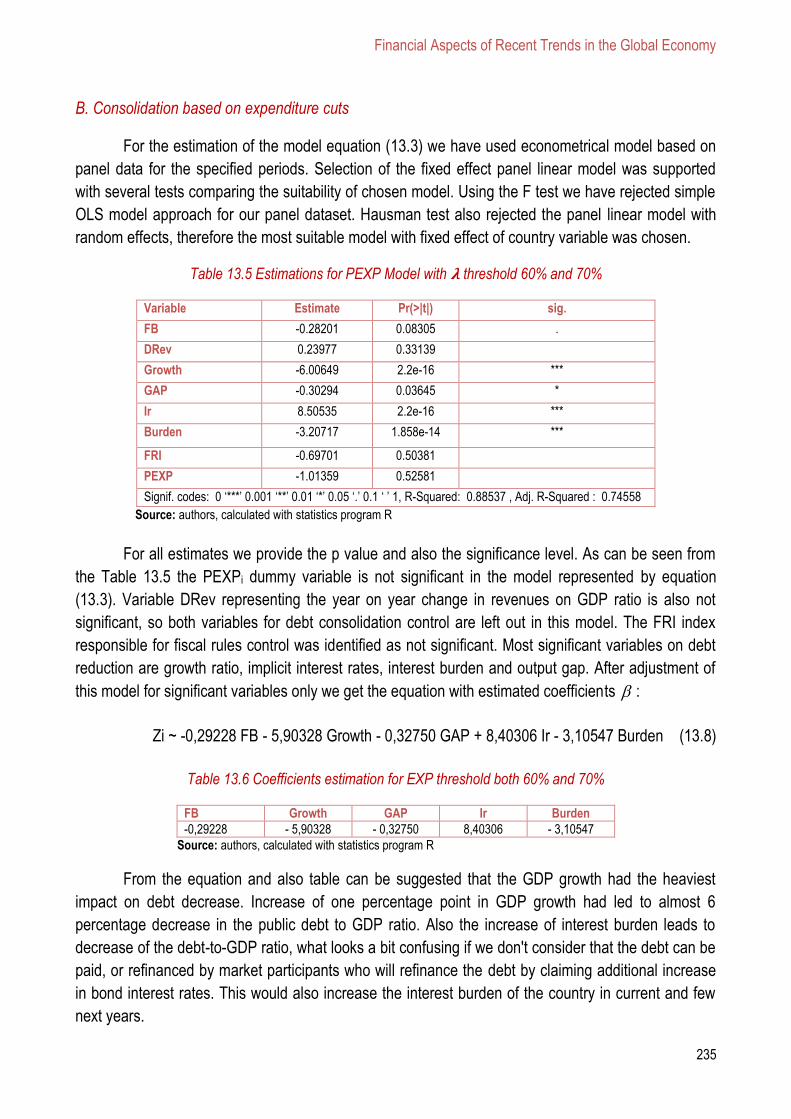
Financial Aspects of Recent Trends in the Global Economy
235
B. Consolidation based on expenditure cuts
For the estimation of the model equation (13.3) we have used econometrical model based on
panel data for the specified periods. Selection of the fixed effect panel linear model was supported
with several tests comparing the suitability of chosen model. Using the F test we have rejected simple
OLS model approach for our panel dataset. Hausman test also rejected the panel linear model with
random effects, therefore the most suitable model with fixed effect of country variable was chosen.
Table 13.5 Estimations for PEXP Model with 𝛌 threshold 60% and 70%
Variable Estimate Pr(>|t|) sig.
FB -0.28201 0.08305 .
DRev 0.23977 0.33139
Growth -6.00649 2.2e-16 ***
GAP -0.30294 0.03645 *
Ir 8.50535 2.2e-16 ***
Burden -3.20717 1.858e-14 ***
FRI -0.69701 0.50381
PEXP -1.01359 0.52581
Signif. codes: 0 ‘***’ 0.001 ‘**’ 0.01 ‘*’ 0.05 ‘.’ 0.1 ‘ ’ 1, R-Squared: 0.88537 , Adj. R-Squared : 0.74558
Source: authors, calculated with statistics program R
For all estimates we provide the p value and also the significance level. As can be seen from
the Table 13.5 the PEXPi dummy variable is not significant in the model represented by equation
(13.3). Variable DRev representing the year on year change in revenues on GDP ratio is also not
significant, so both variables for debt consolidation control are left out in this model. The FRI index
responsible for fiscal rules control was identified as not significant. Most significant variables on debt
reduction are growth ratio, implicit interest rates, interest burden and output gap. After adjustment of
this model for significant variables only we get the equation with estimated coefficients :
Zi ~ -0,29228 FB - 5,90328 Growth - 0,32750 GAP + 8,40306 Ir - 3,10547 Burden (13.8)
Table 13.6 Coefficients estimation for EXP threshold both 60% and 70%
FB Growth GAP Ir Burden
-0,29228 - 5,90328 - 0,32750 8,40306 - 3,10547
Source: authors, calculated with statistics program R
From the equation and also table can be suggested that the GDP growth had the heaviest
impact on debt decrease. Increase of one percentage point in GDP growth had led to almost 6
percentage decrease in the public debt to GDP ratio. Also the increase of interest burden leads to
decrease of the debt-to-GDP ratio, what looks a bit confusing if we don't consider that the debt can be
paid, or refinanced by market participants who will refinance the debt by claiming additional increase
in bond interest rates. This would also increase the interest burden of the country in current and few
next years.
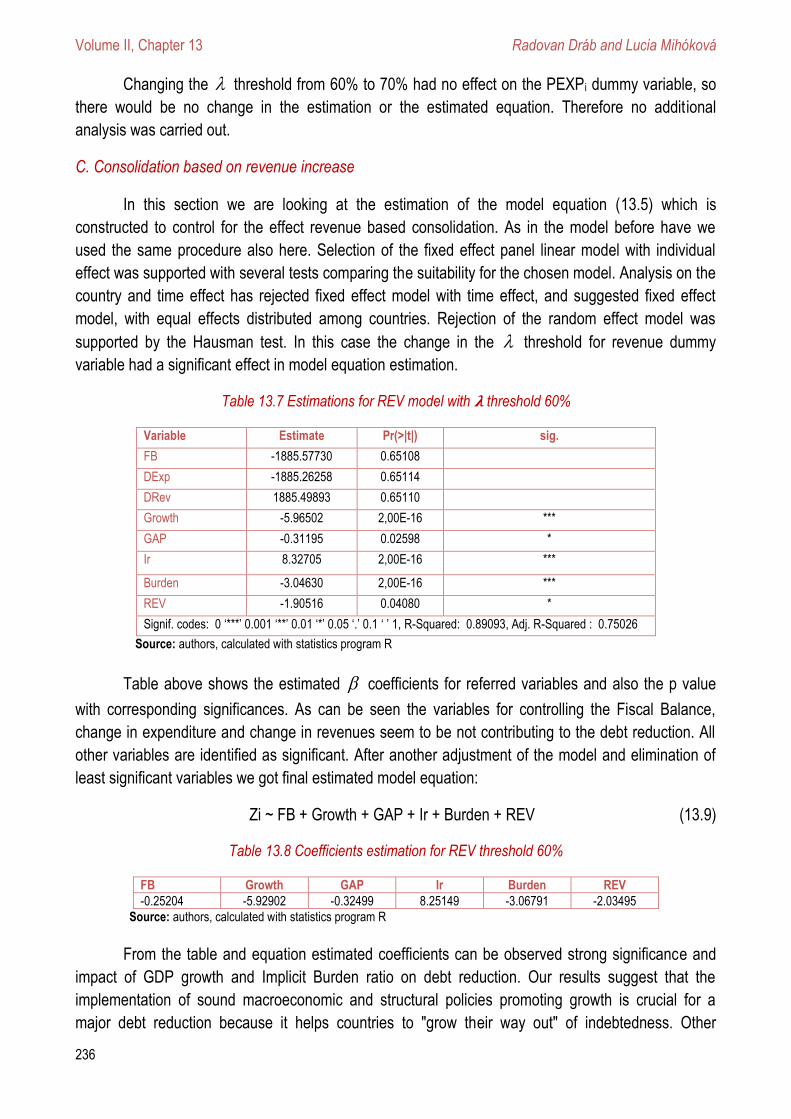
Volume II, Chapter 13 Radovan Dráb and Lucia Mihóková
236
Changing the threshold from 60% to 70% had no effect on the PEXPi dummy variable, so
there would be no change in the estimation or the estimated equation. Therefore no additional
analysis was carried out.
C. Consolidation based on revenue increase
In this section we are looking at the estimation of the model equation (13.5) which is
constructed to control for the effect revenue based consolidation. As in the model before have we
used the same procedure also here. Selection of the fixed effect panel linear model with individual
effect was supported with several tests comparing the suitability for the chosen model. Analysis on the
country and time effect has rejected fixed effect model with time effect, and suggested fixed effect
model, with equal effects distributed among countries. Rejection of the random effect model was
supported by the Hausman test. In this case the change in the threshold for revenue dummy
variable had a significant effect in model equation estimation.
Table 13.7 Estimations for REV model with 𝛌 threshold 60%
Variable Estimate Pr(>|t|) sig.
FB -1885.57730 0.65108
DExp -1885.26258 0.65114
DRev 1885.49893 0.65110
Growth -5.96502 2,00E-16 ***
GAP -0.31195 0.02598 *
Ir 8.32705 2,00E-16 ***
Burden -3.04630 2,00E-16 ***
REV -1.90516 0.04080 *
Signif. codes: 0 ‘***’ 0.001 ‘**’ 0.01 ‘*’ 0.05 ‘.’ 0.1 ‘ ’ 1, R-Squared: 0.89093, Adj. R-Squared : 0.75026
Source: authors, calculated with statistics program R
Table above shows the estimated coefficients for referred variables and also the p value
with corresponding significances. As can be seen the variables for controlling the Fiscal Balance,
change in expenditure and change in revenues seem to be not contributing to the debt reduction. All
other variables are identified as significant. After another adjustment of the model and elimination of
least significant variables we got final estimated model equation:
Zi ~ FB + Growth + GAP + Ir + Burden + REV (13.9)
Table 13.8 Coefficients estimation for REV threshold 60%
FB Growth GAP Ir Burden REV
-0.25204 -5.92902 -0.32499 8.25149 -3.06791 -2.03495
Source: authors, calculated with statistics program R
From the table and equation estimated coefficients can be observed strong significance and
impact of GDP growth and Implicit Burden ratio on debt reduction. Our results suggest that the
implementation of sound macroeconomic and structural policies promoting growth is crucial for a
major debt reduction because it helps countries to "grow their way out" of indebtedness. Other
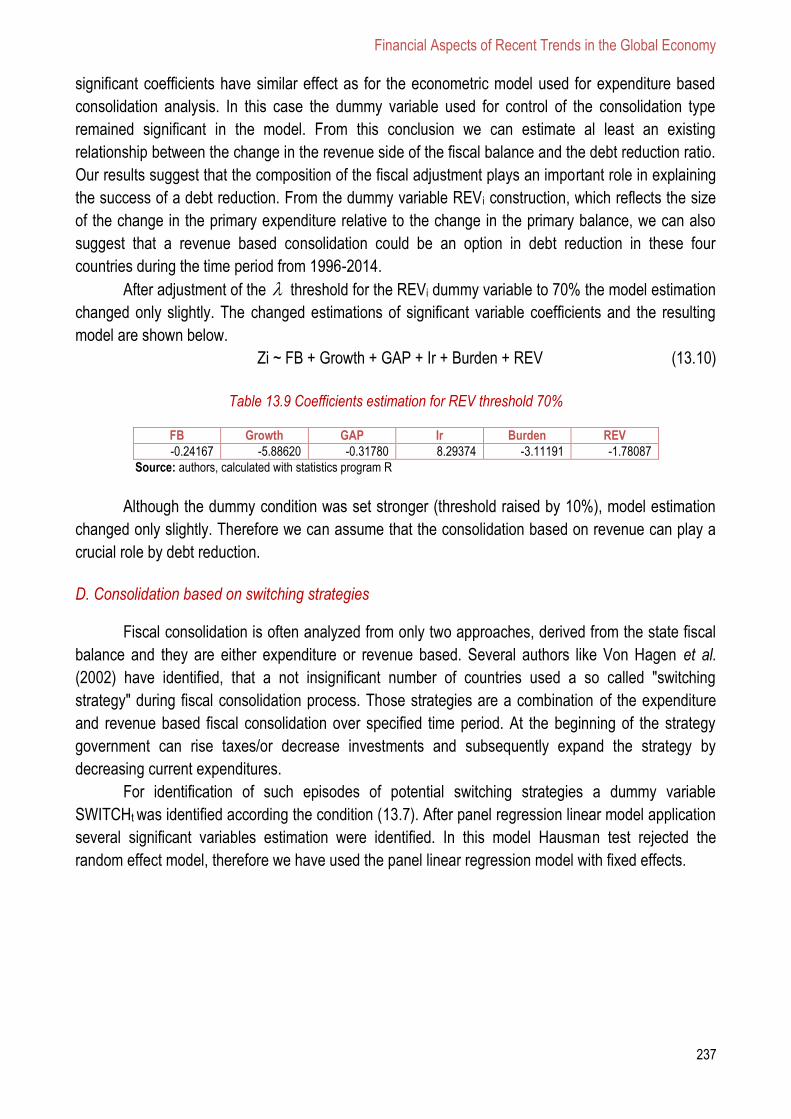
Financial Aspects of Recent Trends in the Global Economy
237
significant coefficients have similar effect as for the econometric model used for expenditure based
consolidation analysis. In this case the dummy variable used for control of the consolidation type
remained significant in the model. From this conclusion we can estimate al least an existing
relationship between the change in the revenue side of the fiscal balance and the debt reduction ratio.
Our results suggest that the composition of the fiscal adjustment plays an important role in explaining
the success of a debt reduction. From the dummy variable REV i construction, which reflects the size
of the change in the primary expenditure relative to the change in the primary balance, we can also
suggest that a revenue based consolidation could be an option in debt reduction in these four
countries during the time period from 1996-2014.
After adjustment of the threshold for the REVi dummy variable to 70% the model estimation
changed only slightly. The changed estimations of significant variable coefficients and the resulting
model are shown below.
Zi ~ FB + Growth + GAP + Ir + Burden + REV (13.10)
Table 13.9 Coefficients estimation for REV threshold 70%
FB Growth GAP Ir Burden REV
-0.24167 -5.88620 -0.31780 8.29374 -3.11191 -1.78087
Source: authors, calculated with statistics program R
Although the dummy condition was set stronger (threshold raised by 10%), model estimation
changed only slightly. Therefore we can assume that the consolidation based on revenue can play a
crucial role by debt reduction.
D. Consolidation based on switching strategies
Fiscal consolidation is often analyzed from only two approaches, derived from the state fiscal
balance and they are either expenditure or revenue based. Several authors like Von Hagen et al.
(2002) have identified, that a not insignificant number of countries used a so called "switching
strategy" during fiscal consolidation process. Those strategies are a combination of the expenditure
and revenue based fiscal consolidation over specified time period. At the beginning of the strategy
government can rise taxes/or decrease investments and subsequently expand the strategy by
decreasing current expenditures.
For identification of such episodes of potential switching strategies a dummy variable
SWITCHt was identified according the condition (13.7). After panel regression linear model application
several significant variables estimation were identified. In this model Hausman test rejected the
random effect model, therefore we have used the panel linear regression model with fixed effects.
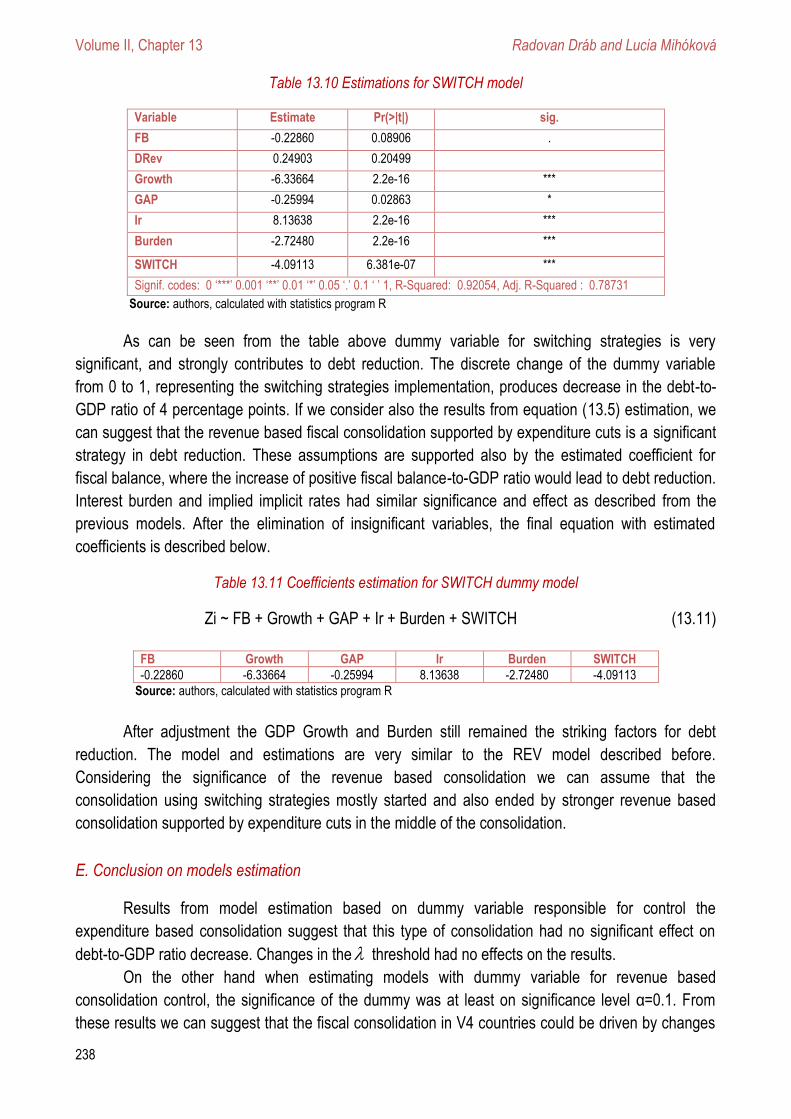
Volume II, Chapter 13 Radovan Dráb and Lucia Mihóková
238
Table 13.10 Estimations for SWITCH model
Variable Estimate Pr(>|t|) sig.
FB -0.22860 0.08906 .
DRev 0.24903 0.20499
Growth -6.33664 2.2e-16 ***
GAP -0.25994 0.02863 *
Ir 8.13638 2.2e-16 ***
Burden -2.72480 2.2e-16 ***
SWITCH -4.09113 6.381e-07 ***
Signif. codes: 0 ‘***’ 0.001 ‘**’ 0.01 ‘*’ 0.05 ‘.’ 0.1 ‘ ’ 1, R-Squared: 0.92054, Adj. R-Squared : 0.78731
Source: authors, calculated with statistics program R
As can be seen from the table above dummy variable for switching strategies is very
significant, and strongly contributes to debt reduction. The discrete change of the dummy variable
from 0 to 1, representing the switching strategies implementation, produces decrease in the debt-to-
GDP ratio of 4 percentage points. If we consider also the results from equation (13.5) estimation, we
can suggest that the revenue based fiscal consolidation supported by expenditure cuts is a significant
strategy in debt reduction. These assumptions are supported also by the estimated coefficient for
fiscal balance, where the increase of positive fiscal balance-to-GDP ratio would lead to debt reduction.
Interest burden and implied implicit rates had similar significance and effect as described from the
previous models. After the elimination of insignificant variables, the final equation with estimated
coefficients is described below.
Table 13.11 Coefficients estimation for SWITCH dummy model
Zi ~ FB + Growth + GAP + Ir + Burden + SWITCH (13.11)
FB Growth GAP Ir Burden SWITCH
-0.22860 -6.33664 -0.25994 8.13638 -2.72480 -4.09113
Source: authors, calculated with statistics program R
After adjustment the GDP Growth and Burden still remained the striking factors for debt
reduction. The model and estimations are very similar to the REV model described before.
Considering the significance of the revenue based consolidation we can assume that the
consolidation using switching strategies mostly started and also ended by stronger revenue based
consolidation supported by expenditure cuts in the middle of the consolidation.
E. Conclusion on models estimation
Results from model estimation based on dummy variable responsible for control the
expenditure based consolidation suggest that this type of consolidation had no significant effect on
debt-to-GDP ratio decrease. Changes in the threshold had no effects on the results.
On the other hand when estimating models with dummy variable for revenue based
consolidation control, the significance of the dummy was at least on significance level α=0.1. From
these results we can suggest that the fiscal consolidation in V4 countries could be driven by changes
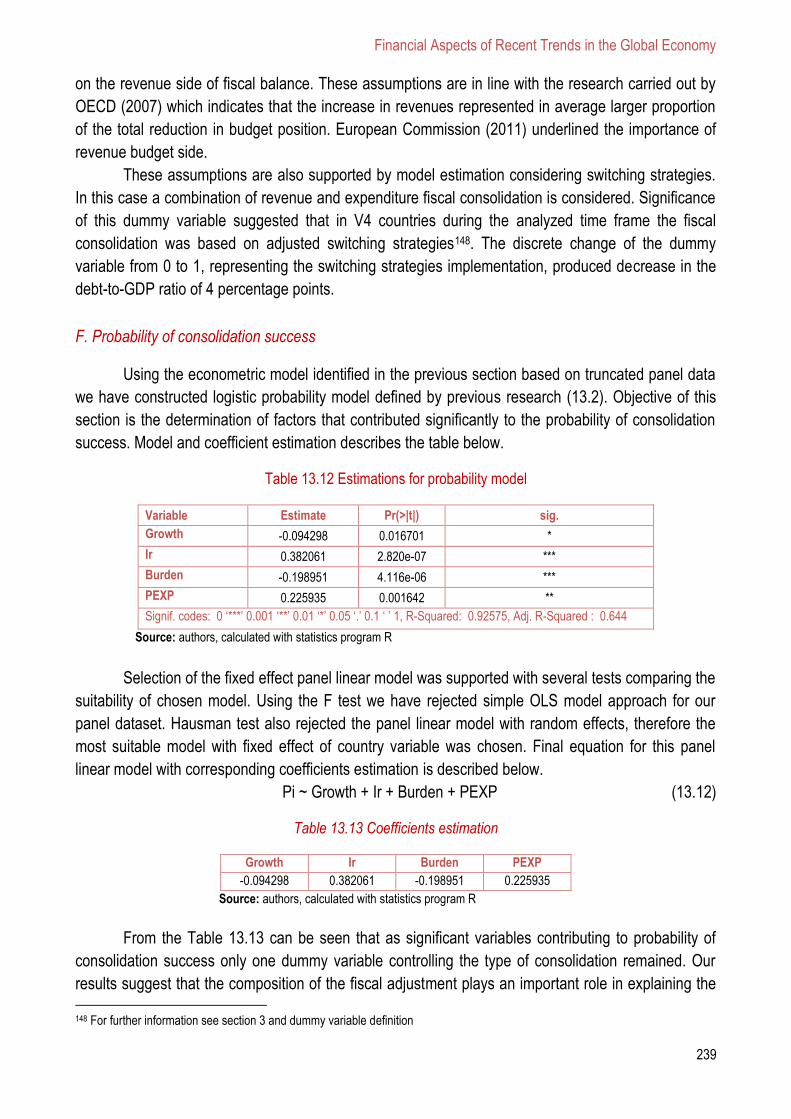
Financial Aspects of Recent Trends in the Global Economy
239
on the revenue side of fiscal balance. These assumptions are in line with the research carried out by
OECD (2007) which indicates that the increase in revenues represented in average larger proportion
of the total reduction in budget position. European Commission (2011) underlined the importance of
revenue budget side.
These assumptions are also supported by model estimation considering switching strategies.
In this case a combination of revenue and expenditure fiscal consolidation is considered. Significance
of this dummy variable suggested that in V4 countries during the analyzed time frame the fiscal
consolidation was based on adjusted switching strategies148. The discrete change of the dummy
variable from 0 to 1, representing the switching strategies implementation, produced decrease in the
debt-to-GDP ratio of 4 percentage points.
F. Probability of consolidation success
Using the econometric model identified in the previous section based on truncated panel data
we have constructed logistic probability model defined by previous research (13.2). Objective of this
section is the determination of factors that contributed significantly to the probability of consolidation
success. Model and coefficient estimation describes the table below.
Table 13.12 Estimations for probability model
Variable Estimate Pr(>|t|) sig.
Growth -0.094298 0.016701 *
Ir 0.382061 2.820e-07 ***
Burden -0.198951 4.116e-06 ***
PEXP 0.225935 0.001642 **
Signif. codes: 0 ‘***’ 0.001 ‘**’ 0.01 ‘*’ 0.05 ‘.’ 0.1 ‘ ’ 1, R-Squared: 0.92575, Adj. R-Squared : 0.644
Source: authors, calculated with statistics program R
Selection of the fixed effect panel linear model was supported with several tests comparing the
suitability of chosen model. Using the F test we have rejected simple OLS model approach for our
panel dataset. Hausman test also rejected the panel linear model with random effects, therefore the
most suitable model with fixed effect of country variable was chosen. Final equation for this panel
linear model with corresponding coefficients estimation is described below.
Pi ~ Growth + Ir + Burden + PEXP (13.12)
Table 13.13 Coefficients estimation
Growth Ir Burden PEXP
-0.094298 0.382061 -0.198951 0.225935
Source: authors, calculated with statistics program R
From the Table 13.13 can be seen that as significant variables contributing to probability of
consolidation success only one dummy variable controlling the type of consolidation remained. Our
results suggest that the composition of the fiscal adjustment plays an important role in explaining the 148 For further information see section 3 and dummy variable definition

Volume II, Chapter 13 Radovan Dráb and Lucia Mihóková
240
success of a debt reduction. These results are at the first side inconsistent with the results for debt
reduction model analysis. The expenditure dummy which reflects the size of the change in the primary
expenditure relative to the change in the primary balance has the expected positive sign and is
statistically significant. It means that the discrete change in the variable from 0 to 1 would increase the
probability of major debt reduction success about 22 percentage points. On the other hand, the
revenue dummy variable turns out to be statistically insignificant. Therefore, it seems that expenditure-
based consolidations have a higher probability to succeed. Another factor which determines the
success of a debt reduction is the interest burden. It turns out to be statistically significant and has a
negative sign. A one percent increase in the interest burden decreases the probability of a major debt
reduction by 9 percentage points. A decrease in the burden would decrease the debt servicing costs
what would positively affect the consolidation success.
13.5 Conclusion
The evolution of European countries’ indebtedness shows increasing public finance deficit
tendency that had emerged from about the 70th. The debt problem has become the basis of current
crisis in the most countries. Dealing with the consequences of systemic crisis, which is characterized
by the long-term fiscal imbalance deepening is the theme “number one” in academic and expert
circles as well as in international institutions. Therefore empirical studies and real national
governments focus on the implementation of fiscal consolidation that would reduce public debt as
much as possible.
All the V4 countries have to undertake policy measures to reverse the trend of rising debt
ratios. Therefore, the question of how to successfully reduce public debt is of eminent interest.
According to this situation, the main focus of this chapter was identification and comparison of
revenue and expenditure based consolidation and was performed in several stages.
Using the specified methodology several episodes of public debt accumulation, public debt
major and modest reduction were identified. Three of four countries experienced episodes of major
debt reduction over the analyzed time frame. Next step was model specification based on theoretical
and empirical evidence in order to identify factors, which in related periods influenced the major part of
debt reduction and debt accumulation in Visegrad countries.
Based on the estimation of different specifications of a logistic probability model over the
period 1996-2014, our results indicate that especially the real trend GDP growth, the interest burden
and also the composition of the fiscal adjustment are crucial factors in explaining the success of a
debt reduction. Several dummy variables were designed for the control of the fiscal consolidation type.
When assessing the significance of success on debt reduction, expenditure based consolidation was
suggested as the driving factor. Although the switching strategies consolidation played a significant
role for major and modest debt reduction, revenue based consolidation looks like insignificant when
considering the probability of consolidation success.
Future research could mainly cover the topics for the identification of described fiscal
consolidation component types, which contribute to the increase of debt reduction probability in
countries V4.
Financial Aspects of Recent Trends in the Global Economy
241
13.6 References
[1] Alesina, A., Ardagna, S. (1998). Fiscal Adjustments - Why they can be Expansionary? Economic Policy,
13(27).
[2] Alesina, A., Ardagna, S. (2009). Large Changes in Fiscal Policy: Taxes versus Spending. NBER Working
Paper No. 15438.
[3] Alesina, A., Bayoumi, T. (1996). The Costs and Benefits of Fiscal Rules: Evidence from the US NBER
Working Paper, No. 5614.
[4] Alesina, A., Perotti, R. (1996), Fiscal Adjustments in OECD Countries: Composition and Macroeconomic
Effects. NBER Working Paper, No. 5730.
[5] Ardagna, S. (2004). Fiscal Stabilizations: When Do They Work and Why. European Economic Review,
48(5): 1047-1074, doi:10.1016/j.euroecorev.2003.09.010.
[6] Barrios, S., Langedijk, S., Pench, L. (2010). EU Fiscal Consolidation after the Financial Crisis - Lessons
from Past Experiences. The 12th Banca d‟Italia Public Finance Workshop Fiscal Policy: Lessons from the
Crisis held in Perugia on 25-27 March.
[7] Bassanini, A., Scarpetta, S., Hemmings, P. (2001). Economic Growth: The Role of Policies and
Institutions. OECD Economics Department Working Papers, No 283.
[8] Bispham, J.A. (1987). Rising Public Sector Indebtedness: Some More Unpleasant Arithmetic. In: Boskin,
M.J., Flemming, J. S., Gorini, S. (Ed.) (1987). Private Saving and Public Debt. Oxford: Blackwell, p. 40-
71.
[9] Bordo, M.D. (1987). Financial Crisis: Lessons from History. The Fifth Garderen Conference on
International Finance. Erasmus Universiteit, Roterad, April, 1987.
[10] Caprio, G., Klingbeil, D. (1999). Episodes of Systemic and Borderline Financial Crises. Mimeo: World
Bank.
[11] Cournède, B., Gonand, F. (2006). Restoring Fiscal Sustainability in the Euro Area: Raise Taxes or Curb
Spending? OECD Economics Department Working Papers, No. 520.
[12] De Mello, L., Kongsrud, P.M., Price, R. (2004). Saving Behaviour and the Effectiveness of Fiscal Policy.
OECD Economics Department Working Papers, No. 397.
[13] Dvořák, P. (2008). Veřejné finance, fiskální nerovnováha a finanční krize. Praha: CH Beck.
[14] Eichengreen, B., Rose, A.K., Wyplosz, CH. (1996). Speculative Attacks on Pegged Exchange Rates: An
Empirical Exploration with SPecial Reference to the European Monetary System. In Canzoneri, M. Ethier,
W., Grilli, V. The New Transatlantic Economy.
[15] Eichengreen, B., Bordo, M.D. (2002). Crises now and then: What Lessons from the Last Era of Financial
Globalization? NBER Working Paper No. 8716.
[16] Foster, J.B., Magdoff, F. (2009). Velká finanční krize: Příčiny a následky. Český Těšin: Grrimmus.
[17] Goldsmith, R.W. (1982). Comment´ on Hyman P. Minsky´s the Financial Instability Hypothesis: Capitalist
Processes and the Behavior of the Economy, s.42. In: KINDLEBERGER, C.P. – LAFFARGUE, J.P.
(1982). Financial Crisis: Theory, History and Policy. Cambridge University Press, Cambridge,
[18] Guichard, S., Kennedy, M., Wurzel, E., André, C. (2007). What Promotes Fiscal Consolidation? OECD
Country Experiences. OECD Economics Department Working Paper, No. 553.
[19] Imbeau, L.M., Chenard, K. (2002). The Political Economy of Public Deficits: A Review Essay. Centre
d´analyse des politiques publiques. France, ECPS Conference.
Volume II, Chapter 13 Radovan Dráb and Lucia Mihóková
242
[20] Jajubíková, E., Mihoková, L. (2011). Impact of the Government Debt on the Macroeconomic
Development of the Slovak and Czech Republic. In: VÍTEK, L. (ed.) (2011). Analysis of the Impact of the
Economic Crisis on Public Finances. 1st Edition. Praha: Wolters Kluwer ČR, a.s., p. 116 – 142.
[21] Jílek, M. (2011). Deficitní sklon veřejných financi a fiskálni pravidla. In: KUBÁTOVÁ, K. (ed.) (2011).
Úloha veřejných financi v řešení problému a dopadu současné krize: Praha: Wolters Kluwer ČR.
[22] Kaminsky, G., Reinhart, C.M. (1999). The twin Crises: The Cause of Banking and Balance-of-Payments
Problems. American Economic Review, 89(3): 473-500.
[23] Krugman, P. (2001). Crises: The Next Generation? Draft prepared for conference in Tel Aviv, March.
[24] Krugman, P. (2008). Desperately Seeking Seriousness, New York Times, 26 október,
http://www.nytimes. com/2008/10/26/books/review/Tanenhaus-t.html.
[25] Mcdermott, J., Wescott, R. (1996). An Empirical Analysis of Fiscal Adjustment, IMF Staff Papers, 43:
725-753.
[26] Mishkin, F. S. (1996). Understanding Financial Crises: A Developing Country Perspective. In: Bruno, M.
and Pleskovic, B. Annual World Bank Conference on Development Economics. World Bank, Washington,
p. 29
[27] Mishkin, F.S. (2001). Financial Policies and the Prevention of Financial Crises in Emerging Market
Economies. World Bank Policy Researd Working Paper, October 2001, no. 2683
[28] Molnar, M. (2012). Fiscal Consolidation: Part 5. What Factors Determine the Success of Consolidation
Efforts? OECD Economics Department Working Papers, No. 936, OECD Publishing. http://dx.doi.org/
10.1787/5k9h28mzp57h-en.
[29] Musílek, P. (2004). Analýza příčin a dusledku české finanční krize v 90. letech. Výzkumná studie. Praha:
Grantová agentura České republiky.
[30] Nemec, J. (2011). Súčasná systémová kríza a verejné financie. In. MEDVEĎ, J. - NEMEC, J. a kol.
(2011). Verejné financie. Bratislava: Sprint dva. ISBN 978-80-89393-46-6.
[31] Nickel, CH., Rother, P., Zimmermann, L. (2010). Major Public Debt Reduction: Lessons from past,
lessons for the future. ECB Working paper series, No. 1241.
[32] Pattillo, C., Poirson, H., Ricci, L. (2002). External Debt and Growth. IMF Working Paper 02/69
Washington.
[33] Petras, J. (2008). Who´s to Blame for the Great Financial Crisis? Telegraph (Londýn), 18 august 2008,
http://www.telegeaph.co.uk.
[34] Radelet, S., Sachs, J. (1998). The Onset of the East Asian Financial Crisis. Harvard Institute for
Interantional Development, NBER Working Paper, No. March 1998.
[35] Soros, G. (2009). Nové paradigma pro finanční trhy. Úverová krize 2008 a co dál. Praha: Vydavateľstvo
ELK. ISBN 978-80-86316-82-6.
[36] Staněk, P. (2010). Globálna kríza – hrozba alebo výzva? Bratislava: Sprint dva. ISBN 978-80-89393-24-4
Stratégia rozvoja slovenskej spoločnosti. Úplná verzia. Bratislava. http://www.ekoforum.sk/archiv/
dokumenty/strategia-slovensko-2010/view.
[37] Tsibouris, G.C., Horton, M.A., Flanagan, M.J., Maliszewski, W.S. (2006). Experience with Large Fiscal
Adjustment. IMF Occasional Paper, No. 246.
[38] Vítek, L. (ed.) (2011). Analysis of the Impact of the Economic Crisis on Public Finances. 1st Edition.
Praha: Wolters Kluwer ČR, a.s., 316 p.
Financial Aspects of Recent Trends in the Global Economy
243
[39] Von Hagen, J., Strauch, R. R. (2001). Fiscal consolidations: Quality, economic conditions and success,
Public Choice, 109: 437-346.
[40] Von Hagen, J., Hallett, A.H., Strauch, R.R. (2002). Budgetary consolidation in Europe: Quality, economic
conditions and persistence. Journal of the Japanese and International Economies, 16(4):512-535.
*** European Commission. (2007). European Economy - Public Finances in EMU. EC, Brussels.
*** European Commission. (2010). European Economic Forecast. Spring. European Economy No. 2.
*** European Commission, (2010). Taxation Papers - Monitoring Tax Revenues and Tax Reforms in EU
Members States, Tax Policy after Crisis. Luxembourg: Publications Office of European Union. 85 p.
*** European Commission. (2011). Tax Reforms in EU Member States 2011. Tax policy challenges for
economic growth and fiscal sustainability. Brussel: Publications Office of European Union. European
Economy 5/2011. 137s.
*** European Commission. (2012). European Economy - Public Finances in EMU 2012. EC, Brussels.
*** European Commission. (2011). European Economy - Public Finances in EMU 2011. EC, Brussels.
*** International Monetary Fund. (1998). Financial Crises: Characteristics and Indicators of vulnerability.
[cit.2011-11-5].Dostupné na internete: http://www.imf.org/external/pubs/ft/weo/weo0598/pdf/0598ch4.pdf.
*** OECD (2007). Fiscal Consolidation: Lessons from past experieces. OECD Economic Outlook. Preliminary
Edtition.
*** OECD STATISTICAL DATABASE
*** International Monetary Fund. (2011). Analytics of Systemic Crises and the Role of Global Financial Safety
Nets.
*** International Monetary Fund. (2003). How Can High Public Debt Levels be Reduced, World Economic
Outlook 2003, pp. 137-152.

Volume II, Chapter 14 Cristian Marius Litan, Paula Curt and Diana Andrada Filip
244
x
Chapter 14
DEVELOPMENTS IN MODELS OF MAJORITY VOTING OVER FIXED INCOME TAXATIONS
by Cristian Marius LITAN
Babeş-Bolyai University of Cluj-Napoca, Faculty of Economics and Business Administration, Romania [email protected]
Paula CURT
Babeş-Bolyai University of Cluj-Napoca, Faculty of Economics and Business Administration, Romania [email protected]
and Diana Andrada FILIP
Babeş-Bolyai University of Cluj-Napoca, Faculty of Economics and Business Administration, Romania [email protected]
14.1 Introduction
14.2 Literature review
14.3 General setup (definitions and terminology)
14.4 The results - a critical evaluation
14.5 Conclusions and further research
14.6 References
Financial Aspects of Recent Trends in the Global Economy
245
DEVELOPMENTS IN MODELS OF MAJORITY VOTING OVER FIXED INCOME TAXATIONS
Cristian Marius LITAN149
Babeş-Bolyai University of Cluj-Napoca Faculty of Economics and Business Administration, Romania
Paula CURT150
Babeş-Bolyai University of Cluj-Napoca Faculty of Economics and Business Administration, Romania
Diana Andrada FILIP151
Babeş-Bolyai University of Cluj-Napoca Faculty of Economics and Business Administration, Romania
Abstract
As public debt becomes an acute problem for western economies, the political debate becomes more
and more dominated by issues related to the need of increasing the progressivity of taxation. In order that one
better understands the current context, it is necessary, in our view, to become familiar with the literature of the
positive theory of income taxation. This literature regards the tax schemes in democratic societies as emerging
from majority voting.
The aims of this chapter are the following. First, we briefly review the most important results in the
above mentioned literature, trying to explain the empirical regularities of taxations. Second, based on previous
work, we discuss how standard equilibrium concepts from simple majority voting games in coalitional form
(e.g. core, -core and least core) can be adapted to the general setup of voting over income tax schedules,
as well as the conditions under which such adapted concepts are stable. Third, we investigate which are the
implications of these concepts, from the perspective of progressivity versus regressivity, for workhorse models
of the positive theory of income taxation (e.g. with restricted policy spaces such as quadratic taxation models,
piecewise linear taxation models, etc.).
Finally, we provide a brief critical evaluation of the extent to which this approach is able to address the
difficulties acknowledged by the literature in the field and we draw future lines of investigation (such as
possible adaptations of Mas-Colell Bargaining Set to the setup of voting over income tax schedules).
Keywords: public finance, progressive taxation, majority voting.
149 Cristian Marius Litan, Associate Professor at Babeş-Bolyai University of Cluj-Napoca, Faculty of Economics and Business
Administration, Department of Statistics, Forecasting and Mathematics, 58-60 Teodor Mihali street, 400591 Cluj-Napoca, Romania
150 Paula Curt, Associate Professor at Babeş-Bolyai University of Cluj-Napoca, Faculty of Economics and Business Administration, Department of Statistics, Forecasting and Mathematics, 58-60 Teodor Mihali street, 400591 Cluj-Napoca, Romania
151 Diana Andrada Filip, Professor at Babeş-Bolyai University of Cluj-Napoca, Faculty of Economics and Business Administration, Department of Statistics, Forecasting and Mathematics, 58-60 Teodor Mihali street, 400591 Cluj-Napoca, Romania Associate Researcher at Université d’Orléans, Faculté de Droit, d'Economie et de Gestion, LEO (Laboratoire d'Economie d'Orléans), Rue de Blois BP 26739, 45067 Orléans Cedex2, France
Volume II, Chapter 14 Cristian Marius Litan, Paula Curt and Diana Andrada Filip
246
14.1 Introduction
One of the main features of the current crisis of the western European economies is
represented by the soaring public debt. And as public debt becomes an acute problem, it seems that
in the political debate and in the space of public discussions of the western countries, issues like
widening income gaps and more progressive taxation are gaining in importance.
Apparently, after many years of stability of tax systems, in which taxation issues were
peripheral within the political debate, nowadays we can witness a political scene animated by
proponents and condemners of raising tax rates for the rich. Moreover, an increasing number of
western governments seem eager to be the first to take steps towards new levies for the highest
earners, even if for the moment we can only talk about their symbolic significance.
Given such political scenes dominated by discussions on taxation issues, do we witness the
end of a long period of an apparent stability of tax schedules? Have these governments become more
predisposed to progressivity, as they try to maximize a social welfare function under the constraints of
raising income inequality and the objective of decreasing the public debt? Or are the governments (or
other political actors) simply driven by electoral calculations, given the increasing right-skewness of
the income distributions? In our view, in order that one better understands the current context and the
discussions about taxing the wealthy, it is necessary to become familiar with the literature of the
positive theory of income taxation.
Part of the literature in the positive theory of income taxation is concerned with explaining
important empirical stylized facts that regard the tax schedules. The first empirical regularity refers to
the stability of the tax schedules in democratic societies (see Grandmont, 2006; Marhuenda and
Ortuño-Ortin, 1998). The second well-documented empirical fact is that industrialized democracies (in
particular, all OECD countries) usually implemented statutory income tax schedules with marginal
rates that are increasing in income (see Carbonell-Nicolau and Ok, 2007; Carbonell-Nicolau and Klor,
2003). The tax functions with marginal rates increasing in income are called marginal-rate progressive
in public finance. In fact, these are tax functions which are convex from mathematical point of view.
The concave tax schedules are called marginal-rate regressive.
According to Grandmont (2006), the main assumption on which the positive theory of income
taxation builds is that tax schemes are emerging, explicitly or implicitly, from majority voting.
Carbonell-Nicolau and Ok (2007) assert that the income tax policy is one of the most important traits
of a political candidate. Therefore, one should expect that the above mentioned stylized facts reflect,
not necessarily in a direct manner, the preferences of the majority of the constituents of the
democratic societies (Carbonell-Nicolau and Ok, 2007). Within the same logic, one can extend to the
public choice of tax schedules the following idea of Roberts (1977): “the point is not whether choices
in the public domain are made through a voting mechanism but whether choice procedures mirror
some voting mechanism” (also cited by Marhuenda and Ortuño-Ortin, 1995). An alternative approach
to the positive theory of income taxation starts from the assumption that the tax designer intends to
maximize some utilitarian social welfare function. Nevertheless, the present work and the referred
literature subscribes to the former approach, which is the positive economic theory of income taxation.
Financial Aspects of Recent Trends in the Global Economy
247
The literature in the area is still inconclusive on the relationship between majority voting and
the mentioned stylized facts. There are few main difficulties that the researchers have to face. First, a
very important difficulty is that the Condorcet majority winner is not usually guaranteed because the
policy space of tax schedules is multidimensional (the multidimensionality remains true even for very
restrictive policy spaces). The possible inexistence of a Condorcet winner can be regarded as
predicting political instability with respect to the taxation system to be agreed on, which is in
contradiction with the empirical evidence (see Grandmont, 2006; Marhuenda and Ortuño-Ortin, 1998).
A second difficulty resides in the fact that deriving the properties of the stable taxes is
mathematically cumbersome when there are used equilibrium concepts other than the Condorcet
winner. As noted before, by restricting the policy space or considering solution concepts different than
the Condorcet winning tax, one can guarantee the existence of the set of equilibrium taxations.
However, even in such cases, the analytical description and derivation of the properties of the set of
stable taxations proves to be mathematically cumbersome. Therefore, in many instances, the state of
the art literature in the field of positive theory of income taxation has limitations. It should resort either
to numeric simulations of the solutions (e.g. De Donder and Hindriks, 2003; Marhuenda and Ortuño-
Ortin, 1998) and/or to restrictions on the policy space or on the income distributions (e.g. Roemer,
1999; De Donder and Hindriks, 2003, 2004; Curt, Litan and Filip, 2010, 2011). Nevertheless, such
restrictions are difficult to motivate in real life.
A third difficulty is that the literature usually considers solution concepts that are intrinsically
static, while the stability of taxes is empirically proved in the context of much dynamicity (e.g.
consecutive electoral cycles in which the same parties will present themselves repeatedly in front of
the same electorate). In this context, most of the literature suffers from the limitation that it applies
quite static equilibrium concepts. For example, the following papers build around the idea of a status-
quo tax function: Marhuenda and Ortuño-Ortin (1995, 1998), De Donder and Hindriks (2003, 2004),
Curt, Litan and Filip (2010, 2011, and 2011a).
The aims of this work are the following. First, we briefly review the most important results in
the literature trying to explain the empirical regularities. This brief literature review is presented in
relationship with the above mentioned difficulties. Second, we discuss how standard equilibrium
concepts from simple majority voting games in coalitional form can be adapted to the general setup of
voting over income tax schedules. Third, we discuss the conditions under which such adapted
concepts are stable. Moreover, we investigate which are their implications from the perspective of
progressivity versus regressivity, for workhorse models of the positive theory of income taxation, with
restricted policy spaces (e.g. quadratic taxation models, piecewise linear taxation models, etc.).
Finally, we provide a brief critical evaluation of the extent to which this approach is able to address the
above mentioned difficulties and we draw future lines of investigation.
This chapter is organized as follows. Section 14.2 contains the literature review. Section 14.3
presents the general model of voting over income tax schedules and defines the concepts of core, -
core and least core based on the previous work of the authors (Curt, Litan and Filip, 2010, 2011 and
2011a). Section 14.4 provides a critical view on the implications of the concepts of core and least
core, making references to previous results of the authors. In Section 14.5 we discuss possible
Volume II, Chapter 14 Cristian Marius Litan, Paula Curt and Diana Andrada Filip
248
adaptations of Mas-Collel Bargaining Set to the setup of voting over income tax schedules and we
draw the conclusions.
14.2 Literature review
Inexistence of Condorcet winner, possible ways out followed in the literature, their limitations
As already mentioned, an important difficulty is that the Condorcet majority winner is not
usually guaranteed because the policy space of tax schedules is multidimensional. Possible ways out
followed in the literature are summarized below.
Romer (1975, 1977) and Roberts (1977) analyze the outcome of majority voting when tax
policies must be linear functions of income. Snyder and Kramer (1988) admit only tax functions which
are individually optimal for some voter. In the same direction, Cukierman and Meltzer (1991) impose
some tax to be ideal for some voter. Starting with Cukierman and Meltzer (1991), and continuing with
Roemer (1999), Hindriks (2001) and De Donder and Hindriks (2004), all these authors restrict their
analysis only to quadratic taxations. Marhuenda and Ortuño-Ortin (1995) consider as policy space a
subset of only convex and concave tax functions (case that includes the quadratic functions).
In the literature, besides restricting the policy space, another proposed way out from the
difficulty of not having guaranteed a Condorcet winner is to consider less demanding stability
concepts. Marhuenda and Ortuño-Ortin (1998) introduces uncertainty about the tax liability of a new
proposal. Roemer (1999) defines a new equilibrium concept based on the need to reach an intra-party
agreement between the “opportunists” and the “militants” of two competing parties. De Donder and
Hindriks (2003) introduce preferences for leisure and depart from the assumption of fixed income (in
the sense that the income will be an implicit function of taxation). However, even in such cases, in
order to obtain insightful results, the authors were finally obliged to restrict the policy space (for
example, to quadratic taxations).
A different approach is proposed by Carbonell-Nicolau and Ok (2007). They allow for mixed
strategies over the set of admissible taxes, when there are two parties in competition. Nevertheless, it
is conceptually problematic to interpret a mixed equilibrium in the context of income taxation.
A conclusion that may already be drawn is that the literature on income taxation usually
substitutes the Condorcet winner concept with other stability (or equilibrium) concepts, since the
majority winner tax does not usually exist, except under very strong and unrealistic restrictions
imposed on the policy space. Nevertheless, even when using other concepts than Condorcet majority
winner, the existence of the equilibrium taxes can be proved only for quite restrictive policy spaces.
Results regarding the prevalence of progressivity and their limitations
Regarding the prevalence of progressivity in democratic societies, Snyder and Kramer (1988)
assess the existence of progressivity in an economy in which grey and white sectors coexist.
However, as mentioned before, they consider only tax functions which are individually optimal for
some voter, hence their result is limited. Cukierman and Meltzer (1991) provide quite strong sufficient
conditions under which the Condorcet winner is progressive. Marhuenda and Ortuño-Ortin (1995)
prove that for right-skewed income distributions any concave tax scheme receives less popular
support than any convex tax scheme. Still, the result is limited subject to their considered space of

Financial Aspects of Recent Trends in the Global Economy
249
convex and concave tax functions (which is strictly included in the space of all feasible convex and
concave functions).
As mentioned before, Carbonell-Nicolau and Ok (2007) provide a two-party voting game in
which each party whose objective is to win the elections proposes tax schemes from an unrestricted
set of admissible functions and the voters selfishly vote for the tax that taxes them less. They
establish the existence of only mixed equilibria and find that if the tax policy space is not artificially
constrained, the support of at least one equilibrium cannot be obtained within the set of marginal-rate
progressive taxes. This result is in the same line with the one of Klor (2003), who shows that a
majority of poor voters does not necessarily imply progressive taxation for a more general policy
space than the one in Marhuenda and Ortuño-Ortin (1995). The results of Klor (2003) and Carbonell-
Nicolau and Ok (2007) are essentially negative news for those with the common belief that the
prevalence of progressivity is nothing just a simple consequence of the fact that the number of
relatively poor voters exceeds that of richer voters in general.
Roemer (1999) limits his analysis to the quadratic taxation framework and obtains
progressivity for the alternative equilibrium concept he defines. In the same setup of fixed income (i.e.
income not distortioned by taxes) and quadratic taxations à la Roemer (1999), Hindriks (2001)
establishes the inevitable vote cycling theorem. He concludes that the result of Marhuenda and
Ortuño-Ortin (1995) has no predictions even in the simplest imaginable case of only convex and
concave functions, which is the policy space of quadratic taxations. De Donder and Hindriks (2003)
introduce preferences for leisure in the quadratic taxation model, study the voting process over tax
schedules using an alternative political equilibrium concept than the Condorcet winner, and prove
progressivity only simulations-based.
Therefore, a conclusion that may be drawn is that the link between right-skewed income
distributions and progressive taxations, through the democratic institution of majority voting, cannot be
established without imposing the same unrealistic restrictions on the policy space. And when such
restrictions are not imposed, the existing results in the literature are rather negative from the
perspective of the heuristic argument that the prevalence of progressivity is nothing just a simple
consequence of the fact that the number of relatively poor voters exceeds that of richer voters.
The limitation regarding the use of static equilibrium concepts
Most of the referred literature considers, in a way or another, solution concepts that are
intrinsically static. From this point of view, there are no clear differences between the cases in which
Condorcet winner exists and those cases in which alternative concepts are applied. Hence, in our
view, the possible critique mentioned by Grandmont (2006) about the Condorcet winner concept may
be reiterated for most of the alternative concepts reviewed before (even if they provide non empty sets
of equilibrium taxations): “It may be claimed that the political instability predicted by the possible
inexistence of a Condorcet majority winner relies upon a very myopic behavior of voters, who are
assumed to vote against the current tax schedule and for a new tax proposal if and only if they gain in
the short run from the corresponding change. One may argue that in a dynamic setting, voters are
likely to be more forward looking and that "political conservatism" may arise in the sense that a
majority of voters may not wish to vote against the status quo even though they would gain
Volume II, Chapter 14 Cristian Marius Litan, Paula Curt and Diana Andrada Filip
250
immediately from the change, because they fear that doing so would start a political escalation that
would be harmful to them”.
The next sections will discuss how standard equilibrium concepts from simple majority voting
games in coalitional form can be adapted to the general setup of voting over income tax schedules.
Moreover, we shall critically analyze the implications of such adapted concepts from the perspective
of the three dimensions along which the above literature review was conducted. The next sections are
mainly based on the previous work of the authors (see Curt, Litan and Filip, 2010, 2011 and 2011a).
14.3 General setup (definitions and terminology)
The General model
The economy consists of a large number of individuals who differ in their (fixed) income. Each
individual is characterized by her income [ ]. The income distribution can be described by a
function [ ] [ ], continuous and differentiable almost everywhere and increasing on the
interval [ ]. Each individual with income [ ] has strictly increasing preferences on the set of
her possible net incomes. The associated Lebesque-Stieltjes probability measure induced by is
denoted by ( ) and for any Lebesque-Stieltjes measurable set [ ]:
( ) ∫ ( )
(14.1)
The fixed amount:
∫ ( )
[ ] (14.2)
should be collected through means of a tax imposed on the agents. When , the tax is purely
redistributive. It is assumed that there is no tax evasion, respectively there are no distortions induced
by the taxation system in the economy. In one word, the pre-tax income is fixed (in the sense that it is
given and not influenced by the taxation system).
A set of admissible tax schedules ( ) contains functions continuous on [ ] that
necessary satisfy, for a given and , the following conditions:
( ) (14.3)
( ) ( ) (14.4)
( ) ( ) (14.5)
∫ ( ) ( )
[ ] (14.6)
It is noteworthy that the continuity of is actually implied by the conditions (14.4) and (14.5).
Moreover, the tax functions that satisfy the conditions (14.3)-(14.6) are uniformly bounded by the
constant 1. Another important remark is that there is no tax evasion, respectively there are no
Financial Aspects of Recent Trends in the Global Economy
251
distortions induced by the taxation system in the economy. Thus, the pre-tax income is considered
fixed (in the sense that it is given and not influenced by the taxation system).
An example of a restricted policy space that is extensively used is the one of the quadratic
taxations. The space ( ) contains those functions:
[ ] ( ], ( ) (14.7)
such that:
( ) and {
. (14.8)
In the above formulas, is the non-centred moment of the second order of the income
distribution.
Condorcet winners and the core
Let ( ) be a set of admissible tax schedules. Given a tax , a tax policy
is an objection to if and only if:
{ [ ] ( ) ( )} { [ ] ( ) ( )}. (14.9)
That means:
{ [ ] ( ) ( )}
, (14.10)
thus the tax is (weakly) preferred by a majority of individuals to the tax . Denote with ( ) the
set of all objections to the taxation . Hence, is a Condorcet winner or a majority winner if and only if
there is no objection to it, i.e. ( ) (see Curt, Litan and Filip, 2010, 2011 and 2011a).
As in Grandmont (2006), we consider the simple majority game in coalitional form
corresponding to the general setup just described. Then, the set of the Condorcet winners is nothing
else just the core. Moreover, the inexistence of a Condorcet majority winner is equivalent to the fact
that the core is empty.
𝜺-core and least core
Given tax policies , we can construct the distance:
( ) ∫ ( ( ) ( )) ( )
{ [ ] ( ) ( )}. (14.11)
As economic interpretation, this distance represents the total gain of those individuals that are
better off if the tax schedule changes from t to q. It can be immediately proved that the distance is

Volume II, Chapter 14 Cristian Marius Litan, Paula Curt and Diana Andrada Filip
252
equal to
∫ | ( ) ( )| ( )
[ ]. Moreover, a very important property is that ( ) is a metric.
It represents the restriction to the tax function space of the L1 metric,
‖ ‖ ∫ | ( ) ( )| ( )
[ ] ∫ | ( ) ( )| ( )
[ ]. (14.12)
In the metric space ([ ] ), the following convention applies: if and only if
( ) ( ) . The same convention applies to the space of interest . Having all this
terminology at hand, we can now define the concepts of - core and least core in the majority game
in coalitional form associated to the general setup described above.
Given , we define ( ) as the set that contains all the taxes for which there is no
objection such that the total gain of the better off agents under the objection is strictly greater than .
The set ( ) represents the - core and it can be economically interpreted as containing any tax for
which the maximal willingness (that can arise from the agents of the economy) to pay to change this
given tax is less or equal than .
The least core is defined as containing any tax such that the maximal willingness (that can
arise from the agents of the economy) to pay to change this given tax is minimal between all taxes. It
is the intersection of all - core that are not empty, i.e., ⋂ ( ){ ( ) } .
The adaptation of the concepts of - core and least core to the setup of voting over (fixed)
income taxations is introduced by Curt, Litan and Filip (2011). However, the paper of Grandmont
(2006) represents another use of the concept of least core in the literature of voting over income
repartitions. Grandmont (2006) argues that in his setup voting over tax schemes is equivalent to
voting directly over income distributions. Nevertheless, the setup on which this work is focused is not
à la Grandmont (2006); like most of the literature does, we impose fairness principles to the tax
schedules, i.e. a tax is increasing with the revenues in such a way that it does not change the post-tax
income ranking.
In a majority game in coalitional form of voting over income distributions, Grandmont (2006)
proves the usual result that the core is empty. Moreover, in his framework, the least core implies no
insights as well, since it contains just the egalitarian income distribution, in the case it is not empty.
However, the results of Curt, Litan and Filip (2010, 2011a, 2011), which will be presented in the next
section, reveal that the adaptation of the concepts of core, - core and least core to the setup of
voting over (fixed) income taxations provide interesting insights (as opposed to the framework in
Grandmont, 2006).
14.4 The results - a critical evaluation
Results
Curt, Litan and Filip (2010) extend the work of De Donder and Hindriks (2004) and provide a
complete description of those income distribution functions for which a majority winning tax exists (or
does not exist), if the quadratic taxation model is not purely redistributive. They also provide
necessary and sufficient conditions for the Condorcet winner tax to be progressive (if this majority
winning tax exists). In a direct relationship with Curt, Litan and Filip (2010) is the short paper Curt,
Litan and Filip (2011a). In this work the authors provide a specific proof that the sufficient condition of

Financial Aspects of Recent Trends in the Global Economy
253
De Donder and Hindriks (2004) can be relaxed to a broader one, also for purely redistributive
taxations. It is consequently shown how the sufficient and necessary conditions should modify
accordingly.
As already mentioned, Curt, Litan and Filip (2011) is one of the first papers to pilot the idea of
applying “cooperative” concepts like - core and least core to standard models of majority voting over
(fixed) income taxations. Section 14.3 in here closely follows the paper of Curt, Litan and Filip (2011)
in which the authors mathematically defined the concepts of - core and least core for the general
setup of majority voting over fixed-income taxations. In particular, they show that the least core is not
empty for the framework of quadratic taxation, respectively piecewise linear tax schedules. Moreover,
for fixed-income quadratic taxation environments with no Condorcet winner, they prove that for
sufficiently right-skewed income distribution functions, the least core contains only taxes with
marginal-rate progressivity. All these results are formally introduced to the reader in the following of
this text.
The next proposition states two important properties of the least core. First, in the case the
core is not empty, the least core reduces to the core concept. Second, the taxes in the least core can
be found by solving a min sup problem expressed in terms of the distance d. As already noticed by
Curt, Litan and Filip (2011), these results are in line with several properties that the least core has for
discrete policy spaces (see Einy et al., 1999).
Proposition 1 (Curt, Litan and Filip, 2011)
Let be a set of a tax function that satisfies the conditions (14.3)-(14.6). If the set
⋂ ( ){ ( ) } is not empty then the following assertions are true:
- If we denote by { ( ) } , then ⋂ ( ){ ( ) } ( );
- ( ) ( );
- if and only if ⋂ ( ){ ( ) } is the set of Condorcet majority winners;
- ( ) ( ) ( ) ( ).
The next theorem is very important since it provides quite general sufficient conditions such
that the concept of least core does not provide empty sets of taxations.
Theorem 1 (Curt, Litan and Filip, 2011)
Let be a set of tax functions that satisfy the conditions (14.3)-(14.6). Consider that F is an
income distribution function that is absolutely continuous and the density function is almost
everywhere continuous. If the set U is complete with respect to metric d, then ⋂ ( ){ ( ) } is
not empty. The next result focuses on the quadratic case. Before, additional terminology is needed.
Let:
[ ] , ( ) (14.13)
and let:
(14.14)
Then, for each , the quadratic function has two real roots:
( ) √( ) (14.15)
Volume II, Chapter 14 Cristian Marius Litan, Paula Curt and Diana Andrada Filip
254
and:
( ) √( ) , (14.16)
which vary as function of , where:
√( ) and √ . (14.17)
The conditions on the income distribution function for the existence/non-existence of a majority
winning tax are expressed in terms of ( ) and ( ) in De Donder and Hindriks (2004),
respectively in Curt et al. (JIA, 2010).
Theorem 2
Let be a distribution function such that √( ) .
- Curt, Litan and Filip (2010): If (
) (
)
and there is (
( ))
such that ( ( )) ( ( ))
, then the core is empty (there is no Condorcet
majority winner);
- Curt, Litan and Filip (2011): If in addition to the above conditions, ( ( ))
( ( ))
for each (
], then the set ⋂ ( ){ ( ) } contains only
progressive tax functions.
The general message of the second part of Theorem 2 is that for sufficiently right-skewed
distributions, in the least core there are only progressive taxations.
Brief critical evaluation of the results
Regarding Theorem 1, the result is quite general as many of the distribution functions used to
model the repartition of income among the individuals of a society have the required properties (see
for instance the beta distributions in De Donder and Hindriks, 2003, 2004, or the examples of income
distribution functions from Carbonell and Ok, 2007). Moreover, it can be immediately applied to policy
spaces which are extensively used in the literature, like the case of quadratic taxations or the case of
piecewise linear tax schedules.
Nonetheless, the result has the limitation that it crucially depends on the continuity assumption
of the incomes and income distribution. Indeed, there is no clear way the result can easily be adapted
to the (more realistic) case of a discrete set of income values and F discrete (Moreno-Ternero, 2011)
is one of the very few papers that works with discrete income distributions).
Theorem 2 can be interpreted as positive news for those with the common belief that the
prevalence of progressivity is nothing just a simple consequence of the fact that the number of
relatively poor voters exceeds that of richer voters in general. However, we can conclude that the
result suffers from the same limitations we identified for the reviewed literature.
First, it is a construction proof, based very much on the plane geometry that is specific to the
quadratic case. There is no clear way how this proof should be adapted for other taxation cases (e.g.
Financial Aspects of Recent Trends in the Global Economy
255
piecewise linear tax schedules). Second, although it answers to the lack of predictability of the
classical coalitional concepts invoked by Hindricks (2001) for the simplest quadratic taxation case, still
the scope of the result in Theorem 2 is limited. That is because the quadratic case does not include
the (more realistic) cases of neither concave nor convex tax functions. Finally, applying the - core
and the least core doesn’t bring much more dynamicity if compared to other mentioned concepts. Just
to give an example, when a majority considers an objection to the status-quo, the possible reactions
of the members of the minority triggered by this move are not taken into account by the concepts of
- core and least core.
14.5 Conclusions and further research
The general conclusion is that the literature introducing adaptations (to the general setup of
voting over (fixed) income tax schedules) of the standard concepts from simple majority voting games
in coalitional form, does not essentially eliminate the drawbacks identified for the previous literature of
the positive theory of income taxation. However, such studies can prove to be useful exercises in
opening the venues for investigating more credible concepts, like Mas-Colell Bargaining Set.
As one could see, there are weaknesses of the core, – core and the least-core in coalitional
games, related to the fact that when a majority considers an objection to the status-quo, the possible
reactions of the members of the minority triggered by this move are not taken into account. Any
adaptations of these concepts are inheriting the same credibility flaws.
The idea underlying the Mas-Colell Bargaining Set is that for an objection to be implemented
there should be no counter objection. A counter objection to an objection can attract the votes of a
new majority, while guaranteeing their initial utility to members of the old minority who were losing in
the objection, if they wish to join the new majority. In this sense, an objection is said to be justified
when there is no counterobjection to it. An element of the choice space belongs to the Bargaining Set
whenever there is no justified objection to it.
However, transposing and using the concept of Mas-Colell Bargaining Set into the literature of
voting over income repartitions is not in fact an easy task as we could learn from Grandmont (2006).
The mot-a-mot adaptations of the Bargaining Set to Grandmont’s voting setup provide just trivial
results. Nevertheless, in his specific framework, Grandmont(2006) succeeds to define and explore two
variants of the Mas-Colell Bargaining Set which help understanding the apparent stability of income
redistributions in democratic societies. As related to the model presented in Section 14.3, we were not
yet successful in implementing a working variant of the Mas-Colell Bargaining Set for the general
model of fixed income taxation.
Therefore, one of the first priorities in this line of research is to investigate how can there be
defined working variants of the Mas-Colell Bargaining Set for the model in Section 14.3 (and its
associated simple majority game in coalitional form). And once this issue is resolved, the research
questions that should have priority in the view of the existing literature are:
a) What are the implications of the Bargaining Set for the very realistic case of piecewise linear
taxations?
b) Is it possible to obtain results when applying the Bargaining Set for the policy space T(F, R),
containing all tax functions with properties (14.3) to (14.6)?
Volume II, Chapter 14 Cristian Marius Litan, Paula Curt and Diana Andrada Filip
256
c) Is is possible to construct and explore working variants of the Mas-Colell Bargaining Set for the
model in Section 14.3 with a discrete income distribution F?
In the end, we want to put into discussion the feature of “stability” that we attributed to each of
the solution concepts. As depicted in the beginning of the introduction, it seems that the stability of tax
schedules is to be challenged by the recent thick plans of the governments to put new levies on the
rich, and by the fact that the political debate becomes more and more dominated by taxation related
issues. However, what we see nowadays should not necessarily be interpreted as political instability
with respect to the taxation system to be agreed on.
One theoretical argument may be that, except the core which gives unique taxations (when it
is not empty) for certain policy spaces, the least core cannot be proved to provide only a single tax
system. And a working definition of Mas-Colell Bargaining Set, if to respect classical properties, would
not have the cardinality of one since it should include the least core. Therefore, it is possible that the
proposals (and the changes) we are seeing are just happening within the “frontiers” of the least core
or the bargaining set (where we cannot formulate predictions). Another noteworthy argument for the
end of the chapter may be that, the recent apparent preference of governments for more progressivity
is just a normal switch from the taxations in the solution set for an R1, to taxations in the solution set
for an R2>R1 (condition imposed by the need to limit the public debt for the country).
14.6 References
[1] Carbonell-Nicolau, O., Klor, E.F. (2003). Representative democracy and marginal rate progressive
income taxation, J. Public Econ., 87: 2339-2366.
[2] Carbonell-Nicolau, O., Ok, E.A. (2007). Voting on income taxation, J. Econ. Theory, 134: 249-286.
[3] Cukierman, A., Meltzer, A.H. (1991). A political theory of progressive income taxation, in A. Meltzer, A.
Cukierman and S.F. Richard (eds.), Political Economy, OUP, NY, Chapter 5.
[4] Curt, P., Litan, C.M., Filip, D.A. (2010). A mathematical revisit of modelling the majority voting on fixed
income quadratic taxations, J. Inequal. Appl., 2010: 1-15.
[5] Curt, P., Litan, C.M., Filip, D.A. (2011). The least core in fixed-income taxation models: a brief
mathematical inspection, J. Inequal. Appl., 2011: 138: 1-15.
[6] Curt, P., Litan, C.M., Filip, D.A. (2011a). On the majority support for progressive income taxation when
income is fixed and the taxation is quadratic and purely redistributive, Studia Universitatis Babeş-Bolyai
Oeconomica, 56(1): 43-51.
[7] De Donder, P., Hindriks, J. (2003). The politics of progressives’ income taxation with incentive effects, J.
Public Econ., 87: 2639-2660.
[8] De Donder, P., Hindriks, J. (2004). Majority support for progressive income taxation with corner
preferences, Public Choice, 118: 437-449.
[9] Einy, E., Holzman, R., Monderer, D. (1999). On the least core and the mas-colell bargaining set, Games
Econ Behav, 28: 181-188.
[10] Grandmont, M. (2006). Fiscally stable distributions under majority voting, Advances in Mathematical
Economics, 8: 215-230.
[11] Hindriks, J. (2001). Is there a political demand for income tax progressivity? Econ. Lett., 73: 43-50.
[12] Klor, E.F. (2003). On the popular support for progressive taxation, J. Public Econ. Theory, 5: 593-604.
[13] Marhuenda, F., Ortuño-Ortin, I. (1995). Popular support for progressive taxation, Econ. Lett., 48: 319-
324.

Financial Aspects of Recent Trends in the Global Economy
257
[14] Marhuenda, F., Ortuño-Ortin, I. (1998). Income taxation, uncertainty and stability, J. Public Econ., 67:
285-300.
[15] Moreno-Ternero, J. (2011). Voting over piece-wise linear tax methods, J. Math. Econ., 47: 29-36.
[16] Roberts, K.W.S. (1977). Voting over income tax schedules, J. Public Econ., 8: 329-340.
[17] Roemer, J.E. (1999). The democratic political economy of progressive income taxation, Econometrica,
67: 1-19.
[18] Romer, T. (1975). Individual welfare, majority voting and the properties of a linear income tax, J. Public
Econ., 4: 163-185.
[19] Romer, T. (1977). Majority voting on tax parameters, J. Public Econ., 7: 127-133
[20] Snyder, J.M., Kramer, G.H. (1988). Fairness, self-interest, and the politics of the progressive income tax,
J. Public Econ., 36: 197-230.

Financial Aspects of Recent Trends in the Global Economy
258
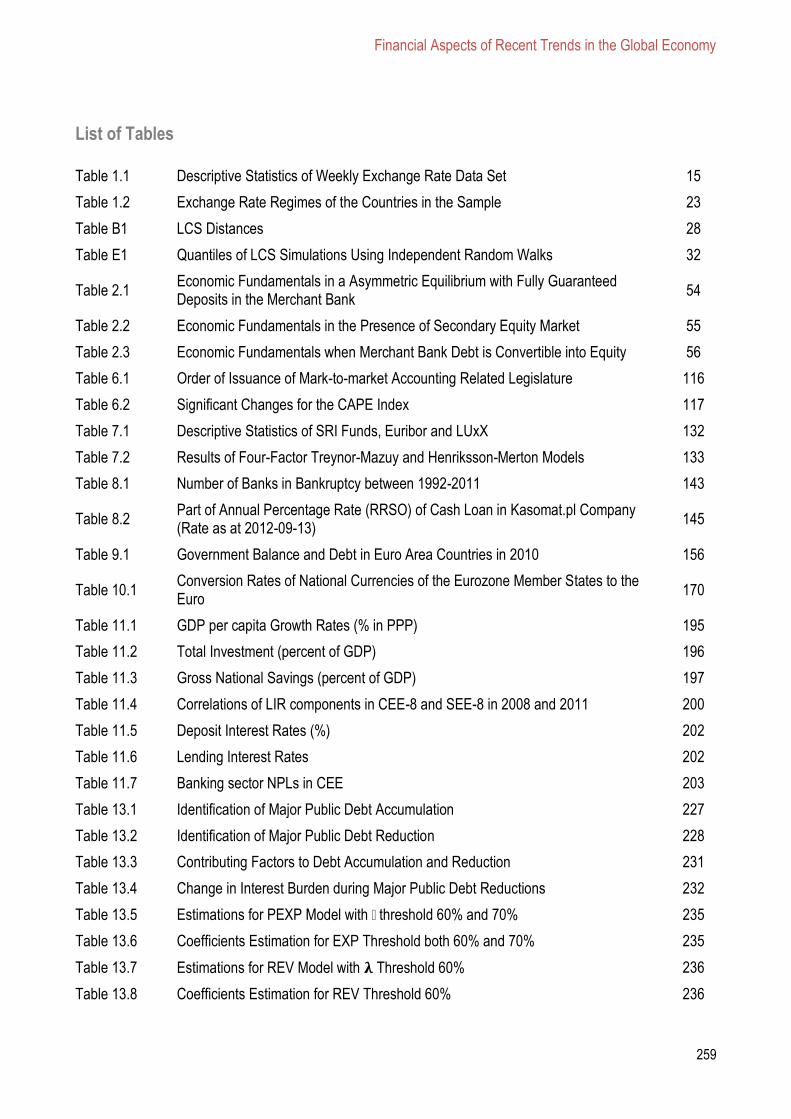
Financial Aspects of Recent Trends in the Global Economy
259
List of Tables
Table 1.1 Descriptive Statistics of Weekly Exchange Rate Data Set 15
Table 1.2 Exchange Rate Regimes of the Countries in the Sample 23
Table B1 LCS Distances 28
Table E1 Quantiles of LCS Simulations Using Independent Random Walks 32
Table 2.1 Economic Fundamentals in a Asymmetric Equilibrium with Fully Guaranteed Deposits in the Merchant Bank
54
Table 2.2 Economic Fundamentals in the Presence of Secondary Equity Market 55
Table 2.3 Economic Fundamentals when Merchant Bank Debt is Convertible into Equity 56
Table 6.1 Order of Issuance of Mark-to-market Accounting Related Legislature 116
Table 6.2 Significant Changes for the CAPE Index 117
Table 7.1 Descriptive Statistics of SRI Funds, Euribor and LUxX 132
Table 7.2 Results of Four-Factor Treynor-Mazuy and Henriksson-Merton Models 133
Table 8.1 Number of Banks in Bankruptcy between 1992-2011 143
Table 8.2 Part of Annual Percentage Rate (RRSO) of Cash Loan in Kasomat.pl Company (Rate as at 2012-09-13)
145
Table 9.1 Government Balance and Debt in Euro Area Countries in 2010 156
Table 10.1 Conversion Rates of National Currencies of the Eurozone Member States to the Euro
170
Table 11.1 GDP per capita Growth Rates (% in PPP) 195
Table 11.2 Total Investment (percent of GDP) 196
Table 11.3 Gross National Savings (percent of GDP) 197
Table 11.4 Correlations of LIR components in CEE-8 and SEE-8 in 2008 and 2011 200
Table 11.5 Deposit Interest Rates (%) 202
Table 11.6 Lending Interest Rates 202
Table 11.7 Banking sector NPLs in CEE 203
Table 13.1 Identification of Major Public Debt Accumulation 227
Table 13.2 Identification of Major Public Debt Reduction 228
Table 13.3 Contributing Factors to Debt Accumulation and Reduction 231
Table 13.4 Change in Interest Burden during Major Public Debt Reductions 232
Table 13.5 Estimations for PEXP Model with � threshold 60% and 70% 235
Table 13.6 Coefficients Estimation for EXP Threshold both 60% and 70% 235
Table 13.7 Estimations for REV Model with 𝛌 Threshold 60% 236
Table 13.8 Coefficients Estimation for REV Threshold 60% 236
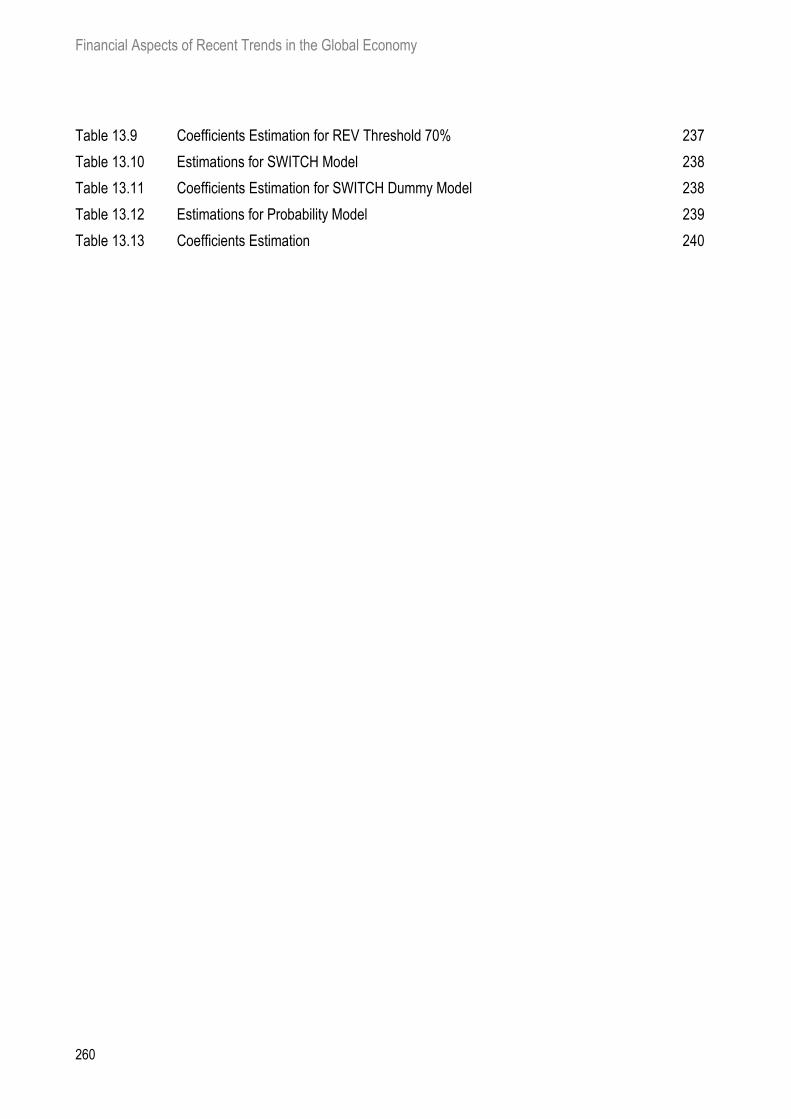
Financial Aspects of Recent Trends in the Global Economy
260
Table 13.9
Coefficients Estimation for REV Threshold 70%
237
Table 13.10 Estimations for SWITCH Model 238
Table 13.11 Coefficients Estimation for SWITCH Dummy Model 238
Table 13.12 Estimations for Probability Model 239
Table 13.13 Coefficients Estimation 240
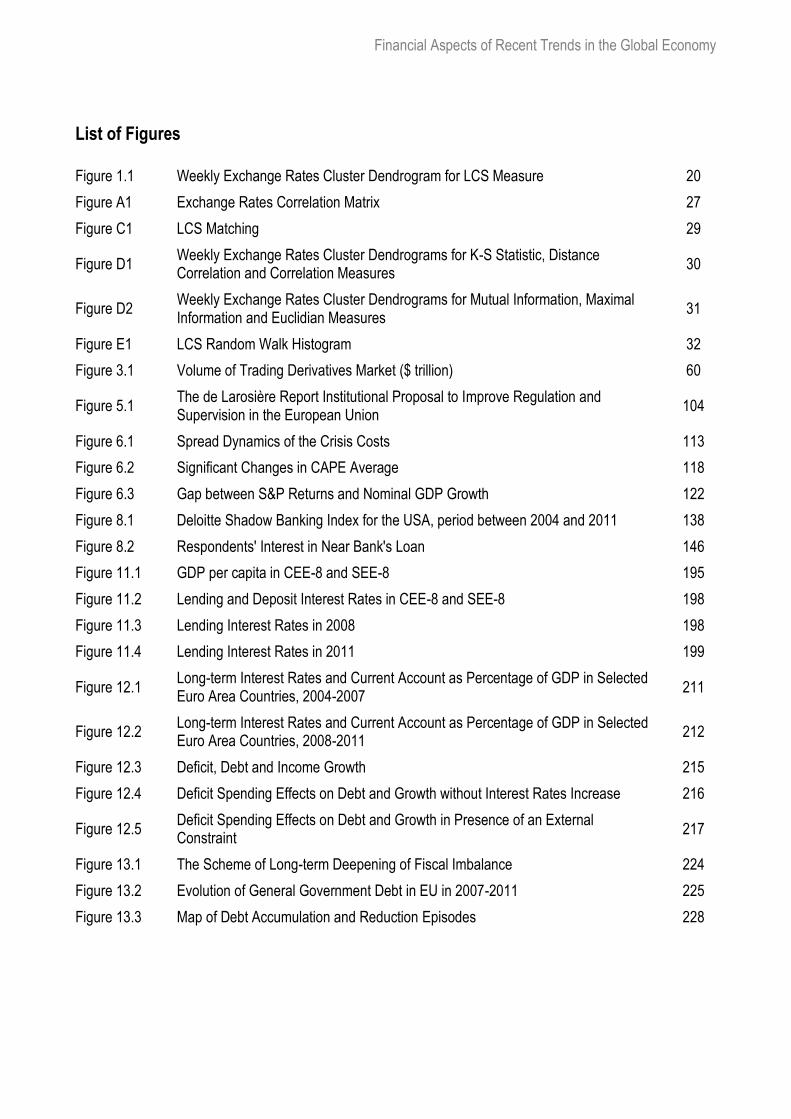
Financial Aspects of Recent Trends in the Global Economy
List of Figures
Figure 1.1 Weekly Exchange Rates Cluster Dendrogram for LCS Measure 20
Figure A1 Exchange Rates Correlation Matrix 27
Figure C1 LCS Matching 29
Figure D1 Weekly Exchange Rates Cluster Dendrograms for K-S Statistic, Distance Correlation and Correlation Measures
30
Figure D2 Weekly Exchange Rates Cluster Dendrograms for Mutual Information, Maximal Information and Euclidian Measures
31
Figure E1 LCS Random Walk Histogram 32
Figure 3.1 Volume of Trading Derivatives Market ($ trillion) 60
Figure 5.1 The de Larosière Report Institutional Proposal to Improve Regulation and Supervision in the European Union
104
Figure 6.1 Spread Dynamics of the Crisis Costs 113
Figure 6.2 Significant Changes in CAPE Average 118
Figure 6.3 Gap between S&P Returns and Nominal GDP Growth 122
Figure 8.1 Deloitte Shadow Banking Index for the USA, period between 2004 and 2011 138
Figure 8.2 Respondents' Interest in Near Bank's Loan 146
Figure 11.1 GDP per capita in CEE-8 and SEE-8 195
Figure 11.2 Lending and Deposit Interest Rates in CEE-8 and SEE-8 198
Figure 11.3 Lending Interest Rates in 2008 198
Figure 11.4 Lending Interest Rates in 2011 199
Figure 12.1 Long-term Interest Rates and Current Account as Percentage of GDP in Selected Euro Area Countries, 2004-2007
211
Figure 12.2 Long-term Interest Rates and Current Account as Percentage of GDP in Selected Euro Area Countries, 2008-2011
212
Figure 12.3 Deficit, Debt and Income Growth 215
Figure 12.4 Deficit Spending Effects on Debt and Growth without Interest Rates Increase 216
Figure 12.5 Deficit Spending Effects on Debt and Growth in Presence of an External Constraint
217
Figure 13.1 The Scheme of Long-term Deepening of Fiscal Imbalance 224
Figure 13.2 Evolution of General Government Debt in EU in 2007-2011 225
Figure 13.3 Map of Debt Accumulation and Reduction Episodes 228
Financial Aspects of Recent Trends in the Global Economy
262
x
Copyright © 2013 ASERS Publishing Craiova, Romania [email protected]
All Rights Reserved. No part of this publication may be reproduced, stored in a retrieval system or transmitted in any form or by any means, electronic, mechanical, photocopying, recording, scanning or otherwise, except under the terms of the Romanian Copyright, Designs and Patents Law, without the permission in writing of the Publisher, Requests to the Publisher should be addressed to the Permissions Department.
Title: Financial Aspects of Recent Trends in the Global Economy (FINART) Volume II
Editor: Rajmund Mirdala
Reviewers: Jean-Pierre Allegret Kosta Josifidis David Carfì John Hudson Giovanni Battista Dagnino
Published by: ASERS Publishing Craiova, Romania [email protected] http://www.asers.eu
Typesetting: Arial Narrow
Edition: First Printed in: Universitaria Printing House,
Brestei Street, 156A, Craiova, Romania Number of pages: 261 Official webpage: http://www.asers.eu/asers-publishing/books.html
ISBN-L: 978-606-93129-5-7 Print ISBN: 978-606-93129-7-1 Online ISBN: 978-606-93129-8-8
ASERS Publishing
Financial Aspects of Recent Trends in the Global Economy (FINART) Volume I

Financial Aspects of Recent Trends in the Global Economy
Financia
ISBN – L: 978-606-93129-5-7
Print ISBN: 978-606-93129-7-1
www.asers.eu
This book is important reading for anyone interesting by the implications of the financial globalization. The different contributions offer an in-depth analysis of the recent trends in globalization including debates related to the governance of the world economy and the implications of the crisis for the European integration. This book offers invaluable information for a wide range of audience; from academics to policy makers and anyone interested in learning about the multiple dimensions of the financial globalization.
Professor Jean-Pierre ALLEGRET, EconomiX, CNRS and University Paris Ouest Nanterre La Défense, France
The book provides an interesting overview of recent problems associated with financial crisis and large scale of related implications. Contributing authors challenged particular problems with not easy task to highlight and observe a large complex of crisis related issues in many areas of the real and financial world in global economy. Different ideas and problems are discussed providing in-depth insight into financial crisis effects.
Professor Kosta JOSIFIDIS, University of Novi Sad, Serbia
Very interesting and stimulating book on some of the most followed and important research themes of recent financial aspects in global economy. The authors go deep inside into reasons and perspectives of the present economic and financial crisis: from globalization and financial contagion to growth design and monetary policy; from global imbalances debt constraints to risk management in financial markets. The book ends in a section devoted to eurozone perspectives, with a particular eye to the crisis of euro's governance, to the monetary union and the role of the monetary policy, to the banks financing growth, to the fiscal policy and the external constraints in the eurozone. Readers find here intriguing and original volumes to read, about unavoidable current financial aspects of global economy.
Professor David CARFÌ, University of Messina, Italy
The final crisis is the most important event to affect economics in decades. These two volumes cover this crisis and how economics and economists are responding to it. The chapters vary from the theoretical to the empirical, from those with a focus on policy to more general principles and from those which concentrate on a specific country or group of countries to more general analyses. They are a timely addition to the literature.
Professor John HUDSON, University of Bath, Great Britain
This new two-volume publication "Financial Aspects of Recent Trends in the Global Economy" covers a range of extremely timely issues, such as discussions of several aspects at the origin of the widespread financial and economic crisis (i.e., state imbalances, debt constrains, and oscillating exchange rates), as well as the recent development in financial markets practices and the Eurozone prospects. For its inherent content and specific design, the book is without doubt a suggested reading to all the ones who want to plunge into a deeper and more informed understanding of various relevant financial facets and perspectives of our globalizing world.
Professor Giovanni Battista DAGNINO, University of Catania, Italy
Online ISBN: 978-606-93129-8-8


