Page 1
FINANCIAL FACTORS AFFECTING LIQUIDITY OF SAVINGS
AND CREDIT CO-OPERATIVE SOCIETIES IN KIRINYAGA
COUNTY, KENYA
JOHN MWANGI GITHAKA
A RESEARCH PROJECT SUBMITTED IN THE SCHOOL OF
BUSINESS AND ECONOMICS IN PARTIAL FULFILLMENT OF
THE REQUIREMENTS FOR THE AWARD OF THE DEGREE
OF MASTER OF BUSINESS ADMINISTRATION, IN THE
UNIVERSITY OF EMBU
AUGUST 2017
Page 2
ii
DECLARATION
This research project is my original work and has not been presented in any other
university or college for award of degree, diploma or certificate.
Signed ……………….. Date ……………..
John Mwangi Githaka
D530/1017/2013
This research project has been submitted for examination with our approval as the
candidate’s university supervisors.
Signed ………………… Date ……………….
Dr. Kimani E. Maina
Lecturer, Department of Business and Economics,
University of Embu
Signed ………………… Date ……………….
Mrs. Susan W. Gachora
Lecturer, Department of Business and Economics,
University of Embu
Page 3
iii
DEDICATION
This research project is dedicated to my family, my wife Faith, my son Courtney and
my daughter Tiffaney for their inspiration to further my studies. It is also dedicated to
my parents Francis Githaka and Nancy Wanjiku for their enormous resources support
in all my studies and for their constant reminder that I ought to be a role model in life,
and more so, in academics.
Page 4
iv
ACKNOWLEDGEMENT
I acknowledge and appreciate our heavenly Father for His divine power, enduring
mercies, favour, health and the gift of life that He has granted me since the inception
of this course. I am grateful to my supervisors Dr. Kimani E. Maina and Mrs. Susan
Gachora for their professional guidance through this project. I wish to also thank my
colleagues, friends and especially my classmates for their encouragement and
challenge to complete the course in time. Finally, I acknowledge University of Embu
for giving me the opportunity to pursue the course.
Page 5
v
TABLE OF CONTENTS
Page
DECLARATION ....................................................................................................... ii
DEDICATION .......................................................................................................... iii
ACKNOWLEDGEMENT ....................................................................................... iv
LIST OF TABLES ................................................................................................... vii
LIST OF FIGURES .................................................................................................. ix
LIST OF APPENDICES ........................................................................................... x
ABBREVIATIONS AND ACRONYMS ................................................................ xi
DEFINITIONS OF TERMS ................................................................................... xii
ABSTRACT ............................................................................................................ xiii
CHAPTER ONE ........................................................................................................ 1
INTRODUCTION ..................................................................................................... 1
1.1 Background of the Study .................................................................................. 1
1.2 Statement of the Problem .................................................................................. 5
1.3 General Objective ............................................................................................. 6
1.4 Research Questions ........................................................................................... 6
1.5 Scope of the study ............................................................................................. 6
1.6 Significance of the Study .................................................................................. 7
1.7 Limitations of the study …………………………………………………….. 7
CHAPTER TWO ....................................................................................................... 8
LITERATURE REVIEW ......................................................................................... 8
2.1 Introduction ....................................................................................................... 8
2.2 Theoretical Review ........................................................................................... 8
2.3 Conceptual Framework ................................................................................... 10
2.4 Empirical Review …………………………………………………………... 13
2.5 Summary of Literature Review ...................................................................... 14
2.6 Research Gaps ................................................................................................ 15
CHAPTER THREE ................................................................................................. 16
RESEARCH METHODOLOGY ........................................................................... 16
3.1 Introduction ..................................................................................................... 16
3.2 The Research Design ...................................................................................... 16
3.3 Target Population ............................................................................................ 16
3.4 Sampling Technique and Sample Size ........................................................... 16
Page 6
vi
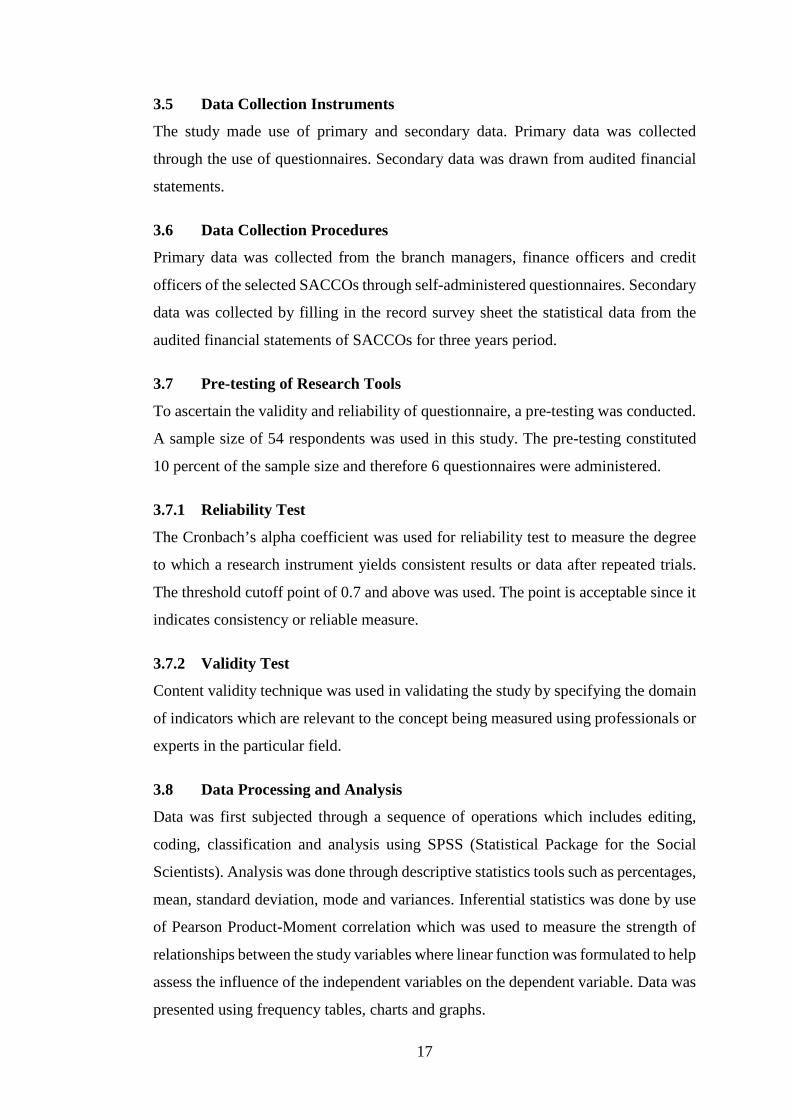
3.5 Data Collection Instruments ........................................................................... 17
3.6 Data Collection Procedures ............................................................................ 17
3.7 Pre-testing of Research Tools ......................................................................... 17
3.8 Data Processing and Analysis ......................................................................... 17
CHAPTER FOUR ……………………………………………………………...... 20
RESEARCH FINDINGS AND DISCUSSIONS ................................................... 20
4.1 Introduction ……………………………………………………………...… 20
4.2 Response Rate ................................................................................................ 20
4.3 Demographic Information …………………………………………...…….. 20
4.4 Descriptive Statistics …………………………………………………......... 38
4.5 Inferential Findings ……………………………………………...………… 43
4.6 Regression Analysis ……………………………………….………………. 45
CHAPTER FIVE ..................................................................................................... 49
SUMMARY, CONCLUSIONS AND RECOMMENDATIONS ......................... 49
5.1 Introduction .................................................................................................... 49
5.2 Summary of Findings ………………………………………...……………. 49
5.3 Conclusions ………………………………………………………………... 51
5.4 Recommendations of the Study ...................................................................... 51
5.5 Suggestions for Further Research ...........................................................…...52
REFERENCES ........................................................................................................ 53
APPENDICES .......................................................................................................... 58
Page 7
vii
LIST OF TABLES
Page
Table 3.1: Statistical Analysis Table ……………………………...…….......…... 18
Table 4.1: Cronbach Alpha for Reliability Assessments …………………………. 20
Table 4.2: Gender of the respondents ……………………………………….…….. 21
Table 4.3: Age of the respondents ……………………………………….......…… 22
Table 4.4: Educational Level of the Respondents ………………………………... 23
Table 4.5: Department/Section of the Respondents ………………………….…… 25
Table 4.6: External Financial Engagements ………………………….……….….. 27
Table 4.7: Internal Financial Engagements ………………………………………. 28
Table 4.8: Performing Loans ……………………………………………………... 30
Table 4.9: Watch Loans …………………………………………………………... 30
Table 4.10: Sub-standard Loans ………………………………………………..… 31
Table 4.11: Doubtful Loans ………………………………………………….…… 32
Table 4.12: Loans Loss …………………………………………………….……... 33
Table 4.13: SACCOs’ New Investments ………………………………………..... 33
Table 4.14: Land and Buildings …………………………………………………… 34
Table 4.15: Listed Company Shares ………………………………………………. 35
Table 4.16: Treasury Bills ………………………………………………………… 36
Table 4.17: Treasury Bonds ………………………………………………………. 36
Table 4.18: Off-Shore Investments ……………………………………………….. 37
Table 4.19: Cash and Cash Equivalents …………………………………………… 38
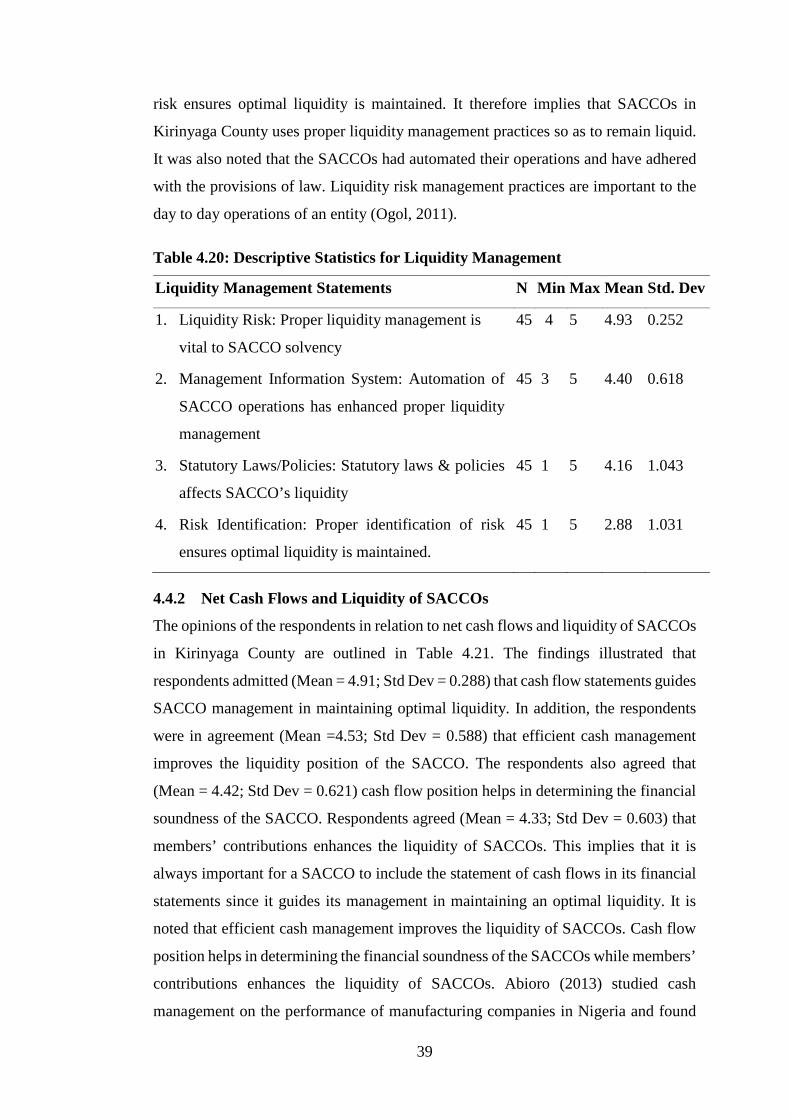
Table 4.20: Descriptive Statistics for Liquidity Management …………………….. 39
Table 4.21: Descriptive Statistics for Net Cash Flows ……………………………. 40
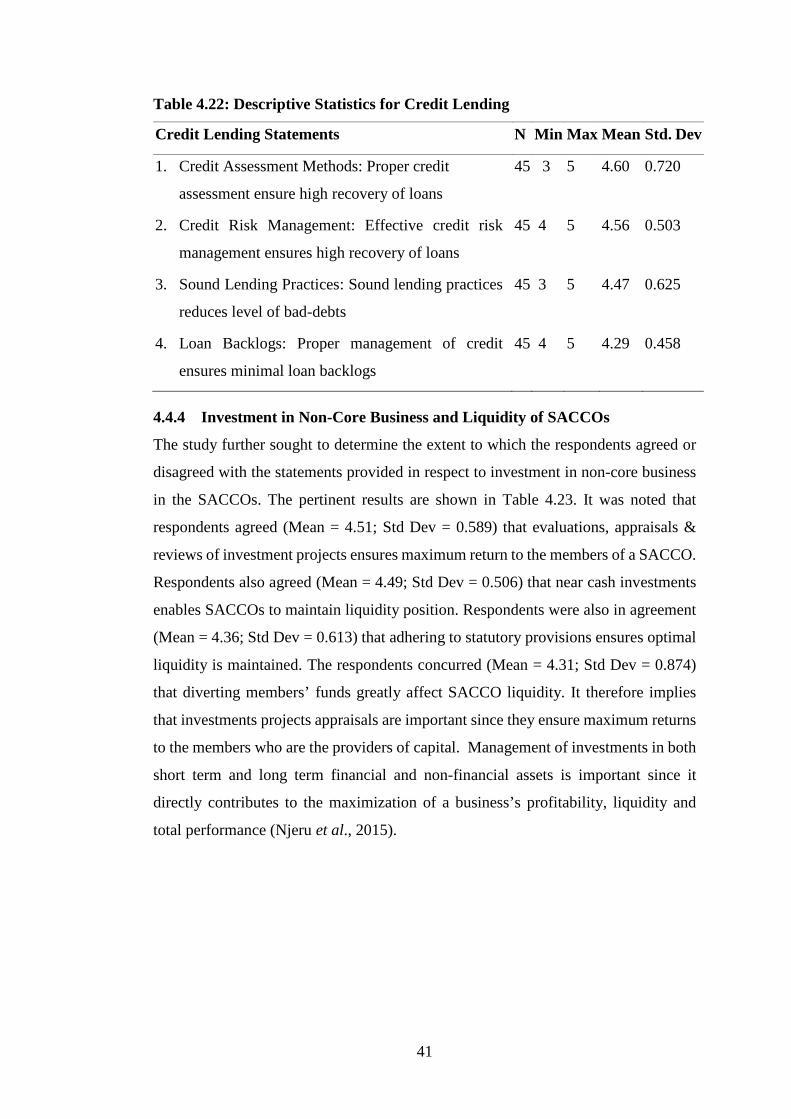
Table 4.22: Descriptive Statistics for Credit Lending …………………………….. 41
Table 4.23: Descriptive Statistics for Investment in Non-Core Business …………. 42
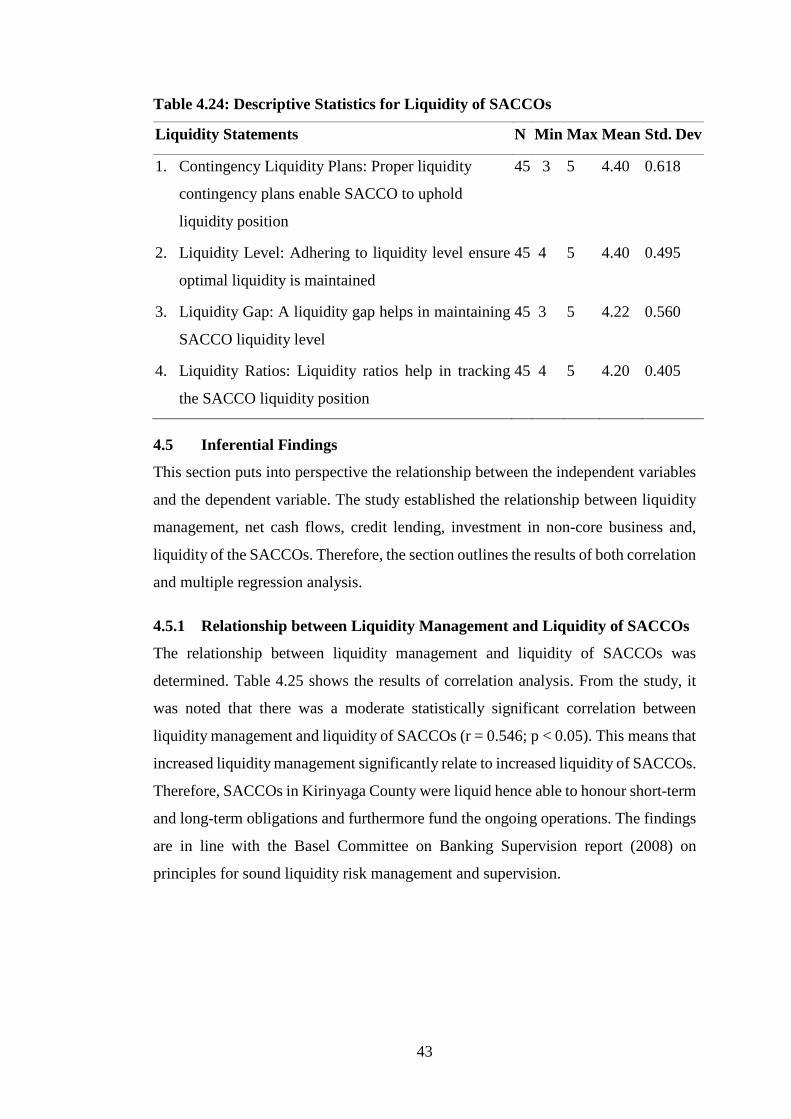
Table 4.24: Descriptive Statistics for Liquidity of SACCOs ……………………… 43
Table 4.25: Correlation between Liquidity Management and Liquidity
of SACCOs ........................................................................................... 44
Table 4.26: Correlation between Net Cash Flows and Liquidity of SACCOs……. 44
Table 4.27: Correlation between Credit Lending and Liquidity of SACCOs ……. 45
Table 4.28: Correlation between Investment in Non-Core Business and
Liquidity of SACCOs ……………………………………..………….. 45
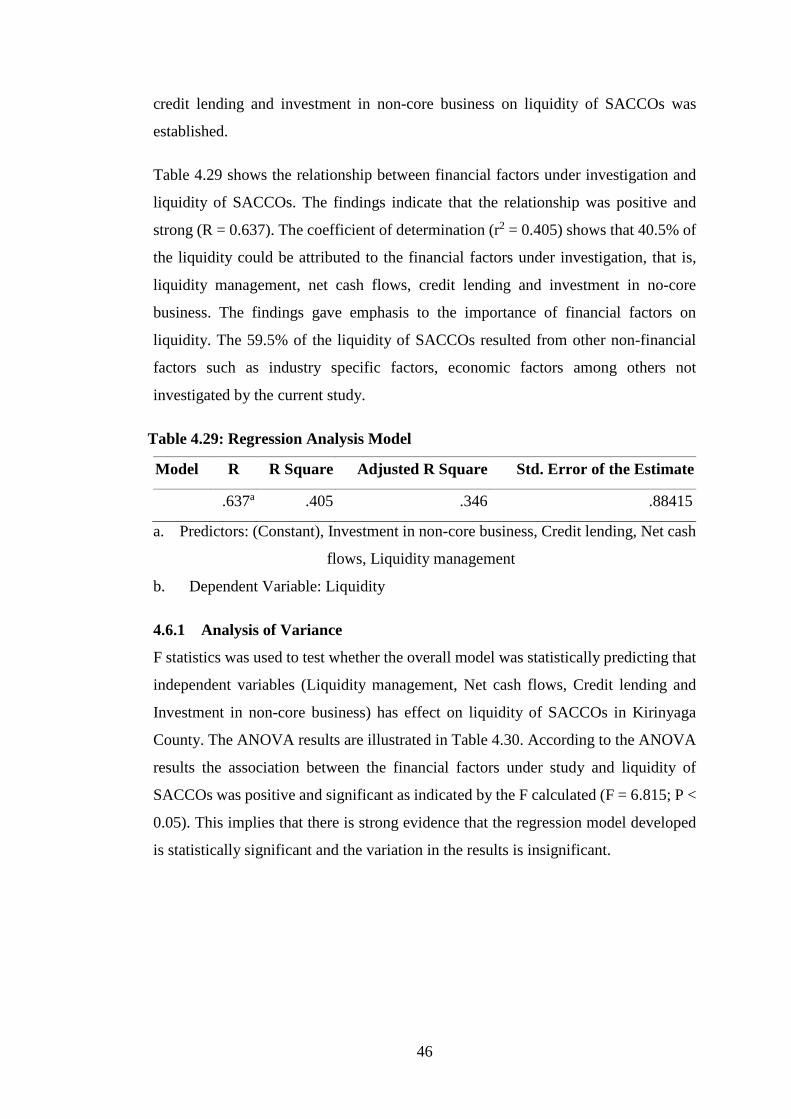
Table 4.29: Regression Analysis Model …………………………………………… 46
Page 8
viii
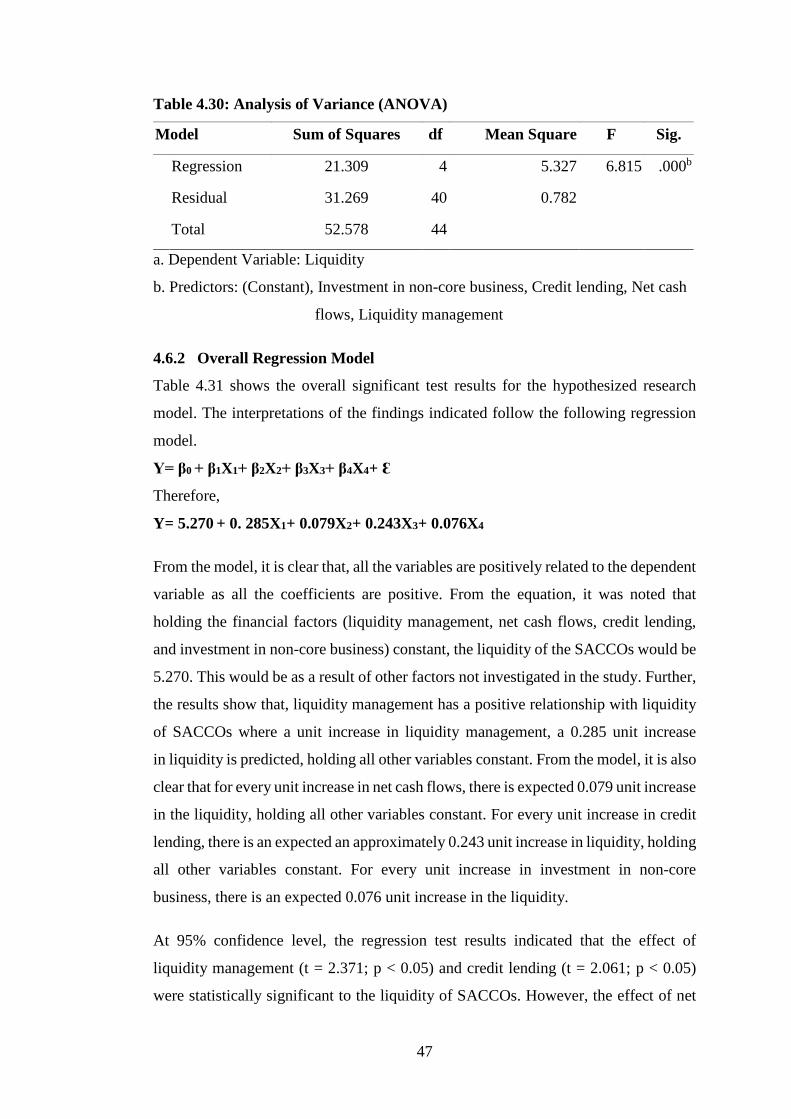
Table 4.30: Analysis of Variance (ANOVA) ………………………………………. 47
Table 4.31: Regression Coefficients …………………………………………...…... 48
Page 9
ix
LIST OF FIGURES
Page
Figure 2.1: Conceptual Framework ……………………………………..….…….. 9
Figure 4.1: Length of Service of the Respondents ……………………………..... 22
Figure 4.2: Position of the Respondents ………………………………...….….… 24
Figure 4.3: Average Monthly Members’ Contribution ……………...……......….. 26
Figure 4.4: Average Yearly Members’ Withdrawal Rate ...............................….... 27
Figure 4.5: Average Monthly Loan Repayment …………………………………..29
Page 10
x
LIST OF APPENDICES
Page
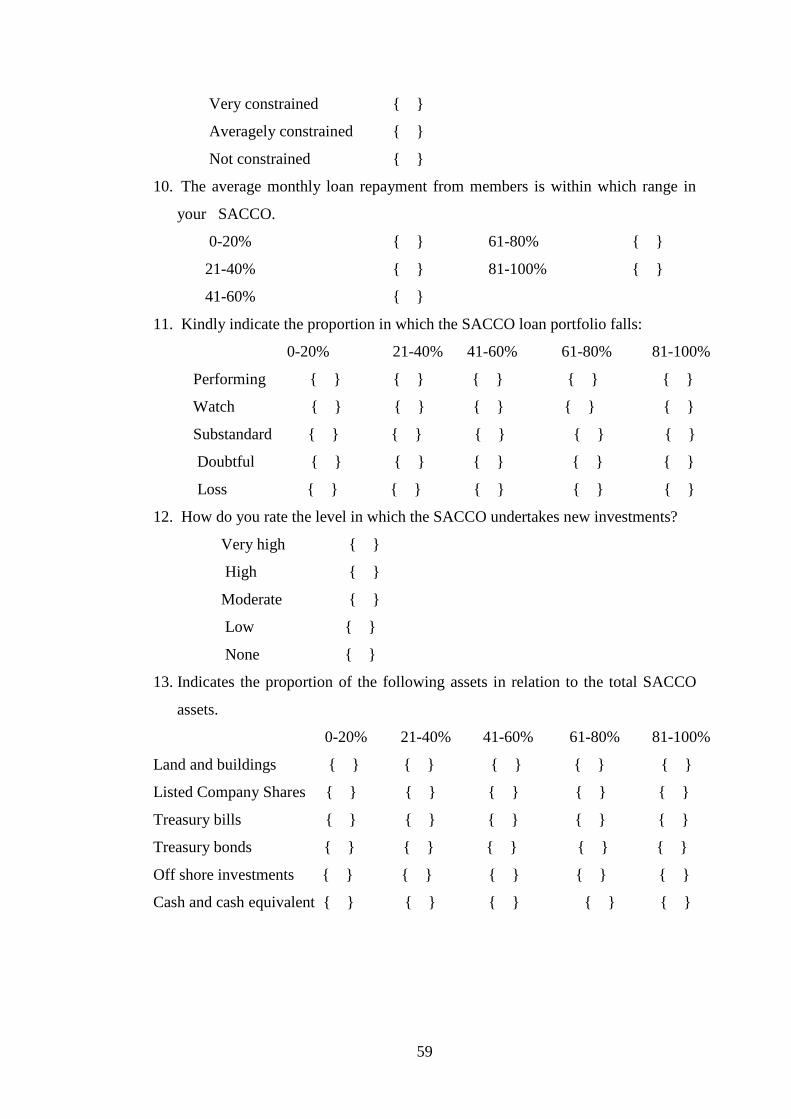
Appendix I Questionnaires …….……………………………….……..……….. 58
Appendix II Record Survey Sheet ………………………………….……..…...... 65
Page 11
xi
ABBREVIATIONS AND ACRONYMS
ACCOSCA African Confederation of Co-operative Savings and Credit
Associations
CFF Central Finance Facility
FOSA Front Office Services Activity
FSD Financial Services Deepening
ICA International Co-operative Alliance
IMF International Monetary Fund
KUSCCO Kenya Union of Savings and Credit Co-operatives
MFIs Micro Finance Institutions
SACCO Savings and Credit Co-operatives
SASRA SACCO Societies Regulatory Authority
WOCCU World Council of Credit Unions
Page 12
xii
DEFINITION OF TERMS
Savings and Credit Co-operative (SACCO)
It is a democratic, unique member driven, self-help co-operative. It is owned and
governed by its members who have the same common bond (ICA, 2007).
Liquidity
Liquidity is a measure of the extent to which a person or organization has cash to meet
immediate and short-term obligations (Omino, 2014).
Liquidity Risk
It is the potential financial loss arising from inability either to meet obligations or to
fund increases in assets as they fall due without incurring unacceptable costs or losses
(Omino, 2014).
Liquidity Risk Management
It is the planning and controlling of current assets/liabilities in such a manner that
eliminates the risk of inability to meet due short-term obligations and to avoid
excessive investment in these assets (Brunnermeier & Pedersen, 2009).
Liquidity Management
It involves a daily analysis and estimation of the size and timing of cash inflows and
outflows over the future to minimize the risk that savers will be unable to access their
deposits in the moments they demand them (Brunnermeier & Pedersen, 2009).
Net Cash Flow
It is the total amount of money being transferred into and out of a business, especially
as affecting liquidity. (Maina, 2011).
Credit
It is a contractual agreement in which a borrower receives something of value now
and agrees to repay the lender at some date in the future (Maina et al., 2016).
Credit Risk
It occurs when a borrower defaults and does not honor his or her obligation to service
debt on time (Maina et al., 2016).
Page 13
xiii
ABSTRACT
Savings and Credit Co-operative Societies are quasi financial institutions that mobilize savings, provide loans as well as other products to their members. Liquidity is considered as one of the serious concern and challenge for the modern era SACCOs. A SACCO having good asset quality, strong earnings and sufficient capital may fail if it is not maintaining adequate liquidity. The general objective of the study was to assess the financial factors that influence liquidity of Savings and Credit Co-operatives Societies in Kenya. A cross-sectional survey research design was used in this study. The target population consisted of all the 60 registered SACCOs in Kirinyaga County from which a sample size of 18 SACCOs was drawn. The study employed stratified random sampling technique. Primary data was collected by use of self-administered semi-structured questionnaires, while secondary data was collected from audited financial statements of the SACCOs and regulator. A pilot test was conducted to ascertain the validity and reliability of questionnaire. The Cronbach’s alpha coefficient was used for reliability test while the content validity technique was used in validating the research instruments. The data was analyzed using descriptive statistics tools such as percentages, mean, standard deviation, mode and variances. Inferential statistics was done by use of Pearson’s product moment of correlation. Multiple regression analysis was performed to assess the relationship between study variables. R2 was used to assess the contribution of independent variable on dependent variable. Data was presented using frequency tables, charts and graphs. The F-test was used to evaluate the significance of the obtained results. The study findings is of great importance to the SACCO management to formulate proper policies. The study helps the regulator and the government to improve on the framework for regulation of SACCO’s. The study found the relationship between liquidity management, net cash flows, credit lending and investment in non-core business and liquidity of SACCOs to be positively correlated. The study concluded that SACCOs in Kirinyaga County mostly capitalized on liquidity management and as such it affected the SACCOs’ liquidity. In addition, the study concluded that it was critical for SACCOs to have adequate liquidity in order to ensure that they meet short term maturing obligations. The study also concludes that cautious credit lending in SACCOs would result to helpfulness in liquidity of SACCOs. The study recommends that the SACCO management must put in place financial strategies to ensure that liquidity is effectively managed on a regular and timely basis and that appropriate policies and procedures are established to limit and control material sources of liquidity risk. It also recommends that SACCOs should also reconsider their loan recovery strategies and collateral for their loans and advances.
Page 14
1
CHAPTER ONE
INTRODUCTION
1.1 Background of the Study
Savings and Credit Co-operative Societies (SACCOs) are quasi financial institutions
that mobilize savings, provide loans as well as other products to their members [Kenya
Union of Savings and Credit Co-operatives (KUSCCO, 2009)]. SACCOs plays an
important role in Kenya’s financial sector in provision of affordable financial services
to their members both urban and rural households (Co-operative Bank of Kenya,
2013). The co-operatives in Kenya can be traced back in 1908 when European settlers
formed the Lumbwa Co-operative Society near Kericho (Kiragu, 2014). Kenya Co-
operative movement is currently ranked 1st in Africa and 7th internationally (SASRA,
2013). In July 2013, World Council of Credit Unions recognized Kenya SACCOs as
the fastest growing subsector in the World [World Council of Credit Unions
(WOCCU, 2013)].
1.1.1 Financial Factors that Influence Liquidity
Savings mobilization is not an end in itself, it plays an important role in sustaining
growth and development (Odhiambo, 2013). A high saving economy accumulates
assets faster, and thus grows faster, than does a low saving economy (Muriuki, 2013).
Members’ savings deposits forms the major source of funding for the SACCO
Societies (Kiragu, 2014). These are deposits contributed on a monthly basis by
members and are used for borrowing from the SACCO Society (SACCO Societies
Act, 2008). The SACCOs had mobilized savings to the tune of Ksh.380 billion with
asset base of 493 billion as at 31st December, 2012. Savings mobilization in the
SACCO subsector has been growing at the average rate of 30% per annum (SASRA,
2013). Members’ contributions are deducted from their salaries or products’ pay out
on a regular basis and remitted to the SACCO Society (Godfrey, 2015). Loan
recoveries are similarly made on a regular basis (Keitany, 2013).
SACCO societies are prohibited to grant a loan or credit facility to a member where
the loan or credit facility, in the aggregate, exceeds such limit of the SACCO society’s
core capital (SACCO Societies Act, 2008). Loans to members in the Kenya’s SACCO
subsector increased by 23% in 2011 to stand at 221 billion up from 179.9 billion
Page 15
2
(SASRA, 2012). The SACCOs are now significant partners in national financial
markets of most world economies. The ability of a financial institution to meet
demand for deposit withdrawals and other cash outflows is a visible indicator of its
viability (Muraguri, 2014). During the 2007 financial crisis, the financial institutions
were unable to roll over short-term financing which resulted in a major liquidity event
and their subsequent collapse which, among other factors, had a detrimental effect on
the global economy. SACCOs have largely invested their funds in the following
investment channels; loans which take a major share, liquid investments such as
money transfer services, financial investments such as term deposits, bonds, treasury
bills, non-financial investments such as land and buildings, and investments in
regulated financial institutions such as shares (WOCCU, 2009). In an environment of
ultra-low interest rates, one of the biggest challenges that SACCOs face over the years
is the ability to generate meaningful income.
The vision 2030 blue print in Kenya recognizes SACCO societies as important players
in deepening financial access to mobilize savings for investments in enterprises and
personal development (Karagu & Okibo, 2014). SACCO Societies investment
decisions are shown to be directly related to financial factors (Maina, 2011). SACCO
Societies are prohibited from investing in non-earning assets or property and
equipment in excess of 10% of total assets, of which land and buildings shall not
exceed 5% (SACCO Societies Act, 2008). SACCO Societies are also required to
dispose of the investment in property acquired for the purpose of future expansion, if
the property remains unutilized for 2 years from the date of acquisition (Ademba,
2010).
Default on loan repayments poses the greatest risk to stability of the multi-billion
shilling savings and credit co-operative movement (SASRA, 2013). The risk of
defaults on personal loans granted by SACCOs is high, as the debts are secured only
by member guarantees (Maina, Kinyariro & Muturi, 2016). The regulator has also
warned that reliance on expensive bank loans, instead of members’ share
contributions, raised the probability of the SACCOs defaulting on their debt (Keitany,
2013). This is indicated by SACCOs’ low liquidity and solvency ratios especially
since borrowing costs have sharply increased over the past periods.
Page 16
3
1.1.2 Liquidity of Savings and Credit Co-operative Societies
Liquidity is the ability of a business entity to honor all cash payment commitments as
they fall due (Kimathi, 2014). Funding liquidity is the ability to fund increases in
assets and meet obligations as they come due, without incurring unacceptable losses
(Basel Committee on Banking Supervision, 2008). An asset is therefore said to be
liquid if it can be easily bought or sold (Goodhart, 2008). The cash payment
commitments can be met either by drawing from a stock of cash holdings, by using
current cash inflows, by borrowing cash or by converting liquid assets into cash
(Goodhart, 2008). Effective liquidity risk management helps ensure a SACCO’s
ability to meet cash flow obligations, which are uncertain as they are affected by
external events and other agent’s behaviour (Song’e, 2015). Liquidity risk
management is of paramount importance because a liquidity shortfall at a single
institution can have system-wide repercussions (Muraguri, 2014). Liquidity is
essential in all SACCOs to meet customer withdrawals, compensate for balance sheet
fluctuations, and provide funds for growth (Njeri, 2014).
Liquidity management involves estimating liquidity requirements and meeting those
needs in a cost-effective way (Owino, 2011). An effective liquidity management
requires financial institutions to estimate and plan for liquidity demands over various
periods and to consider how funding requirements may evolve under various
scenarios, including adverse conditions (Njeri, 2014). SACCOs must maintain
sufficient levels of cash, liquid assets, and prospective borrowing lines to meet
expected and contingent liquidity demands (Ogol, 2011). The management of
SACCOs has to present the capital adequacy return reports, liquidity statement report,
statement of financial position and statement of deposit return as well as return on
investments report which compares land, building, and financial assets to the
SACCO’s total assets and its core capital (WOCCU, 2013). Karagu and Okibo (2014)
documented that liquidity enables firms to survive during bad economic times and is
achieved by holding a portfolio of liquid investment.
1.1.3 Financial Factors versus Liquidity of Savings and Credit Co-operative
Societies
The SACCO business, like the banking business thrives on trust and confidence of the
depositors and investors (Odhiambo, 2013). The importance of the SACCO sub-sector
Page 17
4
in Kenya led the Government to enact the SACCO Act 2008 and the SACCO Societies
Regulations 2010 (Kiragu, 2014). The SACCO Societies Act 2008 and its attendant
regulations 2010, are risk oriented providing minimum operational regulations and
prudential standards required of deposit-taking SACCO Societies to ensure financial
stability of the SACCO subsector (SACCO Societies Act, 2008). The policy objective
of establishing prudential regulation of deposit taking SACCOs is to enhance
transparency and accountability in the SACCO subsector (Kimathi, 2014).
The prudential standards target all areas that entail significant risk for the SACCO
business from a going-concern perspective. These areas include the availability of
capital funds to face any potential unexpected losses arising from poorly performing
loans or investments and the quality of the loan portfolio as the main income-
generating asset in SACCO Societies as well as ensuring that loan granting and
lending conforms to the approved credit policy (SACCO Societies Act, 2008). Other
areas are the continuing availability of liquid funds to finance loan portfolio growth
and to respond to depositors’ and creditors’ needs and the overall asset structure in
terms of non-earning assets, fixed assets and investments in private sector securities
(SASRA, 2012).
As at December 31st 2012, average liquidity (net liquid assets divided by savings
deposits and short term liabilities) for the licensed deposit taking SACCOS stood at
36% against a statutory minimum of 15%. However, the demand for loans continues
to put pressure on liquidity with the industry ratio of loans to deposits exceeding 100%
(SASRA, 2012). As financial institution, SACCOS should manage the demand and
supply of liquidity in an appropriate manner in order to safely run their business,
maintain good relations with the stakeholders and avoid liquidity problem (Njeri,
2014).
1.1.4 Savings and Credit Co-operative Societies in Kirinyaga County
Kirinyaga County borders Embu County to the east, Machakos County to the south,
Murang’a County to the south west and Nyeri County to the west. In 2009, the County
had a population of 528,054 persons and an area of 1,478.1 square kilometers with an
annual growth rate of 1.5 percent. In Kirinyaga County, the first Savings and Credit
Co-operative Societies were started in the seventies and they have grown
tremendously (Kamonjo, 2014). There are over 60 registered co-operatives with over
Page 18
5
10 deposit taking SACCOs in Kirinyaga County (Kamonjo, 2014). The movement is
estimated to have over Ksh. 10 billion in savings and over Ksh. 2.5 billion in share
capital while employing about 500 directly and another 1,000 indirectly (SASRA,
2013). SACCOs in Kirinyaga County has led to growth of many small scale
businesses but the loans has been defaulted to a large extent such that it has become a
concern of the all the stakeholders within the county (Kamonjo, 2014).
1.2 Statement of the Problem
SACCOs have been providing financial products to their members without any
competition from other financial service providers (Song’e, 2015). SACCOs convert
immediately available savings deposits into loans with longer maturities (Muriuki,
2013). However, individual savings deposits are typically much smaller than an
average loan, requiring multiple deposits to fund a single loan (Obbuyi, 2014). These
predispose them to liquidity risks (Kimathi, 2014). More so, liberalization have also
resulted in a lot of competition from other financial service providers leading to
liquidity problems (Kimathi, 2014). The liquidity challenges seems to impair the
SACCOs’ ability to offer timely services. Low liquidity make the SACCO not to be
able to meet share capital and savings withdrawals, external borrowing repayments,
member loan demand and operating expenses (Maina, 2011). It can also lead to low
income generation as disbursements are low and membership withdrawals (Kimathi,
2014). This has been a major cause of failure of many SACCOs (Godfrey, 2015). In
return it lead to business failure due to fund shortage, low economic development,
loss of investors’ confidence and unemployment in the country.
In Kenya, studies have been done in regard to SACCOs. Muraguri (2014) studied the
effect of liquidity on the return on investments for SACCOs in Nairobi. Okundi (2011)
studied the financial challenges facing savings and credit co-operative societies in
Kenya. Karagu (2014) did a study on the financial factors influencing performance of
savings and credit co-operative organization in Kenya. Keitany (2013) studied the
relationship between loan default and the financial performance of SACCOs in
Kenya. Song’e (2015) carried out a survey on the effect of liquidity management on
the financial performance of deposit taking SACCOs in Nairobi County. Kamonjo
(2014) studied the effects of corporate governance practices on financial performance
of SACCOs in Kirinyaga County. It is evident that there is hardly any empirical
Page 19
6
literature that discusses the assessment of financial factors that affect the liquidity of
SACCOs in Kirinyaga County. It is against this background that the study intended to
fill this pertinent gap by focusing on the financial factors that affect the liquidity of
SACCOS with Kirinyaga as the area under scope.
1.3 General Objective
The general objective of the study was to assess the financial factors that affect
liquidity of Savings and Credit Co-operatives Societies in Kirinyaga County, Kenya.
1.3.1. Specific Objectives
i) To investigate the effect of liquidity management on liquidity of SACCOs in
Kirinyaga County
ii) To establish the effect of net cash flow on liquidity of SACCOs in Kirinyaga
County
iii) To evaluate the effect of lending on liquidity of SACCOs in Kirinyaga County
iv) To examine the effect of investment in non-core business on liquidity of
SACCOs in Kirinyaga County
1.4 Research Questions
i) What is the effect of liquidity management to the liquidity of SACCOs in
Kirinyaga County?
ii) What is the effect of net cash flow to the liquidity of SACCOs in Kirinyaga?
iii) What is the effect of lending to the liquidity of SACCOs in Kirinyaga County?
iv) What is the effect of investment in non-core business to the liquidity of
SACCOs in Kirinyaga County?
1.5 Scope of the study
The research focused on financial factors affecting liquidity of SACCOs in Kirinyaga
County. There are 6007 registered SACCOs in Kenya. The total population of
SACCOs in Kirinyaga County is 60. The major focus on Kirinyaga County was
because it is one of the top drivers of Kenya’s economy contributing a significant
portion of the national wealth despite its small size. The research was conducted using
financial factors such as liquidity management, cash flow, credit lending and
investment in none-core business as independent variables and their relationship with
liquidity as dependent variable.
Page 20
7
1.6 Significance of the Study
The study findings benefits the management board which has been mandated by law
to formulate proper policies to ensure effective running of the SACCO and the
managers by gaining insight on how their SACCOs can cease liquidity problems and
especially currently when we have new regulator. The study is of great importance to
future scholars and academicians as there is inadequate literature in the field of
SACCO’s regulations, especially in the developing countries. This study forms the
basis for future researches as it provides literature basis. The SACCO Society
Regulatory Authority can use the study to improve on the framework for regulation
of SACCO’s in Kenya even as they continue with the role of regulating the SACCO’s
in this infancy stages. The study assists SASRA in the implementation of the new
regulations to deal with the investment of SACCO funds and business continuity as
way of promoting SACCOs. The study assists the Government and its agencies in
coming up with policies through the SACCO regulatory authority, SASRA and Vision
2030 Secretariat especially in strengthening policy considerations in the subsector.
1.7 Limitations of the Study
Although the research reached its aims, there were some unavoidable limitations. The
main limitation of this study was the information disclosure, owing to the fact that it
is touching on heart of SACCO’s operations. This was due to the other fact that the
information required by the researcher was considered classified and confidential
implying to share with a stranger is not encouraged. Then the aspect of time due to
limited time because the researcher is a full-time employee. However, a coherent
system in collecting and analyzing data should minimize the risks of research process.
Page 21
8
CHAPTER TWO
LITERATURE REVIEW
2.1 Introduction
In this chapter, theoretical literature, conceptual framework, empirical review,
summary of reviewed literature and research gaps are discussed.
2.2 Theoretical Review
This study was guided by commercial loan theory of liquidity, Baumol’s model of
cash management, anticipated income theory, free cash flow theory and liquidity
premium theory.
2.2.1 Commercial Loan Theory of Liquidity
Andersen (1969) argued that short-term loans advanced to finance salable goods on
the way from producer to consumer are the most liquid loans the SACCO can make.
These are self-liquidating loans because the goods being financed will soon be sold.
The loan finances a transaction and the transaction itself provides the borrower with
the funds to repay the financial institution and therefore in managing its investment
portfolio a SACCO must strike a balance between the objectives of liquidity and
profitability. SACCO liquidity depends on the availability and cost of borrowings
(Muraguri, 2014). If it can borrow large amounts at any time without difficulty at a
low cost (interest rate), it will hold very little liquid assets. But if it is uncertain to
borrow funds or the cost of borrowing is high, the SACCO will keep more liquid
assets in its portfolio.
2.2.2 Baumol’s Model of Cash Management
The Baumol’s model of cash management, first suggested by William in 1952, is an
economic model of the transactions demand for money. The model helps in
determining a firm’s optimum cash balance under certainty. The theory relies on the
trade off between the liquidity provided by holding money (the ability to carry out
transactions) and the interest foregone by holding one’s assets in the form of non-
interest-bearing money. SACCO should optimally manage cash and marketable
securities so as to achieve a balance between the risk of insufficient liquid or near
liquid resources, and the cost of holding excessively high levels of these resources.
The model has various limitations. It does not allow cash flows to fluctuate. Overdraft
is not considered in the model and there are uncertainties in the pattern of future cash
Page 22
9
flows. Since most of the SACCO’s operations revolve around advancement of cash
then it is imperative for a considerable minimum level of cash to be maintained
(Huseyin, 2011). The theory therefore is of essence on the bases of the policy the
SACCOs may have in place with regard to cash retention so as to avoid illiquidity.
2.2.3 The Anticipated Income Theory
Herbert (1948) outlined that liquidity can be ensured if scheduled loan payments are
made on future income of the borrower. This theory holds that a SACCO liability can
be influenced by the maturity pattern of loans and investment portfolios. The theory
recognized that certain types of loans have more liquidity than others. On the basis of
this theory, SACCO management should adopt ladder effect in the investment
portfolio as this will ensure a certain amount of securities are maturing annually and
at times when funds might be demanded for lending or withdrawal (Muraguri, 2014).
2.2.4 Free Cash Flow Theory
Jensen (1986) argues that free cash flows should be paid out to investors in order to
avoid poor use of funds by managers. Managers have an incentive to hoard cash to
increase the amount of assets under their control and to gain discretionary power over
the firm investment decision. Managers of firms with poor investment opportunities
are expected to hold more cash to ensure the availability of funds to invest in growth
projects, even if the Net Present Value of these projects is negative. This would lead
to destruction of shareholder value and, even if the firm has a large investment
programme and a low market-to-book ratio. This is critical in management of liquidity
in the firm and ensuring there is a balance between meeting the current obligation to
mitigate liquidity short fall and investing in the interest of shareholders wealth
maximization.
2.2.5 Liquidity Premium Theory
This theory was advanced by John Maynard Keynes in 1936. He argued that some
investors may prefer to own shorter rather than longer term securities because a
shorter maturity represents greater liquidity. In such case they will be willing to hold
long-term securities only if compensated with a premium for the lower degree of
liquidity. Short-term securities are usually considered to be more liquid because they
are more likely to be converted to cash without a loss in value. Adequate liquidity is
needed to avoid forced sale of asset at unfavorable market conditions and at heavy
Page 23
10
loss (Basel Committee on Banking Supervision, 2008). Adequate liquidity serves as
vehicle for profitable operations especially to sustain confidence of depositors in
meeting short run obligations.
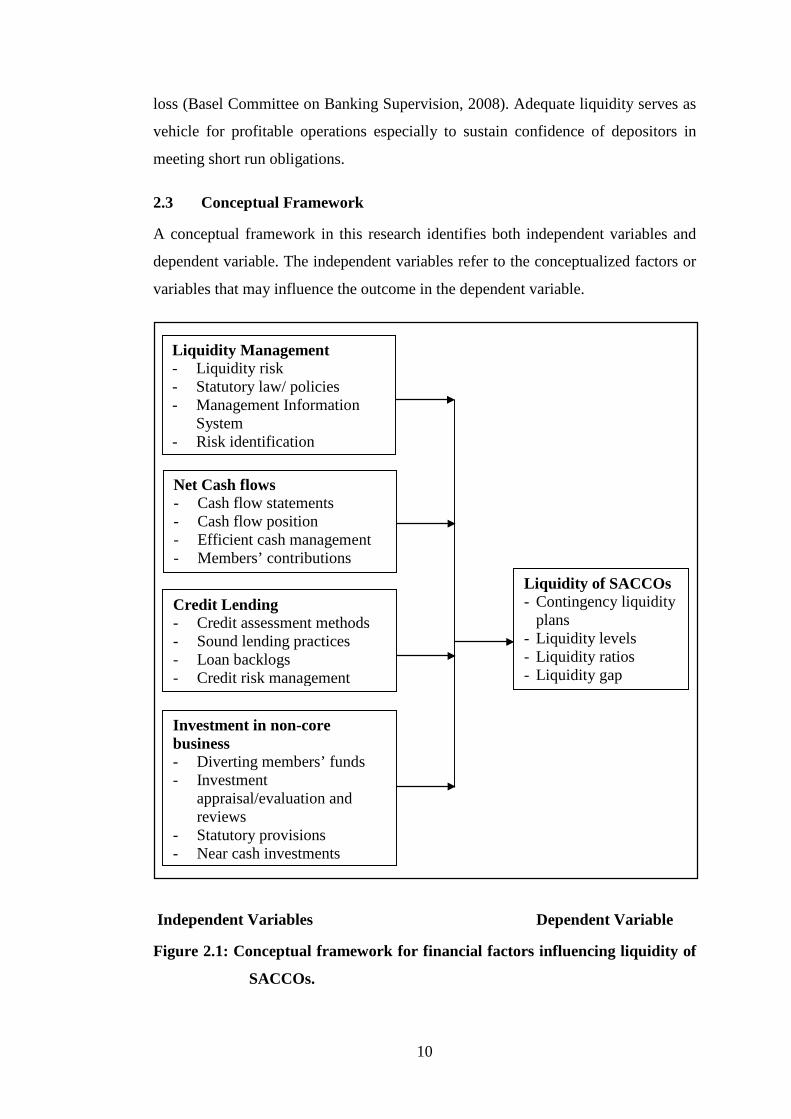
2.3 Conceptual Framework
A conceptual framework in this research identifies both independent variables and
dependent variable. The independent variables refer to the conceptualized factors or
variables that may influence the outcome in the dependent variable.
Independent Variables Dependent Variable
Figure 2.1: Conceptual framework for financial factors influencing liquidity of
SACCOs.
Net Cash flows - Cash flow statements - Cash flow position - Efficient cash management - Members’ contributions
Liquidity Management - Liquidity risk - Statutory law/ policies - Management Information
System - Risk identification
Liquidity of SACCOs - Contingency liquidity
plans - Liquidity levels - Liquidity ratios - Liquidity gap
Investment in non-core business - Diverting members’ funds - Investment
appraisal/evaluation and reviews
- Statutory provisions - Near cash investments
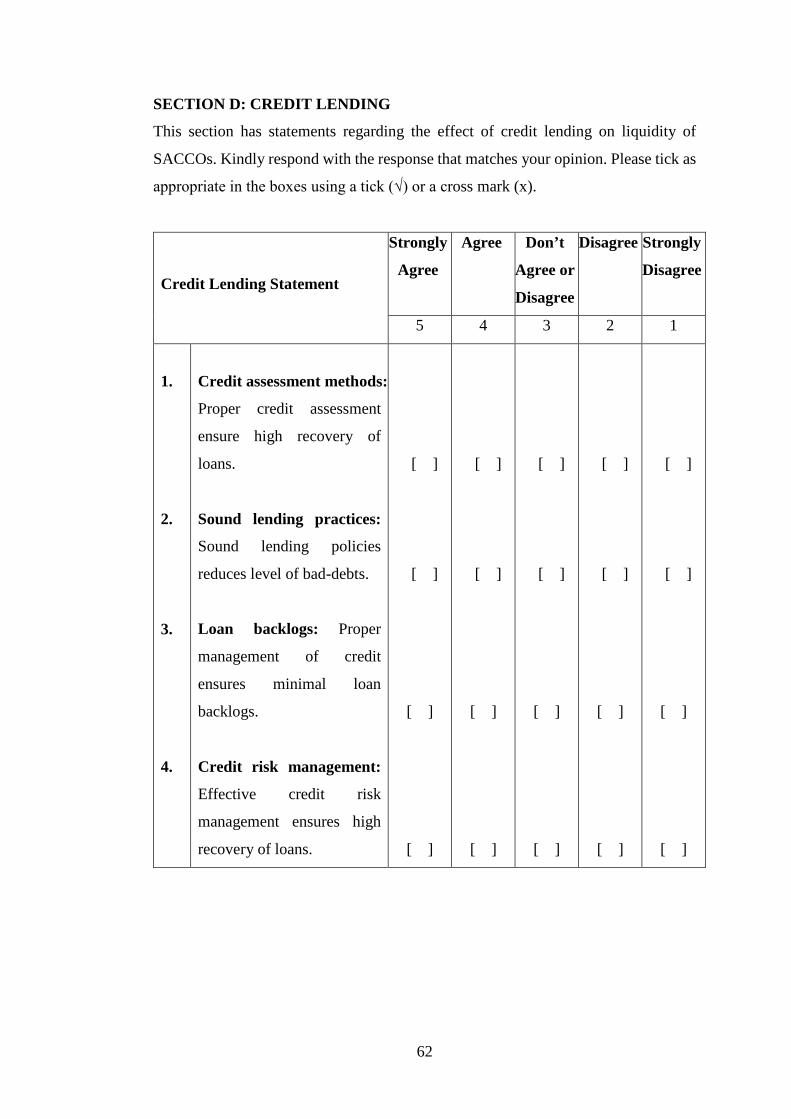
Credit Lending - Credit assessment methods - Sound lending practices - Loan backlogs - Credit risk management
Page 24
11
2.3.1 Liquidity Management
The liquidity management process is effective in identifying, measuring, monitoring
and controlling liquidity risk (Njeri, 2014). Poor liquidity management will expose
financial institution to liquidity risk which will have impact on its performance
(Song’e, 2015). To realize positive financial education outcomes and ensure checks
and balances within the SACCO ranks, it is important that stakeholders get exposed
to key financial education tools that include understanding the dynamics of savings,
budgeting, borrowing, banking operations and dynamics of long term wealth
acquisition and management (Odhiambo, 2013). A SACCO is in a liquid position if it
is able to meet its current obligations as they become due, if demands for funds are
readily met while balancing the need to earn revenue (Sam, 2015).
2.3.2 Net Cash Flows
All the receipts over the period are referred to as cash inflow while all the payments
made are termed as cash outflows (Maina, 2011). On comparing the cash inflows and
cash outflows at period end, the net cash inflow or outflow is determined. In a
SACCO, cash flows in when cash is paid in as share contribution by the employers on
behalf of the employees, loan interest is paid in for the loans issued, interest is paid in
by other financial institutions in which the SACCO may have made deposits, loans
previously issued to members are repaid, the SACCO disposes some of its fixed
assets, when a SACCO gets a loan from a financial institution and when members pay
entrance fees (Maina, 2011). Cash flows out when loans are issued to members,
dividends and interest are paid out to members for their deposits and investments in
the SACCO, loans are repaid to the SACCO creditors like financial institutions,
payments are made when fixed assets are acquired, normal operating expenses like
salaries, rents and rates are paid for by the SACCO (Okundi, 2011).
When the cash inflows are higher than the cash outflow there is a net positive cash
position while if the cash outflows are higher than cash inflows the cash position is
negative (Owino, 2011). When the cash flow is positive, the organization has a healthy
financial position and can be said to be financially stable since it will be able to meet
its cash requirements easily (Ombado, 2010). On the other hand, a negative cash flow
position leads to instability with the SACCO not being able to meet its obligations and
core responsibility of issuing loans to members in good time (Ombado, 2010).
Page 25
12
2.3.3 Credit Lending
Sound lending procedures in financial institutions involve identifying high-risk loan
applicants, modifying lending conditions such as security requirements and
monitoring repayments (Njeru et al., 2015). SACCO managers need to reduce the risk
of loan default because the institutions financial viability is weakened by the loss on
principle and interest, the cost of recovery and the opportunity cost of management
time taken to recover (Njeru et al., 2015). SACCO’s operates under the objective of
maximizing benefits to members which include providing loans to help members
achieve their standards of living goals. The non-performing loans can definitely cause
too much stagnation of the financial sources (Lagat et al., 2013). Effective provision
of credit risk management depends on the lenders assessment of the risk of default of
the loaners. For SACCO’s this is typically based on the borrower’s incomes,
employment and the credit history at the time of loan application (Lagat et al., 2013).
Therefore, it is stressed that collection policies and procedures are measures and
disciplines complementary to the primary loan portfolio granting and management
activities (Kipngetich & Muturi, 2015).
2.3.4 Investment in Non-Core Business
An investment is the outlay of a sum of money in the expectation of a future return
which more than compensates for the original outlay plus a premium to cover
inflation, interest foregone and risk (Kimathi, 2014). High investment in non-earning
investments and inadequate managerial competence contributes to the failure of
SACCOs in Kenya (Kimathi, 2014). Non-profitable investments should be
discouraged because, despite the enormous amount of resources input in such projects,
returns are almost nil, hence reducing the capital base where interest is drawn from
(Mwithiga, 2012). The law clearly prohibits investments that are not related to the
core objective of the SACCO (SACCO Societies Act, 2008). SACCOs should limit
their investment on non-productive assets such as land, buildings, vehicles, furniture
and cash, to a maximum of 5% of the total assets and thereby invest 95% of their
funds into those assets that earn a return greater than the cost of funds and operating
costs [Financial Services Deepening (FSD, 2009)].
Page 26
13
2.3.5 Liquidity of SACCOs
Liquidity level indicates an institution’s ability to fund increase in assets and meet
obligations when they fall due (Kimathi, 2014). Liquidity of the firm is a key
determinant of the firm’s financial performance. Liquidity is the amount of capital
that is available for investment and spending. Most of the capital is credit rather than
cash. This is because the large financial institutions that do most investments prefer
using borrowed money (Muraguri, 2014). At any date, a positive gap between assets
and liabilities is equivalent to a deficit. Liquidity ratios are various balance sheet ratios
which should identify main liquidity trends. These ratios reflect the fact that firm
should be sure that appropriate, low cost funding is available in a short time
(Muraguri, 2014). This might involve holding a portfolio of assets that can be easily
sold cash reserves, minimum required reserves or government securities.
2.4 Empirical Review
A number of studies on liquidity of SACCOs have been done nationally and
internationally. Njeri (2014) carried a study on the effect of liquidity on financial
performance of deposit taking micro finance institutions in Kenya. From the analysis,
it’s evidently that financial performance of the MFIs in Kenya is highly dependent on
the level of institutional liquidity. Muraguri (2014) studied the effect of liquidity on
the return on investment for SACCOs in Nairobi. The study found that liquidity has a
positive impact on the return on investments in the SACCOs while capital adequacy
had a negative influence on the returns. Sam (2015) researched on effect of cash
management practices on the growth of matatu SACCOs in Kimilili Su-county,
Bungoma County. The study concluded that cash management is critical as a liquidity
management tool in matatu SACCO’s. Ogol (2011) conducted a study to find out
liquidity risk management practices in microfinance institutions in Kenya. The
findings of the study indicate that most MFIs have laid down policies to refer to in
identifying liquidity risks and that the MFIs have their core risk policy formulation
done by the risk committee.
Kimathi (2014) carried a study on the effect of financing strategies on the liquidity of
SACCOs licensed by SASRA operating in Nairobi County. The study concludes that
financial strategies positively and significantly influence the liquidity in SACCOS
licensed by SASRA operating in Nairobi County. Song’e (2015) conducted a study
Page 27
14
on the effect of liquidity management on the financial performance of deposit taking
SACCOs in Nairobi County. The findings were that financial performance as
measured by profit before tax over total assets is positively related to Liquidity,
funding liquidity risk, operational efficiency, quick ratio and log of total assets. Omino
(2014) carried out a study on liquidity risk mitigation measures and financial
performance of SACCOs in Kisumu County. The study found that liquidity risk
mitigation approaches adopted by different SACCOs had a significant effect on their
financial performances.
Okundi (2011) carried out a study on the financial challenges facing SACCOs in
Nairobi and concluded that SACCOs suffered challenges in meeting loan requests by
the members partly due to long term investments they engage in. Njeru et al. (2015)
researched on effect of cash management on financial performance of deposit taking
SACCOs in Mount Kenya region. They concluded that cash management is critical
as a liquidity management tool in deposit taking SACCO’s. Hence cash management
policy should be put in place to attain optimal financial performance of deposit taking
SACCOs. Godfrey (2015) carried out a research on liquidity and bank performance
and examined nexus between Net Interest Margin and liquidity on South African
banks. The research concluded that there is an insignificant co-integrating relationship
between Net Interest Margin (NIM) and two measures of liquidity, namely market
liquidity and funding liquidity.
2.5 Summary of Literature Review
Many researchers have come up with a number of theories on the financial factors
influencing liquidity of SACCOs in Kenya. The Commercial Loan Theory of liquidity
reveals that though long-term securities may be liquidated prior to maturity, their
prices are more sensitive to interest rate movements. Short-term securities are usually
considered to be more liquid because they are more likely to be converted to cash
without a loss in value (Crowe, 2009). The Baumol’s model of cash management
theory argues that there is tradeoff between the liquidity provided by holding money
(the ability to carry out transactions) and the interest foregone by holding one’s assets
in the form of non-interest-bearing money. There is therefore need for contingency
funding plan which should be well developed, effective and useful (Maina, 2011).
Page 28
15
The Anticipated Income theory of liquidity holds that liquidity can be ensured if
scheduled loan payments are made on future income of the borrower. The doctrine of
anticipated income embodies the ideas and equates intrinsic soundness of term loans
with appropriate repayment schedules adapted to the anticipated income or cash flow
of the borrower (Crowe, 2009). The free cash flow theory of liquidity argues that free
cash flows should be paid out to investors in order to avoid poor use of funds by
managers. Having cash available to invest, the manager does not need to raise external
funds and to provide capital markets detailed information about the firm’s investment
projects (Huseyin, 2011). The liquidity premium theory asserts that some investors
may prefer to own shorter rather than longer term securities because a shorter maturity
represents greater liquidity. According to the theory, investors will be willing to hold
long-term securities only if compensated with a premium for the lower degree of
liquidity (Kimathi, 2014).
2.6 Research Gaps
From the review of relevant literature, it is evident that research in the area of liquidity
of SACCOs has been done both internationally and locally. Kimathi (2014) studied
the effect of financing strategies on the liquidity of SACCOs licensed by SACCO
Societies Regulatory Authority in Nairobi County. Song’e (2015) studied the effect
of liquidity management on the financial performance of deposit taking SACCOs in
Nairobi County. Njeri (2014) carried a study on the effect of liquidity on financial
performance of deposit taking micro finance institutions in Kenya. Omino (2014)
studied the liquidity risk mitigation measures and financial performance of SACCOs
in Kisumu County. Muraguri (2014) studied the effect of liquidity on the return on
investment for SACCOs in Nairobi. From survey of relevant literature, it was found
that there is no studies specific to Kenya in regard to the assessment of financial
factors that influence liquidity of SACCOs in Kirinyaga County in Kenya. This study
was therefore conducted in order to fill the gaps in literature by studying variables that
affect liquidity of SACCOs in Kirinyaga County.
Page 29
16
CHAPTER THREE
RESEARCH METHODOLOGY
3.1 Introduction
This chapter provides a discussion of the procedures that was employed in this study.
It also covers the research design, target population, sampling technique and sample
size, research instruments, pre-testing, data processing and analysis.
3.2 The Research Design
A cross sectional descriptive survey research design was employed in this study.
Descriptive research is the investigation in which data is collected and analyzed in
order to describe the specific phenomenon in its current trends, current events and
linkages between different factors at the current time. Descriptive research design was
chosen because it enabled the researcher to generalize the findings to a larger
population. It guarantees breadth of information and accurate descriptive analysis of
characteristics of a sample which can be used to make inferences about population
(Mugenda & Mugenda, 2011).
3.3 Target Population
The targeted population in the study was the 60 registered SACCOs in Kirinyaga
County. In this study, the sampling frame consisted of the 60 registered SACCOs in
Kirinyaga County.
3.4 Sampling Technique and Sample Size
The study employed stratified random sampling technique. Kirinyaga County is
administratively divided into four sub-counties and therefore, SACCOs were
categorized into the four sub-counties i.e. Kirinyaga Central, Kirinyaga East,
Kirinyaga South and Kirinyaga West. From each sub-county 30% of the SACCOs
were selected randomly so as to make the sample that was studied. A sample size of
30% was preferred so as to make the sample reasonable, economic and reliable
(Zikmund, Bahin & Graffin, 2010). Purposive sampling technique was used to
identify three management staff from the credit, finance and operations departments
from each of the selected SACCO Society. Purposive sampling helps the researcher
to obtain reliable and accurate information from all the levels of liquidity management
and to avoid bias. Therefore, 3 management staff from each of the 18 SACCOs were
selected for the study giving a sample size of 54 respondents.
Page 30
17
3.5 Data Collection Instruments
The study made use of primary and secondary data. Primary data was collected
through the use of questionnaires. Secondary data was drawn from audited financial
statements.
3.6 Data Collection Procedures
Primary data was collected from the branch managers, finance officers and credit
officers of the selected SACCOs through self-administered questionnaires. Secondary
data was collected by filling in the record survey sheet the statistical data from the
audited financial statements of SACCOs for three years period.
3.7 Pre-testing of Research Tools
To ascertain the validity and reliability of questionnaire, a pre-testing was conducted.
A sample size of 54 respondents was used in this study. The pre-testing constituted
10 percent of the sample size and therefore 6 questionnaires were administered.
3.7.1 Reliability Test
The Cronbach’s alpha coefficient was used for reliability test to measure the degree
to which a research instrument yields consistent results or data after repeated trials.
The threshold cutoff point of 0.7 and above was used. The point is acceptable since it
indicates consistency or reliable measure.
3.7.2 Validity Test
Content validity technique was used in validating the study by specifying the domain
of indicators which are relevant to the concept being measured using professionals or
experts in the particular field.
3.8 Data Processing and Analysis
Data was first subjected through a sequence of operations which includes editing,
coding, classification and analysis using SPSS (Statistical Package for the Social
Scientists). Analysis was done through descriptive statistics tools such as percentages,
mean, standard deviation, mode and variances. Inferential statistics was done by use
of Pearson Product-Moment correlation which was used to measure the strength of
relationships between the study variables where linear function was formulated to help
assess the influence of the independent variables on the dependent variable. Data was
presented using frequency tables, charts and graphs.
Page 31
18
The general form of the multiple regression model is as shown in equation 3.1.
Y = β0 + β1X1 + β2X2 + β3 X3 + β4X4 + ɛ………………………..……...… Equation 3.1
Where; Y is SACCO liquidity, β0 is Constant, X1 is Liquidity management, X2 is Net
cash flows, X3 is Credit lending, X4 is Investment in non-core business, β1, β2, β3, β4 is
Regression coefficients of independent variables and ɛ is the error term.
The F-test was used to evaluate the significance of the results obtained. An F-test is
any statistical test in which the test statistic has an F-distribution under the null
hypothesis. It is most often used when comparing statistical models that have been
fitted to a data set, in order to identify the model that best fits the population from
which the data were sampled (Mugenda & Mugenda, 2011). A test of significance
helped to determine whether the obtained results truly hold at 95% confidence level.
Table 3.1: Statistical Analysis Table
Objective Independent
variable
Dependent
variable
Statistical tools Means of
data
collection
To investigate
the effect of
liquidity
management on
liquidity of
SACCOs
Liquidity
Management
Liquidity of
SACCOs in
Kirinyaga
County
Mean, standard
deviation, mode,
variances and
Pearson product-
Moment
correlation
Questionnai
res and
record
survey sheet
To establish the
effect of net cash
flow on liquidity
of SACCOs
Net Cash
flows
Liquidity of
SACCOs in
Kirinyaga
County
Mean, standard
deviation, mode,
variances and
Pearson product-
Moment
correlation
Questionnai
res and
record
survey sheet
To evaluate the
effect of credit
lending on
liquidity of
SACCOs
Credit
Lending
Liquidity of
SACCOs in
Kirinyaga
County
Mean, standard
deviation, mode,
variances and
Pearson product-
Questionnai
res and
record
survey sheet
Page 32
19
Moment
correlation
To examine the
effect of
investment in
non-core
business on
liquidity of
SACCOs
Investment in
Non-core
business
Liquidity of
SACCOs in
Kirinyaga
County
Mean, standard
deviation, mode,
variances and
Pearson product-
Moment
correlation
Questionnai
res and
record
survey sheet
Page 33
20
CHAPTER FOUR
RESEARCH FINDINGS AND DISCUSSIONS
4.1 Introduction
This chapter presents the results and findings of the study based on the research
objectives. The purpose of this study was to determine the financial factors affecting
liquidity SACCOs in Kirinyaga County, Kenya. The study uses liquidity management,
net cash flows, credit lending and investment in non-core business as independent
variables and liquidity of SACCOs as dependent variable. The chapter presents the
response rate and the demographic information of the respondents. The data has been
analyzed for each of the specific objective by use of descriptive and inferential
statistics.
4.2 Response Rate Out of the 54 questionnaires distributed for this research, 45 of them were filled and
returned giving a response rate of 83 per cent. According to Mugenda and Mugenda
(2003), 50% response rate is adequate, 60% good, above 70% is rated very good. This
implies that the response rate was good, representative and acceptable as it had
surpassed the 70% response rate threshold.
4.3 Pre-testing Results for Research Instruments
The study sought to test the reliability and validity of the research instruments. Table
4.1 shows the findings of the study. From the findings of the study, the reliability
coefficients ranged between 0.736 and 0.886. This implies that all the items were
reliable since they met the threshold value of 0.7 as recommended by Cooper and
Schindler (2011) thus they were reliable.
Table 4.1: Cronbach Alpha for Reliability Assessments
Variables Number of items Cronbach Alpha Values
Liquidity Management 4 0.754 Net Cash flows 4 0.736 Credit Lending 4 0.886 Investment in non-core business 4 0.762
Page 34
21
4.3 Demographic Information
The researcher was interested in the distribution of respondents by their gender, age,
length of service, level of education, department/section in which they work and
position in the SACCOs.
4.3.1 Gender of the Respondents
The study sought to know the gender of the respondents. The sampled respondents
provided information relating to their gender. Table 4.2 shows the gender of the
respondents. The findings of the study revealed that majority of the respondent
(55.6%) were females whereas 44.4% of the respondent were males. This indicates
that more female respondents participated in the study than males. It therefore implies
that leadership of most SACCOS in Kirinyaga County is female dominated. The
findings are in line with those of Luoga (2013) who carried out a study to determine
the factors influencing loan delinquency and non-performance of loan repayment in
traders SACCOs and found that nowadays women are motivated to be employed
rather than becoming just a housewife or employing themselves through businesses.
Table 4.2: Gender of the Respondents
Gender Frequency Percentage
Female 25 55.6
Male 20 44.4
Total 45 100.0
4.3.2 Age of the Respondents
Respondents were classified according to their age category. They were grouped into
four sub-categories namely; 18-26 years, 27-35 years, 36-45 year and those above 44
years. Table 4.3 shows the distribution of respondents based on their age. The study
found that majority of the respondents (40%) were aged 27 to 35 years while those
with 36-43 years accounted for 35.6% of the sampled population. Respondents who
were between 18 and 26 years accounted for 15.6% while very few (8.9%) aged above
44 years of age. The findings implied that most of the employees working with
SACCOs in Kirinyaga County were middle aged. This age group is usually energetic,
very active, is experienced, responsible and has skills (Teeples & Glyers, 2007).
Page 35
22
Table 4.3: Age of the Respondents
Age Categories Frequency Percent
18 to 26 years 7 15.6
27 to 35 years 18 40
36 to 43 years 16 35.6
Above 44 years 4 8.9
Total 45 100.0
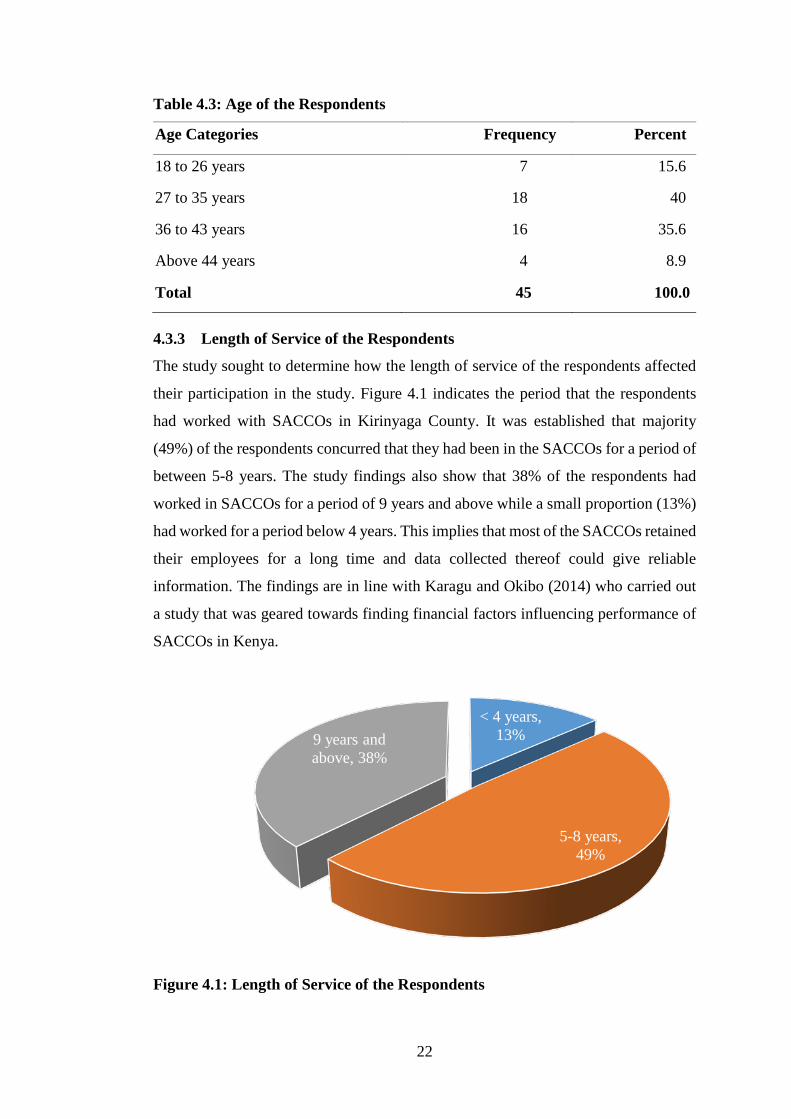
4.3.3 Length of Service of the Respondents
The study sought to determine how the length of service of the respondents affected
their participation in the study. Figure 4.1 indicates the period that the respondents
had worked with SACCOs in Kirinyaga County. It was established that majority
(49%) of the respondents concurred that they had been in the SACCOs for a period of
between 5-8 years. The study findings also show that 38% of the respondents had
worked in SACCOs for a period of 9 years and above while a small proportion (13%)
had worked for a period below 4 years. This implies that most of the SACCOs retained
their employees for a long time and data collected thereof could give reliable
information. The findings are in line with Karagu and Okibo (2014) who carried out
a study that was geared towards finding financial factors influencing performance of
SACCOs in Kenya.
Figure 4.1: Length of Service of the Respondents
< 4 years, 13%
5-8 years, 49%
9 years and above, 38%
Page 36
23
4.3.4 Educational Level of the Respondents
The study examined the distribution of respondents according to their highest
academic qualifications. The level of education of the respondents was categorized
into four sub-groups; O-level, Tertiary, University and Post-graduate as shown in
Table 4.4. The study findings indicated that majority (64.4%) of the respondents
working with SACCOs in Kirinyaga County were bachelor degree holders. In
addition, 17.8% of the respondents had tertiary education while 15.6% held post
graduate degrees or diplomas. A very small (2.2%) proportion of the respondents had
only attained the O-level qualifications. This implies that majority of the respondents
had at least a first degree and could give relevant information on the subject matter.
The findings illustrated that SACCOs employed academically qualified workforce
(Mwithiga, 2012).
Table 4.4: Educational Level of the Respondents
Education Levels Frequency Percent
Post-Graduate 7 15.6
University Degree 29 64.4
Tertiary 8 17.8
O-Level 1 2.2
Total 45 100.0
4.3.5 Position of the Respondents
The study aimed at ascertaining the respondents’ designation with the SACCOs in
Kirinyaga County. The findings are illustrated by Figure 4.2. The designation was
categorized into three main groups that is, the accountant, the manager and the credit
officer. The Manager category (44%) comprised of the chief executive officers, Back
office services and activities (BOSA) managers, front office services and activities
(FOSA) managers, operations managers, finance managers, human resource manager,
and the secretary managers. The Accountant category (38%) comprised of the
accountants, accounts clerk, cashiers, chief cashiers and the savings clerks. The Credit
officer category (18%) comprised of the credit officers, loan officers and the loans
clerks. This implied that most of the study respondents were serving in high profile
Page 37
24
positions. This shows that most of the data was collected from senior managers and
therefore the data collected gave reliable information (Kamonjo, 2014).
Figure 4.2: Position of the Respondents
4.3.6 Department/Section of the Respondents
The study intended to establish the department/Section to which the sampled
respondents work in or were attached. The results were illustrated in Table 4.5. The
study noted that majority (22.2%) of the respondent were attached to the finance and
operations departments. A total of 8 respondents that translated to 17.8% were
attached to the accounts department. Those in administration section were 15.6% of
the sampled population. Only 11.1% and 8.9% were attached to the credit and loans
sections respectively. Very few (2.2%) worked in the human resource department.
This implies that most of the respondents were attached in the finance, operations and
accounts departments and therefore reliable information on liquidity was obtained.
The findings are in line with Tonui (2016) who carried out a study on financial factors
influencing growth of horticultural sector in Nakuru County and found that the
accounts and finance departments are the most central and important in any business
organization.
Accountant38%
Manager44%
Credit Officer18%
Page 38
25
Table 4.5: Department/Section of the Respondents
Department/Section Frequency Percentage
Finance 10 22.2
Operations 10 22.2
Accounts 8 17.8
Administration 7 15.6
Credit 5 11.1
Loans 4 8.9
Human Resource 1 2.2
Total 45 100.0
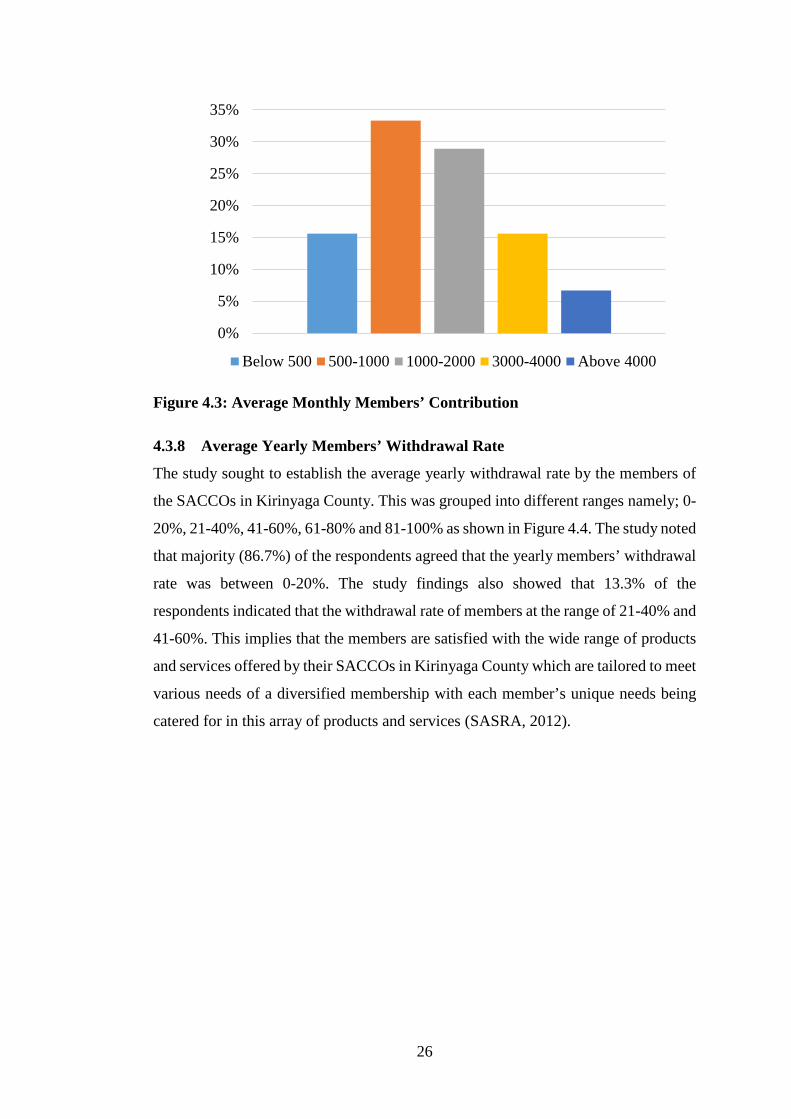
4.3.7 Average Monthly Members’ Contributions
The study sought to ascertain the average monthly members’ contribution to the
SACCO. This is illustrated by Figure 4.3. A majority (33.3%) of the respondents
concurred that average monthly members’ contribution in SACCOs stood at between
Ksh. 500-Ksh. 1,000. The findings also shows that 28.9% of the respondents indicated
that the average monthly contributions by members was between Ksh. 1,000-Ksh.
2,000 while 15.6% of the respondents indicated that the average monthly members’
contribution was below Ksh. 500 and between Ksh. 3,000-Ksh. 4,000. A little number
of respondents (6.7%) indicated that the average monthly contribution by members of
a SACCO was above Ksh. 4,000. The study found out that the monthly contribution
by the members of SACCOs in Kirinyaga County was between Ksh. 500-Ksh. 1,000.
This implies that the SACCO members are able to make their contributions without
straining much. The study findings are in line with Muraguri (2014) who carried out
a study on the effect of liquidity on the return on investments for SACCOs in Nairobi
and found that the services of SACCOs are affordable to its members.
Page 39
26
Figure 4.3: Average Monthly Members’ Contribution
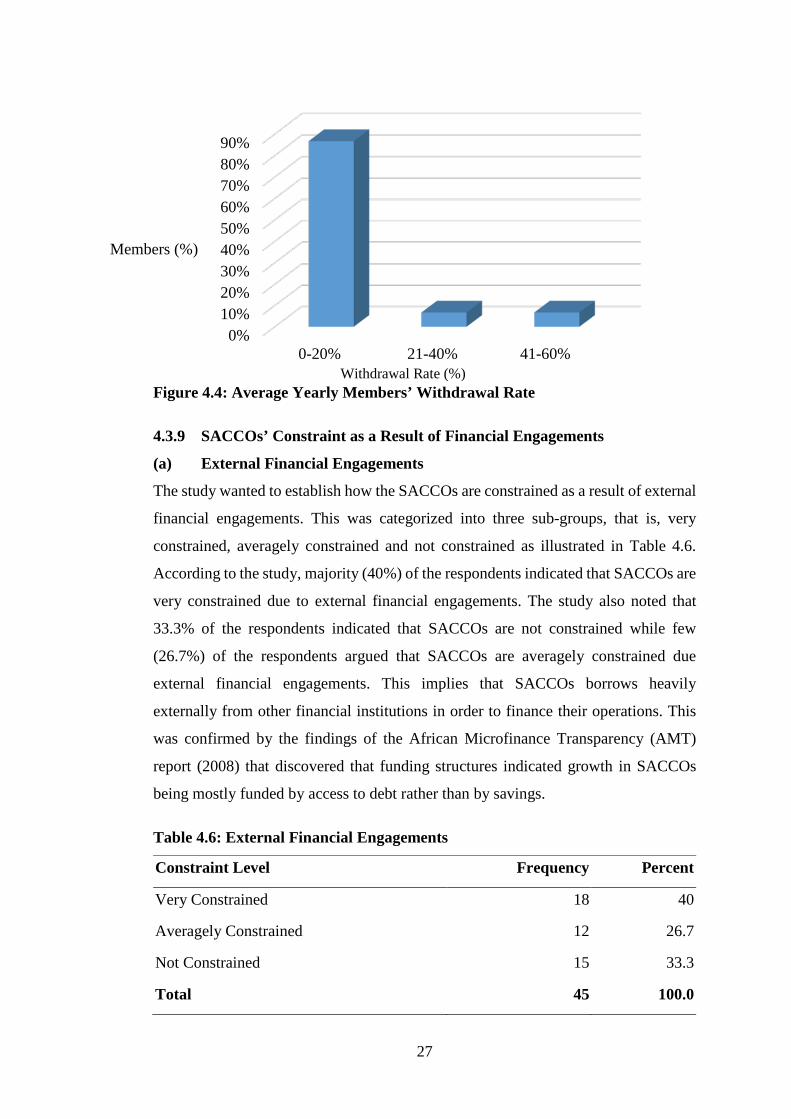
4.3.8 Average Yearly Members’ Withdrawal Rate
The study sought to establish the average yearly withdrawal rate by the members of
the SACCOs in Kirinyaga County. This was grouped into different ranges namely; 0-
20%, 21-40%, 41-60%, 61-80% and 81-100% as shown in Figure 4.4. The study noted
that majority (86.7%) of the respondents agreed that the yearly members’ withdrawal
rate was between 0-20%. The study findings also showed that 13.3% of the
respondents indicated that the withdrawal rate of members at the range of 21-40% and
41-60%. This implies that the members are satisfied with the wide range of products
and services offered by their SACCOs in Kirinyaga County which are tailored to meet
various needs of a diversified membership with each member’s unique needs being
catered for in this array of products and services (SASRA, 2012).
0%
5%
10%
15%
20%
25%
30%
35%
Below 500 500-1000 1000-2000 3000-4000 Above 4000
Page 40
27
Figure 4.4: Average Yearly Members’ Withdrawal Rate
4.3.9 SACCOs’ Constraint as a Result of Financial Engagements
(a) External Financial Engagements
The study wanted to establish how the SACCOs are constrained as a result of external
financial engagements. This was categorized into three sub-groups, that is, very
constrained, averagely constrained and not constrained as illustrated in Table 4.6.
According to the study, majority (40%) of the respondents indicated that SACCOs are
very constrained due to external financial engagements. The study also noted that
33.3% of the respondents indicated that SACCOs are not constrained while few
(26.7%) of the respondents argued that SACCOs are averagely constrained due
external financial engagements. This implies that SACCOs borrows heavily
externally from other financial institutions in order to finance their operations. This
was confirmed by the findings of the African Microfinance Transparency (AMT)
report (2008) that discovered that funding structures indicated growth in SACCOs
being mostly funded by access to debt rather than by savings.
Table 4.6: External Financial Engagements
Constraint Level Frequency Percent
Very Constrained 18 40
Averagely Constrained 12 26.7
Not Constrained 15 33.3
Total 45 100.0
0%10%20%30%40%50%60%70%80%90%
0-20% 21-40% 41-60%
Members (%)
Withdrawal Rate (%)
Page 41
28
(b) Internal Financial Engagements
The study also wanted to establish how the SACCOs are constrained as a result of
internal financial engagements. This was also categorized into three sub-groups, that
is, very constrained, averagely constrained and not constrained. The study findings
indicated that majority (42.2%) of the respondents argued that SACCOs are averagely
constrained as a result of internal financial engagements. The study also noted that
35.6% of the respondents indicated that the SACCOs are very constrained while
22.2% indicated that the SACCOs are not constrained due to internal financial
engagements. This implies that SACCOs had managed to mobilize their internal
resources to finance their operations and therefore averagely constrained. This means
SACCOs had a balanced internal resource mobilization strategy (Song’e, 2015).
Table 4.7: Internal Financial Engagements
Constraint Level Frequency Percent
Very Constrained 16 35.6
Averagely Constrained 19 42.2
Not Constrained 10 22.2
Total 45 100.0
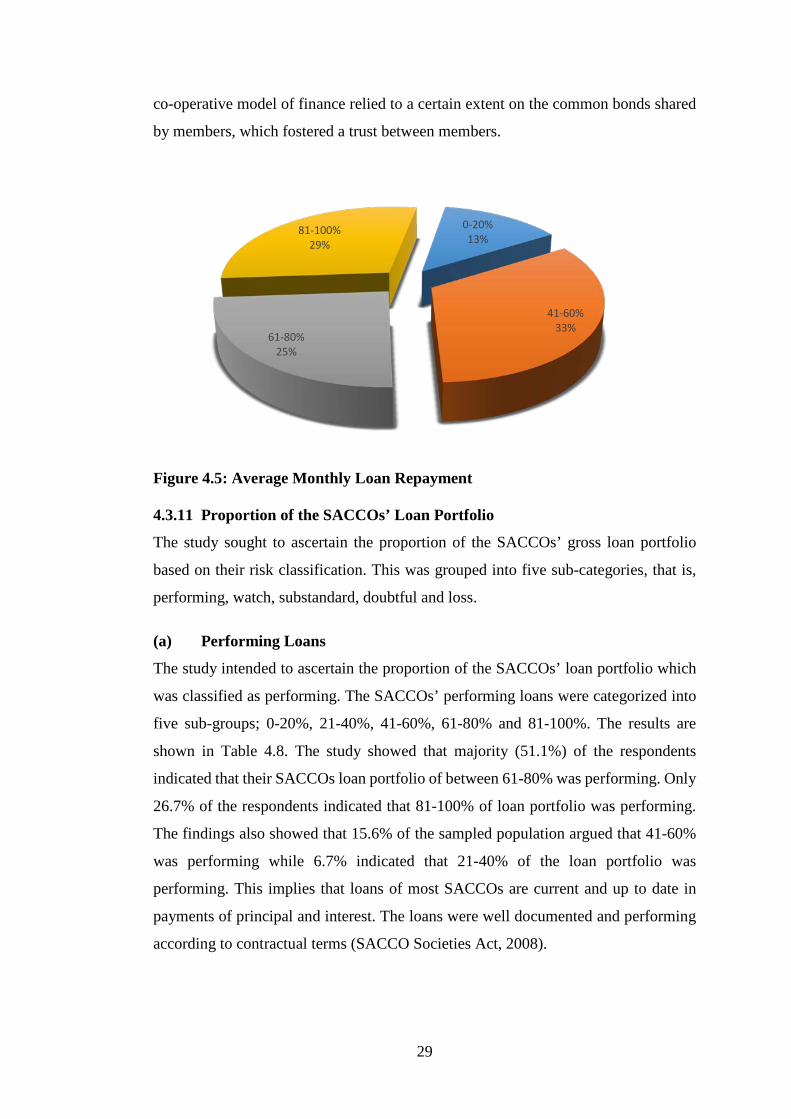
4.3.10 Average Monthly Loan Repayment
The study was conducted to ascertain the average loan repayment by members of
SACCOs. This was grouped into different ranges namely; 0-20%, 21-40%, 41-60%,
61-80% and 81-100%. The results were as illustrated in Figure 4.5. The study found
out that majority (33%) of the respondents concurred that between 41-60% of the total
loan portfolio of the SACCOs was repaid in time as per their schedules. Only 81-
100% of the gross loans are repaid by the loan applicants as per the agreement
according to 29% of the respondents. The study also noted that 25% of the respondent
argued that 61-80% of the SACCO loan are repaid by the borrowers while 13% of the
respondents agreed that 0-20% of the loans are repaid. This implies that SACCO
members paid their loans instalments as scheduled and therefore the cases of loan
delinquencies were very minimal. Allen & Makhumbi (2009) maintained that the loan
evaluation system and ability of members to repay within a specified timeframe had
not always been considered sufficiently in the loan application process and that the
Page 42
29
co-operative model of finance relied to a certain extent on the common bonds shared
by members, which fostered a trust between members.
Figure 4.5: Average Monthly Loan Repayment
4.3.11 Proportion of the SACCOs’ Loan Portfolio
The study sought to ascertain the proportion of the SACCOs’ gross loan portfolio
based on their risk classification. This was grouped into five sub-categories, that is,
performing, watch, substandard, doubtful and loss.
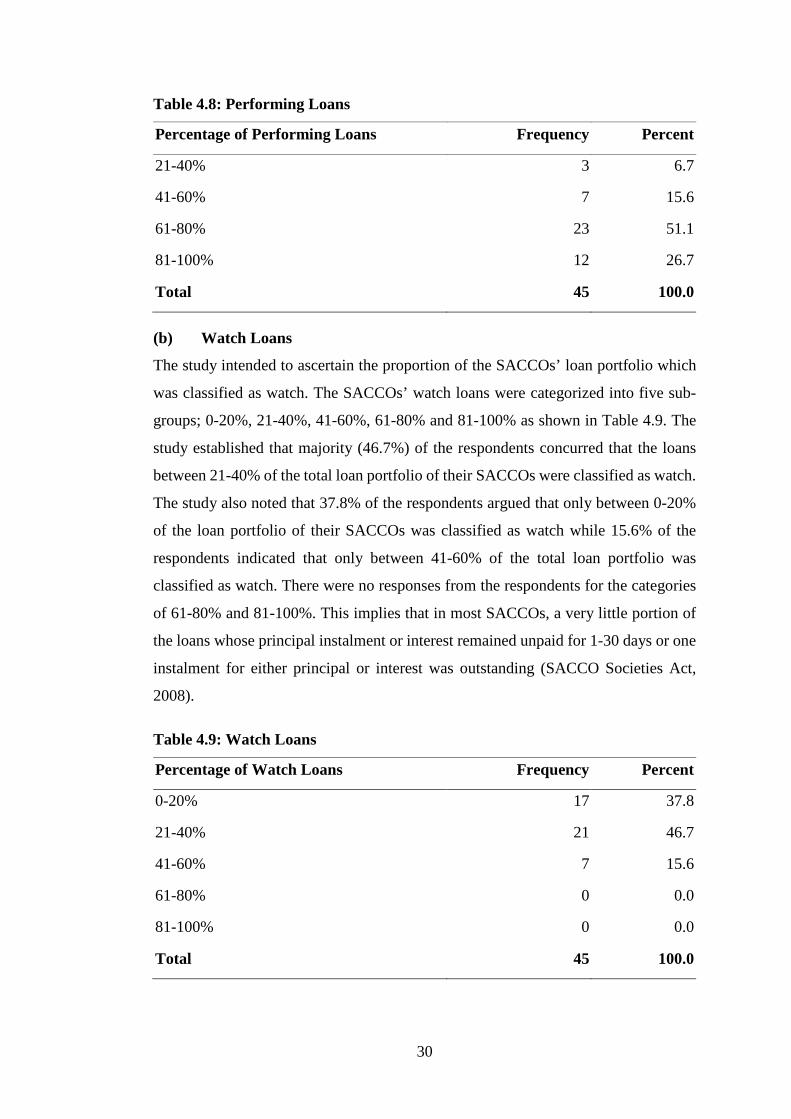
(a) Performing Loans
The study intended to ascertain the proportion of the SACCOs’ loan portfolio which
was classified as performing. The SACCOs’ performing loans were categorized into
five sub-groups; 0-20%, 21-40%, 41-60%, 61-80% and 81-100%. The results are
shown in Table 4.8. The study showed that majority (51.1%) of the respondents
indicated that their SACCOs loan portfolio of between 61-80% was performing. Only
26.7% of the respondents indicated that 81-100% of loan portfolio was performing.
The findings also showed that 15.6% of the sampled population argued that 41-60%
was performing while 6.7% indicated that 21-40% of the loan portfolio was
performing. This implies that loans of most SACCOs are current and up to date in
payments of principal and interest. The loans were well documented and performing
according to contractual terms (SACCO Societies Act, 2008).
0-20%13%
41-60%33%
61-80%25%
81-100%29%
Page 43
30
Table 4.8: Performing Loans
Percentage of Performing Loans Frequency Percent
21-40% 3 6.7
41-60% 7 15.6
61-80% 23 51.1
81-100% 12 26.7
Total 45 100.0
(b) Watch Loans
The study intended to ascertain the proportion of the SACCOs’ loan portfolio which
was classified as watch. The SACCOs’ watch loans were categorized into five sub-
groups; 0-20%, 21-40%, 41-60%, 61-80% and 81-100% as shown in Table 4.9. The
study established that majority (46.7%) of the respondents concurred that the loans
between 21-40% of the total loan portfolio of their SACCOs were classified as watch.
The study also noted that 37.8% of the respondents argued that only between 0-20%
of the loan portfolio of their SACCOs was classified as watch while 15.6% of the
respondents indicated that only between 41-60% of the total loan portfolio was
classified as watch. There were no responses from the respondents for the categories
of 61-80% and 81-100%. This implies that in most SACCOs, a very little portion of
the loans whose principal instalment or interest remained unpaid for 1-30 days or one
instalment for either principal or interest was outstanding (SACCO Societies Act,
2008).
Table 4.9: Watch Loans
Percentage of Watch Loans Frequency Percent
0-20% 17 37.8
21-40% 21 46.7
41-60% 7 15.6
61-80% 0 0.0
81-100% 0 0.0
Total 45 100.0
Page 44
31
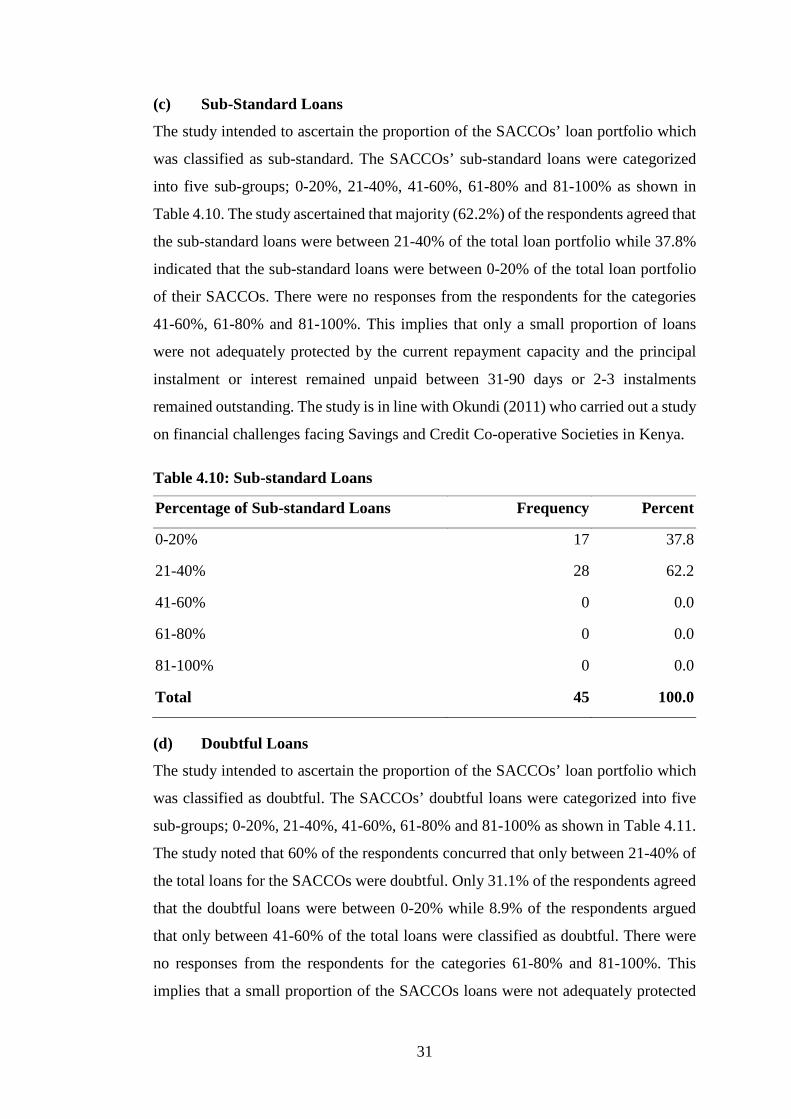
(c) Sub-Standard Loans
The study intended to ascertain the proportion of the SACCOs’ loan portfolio which
was classified as sub-standard. The SACCOs’ sub-standard loans were categorized
into five sub-groups; 0-20%, 21-40%, 41-60%, 61-80% and 81-100% as shown in
Table 4.10. The study ascertained that majority (62.2%) of the respondents agreed that
the sub-standard loans were between 21-40% of the total loan portfolio while 37.8%
indicated that the sub-standard loans were between 0-20% of the total loan portfolio
of their SACCOs. There were no responses from the respondents for the categories
41-60%, 61-80% and 81-100%. This implies that only a small proportion of loans
were not adequately protected by the current repayment capacity and the principal
instalment or interest remained unpaid between 31-90 days or 2-3 instalments
remained outstanding. The study is in line with Okundi (2011) who carried out a study
on financial challenges facing Savings and Credit Co-operative Societies in Kenya.
Table 4.10: Sub-standard Loans
Percentage of Sub-standard Loans Frequency Percent
0-20% 17 37.8
21-40% 28 62.2
41-60% 0 0.0
61-80% 0 0.0
81-100% 0 0.0
Total 45 100.0
(d) Doubtful Loans
The study intended to ascertain the proportion of the SACCOs’ loan portfolio which
was classified as doubtful. The SACCOs’ doubtful loans were categorized into five
sub-groups; 0-20%, 21-40%, 41-60%, 61-80% and 81-100% as shown in Table 4.11.
The study noted that 60% of the respondents concurred that only between 21-40% of
the total loans for the SACCOs were doubtful. Only 31.1% of the respondents agreed
that the doubtful loans were between 0-20% while 8.9% of the respondents argued
that only between 41-60% of the total loans were classified as doubtful. There were
no responses from the respondents for the categories 61-80% and 81-100%. This
implies that a small proportion of the SACCOs loans were not adequately protected
Page 45
32
by the current repayment capacity and the principal instalment or interest remained
unpaid between 91-180 days or 4-6 instalments remained outstanding. Njiru (2006)
carried a study on a list of non-performing loans including all relevant details and
found that loan delinquency arises when there are no strategies for loan recoveries and
security collaterals.
Table 4.11: Doubtful Loans
Percentage of Doubtful Loans Frequency Percent
0-20% 14 31.1
21-40% 27 60
41-60% 4 8.9
61-80% 0 0.0
81-100% 0 0.0
Total 45 100.0
(e) Loans Loss
The study intended to ascertain the proportion of the SACCOs’ loan portfolio which
was classified as loss. The SACCOs’ loss loans were categorized into five sub-groups;
0-20%, 21-40%, 41-60%, 61-80% and 81-100% as shown in Table 4.12. The study
ascertained that majority (46.7%) of the respondents indicated that a small proportion
(0-20%) of the loans portfolio were loss. The same number (46.7%) of respondents
also concurred that a proportion of 21-40% of the total loans was classified as loss. A
few (6.7%) respondents argued that the only 41-60% of the loans were classified as
loss. There were no responses from the respondents for the categories 61-80% and 81-
100%. This implies that only a small proportion of the loans which were considered
uncollectible or of such little value that their continuous recognition as receivable
assets was not warranted, not adequately protected and had remained unpaid for more
than 180 days or 6 instalments had remained outstanding. Gisemba (2010) researched
on the relationship between risk management practices and financial performance of
SACCOs and found out that the SACCOs adopted various approaches in screening
and analyzing risk before awarding credit to client to minimize loan loss.
Page 46
33
Table 4.12: Loans Loss
Percentage of Loans Loss Frequency Percent
0-20% 21 46.7
21-40% 21 46.7
41-60% 3 6.7
61-80% 0 0.0
81-100% 0 0.0
Total 45 100.0
4.3.12 SACCOs’ New Investments
The study wanted to establish the extent to which SACCOs undertook new
investments using the members’ funds. The results of the findings are shown in Table
4.13. From the study, it was noted that 31.1% of the respondents agreed that the extent
to which SACCOs undertook new investments was moderate. Only 28.9% of the
respondents revealed that SACCOs undertook new investments to a high extent. A
few (26.7%) respondents indicated that their SACCOs undertook new investments to
a low extent while 13.3% argued that SACCOs undertook new investments to a very
high extent. This implies that SACCOs were not using more members’ funds to
undertake new investments. It was found that members’ funds were used moderately
to undertake new investments and therefore more funds were used to meet their core
objectives (SACCO Societies Act, 2008).
Table 4.13: SACCOs’ New Investments
Extent of New Investments Frequency Percent
Very High 6 13.3
High 13 28.9
Moderate 14 31.1
Low 12 26.7
Total 45 100.0
4.3.13 Proportion of the SACCOs’ Total Assets
The study intended to establish the proportion of the specific assets that were owned
by SACCOs. The assets that were included in the study were land and buildings, listed
Page 47
34
company shares, treasury bills, treasury bonds, off-shore investments and cash and
cash equivalents.
(a) Land and Buildings
The study sought to ascertain the proportion of land and buildings from the total assets
held by the SACCOs. The results are illustrated in Table 4.14. The proportion of land
and buildings was categorized into five sub-groups; 0-20%, 21-40%, 41-60%, 61-80%
and 81-100%. From the study, it was noted that majority (51.1%) of the respondents
concurred that land and buildings actually took a very small (0-20%) proportion of
the total SACCOs assets while only 28.9% of the respondents argued that land and
buildings only account for between 41-60% of the total assets owned by the SACCOs.
A few (13.3%) responded that the proportion of the land and buildings was only 61-
80% while 6.7% of the respondents argued that the proportion of the land and
buildings only accounted for 21-40% of the total assets. There was no response from
the respondents for the category 81-100%. This implies that SACCOs do not tie the
members’ funds by investing in non-interest earning assets like the land and buildings
which requires huge investments. SACCOs therefore have not invested in land and
buildings and hence are not tying their capital (Maina, 2008).
Table 4.14: Land and Buildings
Percentage of Land and Buildings Frequency Percent
0-20% 23 51.1
21-40% 3 6.7
41-60% 13 28.9
61-80% 6 13.3
81-100% 0 0.0
Total 45 100.0
(b) Listed Company Shares
The study also wanted to ascertain the proportion of limited company shares from the
list of all assets held and owned by the SACCOs. The proportion of listed company
shares was categorized into five sub-groups; 0-20%, 21-40%, 41-60%, 61-80% and
81-100% as shown in Table 4.15. The study findings revealed that the majority
(71.1%) of the respondents concurred that only a very small proportion (0-20%) of
Page 48
35
the total assets were held in form of shares from listed companies. Few (28.9%) of the
respondents indicated that a proportion of between 21-40% were held in form of listed
company shares. There were no responses from the respondents for the categories 41-
60%, 61-80% and 81-100%. This implies that SACCOs do not invest their capital in
financial assets like listed company shares which can be turned into cash within a
short time (Maina, 2008).
Table 4.15: Listed Company Shares
Percentage of Listed Company Shares Frequency Percent
0-20% 32 71.1
21-40% 13 28.9
41-60% 0 0.0
61-80% 0 0.0
81-100% 0 0.0
Total 45 100.0
(c) Treasury Bills
The study also wanted to establish the proportion of the treasury bills held by the
SACCOs from the total assets. The proportion of treasury bills was categorized into
five sub-groups; 0-20%, 21-40%, 41-60%, 61-80% and 81-100%. The results
pertinent to this was analyzed in Table 4.16. The study found out that majority
(66.7%) of the respondents agreed that SACCOs invested very little (0-20%) in form
of treasury bills while 33.3% of the respondents indicated that treasury bills accounted
for a proportion of between 21-40% of the total SACCOs assets. There were no
responses from the respondents for the categories 41-60%, 61-80% and 81-100%.
This implies that SACCOs do not invest heavily in financial assets like the treasury
bills. Investment in treasury bills do not affect the cash flow position but only serves
as a prudent way of cash management since it can be converted into cash within a
short period of time. This was in line with Sam (2015) who carried out a study on the
effect of cash management practices on the growth of Matatu SACCOs in Kimilili
Sub-county, Bungoma County and found that SACCOs mostly invest in convertible
securities in the short term.
Page 49
36
Table 4.16: Treasury Bills
Percentage of Treasury Bills Frequency Percent
0-20% 30 66.7
21-40% 15 33.3
41-60% 0 0.0
61-80% 0 0.0
81-100% 0 0.0
Total 45 100.0
(d) Treasury Bonds
The study also wanted to establish the proportion of the treasury bonds from the total
assets owned by the SACCOs. The proportion of treasury bonds was categorized into
five sub-groups; 0-20%, 21-40%, 41-60%, 61-80% and 81-100% as shown in Table
4.17. The study findings were that a majority (73.3%) of the total respondents agreed
that only a small (0-20%) proportion of the total assets were owned in form of treasury
bonds. Only 26.7% of the respondents argued that the investments in treasury bonds
by the SACCOs only accounted for a proportion of between 21-40%. There were no
responses from the respondents for the categories 41-60%, 61-80% and 81-100%.
This implies that SACCOs uses very little members’ funds to make financial
investments in form of treasury bonds which are easily convertible into cash. The
study was also in line with Sam (2015) who carried out a study on the effect of cash
management practices on the growth of Matatu SACCOs in Kimilili Sub-county,
Bungoma County and found that SACCOs mostly invest in convertible securities in
the short term.
Table 4.17: Treasury Bonds
Percentage of Treasury Bonds Frequency Percent
0-20% 33 73.3
21-40% 12 26.7
41-60% 0 0.0
61-80% 0 0.0
81-100% 0 0.0
Total 45 100.0
Page 50
37
(e) Off-shore Investments
The study intended to establish the proportion of assets held by SACCOs in form of
off-shore investments. Table 4.18 shows the proportion of the off-shore investment.
The proportion of the off-shore investments was categorized into five sub-groups; 0-
20%, 21-40%, 41-60%, 61-80% and 81-100%. From the study, it was noted that
majority (73.3%) of the respondents agreed that off-shore investments accounted for
only 0-20% of the total assets. A few (13.3%) of the respondents were indifferent that
the proportion of offshore investments was between 21-40% and 41-60% of the total
assets. There were no responses from the respondents for the categories 61-80% and
81-100%. This implies that SACCOs do not use the members’ funds to make
investments from abroad and therefore the only available funds were used to meet
their objectives of loaning to their members. The study is in line with Mwithiga (2012)
who carried a study on strategic responses adopted by SACCOs to the changing
operation environment in the Kenyan financial sector and found that SACCOs’ funds
are invested prudentially to maximize their wealth.
Table 4.18: Off-Shore Investments
Percentage of Off-Shore Investments Frequency Percent
0-20% 33 73.3
21-40% 6 13.3
41-60% 6 13.3
61-80% 0 0.0
81-100% 0 0.0
Total 45 100.0
(f) Cash and Cash Equivalents
The study also intended to establish the proportion of the cash and cash equivalents
that was held by the SACCOs out of their total assets. The proportion of the cash and
cash equivalents was categorized into five sub-groups; 0-20%, 21-40%, 41-60%, 61-
80% and 81-100% as shown in Table 4.19. The study found out that 33.3% of
respondents concurred that the proportion of the cash and cash equivalents out of the
total assets stood at 41-60%. Only 31.1% agreed that the proportion of cash and cash
equivalents stood at between 21-40% of the total assets while 22.2% of the
Page 51
38
respondents argued that the cash and cash equivalents accounted for 61-80% of the
total assets. Only 13.3% gave their views that the cash and cash equivalents only
accounted for 0-20% of the total assets. There was no response from the respondents
for the category 81-100%. This implies that SACCOs maintained cash balances in
order to be liquid. They complied with the law that required them to maintain a
liquidity level of at least 15% (SACCO Societies Act).
Table 4.19: Cash and Cash Equivalents
Percentage of Cash and Cash Equivalents Frequency Percent
0-20% 6 13.3
21-40% 14 31.1
41-60% 15 33.3
61-80% 10 22.2
81-100% 0 0.0
Total 45 100.0
4.4 Descriptive Statistics
The study requested respondents to give opinions in regard to liquidity management,
net cash flows, credit lending, investment in non-core business and SACCOs’
liquidity. The responses were on a scale of five points where 5, 4, 3, 2, and 1
represented strongly agree, agree, don’t agree or disagree, disagree, and strongly
disagree respectively. Their responses were assessed and analyzed. In this section, the
findings in respect to the aforementioned are presented. The findings are presented in
form of means and standard deviations.
4.4.1 Liquidity Management and Liquidity of SACCOs
The study assessed the views of the respondents concerning liquidity management
and liquidity of SACCOs. The pertinent findings of the study are illustrated in Table
4.20. The study noted that respondents agreed (Mean = 4.93; Std Dev = 0.252) that
proper liquidity management is vital to SACCO solvency. They also argued (Mean =
4.40; Std Dev = 0.618) that automation of SACCOs’ operations has enhanced proper
liquidity management. In addition, the respondents also concurred (Mean = 4.16; Std
Dev = 1.043) that the statutory laws and provisions do affect SACCO’s liquidity.
Respondents disagreed (Mean = 2.88; Std Dev = 1.031) that proper identification of
Page 52
39
risk ensures optimal liquidity is maintained. It therefore implies that SACCOs in
Kirinyaga County uses proper liquidity management practices so as to remain liquid.
It was also noted that the SACCOs had automated their operations and have adhered
with the provisions of law. Liquidity risk management practices are important to the
day to day operations of an entity (Ogol, 2011).
Table 4.20: Descriptive Statistics for Liquidity Management
Liquidity Management Statements N Min Max Mean Std. Dev
1. Liquidity Risk: Proper liquidity management is
vital to SACCO solvency
45 4 5 4.93 0.252
2. Management Information System: Automation of
SACCO operations has enhanced proper liquidity
management
45 3 5 4.40 0.618
3. Statutory Laws/Policies: Statutory laws & policies
affects SACCO’s liquidity
45 1 5 4.16 1.043
4. Risk Identification: Proper identification of risk
ensures optimal liquidity is maintained.
45 1 5 2.88 1.031
4.4.2 Net Cash Flows and Liquidity of SACCOs
The opinions of the respondents in relation to net cash flows and liquidity of SACCOs
in Kirinyaga County are outlined in Table 4.21. The findings illustrated that
respondents admitted (Mean = 4.91; Std Dev = 0.288) that cash flow statements guides
SACCO management in maintaining optimal liquidity. In addition, the respondents
were in agreement (Mean =4.53; Std Dev = 0.588) that efficient cash management
improves the liquidity position of the SACCO. The respondents also agreed that
(Mean = 4.42; Std Dev = 0.621) cash flow position helps in determining the financial
soundness of the SACCO. Respondents agreed (Mean = 4.33; Std Dev = 0.603) that
members’ contributions enhances the liquidity of SACCOs. This implies that it is
always important for a SACCO to include the statement of cash flows in its financial
statements since it guides its management in maintaining an optimal liquidity. It is
noted that efficient cash management improves the liquidity of SACCOs. Cash flow
position helps in determining the financial soundness of the SACCOs while members’
contributions enhances the liquidity of SACCOs. Abioro (2013) studied cash
management on the performance of manufacturing companies in Nigeria and found
Page 53
40
out that the concept of efficient cash management and effective cash flow
management procedures will lead to success of a business.
Table 4.21: Descriptive Statistics for Net Cash Flows
Net Cash Flows Statements N Min Max Mean Std. Dev
1. Statement of Cash Flows: Cash flow statements
guides management in maintaining optimal liquidity
45 4 5 4.91 0.288
2. Efficient Cash Management: Efficient cash
management improves the liquidity position of the
SACCO
45 3 5 4.53 0.588
3. Cash flow Position: Cash flow position helps in
determining the financial soundness of the SACCO.
45 3 5 4.42 0.621
4. Members’ Contribution: Members’ contributions
enhances the liquidity of the SACCO.
45 3 5 4.33 0.603
4.4.3 Credit Lending and Liquidity of SACCOs
The study further sought the opinions of the respondents in respect to credit lending
in the SACCOs they worked with in Kirinyaga County. The findings are shown in
Table 4.22. The study revealed that the respondents agreed (Mean = 4.60; Std Dev =
0.720) that proper credit assessment ensure high recovery of loans. The respondents
also agreed (Mean = 4.56; Std Dev = 0.503) that effective credit risk management
ensures high recovery of loans. In addition, respondents also strongly agreed (Mean
= 4.47; Std dev = 0.625) that sound lending practices reduces level of bad-debts.
Respondents agreed (Mean = 4.29; Std Dev = 0.458) that proper management of credit
ensures minimal loan backlogs. This implies that proper credit assessment methods
ensures high recovery of loans by employing effective credit risk management. It was
also noted that sound lending practices reduces level of bad debts and that proper
management of credit ensures minimal loan backlog. Lack of credit analysis, credit
follow-ups as well as hostile lending are the key factors that contribute to poor
performance in loan lending by SACCO Societies in Kenya (Mwaura, 2005).
Page 54
41
Table 4.22: Descriptive Statistics for Credit Lending
Credit Lending Statements N Min Max Mean Std. Dev
1. Credit Assessment Methods: Proper credit
assessment ensure high recovery of loans
45 3 5 4.60 0.720
2. Credit Risk Management: Effective credit risk
management ensures high recovery of loans
45 4 5 4.56 0.503
3. Sound Lending Practices: Sound lending practices
reduces level of bad-debts
45 3 5 4.47 0.625
4. Loan Backlogs: Proper management of credit
ensures minimal loan backlogs
45 4 5 4.29 0.458
4.4.4 Investment in Non-Core Business and Liquidity of SACCOs
The study further sought to determine the extent to which the respondents agreed or
disagreed with the statements provided in respect to investment in non-core business
in the SACCOs. The pertinent results are shown in Table 4.23. It was noted that
respondents agreed (Mean = 4.51; Std Dev = 0.589) that evaluations, appraisals &
reviews of investment projects ensures maximum return to the members of a SACCO.
Respondents also agreed (Mean = 4.49; Std Dev = 0.506) that near cash investments
enables SACCOs to maintain liquidity position. Respondents were also in agreement
(Mean = 4.36; Std Dev = 0.613) that adhering to statutory provisions ensures optimal
liquidity is maintained. The respondents concurred (Mean = 4.31; Std Dev = 0.874)
that diverting members’ funds greatly affect SACCO liquidity. It therefore implies
that investments projects appraisals are important since they ensure maximum returns
to the members who are the providers of capital. Management of investments in both
short term and long term financial and non-financial assets is important since it
directly contributes to the maximization of a business’s profitability, liquidity and
total performance (Njeru et al., 2015).
Page 55
42
Table 4.23: Descriptive Statistics for Investment in Non-Core Business
Investment in Non-Core Business Statements N Min Max Mean Std. Dev
1. Evaluations, Appraisals & Reviews of Investment
projects: Proper investment appraisal ensures
maximum return
45 3 5 4.51 0.589
2. Near Cash Investments: Near cash investments
enables SACCOs to maintain liquidity position
45 4 5 4.49 0.506
3. Statutory Provisions: Adhering to statutory
provisions ensures optimal liquidity is maintained
45 3 5 4.36 0.613
4. Diverting Members’ Funds: Diverting members’
funds greatly affect SACCO liquidity
45 3 5 4.31 0.874
4.4.5 Liquidity of SACCOs
Lastly, the respondents were asked to indicate their level of agreement or
disagreement regarding propositions floated to them regarding the liquidity of
SACCOs. Table 4.24 illustrates the findings. Respondents concurred (Mean = 4.40;
Std Dev = 0.618) that proper liquidity contingency plans enable SACCO to uphold
liquidity position. In addition, it was also agreed (Mean = 4.40; Std Dev = 0.495) that
adhering to liquidity level ensure optimal liquidity is maintained. The respondents
were also in agreement (Mean = 4.22; Std Dev = 0.560) that liquidity gap helps in
maintaining SACCO liquidity level. It was agreed (Mean = 4.20; Std Dev = 0.405)
that liquidity ratios help in tracking the SACCO liquidity position. This implies that
SACCOs hold and maintain minimum liquidity, develop and implement contingency
liquidity plans so as to effectively serve their members. Satisfaction and meeting
member’s needs has been in forefront for every financial institution including
SACCOs and hence the necessity of optimal liquidity to these institutions (Song’e,
2015).
Page 56
43
Table 4.24: Descriptive Statistics for Liquidity of SACCOs
Liquidity Statements N Min Max Mean Std. Dev
1. Contingency Liquidity Plans: Proper liquidity
contingency plans enable SACCO to uphold
liquidity position
45 3 5 4.40 0.618
2. Liquidity Level: Adhering to liquidity level ensure
optimal liquidity is maintained
45 4 5 4.40 0.495
3. Liquidity Gap: A liquidity gap helps in maintaining
SACCO liquidity level
45 3 5 4.22 0.560
4. Liquidity Ratios: Liquidity ratios help in tracking
the SACCO liquidity position
45 4 5 4.20 0.405
4.5 Inferential Findings
This section puts into perspective the relationship between the independent variables
and the dependent variable. The study established the relationship between liquidity
management, net cash flows, credit lending, investment in non-core business and,
liquidity of the SACCOs. Therefore, the section outlines the results of both correlation
and multiple regression analysis.
4.5.1 Relationship between Liquidity Management and Liquidity of SACCOs
The relationship between liquidity management and liquidity of SACCOs was
determined. Table 4.25 shows the results of correlation analysis. From the study, it
was noted that there was a moderate statistically significant correlation between
liquidity management and liquidity of SACCOs (r = 0.546; p < 0.05). This means that
increased liquidity management significantly relate to increased liquidity of SACCOs.
Therefore, SACCOs in Kirinyaga County were liquid hence able to honour short-term
and long-term obligations and furthermore fund the ongoing operations. The findings
are in line with the Basel Committee on Banking Supervision report (2008) on
principles for sound liquidity risk management and supervision.
Page 57
44
Table 4.25: Correlation between Liquidity Management and Liquidity of
SACCOs
Liquidity of SACCOs
Liquidity
Management
Pearson Correlation .546**
Sig. (2-tailed) .000
N 45
**. Correlation is significant at the 0.05 level (2-tailed).
4.5.2 Relationship between Net Cash Flows and Liquidity of SACCOs
The relationship between the net cash flows and liquidity of SACCOs was determined.
Table 4.26 shows the results of correlation analysis. The study findings noted that
there was a positive and statistically significant relationship between net cash flows
and liquidity of SACCOs (r = 0.434; p < 0.05). This means that changes in net cash
flows correlate with changes in liquidity of SACCOs. This implies that there is need
for careful planning and monitoring of cash flows over time so as to determine the
optimal cash to hold (Njeru et al., 2015).
Table 4.26: Correlation between Net Cash Flows and Liquidity of SACCOs
Liquidity of SACCOs
Net Cash
Flows
Pearson Correlation .434**
Sig. (2-tailed) .003
N 45
**. Correlation is significant at the 0.05 level (2-tailed).
4.5.3 Relationship between Credit Lending and Liquidity of SACCOs
The study examined the relationship between credit lending and liquidity among
SACCOs in Kirinyaga County. The results of correlation analysis are shown in Table
4.27. The findings indicated that credit lending and liquidity of SACCOs had positive
and statistically significant relationship (r = 0.449; p < 0.05). This means that
increases or decreases in credit lending significantly relate to increases or decreases
in liquidity of SACCOs. This implies that a SACCO’s sustainability and financial
viability depends on sound lending procedures and effective credit risk management
practices (Lagat et al., 2013).
Page 58
45
Table 4.27: Correlation between Credit Lending and Liquidity of SACCOs
Liquidity of SACCOs
Credit Lending Pearson Correlation .449**
Sig. (2-tailed) .002
N 45
**. Correlation is significant at the 0.05 level (2-tailed).
4.5.4 Relationship between Investment in Non-Core Business and Liquidity of
SACCOs
The study determined how investment in non-core business is correlated to the
liquidity of SACCOs. Table 4.28 displays the results. The study established that there
existed a positive, moderately weak but statistically significant (r = 0.323; p < 0.05)
correlation between investment in non-core business and liquidity of SACCOs.
Investment in non-core business significantly and moderately affected liquidity of
SACCOs. The findings are in line with Okundi (2011) carried out a study on the
financial challenges facing SACCOs in Nairobi and concluded that SACCOs suffered
challenges in meeting loan requests by the members partly due to long term
investments they engage in.
Table 4.28: Correlation between Investment in Non-Core Business and Liquidity
of SACCOs
Liquidity of SACCOs
Investment in Non-
Core Business
Pearson Correlation .323**
Sig. (2-tailed) .030
N 45
**. Correlation is significant at the 0.05 level (2-tailed).
4.6 Regression Analysis
The study evaluated how the financial factors under study (liquidity management, net
cash flows, credit lending and investment in non-core business) affected liquidity of
SACCOs in Kirinyaga County. Using multiple regression analysis and Analysis of
Variance (ANOVA), the combined effect of liquidity management, net cash flows,
Page 59
46
credit lending and investment in non-core business on liquidity of SACCOs was
established.
Table 4.29 shows the relationship between financial factors under investigation and
liquidity of SACCOs. The findings indicate that the relationship was positive and
strong (R = 0.637). The coefficient of determination (r2 = 0.405) shows that 40.5% of
the liquidity could be attributed to the financial factors under investigation, that is,
liquidity management, net cash flows, credit lending and investment in no-core
business. The findings gave emphasis to the importance of financial factors on
liquidity. The 59.5% of the liquidity of SACCOs resulted from other non-financial
factors such as industry specific factors, economic factors among others not
investigated by the current study.
Table 4.29: Regression Analysis Model
a. Predictors: (Constant), Investment in non-core business, Credit lending, Net cash
flows, Liquidity management
b. Dependent Variable: Liquidity
4.6.1 Analysis of Variance
F statistics was used to test whether the overall model was statistically predicting that
independent variables (Liquidity management, Net cash flows, Credit lending and
Investment in non-core business) has effect on liquidity of SACCOs in Kirinyaga
County. The ANOVA results are illustrated in Table 4.30. According to the ANOVA
results the association between the financial factors under study and liquidity of
SACCOs was positive and significant as indicated by the F calculated (F = 6.815; P <
0.05). This implies that there is strong evidence that the regression model developed
is statistically significant and the variation in the results is insignificant.
Model R R Square Adjusted R Square Std. Error of the Estimate
.637a .405 .346 .88415
Page 60
47
Table 4.30: Analysis of Variance (ANOVA)
Model Sum of Squares df Mean Square F Sig.
Regression 21.309 4 5.327 6.815 .000b
Residual 31.269 40 0.782
Total 52.578 44
a. Dependent Variable: Liquidity
b. Predictors: (Constant), Investment in non-core business, Credit lending, Net cash
flows, Liquidity management
4.6.2 Overall Regression Model
Table 4.31 shows the overall significant test results for the hypothesized research
model. The interpretations of the findings indicated follow the following regression
model.
Y= β0 + β1X1+ β2X2+ β3X3+ β4X4+ Ɛ
Therefore,
Y= 5.270 + 0. 285X1+ 0.079X2+ 0.243X3+ 0.076X4
From the model, it is clear that, all the variables are positively related to the dependent
variable as all the coefficients are positive. From the equation, it was noted that
holding the financial factors (liquidity management, net cash flows, credit lending,
and investment in non-core business) constant, the liquidity of the SACCOs would be
5.270. This would be as a result of other factors not investigated in the study. Further,
the results show that, liquidity management has a positive relationship with liquidity
of SACCOs where a unit increase in liquidity management, a 0.285 unit increase
in liquidity is predicted, holding all other variables constant. From the model, it is also
clear that for every unit increase in net cash flows, there is expected 0.079 unit increase
in the liquidity, holding all other variables constant. For every unit increase in credit
lending, there is an expected an approximately 0.243 unit increase in liquidity, holding
all other variables constant. For every unit increase in investment in non-core
business, there is an expected 0.076 unit increase in the liquidity.
At 95% confidence level, the regression test results indicated that the effect of
liquidity management (t = 2.371; p < 0.05) and credit lending (t = 2.061; p < 0.05)
were statistically significant to the liquidity of SACCOs. However, the effect of net
Page 61
48
cash flows (t = 0.772; p > 0.05) and investment in non-core business (t = 0.819; p >
0.05) were statistically insignificant to the liquidity of SACCOs. This illustrates that
efforts of creating a unit change in liquidity management would see the SACCOs
experiencing significant changes in terms of liquidity. Credit lending was also
evaluated to be significantly affecting liquidity of SACCOs and thus, cautious credit
lending in SACCOs would result to helpfulness in liquidity of SACCOs.
Table 4.31: Regression Coefficientsa
Model
Unstandardized
Coefficients
Standardized
Coefficients
T Sig. B
Std.
Error Beta
(Constant) 5.270 2.598 2.028 .049
Liquidity
Management
.285 .120 .357 2.371 .023
Net cash flows .079 .102 .121 .772 .445
Credit lending .243 .118 .271 2.061 .046
Investment in non-
core business
.076 .093 .112 .819 .418
a. Dependent Variable: Liquidity
Page 62
49
CHAPTER FIVE
SUMMARY, CONCLUSIONS AND RECOMMENDATIONS
5.1 Introduction
This chapter presents the summary, conclusions and recommendations of the study on
determining the effect of financial factors on liquidity of Savings and Credit Co-
operative Societies in Kirinyaga County. Also highlighted in this chapter are possible
suggestions for further research.
5.2 Summary of Findings
The study findings are summarized and presented in this section. The summary is in
line with the study objectives. To address the aim of the study, inferential statistics
were conducted where correlation analysis was used to study the association between
the variables and regression analysis undertaken to study the relationship between the
variables. A multiple regression analysis was conducted to develop the regression
model relating to the study variables. The significance of the results was tested at 5%
level in a 2-tailed test.
5.2.1 Liquidity Management
Maintaining a robust liquidity management is very challenging and difficult in a
current competitive and open economic system with strong external influences and
sensitive market players. The study revealed that proper liquidity management is vital
to SACCO solvency and that automation of SACCOs’ operations has enhanced proper
liquidity management. Moreover, the statutory laws and provisions usually affect
SACCO’s liquidity. However, respondents disagreed that proper identification of risk
ensures optimal liquidity is maintained. Liquidity risk management practices are
important to the day to day operations of an entity. This means that increased liquidity
management considerably relate to increased liquidity of SACCOs.
5.2.2 Net Cash Flows
The study found that it is always important for a SACCO to include the statement of
cash flows in its financial statements since it guides its management in maintaining
an optimal liquidity. It is noted that efficient cash management improves the liquidity
of SACCOs. Cash flow position helps in determining the financial soundness of the
SACCOs while members’ contributions enhances the liquidity of SACCOs. This
Page 63
50
illustrates that efforts of making changes in liquidity management would see the
SACCOs experiencing weighty growth in terms of liquidity. This means that changes
in net cash flows connect with changes in liquidity of SACCOs.
5.2.3 Credit Lending
The study noted that proper credit assessment methods ensures high recovery of loans
by employing effective credit risk management. It was also noted that sound lending
practices reduces level of bad debts and that proper management of credit ensures
minimal loan backlog. Lack of credit analysis, credit follow-ups as well as hostile
lending are the key factors that contribute to poor performance in loan lending by
SACCOs. This means that increases or decreases in credit lending expressively relate
to increases or decreases in liquidity of SACCOs. Thus cautious credit lending in
SACCOs would result to helpfulness in liquidity of SACCOs. SACCO’s sustainability
and financial viability depends on sound lending procedures and effective credit risk
management practices.
5.2.4 Investment in Non-Core Business
It was noted that respondents agreed that evaluations, appraisals & reviews of
investment projects ensures maximum return to the members of a SACCO and that
near cash investments enables SACCOs to maintain liquidity position. It was agreed
that adhering to statutory provisions ensures optimal liquidity is maintained and that
diverting members’ funds greatly affect SACCO liquidity. This indicates that, proper
appraisal of investment projects and investing members’ funds only in interest-
earning assets would result to increases in the liquidity of SACCOs. 5.2.5 Liquidity of SACCOs
SACCOs are always striving to maintain their liquidity at safe levels. This move is
informed by the need to fund increases in assets and meet obligations as they come
due, without incurring unacceptable losses. Liquidity can be understood in terms of
flows. Inability of realizing these flows would render the financial entity illiquid.
Respondents concurred that proper liquidity contingency plans enable SACCO to
uphold liquidity position and that adhering to liquidity level ensure optimal liquidity
is maintained. The study also noted that liquidity gap helps in maintaining SACCO
liquidity level and that liquidity ratios help in tracking the SACCO liquidity position.
Page 64
51
5.3 Conclusions
The objective of the study was to establish the effect of financial factors on the
liquidity of SACCOs. It was noted that liquidity management and credit lending were
the most important financial factors that affected the liquidity of SACCOs in
Kirinyaga County. The study concluded that efforts of creating a unit change in
liquidity management would see the SACCOs experiencing significant change in
terms of liquidity. Credit lending was also evaluated to be significantly affecting
liquidity of SACCOs and thus, cautious credit lending in SACCOs would result to
helpfulness in liquidity of SACCOs.
The study concluded that SACCOs in Kirinyaga County mostly capitalized on
liquidity management and as such it affected the SACCOs’ liquidity position. In
addition, the study concluded that it was critical for SACCOs to have adequate
liquidity in order to ensure that they meet short term maturing obligations.
5.4 Recommendations of the Study
The contribution of SACCOs in Kenyan economy cannot be ignored. However, this
contribution has been affected in the recent past by some financial factors. To address
this, SACCOs should have a management structure in place to effectively execute
their financial strategies to enhance liquidity. They must ensure that liquidity is
effectively managed on a regular and timely basis and that appropriate policies and
procedures are established to limit and control material sources of funding liquidity
risk. SACCOs should manage the demand and supply of liquidity in an appropriate
manner in order to safely run their business, maintain good relations with the
stakeholders and avoid liquidity problem. The SACCOs’ board of directors should be
informed regularly of the liquidity position of the firm, and immediately notified if
there are any material changes in the SACCOs’ current or prospective liquidity
positions.
SACCOs should also reconsider their loan recovery strategies and collateral for their
loans and advances. For example, members’ non-withdrawable deposits and
guarantors are not adequate measures to loan delinquency. SACCOs should bring in
the idea of loan insurance (loan guard) like commercial banks other financial
institutions in order to cushion their members from unnecessary burden from
defaulted loans and collaterals. There is also need for the government and the regulator
Page 65
52
(SASRA) to introduce a SACCO system driven Central Finance Facility (CFF) to aid
in liquidity management. This will enable control of liquidity in the SACCOs and also
help on overnight borrowing to assist the SACCOs assess the cash during cash
shortage and release cash surpluses when there is excess funds. It will also facilitate
competitiveness of SACCOs as alternative financial service providers in line with
Vision 2030 and the Medium-Term Plan for the Financial Sector.
5.5 Suggestions for Further Research
This study focused on the effect of financial factors on the liquidity of savings and
credit co-operatives societies operating in Kirinyaga County. It is recommended that
another study should be conducted to establish whether similar results would be
replicated in other financial institutions such as commercial banks, insurance
companies and Micro Finance Institutions (MFIs).
The study also recommends that a further study should be carried out to determine the
challenges facing the SACCOs in their quest to ensure implementation of SASRA
regulations such as capital adequacy and liquidity requirements and at the same time
meet the demands of their members.
A study should also be carried out to establish the effect of non-financial factors on
liquidity of the non-deposit-taking SACCOs. This will help to establish if the results
obtained with the deposit-taking SACCOs also apply to the entire SACCO industry.
Page 66
53
REFERENCES
ACCOSCA (African Confederation of Co-operative Savings and Credit
Associations). (2011). Using Co-operative Model to Tackle Challenges in
Africa. Monthly Newsletter, 3(11), 2-3.
Ademba, C. (2010). Challenges Facing Sacco Regulatory Framework in Africa.
SACCO Supervision Annual Report. 1(2), 6-7.
Basel Committee on Banking Supervision. (2008). Principles for Sound Liquidity Risk
Management and Supervision. Available at: www.bis.org/ publ/ bcbs138.htm.
Brunnermeier, M. & Pedersen, L. H. (2009). Market Liquidity and Funding Liquidity.
Review of Financial Studies, 22(6), 201-238.
Co-operative Bank of Kenya. (2013). The History of Co-operative Bank of Kenya.
Retrieved from http://co-opbank.co.ke/index.php/about-us/history.
Cooper, D. R., Schindler, P. S. (2007). Business Research Methods. Berkshire:
McGrawHill Education.
Creswell, J. W. (2009). Research Design: Qualitative, Quantitative and Mixed
Methods Approaches. Los Angeles: CA, Sage Publications.
Crowe, K. (2009). Liquidity Risk Management – more important than ever. Harland
Financial Solutions, 5(2), 3.
Dawson, C. (2009). Introduction to Research Methods. A practical Guide for
Anyone Undertaking a Research Project. London: Newtec.
Essendi, L. K. (2013). Effect of Credit Risk Management on Loans Portfolio among
SACCOs in Kenya. Nairobi: University of Nairobi.
Godfrey, M. (2015). Liquidity and Bank Performance. International Business &
Economics Research Journal, 4(3), 12-29.
Goodhart, C. (2008). Liquidity Risk Management. Financial Stability Review, 11(6).
Huseyin, Y. (2011). Another Perspective to Corporate Cash Management: A New
Model and Definition. International Journal of Humanities and Social
Science, 1(11), 302-313.
ICA (International Co-operative Alliance). (2007). Statement on the Co-operative
Identity. Available from the University of Wisconsin Center for Co-operatives
at Http://www.wisc.edu/uwcc/rin-html.
Kamonjo, K. L. (2014). Corporate Governance Practice and its Effect on Financial
Performance in SACCOs. A Case Study of Urban SACCOs in Kirinyaga
County-Kenya). Nairobi: Kenyatta University.
Page 67
54
Karagu, J. M., & Okibo, B. (2014). Financial Factors Influencing Performance of
Savings and Credit Co-operative Organization in Kenya. International
Journal of Academic Research in Accounting, Finance and Management
Sciences, 4(2), 295-306.
Keitany, N. J. (2013). Relationship between Loan Default and the Financial
Performance of SACCOs in Kenya. Nairobi: University of Nairobi.
Kilonzi, B. K. (2012). Assessments of Impacts of SASRA Regulations on Financial
Performance of SACCOs in Kenya, Case Study of 30 SACCO’s in Nairobi
County. Nairobi: Kenyatta University.
Kimathi, P. M. (2014). The Effect of Financing Strategies on the Liquidity of Savings
and Credit Co-operatives Societies Licensed by SACCO Societies Regulatory
Authority operating in Nairobi County. Nairobi: University of Nairobi.
Kinyua, J. (2013). Role of Financial Management Practices in the Performance of
Public Service Vehicle Savings and Credit Co-operative Societies in Kenya.
Nairobi: University of Nairobi.
Kipngetich, S., & Muturi, W. (2015). Effect of Credit Risk Management on Financial
Performance of Savings and Credit Co-operative Society. The Strategic
Journal of Business & Change Management, 2(44), 900-915.
Kiragu, D. N. (2014). The Effect of SACCO Societies Regulatory Authority’s
Regulations on Financial Performance of SACCOs in Nairobi County.
Nairobi: University of Nairobi.
Kithunzi, M. (2009). Effectiveness of Guarantorship in Loan Recovery in Co-
operative Societies in Kenya: Case study of Mwalimu SACCO. Nairobi:
University of Nairobi.
KUSCCO. (2009). SACCO Star Magazine. 1(54), 9-13. Nairobi, Kenya.
Lagat, F. K., Mugo, R., & Otuya, R. (2013). Effect of Credit Risk Management
Practices on Lending Portfolio among Savings and Credit Co-operatives in
Kenya. European Journal of Business and Management, 5(19).
Maina, H. (2011). Relationship between the Liquidity and Profitability of Oil
Companies in Kenya. Nairobi: University of Nairobi.
Maina, J. N., Kinyariro, D. K., & Muturi, H. M. (2016). Influence of Credit Risk
Management Practices on Loan Delinquency in Savings and Credit Co-
operative Societies in Meru County, Kenya. International Journal of
Economics, Commerce and Management. United Kingdom, 4(2), 763-773.
Page 68
55
Miriti, J. M. (2014). Factors Influencing Financial Performance of Savings and
Credit Co-operatives. A case of Capital SACCO, Meru County, Kenya.
Nairobi: University of Nairobi.
Mugenda, M., & Mugenda, G. A. (2011). Research Methods; Quantitative and
Qualitative Approaches. Nairobi: Laba Graphics Services.
Muraguri, J. K. (2014). The Effect of Liquidity on the Return on Investments for
SACCOs in Nairobi. Nairobi: University of Nairobi.
Muriuki, (2013). Investigation into the Cash Balance Management Approaches in
Saving and Credit Co-operative Societies (SACCOS) in Nakuru County,
Kenya. Nakuru: Egerton University.
Murugu, H. M. (2012). Effect of Credit Risk Management Practices on the
Performance of SACCOs in Kenya. A case of Nairobi Based SACCOs.
Nairobi: University of Nairobi.
Mwithiga, R. W. (2012). Strategic Responses Adopted by SACCOs to the Changing
Operation Environment in the Kenyan Financial Sector. A case of Nairobi
Based SACCOs with Front Office Service Activity. Nairobi: Kenyatta
University.
Ng’ang’a, S. I., Kosgei, Z. K., & Gathuthi, E. W. (2008). Management Research
Methods. A Learner’s Guide. Nairobi: African Center for Technology Studies
(ACTS) Press.
Njeru, M. D., Njeru, M. A, Memba, F., & Ondabu, I. T. (2015a). Effect of Cash
Management on Financial Performance of Deposit Taking SACCOs in Mt.
Kenya Region. International Journal of Scientific and Research Publications,
5(2), 124-133.
Njeru, M. D., Njeru, M. A, Memba, F., & Ondabu, I. T. (2015b). Effect of Loan
Repayment on Financial Performance of Deposit Taking SACCOs in Mt.
Kenya Region. International Journal of Innovation and Applied Studies,
10(4), 238-244.
Njeri, M. M. (2014). The Effect of Liquidity on Financial Performance of Deposit
Taking Microfinance Institutions in Kenya. Nairobi: University of Nairobi.
Obbuyi, P. I. (2014). The Effect of Credit Rating Policies on the Loan Uptake in
Savings and Credit Co-operatives (SACCOs) in Nairobi County. Nairobi:
University of Nairobi.
Page 69
56
Odhiambo, J. (2013). The Relationship between Working Capital Management and
Financial Performance of Deposit Taking Savings and Credit Co-operative
Societies Licensed by SACCO Societies Regulatory Authority in Nairobi
County. Nairobi: University of Nairobi.
Ogol, G. O. (2011). Liquidity Risk Management Practices in Microfinance Institutions
in Kenya. Nairobi: University of Nairobi.
Okundi, H. O. (2011). Financial Challenges Facing Savings and Credit Co-operative
Societies in Kenya: Case of SACCOS in Nairobi. Nairobi: University of
Nairobi.
Ombado, G. (2010). Identifying and Maximizing SACCO’s Potential. ACCOSA
Newsletter. 2(2), 2-6.
Omino, P. A. (2014). Liquidity Risk Mitigation Measures and Financial Performance
of Savings and Credit Co-operative Societies (SACCOs) in Kisumu County.
Nairobi: University of Nairobi.
Owino, E. O. (2011). The Relationship between Liquidity and Leverage of Companies
Quoted at the Nairobi Securities Exchange. Nairobi: University of Nairobi.
Polit, D., & Beck, C. (2003). Research Principles and Methods, (7th Ed.).
Lippincott.
SACCO Societies Act. (2008). Kenya Gazette Supplement No. 98 (Acts No. 14).
Nairobi: The Government Printer.
Sam, N. W. (2015). Effect of Cash Management Practices on the Growth of Matatu
SACCOs in Kimilili Sub-county, Bungoma County. The International Journal
of Business & Management, 3(1), 78-89.
SASRA. (2012). Licensed Deposit Taking SACCOs. SACCO Supervision Annual
Report 2012. Nairobi: SACCO Societies Regulatory Authority, 1(2), 7-16.
SASRA. (2013). Deposit-Taking SACCOs Licensed by the SACCO Societies
Regulatory Authority. Retrieved from http://www.sasra.go.ke/
downloads/Licensed_Saccos_ 2013.pdf.
Song’e, H. K. (2015). The Effect of Liquidity Management on the Financial
Performance of Deposit Taking SACCOs in Nairobi County. Nairobi:
University of Nairobi.
WOCCU (World Council of Credit Unions). (2013). Member Statistics. Retrieved
from http://www.woccu.org/about/intlcusystem.
Page 70
57
Zikmund, W. G., Babin B. J. & Graffin, M. (2010). Business Research Methods.
Mason, Ohio: South-Western.
Page 71
58
APPENDICES
APPENDIX I: QUESTIONNAIRES
This questionnaire is aimed at collecting relevant data that will help the researcher
analyze the financial factors affecting liquidity of SACCO’s in Kirinyaga County.
Please give your honest opinion on the mentioned aspects affecting liquidity in your
SACCO.
SECTION A: BACKGROUND INFORMATION
1. Please indicate your gender Male { } Female { }
2. Age 18-26 yrs { } 36-43 yrs { }
27-35 yrs { } 44 & above { }
3. Length of service < 4 yrs { } 5-8 yrs { }
9 yrs and above { }
4. What is your level of Education
(a) ‘O’ level { } (b) Tertiary { }
(c) University { } (d) Post graduate { }
5. What is your position in the SACCO?
_________________________________________________________________
6. Department/Section_________________________________________________
7. Please indicate the average monthly member’s contribution in Kenya shillings of
your SACCO as per the following ranges.
Below 500 { } 500-1000 { }
1000-2000 { } 3000-4000 { }
Above 4000 { }
8. Kindly tick appropriately the average yearly withdrawal rate of members in your
SACCO as per the following.
0-20% { } 21-40% { }
41-60% { } 61-80% { }
81-100% { }
9. (a). How constrained is your SACCO as a result of external financial engagements.
Very constrained { }
Averagely constrained { }
Not constrained { }
(b). How constrained is your SACCO as a result of internal financial engagements.
Page 72
59
Very constrained { }
Averagely constrained { }
Not constrained { }
10. The average monthly loan repayment from members is within which range in
your SACCO.
0-20% { } 61-80% { }
21-40% { } 81-100% { }
41-60% { }
11. Kindly indicate the proportion in which the SACCO loan portfolio falls:
0-20% 21-40% 41-60% 61-80% 81-100%
Performing { } { } { } { } { }
Watch { } { } { } { } { }
Substandard { } { } { } { } { }
Doubtful { } { } { } { } { }
Loss { } { } { } { } { }
12. How do you rate the level in which the SACCO undertakes new investments?
Very high { }
High { }
Moderate { }
Low { }
None { }
13. Indicates the proportion of the following assets in relation to the total SACCO
assets.
0-20% 21-40% 41-60% 61-80% 81-100%
Land and buildings { } { } { } { } { }
Listed Company Shares { } { } { } { } { }
Treasury bills { } { } { } { } { }
Treasury bonds { } { } { } { } { }
Off shore investments { } { } { } { } { }
Cash and cash equivalent { } { } { } { } { }
Page 73
60
SECTION B: LIQUIDITY MANAGEMENT
This section has statements regarding the effect of liquidity management on liquidity
of SACCOs. Kindly respond with the response that matches your opinion. Please tick
as appropriate in the boxes using a tick (√) or a cross mark (x).
Liquidity Management Statement
Strongly
Agree
Agree Don’t
Agree or
Disagree
Disagree Strongly
Disagree
5 4 3 2 1
1.
2.
3.
4.
Liquidity risk: Proper liquidity
management is vital to SACCO
solvency.
Statutory laws/policies:
Statutory laws & policies affects
SACCOs’ liquidity.
Management information
systems: Automation of
SACCO operations has
enhanced proper liquidity
management.
Risk identification: Proper
identification of risk ensures
optimal liquidity is maintained.
[ ]
[ ]
[ ]
[ ]
[ ]
[ ]
[ ]
[ ]
[ ]
[ ]
[ ]
[ ]
[ ]
[ ]
[ ]
[ ]
[ ]
[ ]
[ ]
[ ]
Page 74
61
SECTION C: NET CASH FLOWS
This section has statements regarding the effect of net cash flows on liquidity of
SACCOs. Kindly respond with the response that matches your opinion. Please tick as
appropriate in the boxes using a tick (√) or a cross mark (x).
Net Cash Flows Statement
Strongly
Agree
Agree Don’t
Agree or
Disagree
Disagree Strongly
Disagree
5 4 3 2 1
1.
2.
3.
4.
Statement of cash flows:
Cash flow statement guides
management in maintaining
optimal liquidity.
Cash flow position: Cash
flow position helps in
determining the financial
soundness of the SACCO.
Efficient cash management:
Efficient cash management
improves the liquidity
position of the SACCO
Members’ contributions:
Members contribution
enhances the liquidity of the
SACCO
[ ]
[ ]
[ ]
[ ]
[ ]
[ ]
[ ]
[ ]
[ ]
[ ]
[ ]
[ ]
[ ]
[ ]
[ ]
[ ]
[ ]
[ ]
[ ]
[ ]
Page 75
62
SECTION D: CREDIT LENDING
This section has statements regarding the effect of credit lending on liquidity of
SACCOs. Kindly respond with the response that matches your opinion. Please tick as
appropriate in the boxes using a tick (√) or a cross mark (x).
Credit Lending Statement
Strongly
Agree
Agree Don’t
Agree or
Disagree
Disagree Strongly
Disagree
5 4 3 2 1
1.
2.
3.
4.
Credit assessment methods:
Proper credit assessment
ensure high recovery of
loans.
Sound lending practices:
Sound lending policies
reduces level of bad-debts.
Loan backlogs: Proper
management of credit
ensures minimal loan
backlogs.
Credit risk management:
Effective credit risk
management ensures high
recovery of loans.
[ ]
[ ]
[ ]
[ ]
[ ]
[ ]
[ ]
[ ]
[ ]
[ ]
[ ]
[ ]
[ ]
[ ]
[ ]
[ ]
[ ]
[ ]
[ ]
[ ]
Page 76
63
SECTION E: INVESTMENT IN NON-CORE BUSINESS
This section has statements regarding the effect of investment in non-core business on
liquidity of SACCOs. Kindly respond with the response that matches your opinion.
Please tick as appropriate in the boxes using a tick (√) or a cross mark (x).
Investment in Non-core
Business Statement
Strongly
Agree
Agree Don’t
Agree or
Disagree
Disagree Strongly
Disagree
5 4 3 2 1
1.
2.
3.
4.
Diverting members’ funds:
Diverting members’ funds
greatly affect SACCO
liquidity.
Evaluations, appraisals and
reviews of investment
projects: Proper investment
appraisal ensures maximum
return.
Statutory provisions:
Adhering to statutory
provision ensures optimal
liquidity is maintained.
Near-cash investments:
Near cash investments
enables SACCO to maintain
liquidity position.
[ ]
[ ]
[ ]
[ ]
[ ]
[ ]
[ ]
[ ]
[ ]
[ ]
[ ]
[ ]
[ ]
[ ]
[ ]
[ ]
[ ]
[ ]
[ ]
[ ]
Page 77
64
SECTION F: LIQUIDITY
This section has statements regarding the liquidity of SACCOs. Kindly respond with
the response that matches your opinion. Please tick as appropriate in the boxes using
a tick (√) or a cross mark (x).
Liquidity Statement
Strongly
Agree
Agree Don’t
Agree or
Disagree
Disagree Strongly
Disagree
5 4 3 2 1
1.
2.
3.
4.
Contingency liquidity plans:
Proper liquidity contingency
plans enable SACCO to
uphold liquidity position.
Liquidity level: Adhering to
liquidity level ensure optimal
liquidity is maintained.
Liquidity ratios: Liquidity
ratios help in tracking the
SACCO liquidity position.
Liquidity gap: A liquidity gap
helps in maintaining SACCO
liquidity level.
[ ]
[ ]
[ ]
[ ]
[ ]
[ ]
[ ]
[ ]
[ ]
[ ]
[ ]
[ ]
[ ]
[ ]
[ ]
[ ]
[ ]
[ ]
[ ]
[ ]
Page 78
65
APPENDIX II: RECORD SURVEY SHEET The record survey sheet will be filled by using the data from the audited financial
statements of SACCOs for three years from 2013 to 2015.
2013 2014 2015
Turnover
Total expenditure
Total assets
Share capital
Cash and cash equivalents
Net loan portfolio
Members’ deposits