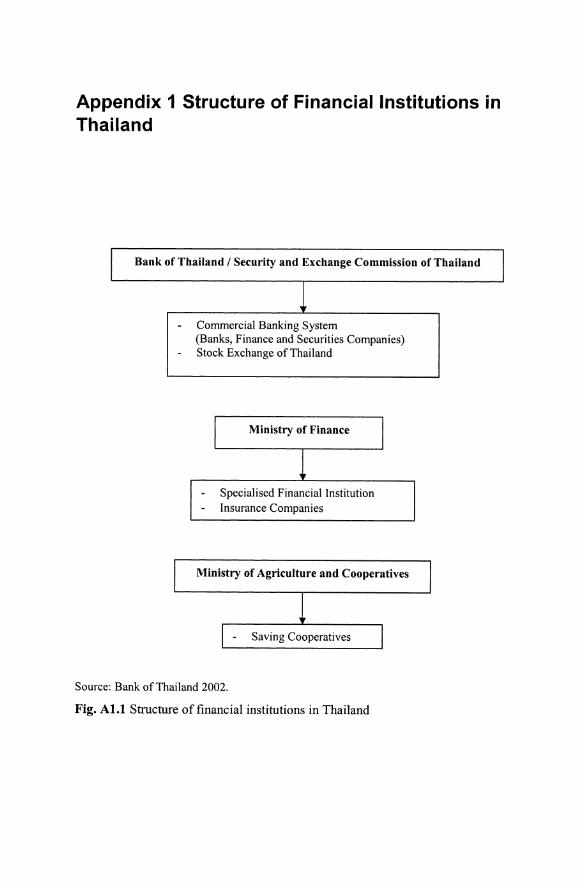
Appendix 1 Structure of Financial Institutions in Thailand I Bank of Thailand / Security and Exchange Commission of Thailand I 1 Commercial Banking System (Banks, Finance and Securities Companies) Stock Exchange of Thailand I Ministry of Finance 1 I Specialised Financial Institution Insurance Companies Ministry of Agriculture and Cooperatives Saving Cooperatives Source : Bank of Thailand 2002. Fig. Al.I Structure of financial institutions in Thailand
Transcript
Appendix 1 Structure of Financial Institutions inThailand
I Bank of Thailand / Security and Exchange Commission of Thailand I
1Commercial Banking System(Banks , Finance and Securities Companies)Stock Exchange of Thailand
Figure 2.1 Money market rate, 1992-2001 17Figure 2.2 Average exchange rate, Thai baht per US dollar, 1992- 18
2001Figure 2.3 Movement of the SET Index, 1975-2001 19Figure 2.4 Exchange rate during 1997-2001, Thai baht per US dollar 23Figure 3.1 Volatility of the SET Index, 1975-2001 27Figure 3.2 Volatility of the SET Index measured by standard devia-
tion, 1992-2001 30Figure 3.3 Single moving average on monthly SET Index, 1992-2001 33Figure 3.4 Single moving average on the monthly stock returns,
1992-2001 34Figure 3.5 Double moving average on the monthly SET Index,
1992-2001 35Figure 3.6 Triple moving average on the monthly SET Index,
1992-2001 35Figure 3.7 Single exponential smoothing of the SET Index,
a = 0.2, 0.5 and 0.8 38Figure 3.8 Single exponential smoothing of the SET returns,
a =0.2 39Figure 3.9 Double exponential smoothing of the SET Index,
a, T = 0.2 40Figure 3.10 Double exponential smoothing of the SET Index,
a, T = 0.5 40Figure 3.11 Double exponential smoothing of the SET Index,
a, T =0.8 41Figure 3.12 Double exponential smoothing of the SET returns,
a, T = 0.2 41Figure 3.13 Double exponential smoothing of the SET returns,
a, T = 0.5 42Figure 3.14 Double exponential smoothing of the SET returns,
a. T =0.8 42Figure 3.15 Holt Winters model of the SET Index, L, T, S = 0.2 45Figure 3.16 Holt Winters model of the SET Index, L, T, S = 0.5 46Figure 3.17 Holt Winters model of the SET Index, L, T, S = 0.8 46Figure 3.18 Holt Winters model of the SET returns, L, T, S = 0.2 47Figure 3.19 Holt Winters model of the SET returns, L, T, S = 0.5 47Figure 3.20 Holt Winters model of the SET returns, L, T, S = 0.8 48
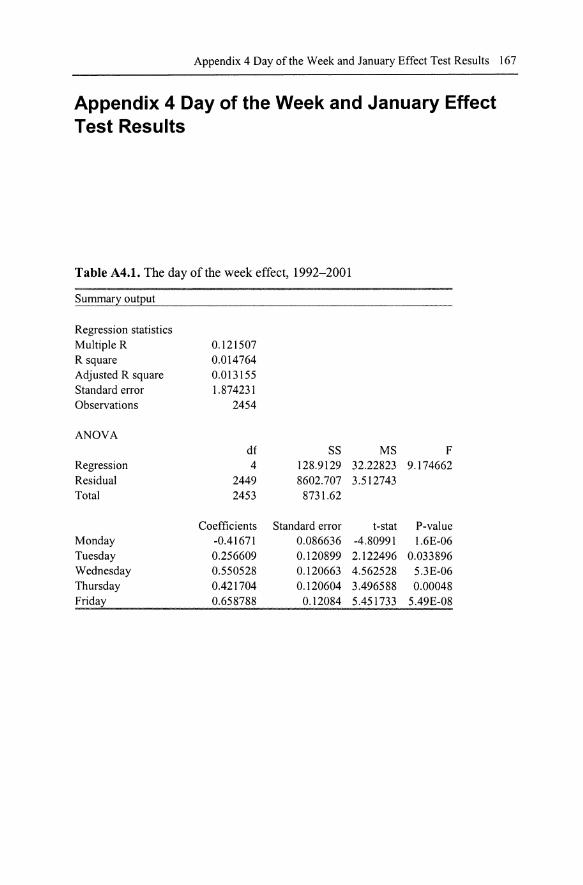
Corre1ogram of autocorrelation function on stock returns,1992-2001 61Corre1ogram of partial autocorrelation function on stockreturns, 1992-2001 61Simulation of sizes of rational speculative bubbles on dailydata, the duration dependence test, 1992-2001 104Simulation of sizes of rational speculative bubbles on dailydata, the Weibull Hazard model, 1992-2001 105The day of the week effect, 1992-2001, annualised 110The day of the week effect, pre-crisis, annualised 110The day of the week effect, post-crisis, annualised IIIThe day of the week effect, 1992, annualised 112The day of the week effect, 1993, annualised 112The day of the week effect, 1994, annualised 113The day of the week effect, 1995, annualised 113The day of the week effect, 1996, annualised 114The day of the week effect, 1997, annualised 114The day of the week effect, 1998, annualised 115The day of the week effect, 1999, annualised 115The day of the week effect, 2000, annualised 116The day of the week effect, 2001, annualised 116The January effect, 1975-2001, annualised 117The January effect, 1992-1996, annualised 118The January effect, 1997-2001 , annualised 118Monthly returns series for the SET, 1975-2001 134
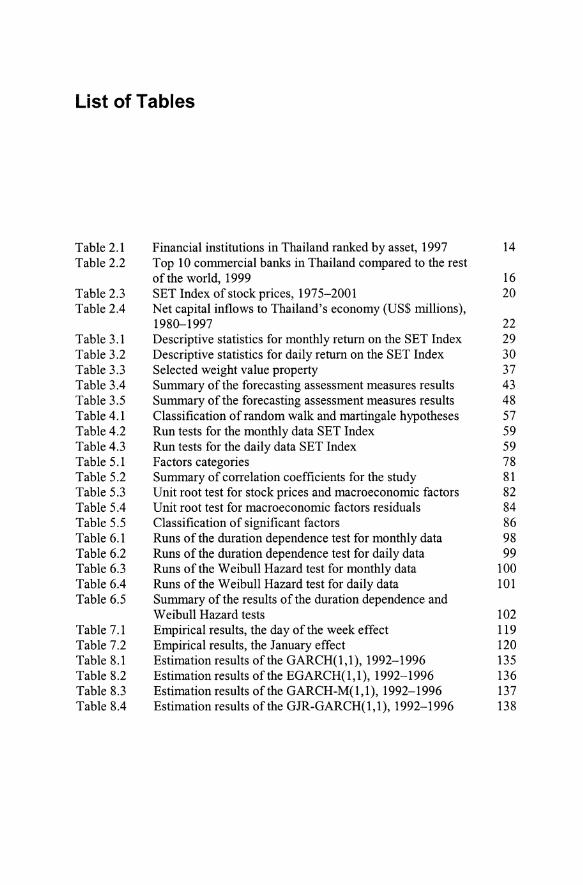
Financial institutions in Thailand ranked by asset, 1997Top 10 commercial banks in Thailand compared to the restof the world, 1999SET Index of stock prices, 1975-2001Net capital inflows to Thailand's economy (US$ millions),1980-1997Descriptive statistics for monthly return on the SET IndexDescriptive statistics for daily return on the SET IndexSelected weight value propertySummary of the forecasting assessment measures resultsSummary of the forecasting assessment measures resultsClassification of random walk and martingale hypothesesRun tests for the monthly data SET IndexRun tests for the daily data SET IndexFactors categoriesSummary of correlation coefficients for the studyUnit root test for stock prices and macroeconomic factorsUnit root test for macroeconomic factors residualsClassification of significant factorsRuns of the duration dependence test for monthly dataRuns of the duration dependence test for daily dataRuns of the Weibull Hazard test for monthly dataRuns of the Weibull Hazard test for daily dataSummary of the results of the duration dependence andWeibull Hazard testsEmpirical results, the day of the week effectEmpirical results, the January effectEstimation results of the GARCH(l ,l), 1992-1996Estimation results of the EGARCH( 1,1), 1992-1996Estimation results of the GARCH-M(l,l), 1992-1996Estimation results of the GJR-GARCH(l,l), 1992-1996
Estimation results of the PGARCH( 1,1), 1992-1996Estimation results of the GARCH( 1,1), 1997-2001Estimation results of the EGARCH(1,1), 1997-2001Estimation results of the GARCH-M(1,1), 1997-2201Estimation results of the GJR-GARCH(1,1), 1997-2001Estimation results of the PGARCH( 1,1), 1997-2001
139140141142143144
List of Appendices
Appendix 1 Structure of Financial Institutions in ThailandFigure ALl Structure of financial institutions in Thailand 155
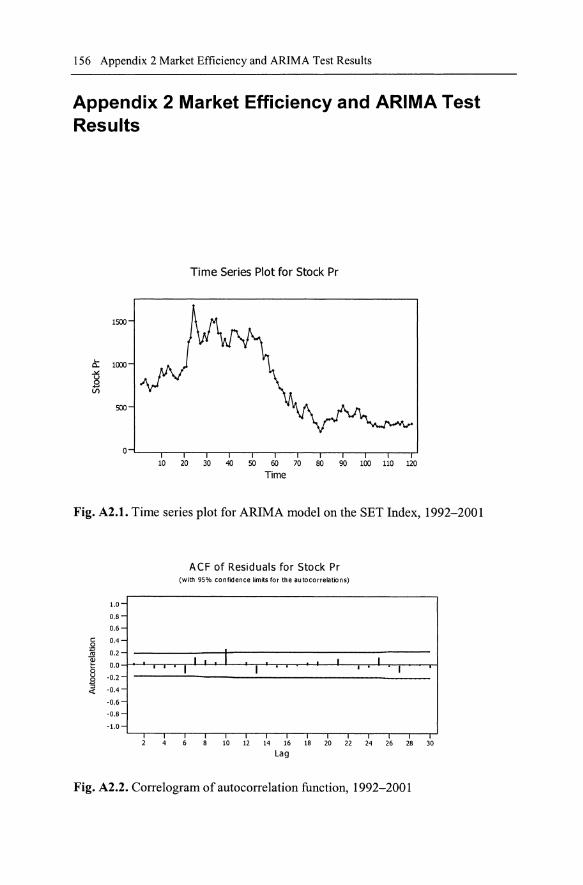
Appendix 2 Market Efficiency and ARIMA Test Results 156Figure A2.1 Time series plot for ARIMA model on the SET Index,
1992-2001 156Figure A2.2 Correlogram of autocorrelation function, 1992-2001 156Figure A2.3 Correlogram of partial autocorrelation function,
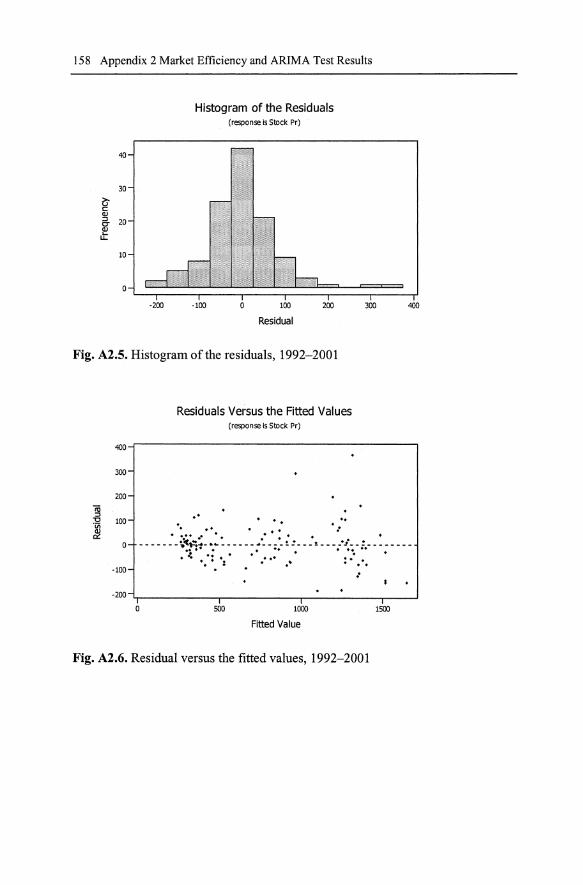
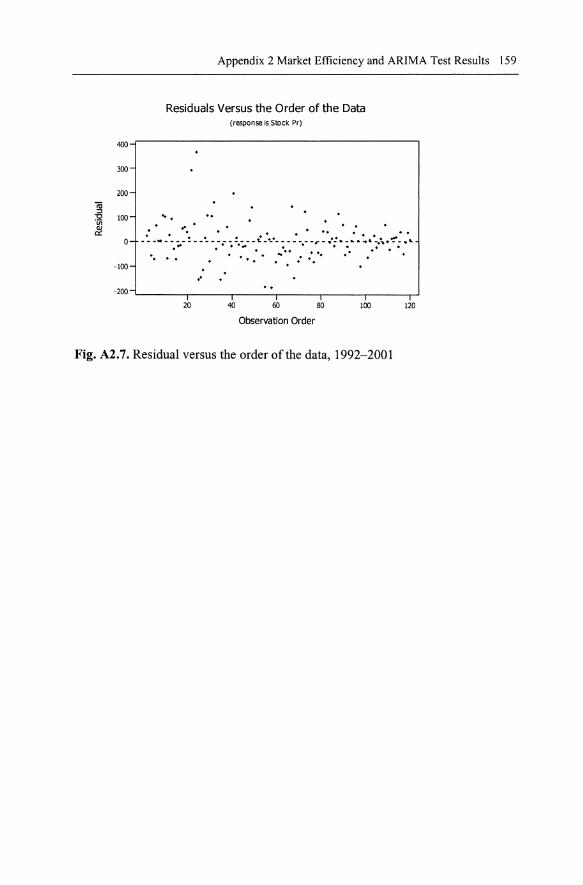
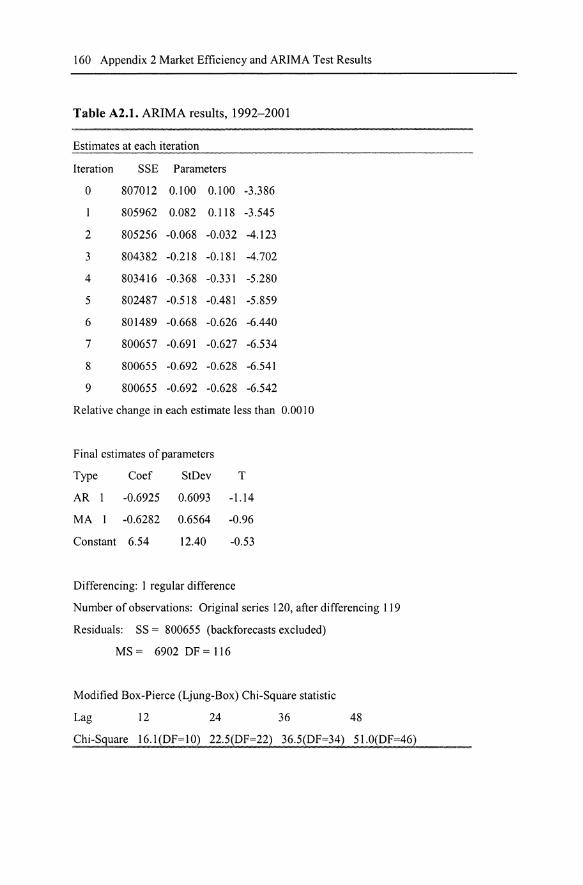
1992-2001 157Figure A2.4 Normal probability plot of the residuals, 1992-2001 157Figure A2.5 Histogram of the residuals, 1992-2001 158Figure A2.6 Residuals versus the fitted values, 1992-2001 158Figure A2.7 Residuals versus the order of the data, 1992-2001 159Table A2.1 ARIMA results, 1992-2001 160
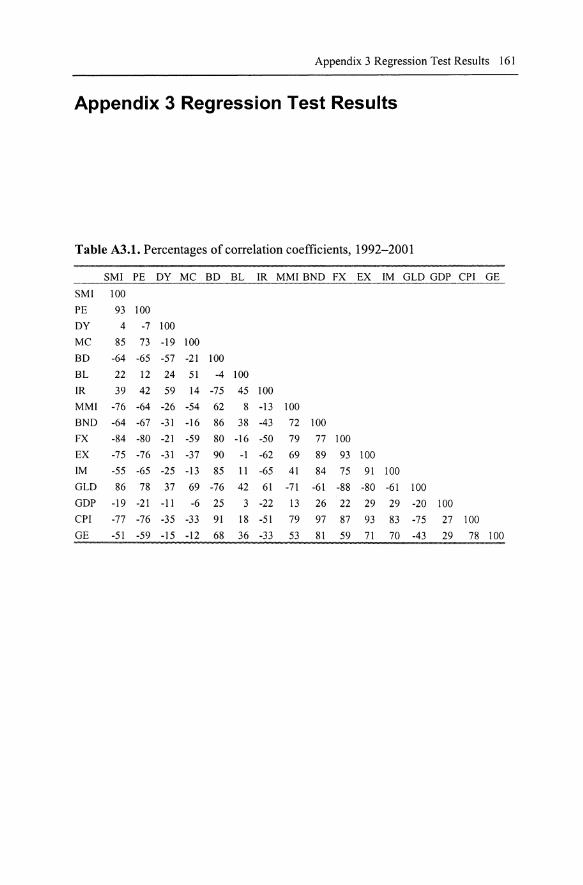
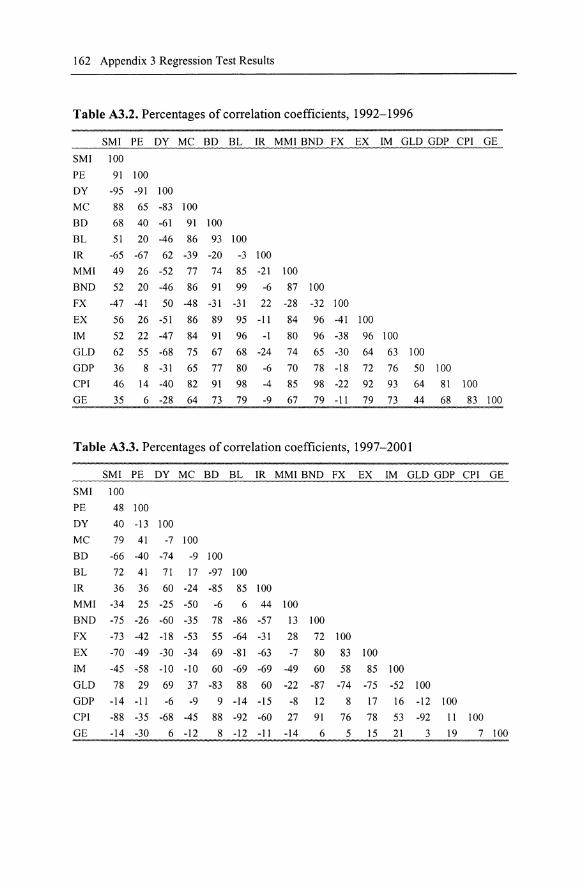
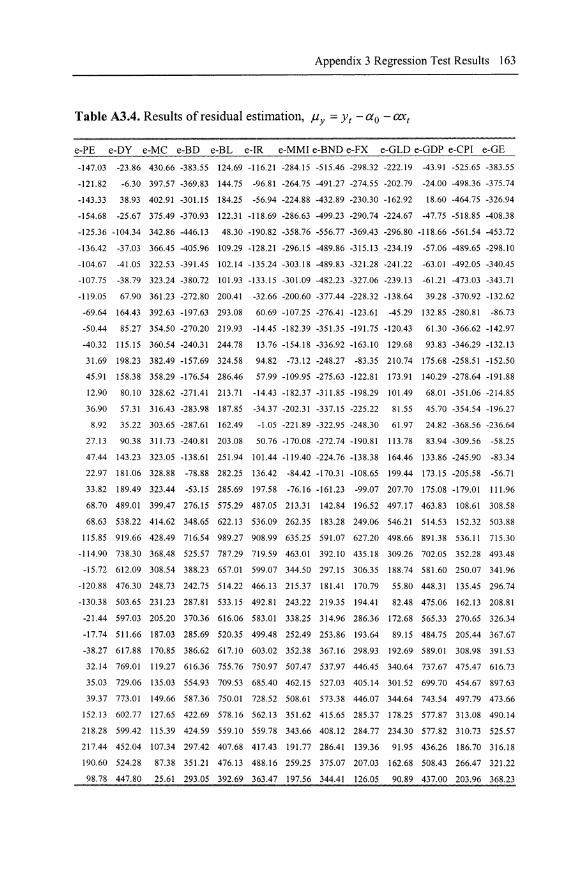
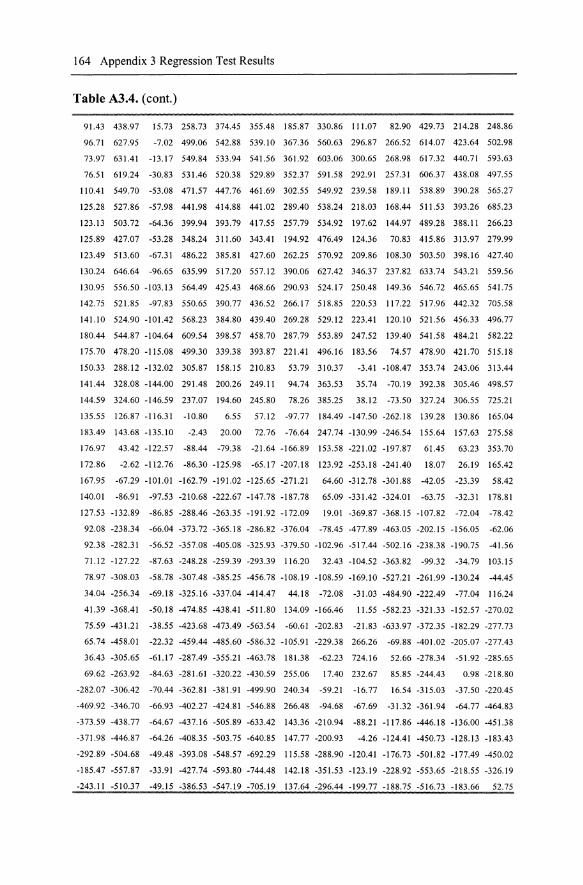
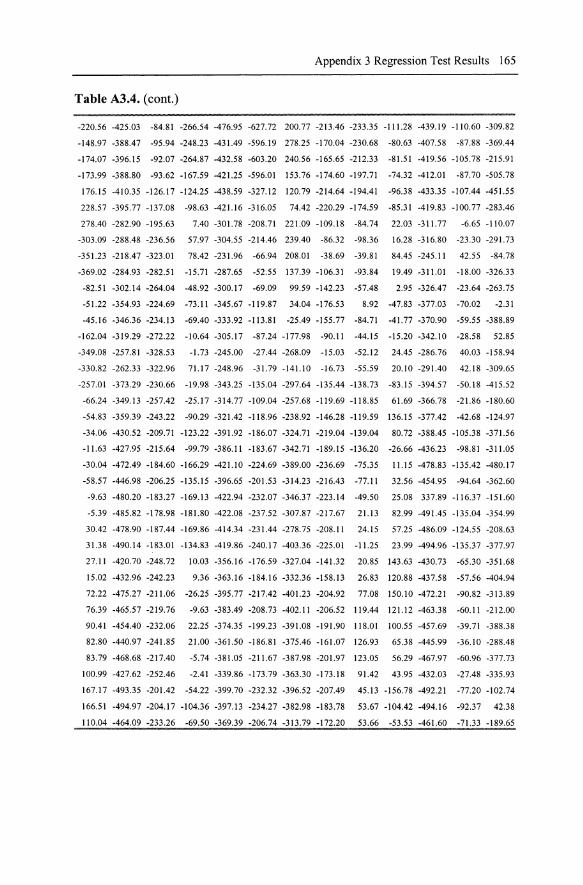
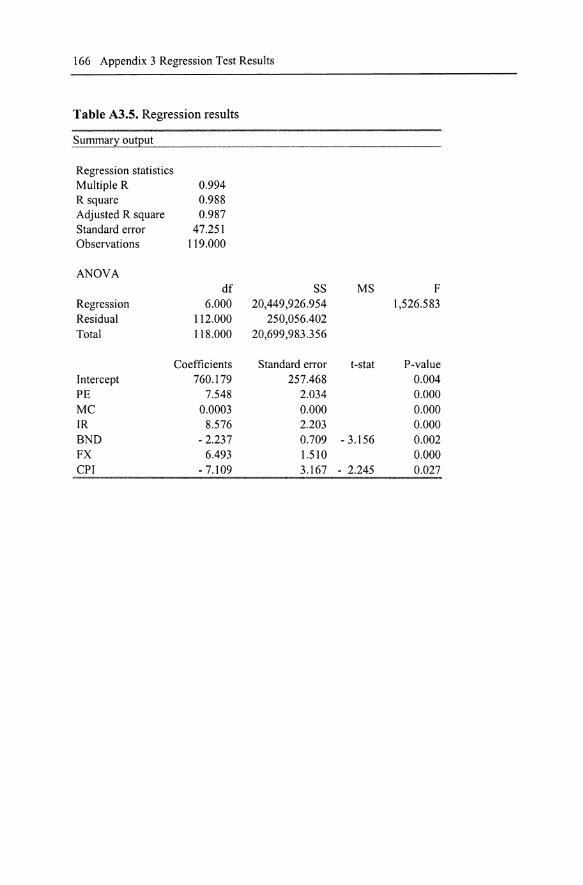
Appendix 3 Regression Test Results 161Table A3.1 Percentages of correlation coefficients, 1992-2001 161Table A3.2 Percentages of correlation coefficients, 1992-1996 162Table A3.3 Percentages of correlation coefficients, 1997-2001 162Table A3.4 Results of residual estimation, Jly = Yt- ao- ax, 163Table A3.5 Regression results 166
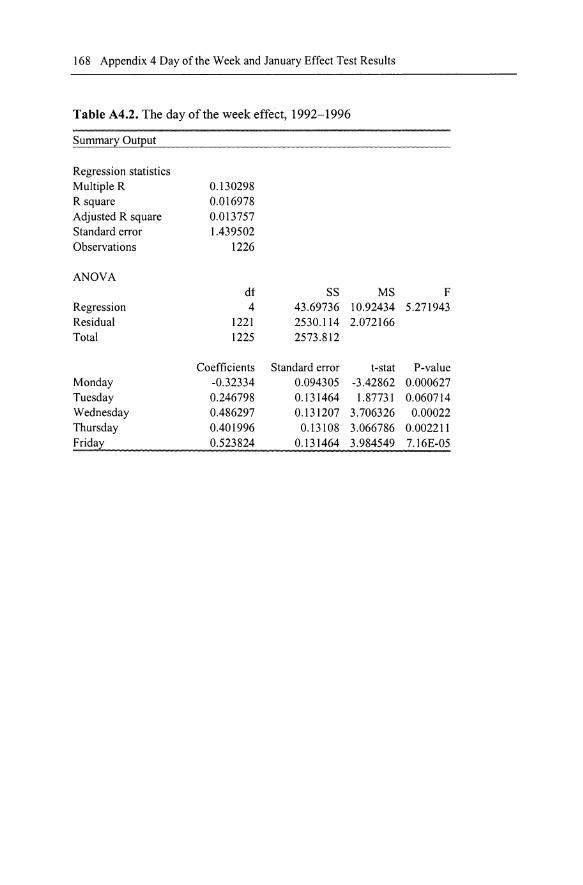
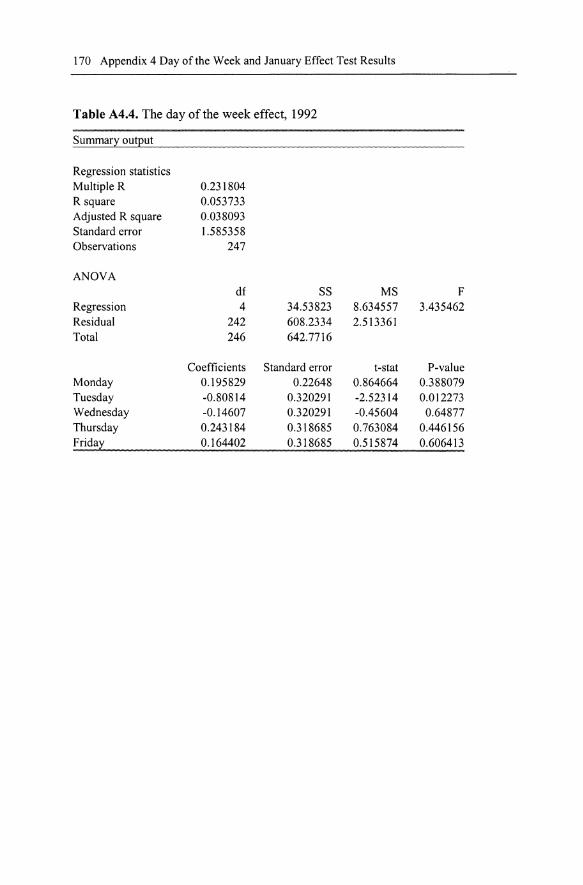
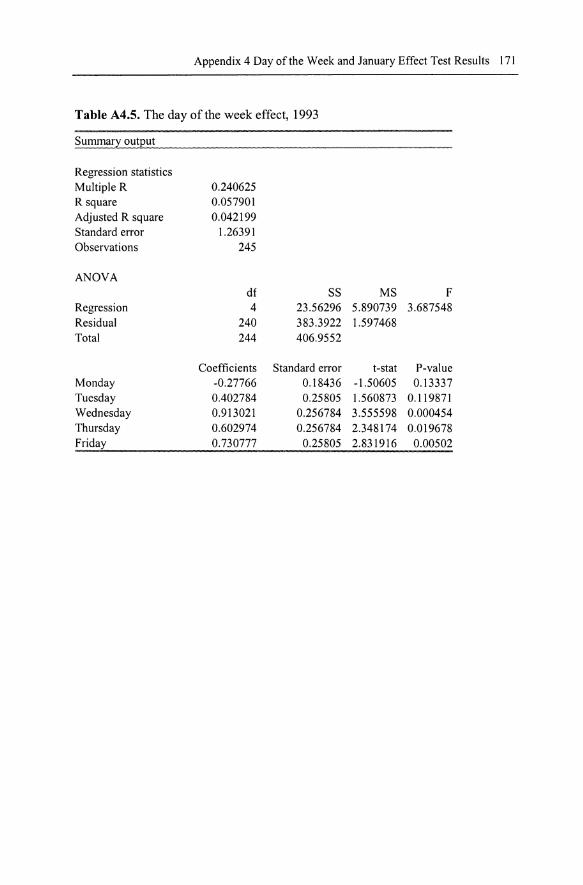
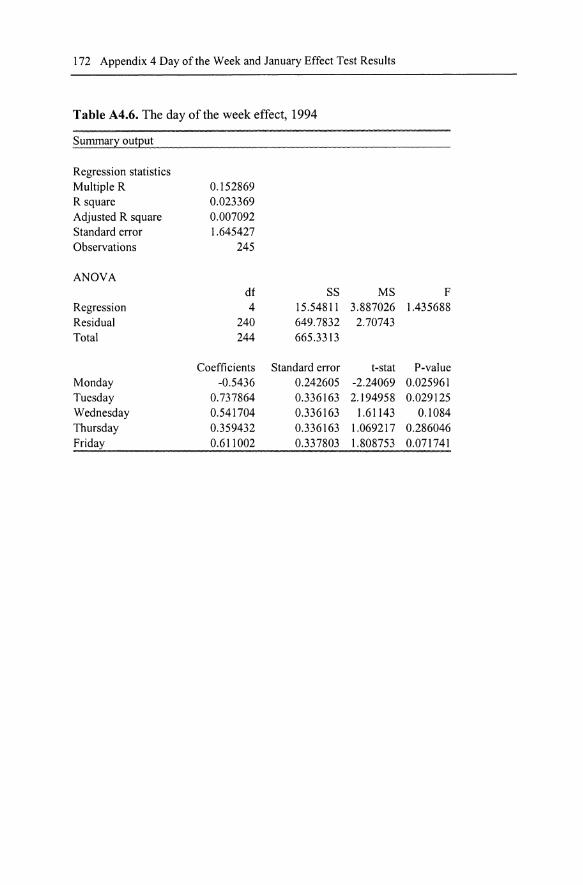
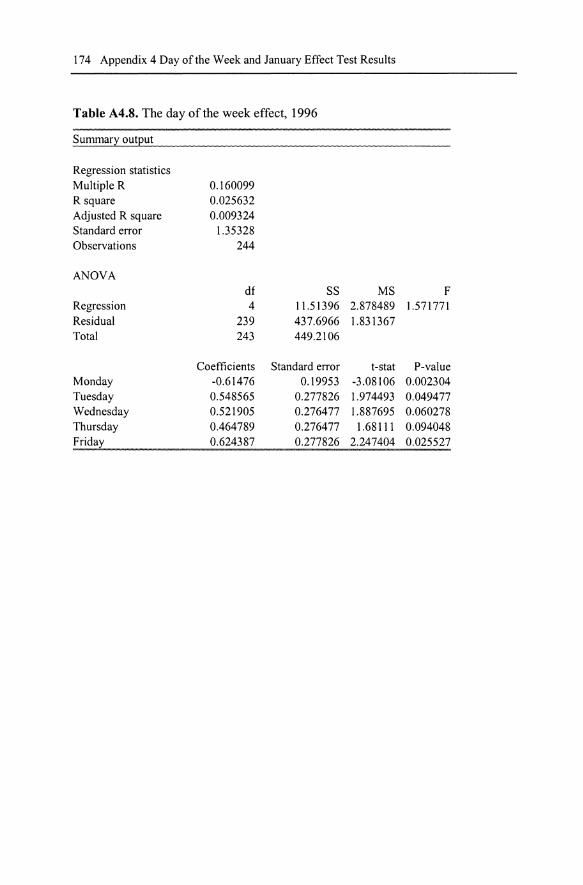
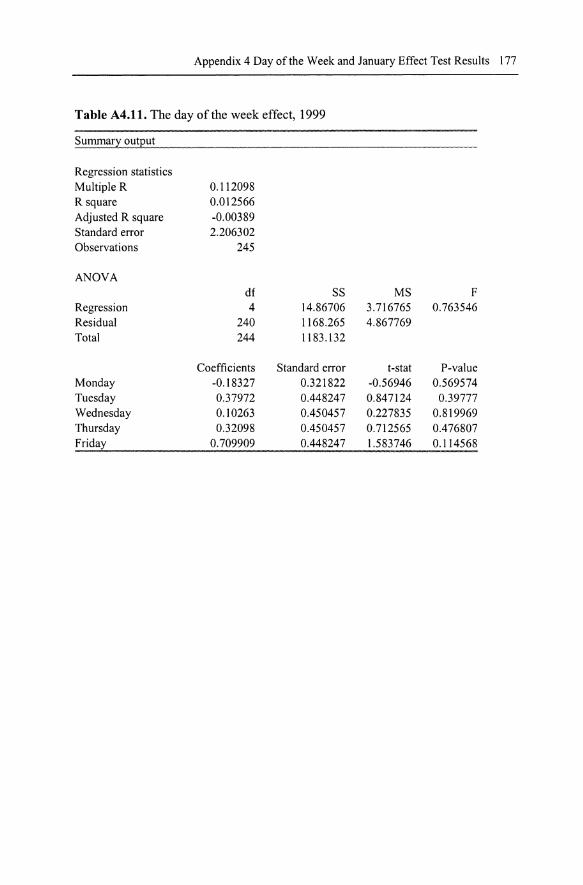
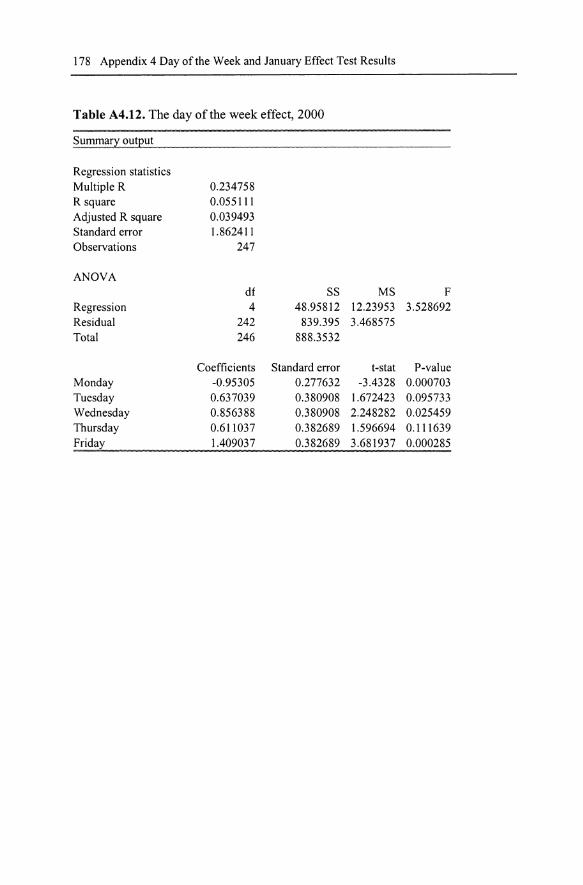
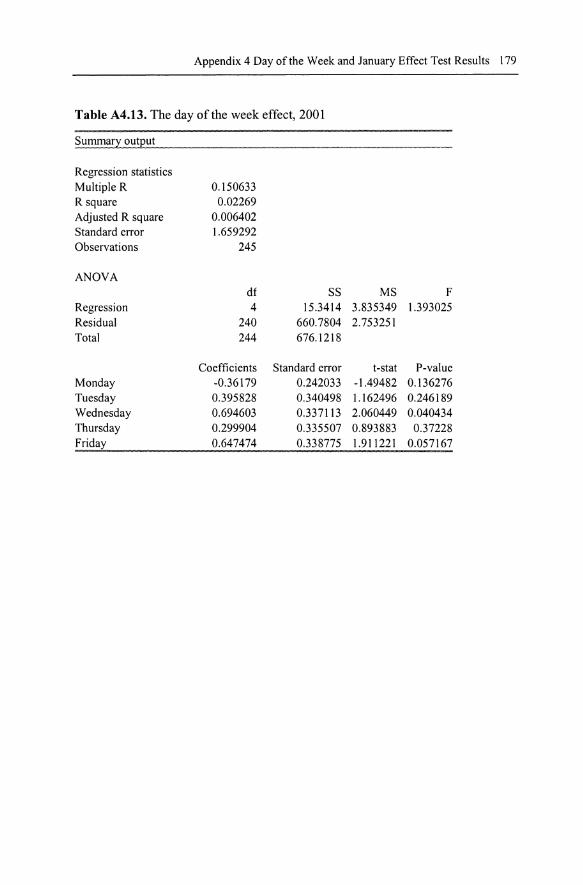
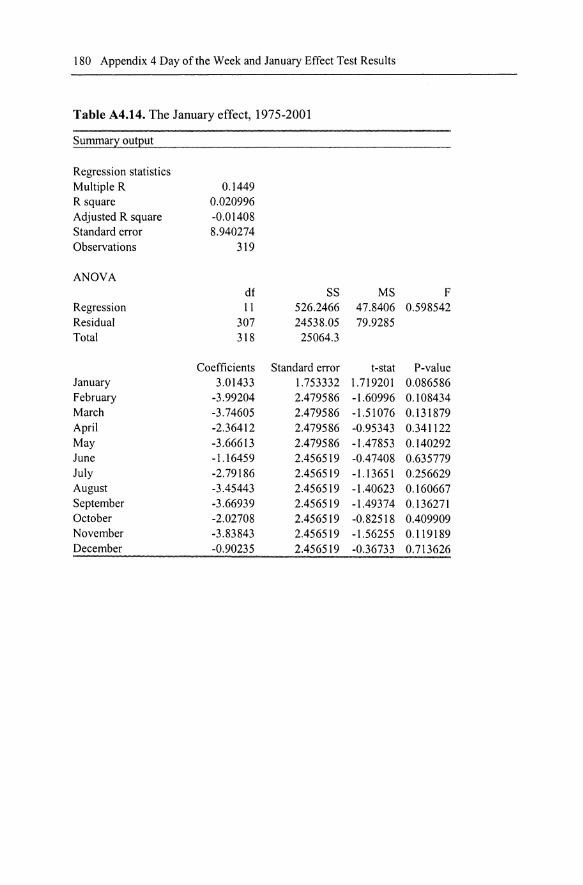
Appendix 4 The Day of the Week and the January Effect Test Results 167Table A4.1 The day of the week effect, 1992-2001 167Table A4.2 The day of the week effect, 1992-1996 168Table A4.3 The day of the week effect, 1997-2001 169Table A4.4 The day of the week effect, 1992 170Table A4.5 The day of the week effect, 1993 171Table A4.6 The day of the week effect, 1994 172Table A4.7 The day of the week effect, 1995 173Table A4.8 The day of the week effect, 1996 174Table A4.9 The day of the week effect, 1997 175Table A4.10 The day of the week effect, 1998 176Table A4.11 The day of the week effect, 1999 177Table A4.12 The day of the week effect, 2000 178Table A4.13 The day of the week effect, 2001 179Table A4.14 The January effect, 1975-2001 180
188 List of Appendices
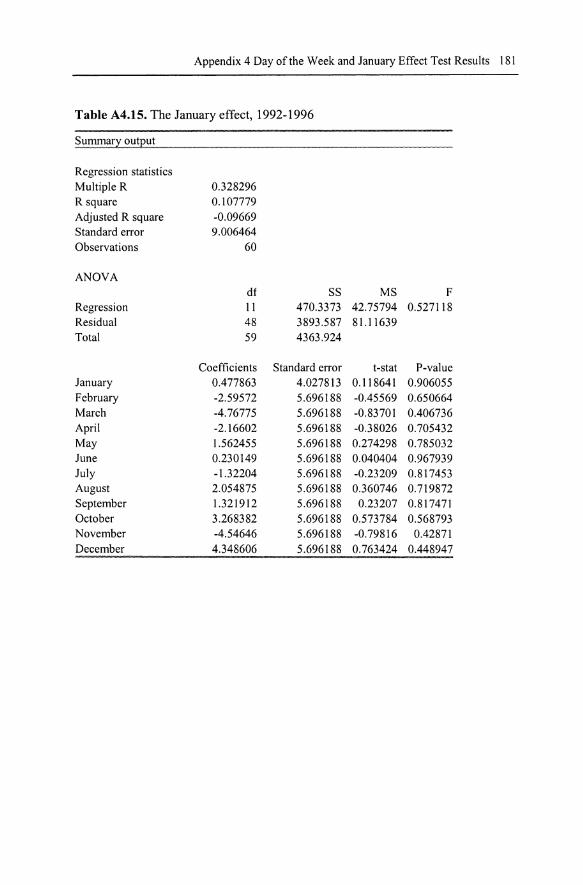
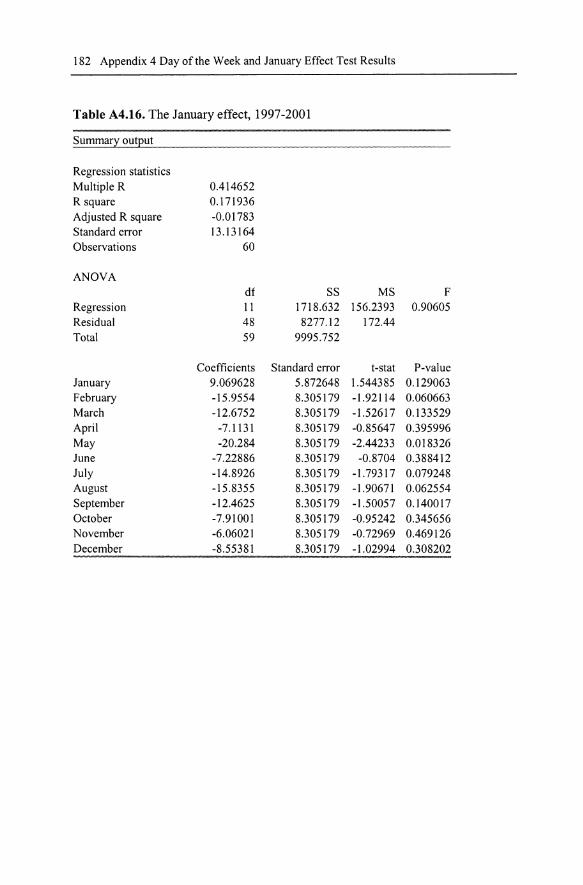
Table A4.15 The January effect, 1992-1996Table A4.16 The January effect, 1997-2001
181182
Bibliography
Abdullah DA, Hayworth SC (1993) Macroeconometrics of stock price fluctuations. Quarterly Journal of Business and Economics 32:49-63
Abelson P, Joyeux R (2000) Economic forecasting. Allen and Unwin, SydneyAbraham A, Ikenberry DL (1994) The individual investor and the weekend effect. Journal
of Financial and Quantitative Analysis 29:263-277Aggrawal A, Tandon K (1994) Anomalies or illusions? evidence from stock markets in
eighteen countries . Journal ofInternational Money and Finance 13:83-106Akdenis L, Salih A, Caner M (2002) Time varying betas help in asset pricing : the threshold
CAPM. Working Paper , University of Pittsburgh, PittsburghAkrasanee N, Jansen K, Pongpisanupichit J (1993) International capital flows and eco
nomic adjustment in Thailand. Thailand Development Research Institute , BangkokAllen F, Gale D (1990) Incomplete markets and incentives to set up an options exchange .
Geneva Papers on Risk and Insurance 15:17---46Allen F, Gale D (2000) Bubble and crises. The Economic Journal 110:236-255AI-Loughani N, Chappell D (200 I) Modelling the day of the week effect in the Kuwait
stock exchange: a nonlinear GARCH representation. Journal of Applied Financ ialEconomics II :353- 359
Asia Week (2000) Thailand : struggling out of a deep hole.http ://www .asiaweek.com/asiaweek/features/financiaI500.2000
Aydemir AB (1998) Volatility modelling in finance . In: J Knight, S Satchell (eds) Forecasting volatility in the financial markets . Reed Educat ional and Professional Publishing,Oxford
Baillie R, McMahon P (1989) The foreign exchange market. Cambridge University Press,Cambridge
Ball R (1978) Anomalies in relationships between securities yields and yield-surrogates.Journal of Financial Economics . 6:103-126
Balvers RJ, Cosirnano TF, McDonald B (1990) Predicting stock returns in an efficient market. Journal of Finance 45:II 09-1135
Bank of Thailand (2000a) Economic conditions. Monetary Policy Group, BangkokBank of Thailand (2000b) Financial institutions and markets in Thailand.
http://www.bot.or.thBank of Thailand (2002) Roles of the bank of Thailand . http ://www .bot.or.thBanz RW (1981) The relationship between return and market value of common stocks .
Journal of Financial Economics 9:3-18Barndorff-Nielson OE, Nicalato E, Shephard N (200 I) Some recent developments in sto
chastic volatility modelling. Working Paper , University of Aarhus, DenmarkBerry M, Burmeister E, McElroy M (1988) Sorting out risks using known APT factors. Fi
nancial Analysts Journal 44:9---42Berument H, Kayimaz H (2001) The day of the week effect on stock market volatility.
Journal of Economics and Finance 25:181-193
190 Bibliography
Binswanger M (1999) Stock markets, speculative bubbles and economic growth. EdwardElgar Publishing, London
Black F (1986) Noise . Journal of Finance 41:529- 543Black F, Jensen MC, Scholes M (1972) The capital asset pricing model : some empirical
tests . In: M Jensen (eds) Studies in the theory of capital markets . Praeger, New York,pp 79-121
Black K, Eldredge D (2002) Business and economic statistics: using Microsoft EXCEL.South Western, Ohio
Bodie Z, Kane A, Marcus A (1993) Investment. Irwin, Cambridge, MassachusettsBolIerslev T (1986) Generalized autoregressive conditional heteroscedasticity. Journal of
Econometrics 31:307- 327Bond SR (200 I) The behavior of stock prices: lesson from current research on company in
vestment. Institute for Fiscal Studies and Nuffield College, OxfordBox GEP, Jenkins GM (1976) Time series analysis: forecasting and control. Holden Day,
San FranciscoBrigham EF, Gapenski LC (1994) Financial management: theory and practice . 7th edn,
Dryden Press, New YorkBrooks R et al. (2000) A multi-country study of power ARCH models and national stock
market returns . Journal oflnternational Money and Finance 19:377-397Brown SJ, Otsuki T (1990) Macroeconomic factors and the Japanese equity markets: the
CAPMD project. In: E Elton and M Gruber (eds) Japanese capital markets . Ballinger,New York
Butler KC, Malaikah SJ (1992) Efficiency and inefficiency in thinly traded stock markets :Kuwait and Saudi Arabia . Journal of Banking and Finance 16:97-201
CabelIo A, Ortiz E (2002) Day of the week and month of the year anomal ies at the Mexicanstock market. Paper presented to International Trade and Finance Association,Ramkhumhang University, May, Bangkok
Campbell JY, Shiller RJ (1987) Cointegration and tests of present value models . Journal ofPolitical Economy 95:1062-1088
CampbelI JY, Lo AW, MacKin lay AC (1997) The econometrics of financial markets .Princeton University Press, New Jersey
Charemza W, Deadman DF (1995) Speculative bubbles with stochastic explosive roots: thefailure of unit root testing . Journal of Empirical Finance 2:153-163
Charest G (1978) Split information, stock returns and market efficiency. Journal of Financial Economics 6:265-330
Chen H, Singal V (2001) What drives the January effect? Working Paper, Merrick Schoolof Business, University of Baltimore, Baltimore
Chen NF (1983) Some empirical tests of the theory of arbitrage pricing . Journal of Finance38:1393-1414
Chen NF, RolI R, Ross S (1986) Economic forces and the stock market. Journal of Business59:83-403
Cheng ACS (1995) The UK stock market and economic factors: a new approach. Journal ofBusiness Finance and Accounting 22:129-142
Chew DH (1997) Introduction: financial innovation in the 1980s and I990s . Irwin MeGraw-Hill, New York
Chia SY, Pacini M (1997) ASEAN in the new Asia: issues and trends . Working Paper , Institute of Southeast Asia Studies, Singapore
Chiat HS, Finn FJ (1983) Random walks on the stock exchange of Singapore. Accountingand Finance 23:81-87
Clarke M, Islam SMN (2004) Economic growth and social welfare: operationalising socialchoice theory. North HolIand, Amsterdam
Bibliography 191
Cooper JCB (1982) World stock markets: some random walk tests. Applied Economics14:515-531
Cowles A (1933) Can stock market forecasters forecast? Econometrica 1:309-324Cross F (1973) The behaviour of stock prices on Friday and Monday. Financial Analyst
Studies 29:67-69CSES (Center for Strategic Economic Studies) (1998) Crisis in East Asia: global watershed
or passing storm? Conference Report , Victoria University, MelbourneCuthbertson K (1996) Quantitative financial economics : stocks, bonds, foreign exchange.
John Wiley and Sons, LondonDabek RA (1999) Valuation of a technology. Intellectual Property Licensing Seminar, Uni
versity of Dayton School of Law, Dayton, Ohio,http://www.udayton.edu/-lawtech/cle99Iic-dabek
Dhakal D, Kandil M, Sharma SC (1993) Causality between the money supply and shareprices: a VAR investigation . Quarterly Journal of Business and Economics 32:52-74
Diba B, Grossman H (1988) Explosive rational bubbles in stock prices. American Economic Review 78:520-530
Ding Z, Granger CWJ (1996) Modeling volatility persistence of speculative returns: a newapproach . Journal of Econometrics 73:185-215
Ding Z, Granger CWJ, Engle RF (1993) A long memory property of stock market returnsand a new model. Journal of Empirical Finance 1:83-106
Dixon C (1999) The development implications of the Pacific Asian crises: the Thai experi-ence. Third World Quarterly 20:439--452
Eatwell J, Milgate M, Newman P (1990) Time series and statistics. Macmillan, LondonEatwell J, Milgate M, Newman P (1987) Finance. Macmillan, LondonEMEAP (2002) Financial markets and payment systems in EMEAP economies.
http://www.emeap.org :8084/RedBook!Engle RF (1982) Autoregressive condit ional heteroscedasticity with estimates of the vari
ance of United Kingdom Inflation. Econometrica 50:987-1007Fama EF (1990) Stock returns, expected returns, real activity. Journal of Finance 45:1089
1108Fama EF (1965) The behaviour of stock market prices. Journal of Business 38:34-105Fama EF (1970) Efficient capital markets : a review of theory and empirical work. Journal
of Finance 25:383--417Fama EF (1976) Foundations of finance. Basic Books, New YorkFama EF (1981) Stock returns, real activity, inflation, money. American Economic Review
71:545-565Fama EF (1991) Efficient capital markets: II. Journal of Finance 96:1575-1617Fama EF, French K (1988) Dividend yields and expected stock returns . Journal of Financial
Economics 22:3-25Fama EF, French KR (1989) Business conditions and expected returns to stocks and bonds.
Journal of Financial Economics 25:23-50Fama EF, French KR (1992) The cross-section of expected stock returns. Journal of Fi
nance 50:131-155Fama EF, French K, Booth D, Sinquefield R (1993) Differences in the risks and returns of
NYSE and NASD stocks. Financial Analysts Journal 49:37--41Fifield S, Power D, Sinclair C (2002) The role of economic and fundamental factors in
emerging market share return. Paper presented to International Trade and Finance Association , Ramkhumhang University, May, Bangkok
192 Bibliography
FitzHerbert R (1998) Blueprint for investment: a long term contrarian approach. 2nd edn,Wrightbooks, Victoria
Fox J (2001) When bubbles burst. Fortune, 29 MayFranses PH, Dijk D (2000) Non-linear time series models in empirical finance. Cambridge
University Press, LondonFrench KR (1980) Stock returns and the weekend effect. Journal of Financial Economics 8:
Journal of Financial Econometrics 19:3-30Friend I, Blume M, Crockett J (1970) Mutual funds and other institutional investors: a new
perspective . McGraw-Hill, New YorkFry MJ (1995) Money, interest, banking in economic development. 2nd edn, The Johns
Hopkins University Press, BaltimoreFung HG, Lie CJ (1990) Stock market and economic activities : a causal analysis . In: SG
Rhee and RP Chang (eds) Pacific-basin capital markets research . Elsevier Science,Amsterdam
Fung L (2001) Time series analysis of rational speculative bubble : a simulation experiment.Working Paper, Department of Management, Birkbeck College, London
Gay GD, Kolb RW (1984) International finance: concepts and issues. Prentice Hall, Virginia
Gibbons MR, Hess P (1981) Day of the week effects and asset returns. Journal of Business54:579-596
Glosten L, Jagannathan R, Runkle D (1993) Relationship between the expected value andthe volatility of nominal excess return on stocks. Journal of Finance 48:1779-180I
Gourieroux C, Jasiak J (2001) Financial econometr ics: problems, models, methods . Prince-ton University Press, New Jersey
Grabbe JO (1996) International financial markets. Prentice Hall, New JerseyGujarati DN (2003) Basic econometrics. McGraw-Hill , New YorkHansen PR, Lunde A (2001) A comparison of volatility models: does anything beat a
GARCH(I,I). Working Paper, Centre for Analytical Finance, University of Aarhus,Denmark
Harman YS, Zuehlke TW (2001) Testing for rational bubbles with a generalized WeibullHazard. Working Paper, Department of Finance, Miami University, Oxford
Harvey CR (1991) The world price of covariance risk. Journal of Finance 46:111-157Harvey CR (1995a) Predictable risk and returns in emerging markets. Review of Financial
Studies 8:773-816Harvey CR (1995b) The risk exposure of emerging equity markets. The World Bank Eco
nomic Review 12:19-50Henke H (200 I) Tax-selling and window dressing : an investigation of the January effect on
the Polish stock market. Working Paper, Department of Economics, Europa University, Viadrana, Germany
Ho YK (1990) Stock return seasonalities in Asia Pacific markets. Journal of InternationalFinancial Management and Accounting 2:44-77
Ho YK (1991) The Hong Kong financial system. Oxford University Press, New YorkHossain A, Chowdhury A (1996) Monetary and financial policies in developing countries:
growth and stabilization . Routlege, LondonHunt B, Terry C (2002) Financial institutions and markets. 3rd edn, Nelson, MelbourneIkenberry D, Rankine G, Stice EK (1996) What do stock splits really signal? Journal of Fi
nance 48:65-91IMF (International Monetary Fund) (2002) International financial statistics . CD-Rom,
Washington DC
Bibliography 193
International Financial Risk Institute (2001) Background to the financial and economic turbulence of 1997-1998. http://newrisk.ifc Lch/145900.htm
Islam S (2001) Applied welfare economics: measurement and analysis of social welfare byeconometric consumption models. Research Monograph 112001, CSES, Victoria University, Melbourne
Islam S, Oh KB (2000) Econometric analyses of e-commerce stocks: valuation, volatilityand predictability. Seminar paper, CSES, Victoria University, Melboume
Islam S, Oh KB (2003) Applied financial econometrics in e-commerce . Contributions toEconomic Analysis, North Holland Publishing, Amsterdam
Islam S, Watanapalachaikul S (2002a) Financial issues in the developing economy: an empirical investigation of the Thai telecommunications sector. Paper presented to International Trade and Finance Association , Ramkhumhang University, May, Bangkok
Islam S, Watanapalachaikul S (2002b) Financial market and reform strategy in developingcountries : a case study of the Thai telecommunication sector. Paper presented to Economic Recovery and Reform, Thammasart University, October, Bangkok
Islam S, Watanapalachaikul S (2002c) Stock valuation in a developing economy: a casestudy of Thai telecommun ications stocks. Paper presented to Asia Pacific Economicsand Business Conference, October, Sarawak
Islam S, Watanapalachaikul S (2002d) Time series financial econometrics of Thai stockvaluation . Seminar paper, September, Victoria University, Melbourne
Islam S, Watanapalachaikul S (2003) Time series financial econometrics of the Thai stockmarket: a multivariate error correction and valuation model. Paper presented to GlobalBusiness and Economic Development, Asian Institute of Technology, January, Bangkok
Islam S, Oh KB, Watanapalachaikul S (2001) Empirical characterization and financial issues of the Thai telecommunication industry. Seminar paper, November, Victoria University, Melbourne
Islam S, Oh KB, Watanapalachaikul S (200Ia) Stock valuation : a case study of the Thaitelecommunication industry. Seminar paper, July, Victoria University, Melbourne
Jaffe JR (1974) Special information and insider trading. Journal of Business 47:41Q-428Jaffe JR, Westerfield R (1985) The weekend effect in common stock returns: the interna
tional evidence. Journal of Finance 40:433-454Jegadeesh N, Titman S (1993) Returns to buying winners and selling loosers: implications
for stock market efficiency . Journal of Finance 48:65-91Jensen M (1978) Some anomalous evidence regarding market efficiency . Journal of Finan
cial Economics 12:33-56Jensen M, Ruback RS (1983) The market for corporate control : the scientific evidence .
Journal of Financial Economics 11:5-50Jiang GJ (1998) Stochastic volatility and option pricing. In: J Knight, S Satchell, Forecast
ing volatility in the financial markets. Reed Educational and Professional Publishing,Oxford
Juttner DJ, Hawtrey KM (1997) Financial markets: money and risk. 4th edn, AddisonWesley Longman, Melbourne
Keane S (1983) Stock market efficiency. Phillip Allan Publishers, OxfordKeim DB, Staumbaugh RF (1984) A further investigation of the weekend effect in stock re
turns. Journal of Finance 39:818-835Kendall MJ (1953) The analysis of economic time series, part I : prices. Journal of the
Royal Statistical Society 96:11-25Kiranand S (1999) An investigation of Asian stock markets integration . Dissertation, Chu
lalongkorn University, Bangkok
194 Bibliography
Ko KS, Lee SB (1991) A comparative analysis of the daily behavior of stock returns : Japan,the US and the Asian NICs. Journal of Business Finance and Accounting 18:219-234
Koehler AB, Snyder RD (1999) Forecasting models and prediction intervals for the multiplicative Holt-Winters method. Working Paper, Monash University, Melbourne
Kwon CS, Shin TS, Bacon FW (1997) The effect of macroeconomic variables on stockmarket returns in developing markets. Multinational Business Review 5:63-70
Leightner JE (1999) Globalization and Thailand 's financial crisis. Journal of Economic Issues 33:367-373
Lewis S (1998) Banking system and capital market development: the case of Thailand . Malaysian Journal of Economic Studies 35:95-111
Lie F, Brooks R, Faff R (2000) Modelling the equity beta risk of Australian financial sectorcompanies . Australian Economic Papers 39:301-311
Lintner J (1965) The valuation of risky assets and the selection of risky investments instock portfolios and capital budgeting. Review of Economics and Statistics 47:13-37
Lo A (1996) Market efficiency: stock market behaviour in theory and practice. Edward Elgar Publishing , London
Madala GS (2001) Introduction to econometrics. 3rd edn, John Wiley and Son, West SussexMasuyama S, Vandenbrink D, Yue CS (1999) East Asia's financial systems: evolution and
crisis. Institute of Southeast Asian Studies, SingaporeMcConnell 11, Muscarella CJ (1985) Corporate capital expenditure decisions and the mar
ket value of the firm. Journal of Financial Economics 14:399-422McKinnon R (1973) Money and capital in economic development. Brookings Institution ,
WashingtonMcKinnon R (1976) Money and finance in economic growth development, Marcel Dekker,
New YorkMcQueen G, Thorley S (1994) Bubbles, stock returns, duration dependence. Journal of Fi
nancial and Quantitative Analysis 29:196-197Mctaggart D, Findlay C, Parkin M (1996) Macroeconomics . Addison-Wesley Publishing
Company, MelbourneMichaely R, Thaler R, Womack K (1995) Price reactions to dividend initiations and omis
sions: overreaction or drift? Journal of Finance 50:573-608Mills TC (1999) The econometric modelling of financial time series. Cambridge University
Press, CambridgeMishkin FS (1997) Understanding financial crises: a developing country perspective. The
International Bank for Reconstruction and Development, World Bank, Washington DCMishkin FS (1999) Lessons from the Thai Asian crisis. Journal of International Money and
Finance 18:709-723Moosa IA (2003a) International finance: an analytical approach. 2nd edn, McGraw Hill,
SydneyMoosa IA (2003b) International financial operations : arbitrage, hedging, speculation. Pal
grave, LondonMudholkar G et al.(1996) A generalization of the Weibull distribution with application to
the analysis of survival data. Journal of the American Statistical Association 91:15751583
Myrdal G (1981) Asian drama: an inquiry into the poverty of nations . In: MP Todaro (ed.)Economic development in the third world. 2nd edn, Longman, New York
Nasseh A, Strauss J (2000) Stock prices and domestic and international macroeconomic activity: a cointegration approach . The Quarterly Review of Economics and Finance40:229-245
Bibliography 195
Nassir A, Mohammad S (1987) The January effect of stocks traded at the Kuala Lumpurstock exchange: an empirical analysis. Hong Kong Journal of Business Management5:35-50
Nelson DB (1991) Conditional heteroskedasticity in asset returns: a new approach . Econometrica 59:347-370
Nikolova S (2002) Lecture notes on debt and money market. University of Florida, Gainesville
Nuntajindawat N (1995) The efficiency of the stock market in Thailand. Dissertation, AsianInstitute of Technology, Bangkok
Oh KB (200 I) An empirical analysis of financial issues in the Australian electronic commerce sector. Dissertation, Victoria University, Melbourne
Palepu K, Healy P, Bernard V (2000) Business analysis and valuation : using financialstatements. 2nd edn, South Western College, Ohio
Peirson G et al. (1995) Business finance. 6th edn, McGraw-Hill, SydneyPiero A (1996) Stock prices, production and interest rates: comparison of three European
countries with the USA. Empirical Economics 2:221-234Poon S, Granger C (2003) Forecasting volatility in financial markets: a review. Working
Paper, Strathclyde University, GlasgowPoterba J, Summers L (1986) The persistence of volatility and stock market fluctuations .
American Economic Review 76:1141-1151Pratt SP et aI. (1996) Valuing a business : the analysis and appraisal of closely held compa
nies. 3rd edn, McGraw-Hill , New YorkRappoport P, White E (1993) Was there a bubble in the 1929 stock market? Journal of Eco
nomic History 53:549-574Reinganum MR (1983) The anomalous stock market behavior of small firms in January:
empirical tests for tax-loss selling effects. Journal of Financial Economics 12:89-104Rodan G, Hewison K, Robison R (2001) The political economy of South-East Asia: con
flicts, crises and change. Oxford University Press, MelbourneRoll R (1983) The tum of the year effect and the return premia of small firms. Journal of
Portfolio Management 3:379-402Rosiff MS, Kenney WR (1976) Capital market seasonality: the case of stock returns. Jour
nal of Financial Economics 3:379-402Samuelson PA (I 965a) Proof that properly anticipated prices fluctuate randomly. Industrial
Management Review 6:41-50Samuelson PA (1965b) Rational theory of warrant pricing. Industrial Management Review,
SpringSchwert GW (1983) Size and stock returns, other empirical regular ities. Journal of Finan
cial Economics 12:3-12Schwert GW (1987) Effects of model specification on tests for unit roots in macroeconomic
data. Journal of Monetary Economics 20:73-103Schwert GW (1990) Stock volatility and the crash of 87. Review of Financial Studies 3:77
102Seyhun N (1986) Insiders' profits, costs of trading, market efficiency. Journal of Financial
Economics 16:189-212Sharma JL, Kennedy RE (1977) A comparative analysis of stock price behaviour on the
Bombay, London and New York stock exchanges . Journal of Financial and Quantitative Analysis 12:391-413
Sharpe RF (1964) Capital asset prices: a theory of market equilibrium under conditions ofrisk. Journal of Finance 19:425-442
Sharpe WF (1966) Mutual fund performance . Journal of Business, January
196 Bibliography
Sharpe WF, Cooper, GM (1972) Risk-return classes of New York stock exchange commonstocks. Financial Analysts Journal 28:46-54
Sharpe WF, Alexander G, Bailey J (1995) Investments. 5th edn, Prentice-Hall, New YorkSharpe WF, Alexander G, Bailey J (1999) Investments. 6th edn, Prentice-Hall, New YorkShaw E (1973) Financial deepening in economic development. Oxford University Press,
New YorkShiller R (1989) Market volatility, MIT Press, MassachusettsShiller R (1984) Stock prices and social dynamics . Brooking Papers on Economic Activity
2:457-498Siamwalla A, Vajragupta Y, Vichyanond P (1999) Foreign capital flows to Thailand: de
terminants and impact. Thailand Development Research Institute, BangkokStatman M (1988) Investor psychology and market inefficiencies. Equity Market and
Valuation Methods , The Institute of Chartered Financial Analysts, CaliforniaStiglitz JE (1993) The role of the state in financial markets. In Proceedings of the World
Bank Annual Conference on Development Economics, The World Bank, WashingtonDC
Stock Exchange of Thailand (2002a) Listed company info 1975-200 IStock Exchange of Thailand (2002b) http://www.set.or.thSukhamongkhon S (1994) A test of microeconomic factors on the stock exchange of Thai
land using the APT model. Dissertation, University of Birmingham, BirminghamTakagi S (2002) Fostering capital markets in a bank-based financial system: a review of
major conceptual issues. Asian Development Review 19:67-97Tan A, Kapur B (1986) Pacific growth and financial interdependence. Allen and Urwin,
SydneyTemby C (1998) Technical analysis for trading index warrants . Wrightbooks, VictoriaThomas S (1995) An empirical characterisation of the Bombay stock exchange . Center for
Monitoring Indian Economy, University of Southern California, CaliforniaTirle J (1982) On the possibility of speculation under rational expectation . Econometrica
50:1163-1181Titman S, Wei K (1999) Understanding stock market volatility : the case of Korea and Tai
wan. Pacific-Basin Finance Journal 7:41-66Tongzon J (1998) The economies of South East Asia: the growth and development of
ASEAN Economies. Edward Elgar, MassachusettsWarr P (1996) Thailand's macroeconomic miracle: stable adjustment and sustained growth.
Oxford University Press, Kuala LumpurWatanapalachaikul S, Islam S (2004) Are emerging stock markets excessively volatile? A
study of the Thai stock market. Mimeo, Center for Strategic Studies, Victoria University, Melbourne
Watanapalachaikul S, Islam S (2004) Speculative bubbles in the Thai stock market: econometric tests and implications . Mimeo, Center for Strategic Studies, Victoria University,Melbourne
Watanapalachaikul S, Islam S (2004) The behaviour of an emerging financial market: atime series financial econometric analysis and implications. Mimeo, Center for Strategic Studies, Victoria University, Melbourne
Watsham TJ, Parramore K (1997) Quantitative methods in finance. Thomson Learning,London
West KD (1987) A specification test for speculative bubbles . Quarterly Journal of Economics 102:553-580
Wong KA, Kwong KS (1984) The behaviour of Hong Kong stock prices . Applied Economics 16:905-917
Wongbangpo P, Sharma S (2002) Stock market and macroeconomic fundamental dynamicinteractions: ASEAN-5 countries . Journal of Asia Economics 13:27-5 I
Working H (1934) A random-diffe rence series for use in the analysis of time series. Journalof the American Statistical Association 29: I 1-24
World Bank (1996) The World Bank Economic Review 10Worthington A, Higgs H (2001) A multivariate GARCH analysis of equity returns and
volatility in Asian equity markets. Discussion papers in economics , Finance, International Competitiveness, University of Queensland, Brisbane
Wu G, Xiao Z (2002) Are there speculative bubbles in stock markets? evidence from an alternative approach . Working Paper, University of Michigan Business School, Michigan
Wu Y (1997) Rational bubbles in the stock market: accounting for the US stock price volatility. Economic Inquiry 35:309-319
Yalawar YB (1988) Bombay stock exchange: rates of return and efficiency . Indian Economic Journal 35:68-121
Yu J (2002) Forecasting volatility in the New Zealand stock market. Applied FinancialEconomics 12:193-202
Yu J, Bluhm HW (2001) Forecasting volatility: evidence from the German stock market.Working Paper, Department of Economics, University of Auckland, Auckland
Dr. Sardar M. N. Islam is a director, Sustainable Growth Program, Victoria University, Australia. He is also associated with the Financial Modelling Programand the Law and Economics Program there. He has published 11 books andmonographs and more than 150 technical papers on Corporate Governance,Mathematical Finance, E-Commerce and Economics.
Dr. Sethapong Watanapalachaikul is a research officer at Victoria University,Australia. He has published several articles in empirical finance in the emergingfinancial markets.