56
Financial integration: Patterns, effects and challenges. Viktoria Hnatkovska UBC and Wharton School BREAD-IGC-ISI Summer School, Delhi July 23 2012
Financial integration:Patterns, effects and challenges.
Viktoria Hnatkovska
UBC and Wharton School
BREAD-IGC-ISI Summer School, DelhiJuly 23 2012

Introduction
New Delhi, March 2012: “Mr Kaushik Basu, chief economic advisor,ministry of finance, has said that time is ripe for India to go forgreater capital account convertibility to allow Indian enterprises totake advantage of the extremely cheap capital available globally.”
I Full current account convertibility
I Partial capital account convertibility
“Pre-mature capital account convertibility can harm economy: RBI”(2012)
“Among the components of capital flows, we prefer long-term flows toshort-term flows and non-debt flows to debt flows. Historically, wehave used policy levers on the debt side of the flows to managevolatility,” Mr. Subbarao said.” (WSJ, 2011)

Benefits of globalization: Traditional channels
I Effects of globalization on consumption volatility
I International risk-sharing: enables countries to smooth consumption
I Especially relevant in developing countries that face very volatileincome process
I Effects of globalization on productivity and growth
I Capital deepening: Greater access to capital
I More efficient allocation of capital: Reallocation of resources to mostproductive sectors and firms
I International risk-sharing and diversification:
I Allows for greater risk tolerance and promotes selection of higherreturn-higher risk projects
I Reduction in firm-specific investment risk spurs innovation andinvestment

Benefits of globalization: Collateral benefits
I Financial development:
I Strong link between financial development and long-termeconomic growth (studies by Ross Levine and co-authors)
I Institutional development
I Better governance:
I Foreign acquisitions of domestic firms spurs technologicaltransfer and improved governance
I Macroeconomic discipline: “Impossible trinity”

Costs of globalization
I Potential exposure to financial instability and crisis in its manyreincarnations:
I “sudden stop” of capital inflows
I current account reversals
I banking crisis
I Leads to an increase in volatility more generally
I Volatility in turn can hurt economic growth
I Speculative flows can magnify rather than reduce the adverseimpact of negative shocks on growth

Outline
I Measuring financial globalization
I Balance of payments accounting
I International investment positions
I Contrasting data patterns in advanced and developing countries
I Valuation effects
I Allocation of investment: Lucas’s paradox/allocation puzzle
I Fiscal and external balances: Twin deficits
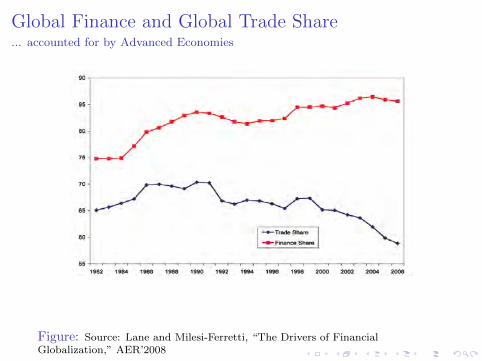
Global Finance and Global Trade Share... accounted for by Advanced Economies
Figure: Source: Lane and Milesi-Ferretti, “The Drivers of FinancialGlobalization,” AER’2008

Measuring financial globalization
I Explicit and implicit restrictions on capital movements
I IMF classification of capital account restrictionsI Chinn and Ito’ 2007
I Arbitrage gaps between domestic and foreign rates
I Volume-based measures:
I size of international balance sheet
I size of gross capital flows
I Volumes important in capturing international exposures andlinkages

Accounting
I Balance of Payments (BOP) records cross-border flows betweenresidents and non-residents
I Current Account (CA) accounts for flows of goods, services, factorincome
I Financial Account (FA) accounts for flows of financial assets
I Capital Account (CapA) accounts for flows of special categories ofassets, typically non-market, non-produced, or intangible assets likedebt forgiveness, copyrights, trademarks, assets of migrants
I International Investment Position (IIP) records cross-borderpositions of residents and non-residents
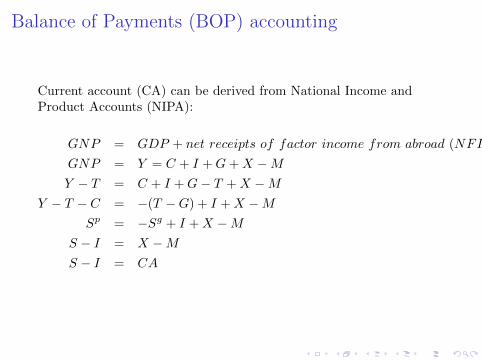
Balance of Payments (BOP) accounting
Current account (CA) can be derived from National Income andProduct Accounts (NIPA):
GNP = GDP + net receipts of factor income from abroad (NFI)
GNP = Y = C + I +G+X −M
Y − T = C + I +G− T +X −M
Y − T − C = −(T −G) + I +X −M
Sp = −Sg + I +X −M
S − I = X −M
S − I = CA
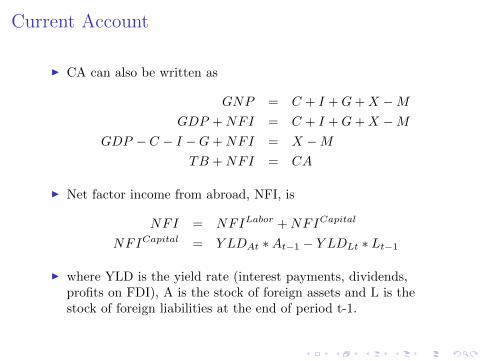
Current Account
I CA can also be written as
GNP = C + I +G+X −M
GDP +NFI = C + I +G+X −M
GDP − C − I −G+NFI = X −M
TB +NFI = CA
I Net factor income from abroad, NFI, is
NFI = NFILabor +NFICapital
NFICapital = Y LDAt ∗At−1 − Y LDLt ∗ Lt−1
I where YLD is the yield rate (interest payments, dividends,profits on FDI), A is the stock of foreign assets and L is thestock of foreign liabilities at the end of period t-1.
Current Account
I In a closed economy national savings always equal investment
I S = I
I wealth can increase only by accumulating new capital
I In an open economy wealth can be increased by either
I building up the capital stock
I acquiring foreign wealth
I A country with profitable investment opportunities does nothave to increase its savings, instead can borrow from abroad
I CA is important because it measures the size and direction ofinternational borrowing
I Such transactions are intertemporal in nature because representa trade-off of current consumption for future consumption.

Financial Account
I Financial Account (FA) can be written as:
FAt = FLOWLt − FLOWAt −NFLOWDERIV t
I where
FLOWAt = FLOWFDIAt + FLOWPEQ
At + FLOWPDAt
+FLOWODAt + FLOWRES
At
FLOWLt = FLOWFDILt + FLOWPEQ
Lt + FLOWPDLt
+FLOWODLt
NFLOWDERIV t = net acquisitions of derivatives

Balance of Payments
I The balance of payments must add up to zero
CA+ FA+ CapA = 0

International Investment Position
I India-owned assets abroad are:
At = FDIAt + PEQAt + PDAt +ODAt +RESAt +DERAt
I Foreign-owned assets in India are:
Lt = FDILt + PEQLt + PDLt +ODLt +DERLt
I Net international investment position (NIIP or NFA) is:
NIIPt = At − Lt
Stock-Flow relationship
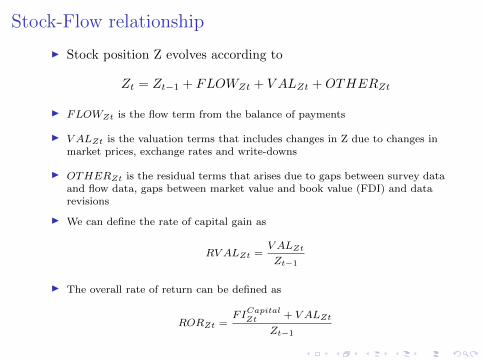
I Stock position Z evolves according to
Zt = Zt−1 + FLOWZt + V ALZt +OTHERZt
I FLOWZt is the flow term from the balance of payments
I V ALZt is the valuation terms that includes changes in Z due to changes inmarket prices, exchange rates and write-downs
I OTHERZt is the residual terms that arises due to gaps between survey dataand flow data, gaps between market value and book value (FDI) and datarevisions
I We can define the rate of capital gain as
RV ALZt =V ALZt
Zt−1
I The overall rate of return can be defined as
RORZt =FICapital
Zt + V ALZt
Zt−1

NIIP dynamics
I Change in NIIP between t and t-1 can be written as
NIIPt −NIIPt−1 = (At −At−1) − (Lt − Lt−1)
I or as
NIIPt −NIIPt−1 = NFLOWZt +NV ALZt +NOTHZt
I from BOP: NFLOWZt = CAt, assuming that CapA=0. Then:
NIIPt −NIIPt−1 = CAt +NV ALZt +NOTHZt
I writing out CA as the sum of TB and NFI we get
NIIPt −NIIPt−1 = TBt +NFIt +NV ALZt +NOTHZt
I Change in NIIP is a sum of: (i) trade balance; (ii) investmentincome; (iii) capital gains; (iv) residual
Valuation effects
Two strands of literature on valuation effects:
I Developing countries: Balance sheet losses due to depreciation
I Eichengreen and Hausmann (2005), Goldstein and Turner(2005)
I US: Capital gains due to dollar depreciation
I Lane and Milesi-Ferretti (research agenda); Gourinchas andRey (2007)

US Foreign Positions
0.1
.2.3
.4
1980 1990 2000 2010
FDI equity bonds
IFS: US International investment position at yearend (at market costs).
(a) US owned assets abroad, % GDP
0.2
.4.6
1980 1990 2000 2010
FDI equity bonds
IFS: US International investment position at yearend (at market costs).
(b) Foreign assets in US, % GDP

US Foreign Positions
−.3
0.3
.6.9
1.2
1.5
1980 1990 2000 2010
assets liab niip
IFS: US International investment position at yearend (at market costs).
Figure: US gross assets, liabilities and NIIP, % GDP
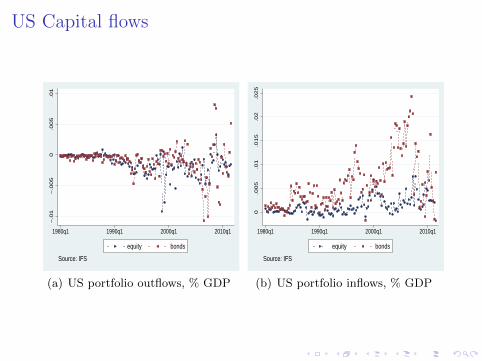
US Capital flows
−.0
1−
.00
50
.00
5.0
1
1980q1 1990q1 2000q1 2010q1
equity bonds
Source: IFS
(a) US portfolio outflows, % GDP
0.0
05
.01
.015
.02
.025
1980q1 1990q1 2000q1 2010q1
equity bonds
Source: IFS
(b) US portfolio inflows, % GDP
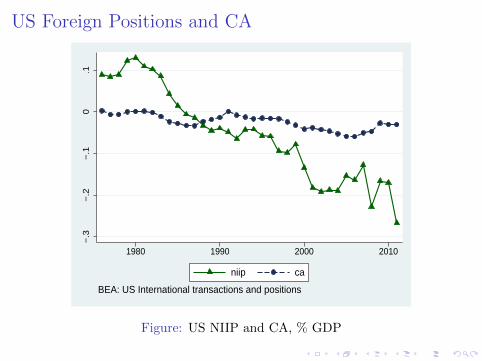
US Foreign Positions and CA
−.3
−.2
−.1
0.1
1980 1990 2000 2010
niip ca
BEA: US International transactions and positions
Figure: US NIIP and CA, % GDP

US Valuation effects
−1
00
−5
00
50
10
0fr
act
ion
19891990
19911992
19931994
19951996
19971998
19992000
20012002
20032004
20052006
20072008
20092010
2011
fin flow price exchange rate other
Figure: Changes in US NIIP, CA, and valuation effects

US Returns volatility
22
24
26
28
30
1989q3 1994q1 1998q3 2003q1 2007q3
Source: MSCI Global Equity Indices
(a) US equity return, %
1.5
22.5
33.5
1989q3 1994q1 1998q3 2003q1 2007q3
Source: IFS
(b) US bond return, %
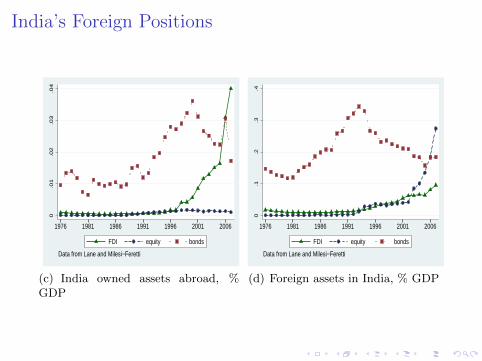
India’s Foreign Positions
0.0
1.0
2.0
3.0
4
1976 1981 1986 1991 1996 2001 2006
FDI equity bonds
Data from Lane and Milesi−Feretti
(c) India owned assets abroad, %GDP
0.1
.2.3
.4
1976 1981 1986 1991 1996 2001 2006
FDI equity bonds
Data from Lane and Milesi−Feretti
(d) Foreign assets in India, % GDP
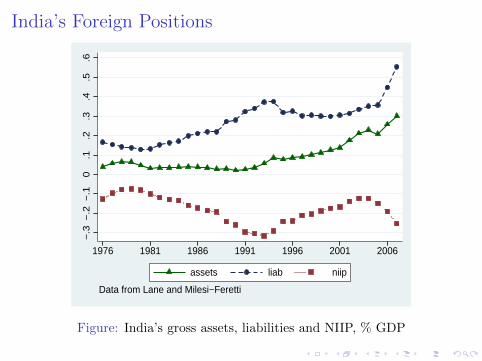
India’s Foreign Positions
−.3
−.2
−.1
0.1
.2.3
.4.5
.6
1976 1981 1986 1991 1996 2001 2006
assets liab niip
Data from Lane and Milesi−Feretti
Figure: India’s gross assets, liabilities and NIIP, % GDP

India’s Foreign Positions and CA
−.3
−.2
−.1
0
1976 1981 1986 1991 1996 2001 2006 2011
niip ca niip official
India’s International transactions and positions
Figure: India’s NIIP and CA, % GDP

India’s Capital Flows
−.0
20
.02
.04
1976 1981 1986 1991 1996 2001 2006 2011
foreign inv assistance debtRp debt service NRI deposits other
Source: India’s Balance of Payments
Figure: India’s capital flows, % GDP

NFA composition in developed and developing countriesMendoza, Quadrini, Rios-Rull AER’ 2008
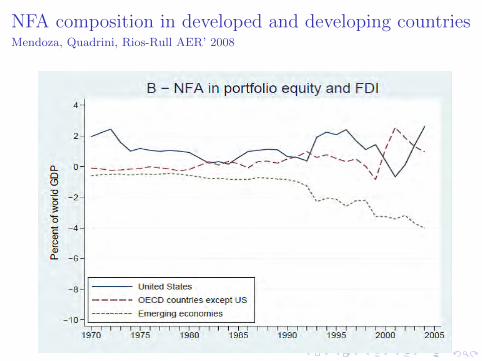
NFA composition in developed and developing countriesMendoza, Quadrini, Rios-Rull AER’ 2008

NFA composition in developed and developing countriesKose et al Fin Development’ 2007
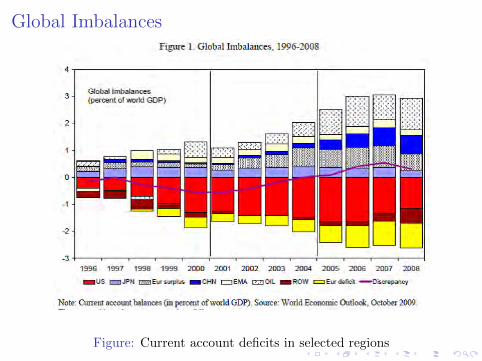
Global Imbalances
Figure: Current account deficits in selected regions

The Nature of Financial Globalization in DevelopedCountries
I Extensive cross-border trade among advanced economies
I Widespread financial innovations (ABS, hedge-funds, etc.)
I US emerges as the “world banker”: holds risky assets andriskless liabilities (long equity, short debt)
I potentially exposes itself to large valuation changes

The Nature of Financial Globalization in DevelopingCountries
I More cautious participation in financial innovations
I Currency risk is still significant
I Generally experienced improvements in NIIP
I Shift towards equity financing of liabilities (FDI, and especiallyportfolio equity)
I Accumulation of safe foreign assets (de-leveraging after the Asiancrisis)
I Long debt, short equity

Valuation effects as a risk-sharing mechanismGourinchas, Rey, Truempler JIE’ 2012

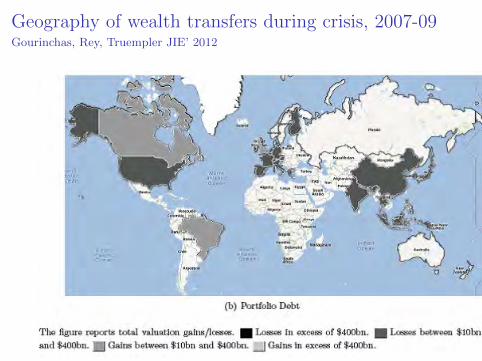
Geography of wealth transfers during crisis, 2007-09Gourinchas, Rey, Truempler JIE’ 2012

Geography of wealth transfers during crisis, 2007-09Gourinchas, Rey, Truempler JIE’ 2012
Geography of wealth transfers during crisis, 2007-09Gourinchas, Rey, Truempler JIE’ 2012

Geography of wealth transfers during crisis, 2007-09Gourinchas, Rey, Truempler JIE’ 2012

Geography of wealth transfers during crisis, 2007-09Gourinchas, Rey, Truempler JIE’ 2012

Geography of wealth transfers during crisis, 2007-09Bilateral valuation gains and losses on the net equity portfolio
Allocation of investment
I Neoclassical model predicts that countries that enjoy higherproductivity growth should receive more net capital inflows
I Data suggests the opposite pattern (Lucas AER’2000)
I Key question: Why doesn’t capital flow from less productive(rich) countries to more productive (poor) countries?
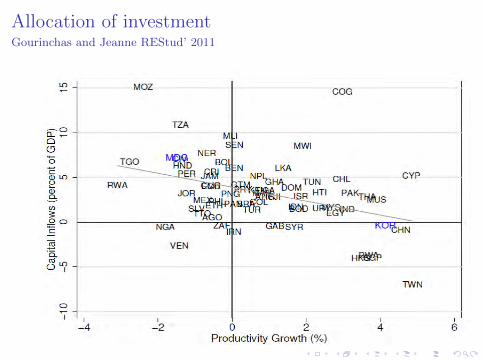
Allocation of investmentGourinchas and Jeanne REStud’ 2011

Private vs public flowsAlfaro, Kalemli-Ozcan, Volosovych WP’ 2011
I international capital flows net of government debt are positivelycorrelated with growth and allocated according to theneoclassical predictions
I international capital flows net of official aid flows, which aremostly accounted as debt, are also positively correlated withproductivity growth consistent with the predictions of theneoclassical model
I public debt flows are negatively correlated with growth only ifgovernment debt is financed by another sovereign and not byprivate lenders
I however, evidence on private flows and growth relationshipremains mixed.

Level of financial markets developmentMendoza, Quadrini, Rios-Rull AER’ 2008
I exists tremendous heterogeneity in the levels of domesticfinancial markets development across countries (risk and depth)
I this gaps persisted despite the globalization of capital markets
I model differences in domestic development as
I the agents’ ability to divert a fraction of their income: limits thefeasibility of state contingent contracts
I the ability to claim limited liability: restricts the capacity to borrow
I more financially developed economies see their NFA positionsdecline in the long-run
I more financially developed economies invest in foreign riskyassets and finances this investment with debt (i.e. US)
I its NIIP position features a large negative position in riskless bondsand a positive position in risky assets
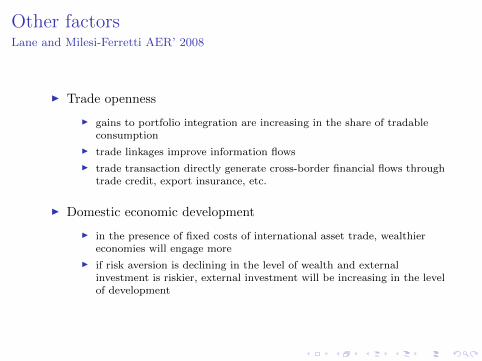
Other factorsLane and Milesi-Ferretti AER’ 2008
I Trade openness
I gains to portfolio integration are increasing in the share of tradableconsumption
I trade linkages improve information flows
I trade transaction directly generate cross-border financial flows throughtrade credit, export insurance, etc.
I Domestic economic development
I in the presence of fixed costs of international asset trade, wealthiereconomies will engage more
I if risk aversion is declining in the level of wealth and externalinvestment is riskier, external investment will be increasing in the levelof development
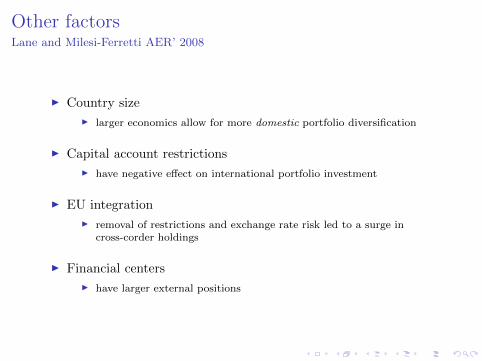
Other factorsLane and Milesi-Ferretti AER’ 2008
I Country size
I larger economics allow for more domestic portfolio diversification
I Capital account restrictions
I have negative effect on international portfolio investment
I EU integration
I removal of restrictions and exchange rate risk led to a surge incross-corder holdings
I Financial centers
I have larger external positions

Other factorsLane and Milesi-Ferretti AER’ 2008
Estimate the following reduced form specification:
Fi = α+ β1 ∗ TRADEi + β2 ∗ FINDEVi + β3 ∗GDPPCi + β4 ∗ POPi
+β5 ∗ CAPOPENi + β6 ∗ EURO + β7 ∗ FINCENTERi + εi
where
I F are financial asset and liability positions as a share of GDP
I TRADE is trade volume to GDP ratio
I FINDEV is the sum of stock market capitalization and bank depositsas a share of GDP
I CAPOPEN is the de jure index of capital account openness developedby Menzie Chinn and Hiro Ito (2007)

Determinants of external positionsLane and Milesi-Ferretti AER’ 2008
Twin Deficits: Fiscal and Current Account
I Recall one of the definitions of current account:
CA = Sp + Sg − I
I whereSg = T −G = Fiscal Balance
I Twin deficits: larger fiscal deficit, through its effect on nationalsaving, leads to a larger current account deficit.
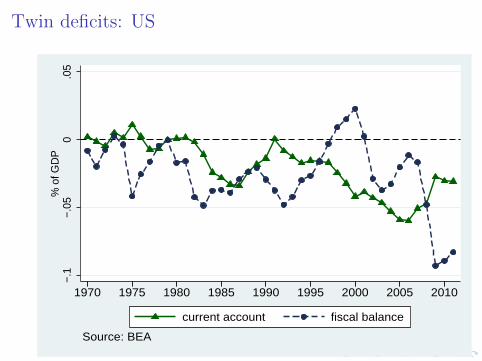
Twin deficits: US
−.1
−.05
0.0
5%
of G
DP
1970 1975 1980 1985 1990 1995 2000 2005 2010
current account fiscal balance
Source: BEA

Twin deficits: India
−.08
−.06
−.04
−.02
0.0
2%
of G
DP
1970 1975 1980 1985 1990 1995 2000 2005 2010
current account fiscal balance
Source: RBI
Twin Deficits: Changes in T
I Changes in lump-sum taxes: Ricardian Equivalence
I any tax cut is saved by private sector in anticipation ofhigher taxes in the future
I therefore, national savings remain unaffected by the timingof lump-sum taxes
Twin Deficits: Changes in G
I Changes in government spending
I temporary increase in government consumption reducesprivate consumption for a given Y
I consumption smoothing implies that the fall in privateconsumption is smaller than increase in public consumption
I therefore, both fiscal balance and current accountdeteriorate: twin deficits
Twin Deficits: Failure of Ricardian Equivalence
Failure of Ricardian Equivalence:
I households face borrowing constraints
I any tax cuts are consumed instead of saved
I exist intergenerational effects
I people that benefit from taxes are not the same who have to pay forthem in the future
I this reduces incentive to save tax cuts today
I taxes are not lump-sum, but distortionary
I lower taxes today reduce the relative price of current consumption interms of tomorrow’s consumption
I ... leading to higher current consumption
I therefore, both fiscal balance and current account deteriorate: twindeficits

Conclusion
I A dramatic increase in globalization and financial integration
I Shifting composition of countries’ NIIP
I Large valuation effects, especially during crisis
I Some evidence on “twin deficits”


