Benedict Koh, Olivia S. Mitchell, and Susann Rohwedder
Around the world, greater financial literacy has been shown to be associated with more
financial planning and saving, better investment behavior, and greater understanding of how to
manage retirement drawdowns (Lusardi and Mitchell, 2014). This is particularly important in view
of peoples’ increased responsibility to effectively plan for and manage their own retirement
savings and decumulation in the context of defined contribution plans. Unfortunately, several
studies have also found that financial knowledge is low among older adults, even in nations with
highly developed financial systems such as the UK and the US, as well as countries with less
sophisticated financial markets such as Russia (Lusardi and Mitchell, 2011a, b).
Until recently, Singapore was a country where financial literacy had been little analyzed,
notwithstanding the reality that it is one of the world’s most rapidly aging nations (Chan, 2001).
Moreover, Singaporeans must make a number of key financial decisions in connection with their
contributions to, investments in, and decumulation from, their nation’s mandatory pension scheme
known as the Central Provident Fund (CPF). On the one hand, one might anticipate that older
Singaporeans would be quite financially literate, having benefited from the country’s globally-
renowned educational system, top-ranked since the 1960s (OECD 2012). On the other hand, the
government has, since 1955, required participation in the CPF. If participants anticipated that their
CPF accounts would provide them security in retirement, they might not have been interested in
self-management nor invested in financial knowledge. Moreover, the diversity of backgrounds,
languages, and relatively-lower levels of education among the older Singaporean population could
imply lower levels of financial knowledge for this group (OECD 2016).
2
SMU Classification: Restricted
Accordingly, this paper reports the first analysis of older Singaporeans’ financial literacy
using a unique new dataset, the Singapore Life Panel (SLP®). With this nationally representative
survey, we can address three important questions. First, we analyze older Singaporeans’ levels of
financial knowledge and compare their results to findings from the U.S. Second, we examine the
empirical linkages between financial literacy, self-assessed retirement preparedness, and wealth
holdings in Singapore. Third, we evaluate the extent to which financial knowledge in Singapore is
associated with financial portfolio complexity among older individuals.
To preview our findings, we show that overall financial literacy among older adults in
Singapore is comparable to that of similar-aged persons in the United States. Interestingly, in
Singapore, financial literacy is higher for the 65-70 age group, compared to the age 50-54 reference
category. Better-educated people and those in better health are more financially knowledgeable,
while women as well as those in poor health are less financially informed. These results are similar
to those from other countries. We also show that close to half of older Singaporeans anticipate that
they will struggle in retirement (46%), and fewer than half say they are well prepared financially
for retirement (43%). In general, the more financially literate also have more confidence in their
knowledge about their household finances and are less worried about finances in retirement.
Finally, we evaluate the correlates of portfolio diversification among older Singaporeans. As we
have found in other countries, financial knowledge is associated with higher household net worth,
higher net financial wealth, and more net non-housing wealth. Overall, the financially savvy hold
more diversified and riskier portfolios. This is true even after controlling for education, indicating
that financial literacy plays a role independent of schooling in peoples’ portfolios.
3
SMU Classification: Restricted
In what follows, we first describe the dataset and then outline the empirical methodology
we use to answer our two questions. Next we present results. We conclude with a discussion of
further research questions deserving of attention.
The Singapore Life Panel (SLP®)
In this section we describe the Singapore Life Panel (SLP®), a high-frequency survey
underway since 2015 and fielded by the Centre for Research on the Economics of Ageing (CREA)
at the Singapore Management University.1 The SLP® is a longitudinal study of individual and
household circumstances and behavior in a representative cohort of Singaporean citizens and
permanent residents age 50-70 when first included in the survey in 2015. Monthly surveys are
ongoing.2 Designed with input from the creators of the US Health and Retirement Study (HRS),
several of the international sister studies of the HRS, the American Life Panel (ALP) at RAND,
and the Chilean Encuesta de Protección Social (EPS), the survey includes many state-of-the-art
and globally harmonized questions on health and health expenditures, wealth and investments,
expectations and preferences, consumption and spending, and other factors central to the
development of a broad-based survey useful for a wide range of economic, social, and other
analyses.
The SLP® is distinguished from other longitudinal studies by its large-scale monthly
frequency questionnaires delivered over the internet. The initial recruitment effort resulted in a panel
of 15,000 individuals from 11,500 distinct households who completed a baseline survey in May-July
1 For additional information on the SLP® see Vaithianathan et al. (2017). 2 All data are anonymized so no personal identification of individuals or households is feasible.
4
SMU Classification: Restricted
2015. Analysis of the panel along several dimensions has shown that it is closely representative of the
population, and attrition rates are low.3
Methodology
Our empirical analysis of portfolio complexity and financial literacy in the SLP® has
several components. First, we describe a module on financial knowledge that we designed and
implemented in the survey, informed by similar surveys in other nations. This module allows us
to evaluate older Singaporeans’ financial knowledge and to compare it to that of similar-aged
individuals in the United States. In addition, we are also able to relate financial knowledge to
respondent attributes, to determine what systematic patterns may be detected. Second, we relate
respondents’ anticipated retirement outcomes to their measured financial literacy. Third, we
examine the relationship between financial literacy and respondents’ wealth and portfolio
complexity.
Measures of Financial Knowledge. In this section we describe how we create the key financial
knowledge variables of interest. We posit that three key concepts lie at the root of economic saving
and investment decisions: (i) numeracy and capacity to do calculations related to interest rates; (ii)
understanding of inflation; and (iii) understanding of risk diversification (Lusardi and Mitchell
2008, 2011a, b). In our earlier work, we designed a set of “Big Three” questions around these ideas
and implemented them in numerous surveys in the United States and abroad.4 As implemented in
the Singapore Life Panel, the questions are as follows (correct answers in bold):
3 For additional information on the survey see https://crea.smu.edu.sg/singapore-monthly-panel. 4 As noted in Lusardi and Mitchell (2014), four considerations informed these questions. The first was simplicity, so
that the questions measured knowledge of the building blocks fundamental to decision-making in an intertemporal
setting. The second was relevance, so that the question had to relate to concepts pertinent to peoples’ day-to-day
financial decisions and capture general rather than context-specific ideas. The third was brevity; the number of
questions had to be kept short to secure widespread adoption. The fourth was that the questions had to be able to
differentiate financial knowledge so as to permit comparisons across people. These same questions were added to
5
SMU Classification: Restricted
• Suppose you had $100 in a savings account and the interest rate was 2% per year. After 5
years, how much do you think you would have in the account if you left the money to grow:
[more than $102, exactly $102, less than $102? Don’t know, refuse to answer.]
• Imagine that the interest rate on your savings account was 1% per year and inflation was
2% per year. After 1 year, would you be able to buy: [more than, exactly the same as, or less
than today with the money in this account? Don’t know; refuse to answer.]
• Do you think that the following statement is true or false? “Buying a single company stock
usually provides a safer return than a Unit Trust. [Don’t know; refuse to answer.]
The goal of the first question is to measure respondents’ understanding of a simple interest rate
calculation. The second assesses peoples’ understanding of inflation in the context of a simple
financial decision. The third is a joint test of knowledge of risk diversification and unit trusts or
mutual funds. Naturally the answer to this question requires knowledge of both what a stock is,
and that a unit trust (mutual fund) is comprised of many stocks.
Correlates of Financial Literacy. Table 1 provides summary statistics on responses in the SLP®
on the Big Three financial literacy questions in the first three rows.5 Here we report findings first
for the full sample (Panel A), and then for the subset of nonmarried persons alone (Panel B). While
the latter group is smaller, there is less possibility of confounding asset ownership as could be the
case with married households.
Table 1 here
In the first three rows of both panels, a correct answer has a value of 1 and any other answer
(incorrect or don’t know) is assigned a value of zero. Our tabulations indicate that, in the full
sample, 81% of older Singaporeans answered the interest rate question correctly, 72% answered
several other U.S. surveys thereafter, including the 2007–2008 National Longitudinal Survey of Youth (NLSY) for
young respondents (ages 23–28); the RAND American Life Panel (ALP) covering all ages; and the 2009 and 2012
National Financial Capability Study. They have been added to the PISA test run by the OECD to assess high school
students’ financial knowledge in more than a dozen countries to date. 5 Our sample consists of persons who were age 50-70 in Wave 5 and who answered financial questions in Waves 18
or 19. We use the latter two waves since those modules included detailed questions on asset allocation in peoples’
pension (CPF) accounts.
6
SMU Classification: Restricted
the inflation question correctly, and 47% responded to the risk diversification question correctly.
(In the nonmarried sample, results are similar though slightly lower, at 79%, 71%, and 44%). For
the FinLit index, which is the total number of questions each person answered correctly,
Singaporeans averaged around two of three correct answers (2.01 in the full sample, and 1.94 for
the nonmarrieds). It is worth noting that many respondents answered “do not know” to the last
question on risk diversification, suggesting that Singaporean respondents in their 50s and 60s are
not particularly well informed about stock risk and unit trusts.
Table 2 compares SLP® responses to the Big Three questions with those from another
survey of similar-aged adults in the United States, namely the American Life Panel (ALP)
conducted in 2011 (data are weighted). It should be noted that we elect to compare our results with
the ALP study as both are internet-based surveys. The table reveals that the SLP® respondents
scored slightly lower on the interest rate question than the ALP respondents (81% versus 87%).
Older Singaporeans also performed less well on the inflation question than the US survey (72% vs
86%). Interestingly, on the risk diversification question, both SLP® and ALP respondents were
markedly less accurate than on the other two questions (47% and 43%). For the full sample, the
Singaporean mean correct score on the FinLit index (2.01 out of 3 questions) was slightly lower
than the 2.16 average for ALP respondents in the U.S. of the same age.
Table 2 here
Next we provide estimates from a multivariate model of the Big Three questions as well as
the FinLit index, regressed on a vector of control variables (where Panel A includes the entire
sample and Panel B restricts the sample to nonmarried persons). Controls include the respondent’s
age, sex, marital status, education, health and other control variables commonly used in prior
variable in the first three cases is equal to 1 if the response was correct, and 0 otherwise; estimation
is by Probit. In the last column, the dependent variable is the total FinLit score; estimation is by
OLS. The coefficients on the age groups should be interpreted relative to the age 50-54 reference
group. A first point to note is that, in the full sample, only the 60+ age groups were statistically
significantly better-informed about interest rates than the younger groups (the effect is not
significant for the nonmarried group). Persons age 55+ were better informed about inflation than
the reference group, and those age 65-70 even more so, in the full sample. (Results for the
nonmarrieds are less robust, probably due to the smaller sample size). Knowledge about risk
diversification is not particularly age sensitive for either sample.
Table 3 here
Coefficients on the other correlates are also of interest. In the full sample, women scored
slightly worse on the risk diversification question, consistent with findings from similar surveys
elsewhere (Lusardi and Mitchell 2007). Nevertheless, women were not significantly different from
men in the nonmarried group. Marital status was never a significant discriminator in Panel A of
Table 3. Not surprisingly, the better-educated were all more financially literate than the reference
group (those with less than a secondary education); these effects are similar to those we have seen
in the US context and are consistent across the full sample as well as the nonmarried subgroup.
Being in fair or poor health was associated with being less informed about interest rate
compounding (in the full sample but not the single sample). This could arise if the less-healthy
6 A list of descriptive statistics on our sample appears in Appendix Table 1. In addition, we control on but do not report
coefficients for whether respondents indicate being employed, if they are homeowners, and whether they manage the
finances in their households (e.g., the respondent alone, the respondent along with another, usually the spouse, or the
spouse alone), as well as ethnicity. Additional results are available on request.
8
SMU Classification: Restricted
find the cost of investment needed to learn about financial matters simply too great (or offers a
lesser payout). Results also show that, in all groups, homeowners were better informed about
financial matters.7
Results: Financial Literacy and Key Outcome Measures
Anticipated Retirement Preparedness. To evaluate whether financial literacy is associated with
how older Singaporeans assess their own financial situation in retirement, Table 4 focuses on two
key outcomes. First we examine respondents’ self-assessed chances of struggling financially in
retirement, and the full sample (and nonmarried) mean was 46%. Second we asked people to assess
the quality of their financial preparedness for retirement. Possible answers were excellent, very
good, good (all three coded as equal to 1), or fair or poor (coded as equal to 0). Here some 43% of
all respondents indicated they were in the good or better category; in the nonmarried sample this
was the case for 39%. A multivariate analysis of these two measures of expected retirement
wellbeing is provided in Table 4, with Panel A covering the full sample estimates and Panel B the
nonmarried group alone.
Table 4 here
Not surprisingly, we find that people scoring higher on the FinLit questions feel they are
less likely to face financial struggles in retirement and more likely to indicate they are financially
well prepared for retirement. Interestingly, the effect in the full sample is less pronounced than
7 In work not reported here in detail, we also analyzed which respondents gave a “don’t know” answer versus a wrong
one, or a “correct” answer versus a wrong one. Factors most strongly associated with people responding “don’t know”
were relative youth (older people were better informed about interest rates and risk diversification); being less
educated (better educated respondents were more likely to be correct and less likely not to know correct answers to
all three questions); and owning a home (those who own homes were less likely to say “don’t know).” As in other
cross-national comparative studies, women were more likely to say they “don’t know” than men, particularly about
stock market diversification (Lusardi and Mitchell 2014). This could imply that women would be more welcoming to
financial education efforts, as they are less confident in their knowledge.
9
SMU Classification: Restricted
that for the nonmarried sample alone. This is plausible because in couples both spouses may
influence the financial decision making of the household, hence reducing the influence of just the
respondents’ own FinLit, whereas in nonmarried households the involvement of another person
tends to be rare. It is also interesting to note that the respondents age 60-70 were more financially
confident than their younger counterparts, probably due to the recently-introduced Silver Support
program targeted at the elderly poor in Singapore.8 Better-educated respondents were substantially
more optimistic about their retirement prospects, and women were also relatively less concerned
about retirement struggles. Those expressing most concern were those in fair or poor health, who
were much less optimistic on both metrics. Results are comparable across the full sample and the
nonmarried groups.
Household Portfolios and Financial Literacy. Several measures of household wealth are
available in the SLP®, three of which we relate to our financial literacy index. The most
comprehensive measure we call total net wealth; this includes total household wealth inclusive of
pensions, financial wealth, bank accounts, insurance, vehicles, primary and any secondary
residences and net of debt. The second measure which we call total non-housing wealth excludes
from the previous measure all housing assets and debt. The third measure, net financial wealth,
excludes pension assets from the previous measure.9
Table 5 summarizes results of multivariate linear regression models analyzing the
association between financial literacy and household wealth in the older Singaporean population.
As before, we control on age, sex, marital status, education, self-reported health, etc., 10 and Panel
8 See for instance Chen and Tan (2017). 9 In the dataset these variables are named HaTotbw, HaTotnw, and HaTotfw, devised under the direction of the RAND
team, particularly Susann Rohwedder. 10 In sensitivity analysis we also controlled on the respondent’s self-assessed confidence regarding knowledge to report
on household’s financial matters, an indicator of the respondent having a 5+ year planning horizon, and indicators of
the respondent’s risk preferences (one regarding general risks, and the second regarding financial risks). Results are
qualitatively similar.
10
SMU Classification: Restricted
A reports findings for the full sample, while Panel B for the nonmarried group only. Results for
the full sample strongly confirm the economically meaningful and statistically significant
relationship between financial knowledge and household wealth (expressed in S$100,000). For
instance, if a respondent scored one additional correct answer to the FinLit questions versus the
mean, this was associated with around 16% more total net wealth, 30% more net financial wealth,
and 23% more nonhousing wealth.11 The qualitative results for the nonmarried sample are
qualitatively similar, though the FinLit score was statically significant only for net financial
wealth: one additional correct answer to the FinLit questions here would be associated with a 23%
more net financial wealth.
Table 5 here
Besides the FinLit coefficients, other controls behave as expected. For instance, in all cases
and for both samples, having more education is associated with more wealth (however defined).
Thus we confirm that in the SLP®, more financial knowledge is associated with substantially
higher household wealth, regardless of whether we focus on the broadest measure available, or
look instead at narrower measures such as non-housing and financial wealth.
Measures of Portfolio Complexity. SLP® respondents were also asked the details of the asset
allocation of their investments. For the analysis below, we distinguish two broad categories of
portfolio holdings: assets held outside respondents’ CPF accounts, and assets held inside their CPF
accounts.12 In addition, we develop a total number of complex asset holdings measure, which is
the sum of the total number of complex assets held outside and inside respondents’ CPF accounts.
11 See for instance Behrman et al. (2012). 12 For non-CPF assets, we sum each age-eligible respondent’s holdings plus those of the spouse, if any, to obtain
household non-CPF assets; for some assets we cannot disentangle ownership, notably those that tend to be jointly held
by spouses of a couple, like homes. For CPF assets, the respondent reports own CPF balances and—in separate survey
questions—the CPF balances of the spouse (if any). The respondent was also asked to provide the details of his or her
own CPF investment allocations. However, with respect to the spouse’s CPF investment allocations the respondent
was only asked to provide the fraction of the CPF balance held in shares. Accordingly, our variable measuring
11
SMU Classification: Restricted
We also distinguish people’s allocations to what we term to be noncomplex versus complex
holdings in each of the two asset locations. For nonpension accounts, we define noncomplex
investments as including an owner-occupied home, a checking/saving bank account, a vehicle, any
fixed-term deposits, bonds, and whole life insurance. Complex nonpension assets include own
businesses, investment property, shares/stock funds, gold/gold funds, managed accounts, and
mutual funds/unit trusts. We categorize CPF holdings according to whether people left their CPF
retirement funds in their default account invested by the government, or whether they moved their
money to “permitted” assets managed by non-government entities via the CPF Investment Scheme
(CPFIS). In prior work, Koh et al. (2008a and b, 2010) reported that many CPF participants left
their retirement assets to be managed by the CPF since their net-of-expense returns are perceived
to be safer, and often higher than, those earned from investing in relatively expensive and riskier
non-CPF products.13 Nevertheless, several products available under the CPF IS may be attractive
to savers willing to take additional risk including gold ETFs and gold certificates, investment-
linked insurance products, annuities, government-guaranteed and statutory board bonds, unit
trusts, and property funds.14 For this analysis, we classify as noncomplex CPF assets money
managed by the CPF, and as complex CPF assets those held in CPF-Investment Scheme (IS)
accounts.
Table 6 reports coefficient estimates from multiple regression analyses of the number of
complex assets held inside and outside respondent CPF accounts, as well as for the full portfolio
household CPF total complex holdings sums the respondent’s complex investments and the spouse’s share CPF
investments. 13 This was confirmed in a recent CPF Advisory Panel report showing that the funds permitted under the investment
scheme remain expensive by international standards; see
inclusive of both pension and nonpension accounts. Findings for the full sample as well as
nonmarried respondents alone are presented separately, as before. It should be noted that the
portfolio holdings are drawn from survey responses, so they represent what people reported and
presumably believed they owned. In future work, we hope to compare these self-reports with
administrative records.15
Table 6 here
The row labeled Dep Var Mean indicates that older Singaporeans held relatively few
complex assets overall, namely an average of 0.7 per respondent in the full sample (and 0.6 in the
nonmarried group). Nevertheless there is important variation inside and outside the CPF accounts,
since people averaged 0.5 complex nonpension assets, but only 0.2 inside their pension accounts.
These results confirm earlier evidence that older respondents tend to keep their pension money in
what they consider to be a safe government-invested account. Consistent with expectations,
estimated coefficients on the FinLit variable in Table 6 show that the more financially
knowledgeable did hold a statistically significantly higher number of complex assets.16 Being able
to answer one additional financial question correctly is associated with 0.17 more complex assets
overall (a difference of almost 25%). We also see that older Singaporeans (age 60-70) held fewer
complex assets in their pension accounts than the reference group, while in their non-CPF accounts
they held—if anything—slightly more complex assets than their younger counterparts, however
these estimates are not statistically significant at the 5-percent level. Across the board, better-
15 In Chile, for instance, respondent self-reports of pension accumulations and investments can be compared with
evidence from administrative data. We found that people tend to report contributing more than they actually do over
their lifetimes, though account balances were relatively accurate for those who were willing to report a pension fund
balance (Arenas et al. 2008). Nevertheless only 40% of the respondents could provide an estimated balance in the
Chilean context. In the SLP, the response rates on CPF account balances are much higher, ranging between 86 and 92
percent, if counting only continuous reporters, and even a little higher when taking into account bracketed responses.
These higher item-response rates are likely due to the self-administered nature of the survey and the careful survey
design. 16 This accords with U.S. data from Clark et al. (2015).
13
SMU Classification: Restricted
educated individuals held more complex assets, and the association is quantitatively large and
statistically significant. Persons in poor health held fewer complex assets across the board, while
married persons were less diversified in their CPF accounts.
A similar story is told by Table 7, where the dependent variables focus on the share of each
wealth type held in complex assets. Again, the FinLit score is consistently statistically significant
and positive for both samples examined, confirming that those with more financial knowledge held
much larger shares of their net wealth in complex assets. Overall, a one-point higher FinLit score
is associated with a 2.0 percent higher share held in complex assets in the full sample, a
quantitatively large (32%) result compared to the mean (6.1). As above, the older age groups (60-
70) had lower complex shares in their pension accounts but not outside their pensions, and better-
educated respondents had much higher complex wealth shares. Results were similar for the
nonmarried subset.
Table 7 here
Portfolio Diversification: Risky and Equity Share. The data also permit us to evaluate how
older Singaporeans allocate their pension and nonpension investments to risky assets and to
equities. We define someone as diversified if he holds equity/stocks, fixed-income/bonds, and
cash.17 We also compute whether the respondent’s risky share of assets falls within +/-10% of the
17 A respondent’s risky share is defined as the value of his stocks/shares, unit trusts, mutual funds, investment-linked
products, ETFs, properties, and gold, as a ratio of his total wealth (see Table 7). This is a composite of a variable
HoldRisk = 1 if a respondent held any risky assets (defined as any common stocks/shares, unit trusts, mutual funds,
investment-linked investments, ETFs, properties, gold), 0 otherwise; a variable HoldEquity = 1 if the respondent held
equity (defined here as any common stocks/shares, unit trusts, mutual funds, investment-linked investments, ETFs,
gold), 0 otherwise; a variable HoldFI=1 if a respondent holds corporate bonds, treasury bonds, Singapore savings
bonds, endowment policies (life insurance), etc; and a variable HoldCash = 1 if the respondent held bank checking
account, savings account, time or fixed deposits, 0 otherwise. If a respondent’s wealth was less than $1,000, we
dropped the observation; thus 287 observations were omitted for total wealth, 1,672 for financial wealth, and 421 for
nonhousing wealth.
14
SMU Classification: Restricted
fraction conventionally recommended by financial advisors, namely 100 minus his age.18 A
comparable measure focuses more narrowly only on the respondent’s equity share.19 Additionally,
we can evaluate whether a respondent’s risky share is close to (again, within +/- 10%) the age-
appropriate fraction implied by the glide path of a conventional Target Date Fund (TDF) such as
that offered by Vanguard (see Figure 1).20 This variable is defined over net financial wealth. Table
8 provides results regarding whether portfolios were within the 10% of the 100-Age Rule of
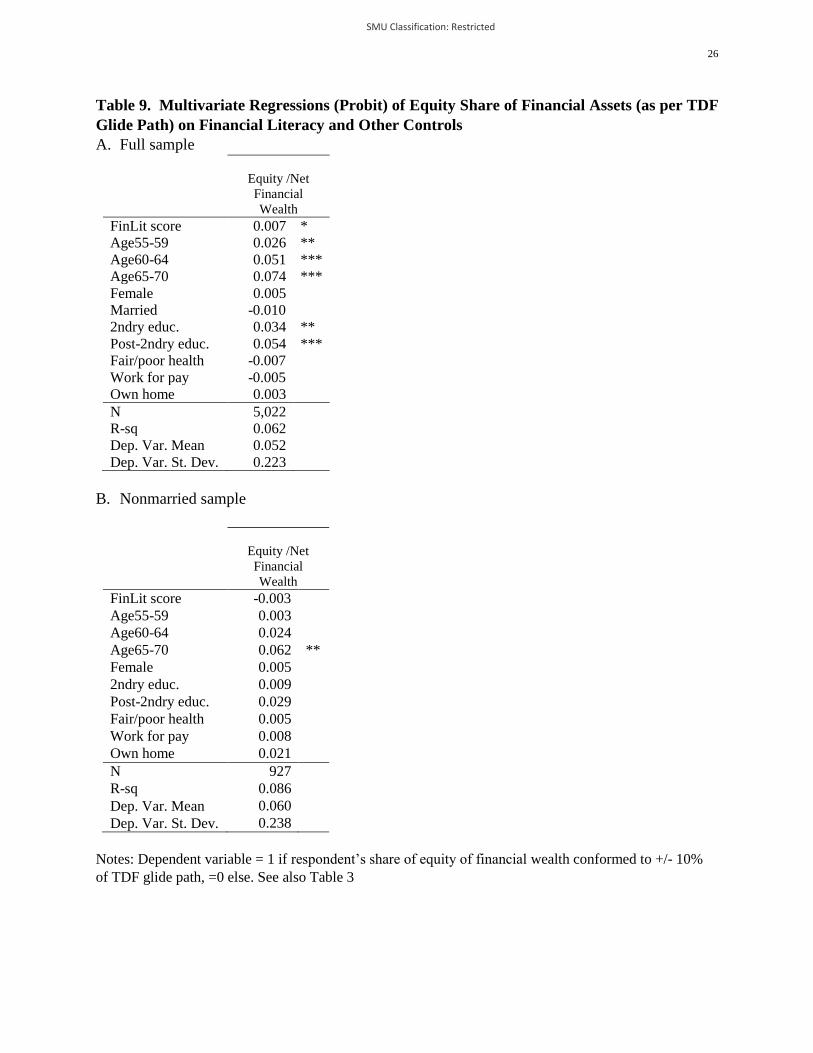
Thumb, while Table 9 shows factors associated with whether the respondent’s investment portfolio
was within the conventional TDF glide path described above.
Figure 1 and Tables 8 and 9 here
Focusing first on Table 8, we see that around one-third (33.1%) of all SLP® respondents
held cash, stocks, and bonds, and hence they were diversified in this basic way. About 8% of the
full sample held a risky share of financial assets that approximately met the 100-Age Rule of
Thumb. For the nonmarried sample this was also about 8%. We note that diversification, as defined
in Table 8, is strongly positively associated with the FinLit score: for instance the coefficient in
the first row and column of Panel A indicates that people in the full sample who answered one
additional FinLit question correctly were 8 percentage points more likely to be diversified, or 24%
higher than the mean. For the nonmarried sample the estimates were closely comparable.
Continuing on to an assessment of the respondent’s risky share of financial wealth, we find a
positive association with FinLit overall (in the nonmarried sample the estimate was not statistically
18 A respondent’s risky share is defined as the value of his stocks/shares, unit trusts, mutual funds, investment-linked
products, ETFs, properties, and gold, as a ratio of his total wealth (see Table 7). 19 The respondent’s equity share is defined as the value of common stocks/shares, unit trusts, mutual funds, investment-
linked investments, and ETFs, to the total wealth measure (see Table 7). 20 Target Date Funds recommend that people invest more in equity when young, and less (following a glide path)
when older. In the figure above, the fraction is 90% to age 40, declining at 1.5% per year of age to 60% at age 60,
declining by 2% per year of age to 50% at age 65, declining 2.9% per year of age to 40% at age 72, and flat after age
72 at 30%.
15
SMU Classification: Restricted
significant). We conclude that the financially savvier were more likely to have portfolios that
rebalanced according to the 100-age rule. It is interesting that these effects remain strong and
statistically significant despite controlling for education (which is also positive and statistically
significant).
Table 9 shows which respondents held portfolio investments conforming to the Target Date
Fund glide path benchmark described above. Here we see that only 5% of respondents in the full
sample indicated that they held an equity share of financial wealth that was in line with (+/- 10%)
of the TDF guideline; in the nonmarried sample this was the case for 6%. Interestingly, the
coefficient on the FinLit index is not statistically significant here at conventional levels, indicating
that financially savvy Singaporeans do not follow the Target Date profile when allocating their
asset portfolios. There is evidence, however, that older and better-educated respondents invested
along what could be called a TDF glide path more closely.
A Comment on Causal Relationships versus Associations
Thus far we have framed our discussion in terms of associations rather than causal
relationships. This is because an economic model of lifecycle consumption, saving, investment,
and retirement would posit that rational and well-informed individuals will arrange their optimal
behavior in ways that smooth their marginal utilities over their lifetimes. These behaviors will
naturally be influenced by peoples’ time preferences and tastes for risk, features of their economic
environment, and the availability and generosity of transfer schemes.21 This literature has recently
been enriched by behavioral research showing that some people have difficulties making complex
economic calculations and lack the expertise to deal effectively with complex financial products.
21See Lusardi and Mitchell (2014) for citations.
16
SMU Classification: Restricted
As a result, and particularly when retirement saving schemes are centrally-designed and managed,
many workers tend to devote little attention to managing their saving and investment plans on their
own. Accordingly, it is critical to explore which people are well-equipped to make these decisions,
and also to determine where policy efforts can be most effectively targeted to enhance individual
decision-making.
It is important to acknowledge that investing in financial knowledge is also endogenous:
that is, consumers must devote time and money to learn about financial products and the working
of the capital market. (Kim et al, 2016). Accordingly, investment in financial knowledge depends
on both the costs of acquiring financial knowledge and the value of the investment to the decision-
makers. In this context, it has been shown that some people – particularly the least educated and
lowest-paid – may optimally invest little in financial literacy (Lusardi et al. 2017, Delavande et al.
2008). An implication of this research is that peoples’ financial knowledge will be endogenously
related to their wealth and portfolio diversification. As a result, it is important to identify the
directionality of these causal relationships, and many researchers have used instrumental variable
econometric techniques and experimental analysis to this end. While additional research will be
useful to confirm findings, there is now substantial evidence supporting the conclusion that
financial knowledge does drive more saving, better retirement planning, better investment
outcomes, and more informed decisions about retirement payouts.22 Future work with the SLP®
will allow us to investigate this matter in more detail using this dataset.
Conclusions and Implications
22 A discussion of this literature appears in Lusardi and Mitchell (2014); see also Brown et al (2016 and
forthcoming), and Clark et al. (2015).
17
SMU Classification: Restricted
This paper reports the first results of our analysis of Singaporeans’ financial literacy using
a unique new dataset, the Singapore Life Panel®. With this new and nationally representative
survey, we addressed three important questions. First, we explored how financially knowledgeable
Singaporeans are, and how their results compared to a similar internet-based U.S. study, the
American Life Panel. Second, we evaluated the relationship between financial literacy and wealth,
an issue of key interest in a wide range of policy circles. Third, we examined whether greater
financial knowledge in Singapore is associated with more complex portfolios.
We show that older adults’ level of financial literacy in Singapore is comparable, albeit a
bit lower, than that in the U.S. American Life Panel. Moreover, financial literacy is positively
associated with having more wealth and better-diversified portfolios both inside and outside CPF
pensions. Older women in Singapore tend to be less informed about stock diversification, while
educated and wealthier people tend to be more financially knowledgeable. We also show that
financial literacy is positively and significantly associated with most of our portfolio complexity
measures, holding other factors constant. Additionally, better-educated and healthier respondents
tend to exhibit better portfolio diversification.
As Singapore, and indeed the entire Asian region, continue to age, there will be pressure
to facilitate and encourage more saving, and especially more productive saving, among some parts
of the population. Financial literacy can play an important role in enhancing peoples’ pension and
non-pension saving, and also in improving asset diversification patterns.
18
SMU Classification: Restricted
Figure 1. Share Held in Risky Assets in Conservative, Aggressive, and the Vanguard Target
Date Glide Path
Source: http://www.vanguard.com/pdf/s167.pdf
19
SMU Classification: Restricted
Table 1: Summary Statistics on Financial Literacy in Singapore among Older Adults