57
Financial Management Institute Workshop Keeping it Interesting
| Date post: | 13-Dec-2015 |
| Category: |
Documents |
| Upload: | kelly-strickland |
| View: | 223 times |
| Download: | 2 times |

Financial Management Institute Workshop
Keeping it Interesting

Power Point or Paper• Small groups versus large
• Tips still apply
• Paper – indicate where you are.

Keeping it Interesting• Individuals have different ways of
taking in information.
• Variety helps to break monotony and add interest
• Simple rules may help

Rule of Three• People can only process so much
information at once.
• Limit points to related items
• Try to limit the number to 2 to 4.

Layer Presentations• Start with the big picture (forest)
• Add level of detail (trees)
• If necessary, proceed to fine detail (branches and twigs)
Advantages of Layering• Allows senior to set the pace and
determine the priorities
• Sets the context for detailed information
• Shows how pieces fit into a larger view

Example of Layering• Section 1: Overall Financial
Situation – Bottom Lines• Section 2: Overview of Revenue,
Expense, Assets and Liabilities• Section 3: Detailed Analysis of
Revenue, Expense, Assets and Liabilities

LayeringSurplus/Deficit
Debt/Accumulated Deficit
Revenue
Revenue by Code/Source
Liabilities by Type
Expense by Code/Agency
LiabilitiesExpense Assets
Assets by Category
Layer 1
Layer 2
Layer 3
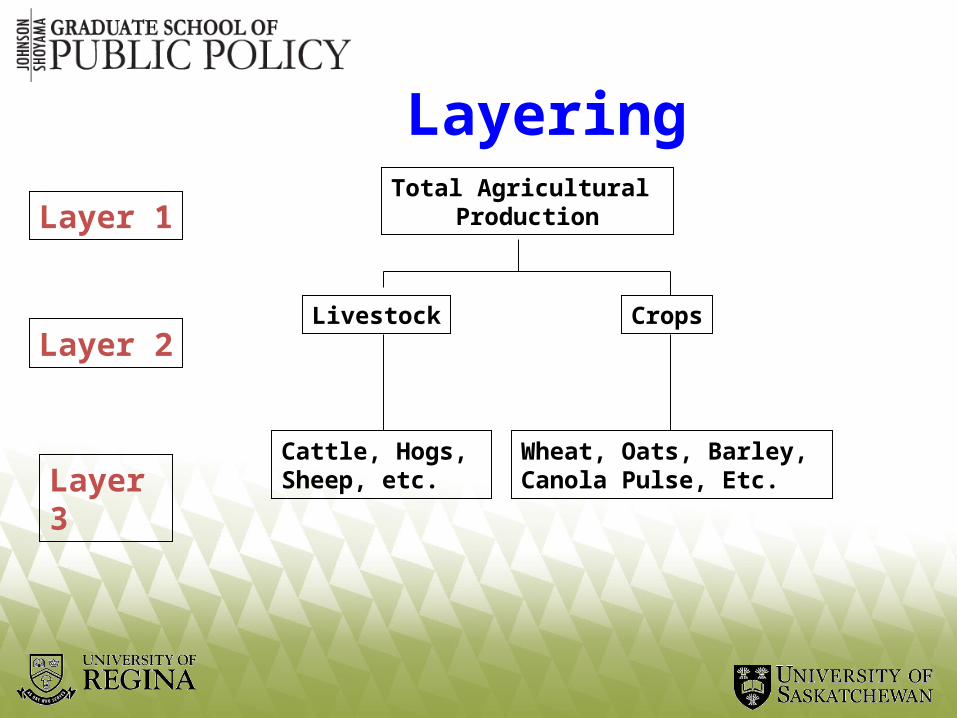
Layering
Layer 1
Layer 2
Layer 3
Total Agricultural Production
Livestock Crops
Cattle, Hogs, Sheep, etc.
Wheat, Oats, Barley, Canola Pulse, Etc.

Mix Presentation Styles• Three types of people:
Verbal peopleNumber peopleVisual people
• Mixing styles help reach all three and keeps interest

Keep it Simple• Use clear but concise
language/tables
• Use lots of white space
• Focus on the main points

Verbal Material While lengthy and complex sentence structures
and paragraphing are expected standards and encouraged in academic literature, in the context of most business applications and, especially, in the process of briefing senior officials, such structural constructs may be of limited practical application lest verbosity, complexity, repetition and potential redundancies result in uncertainty and obfuscation of the critical information originally intended to be conveyed, thereby reducing the effectiveness of the briefing effort and, potentially, alienating the very audience with which one is initially intending to communicate to the point that continued interest on the part of that audience may be difficult to re-establish or, indeed, to maintain at any level.

Use BulletsBullets help to:• keep it simple;• keep it concise; and,• organize several related points.
Using Numbers• Keep tables simple and clean
• Use round numbers in tables and text
• Avoid mixing number formats (dollars, percentages, growth rates, etc.)
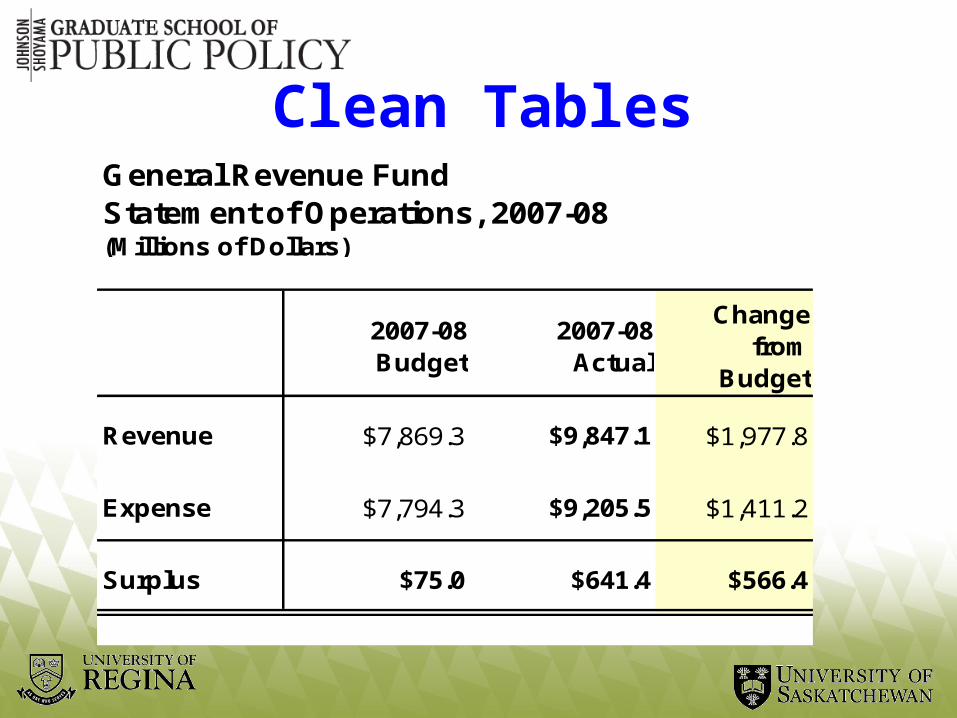
Clean TablesGeneral Revenue FundStatement of Operations, 2007-08(Millions of Dollars)
2007-08 Budget
2007-08 Actual
Change from
Budget
Revenue $7,869.3 $9,847.1 $1,977.8
Expense $7,794.3 $9,205.5 $1,411.2
Surplus $75.0 $641.4 $566.4
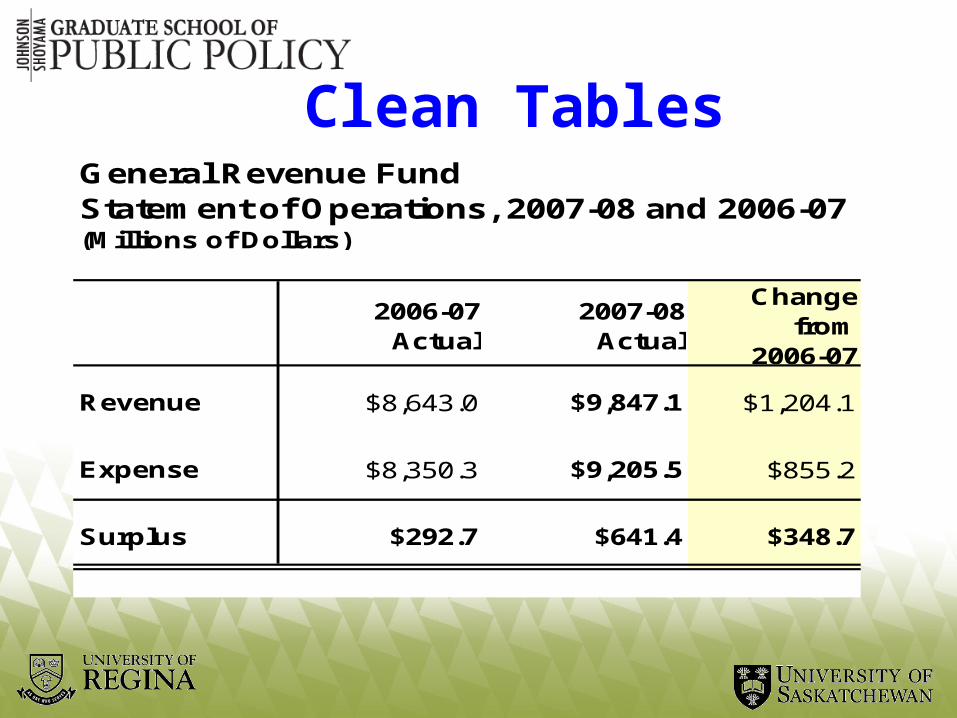
Clean TablesGeneral Revenue Fund Statement of Operations, 2007-08 and 2006-07(Millions of Dollars)
2006-07 Actual
2007-08 Actual
Change from
2006-07
Revenue $8,643.0 $9,847.1 $1,204.1
Expense $8,350.3 $9,205.5 $855.2
Surplus $292.7 $641.4 $348.7

Visual Presentations• A picture says a thousand words
• Keep graphs simple
• Label clearly

Bar chartsGeneral Revenue Fund,
Revenue, 2007-08
$7.9
$9.8
$0.0
$5.0
$10.0
2007-08 Budget 2007-08 Actual
Bil
lio
ns

Clustered Bar ChartsGeneral Revenue Fund,
Revenue and Expense, 2007-08
$7.9
$9.8
$7.8$9.2
$0.0
$5.0
$10.0
2007-08 Budget 2007-08 Actual
Bil
lio
ns
Revenue Expense

Stacked BarsComponents of Total, 1997-98 and 2007-08
$0
$100
$200
$300
$400
1997-98 2007-08
Dol
lars
A B C
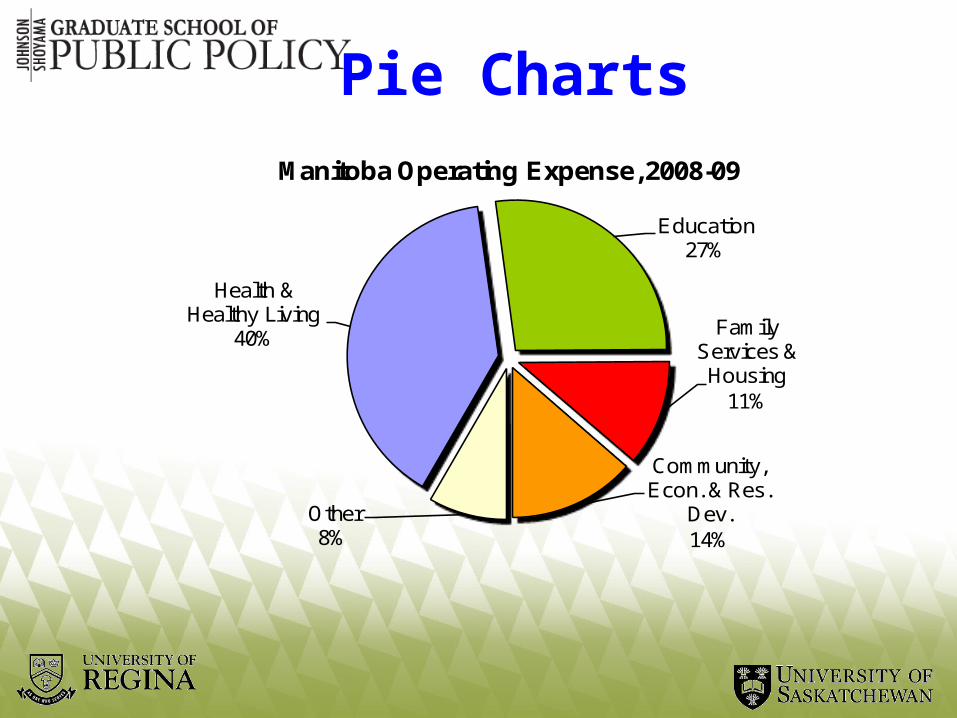
Pie Charts
Health & Healthy Living
40%
Education27%
Family Services & Housing
11%
Community, Econ. & Res.
Dev.14%
Other8%
Manitoba Operating Expense, 2008-09

Pie Charts

Line GraphsHistorical Prices of A, B and C in dollars
$0
$100
$200
$300
1 6 11 16 21 26 31Year
Do
llar
s
A B C
Graphs to Avoid
• Dual Axes charts
• Multi-dimensional charts
• Too many data categories

Dual Axes Graphs
0
5
10
15
20
25
30
35
0
2
4
6
8
10
12
1 2 3 4 5
Series1
Series2

Multi-dimensional Graphs
Series1
Series2
Series305
10152025
30
1 2 34
5
25-30
20-25
15-20
10-15
5-10
0-5
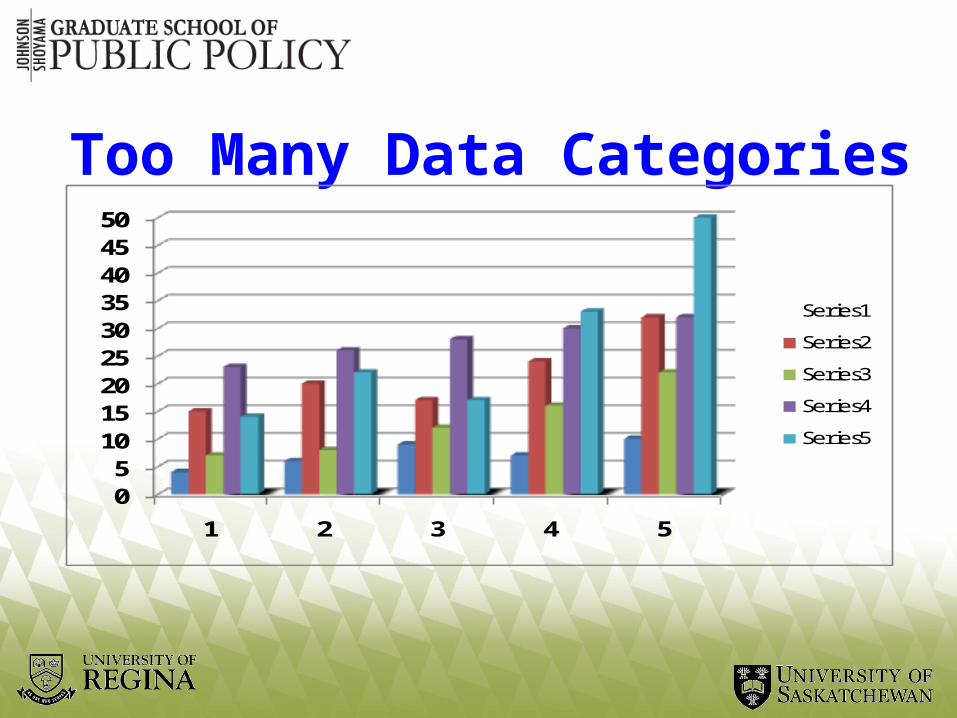
Too Many Data Categories
05101520253035404550
1 2 3 4 5
Series1
Series2
Series3
Series4
Series5
Summary
• Do not assume deep understanding from your audience
• Layer presentation focussing on main points in each layer
• Mix verbal, visual and numeric approaches
Financial Management Institute Workshop
Applied Techniques


How this Looks to Others!@#$#$$%%% )))*&^%$$%? ^^$%%%?>>< ***^&&%$%%#
@@@@@@@@@@*******???????/////////34355522244455&&^%^*(()
??????????&&&%$###%^&(()P^(HNN*(*&*^%%TGB((B B*(**H BU**}
MK((FF^IU)UF%^%**()(_N_)()y87t_)N()NU)U(y76(&%%*())N_)YTP)N__
%%890oj%%%%% $$$$$$$ b &&*)))BN&Y&* ((_)%%RG (*&^CCT
%%^&&**(_)_ (I)(U++__)Ooo-=&^^^^&&^)__+___++)NY87897h 0-098
%%^&&**(_)_ (I)(U++__)Ooo-=&^^^^&&^)__+___++)NY87897h 0-098
%%^&&**(_)_ (I)(U++__)Ooo-=&^^^^&&^)__+___++)NY87897h 0-098
??????????&&&%$###%^&(()P^(HNN*(*&*^%%TGB((B B*(**H BU**}

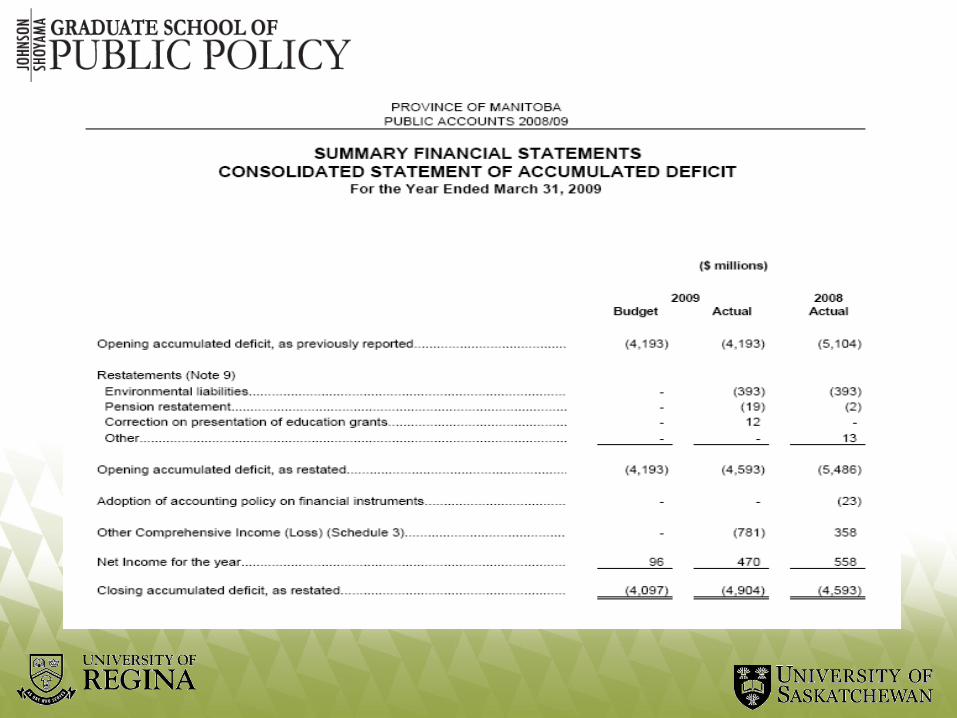
Manitoba Financial Statements, 2008-09
Compared to last year:• the accumulated deficit is up $311
million;• public debt is up $899 million;• the operating surplus is down $88
million; • revenue is up $ 419 million; and,• expense is up $517 million.

Manitoba Financial PositionSummary Financial Statements
Statement of Financial Position at March 31, 2008 and 2009(Millions of Dollars)
2007-08 Actual
2008-09 Actual
Change from
2007-08
Assets $17,740 $15,339 -$2,401
Liabilities $22,333 $20,243 -$2,090
Accumulated Surplus (Deficit)
-$4,593 -$4,904 -$311

Manitoba Debt
$14,555 $14,664
$0
$5,000
$10,000
$15,000
$20,000
$25,000
2008 2009
Mil
lio
ns
Comparison of Liabilities, 2008 and 2009
Other Liabilities
Borrowings
$22,333 $20,243

Debt History

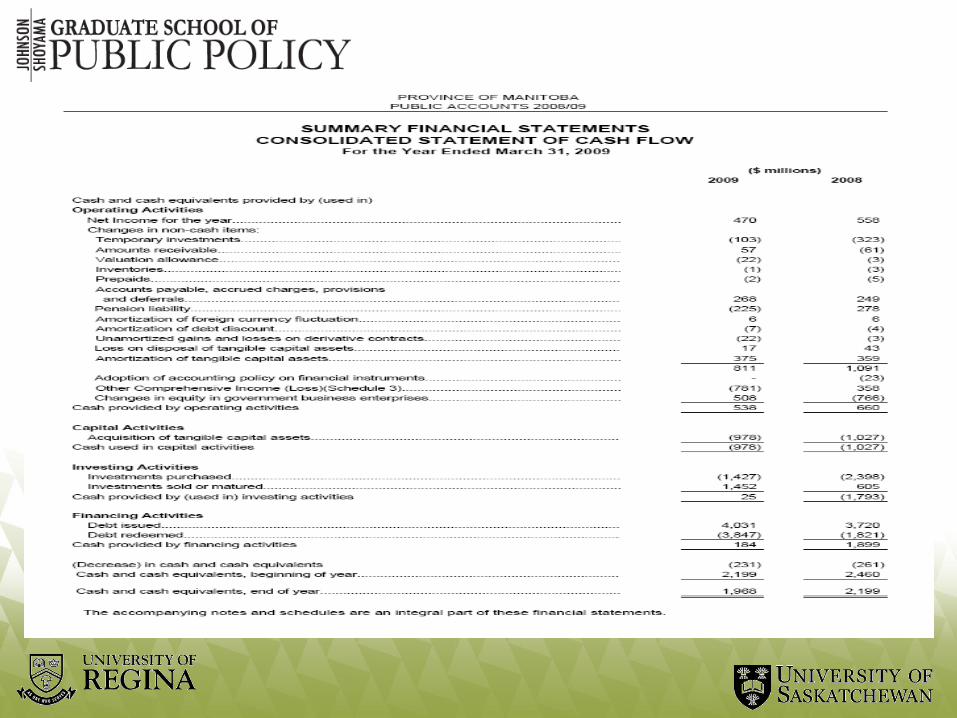
Operations HighlightsCompared to last year:
• Operating surplus is down $88 million;
• Revenue is up $ 419 million; and
• Operating expense is up $507 million.

Revenue and ExpenseSummary Financial StatementsStatement of Operations, 2007-08 and 2008-09(Millions of Dollars)
2007-08 Actual
2008-09 Actual
Change from
2007-08
Revenue $12,496 $12,915 $419
Expense $11,938 $12,445 $507
Surplus $558 $470 -$88

Revenue Growth
Revenue is up $419 million over last year:
• Taxation (up $249 million);• Federal transfers (up $269
million), and;• Other Revenue (down $99
million).

2008-09 Revenue Composition
Taxation 48%
Federal Transfers 30%
Other 22%
Manitoba Revenue, 2008-09

2008-09 Operating Expense
Health & Healthy Living
40%
Education27%
Family Services & Housing
11%
Community, Econ. & Res.
Dev.14%
Other8%
Manitoba Operating Expense, 2008-09

Since 2008-09 Budget
Since the Budget:
• revenue is up about $592 million;
• expense is up about $ 218 million; and
• the surplus is up $374 million.
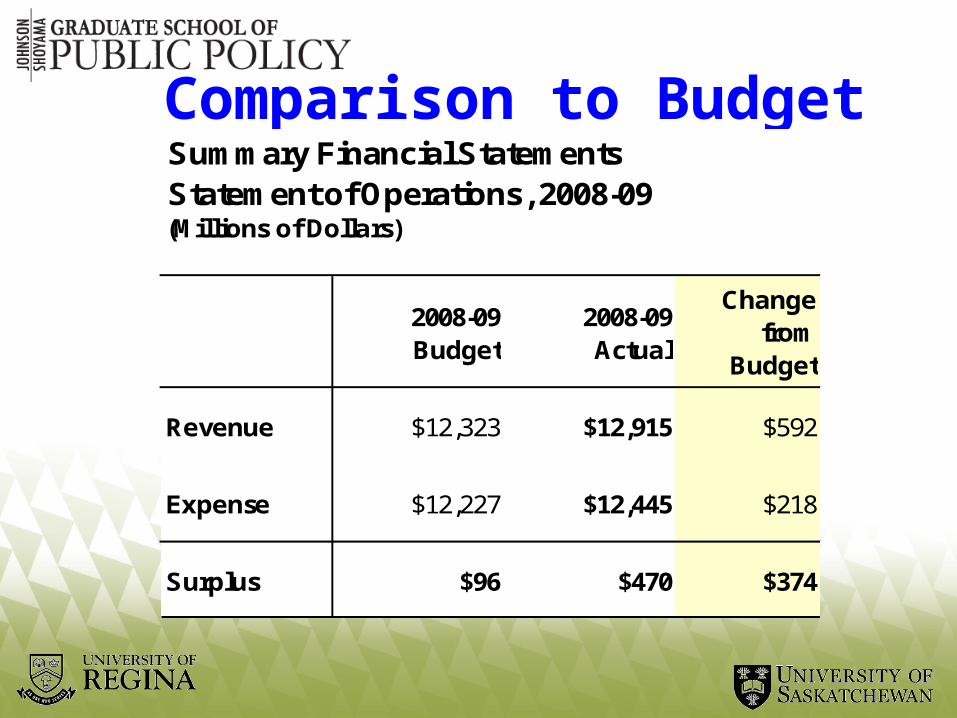
Comparison to BudgetSummary Financial StatementsStatement of Operations, 2008-09(Millions of Dollars)
2008-09 Budget
2008-09 Actual
Change from
Budget
Revenue $12,323 $12,915 $592
Expense $12,227 $12,445 $218
Surplus $96 $470 $374
Revenue Increases
Since the Budget, revenue is up $592 million:
• taxation (up $178 million),• transfers from the federal
government (up $40 million): and,
• other revenue (up $374 million).

Allocation of New Revenue
The $592 million in revenue increase since the Budget has gone to:
• increased surplus (or debt reduction) (up $374 million);
• expense increases ( up $218 million).

Overview of Statements
Revenue is up significantly, leading to:
• a higher surplus;• reduced debt; and,• lower government liabilities.

Financial Management Institute Workshop
Summary and Overview

Overview
In this session we have discussed:• the context for briefings• general rules for briefing senior
officials;• briefing on financial issues;• keeping briefings interesting; and,• specific applications of
techniques.
Context
• Ministerial accountability
• Legislated responsibility
• Role of officials

General Rules
• Understand your audience• Respect time pressures• Let the audience set priorities• Keep it brief• Focus on main points• Be flexible in time and subject
focus

Briefing on Financial Issues
• Keep it simple
• Focus on big issues
• Prepare options for problem areas

Keeping it Interesting• Rule of 3
• Layer presentations
• Mix presentation styles
• Different charts for different purposes

ObjectivesContext for Briefing
Ministers/Senior Officials
General Information on Briefing
Special Needs in Financial Briefings
Tips and Techniques

Wrap up• Understanding financial issues is
very important to good management.
• Not all senior managers have a financial focus.
• Presenting information well helps managers manage.


