INTERNAL USE ONLY Financial Performance Navigator - Mobile Dashboard with SAP Design Studio/Graphomate - August 31, 2016 Michael Schramm / Michael Hutter (winnovation AG) Group Planning & Performance Reporting
Transcript
INTERNAL USE ONLY
Financial Performance Navigator- Mobile Dashboard with SAP Design Studio/Graphomate -
August 31, 2016
Michael Schramm / Michael Hutter (winnovation AG)
Group Planning & Performance Reporting
INTERNAL USE ONLY
Intro –Zurich
Why – The Case for Change
Context – The Global InsightZ Program
Foundation – The System Landscape
Project approach, timeline, team composition
Demo – The Financial Performance Navigator LIVE
Discussion
2
Our Journey Today
INTERNAL USE ONLY 3
INTERNAL USE ONLY 4
INTERNAL USE ONLY
Zurich’s Performance Reporting is Based on Traditional Concepts
5
Paper based and static
Layered, with separate reports for each segment and region
Not easy to drill-in to the performance of a specific business units
Often not intuitive to navigate to the “root cause”
Is tablet enabled and can be accessed over the internet
Comprises financial information for the Group and all Segments
Allows to drill-in to each of the business units within segments
Is a fast track to answers on performance questions, triggering questions for specific deep dives
Our reporting today is… But we want something, which…
INTERNAL USE ONLY
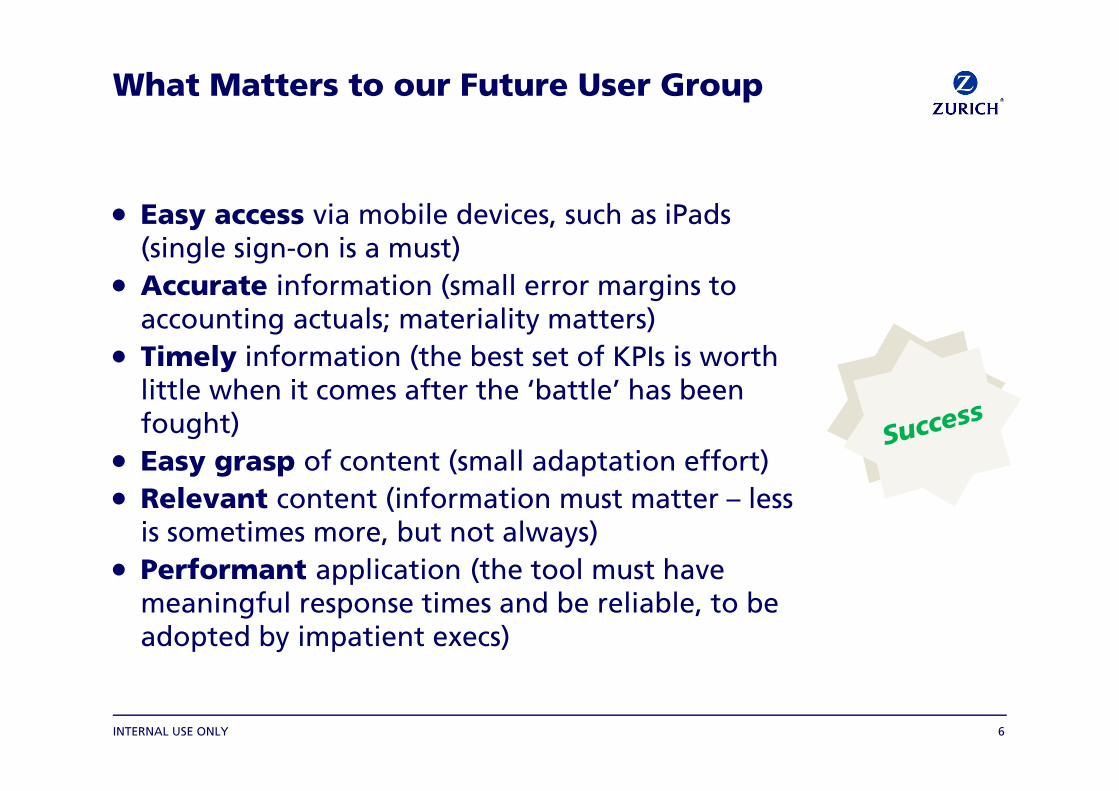
Easy access via mobile devices, such as iPads (single sign-on is a must)
Accurate information (small error margins to accounting actuals; materiality matters)
Timely information (the best set of KPIs is worth little when it comes after the ‘battle’ has been fought)
Easy grasp of content (small adaptation effort) Relevant content (information must matter – less
is sometimes more, but not always) Performant application (the tool must have
meaningful response times and be reliable, to be adopted by impatient execs)
What Matters to our Future User Group
6
INTERNAL USE ONLY 7
Global MIS
Global Actual/Forecast
Global Planning Solution Release 2
Global Planning Solution Release 1
Global Process & Technical Design
Build Technology Infrastructure BPC10.0
Build Technology Infrastructure SAP NW/AO/DM
Global Process & Technical Design
Dashboard – FPN
Global Scenario Modelling
2011 2012 2013 2014 2015 2016
Standardized Traditional Reporting/Ad-hoc
Integrated Master Data
Global InsightZ InitiativeCreating a State of the Art FP&A Environment
INTERNAL USE ONLY
Global InsightZComponents of System Landscape (mainly SAP)
8
Group Financial ConsolidationActual
Life Actuarial (MCEV)
Functional Direct ExpensesActual
Global InsightZPlan
Global InsightZACT/FC
Global InsightZMIS (BW)
Dat
a Tr
ansf
orm
atio
n
Harmonized Information
Global InsightZAd hoc reporting:Analysis for Office
(AfO)
Global InsightZPack production:
Disclosure Management(DM)
FPNGlobal InsightZ
Dashboard (mobile):SAP Design
Studio/Graphomate
BEx Queries
Global InsightZ
GlobalInsightZ
Master DataManagement
InsightZSharePoint
CollaborationPlatform
Automated interface
Citrix
INTERNAL USE ONLY
Data Sourcing ConceptKPIs
9
…
KPI Sourcing Query FC CY
KPI Sourcing Query Act PY
KPI Sourcing Query Act CY
Analysis Process Designer
Analysis Process Designer
Analysis Process Designer
Global InsightZ MIS
Data Aggregation and Transformation
- Transform RKF and CKF to KPIs;
- Aggregate data
- Derive FPN Segment, Region, Subregion, BU
- Derive value for Reporting Period
- Skip records with Amount $0
KPI ReconQuery MIS -dashboard
KPI Sourcing Query Plan CY
Analysis Process Designer
Cockpit (L1)
Segment Level (L2)
Region Level (L3)
Sub-regionLevel (L4)
GI BU OverviewLevel (L5)
GI BU Detail Level (L6)
FPN dashboardqueries
GL BU OverviewLevel (L5)
GL BU DetailLevel (L6) FPN
Dashboard
KPI layer & data history
File upload for non-MIS KPIs
Self-service Analyticsand Modeling
NEXT STEP
INTERNAL USE ONLY
Project approach and challengesFinancial Performance Navigator
10
Jan – Feb 2015 showcaseSCRUM – 4 sprints in 9 weeks4-6 developers / consultants
Jan – Apr 2016 projectAgile approach with daily huddles, Kanban backlog and bi-weekly business owner feedback/decision meetings9 developers / consultants with 60% assignment
New technology, no in-house skills Near shore outsourcing activities in Finance
and IT during 2016 Team members distributed in 2 countries
and 3 locations No full time team assignment Not possible to apply SCRUM
2 external design studio consultants from winnovation with SAP BW, Design Studio, CSS, Javascript and graphomate skills
1 internal IT resources with SAP BW skills 2 external IT resources with SAP BW skills 4 internal developers from Bratislava with
SAP BEx, SAP BW, Javascript skills
Project team Challenges
INTERNAL USE ONLY
Design of Financial Performance Navigator (DS V1.6)and make use of graphomate add-on
Best practice visualization for various KPI’s to be most widely used on various mobile devices (iPads)
Do’s & Dont’s in Dashboard Visualization for mobile use (easy access, easy grasp, precise, relevant & performant)
Advise, Coach & Support an agile visualizationproject - all stakeholders involved
Build a performant FPN dashboards (demo) in 4 sprints with daily huddles, backlog and bi-weekly business owner feedbacks
Upskill personnel to have them fulfill their project role & role in operation (maintenance, enhancement)
Ensure proper documentation for handover to operation
Financial Performance NavigatorHow winnovation has supported us


![Auto-FPN: Automatic Network Architecture Adaptation for ...openaccess.thecvf.com/content_ICCV_2019/papers/Xu_Auto-FPN_Au… · FPN) [30]. To build an efficient yet accurate detector,](https://static.documents.pub/doc/80x56/5eadb209a076ec1fc6264bdd/auto-fpn-automatic-network-architecture-adaptation-for-fpn-30-to-build.jpg)


