Page 1
European Research Studies Journal
Volume XX, Issue 2A, 2017
pp. 443-460
Financial Performance towards Value of Firms in Basic and
Chemicals Industry
P. Purwanto1, Jillian Agustin
2
Abstract:
This research aims to empirically prove the significant influences of financial performance
towards value of firm. This research chose the population in basic and chemicals industry
during the period of 2009-2014.
Through purposive sampling and panel data, this research had 60 observations which was
obtained through each firm. This research adopted quantitative research with random effect
model, which used some analysis methods of descriptive analysis, classical assumption,
multiple regression analysis and hypotheses testing.
The result was concluded that firm size, earnings growth, current ratio, DER and ROA had
partial significant influences towards PBV. Simultaneously, those five independent variables
provided 66.594% influences while the rest 33.406% was influenced by other factors.
Moreover, firm size was chosen as the most significant factor which influences price to book
value.
Keywords: PBV, Firm Size, Earnings Growth, Current Ratio, DER, ROA
1 Faculty of Economic and Business, Padjajaran University, Bandung, Indonesia; Faculty of
Business, President University, Jababeka Education Park, Jl. Ki Hajar Dewantara, Kota
Jababeka, Cikarang Baru, Bekasi 17550 – Indonesia, E-mail: [email protected]
and Faculty of Business, President University, Jababeka Education Park, Jl. Ki Hajar
Dewantara, Kota Jababeka, Cikarang Baru, Bekasi 17550 – Indonesia. 2 Faculty of Business, President University, Jababeka Education Park, Jl. Ki Hajar
Dewantara, Kota Jababeka, Cikarang Baru, Bekasi 17550 – Indonesia.
Page 2
Financial Performance towards Value of Firms in Basic and Chemicals Industry
444
1. Introduction
Capital market is one of the major contributors of economic growth in Indonesia.
Rise and fall of the stock index is a reflection of the economic dynamism of the
country (Widoatmodjo, 2009). Capital market is a platform between parties who
have excess fund (investors) to those who need additional fund by trading the
securities issued by the related companies (Tandelilin, 2010). The performance of
capital market could be used as a benchmark to determine the economy growth of a
country (Fetai, 2015; Glavina, 2015; Thalassinos, 2008; Thalassinos et al., 2012).
Investment activity is an activity of placing funds in to one or more than one assets
in a certain period with expectation of generating income or increasing value of the
investment. Increasing trading value will be followed by increasing stock price
(Husnan, 2005). Investment climate in Indonesia tends to hike in accordance with
the new regulation of Decree No. KEP-00071/BEI/11-2013 concerning Changes to
Round Lots and Tick Price. Effectively implemented since January 6, 2014, the new
regulation stipulated the round lot value of equity security now consists of 100
shares as compared to 500 shares set out in the previous Decree of 2012. Decreasing
round lots is expected to attract investors to trade actively at stock exchange,
because the funds needed to purchase a stock became less. Since more investors are
entering the stock market, there will be more trading transactions so it will enhance
market capitalization and the liquidity of stock will go up. Liquid stocks will have
high trading value, which indicates the investors are attracted to this stock. Stock
price is formed on the power supply and demand in the stock market which is
influenced by investors’ considerations both from firm’s internal and external factors
(Jogiyanto, 2010; Thalassinos et al., 2015; Rupeika-Apoga and Nedovis, 2015).
An investor, before making any decision regarding an investment, should always
analyze and have in depth knowledge about the performance of related firm. The
firm's performance could be discovered through the firm's internal information
sourced from the firm's financial statements (Hanafi and Halim, 1996). The
information presented in the financial statements has been sufficiently described the
development of the firm and its achievements. If the financial performance of a firm
shows good prospects, the stockholders and potential investors will be interested in
buying the stocks, which will affect stock price (Tcvetkov et al., 2015).
Generally, the main purpose of a firm is to maximize the wealth of its stockholders
through the firm's value as reflected in the stock price (Brigham and Houston, 2001).
The stock price is the price that would be paid by investors as an evidence of
ownership. The higher the value of the firm, the more an investor is willing to pay
for a stock. The stockholders always observe stock price movements, as the value of
their prosperity is determined by the stock price. The stock price will directly affect
value of the firm, which is an important indicator for investors. Value of a firm is
very essential because it reflects firm’s performance that could affect investors’
perception towards the firm. In general terms, there are three approaches to value a
Page 3
P. Purwanto, J. Agustin
445
firm which are discounted cash flow valuation, relative valuation, and contingent
claim valuation (Damodaran, 2012). In reality, the most approach used is the relative
valuation which will become the focus in this study. Relative valuation estimates the
value of an asset by analyzing its pricing of comparable assets relative to a common
variable. Price earnings ratio (PER), price to book value ratio (PBV), Tobin’s Q, and
price sales ratio are some of the widely used ratios to determine the value of a firm.
A publicly traded firm provides information regarding its financial performance and
financial ratios as consideration for investors in making an investment decision.
There is significant and strong correlation between value of firm towards its
financial performance. Financial performance is expected to be able to predict the
value of the firm in the future. However, there is an inconsistency on the influence
of financial ratios towards its value of firm. As stated by (Mahendra et al., 2012)
“There are several factors that affect the value of the firm, namely: funding
decisions, dividend policy, investment decisions, capital structure, earnings growth,
and size of the firm. Some of these factors have a relationship and influence on the
value of a firm inconsistently.”
Many investors believe the larger the firm size, the easier a firm gets additional
funding thus it will positively affect value of firm (Hidayah, 2014). On the other
hand, Budi and Rachmawati (2014) did not found any influence between them.
Kuswanto and Taufiq (2010) found that earnings growth has significant influence
towards value of firm; however, Nasehah and Widyarti (2012) showed no influence
of earnings growth to value of firm.
Firm that has a high level of liquidity, has much internal funds to manage its
operational and tends not to use debt to finance its investment; it will enhance firm's
ability to manage its fund so it will affect the value of the firm (Jantana, 2012).
However, Lins and Kalcheva (2007) founding was theoretically contradicted, in
which liquidity has negative influence towards value of firm. Many investors
perceive that more debt will increase investment risk, therefore, they avoid the firm
with high debt levels. However did not find any significant influence of leverage
towards value of firm. Ang (1997) stated that profitability positively affect the firm's
value as profitability ratio shows the firm’s success in generating profits, which is
also supported by Hidayah (2014) and Febrianti (2012).
Those research inconsistencies show that factors that affect price to book value will
be varies across industry sector, period, or even country. Each sector, whether
primary, secondary, or tertiary sector, will have different price to book value ratio
which is not comparable among sector. This study will focus on the secondary
sector, exactly in manufacturing, which transforms the raw materials into goods for
sale or consumption. Indonesia Stock Exchange classified manufacture industry into
three sectors; basic industry and chemicals, miscellaneous, and consumer goods.
This research will emphasize on basic industry and chemicals sector, which suffers a
downtrend stock movement.
Page 4
Financial Performance towards Value of Firms in Basic and Chemicals Industry
446
Basic industry and chemicals sector, which consists of 65 listed stocks in Indonesia
Stock Exchange, is included in the manufacturing industry. Thus, if this condition
goes on, it will have bad impact towards this sector as investors will be attracted to
other sectors. The negative movement of basic industry and chemicals sector,
furthermore, will affect value of firms within the sector. Value of firms in
manufacturing industry, which is measured using price to book value. It also shows
the downtrend price to book value movement of basic industry and chemicals sector,
which means the declining of its sectoral indices, will affect its price to book value.
During 2013 to 2014, only basic industry and chemicals sector was decreasing while
the other sectors of manufacture industry were increasing or at least stagnant. Since
the movement it is related to value of the firm, the researcher has the desire to
empirically check whether declining movement in basic industry and chemicals
sector will negatively affect value of the firm (Thalassinos and Liapis, 2014).
Based on the problems stated and the research gaps which show discrepancies
among research result, the researcher is attracted to compose a research with the
focus on price to book value through the analysis of their financial performance
which are firm size, earnings growth, current ratio, debt to equity ratio, and return on
assets (Ugurlu et al., 2014). The sample is taken from basic industry and chemicals
firms listed in Indonesia Stock Exchange.
2. Previous Research
Some researchers had conducted researches about variables that may influence the
price to book value. Those previous researches will help the researcher to identify
and highlight the influential variables and record significant findings from
researches which had been conducted (Sekaran and Bougie, 2011). The researcher
has summarized some previous research from published journals which has price to
book value as dependent variable.
Hidayah (2014) analyzed the influence of managerial ownership, debt to equity
ratio, firm size, and return on asset towards price to book value in property and real
estate firms from 2010-2012 listed in Indonesia Stock Exchange. This research
found that managerial ownership, firm size and return on asset had positive
significant effect on the price to book value while debt to equity ratio has negative
but insignificant influence. The coefficient determination resulted from this research
was 10.2%.
Marangu and Jagongo (2014) analysis was to establish the relationship between
price to book value and financial statement variables of dividend payout ratio, return
on assets, return on equity, return per share, dividend per share and earnings growth
after tax. The sample was selected from Nairobi Stock Exchange 20 share index
during 1991-2003. The result indicated return on assets, return on equity, and return
per share have positive significant influence towards price to book value. On the
other hand, there was negative significant influence between price to book value
Page 5
P. Purwanto, J. Agustin
447
ratio and dividend per share. While dividend payout ratio and growth rate in
earnings after tax do had no statistically significant relationship. The coefficient
determination resulted from this research was 72.6%.
Budi and Rachmawati (2014) analyzed property and real estate firms during 2010-
2013 listed in Indonesia Stock Exchange. The results indicated return on equity, debt
equity ratio, and growth had positive significant effect on price to book value, while
firm size had positive insignificant effect towards price to book value partially. Also,
return on equity, debt to equity ratio, growth, and firm size were simultaneously had
significant effect on price to book value with the coefficient determination of 22.4%.
Nasehah and Widyarti (2012) analyzed the influence of return on equity, debt to
equity ratio, dividend payout ratio, growth, and firm size towards price to book
value. The sample was taken from 14 manufacture firms listed in Indonesia Stock
Exchange during period of 2007-2010. The research found that return on equity and
dividend payout ratio had positive significant influence to price to book value, while
debt to equity ratio had negative significant influence to price to book value. On the
other hand, growth and firm size did not have any significant influence. All
independent variables simultaneously affect price to book value with adjusted R2
value of 52%.
Febrianti (2012) conducted research with the sample taken from 15 mining
companies listed in Indonesia Stock Exchange during 2003-2007. This study get a
comprehensive picture regarding the influence of fixed asset to total asset, operating
profit margin, current ratio, sales growth, firm size, debt to equity ratio, and debt
ratio towards price to book value. The results showed sales growth, firm size, and
debt to equity ratio had positive impact towards price to book value while fixed asset
to total asset, operating profit margin, current ratio, and debt ratio had positive
insignificant impact.
Jantana (2012) with the research used debt to equity ratio, return on equity, and
current ratio to analyze the value of firm. This research found debt to equity ratio,
return on equity, and current ratio had partial significant influence towards value of
firm. Simultaneously, all independent variables were significantly influence firm
value by 74.7%.
Sofyaningsih and Hardiningsih (2011) performed a study with the research sample
taken from 115 manufacture firms listed in Indonesia Stock Exchange during 2007-
2009. By using multiple linear regression to examine the effect of managerial
ownership, insitutisional ownership, dividend policy, and debt policy on firm value
by including the variable size, growth and performance as the control variable, this
research found that managerial ownership, firm size, earnings growth, and return on
assets were proven positively affect price to book value. While institutional
ownership, dividend payout ratio, and debt to equity ratio were not proven to affect
price to book value. Coefficient of determination from this research was 50.5%.
Page 6
Financial Performance towards Value of Firms in Basic and Chemicals Industry
448
Kuswanto and Taufiq (2010) performed a research by analyzing return on equity,
growth, dividend payout ratio, and degree of financial leverage towards price to
book value and its implication towards stock return. This research adopted
quantitative research with the sample taken from 27 manufacture firms listed in
Indonesia Stock Exchange from 2006 to 2008. The results showed partially return on
equity positively affect price to book value while growth negatively affect price to
book value. Dividend payout ratio and degree of financial leverage did not affect
price to book value.
Lins and Kalcheva (2007) conducted a research to examine the net costs and benefits
of cash holdings by taking samples for over 5000 firms from 31 countries. This
study found there is negative and significant influence of cash holdings and dividend
payment towards value of firm. On the other hand, managerial control and
shareholders right did not affect value of firm.
3. Research Hypotheses
This study develops financial performance to measure price to book value. The
independent variables in this study are firm size, earnings growth, current ratio, debt
to equity ratio, and return on assets while the dependent variable is price to book
value. Therefore, based on previous theoretical framework researcher has formulated
some hypotheses which will be tested in this research. Those hypotheses are:
H1 : There is significant influence of firm size towards PBV in basic
industry and chemicals sector.
H2 : There is a significant influence of earnings growth towards PBV
in basic industry and chemicals sector.
H3 : There is a significant influence of current ratio towards PBV in
basic industry and chemicals sector.
H4 : There is a significant influence of debt to equity ratio towards
PBV in basic industry and chemicals sector.
H5 : There is a significant influence of return on assets towards PBV
in basic industry and chemicals sector.
H6 : There is a significant simultaneous influence of firm size,
earnings growth, current ratio, debt to equity ratio, and return on
assets towards PBV in basic industry and chemicals sector.
4. Research Methodology
This research will be conducted by adopting quantitative approach to analyze
determinant factors of price to book value in basic industry and chemicals. In
quantitative method pieces of information can be counted mathematically, the data is
gathered from proportionally representative of population and is analyzed using
statistical methods (Neuman, 2006). The quantitative method is selected because this
study will focus on calculation by inputting data to find out the result and conclude
Page 7
P. Purwanto, J. Agustin
449
from the statistical result. This research will emphasize on measuring variables and
testing hypotheses to find out the impact of independent variables towards
dependent variable.
4.1. Multiple Regression Analysis
Multiple regression analysis is chosen to be used in this research since this research
has five independent variables. The dependent variable is price to book value while
the independent variables are firm size, earnings growth, current ratio, debt to equity
ratio, and return on assets. The influence of independent to dependent variables can
be written in linear regression equation as follows:
Y is price to book value ratio, is constant, X1 is firm size , X2 is earnings growth,
X3 is current ratio, X4 is debt to equity ratio, X5 is return on assets, are
regression coefficient and e is error. The value of partial regression coefficient
has a very important role to measure the marginal contribution of
independent variable to dependent variable, by holding all other variables are
constant (Schwert, 2010)
4.2. T-Test
The decision to reject or to not reject the null hypothesis can be concluded through
the probability value of t-statistics of each independent variable with significance
level of α = 5%. The t-test will help researcher in determining the partial influence
among an independent variable towards dependent variable. The hypotheses of t-test
are:
H01 : β1 = 0 or if probability t-statistics > α then there is no significant partial
influence of firm size towards PBV in basic industry and
chemicals sector.
Ha1 : β1 ≠ 0 or if probability t-statistics < α then there is a significant partial
influence of firm size towards PBV in basic industry and
chemicals sector.
H02 : β2 = 0 or if probability t-statistics > α then there is no significant partial
influence of earnings growth towards PBV in basic industry and
chemicals sector.
Ha2 : β2 ≠ 0 or if probability t-statistics < α then there is a significant partial
influence of earnings growth towards PBV in basic industry and
chemicals sector.
Page 8
Financial Performance towards Value of Firms in Basic and Chemicals Industry
450
H03 : β3 = 0 or if probability t-statistics > α then there is no significant partial
influence of current ratio towards PBV in basic industry and
chemicals sector.
Ha3 : β3 ≠ 0 or if probability t-statistics < α then there is a significant partial
influence of current ratio towards PBV in basic industry and
chemicals sector.
H04 : β4 = 0 or if probability t-statistics > α then there is no significant partial
influence of debt to equity ratio towards PBV in basic industry
and chemicals sector.
Ha4 : β4 ≠ 0 or if probability t-statistics < α then there is a significant partial
influence of debt to equity ratio towards PBV in basic industry
and chemicals sector.
H05 : β5 = 0 or if probability t-statistics > α then there is no significant partial
influence of return on assets towards PBV in basic industry and
chemicals sector.
Ha5 : β5 ≠ 0 or if probability t-statistics < α then there is a significant partial
influence of return on assets towards PBV in basic industry and
chemicals sector.
4.3. F-Test
The f-test will help researcher in determining the simultaneous influence of a set of
independent variables towards dependent variable. The hypothesis of f-test is:
H06 : β1 = β2 = β3 = β4 = β5 = 0 or if probability f-statistics > α then there is no
significant simultaneous influence of firm size, earnings growth, current ratio,
debt to equity ratio, and return on assets towards PBV in basic industry and
chemicals sector.
Ha6 : at least there is one βi ≠ 0 or if probability f-statistics < α then there is
significant simultaneous influence of firm size, earnings growth, current ratio,
debt to equity ratio, and return on assets towards PBV in basic industry and
chemicals sector.
4.4. Scope of the research
This study is conducted with ten samples of basic industry and chemicals firms
listed on Indonesia Stock Exchange by analyzing the influence of financial
performance which is represented by firm size, earnings growth, current ratio, debt
to equity ratio, and return on assets towards the price to book value. The samples
chosen have total assets less than IDR 35 trillion and have no negative earnings.
4.5. Sample
The sample provides population means, the entire group of individuals or objects
that the researcher is interested to analyze (Sekaran and Bougie, 2011). Population is
Page 9
P. Purwanto, J. Agustin
451
a very large number of individuals or objects which is not feasible to manage;
therefore a part of population is selected for research purpose. In this study, research
population is focused on basic industry and chemicals firms listed in Indonesia Stock
Exchange. Based on annual Indonesia Stock Exchange report period 2014, there are
65 firms which are categorized in this sector. Those ten firms represents each
subsector, with the proportion of sample from each subsector are as Table 1.
4.6. Source of Data
This research uses secondary data since the data are already published and can be
accessed through official website such as Indonesia Stock Exchange, related firms,
and as well as the other websites that contain necessary information for this research.
The data that used in this research is annually data during period 2009 until 2014
with source of data are taken from annual report of basic industry and chemicals
firms which are being researched and IDX statistics annually. After the data were
gathered, the data were filtered by the criteria listed on the sampling design in order
to get sample size.
Therefore, this research adopts documentary method since researcher try to study
about certain phenomenon by analyzing the documents which contain information
needed.
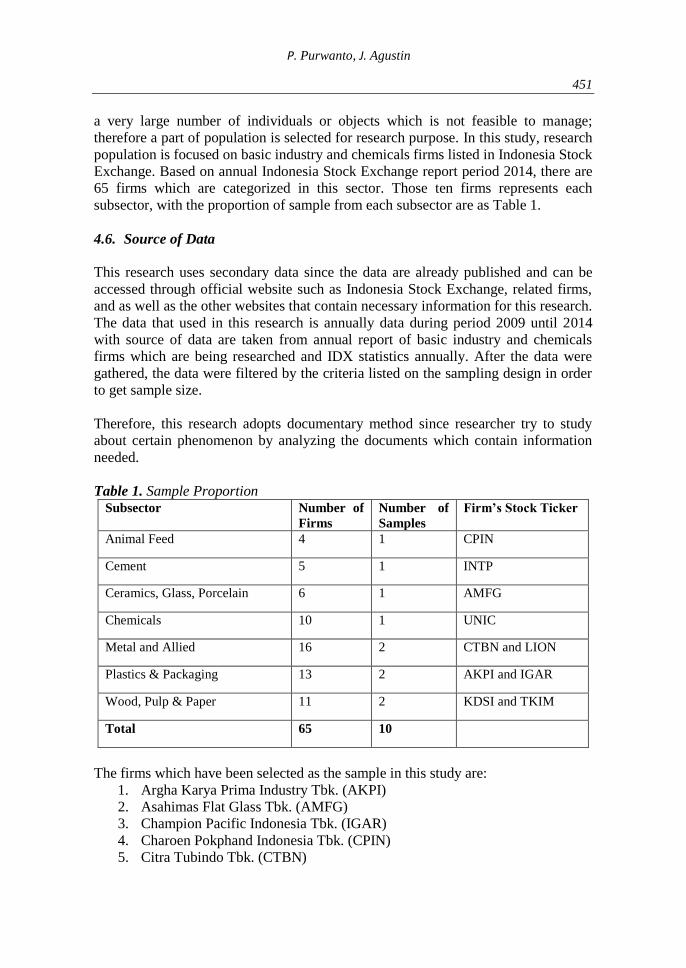
Table 1. Sample Proportion
Subsector Number of
Firms
Number of
Samples
Firm’s Stock Ticker
Animal Feed 4 1 CPIN
Cement 5 1 INTP
Ceramics, Glass, Porcelain 6 1 AMFG
Chemicals 10 1 UNIC
Metal and Allied 16 2 CTBN and LION
Plastics & Packaging 13 2 AKPI and IGAR
Wood, Pulp & Paper 11 2 KDSI and TKIM
Total 65 10
The firms which have been selected as the sample in this study are:
1. Argha Karya Prima Industry Tbk. (AKPI)
2. Asahimas Flat Glass Tbk. (AMFG)
3. Champion Pacific Indonesia Tbk. (IGAR)
4. Charoen Pokphand Indonesia Tbk. (CPIN)
5. Citra Tubindo Tbk. (CTBN)
Page 10
Financial Performance towards Value of Firms in Basic and Chemicals Industry
452
6. Indocement Tunggal Prakarsa Tbk. (INTP)
7. Kedawung Setia Industrial Tbk. (KDSI)
8. Lion Metal Works Tbk. (LION)
9. Pabrik Kertas Tjiwi Kimia Tbk. (TKIM)
10. Unggul Indah Cahaya Tbk. (UNIC)
The research adopts panel data, in which the elements are the time series and cross
sectional data. The time series data is six years (2009-2014) while data are taken
annually, and cross sectional data refer to ten firms. The researcher chooses six years
because the published data are limited by the firms. Therefore, the total observation
data are six years multiply by ten firms which are 60 data (Gujarati, 2004). Since the
cross section unit has the same number of time series observations, then this research
is using balanced panel data.
Roscoe (1975) in Sekaran and Bougie (2011) stated that the sample size larger than
30 and less than 500 are adequate for most research. In addition, in using multiple
regression analysis the sample size should be ten times or more as large as the total
variables which are used in the research. Thus, as this research uses six variables, the
sample size should be 60 data (six variables multiply by ten times).
5. The Result and Discussion
5.1. Descriptive Statistics
Descriptive statistic provides general information of the variables in the research
which are being tested. Mostly, it shows the calculation results of mean, minimum,
maximum, and standard deviation for each variable. The summary descriptive
statistic of each variable for this research is shown in Table 2 using Eviews version
9.
Table 2. Descriptive Statistics PBV_Y SIZE_X1 EGR_X2 CR_X3 DER_X4 ROA_X5
Mean 1.61777 14.7607 0.35493 3.37053 0.78794 0.11317
Maximum 5.52762 17.2734 6.92928 9.44105 2.62851 0.43240
Minimum 0.20000 12.5112 -0.74518 1.13194 0.15364 0.00660
Std. Dev 1.46358 1.46087 1.21819 2.16758 0.65176 0.09654
Observations 60 60 60 60 60 60
5.2. Multiple Regression Analysis
Table 3 shows the result of multiple regression by adopting random effect model.
Table 3. Multiple Regression Analysis Result Variable Coefficient Std. Error t-Statistic Prob.
Page 11
P. Purwanto, J. Agustin
453
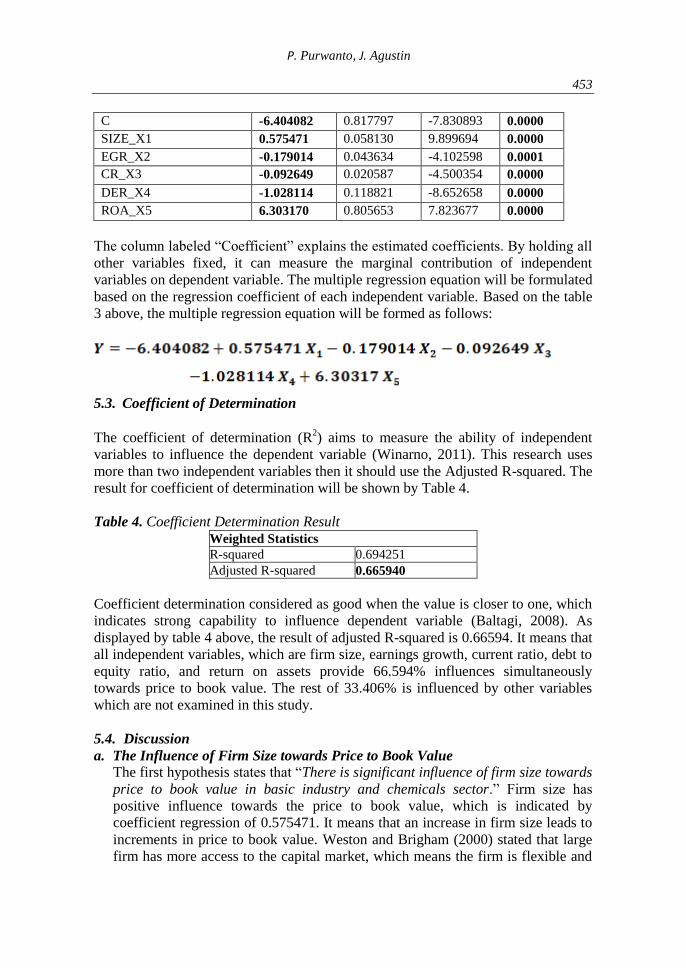
C -6.404082 0.817797 -7.830893 0.0000
SIZE_X1 0.575471 0.058130 9.899694 0.0000
EGR_X2 -0.179014 0.043634 -4.102598 0.0001
CR_X3 -0.092649 0.020587 -4.500354 0.0000
DER_X4 -1.028114 0.118821 -8.652658 0.0000
ROA_X5 6.303170 0.805653 7.823677 0.0000
The column labeled “Coefficient” explains the estimated coefficients. By holding all
other variables fixed, it can measure the marginal contribution of independent
variables on dependent variable. The multiple regression equation will be formulated
based on the regression coefficient of each independent variable. Based on the table
3 above, the multiple regression equation will be formed as follows:
5.3. Coefficient of Determination
The coefficient of determination (R
2) aims to measure the ability of independent
variables to influence the dependent variable (Winarno, 2011). This research uses
more than two independent variables then it should use the Adjusted R-squared. The
result for coefficient of determination will be shown by Table 4.
Table 4. Coefficient Determination Result Weighted Statistics
R-squared 0.694251
Adjusted R-squared 0.665940
Coefficient determination considered as good when the value is closer to one, which
indicates strong capability to influence dependent variable (Baltagi, 2008). As
displayed by table 4 above, the result of adjusted R-squared is 0.66594. It means that
all independent variables, which are firm size, earnings growth, current ratio, debt to
equity ratio, and return on assets provide 66.594% influences simultaneously
towards price to book value. The rest of 33.406% is influenced by other variables
which are not examined in this study.
5.4. Discussion
a. The Influence of Firm Size towards Price to Book Value
The first hypothesis states that “There is significant influence of firm size towards
price to book value in basic industry and chemicals sector.” Firm size has
positive influence towards the price to book value, which is indicated by
coefficient regression of 0.575471. It means that an increase in firm size leads to
increments in price to book value. Weston and Brigham (2000) stated that large
firm has more access to the capital market, which means the firm is flexible and
Page 12
Financial Performance towards Value of Firms in Basic and Chemicals Industry
454
has an ability to obtain funds in the short term from debtors or investors due to
more assets that they have, compared to small firms. Thus, the more total assets
owned by a firm, the larger a firm is which will cause a tendency to attract more
investors to the firm since large firms has better control towards market
conditions (Soliha and Taswan, 2002). The investors will seize such facility as a
positive signal and good prospect. As a result of many attracted investors, the
demand for its stocks will increase thus the price to book value will go up. This is
proven by the research of Hidayah (2014), who found that positive significant
influences between firm size and price to book value.
The result of this research also matches with the research done by Febrianti
(2012) and Sofyaningsih and Hardiningsih (2011) who proved that firm size has
positive and significant influence towards price to book value. Larger firm shows
that the firm has reached a stage of maturity where at this stage the firm generates
positive cash flow and is considered to have good prospects within a relatively
long term, but it also reflects that the firm is relatively more stable and able to
generate profits better than firm with small number of total assets. Based on the
discussion above, it can be concluded that in case of basic industry and chemicals
sector for period of 2009 to 2014, investors prefer large firms than small firms to
invest their money in due to the flexibility and stability large firms have.
b. The Influence of Earnings Growth towards Price to Book Value
The second hypothesis states that “There is significant influence of earnings
growth towards price to book value in basic industry and chemicals sector.
Earnings growth has negative influence towards the price to book value, which is
indicated by coefficient regression of -0.179014. It means that an increase in
earnings growth will decrease the price to book value. Febrianti (2012) stated
that the more rapid the growth rates of a firm, the more funds needed to finance
the expansion. Brigham and Gapenski (1997) state that firm with high growth
rates tends to require huge amount of funding from external sources.
Due to the greater need for funds, the firm tends to have more retained earnings
which resulting in smaller dividend to stockholders. As the low dividend-paying
ability, the firm will no longer attractive to investors, therefore the demand for
the stock will decrease and price to book value will decline. This indicates that
firm with high growth will be responded negatively by investors. This founding
is supported by Kuswanto and Taufiq (2010) who found negative and significant
influence of earnings growth towards price to book value. The investors prefer to
invest their money in more stable firm rather than firm with rapid growth which
needs more financing; therefore, it will affect its price to book value.
c. The Influence of Current Ratio towards Price to Book Value
Table 3 provides information to accept the third hypothesis which is “There is
significant influence of current ratio towards price to book value in basic
industry and chemicals sector.” The significant value of current ratio is 0.0000.
Page 13
P. Purwanto, J. Agustin
455
Current ratio has negative influence towards the price to book value, which is
indicated by coefficient regression of -0.092649. It means that an increase in
current ratio will decrease the price to book value. Theoretically, current ratio is
positively related to price to book value. The higher the current ratio is, the
higher the value of the firm, vice versa. Investors will respond positively to liquid
firms, as the result, the stock price will rise and price to book value will also
increase (Febrianti, 2012).
However, Riyanto (1995) stated that if the increasing liquidity does not raise the
dividends but increase the free cash flow within the firm, then there will be idled
money within the firm. A firm which has a high liquidity due to large amounts of
cash flow means the turnover rate is low and reflects the excess cash flow. High
liquidity value will have bad impact towards earnings power since there is idle
cash or excess working capital; the idle cash or excess fund will decrease the
opportunity to generate more earnings. Declining firm’s earnings will result in a
decline in stock prices, which means also price to book value will also go down.
The management considered the firm which has high liquidity demonstrated poor
management performance due to idle cash balances, excessive inventories or
ineffective firm's credit policy, resulting in high accounts receivable (Hanafi and
Halim, 1996).
Higher liquidity shows ineffectiveness of the firm's management to manage
excessive current assets, which can be used by the firm to pay dividends, pay
long-term debt, fund operations and investments with more returns rather than
being idle. Investors will seize it as a negative signal because firms have to bear
the capital costs, thus price to book value will decrease as investors’ confidence
in related firms are faded. This founding is supported by Lins and Kalcheva
(2007) who found that liquidity has negative and significant influence towards
value of firm.
Based on the discussion above, it can be concluded that current ratio has negative
significant influences to price to book value in basic industry and chemicals
sector. Negative sign explains that during 2009 to 2014 the firm's current assets
are rated by investors has not been effectively used for the operations so this may
result in decreased profits to be obtained by the firm thus reducing the demand
for the stocks.
d. The Influence of Debt to Equity Ratio towards Price to Book Value
The forth hypothesis states that “There is significant influence of debt to equity
ratio towards price to book value in basic industry and chemicals sector.” Debt
to equity ratio has negative influence towards the price to book value, which is
indicated by coefficient regression of -1.028114. It means that an increase in debt
to equity ratio will decrease the price to book value.
Page 14
Financial Performance towards Value of Firms in Basic and Chemicals Industry
456
The theory of Modigliani and Miller (1961) stated “Firms would be able to
increase its value when using the maximum debt in its capital structure.”That is,
the usage of debt gives positive influence towards value of firm since the interest
expense could reduce tax payments. Interest allows the reduction of tax payments
as an expense, but dividend payments to shareholders cannot be deducted.
However, this research finding contradicts with theory, the increasing debt will
negatively affect price to book value. The reason underlies in this result is
Modigliani and Miller theory abandoned the bankruptcy cost. The issue that
related to bankruptcy tends to occur when the firm uses more debt on its capital
structure (Brigham and Houston, 2001). When the bankruptcy cost is high, the
cost of debt will also arise because the creditors will charge higher interest rate to
compensate for the increase in bankruptcy risk.Instead, the present value of
financial distress may result in decreased value leveraged firm (Sartono, 2008).
The interest expense from debt usage will deduct the tax expense. However, the
excessive usage of debt will bring disadvantage for the firm since firm's
obligation to repay the loan and interest, thus, the interest will rise higher than the
tax savings (Sofyaningsih & Hardiningsih, 2011). It is supported by trade-off
theory in which the usage of debt will increase the value of firm only until
optimal point and after that point; the excess debt usage will decrease value of
firm (Hermuningsih, 2013). Based on trade-off theory, as long as the benefits are
greater, additional debt is allowed. If the costs for using debt are greater, then the
additional debt is not allowed because it will decrease value of the firm. Nasehah
and Widyarti (2012) found that debt to equity ratio has negative and significant
influence towards value of firm since the costs of using debt is greater than its
benefits.
As proposed by Warren et al. (2005) that "The smaller debt to equity ratio, the
better the firm's ability to survive in poor condition". Lower debt to equity ratio
indicates that the firm is still able to meet its obligations to creditors, which
suggests better financial performance of the firm (Gibson, 2011). The higher the
debt, the greater the risk of financial distress since the firm has to pay a huge
amount of interest to the debt holders, in accordance with uncertain future
earnings. The higher the debt to equity ratio shows the firm has relatively high
bankruptcy risk, consequently, investors tend to avoid stocks that have high debt
to equity ratio (Ang, 1997).
In addition, higher debt to equity ratio will affect the net earnings available to
stockholders; including dividends distributed; since its obligations to pay debts
take precedence over the distribution of dividends (Sartono, 2008).As the low
dividend-paying ability and high risk firm, the firm will no longer attractive to
investors, therefore the demand for the stock will decrease and price to book
value will decline. As a conclusion, this study which used basic industry and
chemicals in the period of 2009 to 2014 obtains the result that debt to equity ratio
Page 15
P. Purwanto, J. Agustin
457
has negative significant influences to price to book value since firms with high
debt to equity ratio is more risky and not attractive for investors.
e. The Influence of Return on Assets towards Price to Book Value
Table 3 provides information to accept the fifth hypothesis of “There is
significant influence of return on assets towards price to book value in basic
industry and chemicals sector” with the significant value of 0.0000. Return on
assets has positive influence towards the price to book value, which is indicated
by coefficient regression of 6.30317. It means that an increase in return on assets
will lead to increments of price to book value.
Signaling theory describes the urge of the firm to provide reliable financial
information to investors and creditors since there is asymmetry of information
(Febrianti, 2012). The published information is an announcement to give a signal
to investors in making investment decisions (Jogiyanto, 2010). If the information
contains good news, it is expected that the market will react to the information by
increasing stock price. Brigham & Houston (2006) mentioned that return on
assets shows the ability of a firm to gain profit from the utilized or invested assets
in a period. Therefore, increasing return on assets will increase the price to book
value since the higher the ratio level, the bigger the profitability of a firm. Then
the higher a firm’s ability to earn profit, the more efficient a firm’s management
(Gibson, 2011). As a result, such thing can be a positive sign for investors to
invest their money in order to obtain certain return.
The level of return obtained indicated how well the value of firm from investors’
point of view (Brigham and Houston, 2001). If the firm recorded a huge profit
level, it will motivate investors to invest in the stock. Indeed, the management
tries to give signal to investors about firm’s good prospect by publishing
financial report. Thus, based on the information about firm’s good prospect from
financial report, the stock price and demand for the stock will increase as well.
The rising stock price will increase the value of firm which is indicated by price
to book value. The finding of this research is in accordance with signaling theory,
in which the good information will attract investors to buy its stock; therefore
price to book value will increase. The result of this research is supported by
Hidayah (2014) and Marangu and Jagongo (2014) who found return on assets has
positive and significant influence towards price to book ratio.
Sofyaningsih and Hardiningsih (2011) also supported this statement by founding
positive and significant relation between return on assets and price to book value.
Firm with high profitability, is able to generate high profits to maintain equity
remained positive and even increased. Febrianti (2012) stated that firm which is
able to generate more profits are also likely be able to do the funding by its
internal cash resources, so it has smaller obligation to pay interest on the debt,
and the profit generated can be distributed to stockholders in the form of
dividends. Thus, the management tries to give signal to investors about firm’s
Page 16
Financial Performance towards Value of Firms in Basic and Chemicals Industry
458
good prospect by distributing dividends which is generated from high earnings so
the investors will respond positively and demand for the stocks is increasing,
resulting to the increments of price to book value (Febrianti, 2012).
As a conclusion, this study which used basic industry and chemicals in the period
of 2009 to 2014 obtains the result that return on assets has positive significant
influences to price to book value. It means that investors are keen to profitability
value before they make any investment decision.
f. Simultaneous Influence of Firm Size, Earnings Growth, Current Ratio, Debt to
Equity Ratio, and Return on Assets towards Price to Book Value
The hypothesis states that “There is significant simultaneous influence of firm
size, earnings growth, current ratio, debt to equity ratio, and return on assets
towards price to book value in basic industry and chemicals sector” is accepted.
This was proven by the probability value of f-statistic which is 0.0000 less than
0.05. All independent variables are simultaneously influence the dependent
variable. Firm size, earnings growth, current ratio, debt to equity ratio, and return
on assets are able to influence price to book value by 66.594% while the rest of
33.406% is influenced by other variables which are not examined in this study.
6. Conclusions and Recommendations
The larger firm size reflects that the firm is relatively more stable and able to
generate more profits. The investors will seize such facility as a positive signal and
good prospect. As a result, the demand for its stocks will increase thus the price to
book value will go up. The more rapid the growth rates of a firm, the more funds
needed to finance the expansion. Due to the greater need for funds, the firm tends to
have more retained earnings so dividend to stockholders will be smaller. Hence, the
firm will no longer attractive to investors, thus demand and price to book value of
stock will decline. Investors will seize it as a negative signal thus reducing the
demand and price to book value for the stocks.
However, it is in accordance with trade-off theory because the excessive usage of
debt will bring disadvantage for the firm since the firm has relatively high
bankruptcy risk, consequently, investors tend to avoid stocks that have high debt to
equity ratio. Therefore the demand for the stock will decrease and price to book
value will decline. The finding of this research is in accordance with signaling
theory, in which the management tries to attract investors to buy its stock by
publishing financial statements to show its good prospect. Firm with high
profitability is able to generate high profits. As a result, such thing can be a positive
sign for investors to invest their money in order to obtain certain return. Thus, the
stock price will increase and affect the price to book value positively.
We propose further study of this issue in another research with strong financial
performance, the firm should also have good management since it will stimulate
Page 17
P. Purwanto, J. Agustin
459
price to book value to go up. Also, the firm should have good debt management to
implement the trade-off theory to its best interest; to maximize benefits of debt
usage. A good management will lead to better financial performance.
References
Ang, R. 1997. Buku Pintar Pasar Modal Indonesia. Jakarta: Mediasoft Indonesia.
Baltagi, B.H. 2008. Econometrics. Verlag Berlin Heidelberg: Springer.
Brigham, E., Gapenski, I. 1996. Intermediate Financial Management. New York: The
Dryden Press.
Brigham, E. and Houston, J.F. 2001. Fundamentals of Financial Management. New York:
The Dryden Press.
Budi, E. S. and Rachmawati, E.N. 2014. Analisis Pengaruh Return on Equity, Debt to Equity
Ratio, Growth, dan Firm Size Terhadap Price to Book Value pada Perusahaan
Property dan Real Estate di Bursa Efek Indonesia. Jurnal Ekonomi, Manajemen dan
Akutansi I, 22, 41-60.
Damodaran, A. 2012. Investment Valuation: Tools and Technique for Determining the Value
of Any Asset. Canada: Wiley Finance.
Febrianti, M. 2012. Faktor-Faktor yang Mempengaruhi Nilai Perusahaan pada Industri
Pertambangan di Bursa Efek Indonesia. Jurnal Bisnis dan Akuntansi, 14, 141-156.
Fetai, B. 2015. Financial Integration and Financial Development: Does Financial Integration
Matter? European Research Studies Journal, 18(2), 97-106.
Gibson, C.H. 2011. Financial Statement Analysis. Canada: South-Western, Cengage
Learning.
Glavina, S. 2015. Influence of Globalization on the Regional Capital Markets and
Consequences; Evidence from Warsaw Stock Exchange. European Research Studies
Journal, 18(2), 117-134.
Gujarati, D.N. 2004. Basic Econometrics.USA: McGraw Hill.
Hanafi, M., and Halim, A. 1996. Analisis Laporan Keuangan. Yogyakarta: UPP AMP
YKPN.
Hermuningsih, S. 2013. Pengaruh Profitabilitas, Growth Opportunity, Struktur Modal
Terhadap Nilai Perusahaan pada Perusahaan Publik di Indonesia. Buletin Ekonomi
Moneter dan Perbankan.
Hidayah, N. 2014. The Effect of Company Characteristics Toward Firm Value in the
Property and Real Estate Company in Indonesia Stock Exchange. International
Journal of Business, Economics and Law, 5(1), 1-8.
Husnan, S. 2005. Dasar-Dasar Teori Portofolio dan Analisis Sekuritas, Edisi Kelima.
Yogyakarta: BPFE.
Jantana, I. 2012. Pengaruh Struktur Modal, Profitabilitas, dan Likuiditas Terhadap Nilai
Perusahaan pada Perusahaan Sektor Barang Konsumsi Sub-Sektor Rokok di BEI
Tahun 2007-2011. Jurnal Manajemen, Strategi Bisnis, dan Kewirausahaan , 1-30.
Jogiyanto, H. 2010. Teori Portofolio dan Analisis Investasi, Edisi Ketujuh. Yogyakarta:
BPFE.
Kuswanto, H. and Taufiq, M. 2010. Pengaruh Faktor Fundamental Perusahaan Terhadap
Price to Book Value dan Implikasinya pada Return Saham di Bursa Efek Indonesia.
Jurnal Bisnis dan Ekonomi, 9, 187-221.
Lins, K., Kalcheva, I. 2007. International Evidence on Cash Holdings and Expected
Managerial Agency Problems. The Review of Financial Studies, 1087-1112.
Page 18
Financial Performance towards Value of Firms in Basic and Chemicals Industry
460
Mahendra, A.D., Artini, L.G., Suarjaya, A.G. 2012. Pengaruh Kinerja Keuangan Terhadap
Nilai Perusahaan Pada Perusahaan Manufaktur Di Bursa Efek Indonesia. Jurnal
Manajemen, Strategi Bisnis, dan Kewirausahaan, 6, 130-138.
Marangu, K. and Jagongo, A. 2014. Price to Book Value Ratio and Financial Statement
Variables (An Empirical Study of Companies Quoted At Nairobi Securities
Exchange, Kenya). Global Journal of Commerce & Management Perspective, 50-
56.
Miller, M. and Modigliani, F. 1961. Dividend Policy, Growth and Valuation of Shares.
Journal of Business, 411-413.
Nasehah, D. and Widyarti, E.T. 2012. Analisis Pengaruh ROE, DER, DPR, Growth dan Firm
Size Terhadap Price to Book Value (Studi Kasus pada Perusahaan Manufaktur yang
Listed di BEI Periode Tahun 2007-2010). Diponegoro Journal of Management, 1(1),
1-9.
Riyanto, B. 1995. Dasar-dasar Pembelanjaan Perusahaan. Yogyakarta: BPFE.
Rupeika-Apoga, R. and Nedovis Uraev, R. 2015. The Foreign Exchange Exposure of Non-
Financial Companies in Eurozone: Myth or Reality? International Journal of
Economics and Business Administration, 3(1), 54-66.
Sofyaningsih, S. and Hardiningsih, P. 2011. Ownership Structure, Dividend Policy, Debt
Policy and Firm Value. Dinamika Perbankan dan Keuangan, 3, 68-87.
Soliha, E. and Taswan, T. 2002. Pengaruh Kebijakan Hutang Terhadap Nilai Perusahaan
serta Beberapa faktor yang Mempengaruhinya. Jurnal Bisnis Dan Ekonomi, 9, 22-
31.
Sartono, A. 2008. Manajemen Keuangan Teori dan Aplikasi. Yogyakarta: BPFE.
Sekaran, U. and Bougie, R. 2011. Research Methods for Business. Great Britain: Wiley.
Schwert, G.W. 2010. Descriptive Statistic & Test, from E-Views 7 User's Guide I:
http://schwert.ssb.rochester.edu/a425/EV71.pdf
Tandelilin, E. 2010. Portofolio dan Investasi: Teori dan Aplikasi. Yogyakarta: Kanisius.
Tcvetkov M., Tcvetkova I. and Chkalova O. 2015. Transaction Costs under Globalization:
The Example of Russian Economy. European Research Studies Journal, 18(2), 107-
116.
Thalassinos, I.E. 2008. Trends and Developments in the European Financial
Sector. European Financial and Accounting Journal, 3(3), 44-61.
Thalassinos, I.E., Ugurlu, E. and Muratoglu, Y. 2012. Income Inequality and Inflation in the
EU. European Research Studies Journal, 15(1), 127-140.
Thalassinos, I.E. and Liapis K. 2014. Segmental financial reporting and the
internationalization of the banking sector. Chapter book in, Risk Management:
Strategies for Economic Development and Challenges in the Financial System,(eds),
D. Milos Sprcic, Nova Publishers, 221-255.
Thalassinos, I.E., Pintea, M., Raţiu, I.P. 2015. The Recent Financial Crisis and Its Impact on
the Performance Indicators of Selected Countries during the Crisis Period: A Reply.
International Journal of Economics and Business Administration, 3(1), 3-20.
Ugurlu, E., Thalassinos, I.E., Muratoglu, Y. 2014. Modeling Volatility in the Stock Markets
using GARCH Models: European Emerging Economies and Turkey. International
Journal of Economics and Business Administration, 2(3), 72-87.
Weston, J. and Brigham, E. 2004. Essential of Managerial Finance. USA: The Dryden Press
Harcouft Brace College Publishing.
Widoatmodjo, S. 2009. Pasar Modal Indonesia. Jakarta: Ghalia Indonesia.
Winarno, Wing Wahyu 2011. Analisis Ekonometrika dan Statistika dengan EViews.
Yogyakarta: Unit Penerbit dan Percetakan STIM YKPN Yogyakarta.