34
DR.V.N.BEDEKAR INSTITUTE MANAGEMENT STUDIES MMS I DIV B SUBJECT : FINANCIAL ACCOUNTING TOPIC : RATIO ANALYSIS OF ASIAN PAINTS SUBMITTED TO : PROF. SMITA JAPE MA’AM
| Date post: | 13-Jul-2015 |
| Category: |
Education |
| Upload: | tushar-sadhye |
| View: | 818 times |
| Download: | 8 times |

DR.V.N.BEDEKAR INSTITUTE MANAGEMENT
STUDIES
MMS I DIV B
SUBJECT : FINANCIAL ACCOUNTING
TOPIC : RATIO ANALYSIS OF ASIAN PAINTS
SUBMITTED TO : PROF. SMITA JAPE MA’AM

Group Members
Sonali Sakpal 48
Sayali Phatak 44
Tanvi Pawar 43
Nikita Rathod 46
Nikita Watve 55
Tushar Sadhye 47
Vikrant Pokharkar 45

RATIO ANALYSIS
Ratio analysis is the process of determining and
interpreting numerical relationship based on
financial statements. It is the technique of
interpretation of financial statements with the
help of accounting ratios derived from the
balance sheet and profit and loss account.

Basis Of Comparision
Trend Analysis involves comparison of a firm over a period of time, that is, present ratios are compared with past ratios for the same firm. It indicates the direction of change in the performance –improvement, deterioration or constancy – over the years.
Interfirm Comparison involves comparing the ratios of a firm with those of others in the same lines of business or for the industry as a whole. It reflects the firm’s performance in relation to its competitors.
Comparison with standards or industry average
Ways To Interpret Accounting
Ratios
Single absolute ratio.
Group ratio.
Historical comparison.
Inter-firm comparison.
Projected ratios.

Classification Of Ratios
Category Also Called Measures
Liquidity Ratios Solvency Ratios Company’s ability in the
near future to pay its debts
as they become due
Profitability Ratios Margin Ratios Company’s success-or
failure-at earning a
profit(i.e., generating more
revenues than expenses
Asset Management
Ratios
Turnover Ratios
Efficiency Ratios
Activity Ratios
Company’s effectiveness at
using various assets
Leverage Ratios Coverage ratios
Capital
Structure Ratio
Company’s long-term ability
to pay debt as it becomes
due

Topic for observation

Asian Paint 70 years of innovation in paint
Since its foundation in 1942,
India’s largest and Asia’s third largest paint company, with a turnover of Rs.127.15 billion.
Asian Paints operates in 17 countries and has 23 paint manufacturing facilities in the world servicing consumers in over 65 countries.
Category - Paints/ Varnishes
Competitors- Jenson & Nicolson India, Kansai Nerolac, Akzonobel, Sherwin-Williams, Nippon Paints, PPG Industries Inc.

BALANCE SHEET RATIOS
CURRENT RATIO
QUICK RATIO
DEBT EQUITY RATIO
CURRENT RATIO
Working Capital Ratio or Solvency Ratio
Express the relationship between Current Assets & Current
Liabilities.
Current Ratio = Current Assets :: Current Liabilities
Standard Current Ratio = 2:1 is considered to be satisfactory.

SIGNIFICANCE & PURPOSE
Significance
Test of Credit strength & solvency of an organization.
Indicates the strength of the working capital (CA-CL).
Company’s ability to meet its day-to-day financial obligation.
Purpose
Serves index of short–term solvency.
Index of the strength of working capital of an organization.

ASIAN PAINTS RELATED CURRENT
RATIO ANALYSIS
Ratio less than 1.00 may
indicate liquidity issues.
Ratio between 1.00 and
2.00 is sufficient.
It can meet its short term
obligations with short
term assets.
CR in 2014 < CR in 2013
as CA > in 2014 but CL has
also > in 2014.

QUICK RATIO
Acid Test Ratio
Measures the ability of a company to
use its near cash or quick assets to
pay off its debts
An indicator of a company’s short-
term liquidity

Significance of Quick Ratio
Measure of a company's ability to settle its current
liabilities on a very short notice.
May provide a misleading indication of a company's
liquidity position
More reliable measure of liquidity for manufacturing
companies and construction firms that have relatively high
levels of inventory, work in progress and receivables
More conservative version of current ratio.
More rigorous assessment of a company's ability to pay
its current liabilities

Cash in hand + Cash at Bank +Receivables +
Marketable Securities Inventories
Current Liabilities – Provisions
Quick Ratio of 2014,
= 3122.77 + 478.6 – 1665.05
2423.55 – 617.72
Quick Ratio of 2013,
= 2681.53 + 362.61 – 1480.79
2078.94 – 500.32
Quick Ratio Will be calculated
as follows-
A quick ratio of 1.00 or 1:1 means that the most liquid assets of a business are equal to its total debts
More than one indicates that the most liquid assets of a business exceed its total debts.
Less than one indicates that a business would not be able to repay all its debts by using its most liquid assets.
Thus we conclude that, generally, a higher quick ratio is preferable because it means greater liquidity and a lower quick ratio company indicates a relatively lower liquidity position than its competitors.
Low or decreasing quick ratios generally suggest that a company is over-leveraged, struggling to maintain or grow sales, paying bills too quickly or collecting receivables too slowly
Analysis
Debt Equity ratio
It indicates what proportion of equity
and debt the company is using to finance
its assets.
Formulae:
Debt:equity ratio=debt/equity
Standard ratio of debt equity is 2:1
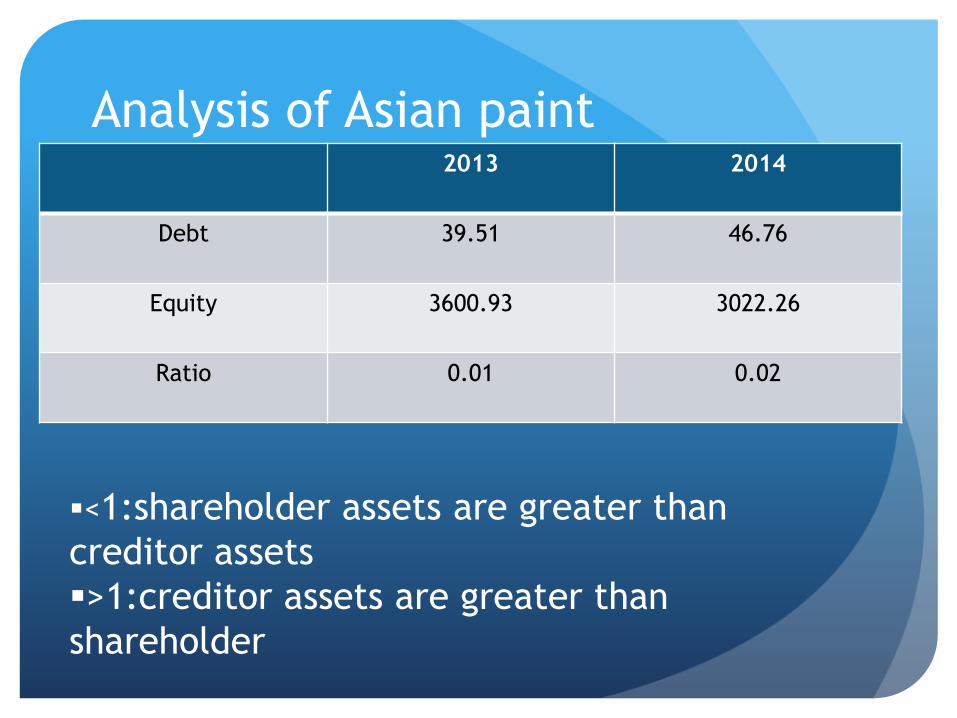
Analysis of Asian paint2013 2014
Debt 39.51 46.76
Equity 3600.93 3022.26
Ratio 0.01 0.02
<1:shareholder assets are greater than
creditor assets
>1:creditor assets are greater than
shareholder

Profitability Ratio
A profitability ratio is a measure of profitability, which is a
way to measure a company's performance. Profitability is
simply the capacity to make a profit, and a profit is what is
left over from income earned after you have deducted all
costs and expenses related to earning the income.
DEFINITION OF ‘GROSS PROFIT’
A company's revenue minus its cost of goods sold. Gross
profit is a company's residual profit after selling a
product or service and deducting the cost associated
with its production and sales.

Significance:-
It is a profitability ratio measuring what proportion of
revenue is converted into gross profit .
Formula:
GP RATIO = 𝑔𝑟𝑜𝑠𝑠 𝑝𝑟𝑜𝑓𝑖𝑡
𝑛𝑒𝑡 𝑠𝑎𝑙𝑒𝑠*100
GROSS PROFIT = REVENUE - COST OF GOODS SOLD
GROSS PROFIT RATIO
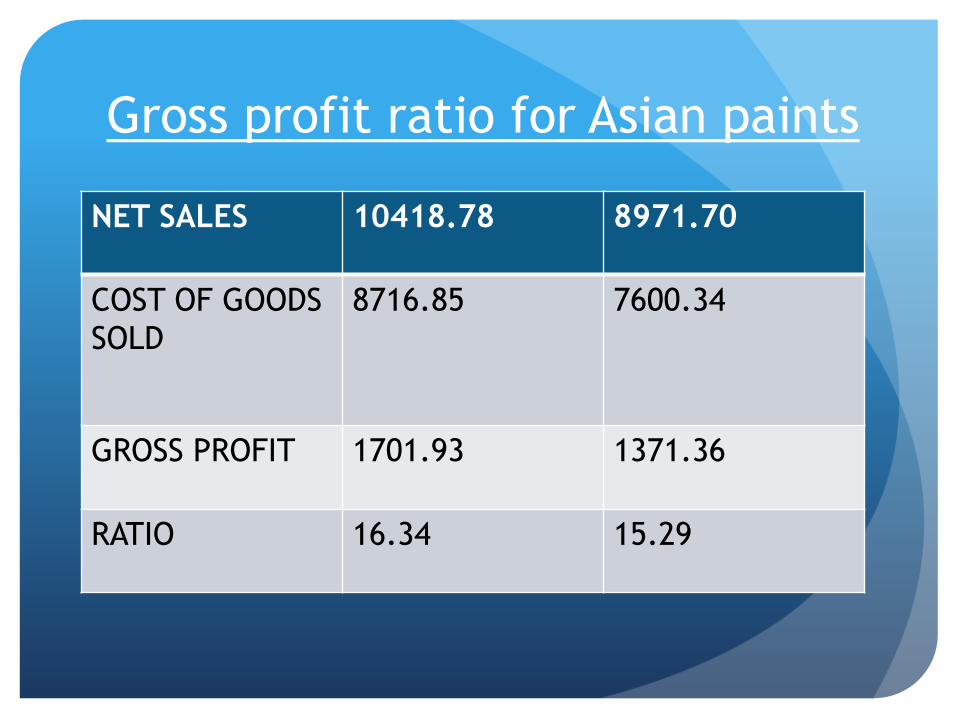
Gross profit ratio for Asian paints
NET SALES 10418.78 8971.70
COST OF GOODS
SOLD
8716.85 7600.34
GROSS PROFIT 1701.93 1371.36
RATIO 16.34 15.29

ANALYSIS:
The ideal level of gross profit margin depends on
the industries, how long the business has been
established and other factors.
High gross profit margin indicates that the
company can make a reasonable profit, as long as
it keeps the overhead cost in control.
Low gross profit margin indicates that the business
is unable to control its production cost.

Gross profit ratio is high in current year than that of
previous year which shows increase in profit which
indicates that even the small changes in gross profit can
affect profitability of the company significantly.
In current year it is shown that we have profit to cover
indirect expenses whichever are there for company.
It is showing that there is increase in gross profit ratio
from that of previous year which indicates company’s
growth.

Net Profit Ratio The net profit percentage is the ratio of after-tax profits to
net sales. It reveals the remaining profit after all costs of
production, administration, and financing have been deducted
from sales, and income taxes recognized.
Formula:-
Net Profit Ratio = 𝑁𝑒𝑡 𝑃𝑟𝑜𝑓𝑖𝑡 𝐴𝑓𝑡𝑒𝑟 𝑇𝑎𝑥
𝑁𝑒𝑡 𝑆𝑎𝑙𝑒𝑠x 100
Here,
NPAT = Gross Profit – Operating expenses –Tax
Net Sales = Gross Sales – Sales returns
Significance:-
Useful tool for profitability measurement.
Provides clues to company.
Acts as an indicator of risk/safety and efficiency of the
company.
Importance of net profit to different parties related to
business-
Owners
Investors
Creditors
Competitors
Government

Net Profit ratio =
𝑁𝑃𝐴𝑇
𝑁𝑒𝑡 𝑆𝑎𝑙𝑒𝑠x 100
For The Year
Ended March
2013
In Rs.(Cr)
For The Year
Ended March
2014
In Rs.(Cr)
NPAT 1050.00 1169.06
Net Sales 8971.70 10418.78
Net Profit Ratio 11.70 % 11.22 %
Net Profit Ratio calculated for Asian Paints for the year ended
2013 & 2014

Analysis:- A high ratio indicates the efficient management of the affairs of
business.
Net Profit Ratio can vary significantly from business to business and
can be affected by internal and external factors, Examples of factors
that can affect the net profit ratio are as follows –
Industries & Segments
Selling Price
Cost of Factors
Efficiency
Taxation
Here, In this case of Asian Paints, the Net Profit Ratio has decreased from
11.70% in 2013 to 11.22% in 2014, which means company has failed to convert
its revenue into actual profit.
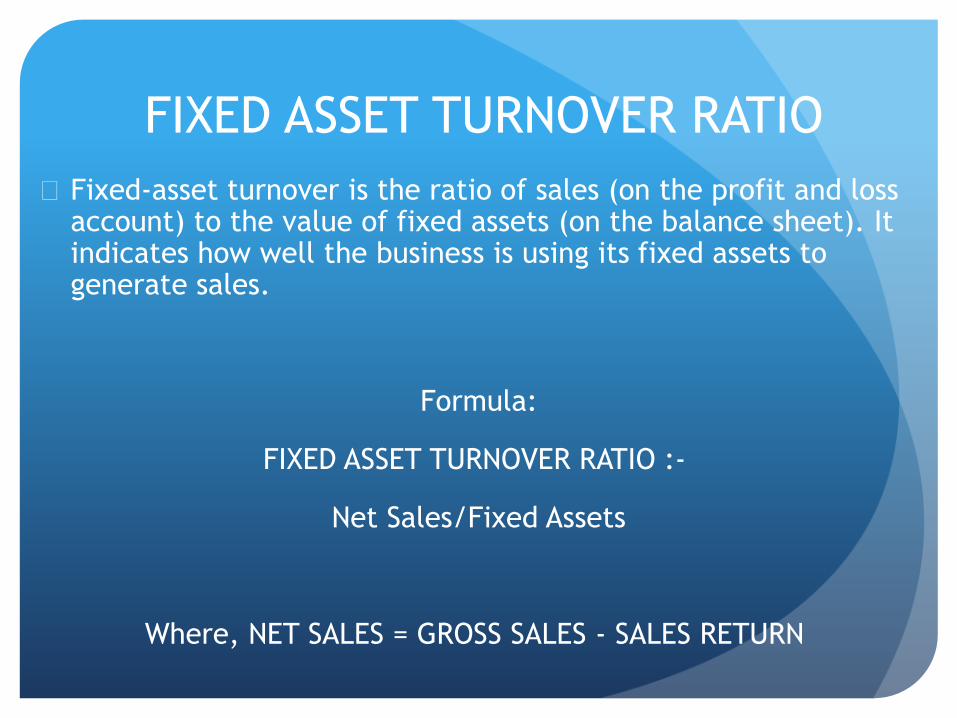
FIXED ASSET TURNOVER RATIO
Fixed-asset turnover is the ratio of sales (on the profit and loss account) to the value of fixed assets (on the balance sheet). It indicates how well the business is using its fixed assets to generate sales.
Formula:
FIXED ASSET TURNOVER RATIO :-
Net Sales/Fixed Assets
Where, NET SALES = GROSS SALES - SALES RETURN
Purpose of FATR
Ratio establishes a relationship between fixed assets and sales.
Higher ratio is better
Standard ratio:5 times
Comparison for year to year
Not useful for short term

Asian paints fixed assets turnover ratio

TRENDS OBSERVED

TRENDS OBSERVED

TRENDS OBSERVED
0
0.01
0.02
0.03
0.04
0.05
0.06
0.07
0.08
2013-2014 2012-2013 2011-2012
Trend in Debt Equity Ratio
Series1
10.9
11
11.1
11.2
11.3
11.4
11.5
11.6
11.7
11.8
2013-2014 2012-2013 2011-2012
Trend in Net Profit Ratio
Series1

THANK YOU


