26
FINANCIAL RATIO ANALYSIS
| Date post: | 25-Dec-2015 |
| Category: |
Documents |
| Upload: | frederick-mckenzie |
| View: | 215 times |
| Download: | 0 times |

FINANCIAL RATIO ANALYSIS

RATIO - MEANING
• Relationship or Proportion that one amount bears to another, the first number being the ‘Numerator’ & the later ‘Denominator’
OR• Relationship b/w two figures expressed
Mathematically

Advantages/Importance/Significance - Ratio Analysis
• Analytical Tool for measuring performance.• Ratios makes Comparison Easy.• Inter firm Comparison possible.• Ascertainment of Short term Liquidity & Long
term Solvency position possible.• Analysis about the STRENGTHS & WEAKNESSES
of the firm’s operations.• Analyze Past Performance & make further
projections.

TYPES OF RATIOS LIQUIDITY
CAPITAL STRUCTURE OR LEVERAGE
TURNOVER/ACTIVITY/PERFORMANCE
PROFITABILITY
MARKET INDICATORS

LIQUIDITY CURRENT RATIO
QUICK/ ACID TEST RATIO
ABSOLUTE LIQUID/SUPER QUICK RATIO
STOCK TO WORKING CAPITAL RATIO
INVENTORY TURNOVER RATIO
ACCOUNTS RECEIVABLE TURNOVER RATIO
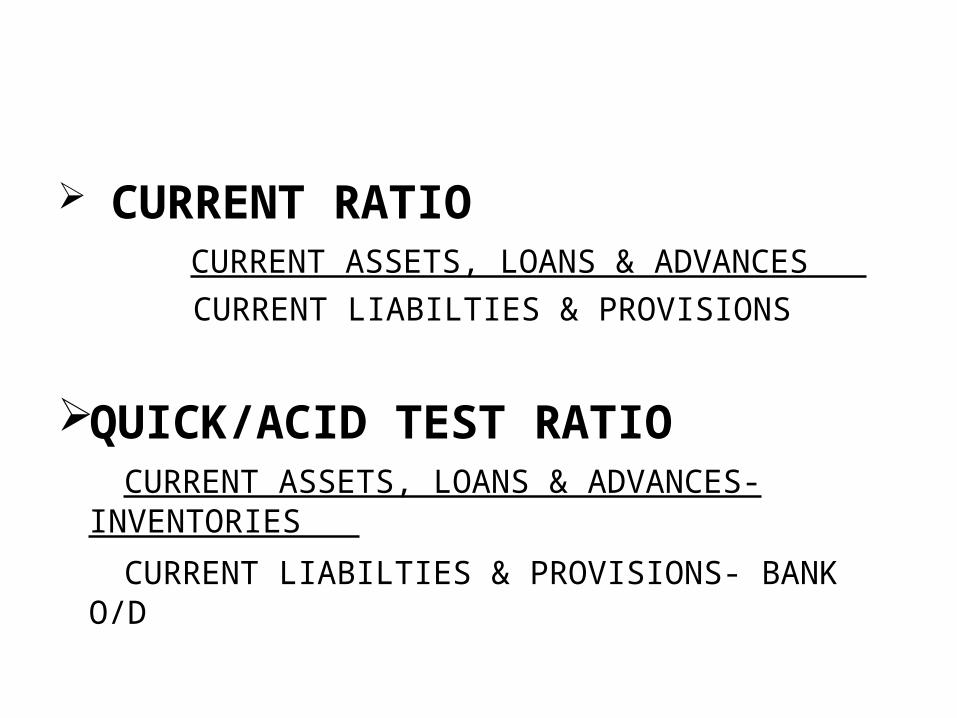
CURRENT RATIO CURRENT ASSETS, LOANS & ADVANCES CURRENT LIABILTIES & PROVISIONS
QUICK/ACID TEST RATIO CURRENT ASSETS, LOANS & ADVANCES-
INVENTORIES
CURRENT LIABILTIES & PROVISIONS- BANK O/D
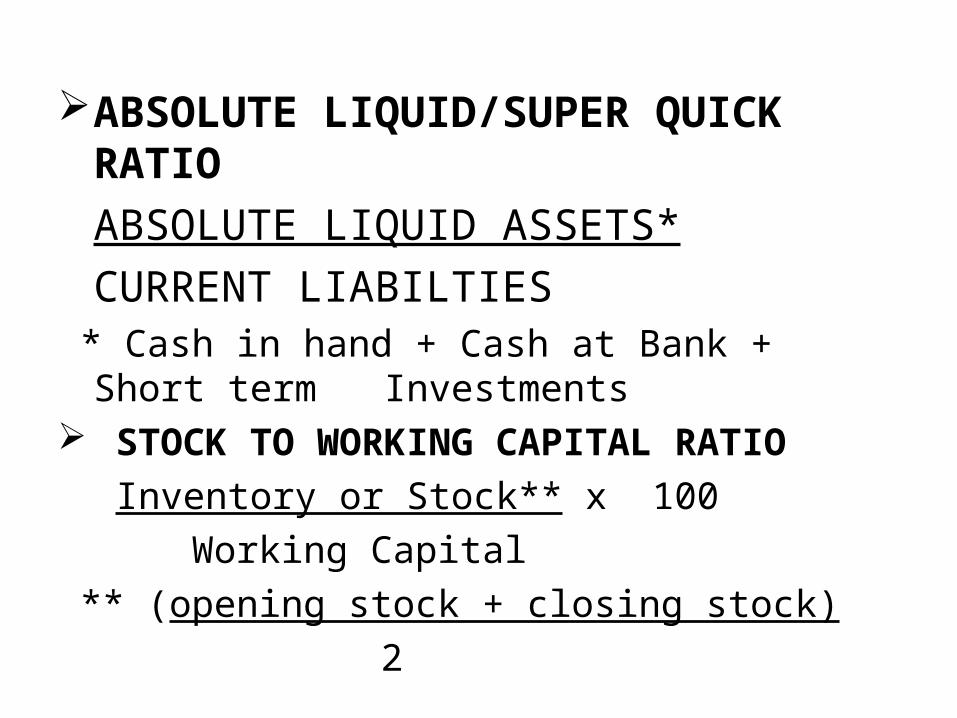
ABSOLUTE LIQUID/SUPER QUICK RATIOABSOLUTE LIQUID ASSETS*CURRENT LIABILTIES
* Cash in hand + Cash at Bank + Short term Investments
STOCK TO WORKING CAPITAL RATIO Inventory or Stock** x 100
Working Capital ** (opening stock + closing stock)
2
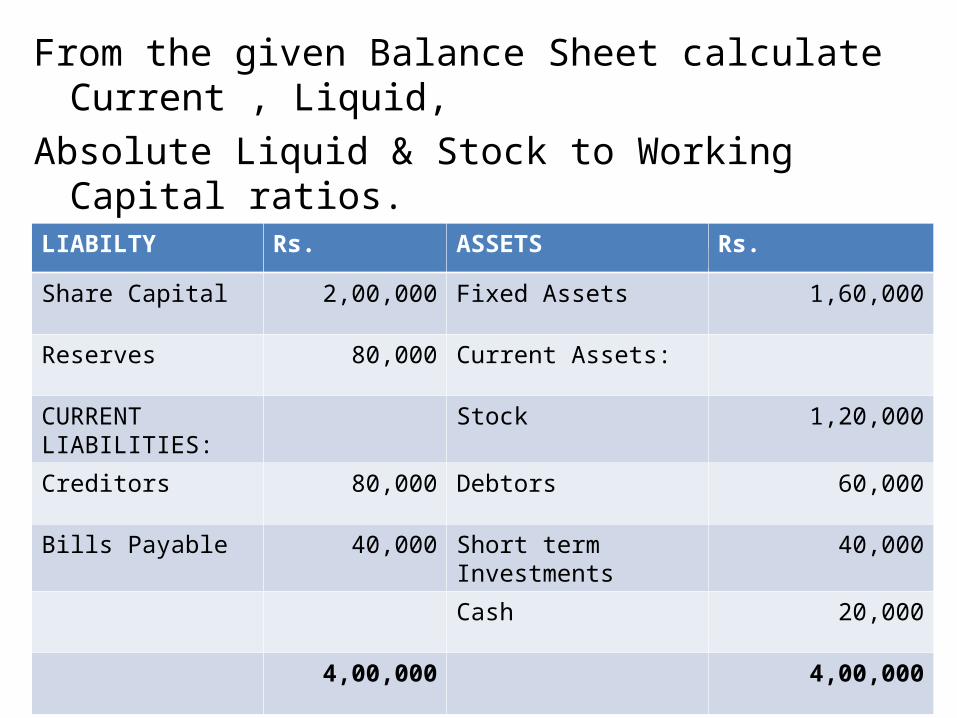
From the given Balance Sheet calculate Current , Liquid, Absolute Liquid & Stock to Working Capital ratios.
Balance Sheet
LIABILTY Rs. ASSETS Rs.
Share Capital 2,00,000 Fixed Assets 1,60,000
Reserves 80,000 Current Assets:
CURRENT LIABILITIES: Stock 1,20,000
Creditors 80,000 Debtors 60,000
Bills Payable 40,000 Short term Investments 40,000
Cash 20,000
4,00,000 4,00,000
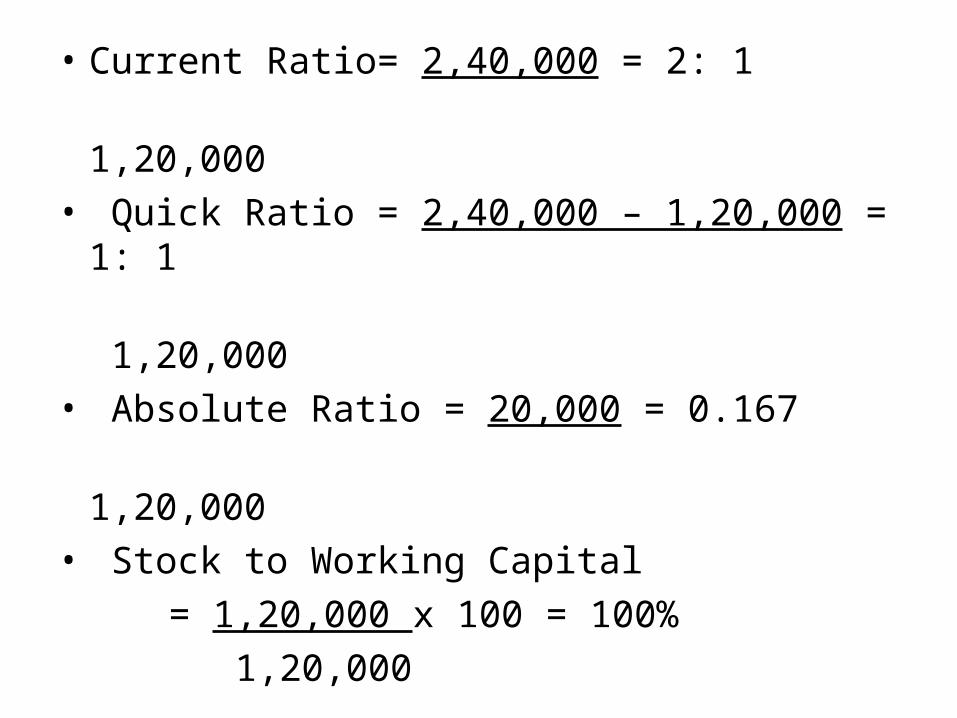
• Current Ratio= 2,40,000 = 2: 1 1,20,000• Quick Ratio = 2,40,000 – 1,20,000 = 1: 1 1,20,000• Absolute Ratio = 20,000 = 0.167 1,20,000• Stock to Working Capital = 1,20,000 x 100 = 100% 1,20,000

CAPITAL STRUCTURE OR LEVERAGE
• Shareholders Equity Ratio• Long Term Debt to Shareholders Net Worth
Ratio• Capital Gearing Ratio• Debt-Equity Ratio• Fixed Assets to Long term Funds Ratio• Proprietary or Net Worth Ratio• Current Assets to Net Worth
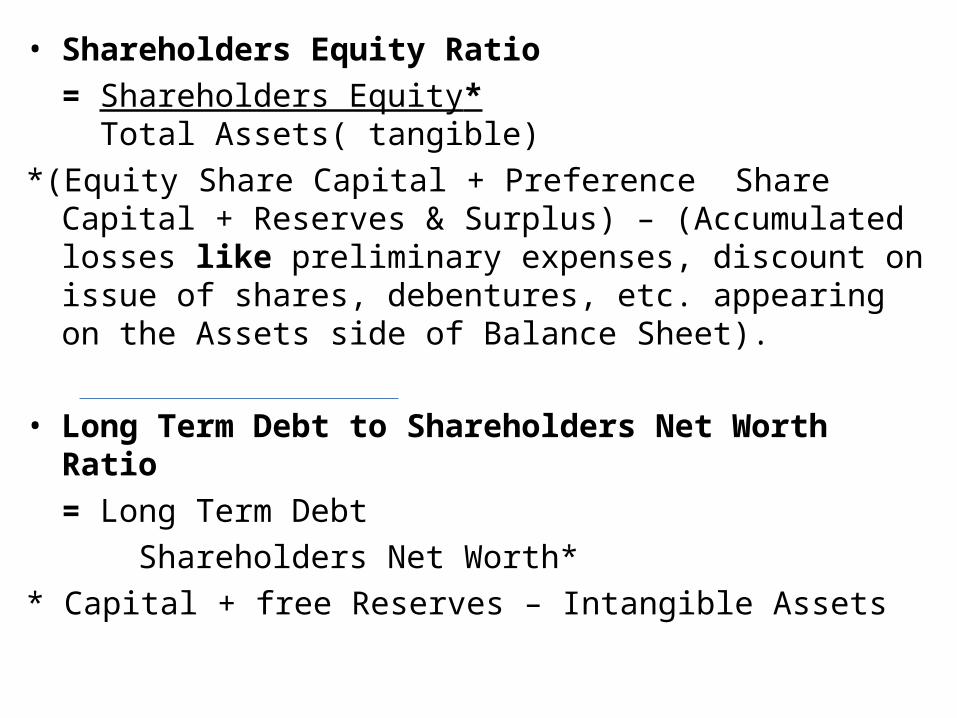
• Shareholders Equity Ratio= Shareholders Equity* Total Assets( tangible)
*(Equity Share Capital + Preference Share Capital + Reserves & Surplus) – (Accumulated losses like preliminary expenses, discount on issue of shares, debentures, etc. appearing on the Assets side of Balance Sheet).
• Long Term Debt to Shareholders Net Worth Ratio= Long Term Debt Shareholders Net Worth*
* Capital + free Reserves – Intangible Assets
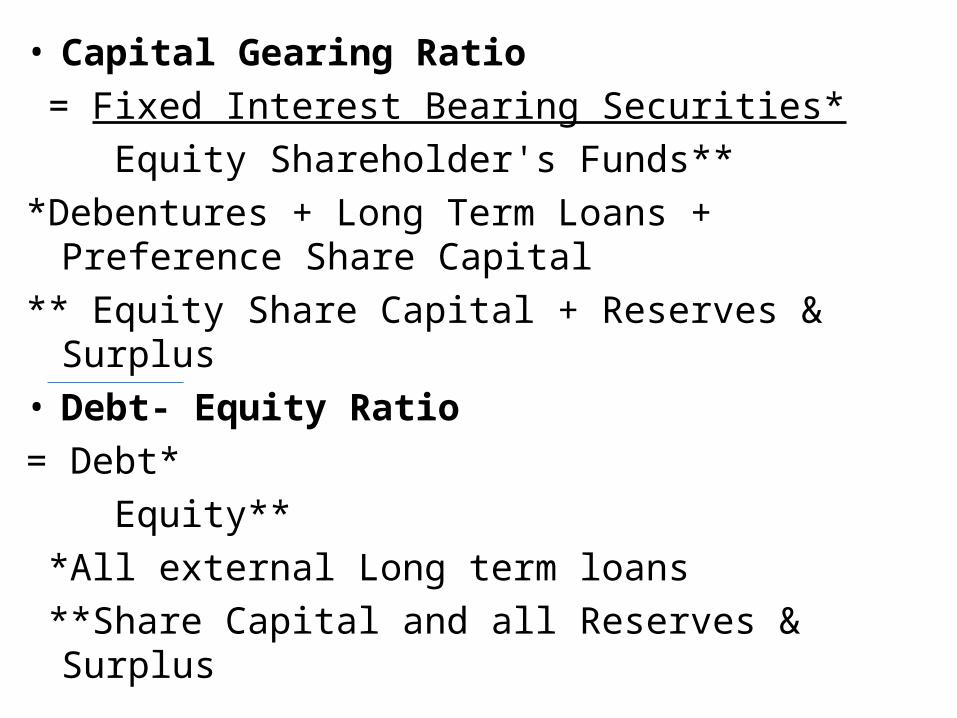
• Capital Gearing Ratio = Fixed Interest Bearing Securities* Equity Shareholder's Funds***Debentures + Long Term Loans + Preference Share Capital** Equity Share Capital + Reserves & Surplus• Debt- Equity Ratio= Debt* Equity** *All external Long term loans **Share Capital and all Reserves & Surplus
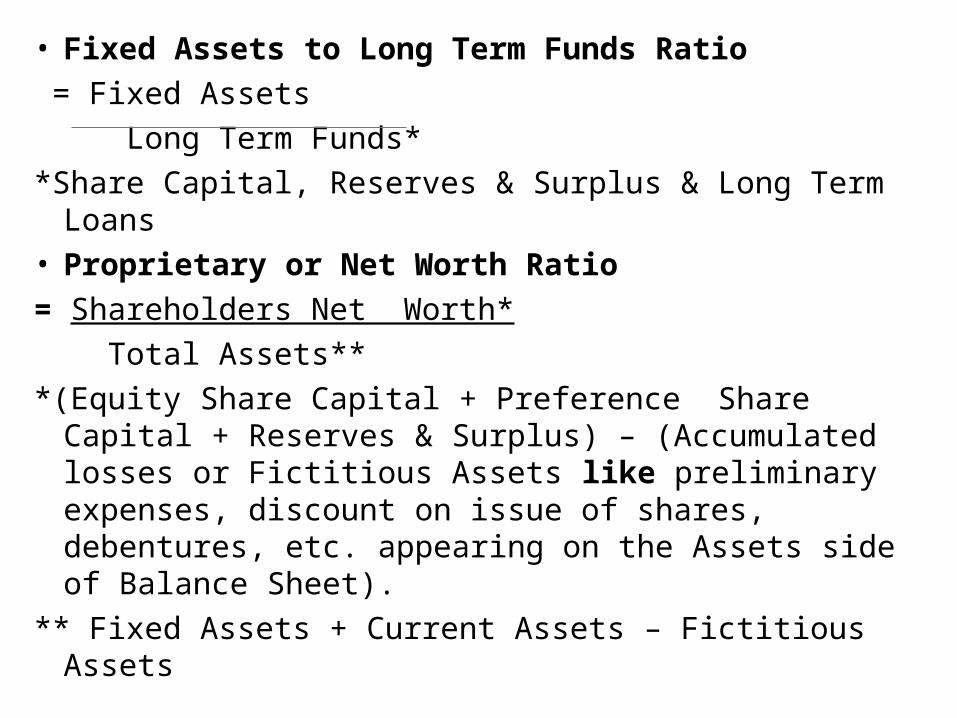
• Fixed Assets to Long Term Funds Ratio = Fixed Assets Long Term Funds**Share Capital, Reserves & Surplus & Long Term Loans• Proprietary or Net Worth Ratio= Shareholders Net Worth* Total Assets***(Equity Share Capital + Preference Share Capital +
Reserves & Surplus) – (Accumulated losses or Fictitious Assets like preliminary expenses, discount on issue of shares, debentures, etc. appearing on the Assets side of Balance Sheet).
** Fixed Assets + Current Assets – Fictitious Assets

• Current Assets to Net Worth= Current Assets Net Worth

TURNOVER/ACTIVITY/PERFORMANCE • Inventory Turnover Ratio• Inventory Ratio• Debtors Turnover Ratio• Debtors Collection Period or Debtors Velocity• Bad debts to Sales Ratio• Creditors Turnover Ratio• Creditors Payment Period or Creditors Velocity• Fixed Assets Turnover Ratio• Total Assets Turnover Ratio• Working Capital Turnover Ratio• Sales to Capital Employed
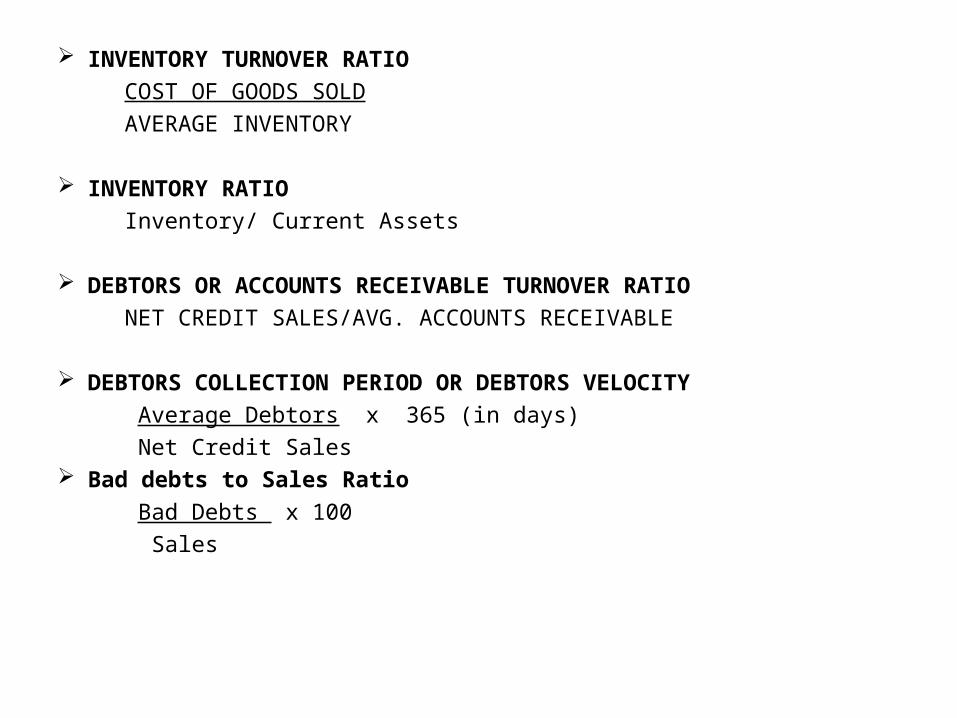
INVENTORY TURNOVER RATIO COST OF GOODS SOLD AVERAGE INVENTORY
INVENTORY RATIO Inventory/ Current Assets DEBTORS OR ACCOUNTS RECEIVABLE TURNOVER RATIO NET CREDIT SALES/AVG. ACCOUNTS RECEIVABLE
DEBTORS COLLECTION PERIOD OR DEBTORS VELOCITY Average Debtors x 365 (in days) Net Credit Sales Bad debts to Sales Ratio Bad Debts x 100 Sales

Creditors Turnover Ratio Net Credit Purchase Average A/c’s Payable Creditors Payment Period or Creditors Velocity Average A/c’s Payable x 365 (in days) Credit Purchases Fixed Assets Turnover Ratio Sales/ Fixed Assets Total Assets Turnover Ratio Sales/ Total Assets Working Capital Turnover Ratio Sales/ Working Capital Sales to Capital Employed Sales/ Capital Employed
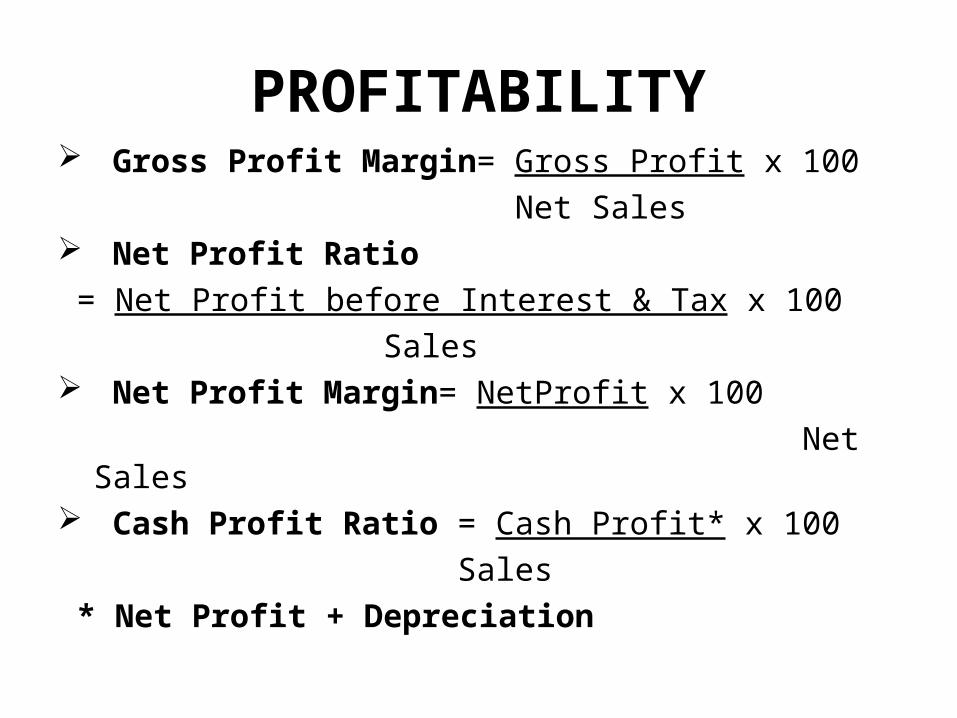
PROFITABILITY Gross Profit Margin= Gross Profit x 100 Net Sales Net Profit Ratio = Net Profit before Interest & Tax x 100 Sales Net Profit Margin= NetProfit x 100 Net Sales Cash Profit Ratio = Cash Profit* x 100
Sales * Net Profit + Depreciation
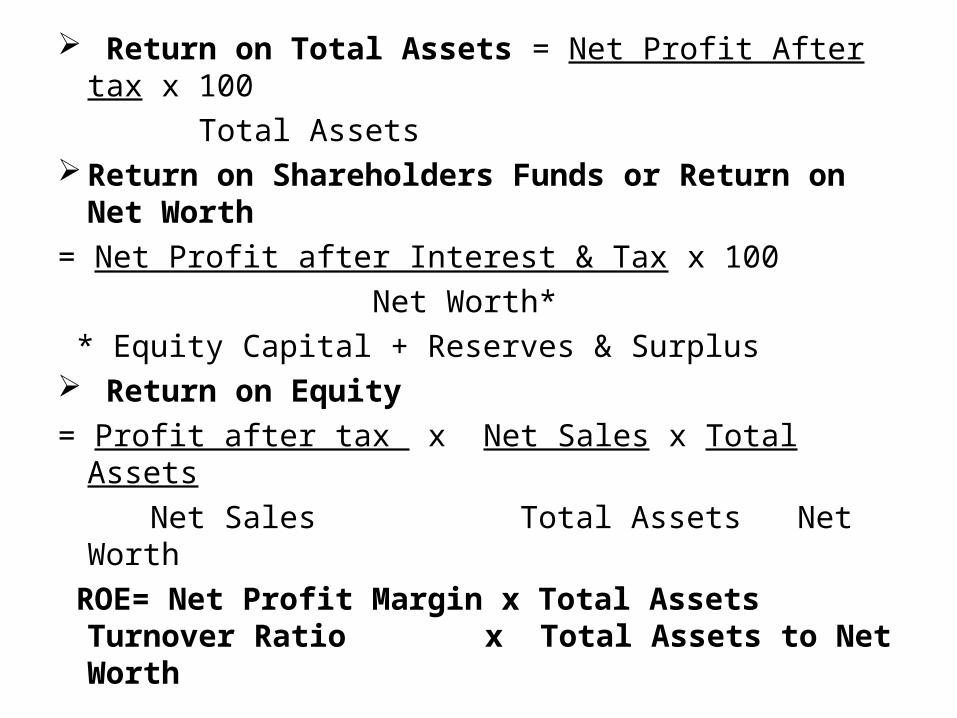
Return on Total Assets = Net Profit After tax x 100 Total Assets
Return on Shareholders Funds or Return on Net Worth
= Net Profit after Interest & Tax x 100 Net Worth* * Equity Capital + Reserves & Surplus Return on Equity= Profit after tax x Net Sales x Total Assets Net Sales Total Assets Net Worth ROE= Net Profit Margin x Total Assets Turnover Ratio
x Total Assets to Net Worth

Operating Ratio or Operating Cost Ratio= Operating Cost* x 100 Net Sales*Cost of Goods sold + Operating Expenses Interest Cover Ratio= Profit Before Interest, Depreciation & Tax Interest Expense Dividend Cover Ratio(i) Equity Dividend Cover = Net Profit after Tax- Preference Dividend
Equity Dividend(ii) Preference Dividend Cover = Net Profit after Tax Preference Dividend

Debt Service Coverage Ratio (DSCR)= Profit After tax+ Depreciation+ Interest on Loan Interest on Loan+ Loan Repayment in a year

MARKET INDICATORS OR MARKET BASED RATIOS Earnings per Share (EPS) = Net Profit after Tax- Preference Dividend No. of Equity Shares Price Earnings Ratio (P/E Ratio) = Current Market Price of Equity Share Earnings per Share Market Price to Book Value Ratio (P/BV Ratio) = Market Price Per Share
Book Value Per Share Cash Earnings Per Share Ratio = Net Profit after tax+ Depreciation No. of Equity Shares
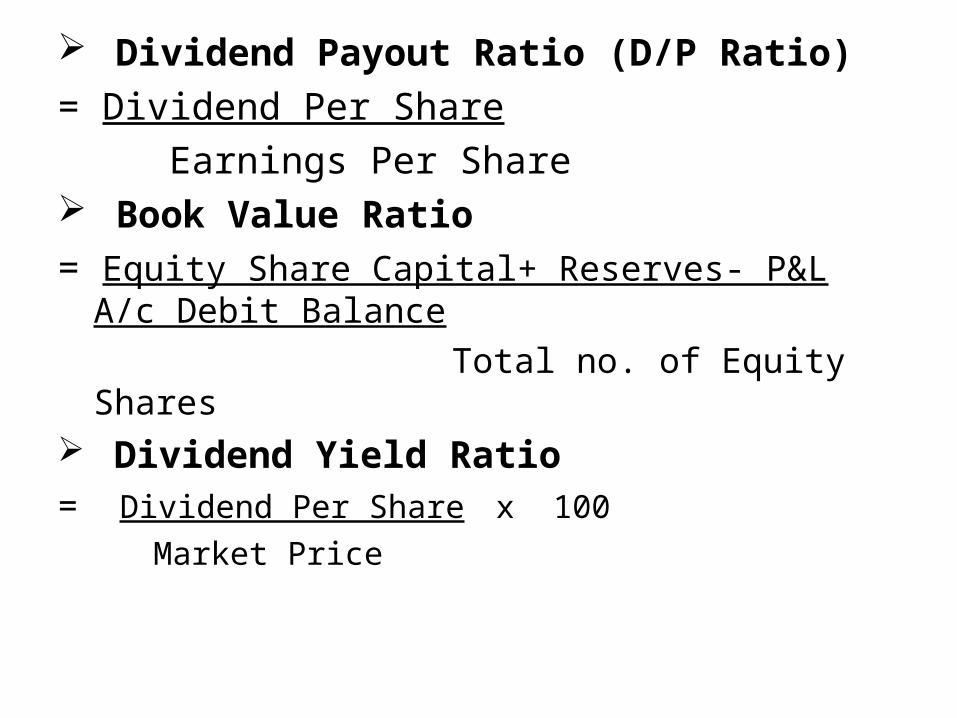
Dividend Payout Ratio (D/P Ratio)= Dividend Per Share Earnings Per Share Book Value Ratio= Equity Share Capital+ Reserves- P&L A/c Debit Balance Total no. of Equity Shares Dividend Yield Ratio= Dividend Per Share x 100 Market Price
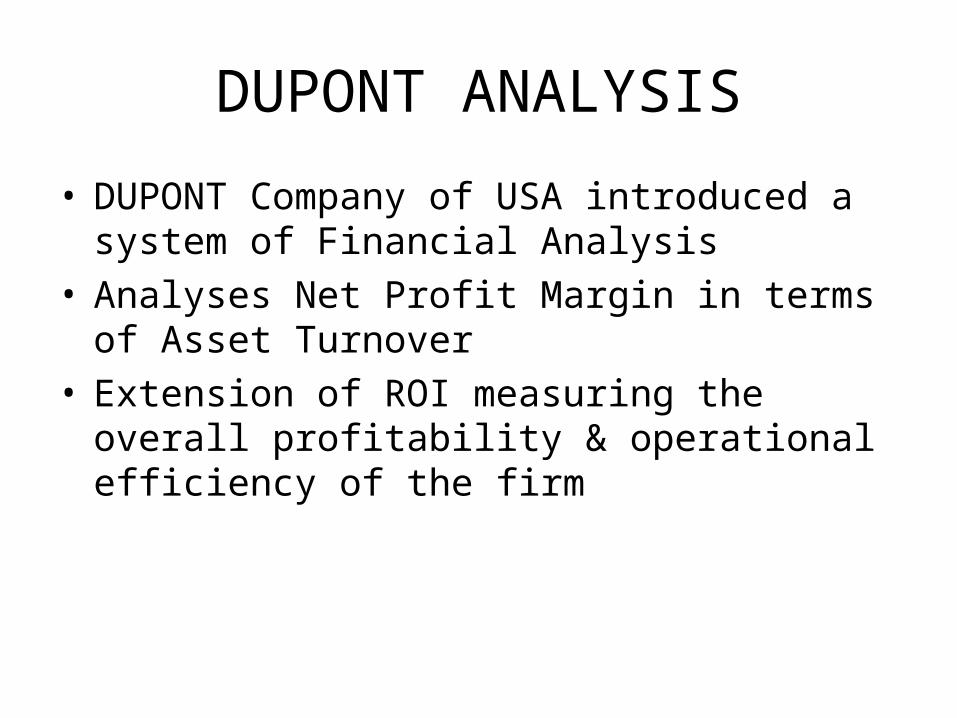
DUPONT ANALYSIS
• DUPONT Company of USA introduced a system of Financial Analysis
• Analyses Net Profit Margin in terms of Asset Turnover
• Extension of ROI measuring the overall profitability & operational efficiency of the firm

Advantages/ Uses of Dupont Analysis• Measuring the managerial performance by linking
the Net Profit Margin to Total Assets Turnover.• Segregation and Identification of factors that affect
the OVERALL PERFORMANCE of the company.• Considers INTERRELATIONSHIP of Accounting
Information given in the Financial Statements.• Comparative Analysis can be done


