33
Financial Ratio Cheatsheet MyAccountingCourse.com PDF PDF
| Date post: | 15-Jan-2017 |
| Category: |
Education |
| Upload: | psb-training-academy |
| View: | 272 times |
| Download: | 2 times |

Financial Ratio CheatsheetMyAccountingCourse.com
PDFPDF
Table of contentsLiquidity Ratios
Solvency Ratios
Efficiency Ratios
Profitability Ratios
Market Prospect Ratios
Coverage Ratios
CPA Exam Ratios to Know
CMA Exam Ratios to Know
3
8
12
17
23
28
31
32
Thanks for signing up for the MyAccountingcourse.com newletter.
This is a quick financial ratio cheatsheet with short explanations,
formulas, and analyzes of some of the most common financial
ratios. Check out www.myaccountingcourse.com/financial-ratios/
for more ratios, examples, and explanations.

Liquidity Ratios
Copyright © MyAccountingCourse.com | For personal use by the original purchaser only - financial ratio cheatsheet - page 3
Quick Ratio / Acid Test Ratio
Current Ratio
Working Capital Ratio
Times Interest Earned
Find more Liquidity Ratioson the myaccountingcourse.com financial ratios page.

Check out more exampleswww.myaccountingcourse.com/financial-ratios/quick-ratio
Quick RatioExplanation-The quick ratio or acid test ratio is a liquid-ity ratio that measures the ability of a com-pany to pay its current liabilities when they come due with only quick assets. Quick assets are current assets that can be con-verted to cash within 90 days or in the short-term. Cash, cash equivalents, short-term investments or marketable securities, and current accounts receivable are con-sidered quick assets.
Copyright © MyAccountingCourse.com | For personal use by the original purchaser only - financial ratio cheatsheet - page 4
-The quick ratio is often called the acid test ratio in reference to the historical use of acid to test metals for gold by the early miners. If the metal passed the acid test, it was pure gold. If metal failed the acid test by corroding from the acid, it was a base metal and of no value.
The acid test of finance shows how well a company can quickly convert its assets into cash in order to pay off its current li-abilities. It also shows the level of quick as-sets to current liabilities.
Analysis-The acid test ratio measures the liquidity of a company by showing its ability to pay off its current liabilities with quick assets. If a firm has enough quick assets to cover its total current liabilities, the firm will be able to pay off its obligations without having to sell off any long-term or capital assets.
Since most businesses use their long-term assets to generate revenues, selling off these capital assets will not only hurt the company it will also show investors that current operations aren’t making enough profits to pay off current liabilities.
-Higher quick ratios are more favorable for companies because it shows there are more quick assets than current liabilities. A company with a quick ratio of 1 indicates that quick assets equal current assets. This also shows that the company could pay off its current liabilities without selling any long-term assets. An acid ratio of 2 shows that the company has twice as many quick assets than current liabilities.
Formula

Current Ratio
Copyright © MyAccountingCourse.com | For personal use by the original purchaser only - financial ratio cheatsheet - page 5
Check out more examples www.myaccountingcourse.com/financial-ratios/current-ratio
Explanation-The current ratio is a liquidity and efficien-cy ratio that measures a firm’s ability to pay off its short-term liabilities with its cur-rent assets. The current ratio is an impor-tant measure of liquidity because short-term liabilities are due within the next year.
This means that a company has a limited amount of time in order to raise the funds to pay for these liabilities. Current assets like cash, cash equivalents, and market-able securities can easily
be converted into cash in the short term. This means that companies with larger amounts of current assets will more easily be able to pay off current liabilities when they become due without having to sell off long-term, revenue generating assets.
Analysis-The current ratio helps investors and credi-tors understand the liquidity of a company and how easily that company will be able to pay off its current liabilities. This ratio ex-presses a firm’s current debt in terms of current assets. So a current ratio of 4 would mean that the company has 4 times more current assets than current liabilities.
A higher current ratio is always more favor-able than a lower current ratio because it shows the company can more easily make current debt payments.
-If a company has to sell of fixed assets to pay for its current liabilities, this usually means the company isn’t making enough from operations to support activities. In other words, the company is losing money. Sometimes this is the result of poor collec-tions of accounts receivable.
The current ratio also sheds light on the overall debt burden of the company. If a company is weighted down with a current debt, its cash flow will suffer.
Formula

Check out more exampleswww.myaccountingcourse.com/financial-ratios/working-capital-ratio
Working Capital RatioExplanation-The working capital ratio, also called the current ratio, is a liquidity ratio that mea-sures a firm’s ability to pay off its current liabilities with current assets. The working capital ratio is important to creditors be-cause it shows the liquidity of the company.
Current liabilities are best paid with cur-rent assets like cash, cash equivalents, and marketable securities because these assets can be converted into cash much quicker than fixed assets.
Copyright © MyAccountingCourse.com | For personal use by the original purchaser only - financial ratio cheatsheet - page 6
The faster the assets can be converted into cash, the more likely the company will have the cash in time to pay its debts.
The reason this ratio is called the working capital ratio comes from the working capi-tal calculation. When current assets exceed current liabilities, the firm has enough capital to run its day-to-day op-erations. In other words, it has even capital to work. The working capital ratio trans-forms the working capital calculation into a comparison between current assets and current liabilities.
Analysis-Since the working capital ratio measures current assets as a percentage of current liabilities, it would only make sense that a higher ratio is more favorable. A WCR of 1 indicates the current assets equal current liabilities. A ratio of 1 is usually considered the middle ground. It’s not risky, but it is also not very safe. This means that the firm would have to sell all of its current assets in order to pay off its current liabilities.
A ratio less than 1 is considered risky by creditors and investors because it shows the company isn’t running efficiently and can’t cover its current debt properly. A ra-tio less than 1 is always a bad thing and is often referred to as negative working capital.
On the other hand, a ratio above 1 shows outsiders that the company can pay all of its current liabilities and still have current assets left over or positive working capital.
Formula

Times Interest Earned Ratio
Copyright © MyAccountingCourse.com | For personal use by the original purchaser only - financial ratio cheatsheet - page 7
Check out more examples www.myaccountingcourse.com/financial-ratios/times-interest-earned-ratio
Explanation-The times interest earned ratio, sometimes called the interest coverage ratio, is a cov-erage ratio that measures the proportion-ate amount of income that can be used to cover interest expenses in the future.
In some respects the times interest ratio is considered a solvency ratio because it measures a firm’s ability to make interest and debt service payments.
Since these interest payments are usually made on a long-term basis, they are often treated as an ongoing, fixed expense. As with most fixed expenses, if the company can’t make the payments, it could go bankrupt and cease to exist. Thus, this ratio could be considered a solvency ratio.
Analysis-The times interest ratio is stated in num-bers as opposed to a percentage. The ra-tio indicates how many times a company could pay the interest with its before tax income, so obviously the larger ratios are considered more favorable than smaller ratios.
In other words, a ratio of 4 means that a company makes enough income to pay for its total interest expense 4 times over. Said another way, this company’s income is 4 times higher than its interest expense for the year.
As you can see, creditors would favor a company with a much higher times inter-est ratio because it shows the company can afford to pay its interest payments when they come due. Higher ratios are less risky while lower ratios indicate credit risk.
Formula

Solvency Ratios
Copyright © MyAccountingCourse.com | For personal use by the original purchaser only - financial ratio cheatsheet - page 8
Debt to Equity Ratio
Equity Ratio
Debt Ratio
Find more Solvency Ratioson the myaccountingcourse.com financial ratios page.

Debt to Equity Ratio
Copyright © MyAccountingCourse.com | For personal use by the original purchaser only - financial ratio cheatsheet - page 9
Check out more examples www.myaccountingcourse.com/financial-ratios/debt-to-equity-ratio
Explanation-The debt to equity ratio is a financial, li-quidity ratio that compares a company’s total debt to total equity. The debt to eq-uity ratio shows the percentage of com-pany financing that comes from creditors and investors. A higher debt to equity ra-tio indicates that more creditor financing (bank loans) is used than investor financ-ing (shareholders).
- Each industry has different debt to equity ratio benchmarks, as some industries tend to use more debt financing than others. A debt ratio of .5 means that there are half as many liabilities than there is equity. In other words, the assets of the company are funded 2-to-1 by investors to creditors. This means that investors own 66.6 cents of every dollar of company assets while cred-itors only own 33.3 cents on the dollar.
A debt to equity ratio of 1 would means that investors and creditors have an equal stake in the business assets.
Analysis-A lower debt to equity ratio usually im-plies a more financially stable business. Companies with a higher debt to equity ratio are considered more risky to credi-tors and investors than companies with a lower ratio. Unlike equity financing, debt must be repaid to the lender. Since debt financing also requires debt servicing or regular interest payments, debt can be a far more expensive form of financing than equity financing. Companies leveraging large amounts of debt might not be able to make the payments.
Creditors view a higher debt to equity ratio as risky because it shows that the investors haven’t funded the operations as much as creditors have. In other words, investors don’t have as much skin in the game as the creditors do. This could mean that in-vestors don’t want to fund the business op-erations because the company isn’t per-forming well. Lack of performance might also be the reason why the company is seeking out extra debt financing.forming well. Lack of performance might also be the reason why the company is seeking out extra debt financing.
Formula

Check out more exampleswww.myaccountingcourse.com/financial-ratios/equity-ratio
Equity RatioExplanation-The equity ratio is an investment leverage or solvency ratio that measures the amount of assets that are financed by owners’ in-vestments by comparing the total equity in the company to the total assets.
The equity ratio highlights two important fi-nancial concepts of a solvent and sustain-able business. The first component shows how much of the total company assets are owned outright by the investors. In other words, after all of the liabilities are paid off, the investors will end up with the remaining assets.
Copyright © MyAccountingCourse.com | For personal use by the original purchaser only - financial ratio cheatsheet - page 10
The second component inversely shows how leveraged the company is with debt. The equity ratio measures how much of a firm’s assets were financed by investors. In other words, this is the investors’ stake in the company. This is what they are on the hook for. The inverse of this calcula-tion shows the amount of assets that were financed by debt. Companies with higher equity ratios show new investors and credi-tors that investors believe in the company and are willing to finance it with their in-vestments.
Analysis-In general, higher equity ratios are typi-cally favorable for companies. This is usu-ally the case for several reasons. Higher investment levels by shareholders shows potential shareholders that the company is worth investing in since so many inves-tors are willing to finance the company. A higher ratio also shows potential creditors that the company is more sustainable and less risky to lend future loans.
Equity financing in general is much cheap-er than debt financing because of the in-terest expenses related to debt financing. Companies with higher equity ratios should have less financing and debt service costs than companies with lower ratios.
As with all ratios, they are contingent on the industry. Exact ratio performance de-pends on industry standards and bench-marks.
Formula

Debt Ratio
Copyright © MyAccountingCourse.com | For personal use by the original purchaser only - financial ratio cheatsheet - page 11
Check out more examples www.myaccountingcourse.com/financial-ratios/debt-ratio
Explanation-Debt ratio is a solvency ratio that mea-sures a firm’s total liabilities as a percent-age of its total assets. In a sense, the debt ratio shows a company’s ability to pay off its liabilities with its assets. In other words, this shows how many assets the company must sell in order to pay off all of its liabili-ties.
This ratio measures the financial leverage of a company. Companies with higher lev-els of liabilities compared with assets are considered highly leveraged and more risky for lenders.
This helps investors and creditors analysis the overall debt burden on the company as well as the firm’s ability to pay off the debt in future, uncertain economic times.
Analysis-The debt ratio is shown in decimal format because it calculates total liabilities as a percentage of total assets. As with many solvency ratios, a lower ratios is more fa-vorable than a higher ratio.
A lower debt ratio usually implies a more stable business with the potential of lon-gevity because a company with lower ra-tio also has lower overall debt. Each indus-try has its own benchmarks for debt, but .5 is reasonable ratio.
A debt ratio of .5 is often considered to be less risky. This means that the company has twice as many assets as liabilities. Or said a different way, this company’s liabilities are only 50 percent of its total assets. Es-sentially, only its creditors own half of the company’s assets and the shareholders own the remainder of the assets.
A ratio of 1 means that total liabilities equals total assets. In other words, the company would have to sell off all of its assets in order to pay off its liabilities. Obvi-ously, this is a highly leverage firm.
Formula

Efficiency Ratios
Copyright © MyAccountingCourse.com | For personal use by the original purchaser only - financial ratio cheatsheet - page 12
Accounts Receivable Turnoverr
Asset Turnover Ratio
Inventory Turnover Ratio
Days’ Sales in Inventory
Find more Efficiency Ratioson the myaccountingcourse.com financial ratios page.

Acccounts Receivable Turnover
Copyright © MyAccountingCourse.com | For personal use by the original purchaser only - financial ratio cheatsheet - page 13
Check out more examples www.myaccountingcourse.com/financial-ratios/accounts-receivable-turnover-ratio
Explanation-What is accounts receivable? It’s an effi-ciency ratio or activity ratio that measures how many times a business can turn its ac-counts receivable into cash during a pe-riod. In other words, the accounts receiv-able turnover ratio measures how many times a business can collect its average accounts receivable during the year.
A turn refers to each time a company col-lects its average receivables. If a compa-ny had $20,000 of average receivables
during the year and collected $40,000 of receivables during the year, the company would have turned its accounts receiv-able twice because it collected twice the amount of average receivables.
This ratio shows how efficient a company is at collecting its credit sales from customers. Some companies collect their receivables from customers in 90 days while other take up to 6 months to collect from customers.
Analysis-Since the receivables turnover ratio mea-sures a business’ ability to efficiently col-lect its receivables, it only makes sense that a higher ratio would be more favor-able. Higher ratios mean that companies are collecting their receivables more fre-quently throughout the year. For instance, a ratio of 2 means that the company col-lected its average receivables twice dur-ing the year. In other words, this company is collecting is money from customers ev-ery six months.
Higher efficiency is favorable from a cash flow standpoint as well. If a company can collect cash from customers sooner, it will be able to use that cash to pay bills and other obligations sooner.
Accounts receivable turnover also is and indication of the quality of credit sales and receivables. A company with a higher ra-tio shows that credit sales are more likely to be collected than a company with a lower ratio. Since accounts receivable are often posted as collateral for loans, quality of receivables is important.
Formula

Check out more exampleswww.myaccountingcourse.com/financial-ratios/asset-turnover-ratio
Asset Turnover RatioExplanation-The asset turnover ratio is an efficiency ratio that measures a company’s ability to generate sales from its assets by compar-ing net sales with average total assets. In other words, this ratio shows how efficiently a company can use its assets to generate sales.
The total asset turnover ratio calculates net sales as a percentage of assets to show how many sales are generated from each dollar of company assets. For instance, a ratio of .5 means that each dollar of assets generates 50 cents of sales.
Copyright © MyAccountingCourse.com | For personal use by the original purchaser only - financial ratio cheatsheet - page 14
This ratio measures how efficiently a firm uses its assets to generate sales, so a higher ratio is always more favorable. Higher turn-over ratios mean the company is using its assets more efficiently. Lower ratios mean that the company isn’t using its assets effi-ciently and most likely have management or production problems.
Analysis-For instance, a ratio of 1 means that the net sales of a company equals the aver-age total assets for the year. In other words, the company is generating 1 dollar of sales for every dollar invested in assets.
Like with most ratios, the asset turnover ra-tio is based on industry standards. Some industries use assets more efficiently than others. To get a true sense of how well a company’s assets are being used, it must be compared to other companies in its in-dustry.
The total asset turnover ratio is a general efficiency ratio that measures how effi-ciently a company uses all of its assets. This gives investors and creditors an idea of how a company is managed and uses its assets to produce products and sales.
Sometimes investors also want to see how companies use more specific assets like fixed assets and current assets. The fixed asset turnover ratio and the working capi-tal ratio are turnover ratios similar to the asset turnover ratio that are often used to calculate the efficiency of these asset classes.
Formula

Inventory Turnover Ratio
Copyright © MyAccountingCourse.com | For personal use by the original purchaser only - financial ratio cheatsheet - page 15
Check out more examples www.myaccountingcourse.com/financial-ratios/inventory-turnover-ratio
Explanation-The inventory turnover ratio is an efficien-cy ratio that shows how effectively inven-tory is managed by comparing cost of goods sold with average inventory for a period. This measures how many times av-erage inventory is “turned” or sold during a period. In other words, it measures how many times a company sold its total av-erage inventory dollar amount during the year. A company with $1,000 of average inventory and sales of $10,000 effectively sold its 10 times over.
This ratio is important because total turn-over depends on two main components of performance. The first component is stock purchasing. If larger amounts of in-ventory are purchased during the year, the company will have to sell greater amounts of inventory to improve its turnover. If the company can’t sell these greater amounts of inventory, it will incur storage costs and other holding costs.
The second component is sales. Sales have to match inventory purchases other-wise the inventory will not turn effectively.
Analysis-Inventory turnover is a measure of how efficiently a company can control its mer-chandise, so it is important to have a high turn. This shows the company does not overspend by buying too much inventory and wastes resources by storing non-sal-able inventory. It also shows that the com-pany can effectively sell the inventory it buys.
This measurement also shows investors how liquid a company’s inventory is. Think about it. Inventory is one of the biggest as-sets a retailer reports on its balance sheet.
If this inventory can’t be sold, it is worthless to the company. This measurement shows how easily a company can turn its inven-tory into cash.
Creditors are particularly interested in this because inventory is often put up as col-lateral for loans. Banks want to know that this inventory will be easy to sell.
Inventory turns vary with industry. For in-stance, the apparel industry will have high-er turns than the exotic car industry.
Formula

Check out more exampleswww.myaccountingcourse.com/financial-ratios/days-sales-in-inventory
Days’ Sales in InventoryExplanation-The days sales in inventory calculation, also called days inventory outstanding or simply days in inventory, measures the number of days it will take a company to sell all of its inventory. In other words, the days sales in inventory ratio shows how many days a company’s current stock of inventory will last.
This is an important to creditors and inves-tors for three main reasons. It measures value, liquidity, and cash flows.
Copyright © MyAccountingCourse.com | For personal use by the original purchaser only - financial ratio cheatsheet - page 16
Both investors and creditors want to know how valuable a company’s inventory is. Older, more obsolete inventory is always worth less than current, fresh inventory. The days sales in inventory shows how fast the company is moving its inventory. In other words, it shows how fresh the inventory is.
This calculation also shows the liquidity of inventory. Shorter days inventory outstand-ing means the company can convert its inventory into cash sooner. In other words, the inventory is extremely liquid.
Analysis-The days sales in inventory is a key com-ponent in a company’s inventory man-agement. Inventory is a expensive for a company to keep, maintain, and store. Companies also have to be worried about protecting inventory from theft and obso-lescence.
Management wants to make sure its inven-tory moves as fast as possible to minimize these costs and to increase cash flows. Remember the longer the inventory sits on the shelves, the longer the company’s cash can’t be used for other operations.
Management strives to only buy enough inventories to sell within the next 90 days. If inventory sits longer than that, it can start costing the company extra money.
It only makes sense that lower days inven-tory outstanding is more favorable than higher ratios.
Formula

Profitability Ratios
Copyright © MyAccountingCourse.com | For personal use by the original purchaser only - financial ratio cheatsheet - page 17
Gross Margin Ratio
Profit Margin Ratio
Return on Assets
Return on Capital Employed
Return on Equity
Find more Liquidity Ratioson the myaccountingcourse.com financial ratios page.

Check out more exampleswww.myaccountingcourse.com/financial-ratios/gross-margin-ratio
Gross Margin RatioExplanation-Gross margin ratio is a profitability ratio that compares the gross margin of a busi-ness to the net sales. This ratio measures how profitable a company sells its inven-tory or merchandise. In other words, the gross profit ratio is essentially the percent-age markup on merchandise from its cost. This is the pure profit from the sale of inven-tory that can go to paying operating ex-penses.
Copyright © MyAccountingCourse.com | For personal use by the original purchaser only - financial ratio cheatsheet - page 18
Gross margin ratio is often confused with the profit margin ratio, but the two ratios are completely different. Gross margin ra-tio only considers the cost of goods sold in its calculation because it measures the profitability of selling inventory. Profit mar-gin ratio on the other hand considers other expenses.
Analysis-Gross margin ratio is a profitability ratio that measures how profitable a company can sell its inventory. It only makes sense that higher ratios are more favorable. Higher ratios mean the company is selling their inventory at a higher profit percent-age.
High ratios can typically be achieved by two ways. One way is to buy inventory very cheap. If retailers can get a big purchase discount when they buy their inventory from the manufacturer or wholesaler, their gross margin will be higher because their costs are down.
The second way retailers can achieve a high ratio is by marking their goods up high-er. This obviously has to be done competi-tively otherwise goods will be too expen-sive and customers will shop elsewhere.
A company with a high gross margin ratios mean that the company will have more money to pay operating expenses like salaries, utilities, and rent. Since this ratio measures the profits from selling inventory, it also measures the percentage of sales that can be used to help fund other parts of the business. Here is another great ex-plaination.
Formula

Profit Margin Ratio
Copyright © MyAccountingCourse.com | For personal use by the original purchaser only - financial ratio cheatsheet - page 19
Check out more examples www.myaccountingcourse.com/financial-ratios/profit-margin-ratio
Explanation-The profit margin ratio, also called the re-turn on sales ratio or gross profit ratio, is a profitability ratio that measures the amount of net income earned with each dollar of sales generated by comparing the net income and net sales of a company. In other words, the profit margin ratio shows what percentage of sales are left over af-ter all expenses are paid by the business.
Creditors and investors use this ratio to measure how effectively a company can convert sales into net income.
Investors want to make sure profits are high enough to distribute dividends while creditors want to make sure the company has enough profits to pay back its loans. In other words, outside users want to know that the company is running efficiently. An extremely low profit margin would indi-cate the expenses are too high and the management needs to budget and cut expenses.
The return on sales ratio is often used by internal management to set performance goals for the future.
Analysis-The profit margin ratio directly measures what percentage of sales is made up of net income. In other words, it measures how much profits are produced at a cer-tain level of sales.
This ratio also indirectly measures how well a company manages its expenses relative to its net sales. That is why companies strive to achieve higher ratios. They can do this by either generating more revenues why keeping expenses constant or keep rev-enues constant and lower expenses.
Since most of the time generating addi-tional revenues is much more difficult than cutting expenses, managers generally tend to reduce spending budgets to im-prove their profit ratio.
Like most profitability ratios, this ratio is best used to compare like sized companies in the same industry. This ratio is also effec-tive for measuring past performance of a company.
Formula
Check out more exampleswww.myaccountingcourse.com/financial-ratios/return-on-assets
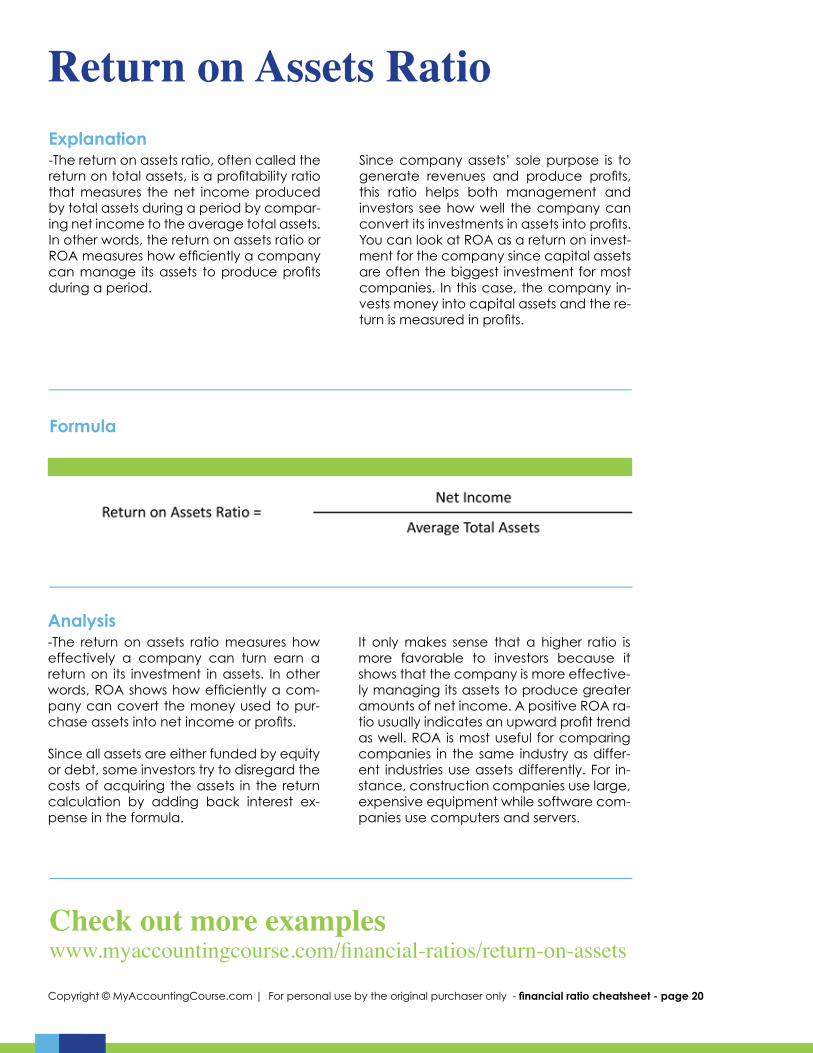
Return on Assets RatioExplanation-The return on assets ratio, often called the return on total assets, is a profitability ratio that measures the net income produced by total assets during a period by compar-ing net income to the average total assets. In other words, the return on assets ratio or ROA measures how efficiently a company can manage its assets to produce profits during a period.
Copyright © MyAccountingCourse.com | For personal use by the original purchaser only - financial ratio cheatsheet - page 20
Since company assets’ sole purpose is to generate revenues and produce profits, this ratio helps both management and investors see how well the company can convert its investments in assets into profits. You can look at ROA as a return on invest-ment for the company since capital assets are often the biggest investment for most companies. In this case, the company in-vests money into capital assets and the re-turn is measured in profits.
Analysis-The return on assets ratio measures how effectively a company can turn earn a return on its investment in assets. In other words, ROA shows how efficiently a com-pany can covert the money used to pur-chase assets into net income or profits.
Since all assets are either funded by equity or debt, some investors try to disregard the costs of acquiring the assets in the return calculation by adding back interest ex-pense in the formula.
It only makes sense that a higher ratio is more favorable to investors because it shows that the company is more effective-ly managing its assets to produce greater amounts of net income. A positive ROA ra-tio usually indicates an upward profit trend as well. ROA is most useful for comparing companies in the same industry as differ-ent industries use assets differently. For in-stance, construction companies use large, expensive equipment while software com-panies use computers and servers.
Formula
Return on Capital Employed
Copyright © MyAccountingCourse.com | For personal use by the original purchaser only - financial ratio cheatsheet - page 21
Check out more examples www.myaccountingcourse.com/financial-ratios/return-on-capital-employed
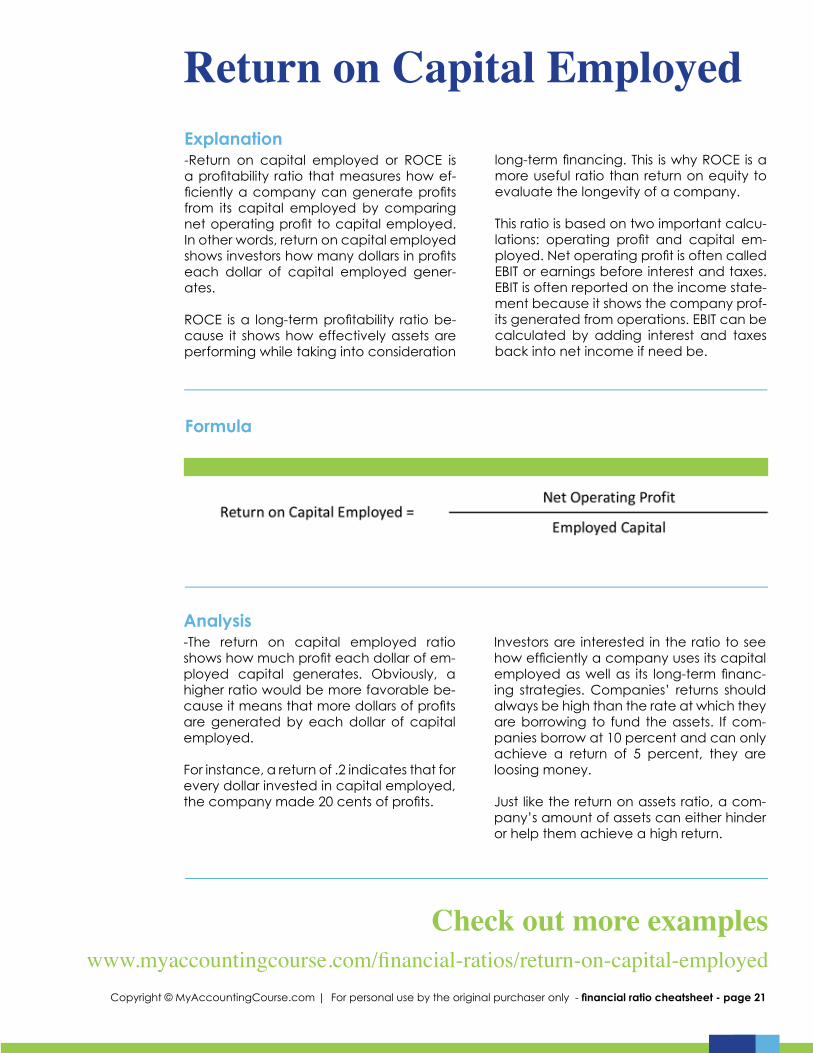
Explanation-Return on capital employed or ROCE is a profitability ratio that measures how ef-ficiently a company can generate profits from its capital employed by comparing net operating profit to capital employed. In other words, return on capital employed shows investors how many dollars in profits each dollar of capital employed gener-ates.
ROCE is a long-term profitability ratio be-cause it shows how effectively assets are performing while taking into consideration
long-term financing. This is why ROCE is a more useful ratio than return on equity to evaluate the longevity of a company.
This ratio is based on two important calcu-lations: operating profit and capital em-ployed. Net operating profit is often called EBIT or earnings before interest and taxes. EBIT is often reported on the income state-ment because it shows the company prof-its generated from operations. EBIT can be calculated by adding interest and taxes back into net income if need be.
Analysis-The return on capital employed ratio shows how much profit each dollar of em-ployed capital generates. Obviously, a higher ratio would be more favorable be-cause it means that more dollars of profits are generated by each dollar of capital employed.
For instance, a return of .2 indicates that for every dollar invested in capital employed, the company made 20 cents of profits.
Investors are interested in the ratio to see how efficiently a company uses its capital employed as well as its long-term financ-ing strategies. Companies’ returns should always be high than the rate at which they are borrowing to fund the assets. If com-panies borrow at 10 percent and can only achieve a return of 5 percent, they are loosing money.
Just like the return on assets ratio, a com-pany’s amount of assets can either hinder or help them achieve a high return.
Formula

Check out more exampleswww.myaccountingcourse.com/financial-ratios/return-on-equity
Return on Equity RatioExplanation-The return on equity ratio or ROE is a profit-ability ratio that measures the ability of a firm to generate profits from its sharehold-ers investments in the company. In other words, the return on equity ratio shows how much profit each dollar of common stockholders’ equity generates.
So a return on 1 means that every dollar of common stockholders’ equity generates 1 dollar of net income.
Copyright © MyAccountingCourse.com | For personal use by the original purchaser only - financial ratio cheatsheet - page 22
This is an important measurement for po-tential investors because they want to see how efficiently a company will use their money to generate net income.
ROE is also and indicator of how effective management is at using equity financing to fund operations and grow the company.
Analysis-Return on equity measures how efficiently a firm can use the money from sharehold-ers to generate profits and grow the com-pany. Unlike other return on investment ratios, ROE is a profitability ratio from the investor’s point of view—not the compa-ny. In other words, this ratio calculates how much money is made based on the inves-tors’ investment in the company, not the company’s investment in assets or some-thing else.
That being said, investors want to see a high return on equity ratio because this indicates that the company is using its in-vestors’ funds effectively. Higher ratios are almost always better than lower ratios, but have to be compared to other compa-nies’ ratios in the industry. Since every in-dustry has different levels of investors and income, ROE can’t be used to compare companies outside of their industries very effectively.
Formula
Market Prospect Ratios
Copyright © MyAccountingCourse.com | For personal use by the original purchaser only - financial ratio cheatsheet - page 23
Earnings Per Share
Price Eanings P/E Ratio
Dividend Payout Ratio
Dividend Yield
Find more Liquidity Ratioson the myaccountingcourse.com financial ratios page.

Check out more exampleswww.myaccountingcourse.com/financial-ratios/earnings-per-share
Earnings Per ShareExplanation-Earning per share, also called net income per share, is a market prospect ratio that measures the amount of net income earned per share of stock outstanding. In other words, this is the amount of money each share of stock would receive if all of the profits were distributed to the out-standing shares at the end of the year.
Copyright © MyAccountingCourse.com | For personal use by the original purchaser only - financial ratio cheatsheet - page 24
Earnings per share is also a calculation that shows how profitable a company is on a shareholder basis. So a larger com-pany’s profits per share can be compared to smaller company’s profits per share. Obviously, this calculation is heavily influ-enced on how many shares are outstand-ing. Thus, a larger company will have to split its earning amongst many more shares of stock compared to a smaller company.
Analysis-Earning per share is the same as any prof-itability or market prospect ratio. Higher earnings per share is always better than a lower ratio because this means the com-pany is more profitable and the company has more profits to distribute to its share-holders.
Although many investors don’t pay much attention to the EPS, a higher earnings per share ratio often makes the stock price of a company rise. Since so many things can manipulate this ratio, investors tend to look at it but don’t let it influence their decisions drastically.
Formula

Price Earnings P/E Ratio
Copyright © MyAccountingCourse.com | For personal use by the original purchaser only - financial ratio cheatsheet - page 25
Check out more examples www.myaccountingcourse.com/financial-ratios/price-earnings-ratio
Explanation-The price earnings ratio, often called the P/E ratio or price to earnings ratio, is a mar-ket prospect ratio that calculates the mar-ket value of a stock relative to its earnings by comparing the market price per share by the earnings per share. In other words, the price earnings ratio shows what the market is willing to pay for a stock based on its current earnings.
Investors often use this ratio to evaluate what a stock’s fair market value should be by predicting future earnings per share.
Companies with higher future earnings are usually expected to issue higher dividends or have appreciating stock in the future.
Obviously, fair market value of a stock is based on more than just predicted future earnings. Investor speculation and de-mand also help increase a share’s price over time.
Analysis-The price to earnings ratio indicates the expected price of a share based on its earnings. As a company’s earnings per share being to rise, so does their market value per share. A company with a high P/E ratio usually indicated positive future performance and investors are willing to pay more for this company’s shares.
A company with a lower ratio, on the other hand, is usually an indication of poor cur-rent and future performance. This could prove to be a poor investment.
In general a higher ratio means that inves-tors anticipate higher performance and growth in the future. It also means that companies with losses have poor PE ratios.
An important thing to remember is that this ratio is only useful in comparing like com-panies in the same industry. Since this ratio is based on the earnings per share calcula-tion, management can easily manipulate it with specific accounting techniques.
Formula

Check out more exampleswww.myaccountingcourse.com/financial-ratios/dividend-payout-ratio
Dividend Payout RatioExplanation-The dividend payout ratio measures the percentage of net income that is distrib-uted to shareholders in the form of divi-dends during the year. In other words, this ratio shows the portion of profits the com-pany decides to keep to fund operations and the portion of profits that is given to its shareholders.
Investors are particularly interested in the dividend payout ratio because they want to know if companies are paying out a reasonable portion of net income to inves-tors.
Copyright © MyAccountingCourse.com | For personal use by the original purchaser only - financial ratio cheatsheet - page 26
For instance, most start up companies and tech companies rarely give dividends at all. In fact, Apple, a company formed in the 1970s, just gave its first dividend to shareholders in 2012.
Conversely, some companies want to spur investors’ interest so much that they are willing to pay out unreasonably high divi-dend percentages. Inventors can see that these dividend rates can’t be sustained very long because the company will even-tually need money for its operations.
Analysis-Since investors want to see a steady stream of sustainable dividends from a company, the dividend payout ratio anal-ysis is important. A consistent trend in this ratio is usually more important than a high or low ratio.
Since it is for companies to declare divi-dends and increase their ratio for one year, a single high ratio does not mean that much. Investors are mainly concerned with sustainable trends.
For instance, investors can assume that a company that has a payout ratio of 20 percent for the last ten years will continue giving 20 percent of its profit to the share-holders.
Conversely, a company that has a down-ward trend of payouts is alarming to inves-tors. For example, if a company’s ratio has fallen a percentage each year for the last five years might indicate that the compa-ny can no longer afford to pay such high dividends. This could be an indication of poor operating performance.
Formula

Dividend Yield
Copyright © MyAccountingCourse.com | For personal use by the original purchaser only - financial ratio cheatsheet - page 27
Check out more examples www.myaccountingcourse.com/financial-ratios/dividend-yield
Explanation-The dividend yield is a financial ratio that measures the amount of cash dividends distributed to common shareholders rela-tive to the market value per share. The dividend yield is used by investors to show how their investment in stock is generating either cash flows in the form of dividends or increases in asset value by stock appre-ciation.
Investors invest their money in stocks to earn a return either by dividends or stock appreciation. Some companies choose to pay dividends on a regular basis to spur investors’ interest. These shares are often called income stocks. Other companies choose not to issue dividends and instead reinvest this money in the business. These shares are often called growth stocks.
Investors can use the dividend yield for-mula to help analyze their return on invest-ment in stocks.
Analysis-Investors use the dividend yield formula to compute the cash flow they are get-ting from their investment in stocks. In other words, investors want to know how much dividends they are getting for every dollar that the stock is worth.
A company with a high dividend yield pays its investors a large dividend com-pared to the fair market value of the stock. This means the investors are getting highly compensated for their investments com-pared with lower dividend yielding stocks.
A high or low dividend yield is relative to the industry of the company. As I men-tioned above, tech companies rarely give dividends at all. So even a small dividend might produce a high dividend yield ratio for the tech industry. Generally, investors want to see a yield as high as possible.
Formula

Coverage Ratios
Copyright © MyAccountingCourse.com | For personal use by the original purchaser only - financial ratio cheatsheet - page 28
Fixed Charge Coverage Ratio
Debt Service Coverage Ratio
Find more Coverage Ratioson the myaccountingcourse.com financial ratios page.

Fixed Charge Coverage Ratio
Copyright © MyAccountingCourse.com | For personal use by the original purchaser only - financial ratio cheatsheet - page 29
Check out more examples www.myaccountingcourse.com/financial-ratios/fixed-charge-coverage-ratio
Explanation-The fixed charge coverage ratio is a fi-nancial ratio that measures a firm’s ability to pay all of its fixed charges or expenses with its income before interest and income taxes. The fixed charge coverage ratio is basically an expanded version of the times interest earned ratio or the times interest coverage ratio.
The fixed charge coverage ratio is very adaptable for use with almost any fixed cost since fixed costs like lease payments, insurance payments, and preferred divi-dend payments can be built into the cal-culation.
Analysis-The fixed charge coverage ratio shows investors and creditors a firm’s ability to make its fixed payments. Like the times in-terest ratio, this ratio is stated in numbers rather than percentages.
The ratio measures how many times a firm can pay its fixed costs with its income be-fore interest and taxes. In other words, it shows how many times greater the firm’s income is compared with its fixed costs.
In a way, this ratio can be viewed as a sol-vency ratio because it shows how easily a company can pay its bills when they be-come due. Obviously, if a company can’t pay its lease or rent payments, it will not be in business for much longer.
Higher fixed cost ratios indicate a healthier and less risky business to invest in or loan to. Lower ratios show creditors and inves-tors that the company can barely meet its monthly bills.
Formula

Check out more exampleswww.myaccountingcourse.com/financial-ratios/debt-service-coverage-ratio
Debt Service Coverage RatioExplanation-The debt service coverage ratio is a finan-cial ratio that measures a company’s abil-ity to service its current debts by compar-ing its net operating income with its total debt service obligations. In other words, this ratio compares a company’s avail-able cash with its current interest, principle, and sinking fund obligations.
The debt service coverage ratio is impor-tant to both creditors and investors, but creditors most often analyze it.
Copyright © MyAccountingCourse.com | For personal use by the original purchaser only - financial ratio cheatsheet - page 30
Since this ratio measures a firm’s ability to make its current debt obligations, current and future creditors are particularly inter-est in it.
Creditors not only want to know the cash position and cash flow of a company, they also want to know how much debt it cur-rently owes and the available cash to pay the current and future debt.
Analysis-The debt service coverage ratio measures a firm’s ability to maintain its current debt levels. This is why a higher ratio is always more favorable than a lower ratio. A high-er ratio indicates that there is more income available to pay for debt servicing.
For example, if a company had a ratio of 1, that would mean that the company’s net operating profits equals its debt service obligations. In other words, the company generates just enough revenues to pay for its debt servicing.
A ratio of less than one means that the company doesn’t generate enough op-erating profits to pay its debt service and must use some of its savings.
Generally, companies with higher service ratios tend to have more cash and are better able to pay their debt obligations on time.
Formula

CPA Exam Ratios to Know
Copyright © MyAccountingCourse.com | For personal use by the original purchaser only - financial ratio cheatsheet - page 31
Although this isn’t a comprehensive list of every financial ratio that
could appear on the CPA exam, it is a list of the most common ones.
The two sections that tend to have ratios pop up in questions are FAR
and BEC. The FAR ratios are typically more financial statement based
and the BEC ratios are more cost accounting and business manage-
ment based. If you learn these ratios, you should do fine on the exam.
Find more about the CPA Examon www.myaccountingcourse.com/cpa/
Debt to Equity Ratio
Return on Assets
Accounts Receivable Turnover
Working Capital
Acid Test
Times Interest Earned
Accounts Receivable Turnover
Inventory Turnover
Gross Profit
Profit Margin
Days in Sales
Days in Inventory
Break Even Point - units and sales
Margin of Safety
Return on Equity
EVA
Earnings per Share
P/E ratio
Debt Ratio
Book Value per Common Share

CMA Exam Ratios to Know
Copyright © MyAccountingCourse.com | For personal use by the original purchaser only - financial ratio cheatsheet - page 32
EBIT - Earnings before interest and taxes
EBITDA - Earnings before interest, taxes,
depreciation and amortization
EBT - Earnings before taxes
EPS - Earnings per share
ROA - Return on assets
ROE - Return on equity
ROI - Return on investment
Current Ratio
Working Capital
Quick Ratio
Cash Ratio
Degree of financial leverage
Degree of operating leveragej
Debt to equity ratio
Debt to total assets ratio
Fixed charge coverage
Interest coverage
Cash flow to fixed charges
Accounts receivable turnover
Find more Financial Ratioson the myaccountingcourse.com financial ratios page.
Inventory turnover
Accounts payable turnover
Days sales in receivables
Days sales in inventory
Days purchases in payables
Operating cycle
Cash cycle
Total asset turnover
Fixed asset turnover
Gross profit margin percentage
Operating profit margin percentage
Net profit margin percentage
Market-to-book ratio
Price earnings ratio
Book value per share
Diluted EPS
Earnings yield
Dividend payout ratio
Shareholder return
Breakeven point in units and dollars
Margin of safety

MyAccountingCourse.com
Copyright © MyAccountingCourse.com | For personal use by the original purchaser only - financial ratio cheatsheet - page 33
Find more accounting information at myaccountingcourse.com.
Courses - Quizzes - Examples - Accounting Dictionary
CPA Exam Study Guide and Resources - Accounting Career Guides


