448
Deutsche Bank Financial Report 2011

Deutsche Bank
Deu
tsch
e B
ank
Fin
anci
al R
eport
201
1
2012April 26, 2012Interim Report as of March 31, 2011
May 31, 2012Annual General Meeting in the FesthalleFrankfurt am Main (Exhibition Center)
June 1, 2012Dividend payment
July 31, 2012Interim Report as of June 30, 2012
October 30, 2012Interim Report as of September 30, 2012
2013January 31, 2013�Preliminary�results�for�the�2012�financial�year
March 21, 2013Annual Report 2012 and Form 20-F
April 30, 2013Interim Report as of March 31, 2013
May 23, 2013 Annual General Meeting in the FesthalleFrankfurt am Main (Exhibition Center)
May 24, 2013Dividend payment
July 30, 2013Interim Report as of June 30, 2013
October 29, 2013Interim Report as of September 30, 2013
Financial Report 2011

Deutsche Bank Financial Report 2011
The Group at a glance 2011 2010
Share price at period end
1 € 29.44 € 39.10 Share price high
1 € 48.70 € 55.11 Share price low
1 € 20.79 € 35.93 Basic earnings per share
2 € 4.45 € 3.07 Diluted earnings per share
2 € 4.30 € 2.92 Average shares outstanding, in m., basic
2 928 753 Average shares outstanding, in m., diluted
2 957 791 Return on average shareholders' equity (post-tax) 8.2 % 5.5 % Pre-tax return on average shareholders' equity 10.2 % 9.5 % Pre-tax return on average active equity
3 10.3 % 9.6 % Book value per basic share outstanding € 58.11 € 52.38 Cost/income ratio 78.2 % 81.6 % Compensation ratio 39.5 % 44.4 % Noncompensation ratio 38.7 % 37.3 %
in € m. in € m.
Total net revenues 33,228 28,567 Provision for credit losses 1,839 1,274 Total noninterest expenses 25,999 23,318 Income before income taxes 5,390 3,975 Net income 4,326 2,330
Dec 31, 2011 in € bn.
Dec 31, 2010 in € bn.
Total assets 2,164 1,906 Shareholders' equity 53.4 48.8 Core Tier 1 capital ratio
4 9.5 % 8.7 % Tier 1 capital ratio
4 12.9 % 12.3 %
Number Number
Branches 3,078 3,083 thereof in Germany 2,039 2,087
Employees (full-time equivalent)
5 100,996 102,062 thereof in Germany 47,323 49,265
Long-term rating Moody's Investors Service Aa3 Aa3 Standard & Poor's A+ A+ Fitch Ratings A+ AA–
1 For comparison purposes, the share prices have been adjusted for all periods before October 6, 2010 to reflect the impact of the subscription rights issue in connection with the capital increase.
2 The number of average basic and diluted shares outstanding has been adjusted for all periods before October 6, 2010 to reflect the effect of the bonus element of the subscription rights issue in connection with the capital increase.
3 We calculate this adjusted measure of our return on average shareholders’ equity to make it easier to compare us to our competitors. We refer to this adjusted measure as our “Pre-tax return on average active equity”. However, this is not a measure of performance under IFRS and you should not compare our ratio based on average active equity to other companies’ ratios without considering the differences in the calculation of the ratio. The items for which we adjust the average shareholders’ equity of € 50,547 million for 2011 and € 41,712 million for 2010 are average accumulated other comprehensive income excluding foreign currency translation (all components net of applicable taxes) of € (519) million for 2011 and € (102) million for 2010, as well as average dividends of € 617 million in 2011 and € 461 million in 2010, for which a proposal is accrued on a quarterly basis and which are paid after the approval by the Annual General Meeting following each year. Tax rates applied in the calculation of average active equity are those used in the financial statements for the individual items and not an average overall tax rate.
4 Capital ratios for December 31, 2011 are based upon Basel 2.5 rules; prior periods are based upon Basel 2. The capital ratios relate the respective capital to risk weighted assets for credit, market and operational risk. Excludes transitional items pursuant to section 64h (3) German Banking Act.
5 Deutsche Postbank aligned its FTE definition to Deutsche Bank which reduced the Group number as of December 31, 2011 by 260 (prior periods not restated). Due to rounding, numbers presented throughout this document may not add up precisely to the totals provided and percentages may not precisely reflect the
absolute figures.
Deutsche Bank
Deutsche Bank Content 1 Financial Report 2011
01 – Management Report
Operating and Financial Review – 4 Risk Report – 42 Internal Control over Financial Reporting – 130 Information pursuant to Section 315 (4) of the German Com-mercial Code and Explanatory Report – 135 Compensation Report – 140 Corporate Social Responsibility – 157 Employees – 162 Outlook – 165
02 – Consolidated Financial Statements
Consolidated Statement of Income – 175 Consolidated Statement of Comprehensive Income – 176 Consolidated Balance Sheet – 177 Consolidated Statement of Changes in Equity – 178 Consolidated Statement of Cash Flows – 180 Notes to the Consolidated Financial Statements including Table of Content – 181
03 – Confirmations
Independent Auditors’ Report – 400 Responsibility Statement by the Management Board – 402 Report of the Supervisory Board – 403

Deutsche Bank Content 2 Financial Report 2011
04 – Corporate Governance Statement/ Corporate Governance Report
Management Board and Supervisory Board – 411 Reporting and Transparency – 421 Related Party Transactions – 422 Auditing and Controlling – 422 Compliance with the German Corporate Governance Code – 424
05 – Supplementary Information
Management Board – 427 Supervisory Board – 428 Advisory Boards – 430 Group Five-Year Record – 435 Declaration of Backing – 436 Glossary – 437 Impressum – Publications – 445

Management Report
Operating and Financial Review Deutsche Bank Group – 4 Executive Summary – 5 Results of Operations – 10 Financial Position – 27 Liquidity and Capital Resources – 39 Events after the Reporting Date – 41
Risk Report
Risk Management Executive Summary – 42 Risk Management Principles – 44 Risk Strategy and Appetite – 48 Risk Inventory – 49 Risk Management Tools – 52 Credit Risk – 55 Market Risk – 93 Operational Risk – 110 Liquidity Risk at Deutsche Bank Group (excluding Postbank) – 115 Capital Management – 122 Balance Sheet Management – 125 Overall Risk Position – 127
Internal Control over Financial Reporting – 130
Information pursuant to Section 315 (4) of the German Commercial Code and Explanatory Report – 135
Compensation Report
Principles of the Compensation System for Management Board Members – 140 Compensation System for Supervisory Board Members – 155
Corporate Social Responsibility
Sustainability – 157 Corporate Citizenship – 160
Employees – 162
Outlook – 165
Deutsche Bank 01 – Management Report 4 Financial Report 2011 Operating and Financial Review
The following discussion and analysis should be read in conjunction with the consolidated financial statements and the related notes to them. Our consolidated financial statements for the years ended December 31, 2011 and 2010 have been audited by KPMG AG Wirtschaftsprüfungsgesellschaft that issued an unqualified opinion.
Deutsche Bank Group
Our Organization Headquartered in Frankfurt am Main, Germany, we are the largest bank in Germany, and one of the largest financial institutions in Europe and the world, as measured by total assets of € 2,164 billion as of December 31, 2011. As of that date, we employed 100,996 people on a full-time equivalent basis and operated in 72 countries out of 3,078 branches worldwide, of which 66 % were in Germany. We offer a wide variety of investment, finan-cial and related products and services to private individuals, corporate entities and institutional clients around the world.
Group Divisions We are organized into the Group Divisions Corporate & Investment Bank (CIB), Private Clients and Asset Management (PCAM) and Corporate Investments (CI).
Corporate & Investment Bank In CIB, we carry out our capital markets business including our origination, sales and trading activities in debt, equity and other securities, as well as our advisory, credit and transaction banking businesses. CIB’s institutional clients are public sector clients like sovereign countries and multinational organizations, and private sector clients like medium-sized companies and multinational corporations.
CIB is further sub-divided into the Corporate Divisions Corporate Banking & Securities (CB&S) and Global Transaction Banking (GTB).
CB&S includes the Business Divisions Markets and Corporate Finance, which globally carry out our securities origination, sales and trading businesses, as well as our mergers and acquisitions advisory and corporate finance businesses.
GTB includes our product offerings in trade finance, cash management and trust & securities services for financial institutions and other companies.
Operating and Financial Review
Deutsche Bank 01 – Management Report 5 Financial Report 2011 Operating and Financial Review
Private Clients and Asset Management PCAM is further sub-divided into the Corporate Divisions Asset and Wealth Management (AWM) and Private & Business Clients (PBC).
AWM consists of the Asset Management Business Division (AM) and the Private Wealth Management Business Division (PWM). AM provides retail clients across the globe with mutual fund products through our DWS fran-chise. It also offers institutional clients, including pension funds and insurance companies, a broad range of services from traditional to alternative investment products. On November 22, 2011, we announced that we will be reviewing our global Asset Management division. The strategic review is part of our continual effort to main-tain an optimal business mix and be among the market leaders in each of our businesses. The strategic review is focusing in particular on the impact of recent regulatory changes on our division and its growth prospects. This also includes analyses of changes in the cost structure and changes in the competitive landscape asso-ciated with aforementioned regulatory changes. The review covers all of the Asset Management division glo-bally except for the DWS franchise in Germany, Europe and Asia, which we have already determined is a core part of our retail offering in those markets. PWM offers its products globally to high-net-worth clients and ultra-high-net-worth individuals, their families and selected institutions. PWM offers its demanding clients an inte-grated approach to wealth management, including succession planning and philanthropic advisory services.
PBC offers retail clients as well as small and medium sized business customers a variety of products including accounts, loan and deposit services as well as investment advice. In our German homemarket, we strength-ened our leading market position through the acquisition of Postbank. Besides Germany, PBC has operated for a long time in Italy, Spain, Belgium and Portugal, and for several years in Poland. Furthermore, we make focused investments in emerging markets in Asia, for instance in China and India.
Corporate Investments The CI Group Division manages our global principal investment activities.
Executive Summary
The Global Economy The global economy was impacted by several negative factors in 2011: rising commodity prices, mounting inflation, natural and nuclear disasters in Japan, political unrest in North Africa, debates on the debt ceiling in the U.S. and downgrading by rating agencies – but especially the sovereign debt crisis in Europe.

Deutsche Bank 01 – Management Report 6 Financial Report 2011 Operating and Financial Review
In 2011, the global economic growth slowed to an estimated 3.5 % after a solid growth of 5 % in 2010 that was driven by catch-up effects in the wake of the global economic crisis. The slowdown took place predominantly in the industrial countries, while growth continued nearly unabated in the emerging markets. The problems of structural adjustment in the industrial countries had apparently been masked in many cases by the massive monetary and fiscal policy measures introduced in 2008 and 2009, some of which only developed their full effect in 2010. As the economic stimulus measures expired, structural problems returned.
The U.S. economy, where continuing problems in the real estate and job markets slowed growth down from 3 % in 2010 to around 1.75 % in 2011, demonstrated this notably. In the wake of the tsunami last March and the nuclear catastrophe it unleashed in Fukushima, Japan’s economy was temporarily thrown into a recession by a negative supply shock and decreased on an annualized basis by around 0.75 %. The eurozone slid into a recession towards the end of the year due to the increasing uncertainty on the future development of the debt crisis and the retarding effects of the fiscal consolidation programs that were launched in many countries. As an annualized average, growth declined from 1.9 % in 2010 to around 1.5 % in 2011. Only the German econ-omy grew strongly again at 3 %, versus 3.6 % in 2010. However, the sentiment clearly dampened here over the course of the year, in particular, due to the waning momentum in foreign trade.
The Banking Industry In 2011, the economic environment for the banking industry was marked by a favorable first half and from summer onwards by a significant downturn as the European sovereign debt crisis worsened and economic activity declined more than expected.
Capital market businesses initially saw stable earnings and healthy client demand. This changed with the sove-reign debt crisis in Europe spreading to Italy, Spain and other core countries during the third quarter. The un-certainty over debt sustainability, the magnitude of the economic downturn and worries about banks' excessive exposure to countries affected by the crisis paralyzed not only issuance activities, corporate acquisitions and trading in Europe but also the willingness of investors to provide long-term financing to the banking sector. Outside Europe, investment banking performance and banks’ term funding remained largely satisfactory. For the year as a whole, the global volume of equity issuance decreased significantly, while debt issuance was down only moderately compared to 2010; the market for M&A picked up slightly, and the syndicated loans business continued to recover.
European banks responded to the widespread drying-up of long-term refinancing sources and of the interbank market by accelerating the restructuring of investment banking activities, reducing risk positions, partially with-drawing from foreign markets and seeking greater recourse to funds made available by the European Central Bank. The change in the refinancing and liquidity situation manifested itself at year-end in the European Cen-tral Bank’s first-ever three-year tender operation with full allotment. In addition, the European Banking Authority also sought to restore confidence in the industry via two stress tests, increased capital requirements and im-proved disclosure of risk exposures in the countries affected by the crisis.

Deutsche Bank 01 – Management Report 7 Financial Report 2011 Operating and Financial Review
Asset management initially benefited in 2011 from the favorable market environment before revenues started to come under pressure with the decline of equity markets in August and higher volatility in the subsequent months. Investors reduced their holdings of equities and debt instruments perceived as relatively risky in favor of, for example, U.S. Treasuries and German Bunds in view of their reputation as safe havens. Banks’ com-missions and fee income benefited from generally higher trading volumes which was offset by investors’ prefe-rence for rather low-margin products.
In line with the macroeconomic trends, lending volumes to private and business clients in the eurozone in-creased moderately in the first two quarters before leveling off towards year-end. Overall, lending volumes increased only insignificantly compared to the prior year. In the U.S., lending to private individuals stabilized in 2011, while corporate lending clearly returned to positive territory in the course of the year. Net interest income suffered from persistently very low interest rates in nearly all the industrialized countries. At the same time, loan loss provisions started to rise again in Europe; by contrast, they continued to fall in the U.S. As a result, banks in the eurozone (unlike U.S. banks) recently began to tighten their lending standards again.
Furthermore, European and U.S. banks posted contrasting profit performances: while banks in the U.S. contin-ued to register sizeable gains and in fact approached the record levels of the pre-crisis period, the banks in Europe experienced declines in net income on an already only moderate performance in the prior year. A few major banks sustained (further) losses in this still relatively favorable economic environment.
The past year provided greater visibility on the new legal architecture for the financial markets. Initiatives were launched in the European Union and the U.S. to transpose the provisions of Basel 3 into national law. In Eu-rope, banks were required for the first time to comply with the requirements of Basel 2.5, as set out in the adapted Capital Requirements Directive (“CRD III”), in particular with its higher risk weights for re-securitizations and trading assets. Furthermore, the global banking supervisors released a draft document detailing the implementation of higher capital requirements for systemically relevant banks as well as a list of the institutions concerned including Deutsche Bank. In the U.S., the various financial regulators – in particular the Federal Reserve, the FDIC, the SEC and the CFTC – introduced rules which cast the underlying legislation of the Dodd-Frank Act adopted in 2010 in concrete regulations for the financial industry. The United Kingdom ventured into new territory with the Vickers Commission’s proposals on the organizational separation of lending and deposit-taking businesses with private and business clients from the rest of a bank’s activities. Finally, the discussion about the introduction of a financial transaction tax intensified at the European level.
In 2011 the German legislator amended the Securities Trading Act with a view to strengthen investor protection and market transparency and the European Commission proposed an overhaul of the Markets in Financial Instruments Directive to enhance investment advice to retail customers, market transparency and the organiza-tion of securities services providers.

Deutsche Bank 01 – Management Report 8 Financial Report 2011 Operating and Financial Review
Deutsche Bank The market environment in 2011 was very difficult. A favourable development of the markets in the first six months was followed by very challenging circumstances in the second half of 2011. The sovereign debt crisis in Europe led to mounting uncertainty in markets around the world and to reluctance to do business among clients, above all in Europe, but it also and most recently had an impact on the economy in several countries.
Despite this challenging environment, we achieved solid results in 2011, generating a net income of € 4.3 billion (2010: € 2.3 billion) and income before income taxes of € 5.4 billion compared with € 4.0 billion in 2010 (which included a € 2.3 billion charge related to the Postbank acquisition). In our business segments within CIB and PCAM, we achieved an income before income taxes of € 6.6 billion. This compares to our original target of € 10 billion, which was based on certain assumptions about the operating environment, not all of which have materialized in 2011.
While our CB&S business showed a very strong performance in the first half of 2011, it could not achieve its full-year target as market conditions clearly deteriorated as a result of the continued European sovereign debt crisis and growing macroeconomic concerns in the second half of 2011. In addition, CB&S had to absorb € 1.0 billion of specific charges related to litigation and operational risks. On the other hand, our GTB and PCAM businesses achieved record results and, in aggregate, exceeded their targets. This performance in-cluded positive impacts from recent acquisitions, notably the full-year consolidation of Postbank, which also contributed to a more balanced earnings mix in the current year. In addition, the results in PBC reflect a € 0.2 billion net negative impact resulting from write-downs on Greek government bonds (€ 0.5 billion), partly offset by a one-time positive impact related to our investment in Hua Xia Bank (€ 0.3 billion).
Our 2011 results were also impacted by other significant factors. Firstly, we recognized impairments of ap-proximately € 0.6 billion in relation to certain investments in CI. Secondly, our performance-related compen-sation expenses were significantly lower in 2011 reflecting lower results, especially in CB&S. Thirdly, we realized incremental efficiency savings of more than € 0.5 billion in 2011 through the execution of our Com-plexity Reduction Program, bringing the total efficiency savings of this program, compared with the respec-tive 2009 cost base, to € 1.1 billion by year-end 2011. Moreover, we have achieved additional savings from the further integration of CIB.
Overall, we considerably strengthened our capital position, liquidity reserves and refinancing sources and, thus, should be well prepared for further potential challenges caused by market turbulences and stricter regulatory rules. After applying the new rules of Basel 2.5 for the first time, our Tier 1 capital ratio was 12.9 % and our Core Tier 1 capital ratio was 9.5 % as of December 31, 2011. Risk-weighted assets at year-end 2011 were € 381 billion, versus € 346 billion at year-end 2010, largely due to an increase of € 54 billion attributable to the first-time implementation of the Basel 2.5 rules partly offset by management actions aimed at de-risking our business, mainly in CB&S. As of December 31, 2011, we also exceeded the capitalization requirements of the European Banking Authority, both in terms of the implementation date and our capitalization levels. Our liquidity reserves (excluding Postbank) were € 219 billion as of December 31, 2011 (December 31, 2010: € 150 billion).

Deutsche Bank 01 – Management Report 9 Financial Report 2011 Operating and Financial Review
The following table presents our condensed consolidated statement of income for 2011 and 2010.
in € m. 2011 increase (decrease) from 2010
(unless stated otherwise) 2011 2010 in € m. in %
Net interest income 17,445 15,583 1,862 12 Provision for credit losses 1,839 1,274 565 44 Net interest income after provision for credit losses 15,606 14,309 1,297 9
Commissions and fee income 11,544 10,669 875 8 Net gains (losses) on financial assets/liabilities at fair value through profit or loss 3,058 3,354 (296) (9) Net gains (losses) on financial assets available for sale 123 201 (78) (39) Net income (loss) from equity method investments (264) (2,004) 1,740 (87) Other income (loss) 1,322 764 558 73 Total noninterest income 15,783 12,984 2,799 22
Total net revenues
1 31,389 27,293 4,096 15
Compensation and benefits 13,135 12,671 464 4 General and administrative expenses 12,657 10,133 2,524 25 Policyholder benefits and claims 207 485 (278) (57) Impairment of intangible assets – 29 (29) N/M Restructuring activities – – – N/M Total noninterest expenses 25,999 23,318 2,681 11
Income before income taxes 5,390 3,975 1,415 36
Income tax expense 1,064 1,645 (581) (35)
Net income 4,326 2,330 1,996 86
Net income (loss) attributable to noncontrolling interests 194 20 174 N/M Net income (loss) attributable to Deutsche Bank shareholders 4,132 2,310 1,822 79 N/M – Not meaningful 1 After provision for credit losses.

Deutsche Bank 01 – Management Report 10 Financial Report 2011 Operating and Financial Review
Results of Operations
Consolidated Results of Operations You should read the following discussion and analysis in conjunction with the consolidated financial statements.
Net Interest Income The following table sets forth data related to our Net interest income.
in € m. 2011 increase (decrease) from 2010
(unless stated otherwise) 2011 2010 in € m. in %
Total interest and similar income 34,878 28,779 6,099 21 Total interest expenses 17,433 13,196 4,237 32
Net interest income 17,445 15,583 1,862 12
Average interest-earning assets
1 1,174,201 993,780 180,421 18 Average interest-bearing liabilities
1 1,078,721 933,537 145,184 16 Gross interest yield
2 2.97 % 2.90 % 0.07 ppt 2 Gross interest rate paid
3 1.62 % 1.41 % 0.21 ppt 15 Net interest spread
4 1.35 % 1.48 % (0.13) ppt (9) Net interest margin
5 1.49 % 1.57 % (0.08) ppt (5) ppt – Percentage points 1 Average balances for each year are calculated in general based upon month-end balances. 2 Gross interest yield is the average interest rate earned on our average interest-earning assets. 3 Gross interest rate paid is the average interest rate paid on our average interest-bearing liabilities. 4 Net interest spread is the difference between the average interest rate earned on average interest-earning assets and the average interest rate paid on average
interest-bearing liabilities. 5 Net interest margin is net interest income expressed as a percentage of average interest-earning assets.
Net interest income in 2011 was € 17.4 billion, an increase of € 1.9 billion, or 12 %, versus 2010. The im-provement was primarily driven by the consolidation of Postbank. The Postbank consolidation was also the main contributor to the increase in average interest-earning assets and average interest-bearing liabilities, resulting in substantially higher interest income and expenses. Excluding Postbank, net interest income in 2011 was down versus 2010. The decrease was mainly driven by CB&S, predominantly due to increased costs of funding due to higher spreads and lower net interest income on trading positions. These developments re-sulted in a tightening of our net interest spread by 13 basis points and of our net interest margin by 8 basis points.
The development of our net interest income is also impacted by the accounting treatment of some of our hedging-related derivative transactions. We enter into nontrading derivative transactions primarily as economic hedges of the interest rate risks of our nontrading interest-earning assets and interest-bearing liabilities. Some of these derivatives qualify as hedges for accounting purposes while others do not. When derivative transactions qualify as hedges of interest rate risks for accounting purposes, the interest arising from the derivatives is reported in interest income and expense, where it offsets interest flows from the hedged items. When derivatives do not qualify for hedge accounting treatment, the interest flows that arise from those derivatives will appear in trading income.

Deutsche Bank 01 – Management Report 11 Financial Report 2011 Operating and Financial Review
Net Gains (Losses) on Financial Assets/Liabilities at Fair Value through Profit or Loss The following table sets forth data related to our Net gains (losses) on financial assets/liabilities at fair value through profit or loss.
in € m. 2011 increase (decrease) from 2010
(unless stated otherwise) 2011 2010 in € m. in %
CIB – Sales & Trading (equity) 412 451 (39) (9) CIB – Sales & Trading (debt and other products) 2,640 3,046 (406) (13) Other 6 (144) 150 N/M
Total net gains (losses) on financial assets/ liabilities at fair value through profit or loss
3,058 3,354 (296) (9)
N/M – Not meaningful
Net gains on financial assets/liabilities at fair value through profit or loss decreased by € 296 million. In Sales & Trading (debt and other products), net gains on financial assets/liabilities at fair value through profit or loss were € 2.6 billion in 2011, compared to € 3.0 billion in 2010. This decrease was mainly driven by significantly lower revenues in Flow Credit, reflecting weakened credit markets and lower client volumes across the industry. In Sales & Trading (equity), net gains on financial assets/liabilities at fair value through profit or loss were al-most unchanged. In other product categories, net gains on financial assets/liabilities at fair value through profit or loss in 2011 were € 6 million, compared to negative € 144 million in 2010. The increase was mainly driven by the absence of mark-to-market losses on new loans and loan commitments held at fair value from Loan Products in CIB, which were recorded in 2010.
Net Interest Income and Net Gains (Losses) on Financial Assets/Liabilities at Fair Value through Profit or Loss Our trading and risk management businesses include significant activities in interest rate instruments and related derivatives. Under IFRS, interest and similar income earned from trading instruments and financial instruments designated at fair value through profit or loss (e.g., coupon and dividend income), and the costs of funding net trading positions are part of net interest income. Our trading activities can periodically shift income between net interest income and net gains (losses) on financial assets/liabilities at fair value through profit or loss depending on a variety of factors, including risk management strategies.

Deutsche Bank 01 – Management Report 12 Financial Report 2011 Operating and Financial Review
In order to provide a more business-focused discussion, the following table presents net interest income and net gains (losses) on financial assets/liabilities at fair value through profit or loss by group division and by product within the Corporate & Investment Bank.
in € m. 2011 increase (decrease) from 2010
(unless stated otherwise) 2011 2010 in € m. in %
Net interest income 17,445 15,583 1,862 12 Total net gains (losses) on financial assets/ liabilities at fair value through profit or loss 3,058 3,354 (296) (9)
Total net interest income and net gains (losses) on financial assets/liabilities at fair value through profit or loss 20,503 18,937 1,566 8
Breakdown by Group Division/CIB product:
1 Sales & Trading (equity) 1,589 2,266 (676) (30) Sales & Trading (debt and other products) 7,826 9,339 (1,513) (16)
Total Sales & Trading 9,415 11,604 (2,189) (19) Loan products
2 701 672 29 4 Transaction services 1,788 1,451 337 23 Remaining products
3 589 353 235 67 Total Corporate & Investment Bank 12,493 14,081 (1,588) (11) Private Clients and Asset Management 7,914 4,609 3,305 72 Corporate Investments 137 (86) 223 N/M Consolidation & Adjustments (40) 333 (373) N/M
Total net interest income and net gains (losses) on financial assets/liabilities at fair value through profit or loss 20,503 18,937 1,566 8
N/M – Not meaningful 1 This breakdown reflects net interest income and net gains (losses) on financial assets/liabilities at fair value through profit or loss only. For a discussion of the
group divisions’ total revenues by product please refer to “Results of Operations by Segment”. 2 Includes the net interest spread on loans as well as the fair value changes of credit default swaps and loans designated at fair value through profit or loss. 3 Includes net interest income and net gains (losses) on financial assets/liabilities at fair value through profit or loss of origination, advisory and other products.
Corporate & Investment Bank (CIB). Combined revenues from net interest income and from net gains (losses) on financial assets/ liabilities at fair value through profit or loss from Sales & Trading were € 9.4 billion in 2011, compared to € 11.6 billion in 2010. In Sales & Trading (debt and other products) the main drivers for the decrease were significantly lower revenues in Flow Credit, reflecting weakened credit markets and lower client volumes across the industry. In Sales & Trading (equity) these revenues were lower than 2010, mainly in Cash Trading, which was negatively impacted by the deterioration in equity markets during 2011, and in Equity Derivatives, due to a more challenging environment and lower client activity. Combined revenues from net interest income and from net gains (losses) on financial assets/ liabilities at fair value through profit or loss from Loan products were virtually unchanged, while in Transaction services, these revenues increased by € 337 million. The in-crease was attributable to all businesses in Global Transaction Banking, and included effects from the acquisi-tion of commercial banking activities from ABN AMRO in the Netherlands. The increase of € 235 million in remaining products was driven by several items, including positive effects from derivatives not qualifying for hedge accounting.
Deutsche Bank 01 – Management Report 13 Financial Report 2011 Operating and Financial Review
Private Clients and Asset Management (PCAM). Combined net interest income and net gains (losses) on financial assets/liabilities at fair value through profit or loss were € 7.9 billion in 2011, an increase of € 3.3 billion, or 72 %, compared to 2010. The increase was mainly driven by the first-time consolidation of Postbank. In addition, the increase included higher net interest income from Deposits and Payment services, resulting from increased deposit volumes, partly offset by decreases in net interest income from Credit Products.
Corporate Investments (CI). Combined net interest income and net gains (losses) on financial assets/ liabilities at fair value through profit or loss were € 137 million in 2011, compared to negative € 86 million in 2010. The main driver for the increase was the transfer of the exposure in Actavis Group from CB&S to CI at the beginning of 2011.
Consolidation & Adjustments. Combined net interest income and net gains (losses) on financial assets/ liabilities at fair value through profit or loss were negative € 40 million in 2011, compared to € 333 million in 2010. The decrease mainly resulted from positions which were measured at fair value for management report-ing purposes and measured at amortized cost under IFRS. Partly offsetting was higher net interest income on non-divisionalized assets and liabilities, including taxes.
Provision for Credit Losses Provision for credit losses was € 1.8 billion for the full year 2011 versus € 1.3 billion in 2010. The increase was mainly attributable to Postbank, which contributed € 761 million for the year. This number excludes releases from Postbank related loan loss allowances recorded prior to consolidation of € 402 million. The impact of such releases is reported as net interest income on the group level. Excluding Postbank, provisions were down € 139 million primarily reflecting improved performance in the Private & Business Clients Advisory Banking Germany and Advisory Banking International.
Deutsche Bank 01 – Management Report 14 Financial Report 2011 Operating and Financial Review
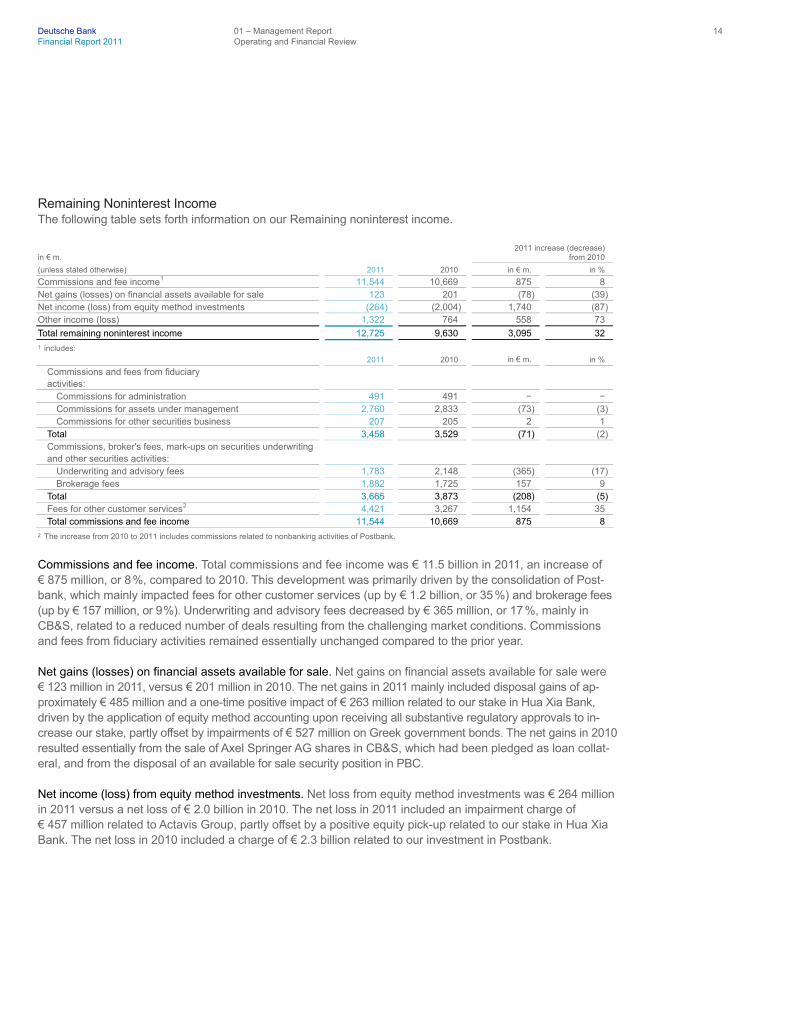
Remaining Noninterest Income The following table sets forth information on our Remaining noninterest income.
in € m. 2011 increase (decrease) from 2010
(unless stated otherwise) 2011 2010 in € m. in %
Commissions and fee income
1 11,544 10,669 875 8 Net gains (losses) on financial assets available for sale 123 201 (78) (39) Net income (loss) from equity method investments (264) (2,004) 1,740 (87) Other income (loss) 1,322 764 558 73
Total remaining noninterest income 12,725 9,630 3,095 32 1 includes:
2011 2010 in € m. in %
Commissions and fees from fiduciary activities:
Commissions for administration 491 491 − − Commissions for assets under management 2,760 2,833 (73) (3) Commissions for other securities business 207 205 2 1
Total 3,458 3,529 (71) (2) Commissions, broker's fees, mark-ups on securities underwriting and other securities activities:
Underwriting and advisory fees 1,783 2,148 (365) (17) Brokerage fees 1,882 1,725 157 9
Total 3,665 3,873 (208) (5) Fees for other customer services
2 4,421 3,267 1,154 35 Total commissions and fee income 11,544 10,669 875 8
2 The increase from 2010 to 2011 includes commissions related to nonbanking activities of Postbank.
Commissions and fee income. Total commissions and fee income was € 11.5 billion in 2011, an increase of € 875 million, or 8 %, compared to 2010. This development was primarily driven by the consolidation of Post-bank, which mainly impacted fees for other customer services (up by € 1.2 billion, or 35 %) and brokerage fees (up by € 157 million, or 9 %). Underwriting and advisory fees decreased by € 365 million, or 17 %, mainly in CB&S, related to a reduced number of deals resulting from the challenging market conditions. Commissions and fees from fiduciary activities remained essentially unchanged compared to the prior year.
Net gains (losses) on financial assets available for sale. Net gains on financial assets available for sale were € 123 million in 2011, versus € 201 million in 2010. The net gains in 2011 mainly included disposal gains of ap-proximately € 485 million and a one-time positive impact of € 263 million related to our stake in Hua Xia Bank, driven by the application of equity method accounting upon receiving all substantive regulatory approvals to in-crease our stake, partly offset by impairments of € 527 million on Greek government bonds. The net gains in 2010 resulted essentially from the sale of Axel Springer AG shares in CB&S, which had been pledged as loan collat-eral, and from the disposal of an available for sale security position in PBC.
Net income (loss) from equity method investments. Net loss from equity method investments was € 264 million in 2011 versus a net loss of € 2.0 billion in 2010. The net loss in 2011 included an impairment charge of € 457 million related to Actavis Group, partly offset by a positive equity pick-up related to our stake in Hua Xia Bank. The net loss in 2010 included a charge of € 2.3 billion related to our investment in Postbank.
Deutsche Bank 01 – Management Report 15 Financial Report 2011 Operating and Financial Review
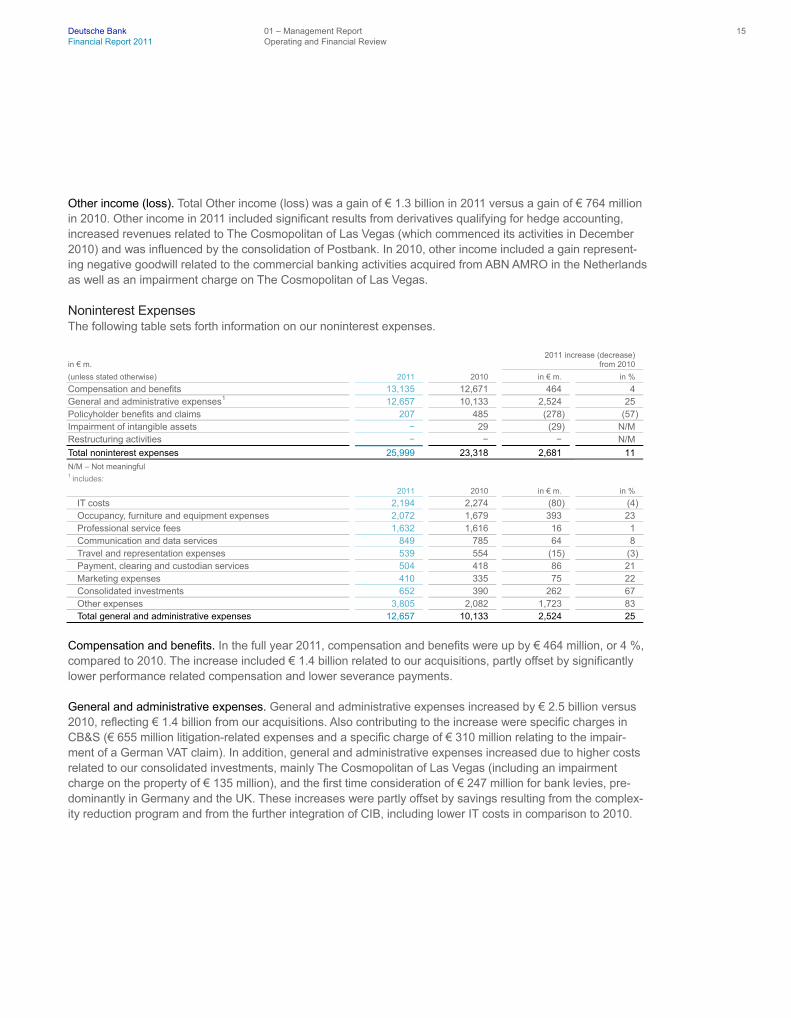
Other income (loss). Total Other income (loss) was a gain of € 1.3 billion in 2011 versus a gain of € 764 million in 2010. Other income in 2011 included significant results from derivatives qualifying for hedge accounting, increased revenues related to The Cosmopolitan of Las Vegas (which commenced its activities in December 2010) and was influenced by the consolidation of Postbank. In 2010, other income included a gain represent-ing negative goodwill related to the commercial banking activities acquired from ABN AMRO in the Netherlands as well as an impairment charge on The Cosmopolitan of Las Vegas.
Noninterest Expenses The following table sets forth information on our noninterest expenses.
in € m.
2011 increase (decrease) from 2010
(unless stated otherwise) 2011 2010 in € m. in %
Compensation and benefits 13,135 12,671 464 4 General and administrative expenses
1 12,657 10,133 2,524 25 Policyholder benefits and claims 207 485 (278) (57) Impairment of intangible assets − 29 (29) N/M Restructuring activities − − − N/M
Total noninterest expenses 25,999 23,318 2,681 11
N/M – Not meaningful
1 includes:
2011 2010 in € m. in %
IT costs 2,194 2,274 (80) (4) Occupancy, furniture and equipment expenses 2,072 1,679 393 23 Professional service fees 1,632 1,616 16 1 Communication and data services 849 785 64 8 Travel and representation expenses 539 554 (15) (3) Payment, clearing and custodian services 504 418 86 21 Marketing expenses 410 335 75 22 Consolidated investments 652 390 262 67 Other expenses 3,805 2,082 1,723 83 Total general and administrative expenses 12,657 10,133 2,524 25
Compensation and benefits. In the full year 2011, compensation and benefits were up by € 464 million, or 4 %, compared to 2010. The increase included € 1.4 billion related to our acquisitions, partly offset by significantly lower performance related compensation and lower severance payments.
General and administrative expenses. General and administrative expenses increased by € 2.5 billion versus 2010, reflecting € 1.4 billion from our acquisitions. Also contributing to the increase were specific charges in CB&S (€ 655 million litigation-related expenses and a specific charge of € 310 million relating to the impair-ment of a German VAT claim). In addition, general and administrative expenses increased due to higher costs related to our consolidated investments, mainly The Cosmopolitan of Las Vegas (including an impairment charge on the property of € 135 million), and the first time consideration of € 247 million for bank levies, pre-dominantly in Germany and the UK. These increases were partly offset by savings resulting from the complex-ity reduction program and from the further integration of CIB, including lower IT costs in comparison to 2010.

Deutsche Bank 01 – Management Report 16 Financial Report 2011 Operating and Financial Review
Policyholder benefits and claims. Policyholder benefits and claims in 2011 were € 207 million, a decrease of € 278 million compared to the prior year, resulting primarily from our Abbey Life business. These insurance-related charges are offsetting related net gains on financial assets/liabilities at fair value through profit or loss.
Impairment of intangible assets. There was no charge for impairment of intangible assets in 2011. In 2010, an impairment charge of € 29 million on intangible assets relating to the client portfolio of an acquired domestic custody services business was recorded in GTB.
Income Tax Expense In 2011, the income tax expense was € 1.1 billion, which led to an effective tax rate of 20 % compared to an income tax expense of € 1.6 billion and an effective tax rate of 41 % in 2010. The current year’s effective tax rate primarily benefited from changes in the recognition and measurement of deferred taxes, a favorable geo-graphic mix of income and the partial tax exemption of net gains related to our stake in Hua Xia Bank. The prior year’s effective tax rate of 41 % was impacted by a Postbank related charge of € 2.3 billion which did not result in a tax benefit.
Segment Results of Operations The following is a discussion of the results of our business segments. See Note 05 “Business Segments and Related Information” to the consolidated financial statements for information regarding
— our organizational structure; — effects of significant acquisitions and divestitures on segmental results; — changes in the format of our segment disclosure; — the framework of our management reporting systems; — consolidating and other adjustments to the total results of operations of our business segments, and — definitions of non-GAAP financial measures that are used with respect to each segment.
The criterion for segmentation into divisions is our organizational structure as it existed at December 31, 2011. Segment results were prepared in accordance with our management reporting systems.

Deutsche Bank 01 – Management Report 17 Financial Report 2011 Operating and Financial Review
2011 in € m. (unless stated otherwise)
Corporate & Investment Bank
Private Clients and Asset Management
Corporate Investments
Total Management Reporting
Consoli- dation & Adjustments
Total Consolidated
Net revenues 18,493 14,379 394 33,266 (38) 33,228
Provision for credit losses 462 1,364 14 1,840 (1) 1,839
Total noninterest expenses 13,977 10,277 1,492 25,746 253 25,999 therein: Policyholder benefits and claims 207 0 − 207 − 207 Impairment of intangible assets − − − − − − Restructuring activities − − − − − −
Noncontrolling interests 27 189 (2) 213 (213) −
Income (loss) before income taxes 1 4,028 2,549 (1,111) 5,466 (77) 5,390
Cost/income ratio 76 % 71 % N/M 77 % N/M 78 % Assets
2 1,796,954 394,094 25,203 2,152,949 11,154 2,164,103 Average active equity
3 20,561 16,563 1,130 38,254 12,195 50,449 Pre-tax return on average active equity
4 20 % 15 % (98) % 14 % N/M 10 % N/M – Not meaningful 1 The Group also uses an adjusted income (loss) before income taxes (IBIT) for the calculation of its pre-tax return on average active equity (target definition).
IBIT is adjusted to exclude a net positive impact of € 236 million related to the stake in Hua Xia Bank (PBC). 2 The sum of corporate divisions does not necessarily equal the total of the corresponding group division because of consolidation items between corporate
divisions, which are to be eliminated on group division level. The same approach holds true for the sum of group divisions compared to ‘Total Consolidated’. 3 For management reporting purposes goodwill and other intangible assets with indefinite useful lives are explicitly assigned to the respective divisions. Starting 2011, the
Group’s average active equity is allocated to the business segments and to Consolidation & Adjustments in proportion to their regulatory capital requirements, which comprises of the regulatory capital required to support risk weighted assets and certain capital deduction items, goodwill and unamortized other intangible assets. Prior periods were adjusted accordingly.
4 For the calculation of pre-tax return on average active equity please refer to Note 05 “Business Segments and Related Information”. For ‘Total consolidated’, pre-tax return on average shareholders’ equity is 10 %.
2010 in € m. (unless stated otherwise)
Corporate & Investment Bank
Private Clients and Asset Management
Corporate Investments
Total Management Reporting
Consoli- dation & Adjustments
Total Consolidated
Net revenues 20,929
1 9,810 (1,796)
2 28,944 (377) 28,567
Provision for credit losses 488 785 (0) 1,273 0 1,274
Total noninterest expenses 14,422 7,919 967 23,308 10 23,318 therein: Policyholder benefits and claims 486 0 − 486 (0) 485 Impairment of intangible assets 29 − − 29 − 29 Restructuring activities − − − − − −
Noncontrolling interests 20 6 (2) 24 (24) −
Income (loss) before income taxes 5,999 1,100 (2,760) 4,339 (363) 3,975
Cost/income ratio 69 % 81 % N/M 81 % N/M 82 % Assets
3 1,519,983 400,110 30,138 1,894,282 11,348 1,905,630 Average active equity
4 21,357 9,906 2,243 33,505 7,848 41,353 Pre-tax return on average active equity
5 28 % 11 % (123) % 13 % N/M 10 % N/M – Not meaningful 1 Includes a gain from the recognition of negative goodwill related to the acquisition of the commercial banking activities of ABN AMRO in the Netherlands of
€ 208 million as reported in the second quarter 2010 which is excluded from the Group’s target definition. 2 Includes a charge related to the investment in Deutsche Postbank AG of € 2,338 million, which is excluded from the Group’s target definition. 3 The sum of corporate divisions does not necessarily equal the total of the corresponding group division because of consolidation items between corporate
divisions, which are to be eliminated on group division level. The same approach holds true for the sum of group divisions compared to ‘Total Consolidated’. 4 For management reporting purposes goodwill and other intangible assets with indefinite useful lives are explicitly assigned to the respective divisions. Starting 2011, the
Group’s average active equity is allocated to the business segments and to Consolidation & Adjustments in proportion to their regulatory capital requirements, which comprises of the regulatory capital required to support risk weighted assets and certain capital deduction items, goodwill and unamortized other intangible assets. Prior periods were adjusted accordingly.
5 For the calculation of pre-tax return on average active equity please refer to Note 05 “Business Segments and Related Information”. For ‘Total consolidated’, pre-tax return on average shareholders’ equity is 10 %.

Deutsche Bank 01 – Management Report 18 Financial Report 2011 Operating and Financial Review
Group Divisions Corporate & Investment Bank Group Division The following table sets forth the results of our Corporate & Investment Bank Group Division (CIB) for the years ended December 31, 2011 and 2010, in accordance with our management reporting systems.
in € m. (unless stated otherwise) 2011 2010
Net revenues: Sales & Trading (debt and other products) 8,579 9,925 Sales & Trading (equity) 2,422 3,108 Origination (debt) 1,056 1,200 Origination (equity) 559 706 Advisory 621 573 Loan products 1,510 1,588 Transaction services 3,608 3,163 Other products 138 665
Total net revenues 18,493 20,929 therein: Net interest income and net gains (losses) on financial assets/liabilities at fair value through profit or loss 12,493 14,081
Provision for credit losses 462 488
Total noninterest expenses 13,977 14,422 therein: Policyholder benefits and claims 207 486 Impairment of intangible assets − 29 Restructuring activities − −
Noncontrolling interests 27 20
Income (loss) before income taxes 4,028 5,999
Cost/income ratio 76 % 69 % Assets 1,796,954 1,519,983 Average active equity
1 20,561 21,357 Pre-tax return on average active equity 20 % 28 % 1 See Note 05 “Business Segments and Related Information” to the consolidated financial statements for a description of how average active equity is allocated to
the divisions.
The following paragraphs discuss the contribution of the individual corporate divisions to the overall results of the Corporate & Investment Bank Group Division.

Deutsche Bank 01 – Management Report 19 Financial Report 2011 Operating and Financial Review
Corporate Banking & Securities Corporate Division The following table sets forth the results of our Corporate Banking & Securities Corporate Division (CB&S) for the years ended December 31, 2011 and 2010, in accordance with our management reporting systems.
in € m. (unless stated otherwise) 2011 2010
Net revenues: Sales & Trading (debt and other products) 8,579 9,925 Sales & Trading (equity) 2,422 3,108 Origination (debt) 1,056 1,200 Origination (equity) 559 706 Advisory 621 573 Loan products 1,510 1,588 Other products 138 449 Total net revenues 14,885 17,551
Provision for credit losses 304 375
Total noninterest expenses 11,650 12,122 therein: Policyholder benefits and claims 207 486 Impairment of intangible assets − − Restructuring activities − −
Noncontrolling interests 27 20
Income (loss) before income taxes 2,905 5,033
Cost/income ratio 78 % 69 % Assets 1,727,156 1,461,495 Average active equity
1 18,113 18,941 Pre-tax return on average active equity 16 % 27 % 1 See Note 05 “Business Segments and Related Information” to the consolidated financial statements for a description of how average active equity is allocated to
the divisions.
Sales & Trading (debt and other products) net revenues were € 8.6 billion, a decrease of € 1.3 billion, or 14 %, compared to the full year 2010 which included charges related to Ocala Funding LLC of approximately € 360 million. Revenues in Credit were significantly lower than the prior year, predominantly in Flow Credit, reflecting weakened credit markets, lower client volumes across the industry, and reduced liquidity especially in the latter half of the year. However absolute performance in client solutions was strong reflecting demand for restructuring capabilities. Deutsche Bank was voted Credit Derivatives House of the Year by IFR and Risk magazines. Rates and Emerging Markets revenues were lower than the prior year primarily due to lower flow client volumes as a result of market uncertainty, although we were ranked number one in Interest Rate Deriva-tives globally for the second consecutive year (source: Greenwich Associates) and were awarded Interest Rate Derivatives House of the Year by Risk magazine. RMBS revenues were significantly higher than the prior year as a result of successful business realignment and the absence of prior year losses. Money Markets revenues were higher than the prior year, driven by strong client activity and volatile markets. Foreign Exchange reve-nues were very strong, with record annual client volumes offsetting lower margins and we were ranked number one by the Euromoney FX Survey by market share for the seventh consecutive year. Commodities delivered record annual revenues despite a challenging environment, reflecting successful strategic investment, and we were awarded Most Innovative Commodity House by The Banker magazine. During 2011, we were also ranked number one in Global and U.S. Fixed Income for the second consecutive year (source: Greenwich Associates).

Deutsche Bank 01 – Management Report 20 Financial Report 2011 Operating and Financial Review
Sales & Trading (equity) generated revenues of € 2.4 billion, a decrease of € 686 million, or 22 %, compared to 2010. This development reflects a more difficult market environment, with higher volatility and declining mar-kets impacting client sentiment and activity, especially in Europe, which accounts for a high proportion of our business. Cash Trading revenues were lower than 2010 due to the impact of the deterioration in equity markets during 2011 and lower client activity in Europe. We increased our cash equities market share in the U.S. ac-cording to Greenwich Associates, which is a result of strategic investments, and we were ranked number one in European Research (source: Institutional Investor). Equity Derivatives revenues were lower as a result of a more challenging environment and lower client activity, although record revenues were achieved in the U.S.. Prime Finance revenues were slightly lower reflecting reduced levels of client leverage, partially offset by our strong market position. During 2011, we were ranked number one Global Prime Broker (source: Global Custo-dian) for the fourth consecutive year.
Origination and Advisory generated revenues of € 2.2 billion in 2011, a decrease of € 244 million, or 10 %, compared to full year 2010. We ended the year ranked number six globally according to Dealogic, very close to the number five ranked firm, and ranked the clear number one in EMEA for a second consecutive year. We were also ranked number four in Asia, up from number six in the prior year. Advisory revenues were € 621 million, an increase of € 48 million, or 8 %, compared to 2010, and we ranked number two in EMEA and number four in crossborder M&A. Debt Origination revenues were € 1.1 billion, a decrease of € 144 million, or 12 %, compared to 2010. We were ranked number three in High Yield and number two in the All International Bonds league table (source: Thomson Reuters). Equity Origination revenues were € 559 million, a decrease of € 147 million, or 21 %, compared to 2010 and we were ranked number one in EMEA. All ranks sourced from Dealogic unless stated otherwise.
Loan products revenues were € 1.5 billion in 2011, a decrease of € 78 million, or 5 %, from last year. The de-crease was mainly driven by the transfer of the exposure in Actavis Group to Corporate Investments at the beginning of 2011.
Net revenues from other products were € 138 million in 2011, compared to € 449 million in 2010. The decrease was mainly driven by lower mark-to-market gains on investments held to back insurance policyholder claims in Abbey Life, which are offset in noninterest expenses.
In provision for credit losses, CB&S recorded a net charge of € 304 million in 2011, compared to a net charge of € 375 million in 2010.
Noninterest expenses were € 11.7 billion in 2011, a decrease of € 472 million compared to 2010. This decrease was primarily driven by lower performance-related compensation expenses, efficiency savings and the impact of the aforementioned effects from Abbey Life, partly offset by € 655 million of specific charges, mainly related to litigation and a specific charge of € 310 million relating to the impairment of a German VAT claim.

Deutsche Bank 01 – Management Report 21 Financial Report 2011 Operating and Financial Review
Global Transaction Banking Corporate Division The following table sets forth the results of our Global Transaction Banking Corporate Division (GTB) for the years ended December 31, 2011 and 2010, in accordance with our management reporting systems.
in € m. (unless stated otherwise) 2011 2010
Net revenues: Transaction services 3,608 3,163 Other products − 216 Total net revenues 3,608 3,379
Provision for credit losses 158 113
Total noninterest expenses 2,327 2,300 therein: Restructuring activities − − Impairment on intangible assets − 29
Noncontrolling interests − −
Income (loss) before income taxes 1,123 965
Cost/income ratio 64 % 68 % Assets 96,404 79,202 Average active equity
1 2,448 2,416 Pre-tax return on average active equity 46 % 40 % 1 See Note 05 “Business Segments and Related Information” to the consolidated financial statements for a description of how average active equity is allocated to
the divisions.
Net revenues were € 3.6 billion, an increase of 7 %, or € 229 million, compared to 2010 which included € 216 million related to negative goodwill from the acquisition of commercial banking activities in the Nether-lands. This increase was driven by a performance on record levels across all businesses with growth in fee and interest income. Trust & Securities Services profited from improved market conditions in the custody and depo-sitary receipt business. Trade Finance further capitalized on high demand for international trade products and financing. In Cash Management, revenues increased on the basis of higher fees from strong payment volumes as well as higher net interest income mainly driven by slightly improved interest rate levels in Asia and the euro area compared to the prior year period.
Provision for credit losses was € 158 million. The net increase of € 45 million versus 2010 was mainly related to the commercial banking activities acquired in the Netherlands.
Noninterest expenses were € 2.3 billion, a slight increase compared to 2010. The increase was driven by the aforementioned acquisition in the second quarter 2010 including higher expenses related to the amortization of an upfront premium paid for credit protection received and higher insurance-related expenses. These factors were partially offset by the non-recurrence of significant severance charges which related to specific measures associated with the realignment of infrastructure areas and sales units in 2010. The prior year included the impact of an impairment of intangible assets.

Deutsche Bank 01 – Management Report 22 Financial Report 2011 Operating and Financial Review
Private Clients and Asset Management Group Division The following table sets forth the results of our Private Clients and Asset Management Group Division (PCAM) for the years ended December 31, 2011 and 2010, in accordance with our management reporting systems.
in € m. (unless stated otherwise) 2011 2010
Net revenues: Discretionary portfolio/fund management 2,354 2,491 Advisory/brokerage 1,735 1,717 Credit products 2,585 2,628 Deposits and payment services 2,244 2,102 Other products 5,460 872 Total net revenues 14,379 9,810
therein: Net interest income and net gains (losses) on financial assets/liabilities at fair value through profit or loss 7,914 4,609
Provision for credit losses 1,364 785
Total noninterest expenses 10,277 7,919 therein: Policyholder benefits and claims − − Impairment of intangible assets − − Restructuring activities − −
Noncontrolling interests 189 6
Income (loss) before income taxes 2,549 1,100
Cost/income ratio 71 % 81 % Assets 394,094 400,110 Average active equity
1 16,563 9,906 Pre-tax return on average active equity 15 % 11 % Invested assets (in € bn.)
2 1,116 1,131 1 See Note 05 “Business Segments and Related Information” to the consolidated financial statements for a description of how average active equity is allocated to
the divisions. 2 We define invested assets as (a) assets we hold on behalf of customers for investment purposes and/or (b) client assets that are managed by us. We manage
invested assets on a discretionary or advisory basis, or these assets are deposited with us.
The following paragraphs discuss the contribution of the individual corporate divisions to the overall results of the Private Clients and Asset Management Group Division.
Deutsche Bank 01 – Management Report 23 Financial Report 2011 Operating and Financial Review
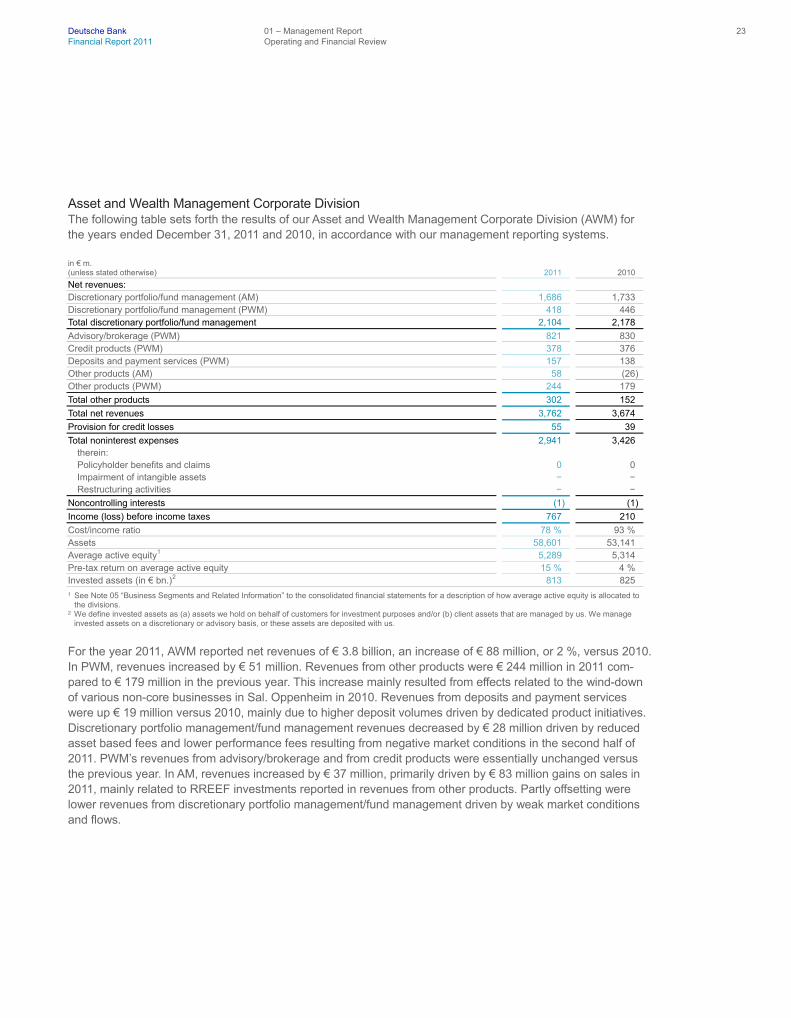
Asset and Wealth Management Corporate Division The following table sets forth the results of our Asset and Wealth Management Corporate Division (AWM) for the years ended December 31, 2011 and 2010, in accordance with our management reporting systems.
in € m. (unless stated otherwise) 2011 2010
Net revenues: Discretionary portfolio/fund management (AM) 1,686 1,733 Discretionary portfolio/fund management (PWM) 418 446 Total discretionary portfolio/fund management 2,104 2,178
Advisory/brokerage (PWM) 821 830 Credit products (PWM) 378 376 Deposits and payment services (PWM) 157 138 Other products (AM) 58 (26) Other products (PWM) 244 179
Total other products 302 152
Total net revenues 3,762 3,674
Provision for credit losses 55 39
Total noninterest expenses 2,941 3,426 therein: Policyholder benefits and claims 0 0 Impairment of intangible assets − − Restructuring activities − −
Noncontrolling interests (1) (1)
Income (loss) before income taxes 767 210
Cost/income ratio 78 % 93 % Assets 58,601 53,141 Average active equity
1 5,289 5,314 Pre-tax return on average active equity 15 % 4 % Invested assets (in € bn.)
2 813 825 1 See Note 05 “Business Segments and Related Information” to the consolidated financial statements for a description of how average active equity is allocated to
the divisions. 2 We define invested assets as (a) assets we hold on behalf of customers for investment purposes and/or (b) client assets that are managed by us. We manage
invested assets on a discretionary or advisory basis, or these assets are deposited with us.
For the year 2011, AWM reported net revenues of € 3.8 billion, an increase of € 88 million, or 2 %, versus 2010. In PWM, revenues increased by € 51 million. Revenues from other products were € 244 million in 2011 com-pared to € 179 million in the previous year. This increase mainly resulted from effects related to the wind-down of various non-core businesses in Sal. Oppenheim in 2010. Revenues from deposits and payment services were up € 19 million versus 2010, mainly due to higher deposit volumes driven by dedicated product initiatives. Discretionary portfolio management/fund management revenues decreased by € 28 million driven by reduced asset based fees and lower performance fees resulting from negative market conditions in the second half of 2011. PWM’s revenues from advisory/brokerage and from credit products were essentially unchanged versus the previous year. In AM, revenues increased by € 37 million, primarily driven by € 83 million gains on sales in 2011, mainly related to RREEF investments reported in revenues from other products. Partly offsetting were lower revenues from discretionary portfolio management/fund management driven by weak market conditions and flows.

Deutsche Bank 01 – Management Report 24 Financial Report 2011 Operating and Financial Review
Provision for credit losses was € 55 million, up € 16 million compared to 2010, primarily attributable to Sal. Oppenheim.
Noninterest expenses in 2011 were € 2.9 billion, a decrease of € 485 million, or 14 %, compared to 2010. In PWM, noninterest expenses decreased by € 344 million, mainly driven by benefits in 2011 resulting from the successful integration of Sal. Oppenheim. In AM, non-interest expenses declined by € 141 million mainly re-flecting the impact of measures to improve platform efficiency.
Invested assets in AWM were € 813 billion at December 31, 2011, a decrease of € 13 billion, thereof € 7 billion in PWM and € 6 billion in AM. The decline in PWM included an impact of € 13 billion due to market deprecia-tion, partly offset by € 4 billion net new assets, mainly in Asia and Germany. The decrease in AM included € 13 billion net outflows. Outflows in the cash and equity business, reflecting investor uncertainty, were partly offset by inflows in higher margin products. Foreign currency movements of € 7 billion partly compensated for the overall net outflows in AM.
Private & Business Clients Corporate Division The following table sets forth the results of our Private & Business Clients Corporate Division (PBC) for the years ended December 31, 2011 and 2010, in accordance with our management reporting systems.
in € m. (unless stated otherwise) 2011 2010
Net revenues: Discretionary portfolio/fund management 251 313 Advisory/brokerage 914 887 Credit products 2,207 2,253 Deposits and payment services 2,087 1,964 Other products
1 5,158 720 Total net revenues 10,617 6,136
Provision for credit losses 1,309 746
Total noninterest expenses 7,336 4,493 therein: Restructuring activities − −
Noncontrolling interests 190 8
Income (loss) before income taxes 1,782 890
Cost/income ratio 69 % 73 % Assets 335,516 346,998 Average active equity
2 11,274 4,592 Pre-tax return on average active equity 16 % 19 % Invested assets (in € bn.)
3 304 306 Loan volume (in € bn.) 206 202
4 Deposit volume (in € bn.) 235 229 1 The increase from 2010 to 2011 includes € 4.2 bn from the consolidation of Postbank. 2 See Note 05 “Business Segments and Related Information” to the consolidated financial statements for a description of how average active equity is allocated to
the divisions. 3 We define invested assets as (a) assets we hold on behalf of customers for investment purposes and/or (b) client assets that are managed by us. We manage
invested assets on a discretionary or advisory basis, or these assets are deposited with us. 4 Prior year amount has been adjusted.

Deutsche Bank 01 – Management Report 25 Financial Report 2011 Operating and Financial Review
Net revenues were € 10.6 billion, up € 4.5 billion, or 73 %, versus 2010. This development was mainly attribut-able to the consolidation of Postbank, which began on December 3, 2010, and contributed revenues of € 4.6 billion in 2011, compared to € 414 million in 2010. PBC’s revenues from other products were impacted by € 527 million impairments on Greek government bonds, of which € 465 million were in Postbank and € 62 million were in Advisory Banking Germany. PBC’s revenues from other products also included a one-time positive impact of € 263 million related to our stake in Hua Xia Bank, driven by the application of equity method accounting upon receiving all substantive regulatory approvals to increase our stake. PBC’s revenues from deposits and payment services revenues increased by € 124 million, or 6 %, largely driven by higher volumes, in Advisory Banking Germany. Advisory/brokerage revenues increased by € 27 million, or 3 %. PBC’s revenues from discretionary portfolio management/fund management revenues decreased by € 62 million, or 20 %, mainly in Advisory Banking Germany due to the challenging environment. Credit products revenues were down by € 46 million or 2 %, with negative effects from lower margins overcompensating revenue increases due to higher volumes in both Advisory Banking Germany and Advisory Banking International.
Provision for credit losses was € 1.3 billion, of which € 761 million related to Postbank. This number excludes releases from Postbank-related loan loss allowance recorded prior to consolidation of € 402 million. The impact of such releases is reported as net interest income. Excluding Postbank, provisions for credit losses were € 548 million, down € 142 million compared to 2010. The decrease was driven by both Advisory Banking Ger-many as well as Advisory Banking International, mainly Poland.
Noninterest expenses were € 7.3 billion, an increase of € 2.8 billion, or 63 %, compared to 2010. The increase was predominantly driven by the consolidation of Postbank. Excluding the Postbank related increase, nonin-terest expenses were down by € 64 million, mainly resulting from measures to reduce complexity and to im-prove platform efficiency.
Invested assets remained virtually unchanged at € 304 billion. This was mainly driven by € 9 billion due to market depreciation, partly offset by € 8 billion net inflows, mainly in deposits.
PBC’s total number of clients was 28.6 million, of which 14.1 million related to Postbank.

Deutsche Bank 01 – Management Report 26 Financial Report 2011 Operating and Financial Review
Corporate Investments Group Division The following table sets forth the results of our Corporate Investments Group Division (CI) for the years ended December 31, 2011 and 2010, in accordance with our management reporting systems.
in € m. (unless stated otherwise) 2011 2010
Net revenues 394 (1,796) therein: Net interest income and net gains (losses) on financial assets/liabilities at fair value through profit or loss 137 (86)
Provision for credit losses 14 (0)
Total noninterest expenses 1,492 967 therein Impairment of intangible assets − − Restructuring activities − −
Noncontrolling interests (2) (2)
Income (loss) before income taxes (1,111) (2,760)
Cost/income ratio N/M N/M Assets 25,203 30,138 Average active equity
1 1,130 2,243 Pre-tax return on average active equity (98) % (123) % N/M – Not meaningful 1 See Note 05 “Business Segments and Related Information” to the consolidated financial statements for a description of how average active equity is allocated to
the divisions.
Net revenues were € 394 million, versus negative € 1.8 billion compared to 2010. In 2011, net revenues mainly consisted of recurring revenues from our exposure in Actavis Group and our investments in BHF-BANK, Maher Terminals and The Cosmopolitan of Las Vegas which were partly reduced by impairment charges of € 457 million related to Actavis Group. Net revenues in 2010 were mainly impacted by a charge of € 2.3 billion on our investment in Postbank in the third quarter.
Noninterest expenses were € 1.5 billion in 2011 versus € 967 million in the prior year. The increase was essen-tially due to The Cosmopolitan of Las Vegas, mainly related to the start of its operations at the end of 2010 and to a lesser extent resulting from an impairment charge of € 135 million on the property. Also contributing to the increase was our investment in BHF-BANK, including special items of € 97 million which mainly relates to severance payments.
For the full year 2011, loss before income taxes amounted to € 1.1 billion compared to a loss before income taxes of € 2.8 billion in the prior year. Consolidation & Adjustments For a discussion of Consolidation & Adjustments to our business segment results see Note 05 “Business Seg-ments and Related Information” to the consolidated financial statements.

Deutsche Bank 01 – Management Report 27 Financial Report 2011 Operating and Financial Review
Financial Position
The table below shows information on the financial position.
in € m. Dec 31, 2011 Dec 31, 2010
Cash and due from banks 15,928 17,157 Interest-earning deposits with banks 162,000 92,377 Central bank funds sold, securities purchased under resale agreements and securities borrowed 57,110 49,281 Trading assets 240,924 271,291 Positive market values from derivative financial instruments 859,582 657,780 Financial assets designated at fair value through profit or loss
1 180,293 171,926 Loans 412,514 407,729 Brokerage and securities related receivables 122,810 103,423 Remaining assets 112,942 134,666
Total assets 2,164,103 1,905,630
Deposits 601,730 533,984 Central bank funds purchased, securities sold under repurchase agreements and securities loaned 43,401 31,198 Trading liabilities 63,886 68,859 Negative market values from derivative financial instruments 838,817 647,195 Financial liabilities designated at fair value through profit or loss
2 118,318 130,154 Other short-term borrowings 65,356 64,990 Long-term debt 163,416 169,660 Brokerage and securities related payables 139,733 116,146 Remaining liabilities 74,786 93,076 Total liabilities 2,109,443 1,855,262
Total equity 54,660 50,368 1 Includes securities purchased under resale agreements designated at fair value through profit or loss of € 117,284 million and € 108,912 million and securities
borrowed designated at fair value through profit or loss of € 27,261 million and € 27,887 million as of December 31, 2011 and December 31, 2010, respectively. 2 Includes securities sold under repurchase agreements designated at fair value through profit or loss of € 93,606 million and € 107,999 million as of December 31,
2011 and December 31, 2010, respectively.
Movements in Assets As of December 31, 2011, total assets were € 2,164 billion. The increase of € 258 billion or 14 % compared to December 31, 2010, was primarily related to derivatives as well as interest-earning deposits with banks. The shift in foreign exchange rates, and in particular between the U.S. dollar and the euro contributed € 43 billion to the overall increase of our balance sheet during 2011.
The increase of positive market values from derivatives by € 202 billion was primarily driven by changing U.S. dollar, euro and pound sterling yield curves as well as € 19 billion relating to currency translation effects.
Interest-earning deposits with banks increased by € 70 billion from € 92 billion as at year-end 2010 to € 162 billion as at year-end 2011, primarily to strengthen our liquidity reserve.
Non-derivative trading assets have decreased by € 30 billion during 2011, with debt securities contributing to more than half of the decrease.
Our loan book has slightly increased by € 5 billion during the year, from € 408 billion as at December 31, 2010 to € 413 billion at year-end 2011.

Deutsche Bank 01 – Management Report 28 Financial Report 2011 Operating and Financial Review
Movements in Liabilities Total liabilities were up by € 254 billion to € 2,109 billion as of December 31, 2011.
The increase in total liabilities occurred mainly in negative market values from derivatives, which were up by € 192 billion, mainly driven by changing yield curves and currency translation effects, similar to positive market values from derivatives.
Also, deposits increased significantly by € 68 billion, with 70 % relating to deposits from banks and 30 % to deposits from non-bank customers.
Equity As of December 31, 2011, total equity was € 54.7 billion, an increase of € 4.3 billion or 9 %, compared to € 50.4 billion as of December 31, 2010. The main factors contributing to this development were net income attributable to Deutsche Bank shareholders of € 4.1 billion, actuarial gains of € 666 million and net gains rec-ognized in accumulated other comprehensive income of € 620 million, partly offset by cash dividends paid of € 691 million, an increase in our treasury shares of € 373 million which are deducted from equity and a de-crease in the noncontrolling interests of € 279 million. The aforementioned net gains recognized in accumu-lated other comprehensive income were mainly driven by positive effects from exchange rate changes of € 1.2 billion (especially in the U.S. dollar), partly offset by an increase in unrealized losses on financial assets available for sale of € 504 million.
Regulatory Capital Starting with December 31, 2011, the calculation of the Group’s regulatory capital incorporates the amended capital requirements for trading book and securitization positions following Capital Requirements Directive 3, also known as “Basel 2.5”. Total regulatory capital (Tier 1 and Tier 2 capital) reported under Basel 2.5 was € 55.2 billion at the end of 2011 compared to € 48.7 billion at the end of 2010 reported under Basel 2. Tier 1 capital reported under Basel 2.5 increased to € 49.0 billion at the end of 2011 versus € 42.6 billion at the end of 2010 as reported under Basel 2, reflecting primarily the retained earnings of 2011, the development of for-eign currency rates and reduced capital deduction items. As of December 31, 2011, Core Tier 1 capital re-ported under Basel 2.5 increased to € 36.3 billion from € 30.0 billion at the end of 2010 as reported under Basel 2.
Amendments to IAS 39 and IFRS 7, “Reclassification of Financial Assets” Under the amendments to IAS 39 and IFRS 7 issued in October 2008, certain financial assets were reclassified in the second half of 2008 and the first quarter of 2009 from the financial assets at fair value through profit or loss and the available for sale classifications into the loans classification. The reclassifications were made in instances where management believed that the expected repayment of the assets exceeded their estimated fair values, which reflected the significantly reduced liquidity in the financial markets, and that returns on these assets would be optimized by holding them for the foreseeable future. Where this clear change of intent existed and was supported by an ability to hold and fund the underlying positions, we concluded that the reclassifica-tions aligned the accounting more closely with the business intent.

Deutsche Bank 01 – Management Report 29 Financial Report 2011 Operating and Financial Review
As of December 31, 2011 and December 31, 2010 the carrying value of reclassified assets was € 22.9 billion and € 26.7 billion, respectively, compared with a fair value of € 20.2 billion and € 23.7 billion as of December 31, 2011 and December 31, 2010, respectively. These assets are predominantly held in CB&S.
Please refer to Note 13 “Amendments to IAS 39 and IFRS 7, ‘Reclassification of Financial Assets’” for addi-tional information on the impact of reclassification.
Update on Key Credit Market Exposures The following is an update on the development of certain credit positions (including protection purchased from monoline insurers) of those CB&S businesses on which we have previously provided additional risk disclosures. These positions were those that significantly impacted the performance of CB&S during the recent financial crisis. In addition to these CB&S positions, we have also provided information about positions acquired from Postbank where relevant.
For information on our Commercial Real Estate and Leveraged Finance exposures, please see “Risk Report – Credit Exposure from Lending” and – “Credit Exposure from Nonderivative Trading Assets”.
Mortgage Related Exposure: The following table presents certain mortgage related exposures from the trad-ing businesses described net of hedges and other protection purchased. Hedges consist of a number of differ-ent market instruments, including protection provided by monoline insurers, single name credit default swap contracts with market counterparties and index-based contracts.
Certain mortgage related exposure in our trading businesses Dec 31, 2011 Dec 31, 2010
in € m. Gross exposure
Hedges and other protection purchased Net exposure
Gross exposure
Hedges and other protection purchased Net exposure
U.S. subprime and Alt-A RMBS and CDO
1,2 2,421 2,567 (146) 3,848 3,228 620 European RMBS 162 − 162 169 − 169 1 Included within U.S. RMBS and CDO exposure is CDO subprime trading exposure of € 169 million gross (€ 29 million net of hedges) as at December 31, 2011
and € 420 million gross (€ 345 million net of hedges) as at December 31, 2010. 2 The reserves included within ‘U.S. subprime and Alt-A RMBS and CDO’ factor in a counterparty credit risk valuation adjustment related to U.S. RMBS, which is
intended to better reflect the fair value of the instruments underlying this exposure. This adjustment resulted in a reduction in the net exposure of € 401 million for December 31, 2011 and € 320 million for December 31, 2010.
The net exposure to U.S. RMBS and CDO is composed of € (457) million Alt-A, € 5 million Subprime, € 19 million Other, € 29 million CDO and € 258 million Trading-related net positions as of December 31, 2011 and € (267) million Alt-A, € 10 million Subprime, € 52 million Other, € 345 million CDO and € 480 million Trad-ing-related net positions as of December 31, 2010. In determining subprime, we apply industry standard crite-ria including FICO (credit quality) scores and loan-to-value ratios. In limited circumstances, we also classify exposures as subprime if 50 % or more of the underlying collateral is home equity loans which are subprime. Alt-A loans are loans made to borrowers with generally good credit, but with non-conforming underwriting ratios or other characteristics that fail to meet the standards for prime loans. These include lower FICO scores, higher loan-to-value ratios and higher percentages of loans with limited or no documentation.

Deutsche Bank 01 – Management Report 30 Financial Report 2011 Operating and Financial Review
In the aforementioned table, net exposure represents our potential loss in the event of a 100 % default of se-curities and associated hedges, assuming zero recovery. It is not an indication of net delta adjusted trading risk (the net delta adjusted trading risk measure is used to ensure comparability between different exposures; for each position the delta represents the change of the position in the related security which would have the same sensitivity to a given change in the market).
The aforementioned table excludes assets reclassified from trading or available for sale to loans and receiv-ables in accordance with the amendments to IAS 39 with a carrying value as of December 31, 2011 of € 1.6 billion (which includes European residential mortgage exposure of € 971 million, Other U.S. residential mortgage exposure of € 286 million, CDO subprime exposure – Trading of € 323 million) and as of December 31, 2010 of € 1.8 billion (which includes European residential mortgage exposure of € 1.0 billion, Other U.S. residential mortgage exposure of € 339 million, CDO subprime exposure – Trading of € 402 million).
The table also excludes both agency mortgage-backed securities and agency eligible loans, which we do not consider to be credit sensitive products, and interest-only and inverse interest-only positions which are nega-tively correlated to deteriorating markets due to the effect on the position of the reduced rate of mortgage pre-payments. The slower prepayment rate extends the average life of these interest-only products which in turn leads to a higher value due to the longer expected interest stream.
The various gross components of the overall net exposure shown above represent different vintages, locations, credit ratings and other market-sensitive factors. Therefore, while the overall numbers above provide a view of the absolute levels of our exposure to an extreme market movement, actual future profits and losses will depend on actual market movements, basis movements between different components of our positions, and our ability to adjust hedges in these circumstances.
In addition to these CB&S positions, at December 31, 2011, Postbank had exposure to European commercial mortgage-backed securities of € 101 million as well as residential mortgage-backed securities of € 233 million (thereof € 231 million in Europe). At December 31, 2010, Postbank had exposure to European commercial mort-gage-backed securities of € 192 million as well as residential mortgage-backed securities of € 428 million (which included € 398 million in Europe, € 27 million in U.S.).
Deutsche Bank 01 – Management Report 31 Financial Report 2011 Operating and Financial Review
Furthermore, Postbank has exposure to non-corporate CDOs of € 35 million where the underlying assets in-clude both commercial mortgage-backed securities and residential mortgage-backed securities. These posi-tions are mainly classified as loans and receivables and available for sale. At December 31, 2010, Postbank had exposure to non-corporate CDOs of € 69 million.
Ocala Funding LLC: We own 71.4 % of the commercial paper issued by Ocala Funding LLC (Ocala), a com-mercial paper vehicle sponsored by Taylor Bean & Whitaker Mortgage Corp. (TBW), which ceased mortgage lending operations and filed for bankruptcy protection in August 2009. We classify the commercial paper as a trading asset and measure it at fair value through profit or loss. As of December 31, 2011, the total notional value of the commercial paper issued by Ocala which was held by the Group was € 928 million, with a fair value of € 132 million. Fair value losses of € 56 million and € 360 million were recorded in 2011 and 2010 re-spectively, resulting from ongoing information we have obtained on the TBW estate.
Exposure to Monoline Insurers: The deterioration of the U.S. subprime mortgage and related markets has generated large exposures to financial guarantors, such as monoline insurers, that have insured or guaranteed the value of pools of collateral referenced by CDOs and other market-traded securities. Actual claims against monoline insurers will only become due if actual defaults occur in the underlying assets (or collateral). There is ongoing uncertainty as to whether some monoline insurers will be able to meet all their liabilities to banks and other buyers of protection. Under certain conditions (e.g., liquidation) we can accelerate claims regardless of actual losses on the underlying assets.
The following tables summarize the fair value of our counterparty exposures to monoline insurers with respect to U.S. residential mortgage-related activity and other activities, respectively, in each case on the basis of the fair value of the assets compared with the notional value guaranteed or underwritten by monoline insurers. The other exposures described in the second table arise from a range of client and trading activity, including collat-eralized loan obligations, commercial mortgage-backed securities, trust preferred securities, student loans and public sector or municipal debt. The tables show the associated credit valuation adjustments (“CVA”) that we have recorded against the exposures. For monolines with actively traded CDS, the CVA is calculated using a full CDS-based valuation model. For monolines without actively traded CDS, a model-based approach is used with various input factors, including relevant market driven default probabilities, the likelihood of an event (either a restructuring or an insolvency), an assessment of any potential settlement in the event of a restructur-ing, and recovery rates in the event of either restructuring or insolvency. The monoline CVA methodology is reviewed on a quarterly basis by management; since the second quarter of 2011 market based spreads have been used more extensively in the CVA assessment.

Deutsche Bank 01 – Management Report 32 Financial Report 2011 Operating and Financial Review
The ratings in the tables below are the lowest of Standard & Poor’s, Moody’s or our own internal credit ratings as of December 31, 2011 and December 31, 2010.
Monoline exposure related to U.S. residential mortgages Dec 31, 2011 Dec 31, 2010
in € m. Notional amount
Fair value prior to CVA CVA
Fair value after CVA
Notional amount
Fair value prior to CVA CVA
Fair value after CVA
AA Monolines: Other subprime 124 65 (20) 45 139 60 (6) 54 Alt-A 3,662 1,608 (353) 1,255 4,069 1,539 (308) 1,231
Total AA Monolines 3,786 1,673 (373) 1,300 4,208 1,599 (314) 1,285
Other Monoline exposure Dec 31, 2011 Dec 31, 2010
in € m. Notional amount
Fair value prior to CVA CVA
Fair value after CVA
Notional amount
Fair value prior to CVA CVA
Fair value after CVA
AA Monolines: TPS-CLO 2,721 786 (201) 585 2,988 837 (84) 753 CMBS 1,113 26 (3) 23 1,084 12 (1) 11 Corporate single name/Corporate CDO − − − − 602 (1) − (1) Student loans 303 56 (13) 43 295 19 (2) 17 Other 922 305 (111) 194 925 226 (23) 203
Total AA Monolines 5,059 1,173 (328) 845 5,894 1,093 (110) 983
Non Investment Grade Monolines:
TPS-CLO 547 199 (89) 110 917 215 (49) 166 CMBS 3,539 211 (42) 169 6,024 547 (273) 274 Corporate single name/Corporate CDO 2,062 2 − 2 2,180 12 (6) 6 Student loans 1,325 587 (189) 398 1,308 597 (340) 257 Other 1,076 213 (89) 124 1,807 226 (94) 132
Total Non Investment Grade Monolines 8,549 1,212 (409) 803 12,236 1,597 (762) 835
Total 13,608 2,385 (737) 1,648 18,130 2,690 (872) 1,818

Deutsche Bank 01 – Management Report 33 Financial Report 2011 Operating and Financial Review
The tables exclude counterparty exposure to monoline insurers that relates to wrapped bonds. A wrapped bond is one that is insured or guaranteed by a third party. As of December 31, 2011 and December 31, 2010, the exposure on wrapped bonds related to U.S. residential mortgages was € 52 million and € 67 million, respec-tively, and the exposure on wrapped bonds other than those related to U.S. residential mortgages was € 46 million and € 58 million, respectively. In each case, the exposure represents an estimate of the potential mark-downs of wrapped assets in the event of monoline defaults.
A proportion of the mark-to-market monoline exposure has been mitigated with CDS protection arranged with other market counterparties and other economic hedge activity.
As of December 31, 2011 and December 31, 2010 the total credit valuation adjustment held against monoline insurers was € 1,109 million and € 1,186 million respectively.
Special Purpose Entities We engage in various business activities with certain entities, referred to as special purpose entities (SPEs), which are designed to achieve a specific business purpose. The principal uses of SPEs are to provide clients with access to specific portfolios of assets and risk and to provide market liquidity for clients through securitiz-ing financial assets. SPEs may be established as corporations, trusts or partnerships.
We may or may not consolidate SPEs that we have set up or sponsored or with which we have a contractual relationship. We will consolidate an SPE when we have the power to govern its financial and operating policies, generally accompanying a shareholding, either directly or indirectly, of more than half the voting rights. If the activities of the SPEs are narrowly defined or it is not evident who controls the financial and operating policies of the SPE we will consider other factors to determine whether we have the majority of the risks and rewards. We reassess our treatment of SPEs for consolidation when there is a change in the SPE’s arrangements or the substance of the relationship between us and an SPE changes. For further detail on our accounting policies regarding consolidation and reassessment of consolidation of SPEs please refer to Note 01 “Significant Ac-counting Policies” in our consolidated financial statements.
In limited situations we consolidate some SPEs for both financial reporting and German regulatory purposes. However, in all other cases we hold regulatory capital, as appropriate, against all SPE-related transactions and related exposures, such as derivative transactions and lending-related commitments and guarantees. To date, our exposures to non-consolidated SPEs have not had a material impact on our debt covenants, capital ratios, credit ratings or dividends.
The following sections provide details about the assets (after consolidation eliminations) in our consolidated SPEs and our maximum unfunded exposure remaining to certain non-consolidated SPEs.

Deutsche Bank 01 – Management Report 34 Financial Report 2011 Operating and Financial Review
Total Assets in Consolidated SPEs Dec 31, 2011 Asset type
in € m.
Financial assets at fair value through profit or loss
1
Financial assets available for sale
Loans
Cash and cash equivalents
Other assets
Total assets
Category: Group sponsored ABCP conduits − 39 10,998 1 33 11,071 Group sponsored securitizations 2,044 191 1,169 3 48 3,455 Third party sponsored securitizations − − 493 14 156 663 Repackaging and investment products 5,032 971 207 606 409 7,225 Mutual funds 3,973 − − 1,934 566 6,473 Structured transactions 2,425 43 3,748 22 334 6,572 Operating entities 2,116 3,879 3,228 102 3,439 12,764 Other 114 239 329 84 548 1,314
Total 15,704 5,362 20,172 2,766 5,533 49,537 1 Fair value of derivative positions is € 580 million.
Dec 31, 2010 Asset type
in € m.
Financial assets at fair value through profit or loss
1
Financial assets available for sale
Loans
Cash and cash equivalents
Other assets
Total assets
Category: Group sponsored ABCP conduits − 431 15,304 − 59 15,794 Group sponsored securitizations 3,168 369 1,250 20 23 4,830 Third party sponsored securitizations 189 − 507 2 18 716 Repackaging and investment products 5,278
2 1,053 206 2,160
2 664 9,361
2 Mutual funds 4,135 9 − 465 654 5,263 Structured transactions 2,533 269 5,315 386 381 8,884 Operating entities 1,676 3,522 3,309 514 3,582 12,603 Other 199 300 556 117 304 1,476
Total 17,178 5,953 26,447 3,664 5,685 58,927 1 Fair value of derivative positions is € 158 million. 2 Prior period has been adjusted
Group Sponsored ABCP Conduits We set up, sponsor and administer our own asset-backed commercial paper (ABCP) programs. These pro-grams provide our customers with access to liquidity in the commercial paper market and create investment products for our clients. As an administrative agent for the commercial paper programs, we facilitate the pur-chase of non-Deutsche Bank Group loans, securities and other receivables by the commercial paper conduit (conduit), which then issues to the market high-grade, short-term commercial paper, collateralized by the un-derlying assets, to fund the purchase. The conduits require sufficient collateral, credit enhancements and li-quidity support to maintain an investment grade rating for the commercial paper. We are the liquidity provider to these conduits and therefore exposed to changes in the carrying value of their assets. We consolidate the majority of our sponsored conduit programs because we have the controlling interest.

Deutsche Bank 01 – Management Report 35 Financial Report 2011 Operating and Financial Review
Our liquidity exposure to these conduits is to the entire commercial paper issued of € 11.6 billion and € 16.3 billion as of December 31, 2011 and December 31, 2010, of which we held € 2.5 billion and € 2.2 billion, respectively.
The collateral in the conduits includes a range of asset-backed loans and securities, including aircraft leasing, student loans, trust preferred securities and residential- and commercial-mortgage-backed securities. The collateral in the conduits has decreased due to the repayment and maturity of certain transactions during the period.
Group Sponsored Securitizations We sponsor SPEs for which we originate or purchase assets. These assets are predominantly commercial and residential whole loans or mortgage-backed securities. The SPEs fund these purchases by issuing multiple tranches of securities, the repayment of which is linked to the performance of the assets in the SPE. When we retain a subordinated interest in the assets that have been securitized, an assessment of the relevant factors is performed and, if SPEs are controlled by us, they are consolidated. The fair value of our retained exposure in these securitizations as of December 31, 2011 and December 31, 2010 was € 3.1 billion and € 3.2 billion, respectively. The decrease in the total assets of these SPEs is mainly due to mark to market movements dur-ing the period.
Third Party Sponsored Securitizations In connection with our securities trading and underwriting activities, we acquire securities issued by third party securitization vehicles that purchase diversified pools of commercial and residential whole loans or mortgage-backed securities. The vehicles fund these purchases by issuing multiple tranches of securities, the repayment of which is linked to the performance of the assets in the vehicles. When we hold a subordinated interest in the SPE, an assessment of the relevant factors is performed and if SPEs are controlled by us, they are consolidat-ed. As of December 31, 2011 and December 31, 2010 the fair value of our retained exposure in these securiti-zations was € 0.6 billion and € 0.7 billion, respectively.
Repackaging and Investment Products Repackaging is a similar concept to securitization. The primary difference is that the components of the re-packaging SPE are generally securities and derivatives, rather than non-security financial assets, which are then “repackaged” into a different product to meet specific individual investor needs. We consolidate these SPEs when we have the majority of risks and rewards inherent in the repackaging entity. Risks and rewards inherent in the repackaging entity may include price movements of the underlying asset for equity, credit, inter-est rate and other risks and the potential variability arising from those risks. Our consolidation assessment considers the exposures that both Deutsche Bank and the investor(s) have in relation to the repackaging entity via derivatives and other instruments. The decrease in the total assets is mainly driven by the maturity and termination of certain trades during the period. In addition to the assets of consolidated repackaging vehicles shown in the table the nominal value of the total assets in non-consolidated repackaging vehicles was € 35 billion and € 33 billion as December 31, 2011 and December 31, 2010 respectively. Investment products offer clients the ability to become exposed to specific portfolios of assets and risks through purchasing our structured notes. We hedge this exposure by purchasing interests in SPEs that match the return specified in the notes.
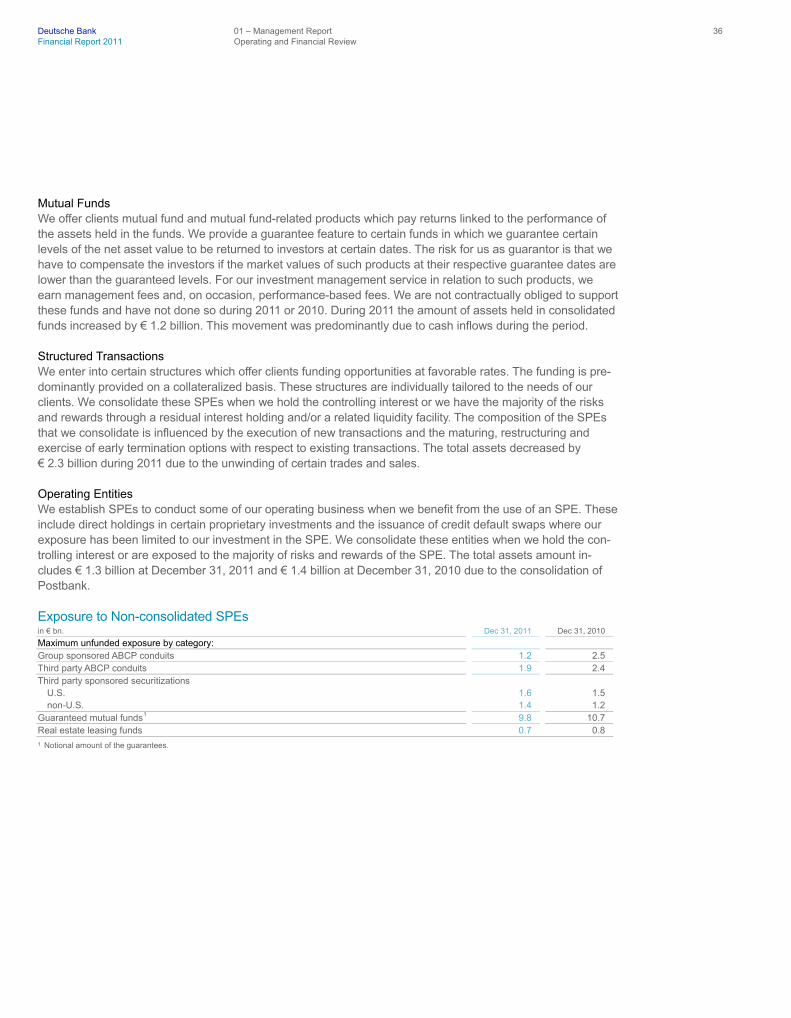
Deutsche Bank 01 – Management Report 36 Financial Report 2011 Operating and Financial Review
Mutual Funds We offer clients mutual fund and mutual fund-related products which pay returns linked to the performance of the assets held in the funds. We provide a guarantee feature to certain funds in which we guarantee certain levels of the net asset value to be returned to investors at certain dates. The risk for us as guarantor is that we have to compensate the investors if the market values of such products at their respective guarantee dates are lower than the guaranteed levels. For our investment management service in relation to such products, we earn management fees and, on occasion, performance-based fees. We are not contractually obliged to support these funds and have not done so during 2011 or 2010. During 2011 the amount of assets held in consolidated funds increased by € 1.2 billion. This movement was predominantly due to cash inflows during the period.
Structured Transactions We enter into certain structures which offer clients funding opportunities at favorable rates. The funding is pre-dominantly provided on a collateralized basis. These structures are individually tailored to the needs of our clients. We consolidate these SPEs when we hold the controlling interest or we have the majority of the risks and rewards through a residual interest holding and/or a related liquidity facility. The composition of the SPEs that we consolidate is influenced by the execution of new transactions and the maturing, restructuring and exercise of early termination options with respect to existing transactions. The total assets decreased by € 2.3 billion during 2011 due to the unwinding of certain trades and sales.
Operating Entities We establish SPEs to conduct some of our operating business when we benefit from the use of an SPE. These include direct holdings in certain proprietary investments and the issuance of credit default swaps where our exposure has been limited to our investment in the SPE. We consolidate these entities when we hold the con-trolling interest or are exposed to the majority of risks and rewards of the SPE. The total assets amount in-cludes € 1.3 billion at December 31, 2011 and € 1.4 billion at December 31, 2010 due to the consolidation of Postbank.
Exposure to Non-consolidated SPEs in € bn. Dec 31, 2011 Dec 31, 2010
Maximum unfunded exposure by category: Group sponsored ABCP conduits 1.2 2.5 Third party ABCP conduits 1.9 2.4 Third party sponsored securitizations
U.S. 1.6 1.5 non-U.S. 1.4 1.2
Guaranteed mutual funds
1 9.8 10.7 Real estate leasing funds 0.7 0.8 1 Notional amount of the guarantees.
Deutsche Bank 01 – Management Report 37 Financial Report 2011 Operating and Financial Review
Group Sponsored ABCP Conduits We sponsor and administer four ABCP conduits, established in Australia, which are not consolidated because we do not hold the majority of risks and rewards. These conduits provide our clients with access to liquidity in the commercial paper market in Australia. As of December 31, 2011 and December 31, 2010 they had assets totaling € 1.0 billion and € 1.9 billion respectively, consisting of securities backed by non-U.S. residential mort-gages issued by warehouse SPEs set up by the clients to facilitate the purchase of the assets by the conduits. The minimum credit rating for these securities is AA-. The credit enhancement necessary to achieve the required credit ratings is ordinarily provided by mortgage insurance extended by third-party insurers to the SPEs.
The weighted average life of the assets held in the conduits is five years. The average life of the commercial paper issued by these off-balance sheet conduits is one to three months.
Our exposure to these entities is limited to the committed liquidity facilities totaling € 1.2 billion as of December 31, 2011 and € 2.5 billion as of December 31, 2010. None of these facilities have been drawn. The decrease in the liquidity facilities has been due to the maturity and reduction of certain facilities during the period. Advances against the liquidity facilities are collateralized by the underlying assets held in the conduits, and thus a drawn facility will be exposed to volatility in the value of the underlying assets. Should the assets decline sufficiently in value, there may not be sufficient funds to repay the advance. As at December 31, 2011 we did not hold material amounts of commercial paper or notes issued by these conduits.
Third Party ABCP Conduits In addition to sponsoring our commercial paper programs, we also assist third parties with the formation and ongoing risk management of their commercial paper programs. We do not consolidate any third party ABCP conduits as we do not control them.
Our assistance to third party conduits is primarily financing-related in the form of unfunded committed liquidity facilities and unfunded committed repurchase agreements in the event of disruption in the commercial paper market. The liquidity facilities and committed repurchase agreements are recorded off-balance sheet unless a contingent payment is deemed probable and estimable, in which case a liability is recorded. At December 31, 2011 and 2010, the notional amount of undrawn facilities provided by us was € 1.9 billion and € 2.4 billion, respectively. The decrease during the period is due to the drawdown of certain facilities. These facilities are collateralized by the assets in the SPEs and therefore the movement in the fair value of these assets will affect the recoverability of the amount drawn.

Deutsche Bank 01 – Management Report 38 Financial Report 2011 Operating and Financial Review
Third Party Sponsored Securitizations The third party securitization vehicles to which we, and in some instances other parties, provide financing are third party-managed investment vehicles that purchase diversified pools of assets, including fixed income se-curities, corporate loans, asset-backed securities (predominantly commercial mortgage-backed securities, residential mortgage-backed securities and credit card receivables) and film rights receivables. The vehicles fund these purchases by issuing multiple tranches of debt and equity securities, the repayment of which is linked to the performance of the assets in the vehicles.
The notional amount of liquidity facilities with an undrawn component provided by us as of December 31, 2011 and December 31, 2010 was € 8.2 billion and € 7.0 billion, respectively, of which € 5.2 billion and € 4.3 billion had been drawn and € 3.0 billion and € 2.7 billion were still available to be drawn as detailed in the table. The increase in the total notional during the period was largely due to the issuance of new facilities. All facilities are available to be drawn if the assets meet certain eligibility criteria and performance triggers are not reached. These facilities are collateralized by the assets in the SPEs and therefore the movement in the fair value of these assets affects the recoverability of the amount drawn.
Mutual Funds We provide guarantees to funds whereby we guarantee certain levels of the net asset value to be returned to investors at certain dates. These guarantees do not result in us consolidating the funds; they are recorded on-balance sheet as derivatives at fair value with changes in fair value recorded in the consolidated statement of income. The fair value of the guarantees was immaterial at December 31, 2011 and December 31, 2010. As of December 31, 2011, these non-consolidated funds had € 10.6 billion assets under management and pro-vided guarantees of € 9.8 billion. As of December 31, 2010, assets of € 12.0 billion and guarantees of € 10.7 billion were reported. The decrease in assets under management was primarily due to cash out flows from funds during the period.
Real Estate Leasing Funds We provide guarantees to SPEs that hold real estate assets (commercial and residential land and buildings and infrastructure assets located in Germany) that are financed by third parties and leased to our clients. These guarantees are only drawn upon in the event that the asset is destroyed and the insurance company does not pay for the loss. If the guarantee is drawn we hold a claim against the insurance company. We also write put options to closed-end real estate funds set up by us, which purchase commercial or infrastructure assets located in Germany and which are then leased to third parties. The put option allows the shareholders to sell the asset to us at a fixed price at the end of the lease. As at December 31, 2011 and December 31, 2010 the notional amount of the guarantees was € 501 million and € 514 million respectively, and the notional of the put options was € 239 million and € 246 million respectively. The guarantees and the put options have an immaterial fair value. We do not consolidate these SPEs as we do not hold the majority of their risks and re-wards.

Deutsche Bank 01 – Management Report 39 Financial Report 2011 Operating and Financial Review
Liquidity and Capital Resources
For a detailed discussion of our liquidity risk management, see our Risk Report and Note 37 “Regulatory Capi-tal” to our consolidated financial statements.
Long-term Credit Ratings We believe that maintaining a strong credit quality is a fundamental value driver for our clients, bondholders and shareholders. 2011 was a year of many dislocations in the capital markets. In this context, many banks worldwide have been downgraded by the rating agencies. Deutsche Bank was also impacted by this trend.
On December 15, 2011, Fitch Ratings downgraded the long-term credit rating of Deutsche Bank from AA- to A+. The rating action occurred in context of an industry-wide downgrading action reflecting Fitch’s expectation that the difficult and uncertain environment will put global trading and universal bank’s earnings under pressure.
On November 29, 2011, Standard & Poor’s – after applying their new bank rating methodology on 37 top global banks – affirmed Deutsche Bank’s A+ long-term credit rating. However, the respective rating outlook was moved from stable to negative as Deutsche Bank’s Risk Adjusted Capital (RAC) ratio, as calculated by Stan-dard & Poor’s, was below the required level of 7 %, a level which the rating agency considers as “adequate”. Standard & Poor’s expects that Deutsche Bank will be able to increase its RAC ratio to levels above 7 % within the next 18 months. Once achieved, the negative outlook could be removed.
Dec 31, 2011 Dec 31, 2010 Dec 31, 2009
Moody’s Investors Service, New York
1 Aa3 Aa3 Aa1 Standard & Poor’s, New York
2 A+ A+ A+ Fitch Ratings, New York
3 A+ AA- AA- 1 Moody’s defines the Aa rating as denoting bonds that are judged to be high quality by all standards. Moody’s rates Aa bonds lower than the best bonds (which it
rates Aaa) because margins of protection may not be as large as in Aaa securities or fluctuation of protective elements may be of greater amplitude or there may be other elements present which make the long-term risk appear somewhat greater than Aaa securities. The numerical modifier 3 indicates that Moody’s ranks the obligation in the lower end of the Aa category.
2 Standard and Poor’s defines its A rating as somewhat more susceptible to the adverse effects of changes in circumstances and economic conditions than obligations in higher-rated categories. However, the obligor’s capacity to meet its financial commitment on the obligation is still strong. The plus indicates a ranking in the higher end of the A category.
3 Fitch Ratings defines it’s A rating as high credit quality. Fitch Ratings uses the A rating to denote expectations of low default risk. According to Fitch Ratings, A ratings indicate a strong capacity for payment of financial commitments. This capacity may, nevertheless, be more vulnerable to adverse business or economic conditions than higher ratings. The plus indicates a ranking in the higher end of the A category.
Each rating reflects the view of the rating agency only at the time it gave us the rating, and you should evaluate each rating separately and look to the rating agencies for any explanations of the significance of their ratings. The rating agencies can change their ratings at any time if they believe that circumstances so warrant. You should not view these long-term credit ratings as recommendations to buy, hold or sell our securities.

Deutsche Bank 01 – Management Report 40 Financial Report 2011 Operating and Financial Review
Tabular Disclosure of Contractual Obligations The table below shows the cash payment requirements from contractual obligations outstanding as of Decem-ber 31, 2011.
Contractual obligations Payment due by period
in € m. Total Less than 1 year 1–3 years 3–5 years
More than 5 years
Long-term debt obligations
1 189,326 34,845 46,389 35,521 72,571 Trust preferred securities
1 15,664 3,330 2,769 3,197 6,368 Long-term financial liabilities designated at fair value through profit or loss
2 15,690 4,933 4,084 2,188 4,485 Finance lease obligations 53 10 35 4 4 Operating lease obligations 5,709 891 1,491 1,081 2,246 Purchase obligations 2,929 759 1,471 646 53 Long-term deposits
1 37,728 − 14,716 7,014 15,998 Other long-term liabilities 8,717 196 1,089 2,327 5,105
Total 275,816 44,964 72,044 51,978 106,830 1 Includes interest payments. 2 Mainly long-term debt and long-term deposits designated at fair value through profit or loss.
Figures above do not include the revenues of noncancelable sublease rentals of € 204 million on operating leases. Purchase obligations for goods and services include future payments for, among other things, facility management, information technology and security settlement services. Some figures above for purchase obli-gations represent minimum contractual payments and actual future payments may be higher. Long-term de-posits exclude contracts with a remaining maturity of less than one year. Under certain conditions future payments for some long-term financial liabilities designated at fair value through profit or loss may occur earlier. See the following notes to the consolidated financial statements for further information: Note 06 “Net Interest Income and Net Gains (Losses) on Financial Assets/Liabilities at Fair Value through Profit or Loss”, Note 23 “Leases”, Note 27 “Deposits” and Note 31 “Long-Term Debt and Trust Preferred Securities”.

Deutsche Bank 01 – Management Report 41 Financial Report 2011 Operating and Financial Review
Events after the Reporting Date
On February 27, 2012, we have exchanged the Mandatory Exchangeable Bond (MEB) in 60 million Postbank shares (27.4 %) and on February 28, 2012, Deutsche Post AG has exercised its option to put 26.4 million shares (12.1 %). As a result, we own an additional 86.4 million Postbank shares (39.5 %), leading to a total Postbank holding of 204.9 million shares (93.7 %). The settlement of MEB and put option has no impact on Deutsche Bank’s regulatory capital and liquidity position. See Note 04 “Acquisitions and Dispositions” for fur-ther details.
On February 28, 2012, we announced that we are in exclusive negotiations with Guggenheim Partners on the sale of our Asset Management businesses that are subject to a previously-announced strategic review. The businesses include DWS Americas, the Americas mutual fund business; DB Advisors, the global institutional asset management business; Deutsche Insurance Asset Management, the global insurance asset manage-ment business; and RREEF, the global alternative asset management business. These negotiations are not yet finalized and we cannot reliably assess the financial effects of a potential sale.

Deutsche Bank 01 – Management Report 42 Financial Report 2011 Risk Report
Included in the following section on quantitative and qualitative disclosures about credit, market and other risks is information which forms part of the financial statements of Deutsche Bank and which is incorporated by reference into the financial statements of this report. Such information is marked by a bracket in the margins throughout this section.
The sections on qualitative and quantitative risk disclosures provide a comprehensive view on the risk profile of Deutsche Bank Group. The quantitative information generally reflects Deutsche Bank Group including Post-bank for the reporting dates December 31, 2011 and December 31, 2010, or for the respective reporting peri-ods starting December 3, 2010. In the limited instances where a consolidated view has not been presented, a separate Postbank risk disclosure or applicable qualitative commentary is provided where appropriate.
Postbank conducts its own risk management activities under its own statutory responsibilities. Deutsche Bank Group provides advisory services to Postbank with regard to specific risk management areas. Substantial progress was made during 2011 to align risk assessment, measurement and control procedures between Postbank and Deutsche Bank Group.
Risk Management Executive Summary
The overall focus of Risk and Capital Management in 2011 was on maintaining our risk profile in line with our risk strategy, strengthening our capital base and supporting the Group’s strategic initiatives under phase 4 of our management agenda. This approach is reflected across the different risk metrics summarized below.
Credit Risk — Adherence to our core credit principles of proactive and prudent risk management in 2011 has enabled the
bank to manage a volatile macro-economic credit environment and contain the level of loan losses, which includes a full year charge for Postbank in 2011. This has been achieved by application of our existing risk management philosophy of underwriting standards, active concentration risk management and risk miti-gation strategies including collateral, hedging, netting and credit support arrangements.
— Our provision for credit losses in 2011 was € 1.8 billion versus € 1.3 billion in 2010. The increase was mainly attributable to the full year consolidation of Postbank, which contributed € 0.8 billion for the year. This excludes € 0.4 billion releases from Postbank related loan loss allowances recorded prior to consoli-dation. Excluding Postbank, provisions were down € 139 million primarily reflecting improved performance in the Private & Business Clients Advisory Banking Germany and International. Taking into consideration full 2010 Postbank provisions (given official year-end figures only account for one month for Postbank), the overall combined provisioning level in 2011 would be lower in comparison to 2010.
— The loan portfolio grew by 1 % or € 6 billion mainly due to shifts in foreign exchange rates, while adhering to strict risk-return requirements. Increase was mainly attributed to lower risk buckets while reducing me-dium and high-risk portfolios.
Risk Report
Deutsche Bank 01 – Management Report 43 Financial Report 2011 Risk Report
— The portion of our corporate credit portfolio book carrying an investment-grade rating declined from 73 % at December 31, 2010 to 72 % at December 31, 2011, remaining stable despite challenging macro-economic environment.
— Even though our gross credit exposure increased during 2011, our credit risk profile as measured by the economic capital usage for credit risk totaled € 12.8 billion at year-end 2011 and remained principally un-changed compared to € 12.8 billion at year-end 2010. The € 27 million increase, principally reflects an off-setting effect of exposure reduction and model recalibrations resulting from the ongoing integration of Postbank as well as further de-risking activities and regular parameter reviews especially in light of the cur-rent market environment.
Market Risk — Nontrading market risk economic capital usage totaled € 7.3 billion as of December 31, 2011, which is
€ 0.5 billion, or 8 % above our economic capital usage at year-end 2010. — The economic capital usage for trading market risk totaled € 4.7 billion at year-end 2011 compared with
€ 6.4 billion at year-end 2010. The decrease was driven by broad risk reduction as well as defensive posi-tioning across all asset classes.
— The average value-at-risk of our Corporate & Investment Bank Group Division was € 71.8 million in 2011, compared to € 95.6 million per 2010. The decrease in average value-at-risk in 2011 was driven primarily by broad risk reduction.
Operational Risk — The economic capital usage for operational risk increased by € 1.2 billion, or 32 %, to € 4.8 billion as of
December 31, 2011. The increase is primarily due to the implementation of a new safety margin applied in our AMA model, intended to cover unforeseen legal risks from the current financial crisis.
Liquidity Risk — Liquidity Reserves (excluding Postbank) increased year-on-year by € 69 billion to € 219 billion as of
December 31, 2011. — 2011 issuance activities (excluding Postbank) amounted to € 22.5 billion as compared to a planned vol-
ume of € 19 billion. — 59 % of the bank’s overall funding came from the most stable funding sources including long-term issu-
ance, retail and transaction banking deposits.
Capital Management — The Core Tier 1 capital ratio, which excludes hybrid instruments, was 9.5 % at the end of 2011 (subse-
quent to introduction of Basel 2.5 framework), above the European Banking Authority (EBA) threshold of 9 % required by June 30, 2012, and was 8.7 % at year-end 2010. The later was calculated under Basel 2 regulation and the comparative Core Tier 1 capital ratio for year-end 2011 would have been 10.8 %.
— The internal capital adequacy ratio, signifying whether the total capital supply is sufficient to cover the capital demand determined by our risk positions, increased to 159 % as of December 31, 2011, compared to 147 % as of December 31, 2010.

Deutsche Bank 01 – Management Report 44 Financial Report 2011 Risk Report
— Risk-weighted assets increased by € 35 billion to € 381 billion at the end of 2011, mainly driven by an increase of € 54 billion due to the introduction of Basel 2.5, and a € 13 billion increase in risk weighted as-sets from operational risk. These increases were partially offset by reductions in credit and market risk-weighted assets, principally as a result of our de-risking efforts.
Balance Sheet Management — As of December 31, 2011, our leverage ratio according to our target definition was 21, decreased from 23
at the end of 2010, and below our target leverage ratio of 25.
Risk Management Principles
We actively take risks in connection with our business and as such the following principles underpin risk man-agement within our group: — Risk is taken within a defined risk appetite. — Every risk taken needs to be approved within the risk management framework. — Risk taken needs to be adequately compensated. — Risk should be continuously monitored and — A strong risk management culture helps reinforcing Deutsche Bank’s resilience.
We expect our employees to behave in a manner that maintains a strong risk culture by taking a holistic approach to managing risk and return and by effectively managing the Bank’s risk, capital and reputational profile. The consideration of risk is consequently inherent in our compensation philosophy and is monitored on an ongoing basis, as detailed in our “Remuneration Report”.
Risk Management Framework The wide variety of our businesses requires us to identify, measure, aggregate and manage our risks effectively, and to allocate our capital among our businesses appropriately. We operate as an integrated group through our divisions, business units and infrastructure functions. Risk and capital are managed via a framework of princi-ples, organizational structures and measurement and monitoring processes that are closely aligned with the activities of the divisions and business units:
— Our Management Board provides overall risk & capital management supervision for the consolidated Group.
— We operate a three-line of defence risk management model whereby business management, risk manage-ment oversight and assurance roles are played by functions independent of one another.
— Risk strategy and risk appetite are defined based on the Group's strategic plans in order to align risk, capital, and performance targets.
— Reviews will be conducted across the Group to verify that sound risk management practices and a holistic awareness of risk exists across the organisation and to help each business manage the balance between their risk appetite and reward.
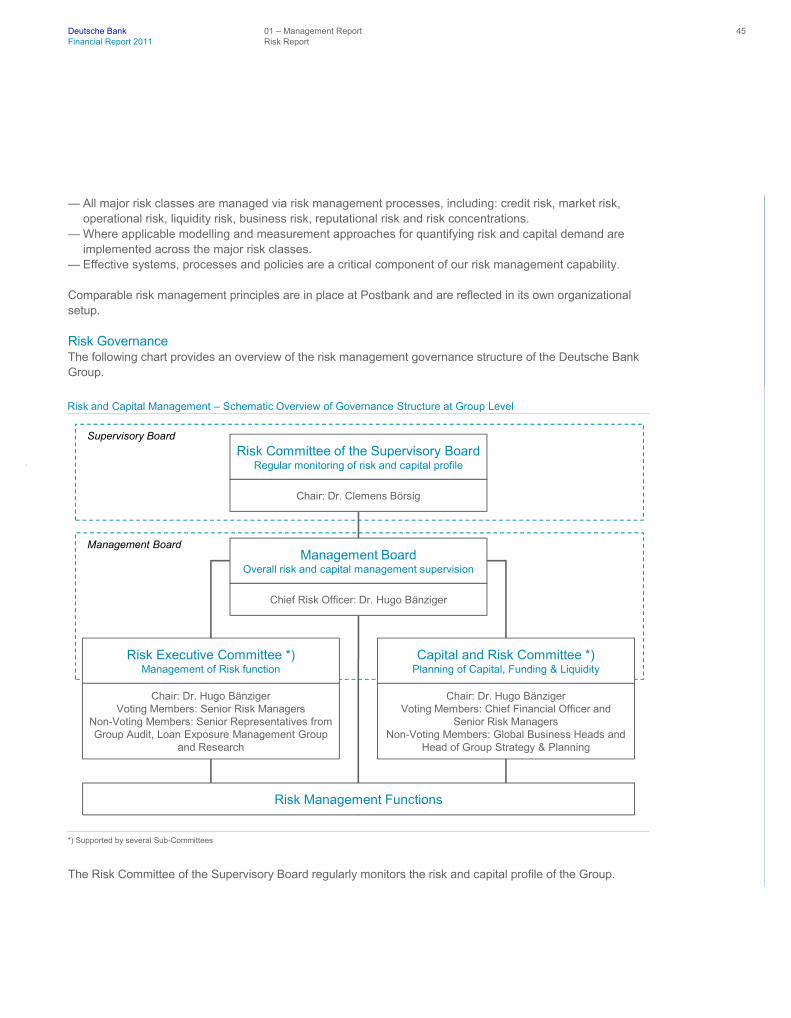
Deutsche Bank 01 – Management Report 45 Financial Report 2011 Risk Report
— All major risk classes are managed via risk management processes, including: credit risk, market risk, operational risk, liquidity risk, business risk, reputational risk and risk concentrations.
— Where applicable modelling and measurement approaches for quantifying risk and capital demand are implemented across the major risk classes.
— Effective systems, processes and policies are a critical component of our risk management capability.
Comparable risk management principles are in place at Postbank and are reflected in its own organizational setup.
Risk Governance The following chart provides an overview of the risk management governance structure of the Deutsche Bank Group.
The Risk Committee of the Supervisory Board regularly monitors the risk and capital profile of the Group.
Risk Committee of the Supervisory BoardRegular monitoring of risk and capital profile
Chair: Dr. Clemens Börsig
Risk Executive Committee *)Management of Risk function
Capital and Risk Committee *)Planning of Capital, Funding & Liquidity
Management BoardOverall risk and capital management supervision
Chief Risk Officer: Dr. Hugo Bänziger
Chair: Dr. Hugo BänzigerVoting Members: Chief Financial Officer and
Senior Risk ManagersNon-Voting Members: Global Business Heads and
Head of Group Strategy & Planning
Risk Management Functions
Risk and Capital Management – Schematic Overview of Governance Structure at Group Level
*) Supported by several Sub-Committees
Supervisory Board
Management Board
Chair: Dr. Hugo BänzigerVoting Members: Senior Risk Managers
Non-Voting Members: Senior Representatives from Group Audit, Loan Exposure Management Group
and Research

Deutsche Bank 01 – Management Report 46 Financial Report 2011 Risk Report
The Management Board is responsible for independently managing the company with the objective of creating sustainable value in the interest of its shareholders, employees and other stakeholders. The Board has exclu-sive responsibility for the day-to-day management of Deutsche Bank Group. It is responsible for defining and implementing comprehensive and aligned business and risk strategies for the Group, as well as establishing well-defined risk management functions and guidelines. The Management Board has delegated certain func-tions and responsibilities to relevant governance committees, in particular the Risk Executive Committee (Risk ExCo) and Capital and Risk Committee (CaR) chaired by our Chief Risk Officer.
Our Chief Risk Officer (CRO), who is a member of the Management Board, and is responsible for the identifi-cation, assessment, management and reporting of risks arising within operations across all businesses and risk types. The below functional committees are central to the Risk function.
— The Capital and Risk Committee oversees and controls integrated planning and monitoring of our risk profile and capital capacity, ensuring an alignment of risk appetite, capitalisation requirements and funding needs with the Group, divisional and sub-divisional business strategies.
— Our Risk Executive Committee identifies controls and manages all risks including risk concentrations at the Group. To fulfill this mandate, the Risk Executive Committee is supported by sub-committees that are responsible for dedicated areas of risk management, including several policy committees and the Group Reputational Risk Committee.
— The Cross Risk Review Committee supports the Risk Executive Committee and the Capital and Risk Committee with particular emphasis on the management of Group wide risk patterns. The Cross Risk Re-view Committee, under a delegation of authority from the Capital and Risk Committee has responsibility for the day-to-day oversight and control of Deutsche Bank Group’s Internal Capital Adequacy Assessment Process (“ICAAP”) ensuring compliance with respective regulatory requirements and policy setting for local ICAAPs.
Multiple members of the Capital and Risk Committee are also members of the Group Investment Committee, ensuring a close link between both committees as proposals for strategic investments are analyzed by the Group Investment Committee. Depending on the size of the strategic investment it may require approval from the Group Investment Committee, the Management Board or even the Supervisory Board. The development of the strategic investments is monitored by the Group Investment Committee on a regular basis.
Dedicated Risk units are established with the mandate to:
— Ensure that the business conducted within each division is consistent with the risk appetite that the Capital and Risk Committee has set within a framework established by the Management Board;
— Formulate and implement risk and capital management policies, procedures and methodologies that are appropriate to the businesses within each division;
— Approve credit, market and liquidity risk limits; — Conduct periodic portfolio reviews to ensure that the portfolio of risks is within acceptable parameters; and — Develop and implement risk and capital management infrastructures and systems that are appropriate for
each division.
The heads of our Risk units, who are members of our Risk Executive Committee, are responsible for the per-formance of the risk management units and report directly to our Chief Risk Officer.

Deutsche Bank 01 – Management Report 47 Financial Report 2011 Risk Report
An Enterprise-wide Risk Management (“ERM”) unit plays a role in monitoring the portfolio of risk against the appetite articulated in the Group's capital plan and manages cross-risk initiatives in the Group. The objectives of the ERM unit are to:
— Develop a comprehensive view of the risks across the businesses in the bank and to focus on cross-risk concentrations and risk-reward “hotspots”;
— Provide a strategic and forward-looking perspective on the key risk issues for discussion at senior levels within the bank (risk appetite, stress testing framework);
— Strengthen risk culture in the bank; and — Foster the implementation of consistent risk management standards across our local entities.
Our Finance and Audit departments operate independently of both the group divisions and of the Risk function. The role of the Finance department is to help quantify and verify the risk that we assume and ensure the quali-ty and integrity of our risk-related data. Our Audit department performs risk-oriented reviews of the design and operating effectiveness of our system of internal controls.
A joint Deutsche Bank and Postbank forum was established in 2011 to align both entities on critical risk-return decision, to exchange risk and portfolio related expertise and to address regulatory topics. This regular forum, in particular facilitates alignment on risk management and control process on a Group level. In addition Post-bank’s Group wide risk management organization independently measures and evaluates all key risks and their drivers. Postbank’s Chief Risk Officer role has been established at its Management Board level since March 1, 2011.
The key risk management committees of Postbank, in all of which Postbank’s Chief Risk Officer is a voting member, are:
— The Bank Risk Committee, which advises Postbank’s Management Board with respect to the determina-tion of overall risk appetite and risk allocation.
— The Credit Risk Committee, which is responsible for limit allocation and the definition of an appropriate limit framework.
— The Market Risk Committee, which decides on limit allocations as well as strategic positioning of Post-bank’s banking book and the management of liquidity risk.
— The Operational Risk Committee which defines the appropriate risk framework as well as the capital allo-cation for the individual business areas.
Risk Reporting and Measurement Systems The Group has centralized risk data and systems supporting regulatory reporting and external disclosures, as well as internal management reporting for credit, market, operational and liquidity risk. The risk infrastructure incorporates the relevant legal entities and business divisions and provides the basis for tailor-made reporting on risk positions, capital adequacy and limit utilization to the relevant functions on a regular and ad-hoc basis. Established units within Finance and Risk assume responsibility for measurement, analysis and reporting of risk while ensuring sufficient quality and integrity of risk-related data.
Deutsche Bank 01 – Management Report 48 Financial Report 2011 Risk Report
The main reports on risk and capital management that are used to provide the central governance bodies with information relating to Group risk exposures are the following:
— Our Risk & Capital Profile which is presented monthly to the CaR and the Management Board by the CRO. It comprises an overview of the current risk, capital and liquidity situation of the Group incorporating infor-mation on regulatory capital and economic capital adequacy.
— An overview of our capital, liquidity and funding is presented to the CaR by the Group Treasurer every month. It comprises information on key developments and metrics across the aforementioned topics.
— Group-wide macro stress tests are performed quarterly and reported to the CaR. These are supplemented, as required, by ad-hoc stress tests at the Group level.
The above reports are complemented by several other standard and ad-hoc management reports of Risk and Finance, which are presented to several different senior committees responsible for risk and capital manage-ment at Group level.
Postbank continues to have an own reporting framework that substantially follows the same principles as out-lined above.
Risk Strategy and Appetite
Our risk strategy statement is expressed as follows:
— balanced performance across business units; — positive development of earnings quality; — compliance with regulatory capital requirements; — capital adequacy; and — stable funding and strategic liquidity allowing for business planning within the liquidity risk tolerance and
regulatory requirements.
We define our risk strategy and risk appetite on the basis of the strategic plans to ensure alignment of risk, capital and performance targets. We conduct an annual strategic planning process which considers our future strategic direction, decisions on key initiatives and the allocation of resources to the businesses. Our plan comprises profit and loss, capital supply and capital demand, other resources, such as headcount, and business-specific key performance indi-cators. This process is performed at the business division and business unit level covering the next three years, projected onto a five-year period for purposes of the goodwill impairment test. In addition, the first year is de-tailed on a month by month basis (operative plan). Group Strategy & Planning and Finance coordinate the strategic planning process and present the resulting strategic plan to the Group Executive Committee and Management Board for discussion and final approval. The final plan is also presented to the Supervisory Board at the beginning of each year.

Deutsche Bank 01 – Management Report 49 Financial Report 2011 Risk Report
Our strategic plans include the Risk & Capital Plan and risk appetite, which allows the Group to: — set capital adequacy goals with respect to risk, considering our strategic focus and business plans; — assess our risk-bearing capacity with regard to internal and external requirements (i.e. regulatory and
economic capital); and — apply stress testing to assess the impact on the capital demand, capital base and liquidity position.
Risk appetite is an expression of the maximum level of risk that we are prepared to accept in order to deliver our business objectives. The Group’s risk appetite statement defines the Group-level risk tolerance that is translated into financial targets for business divisions and risk limits, targets or measures for major risk catego-ries throughout the Group. The setting of the risk appetite thus ensures that risk is proactively managed to the level desired by the Management Board and shareholders and is congruent with our overall risk appetite statement. The Management Board reviews and approves the risk appetite on an annual basis to ensure that it is consistent with the Group strategy, business environment and stakeholder requirements. Risk appetite toler-ance levels are set at different trigger levels, with clearly defined escalation and action schemes. In cases where the tolerance levels are breached, it is the responsibility of the Enterprise-wide Risk Management unit to bring it to the attention of respective risk committees, and ultimately the Chief Risk Officer.
Amendments to the risk and capital strategy must be approved by the Chief Risk Officer or the full Manage-ment Board, depending on significance.
At Postbank, similar fundamental principles are in place. Postbank’s Management Board is responsible for Postbank’s risk profile and risk strategy, and regularly reporting thereon to the Supervisory Board of Postbank. During 2011, Postbank’s capital demand, capital planning procedures and risk strategy processes have been aligned with those of Deutsche Bank.
Risk Inventory
As part of our business activities, we face a variety of risks, the most significant of which are described further in dedicated sections below. These risks can be categorized in a variety of ways. From a regulatory perspec-tive, we hold regulatory capital against three types of risk: credit risk, market risk and operational risk. As part of our internal capital adequacy assessment process we calculate the amount of economic capital that is neces-sary to cover the risks generated from our business activities, outside of liquidity risk.
Credit Risk Credit risk arises from all transactions where actual, contingent or potential claims against any counterparty, borrower or obligor (which we refer to collectively as “counterparties”) exist, including those claims that we plan to distribute (see below in the more detailed section Credit Risk). These transactions are typically part of our traditional non-traded lending activities (such as loans and contingent liabilities), or our direct trading activity with clients (such as OTC derivatives, FX forwards and Forward Rate Agreements).

Deutsche Bank 01 – Management Report 50 Financial Report 2011 Risk Report
We distinguish between three kinds of credit risk:
— Default risk is the risk that counterparties fail to meet contractual payment obligations. — Country risk is the risk that we may suffer a loss, in any given country, due to any of the following reasons:
a possible deterioration of economic conditions, political and social upheaval, nationalization and expro-priation of assets, government repudiation of indebtedness, exchange controls and disruptive currency de-preciation or devaluation. Country risk includes transfer risk which arises when debtors are unable to meet their obligations owing to an inability to transfer assets to non-residents due to direct sovereign interven-tion.
— Settlement risk is the risk that the settlement or clearance of transactions will fail. It arises whenever the exchange of cash, securities and/or other assets is not simultaneous.
Market Risk Market risk is defined as the potential for change in the market value of our trading and investing positions. Risk can arise from adverse changes in interest rates, credit spreads, foreign exchange rates, equity prices, commodity prices and other relevant parameters, such as market volatility and market implied default probabili-ties. We differentiate between three substantially different types of market risk:
— Trading market risk arises primarily through the market-making activities of the Corporate & Investment Bank Group Division. This involves taking positions in debt, equity, foreign exchange, other securities and commodities as well as in equivalent derivatives.
— Traded default risk arising from defaults and rating migrations. — Nontrading market risk arises in various forms. Equity risk arises primarily from non-consolidated strategic
investments, alternative asset investments and equity compensation. Interest rate risk stems from our non-trading asset and liability positions. Structural foreign exchange risk exposure arises from capital and re-tained earnings in non euro currencies in certain subsidiaries, and represents the bulk of foreign exchange risk in our nontrading portfolio. Other nontrading market risk elements are risks arising from asset man-agement and fund related activities as well as model risks in Private Business Clients (“PBC”), Global Transaction Banking (“GTB”) and Private Wealth Management (“PWM”), which are derived by stressing assumptions of client behavior in combination with interest rate movements. In Deutsche Bank, excluding Postbank, these risks are part of nontrading market risk.
Operational Risk Operational risk is the potential for failure (including from legal risk) in relation to employees, contractual speci-fications and documentation, technology, infrastructure failure and disasters, external influences and customer relationships. Operational risk excludes business and reputational risk.
Liquidity Risk Liquidity risk is the risk arising from our potential inability to meet all payment obligations when they come due or only being able to meet these obligations at excessive costs.

Deutsche Bank 01 – Management Report 51 Financial Report 2011 Risk Report
Business Risk Business risk describes the risk we assume due to potential changes in general business conditions, such as our market environment, client behavior and technological progress. This can affect our results if we fail to adjust quickly to these changing conditions.
In addition to the above risks, we face a number of other types of risks, such as reputational risk, insurance-specific risk and concentration risk. They are substantially related to one or more of the above risk types.
Reputational Risk Within our risk management processes, we define reputational risk as the risk that publicity concerning a transaction, counterparty or business practice involving a client will negatively impact the public’s trust in our organization.
Several policies and guidelines form the framework of our reputational risk management. The primary respon-sibility for the identification, escalation and resolution of reputational risk issues resides with the business divi-sions. The risk management units assist and advise the business divisions in ascertaining that reputational risk issues are appropriately identified, escalated and addressed.
The most senior dedicated body for reputational risk issues is our Group Reputational Risk Committee (“GRRC”). It is a permanent sub-committee of the Risk Executive Committee and is chaired by the Chief Risk Officer. The GRRC reviews and makes final determinations on all reputational risk issues, where escalation of such issues is deemed necessary by senior business and regional management, or required under other Group policies and procedures.
Insurance Specific Risk Our exposure to insurance risk relates to Abbey Life Assurance Company Limited and the defined benefit pension obligations of Deutsche Bank Group. In our risk management framework, we consider insurance-related risks primarily as non-traded market risks. We monitor the underlying assumptions in the calculation of these risks regularly and seek risk mitigating measures such as reinsurances, if we deem this appropriate. We are primarily exposed to the following insurance-related risks.
— Longevity risk. The risk of faster or slower than expected improvements in life expectancy on immediate and deferred annuity products.
— Mortality and morbidity risks. The risks of a higher or lower than expected number of death or disability claims on assurance products and of an occurrence of one or more large claims.
— Expenses risk. The risk that policies cost more or less to administer than expected. — Persistency risk. The risk of a higher or lower than expected percentage of lapsed policies.

Deutsche Bank 01 – Management Report 52 Financial Report 2011 Risk Report
To the extent that actual experience is less favorable than the underlying assumptions, or it is necessary to increase provisions due to more onerous assumptions, the amount of capital required in the insurance entities may increase.
Risk Concentration Risk Concentrations are not an isolated risk type but are integrated in the management of the individual risk types and at a cross risk level through Enterprise-wide Risk Management. Risk concentrations refer to a bank’s loss potential through unbalanced distribution of dependencies on specific risk drivers. Risk concentrations are encountered within and across counterparties, businesses, regions/countries, legal entities, industries and products, impacting the aforementioned risks.
We have established a comprehensive approach to managing risk concentrations that primarily encompasses the following key elements: — Intra-risk category reviews, generally undertaken by the Portfolio Management areas, are used to identify
and understand the drivers of concentrations within a risk category. — Reviews of business units and legal entities may identify risk concentrations which are discussed and
dependent on materiality escalated up to the Management Board level. — Expert panels, using qualitative instruments, which focus on intra-risk and enterprise-wide risk issues,
concentrations and portfolios of overlapping risk characteristics such as – but not limited to – interdepend-encies between credit, market, liquidity and operational risks, as well as ensuring that the Group’s risk pro-file remains in-line with the overall risk strategy, risk appetite and capital plans.
— Quantitative instruments such as regulatory or economic capital (overall risk measurement) and stress tests; and
— Comprehensive monitoring and reporting.
The most senior governance body for the oversight of risk concentrations is the Cross Risk Review Committee.
Risk Management Tools
We use a comprehensive range of quantitative and qualitative methodologies for assessing and managing risks. As a matter of policy, we continually assess the appropriateness and the reliability of our quantitative tools and metrics in light of our changing risk environment. Some of these tools are common to a number of risk categories, while others are tailored to the particular features of specific risk categories. The advanced internal tools and metrics we currently use to measure, manage and report our risk:
— Economic capital. Economic capital measures the amount of capital we need to absorb very severe unex-pected losses arising from our exposures. “Very severe” in this context means that economic capital is set at a level to cover with a probability of 99.98 % the aggregated unexpected losses within one year. We cal-culate economic capital for the default risk, transfer risk and settlement risk elements of credit risk, for market risk including traded default risk, for operational risk and for general business risk. We continuously review and enhance our economic capital model as appropriate. We use economic capital to show an ag-gregated view of our risk position from individual business lines up to our consolidated Group level. In ad-dition, we consider economic capital, in particular for credit risk, when we measure the risk-adjusted profitability of our client relationships. For consolidation purposes Postbank economic capital has been calculated on a basis consistent with Deutsche Bank methodology. Postbank uses the same tool and me-thodology to calculate credit economic capital. See “Overall Risk Position” below for a quantitative sum-

Deutsche Bank 01 – Management Report 53 Financial Report 2011 Risk Report
mary of our economic capital usage. Using a similar concept, Postbank also quantifies its capital demand arising from severe unexpected losses, referring to it as “risk capital”. In doing so, Postbank uses uniform parameters to measure individual risks that have been classified as material. These parameters are oriented on the value-at-risk approach, using the loss (less the expected gain or loss) that will not be exceeded for a 99.93 % level of probability within the given holding period which is usually one year but for market risk set at 90 days.
— Expected loss. We use expected loss as a measure of our credit and operational risk. Expected loss is a measurement of the loss we can expect within a one-year period from these risks as of the respective report-ing date, based on our historical loss experience. When calculating expected loss for credit risk, we take into account credit risk ratings, collateral, maturities and statistical averaging procedures to reflect the risk characteristics of our different types of exposures and facilities. All parameter assumptions are based on statistical averages of up to seven years based on our internal default and loss history as well as external benchmarks. We use expected loss as a tool of our risk management process and as part of our man-agement reporting systems. We also consider the applicable results of the expected loss calculations as a component of our collectively assessed allowance for credit losses included in our financial statements. For operational risk we determine the expected loss from statistical averages of our internal loss history, recent risk trends as well as forward looking expert estimates. Postbank applies a similar concept.
— Value-at-risk. We use the value-at-risk approach to derive quantitative measures for our trading book market risks under normal market conditions. Our value-at-risk figures play a role in both internal and external (regu-latory) reporting. For a given portfolio, value-at-risk measures the potential future loss (in terms of market value) that, under normal market conditions, will not be exceeded with a defined confidence level in a defined period. The value-at-risk for a total portfolio represents a measure of our diversified market risk (aggregated, using pre-determined correlations) in that portfolio. At Postbank, the value-at-risk approach is used for both the trading book and the banking book.
— Stress testing. Credit, market and operational risk as well as liquidity risk are subject to a program of regu-lar stress tests. The Cross Risk Review Committee oversees the inventory of stress tests used for manag-ing the Group’s risk appetite, reviews the results and proposes management action, if required. The Cross Risk Review Committee monitors the effectiveness of the stress test process and drives continuous im-provement of our stress testing framework. It is supported by a dedicated Stress Testing Oversight Com-mittee which has the responsibility for the definition of the Group-wide stress test scenarios, ensuring common standards and consistent scenarios across risk types, and reviewing the Group-wide stress test results. The stress testing framework at Group level comprises regular group-wide stress based on a con-sistent macroeconomic global downturn scenario, annual reverse and capital plan relevant stress test as well as ad-hoc scenarios.

Deutsche Bank 01 – Management Report 54 Financial Report 2011 Risk Report
We also supplement our risk type specific analysis of credit, market, operational and liquidity risk with stress testing. For credit risk management purposes, we perform stress tests to assess the impact of changes in general economic conditions or specific parameters on our credit exposures or parts thereof as well as the impact on the creditworthiness of our portfolio. For market risk management purposes, we per-form stress tests because value-at-risk calculations are based on relatively recent historical data, only purport to estimate risk up to a defined confidence level and assume good asset liquidity. Therefore, they only reflect possible losses under relatively normal market conditions. Stress tests help us determine the effects of potentially extreme market developments on the value of our market risk sensitive exposures, both on our highly liquid and less liquid trading positions as well as our investments. The correlations be-tween market risk factors used in our current stress tests are estimated from historic volatile market condi-tions and proved to be consistent with those observed during recent periods of market stress. We use stress testing to determine the amount of economic capital we need to allocate to cover our market risk exposure under the scenarios of extreme market conditions we select for our simulations. For operational risk management purposes, we perform stress tests on our economic capital model to assess its sensitivity to changes in key model components, which include external losses. For liquidity risk management pur-poses, we perform stress tests and scenario analysis to evaluate the impact of sudden stress events on our liquidity position. At Postbank all material and actively managed risk categories (credit, market, liquidity and operational risks) are subject to defined stress tests. Postbank was also integrated into Deutsche Bank group wide capital stress test during 2011.
— Regulatory risk assessment. German banking regulators assess our capacity to assume risk in several ways, which are described in more detail in Note 37 “Regulatory Capital” of the consolidated financial statements.
ICAAP (Internal Capital Adequacy Assessment Process)
ICAAP requires banks to identify and assess risks, maintain sufficient capital to face these risks and apply appropriate risk-management techniques to ensure adequate capitalization on an ongoing basis, i.e. internal capital supply to exceed internal capital demand (figures are described in more detail in the section “Internal Capital Adequacy”).
We, at a group level, maintain compliance with the lnternal Capital Adequacy Assessment Process as required under Pillar 2 of Basel 2 and its local implementation in Germany, the Minimum Requirements for Risk Man-agement (MaRisk), through its risk management and governance framework, methodologies, processes and infrastructure, as described above. The Group’s legal entity ICAAP frameworks are designed to be in compli-ance with local regulatory requirements and, where possible, are consistent with the structure and principles as described in this document.

Deutsche Bank 01 – Management Report 55 Financial Report 2011 Risk Report
In line with MaRisk and Basel 2 requirements, the key instruments to ensure adequate capitalization on an ongoing and forward looking basis for the Group are:
— A strategic planning process and continuous monitoring process against approved risk and capital targets set;
— A frequent risk and capital reporting to management; — An economic capital and stress testing framework.
More information on risk management organized by major risk category can be found below.
Credit Risk
We measure and manage our credit risk following the below philosophy and principles:
— The key principle of credit risk management is client credit due diligence, which is aligned with our coun-try and industry portfolio strategies. Prudent client selection is achieved in collaboration with our business line counterparts who stand as a first line of defense. In each of our group divisions credit decision stan-dards, processes and principles are consistently applied.
— We actively aim to prevent undue concentration and long tail-risks (large unexpected losses) by ensuring a diversified credit portfolio, effectively protecting the bank’s capital in all market conditions. Client, industry, country and product-specific concentrations are actively assessed and managed against our risk appetite.
— We aim to avoid large directional credit risk on a counterparty and portfolio level by applying stringent underwriting standards combined with a pro-active hedging and distribution model and collateralization of our hold portfolio where feasible.
— We are selective in taking outright cash risk positions unless secured, guaranteed and/or adequately hedged. Exceptions to this general principle are lower risk, short-term transactions and facilities supporting specific trade finance business requests as well as low risk businesses where the margin allows for adequate loss coverage.
— We aim to secure our derivative portfolio through collateral agreements and may additionally hedge con-centration risks to further mitigate credit risks from underlying market movements.
— Every extension of credit or material change to a credit facility (such as its tenor, collateral structure or major covenants) to any counterparty requires credit approval at the appropriate authority level. We assign credit approval authorities to individuals according to their qualifications, experience and training, and we review these periodically.
— We measure and consolidate all our credit exposures to each obligor on a global basis that applies across our consolidated Group, in line with regulatory requirements of the German Banking Act (Kreditwesengesetz).
Postbank has comparable uniform standards in place.
Deutsche Bank 01 – Management Report 56 Financial Report 2011 Risk Report
Credit Risk Ratings A basic and key element of the credit approval process is a detailed risk assessment of each credit-relevant counterparty. When rating a counterparty we apply in-house assessment methodologies, scorecards and our 26-grade rating scale for evaluating the credit-worthiness of our counterparties. The majority of our rating methodologies are authorized for use within the advanced internal rating based approach under applicable Basel rules. Our rating scale enables us to compare our internal ratings with common market practice and ensures comparability between different sub-portfolios of our institution. Several default ratings therein enable us to incorporate the potential recovery rate of unsecured defaulted counterparty exposures. We generally rate our counterparties individually, though certain portfolios of purchased or securitized receivables are rated on a pool basis.
In our retail business, creditworthiness checks and counterparty ratings of the homogenous portfolio are de-rived by utilizing an automated decision engine. The decision engine incorporates quantitative aspects (e.g. financial figures), behavioral aspects, credit bureau information (such as SCHUFA in Germany) and general customer data. These input factors are used by the decision engine to determine the creditworthiness of the borrower and, after consideration of collateral evaluation, the expected loss as well as the further course of action required to process the ultimate credit decision. The established rating procedures we have implemented in our retail business are based on multivariate statistical methods and are used to support our individual credit decisions for this portfolio as well as managing the overall retail portfolio.
The algorithms of the rating procedures for all counterparties are recalibrated frequently on the basis of the default history as well as other external and internal factors and expert judgments.
Postbank makes use of internal rating systems authorized for use within the foundation internal rating based approach under Basel 2. Similar to us all internal ratings and scorings are based on a uniform master scale, which assigns each rating or scoring result to the default probability determined for that class.
Credit Limits and Approval Credit limits set forth maximum credit exposures we are willing to assume over specified periods. In determin-ing the credit limit for a counterparty we consider the counterparty’s credit quality by reference to its internal credit rating. Credit limits are established by the Credit Risk Management function via the execution of as-signed credit authorities. Credit authority is generally assigned to individuals as personal credit authority ac-cording to the individual’s professional qualification and experience. All assigned credit authorities are reviewed on a periodic basis to ensure that they are adequate to the individual performance of the authority holder. The results of the review are presented to the Group Credit Policy Committee.
Where an individual’s personal authority is insufficient to establish required credit limits, the transaction is re-ferred to a higher credit authority holder or where necessary to an appropriate credit committee such as the CIB Underwriting Committee. Where personal and committee authorities are insufficient to establish appropri-ate limits the case is referred to the Management Board for approval.
At Postbank comparable credit limit standards and approval processes are in place.

Deutsche Bank 01 – Management Report 57 Financial Report 2011 Risk Report
Credit Risk Mitigation In addition to determining counterparty credit quality and our risk appetite, we also use various credit risk mitigation techniques to optimize credit exposure and reduce potential credit losses. Credit risk mitigants, described more fully below, are applied in the following forms:
— Collateral held as security to reduce losses by increasing the recovery of obligations. — Risk transfers, which shift the probability of default risk of an obligor to a third party including hedging
executed by our Loan Exposure Management Group. — Netting and collateral arrangements which reduce the credit exposure from derivatives and repo- and
repo-style transactions.
Collateral Held as Security for Loans We regularly agree on collateral to be received from or to be provided to customers in contracts that are sub-ject to credit risk. We also regularly agree on collateral to be received from borrowers in our lending contracts. Collateral is security in the form of an asset or third-party obligation that serves to mitigate the inherent risk of credit loss in an exposure, by either substituting the borrower default risk or improving recoveries in the event of a default. While collateral can be an alternative source of repayment, it generally does not replace the ne-cessity of high quality underwriting standards.
We segregate collateral received into the following two types:
— Financial and other collateral, which enables us to recover all or part of the outstanding exposure by liqui-dating the collateral asset provided, in cases where the borrower is unable or unwilling to fulfill its primary obligations. Cash collateral, securities (equity, bonds), collateral assignments of other claims or inventory, equipment (e.g., plant, machinery, aircraft) and real estate typically fall into this category.
— Guarantee collateral, which complements the borrower’s ability to fulfill its obligation under the legal con-tract and as such is provided by third parties. Letters of credit, insurance contracts, export credit insurance, guarantees and risk participations typically fall into this category.
Risk Transfers Risk transfers to third parties form a key part of our overall risk management process and are executed in various forms, including outright sales, single name and portfolio hedging, and securitizations. Risk transfers are conducted by the respective business units and by our Loan Exposure Management Group (“LEMG”), in accordance with specifically approved mandates.
LEMG focuses on managing the residual credit risk of loans and lending-related commitments of the interna-tional investment-grade portfolio and the medium-sized German companies’ portfolio within our Corporate & Investment Bank Group Division.
Acting as a central pricing reference, LEMG provides the respective Corporate & Investment Bank Group Divi-sion businesses with an observed or derived capital market rate for loan applications; however, the decision of whether or not the business can enter into the credit risk remains exclusively with Credit Risk Management.
Deutsche Bank 01 – Management Report 58 Financial Report 2011 Risk Report
LEMG is concentrating on two primary initiatives within the credit risk framework to further enhance risk man-agement discipline, improve returns and use capital more efficiently:
— to reduce single-name and industry credit risk concentrations within the credit portfolio and — to manage credit exposures actively by utilizing techniques including loan sales, securitization via collater-
alized loan obligations, default insurance coverage and single-name and portfolio credit default swaps.
Netting and Collateral Arrangements for Derivatives In order to reduce the credit risk resulting from OTC derivative transactions, where OTC clearing is not available, we regularly seek the execution of standard master agreements (such as master agreements for derivatives published by the International Swaps and Derivatives Association, Inc. (ISDA) or the German Master Agree-ment for Financial Derivative Transactions) with our clients. A master agreement allows the netting of rights and obligations arising under derivative transactions that have been entered into under such master agreement upon the counterparty’s default, resulting in a single net claim owed by or to the counterparty (“close-out net-ting”). For parts of the derivatives business (e.g., foreign exchange transactions) we also enter into master agreements under which we set off amounts payable on the same day in the same currency and in respect to transactions covered by such master agreements (“payment netting”), reducing our settlement risk. In our risk measurement and risk assessment processes we apply netting only to the extent we have satisfied ourselves of the legal validity and enforceability of the master agreement in all relevant jurisdictions.
Also, we enter into credit support annexes (“CSA”) to master agreements in order to further reduce our deriva-tives-related credit risk. These annexes generally provide risk mitigation through periodic, usually daily, margining of the covered exposure. The CSAs also provide for the right to terminate the related derivative transactions upon the counterparty’s failure to honor a margin call. As with netting, when we believe the annex is enforceable, we reflect this in our exposure measurement.
Certain CSAs to master agreements provide for rating dependent triggers, where additional collateral must be pledged if a party’s rating is downgraded. We also enter into master agreements that provide for an additional termination event upon a party’s rating downgrade. These downgrading provisions in CSAs and master agreements usually apply to both parties but may apply to us only. We analyze and monitor our potential contingent payment obligations resulting from a rating downgrade in our stress testing approach for liquidity risk on an ongoing basis. For an assessment of the quantitative impact of a downgrading of the Group’s credit rating please refer to table “Stress Testing Results” in the section “Liquidity Risk”.
In order to reduce the credit risk resulting from OTC derivative transactions, Postbank regularly seeks the execution of standard master agreements (such as the German Master Agreement for Financial Derivative Transactions). Postbank applies netting only to the extent it has satisfied itself of the legal validity and enforce-ability of the master agreement in all relevant jurisdictions. In order to further reduce its derivatives-related credit risk, Postbank has entered into CSAs to master agreements with most of the key counterparties in its financial markets portfolio. As with netting, when Postbank believes the annex is enforceable, it reflects this in its capital requirements.

Deutsche Bank 01 – Management Report 59 Financial Report 2011 Risk Report
For purposes of calculating the regulatory requirements for its derivatives exposures Postbank uses the current exposure method, i.e. calculates its exposure at default as the sum of the net positive fair value of its deriva-tives transactions and the regulatory add-ons.
Monitoring Credit Risk Ongoing active monitoring and management of credit risk positions is an integral part of our credit risk manage-ment activities. Monitoring tasks are primarily performed by the divisional credit risk units in close cooperation with the business which acts as first line of defence, dedicated rating analysis teams and our portfolio man-agement function.
Credit counterparties are allocated to credit officers within specified divisional risk units which are aligned to types of counterparty (such as financial institution or corporate) or economic area (i.e. emerging markets). The individual credit officers within these divisional risk units have the relevant expertise and experience to manage the credit risks associated with these counterparties and their associated credit related transactions. It is the responsibility of each credit officer to undertake ongoing credit monitoring for their allocated portfolio of coun-terparties. We also have procedures in place intended to identify at an early stage credit exposures for which there may be an increased risk of loss. In instances where we have identified counterparties where problems might arise, the respective exposure is generally placed on a watchlist. We aim to identify counterparties that, on the basis of the application of our risk management tools, demonstrate the likelihood of problems well in advance in order to effectively manage the credit exposure and maximize the recovery. The objective of this early warning system is to address potential problems while adequate options for action are still available. This early risk detection is a tenet of our credit culture and is intended to ensure that greater attention is paid to such exposures.
At Postbank largely similar processes are in place.
A key focus of our credit risk management approach is to avoid any undue concentrations in our portfolio. Significant concentrations of credit risk could be derived from having material exposures to a number of coun-terparties with similar economic characteristics, or who are engaged in comparable activities, where these similarities may cause their ability to meet contractual obligations to be affected in the same manner by changes in economic or industry conditions. A concentration of credit risk may also exist at an individual coun-terparty level. Our portfolio management framework supports a comprehensive assessment of concentrations within our credit risk portfolio for potential subsequent risk mitigating actions.
Managing industry and country risk are key components of our overall concentration risk management approach for non-Postbank portfolios. In 2011 Postbank enhanced the management of concentrations in the credit area by systematically identifying credit concentration on the level of a single counterparty as well as on a sectoral level (e.g. industry sector, country, regions, product types).

Deutsche Bank 01 – Management Report 60 Financial Report 2011 Risk Report
Industry Risk Management To manage industry risk, we have grouped our corporate and financial institutions counterparties into various industry sub-portfolios. For each of these sub-portfolios an “Industry Batch report” is prepared usually on an annual basis. This report highlights industry developments and risks to our credit portfolio, reviews concentration risks and incorporates an economic downside stress test. This analysis is used to define strategies for both our industry portfolio, and individual counterparties within the portfolio based on their risk/reward profile and potential.
The Industry Batch reports are presented to the Group Credit Policy Committee, a sub-committee of the Risk Executive Committee and are submitted afterwards to the Management Board. In accordance with an agreed schedule, a select number of Industry Batch reports are also submitted to the Risk Committee of the Supervisory Board. In addition to these Industry Batch reports, the development of the industry sub-portfolios is regularly monitored during the year and is compared to the approved sub-portfolio strategies. Regular overviews are prepared for the Group Credit Policy Committee to discuss recent developments and to take action if necessary.
Country Risk Management Avoiding undue concentrations also from a regional perspective is an integral part of our credit risk manage-ment framework. We manage country risk through a number of risk measures and limits, the most important being:
— Total counterparty exposure. All credit extended and OTC derivatives exposure to counterparties domi-ciled in a given country that we view as being at risk due to economic or political events (“country risk event”). It includes non-guaranteed subsidiaries of foreign entities and offshore subsidiaries of local clients.
— Transfer risk exposure. Credit risk arising where an otherwise solvent and willing debtor is unable to meet its obligations due to the imposition of governmental or regulatory controls restricting its ability either to ob-tain foreign exchange or to transfer assets to non-residents (a “transfer risk event”). It includes all of our credit extended and OTC derivatives exposure from one of our offices in one country to a counterparty in a different country.
— Highly-stressed event risk scenarios. We use stress testing to measure potential risks on our trading posi-tions and view these as market risk.
Our country risk ratings represent a key tool in our management of country risk. They are established by an independent country risk research function within Deutsche Bank and include:
— Sovereign rating. A measure of the probability of the sovereign defaulting on its foreign or local currency obligations.
— Transfer risk rating. A measure of the probability of a “transfer risk event.” — Event risk rating. A measure of the probability of major disruptions in the market risk factors relating to
a country.
Deutsche Bank 01 – Management Report 61 Financial Report 2011 Risk Report
All sovereign and transfer risk ratings are reviewed, at least annually, by the Cross Risk Review Committee, a sub-committee of our Risk Executive Committee and Capital and Risk Committee. Deutsche Bank’s country risk research group also reviews, at least semi-annually, our ratings for the major emerging markets countries. Rat-ings for countries that we view as particularly volatile, as well as all event risk ratings, are subject to continuous review.
We also regularly compare our internal risk ratings with the ratings of the major international rating agencies.
Country risk limits are reviewed annually, in conjunction with the review of country risk ratings. Country risk limits are set by either our Management Board or by our Cross Risk Review Committee, pursuant to delegated authority.
In 2011 we established an additional limit framework for certain European countries, in particular, Greece, Ireland, Italy, Portugal and Spain, with a focus to further avoid undue concentrations.
We charge our group divisions with the responsibility of managing their country risk within the approved limits. The regional units within Credit Risk Management monitor our country risk based on information provided by Risk Operations and our finance function. The Cross Risk Review Committee also reviews data on transfer risk.
Important elements of the country risk management at Postbank are country risk ratings and country risk limits. Ratings are reviewed and adjusted if required by means of a rating tool on a monthly basis. Country risk limits and sovereign risk limits for all relevant countries are approved by the Management Board annually. Loans are charged to the limits with their gross nominal amounts and allocated to individual countries based on the coun-try of domicile of the borrower.
Settlement Risk Management Our trading activities may give rise to risk at the time of settlement of those trades. Settlement risk is the risk of loss due to the failure of a counterparty to honour its obligations to deliver cash, securities or other assets as contractually agreed.
For many types of transactions, we mitigate settlement risk by closing the transaction through a clearing agent, which effectively acts as a stakeholder for both parties, only settling the trade once both parties have fulfilled their sides of the contractual obligation.
Where no such settlement system exists, the simultaneous commencement of the payment and the delivery parts of the transaction is common practice between trading partners (free settlement). In these cases, we may seek to mitigate our settlement risk through the execution of bilateral payment netting agreements. We are also participant in industry initiatives to reduce settlement risks. Acceptance of settlement risk on free settlement trades requires approval from our credit risk personnel, either in the form of pre-approved settlement risk limits, or through transaction-specific approvals. We do not aggregate settlement risk limits with other credit exposures for credit approval purposes, but we take the aggregate exposure into account when we consider whether a given settlement risk would be acceptable.

Deutsche Bank 01 – Management Report 62 Financial Report 2011 Risk Report
Credit Risk Tools – Economic Capital for Credit Risk We calculate economic capital for the default risk, country risk and settlement risk as elements of credit risk. In line with our economic capital framework, economic capital for credit risk is set at a level to absorb with a prob-ability of 99.98 % very severe aggregate unexpected losses within one year. Since December 31, 2010, we in-cluded Postbank in our calculation of economic capital usage, which has been calculated on a basis consistent with Deutsche Bank methodology.
Our economic capital for credit risk is derived from the loss distribution of a portfolio via Monte Carlo Simulation of correlated rating migrations. The loss distribution is modelled in two steps. First, individual credit exposures are specified based on parameters for the probability of default, exposure at default and loss given default. In a second step, the probability of joint defaults is modelled through the introduction of economic factors, which correspond to geographic regions and industries. The simulation of portfolio losses is then performed by an internally developed model, which takes rating migration and maturity effects into account. Effects due to wrong-way derivatives risk (i.e., the credit exposure of a derivative in the default case is higher than in non default scenarios) are modelled by applying our own alpha factor determined for our use of the Basel 2 internal models method. This alpha factor has been set at the minimum level of 1.2 both as of December 31, 2011, and December 31, 2010. We allocate expected losses and economic capital derived from loss distributions down to transaction level to enable management on transaction, customer and business level.
For internal purposes, Postbank employs a similar approach and calculates a credit value-at-risk (“CVaR”) at 99.93 % confidence over a one year time horizon for all of its exposures subject to credit risk.
Credit Exposures Counterparty credit exposure arises from our traditional non-trading lending activities which include elements such as loans and contingent liabilities. Counterparty credit exposure also arises via our direct trading activity with clients in certain instruments which include OTC derivatives like FX forwards and Forward Rate Agree-ments. A default risk also arises from our positions in traded credit products such as bonds.
We define our credit exposure by taking into account all transactions where losses might occur due to the fact that counterparties may not fulfil their contractual payment obligations.

Deutsche Bank 01 – Management Report 63 Financial Report 2011 Risk Report
Maximum Exposure to Credit Risk The following tables present our maximum exposure to credit risk and associated collateral held and other credit enhancements (netting and hedges) that do not qualify for offset in our financial statements for the peri-ods specified. The netting credit enhancement component includes the effects of legally enforceable netting agreements as well as the offset of negative mark-to-markets from derivatives against pledged cash collateral. The collateral credit enhancement component mainly includes real estate, collateral in the form of cash as well as securities related collateral. In relation to collateral we apply internally determined haircuts and cap all col-lateral at the level of the respective exposure.
Dec 31, 2011
Credit Enhancements
in € m.
1
Maximum exposure to credit risk
2 Netting
Collateral
Guarantees and Credit derivatives
3
Total credit enhancements
Due from banks 15,928 − 1 − 1 Interest-earning deposits with banks 162,000 − 3 147 150 Central bank funds sold and securities purchased under resale agreements 25,773 − 25,232 − 25,232 Securities borrowed 31,337 − 30,107 − 30,107 Financial assets at fair value through profit or loss
4 1,204,412 724,194 205,210 5,732 935,136 Financial assets available for sale
4 42,296 − 2,392 1,265 3,657 Loans
5 416,676 − 203,364 42,535 245,899 Other assets subject to credit risk 88,221 65,616 9,995 2 75,613 Financial guarantees and other credit related contingent liabilities
6 73,653 − 5,524 7,521 13,045 Irrevocable lending commitments and other credit related commitments
6 127,995 − 715 6,386 7,101
Maximum exposure to credit risk 2,188,291 789,810 482,543 63,588 1,335,941 1 All amounts at carrying value unless otherwise indicated. 2 Does not include credit derivative notional sold and credit derivative notional bought protection. Interest-earning deposits with banks mainly relate to liquidity reserves. 3 Credit derivatives are reflected with the notional of the underlying. 4 Excludes equities, other equity interests and commodities. 5 Gross loans less (deferred expense)/unearned income before deductions of allowance for loan losses. 6 Financial guarantees, other credit related contingent liabilities and irrevocable lending commitments (including commitments designated under the fair value option)
are reflected at notional amounts.

Deutsche Bank 01 – Management Report 64 Financial Report 2011 Risk Report
Dec 31, 2010
Credit Enhancements
in € m.
1
Maximum exposure to credit risk
2 Netting Collateral
Guarantees and Credit derivatives
3 Total credit enhancements
Due from banks 17,157 − − − − Interest-earning deposits with banks 92,377 − 304 13 317 Central bank funds sold and securities purchased under resale agreements 20,365 − 19,982 − 19,982 Securities borrowed 28,916 − 28,257 − 28,257 Financial assets at fair value through profit or loss
4 1,026,494 555,121 183,379 5,355 743,855 Financial assets available for sale
4 48,587 − 1,736 1,113 2,849 Loans
5 411,025 − 189,137 39,326 228,463 Other assets subject to credit risk 61,441 44,783 11,327 2 56,112 Financial guarantees and other credit related contingent liabilities
6 68,055 − 5,681 9,368 15,049 Irrevocable lending commitments and other credit related commitments
6 123,881 − 2,966 21,929 24,895
Maximum exposure to credit risk 1,898,298 599,904 442,769 77,106 1,119,779 1 All amounts at carrying value unless otherwise indicated. 2 Does not include credit derivative notional sold and credit derivative notional bought protection. Interest-earning deposits with banks mainly relate to liquidity reserves. 3 Credit derivatives are reflected with the notional of the underlying. 4 Excludes equities, other equity interests and commodities. 5 Gross loans less (deferred expense)/unearned income before deductions of allowance for loan losses. 6 Financial guarantees, other credit related contingent liabilities and irrevocable lending commitments (including commitments designated under the fair value option)
are reflected at notional amounts.
Included in the category of financial assets at fair value through profit or loss as of December 31, 2011, were € 117 billion of securities purchased under resale agreements (€ 109 billion as of December 31, 2010) and € 27 billion of securities borrowed (€ 28 billion as of December 31, 2010), both with limited net credit risk as a result of very high levels of collateral, as well as debt securities of € 154 billion (€ 171 billion as of December 31, 2010) that are over 84 % investment grade (over 83 % as of December 31, 2010). The above mentioned financial assets available for sale category primarily reflected debt securities of which more than 93 % were investment grade (more than 83 % as of December 31, 2010).
The increase in maximum exposure to credit risk for December 31, 2011 was predominantly driven by positive market values from derivatives (in financial assets at fair value through profit or loss) which increased by € 202 billion to € 860 billion as of December 31, 2011 and interest-earning deposits with banks, which in-creased by € 70 billion and accounted for € 162 billion exposure as of December 31, 2011.
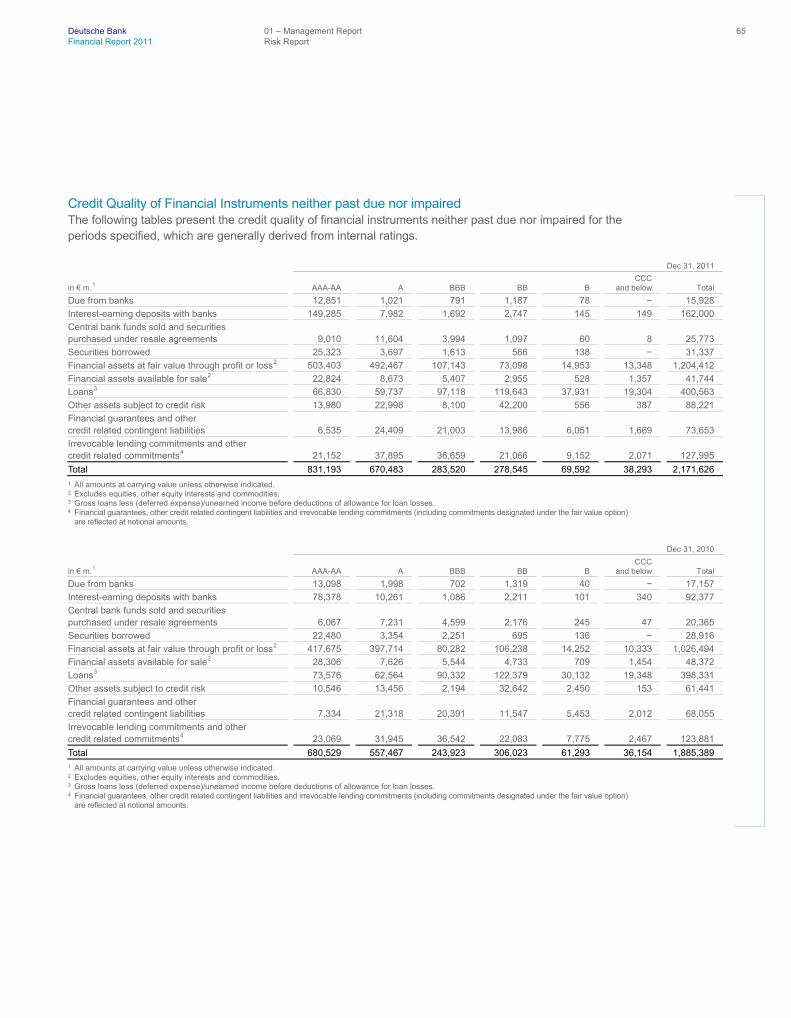
Deutsche Bank 01 – Management Report 65 Financial Report 2011 Risk Report
Credit Quality of Financial Instruments neither past due nor impaired The following tables present the credit quality of financial instruments neither past due nor impaired for the periods specified, which are generally derived from internal ratings.
Dec 31, 2011
in € m.
1 AAA-AA
A
BBB
BB
B
CCC and below
Total
Due from banks 12,851 1,021 791 1,187 78 − 15,928
Interest-earning deposits with banks 149,285 7,982 1,692 2,747 145 149 162,000
Central bank funds sold and securities purchased under resale agreements 9,010 11,604 3,994 1,097 60 8 25,773
Securities borrowed 25,323 3,697 1,613 566 138 − 31,337
Financial assets at fair value through profit or loss
2 503,403 492,467 107,143 73,098 14,953 13,348 1,204,412
Financial assets available for sale
2 22,824 8,673 5,407 2,955 528 1,357 41,744
Loans
3 66,830 59,737 97,118 119,643 37,931 19,304 400,563
Other assets subject to credit risk 13,980 22,998 8,100 42,200 556 387 88,221
Financial guarantees and other credit related contingent liabilities 6,535 24,409 21,003 13,986 6,051 1,669 73,653
Irrevocable lending commitments and other credit related commitments
4 21,152 37,895 36,659 21,066 9,152 2,071 127,995
Total 831,193 670,483 283,520 278,545 69,592 38,293 2,171,626 1 All amounts at carrying value unless otherwise indicated. 2 Excludes equities, other equity interests and commodities. 3 Gross loans less (deferred expense)/unearned income before deductions of allowance for loan losses. 4 Financial guarantees, other credit related contingent liabilities and irrevocable lending commitments (including commitments designated under the fair value option)
are reflected at notional amounts.
Dec 31, 2010
in € m.
1 AAA-AA
A
BBB
BB
B
CCC and below
Total
Due from banks 13,098 1,998 702 1,319 40 − 17,157
Interest-earning deposits with banks 78,378 10,261 1,086 2,211 101 340 92,377
Central bank funds sold and securities purchased under resale agreements 6,067 7,231 4,599 2,176 245 47 20,365
Securities borrowed 22,480 3,354 2,251 695 136 − 28,916
Financial assets at fair value through profit or loss
2 417,675 397,714 80,282 106,238 14,252 10,333 1,026,494
Financial assets available for sale
2 28,306 7,626 5,544 4,733 709 1,454 48,372
Loans
3 73,576 62,564 90,332 122,379 30,132 19,348 398,331
Other assets subject to credit risk 10,546 13,456 2,194 32,642 2,450 153 61,441
Financial guarantees and other credit related contingent liabilities 7,334 21,318 20,391 11,547 5,453 2,012 68,055
Irrevocable lending commitments and other credit related commitments
4 23,069 31,945 36,542 22,083 7,775 2,467 123,881
Total 680,529 557,467 243,923 306,023 61,293 36,154 1,885,389 1 All amounts at carrying value unless otherwise indicated. 2 Excludes equities, other equity interests and commodities. 3 Gross loans less (deferred expense)/unearned income before deductions of allowance for loan losses. 4 Financial guarantees, other credit related contingent liabilities and irrevocable lending commitments (including commitments designated under the fair value option)
are reflected at notional amounts.

Deutsche Bank 01 – Management Report 66 Financial Report 2011 Risk Report
Our counterparty ratings are monitored and updated by dedicated analysts on an ongoing basis so as to reflect the impact of the changing economic environment and where necessary, internal counterparty ratings are amended immediately. We review the effectiveness of our rating methodologies on an annual basis.
Main Credit Exposure Categories Our credit lending activities are governed by our Principles for Managing Country and Credit Risk. These prin-ciples define our general risk philosophy for credit and country risk and its methods to actively manage this risk. The principles define key organizational requirements, roles and responsibilities as well as process principles for credit and country risk management and are applicable to all lending activities undertaken by the Group. Key elements of the principles with relation to the underwriting process include:
— Independence of our credit risk management function from our business divisions. — The internal rating of each borrower, as the rating is an essential part of our underwriting and credit
process and builds the basis for correct risk appetite determination and adequate pricing of transactions. Ratings must always be kept up-to-date and documented.
— Credit approvals are based on credit authority which is assigned to individuals based on personal and professional qualification and experience. Authorities are reviewed annually and are valid until withdrawn.
— Credit approvals are documented by the signing of the credit report by the respective credit authority hold-ers and retained for future reference.
Our various business divisions require individual and customized credit processes performed by independent credit risk units in order to assess and determine the underling risks most appropriately. While this approach is designed to ensure high quality and tailor-made risk management, consistency of approach demands that all divisional credit risk units must follow the same fundamental credit risk management principles described above to ensure consistency of approach. Underwriting standards for our credit units are embodied within credit policies, guidelines and portfolio strategies for each appropriate loan category and are reviewed at least annually. The respective loan portfolios are also subject to frequent monitoring and reporting. For the major loan categories the process applied together with portfolio characteristics are highlighted below.
In the following tables, we show details about several of our main credit exposure categories, namely loans, irrevocable lending commitments, contingent liabilities, over-the-counter (“OTC”) derivatives and debt securi-ties available for sale:
— “Loans” are net loans as reported on our balance sheet at amortized cost but before deduction of our al-lowance for loan losses.
— “Irrevocable lending commitments” consist of the undrawn portion of irrevocable lending-related commit-ments.
— “Contingent liabilities” consist of financial and performance guarantees, standby letters of credit and in-demnity agreements.

Deutsche Bank 01 – Management Report 67 Financial Report 2011 Risk Report
— “OTC derivatives” are our credit exposures from over-the-counter derivative transactions that we have entered into, after netting and cash collateral received. On our balance sheet, these are included in finan-cial assets at fair value through profit or loss or, for derivatives qualifying for hedge accounting, in other assets, in either case, before netting and cash collateral received.
— “Debt securities available for sale” include debentures, bonds, deposits, notes or commercial paper, which are issued for a fixed term and redeemable by the issuer, which we have classified as available for sale.
The following tables break down several of our main credit exposure categories according to the industry sec-tors of our counterparties.
Dec 31, 2011
in € m. Loans
1
Irrevocable lending commitments
2
Contingent liabilities
OTC derivatives
3
Debt securities available for sale
Total
Banks and insurance 35,308 22,553 17,668 50,657 15,887 142,073 Fund management activities 24,952 4,931 2,432 8,943 1,127 42,385 Manufacturing 22,754 31,297 19,608 3,279 697 77,635 Wholesale and retail trade 15,045 8,412 5,527 610 251 29,845 Households 174,188 10,613 2,706 1,082 − 188,589 Commercial real estate activities 46,143 2,877 2,348 2,187 53 53,608 Public sector 16,412 1,479 104 8,625 18,872 45,492 Other 81,874
4 45,833 23,260 4,241 2,494 157,702
Total 416,676 127,995 73,653 79,624 39,381 737,329 1 Includes impaired loans amounting to € 9.4 billion as of December 31, 2011. 2 Includes irrevocable lending commitments related to consumer credit exposure of € 9.2 billion as of December 31, 2011. 3 Includes the effect of netting agreements and cash collateral received where applicable. Excludes derivatives qualifying for hedge accounting. 4 Loan exposures for Other include lease financing.
Dec 31, 2010
in € m. Loans
1
Irrevocable lending commitments
2
Contingent liabilities
OTC derivatives
3
Debt securities available for sale
Total
Banks and insurance 38,798 22,241 17,801 32,315 19,943 131,098 Fund management activities 27,964 6,435 2,392 9,318 − 46,109 Manufacturing 20,748 31,560 18,793 3,270 2,536 76,907 Wholesale and retail trade 13,637 7,369 5,022 517 51 26,596 Households 167,352 9,573 2,537 842 − 180,304 Commercial real estate activities 44,119 3,210 2,196 1,577 70 51,172 Public sector 24,113 858 57 6,510 19,115 50,653 Other 74,294
4 42,635 19,257 7,956 4,499 148,641
Total 411,025 123,881 68,055 62,305 46,214 711,480 1 Includes impaired loans amounting to € 6.3 billion as of December 31, 2010. 2 Includes irrevocable lending commitments related to consumer credit exposure of € 4.5 billion as of December 31, 2010. 3 Includes the effect of netting agreements and cash collateral received where applicable. Excludes derivatives qualifying for hedge accounting. 4 Loan exposures for Other include lease financing.
Our credit risk profile composition by industry sector remained largely unchanged on a year on year compari-son.

Deutsche Bank 01 – Management Report 68 Financial Report 2011 Risk Report
Loan exposures to the industry sectors banks and insurance, fund management activities, manufacturing and public sector comprise predominantly investment grade variable rate loans which are held to maturity. The portfolio is subject to the same credit underwriting requirements stipulated in our Principles for Managing Country and Credit risk, including various controls according to single name, country, industry and product-specific concentration. Material transactions, such as loans underwritten with the intention to syndicate, are subject to review by senior credit risk management professionals and (depending upon size) a credit commit-tee and/or the Management Board. High emphasis is placed on structuring such transactions to ensure de-risking is achieved in a timely and cost effective manner. Exposures within these categories are mostly to good quality borrowers and also subject to further risk mitigation as outlined on the description of our Loan Exposure Management Group’s activities on page 79 and therefore, they are categorised as lower risk.
Within the category household, our loan exposure of € 174 billion as of December 31, 2011 (€ 167 billion as of December 2010) contained € 136 billion of mortgages, of which € 108 billion were in Germany. The € 39 billion of non-mortgage household lending related primarily to Consumer Finance comprising instalment loans, credit lines and credit cards as well as Private Wealth Management lending.
Our household loans are principally associated with our Private & Business Clients (PBC) portfolio comprising predominantly mortgage and to a lesser extent consumer finance business. Given the homogenous nature of this portfolio counterparty credit worthiness and ratings are derived by utilising an automated decision engine. The engine incorporates quantitative aspects (e.g. financial figures), behavioral aspects, credit bureau informa-tion (SCHUFA in Germany) and general customer data. These input factors are used by the decision engine to determine the credit worthiness of the borrower and after consideration of collateral evaluation, specific busi-ness rules, personal credit authority and in certain mortgage cases external and/or internal real estate apprais-ers the ultimate credit decision is made.
Mortgage business is principally the financing of owner occupied properties sold by various business channels in Europe, primarily in Germany but also in Spain, Italy and Poland, with exposure normally not exceeding liquidation value (after appropriate haircuts). Consumer Finance is divided into personal instalment loans, credit lines and credit cards. Various lending requirements are stipulated, including (but not limited to) maxi-mum loan amounts and maximum tenors and are adapted to regional conditions and/or circumstances of the borrower (e.g., for consumer loans a maximum loan amount taking into account household net income). Inter-est rates are mostly fixed over a certain period of time, especially in Germany. Second lien loans are not ac-tively pursued.
Deutsche Bank 01 – Management Report 69 Financial Report 2011 Risk Report
The level of credit risk of the mortgage loan portfolio is determined by assessing the quality of the client and the underlying collateral. The loan amounts are generally larger than consumer finance loans and they are extended for longer time horizons. Consumer Finance loan risk depends on client quality. Given that they are uncollateralized, compared to mortgages they are also smaller in value and are extended for shorter time. Based on our underwriting criteria and processes, diversified portfolio (customers/properties) and low loan to value ratios, the mortgage portfolio is categorised as lower risk and consumer finance medium risk.
Our commercial real estate loans are generally originated for distribution as securities (CMBS) or in the bank syndication market and accounted for as financial assets at fair value through profit and loss. Loans are gener-ally secured by first mortgages on the underlying real property, and follow the credit underwriting requirements stipulated in the Principles for Managing Country and Credit risk noted above (i.e. rating followed by credit approval based on assigned credit authority) and are subject to additional underwriting and policy guidelines such as loan-to-value ratios of generally less than 75 %. Additionally given the significance of the underlying collateral independent external appraisals are commissioned for all secured loans by our valuation team (part of the independent Credit Risk Management function). Our valuation team is responsible for reviewing and challenging the reported real estate values. Excluding legacy exposures, the Commercial Real Estate Group does not retain mezzanine or other junior tranches of debt; Postbank holds an insignificant sub-portfolio of junior tranches, which is being held to maturity. Loans originated for securitization are carefully monitored un-der a € 3.25 billion pipeline limit. Securitized loan positions are entirely sold (except where regulation requires retention of economic risk), while we frequently retain a portion of syndicated bank loans. This hold portfolio, which is held at amortised cost, is also subject to the aforementioned principles and policy guidelines. Post-bank loans are generally held to maturity and not sold in the secondary market. We also participate in conser-vatively underwritten unsecured lines of credit to well-capitalized real estate investment trusts and other public companies (generally investment grade). In addition, sub-performing and non-performing loans and pools of loans are generally acquired from other financial institutions at substantial discounts to both the notional amounts and current collateral values. The underwriting process is stringent and the exposure is managed under a separate € 3.5 billion portfolio limit. We provide both fixed rate (generally securitized product) and floating rate loans, with interest rate exposure subject to hedging arrangements. In addition, new Deutsche Bank unsecured exposure is de-risked via LEMG. Commercial real estate property valuations and rental in-comes can be significantly impacted by macro-economic conditions and underlying properties to idiosyncratic events. Accordingly, the portfolio is categorised as higher risk and hence subject to the aforementioned tight restrictions on concentration.
The category Other loans, with exposure of € 82 billion as of December 31, 2011 (€ 74 billion as of December 31, 2010), relates to numerous smaller industry sectors with no individual sector greater than 5 % of total loans. The largest of these smaller industry sectors relates to financial intermediation, other business activities and transportation.

Deutsche Bank 01 – Management Report 70 Financial Report 2011 Risk Report
Our loans, irrevocable lending commitments, contingent liabilities and OTC derivatives-related credit exposure to our ten largest counterparties accounted for 4 % of our aggregated total credit exposure in these categories as of December 31, 2011 compared to 5 % as of December 31, 2010. Our top ten counterparty exposures were primarily with well-rated counterparties or otherwise related to structured trades which show high levels of risk mitigation, with the exception of one counterparty relationship.
The following tables break down several of our main credit exposure categories by geographical region. For these tables, we have allocated exposures to regions based on the country of domicile of our counterparties, irrespective of any affiliations the counterparties may have with corporate groups domiciled elsewhere.
Dec 31, 2011
in € m. Loans
1
Irrevocable lending commitments
2 Contingent liabilities OTC derivatives
3 Debt securities available for sale Total
Germany 199,442 24,448 15,408 5,148 7,848 252,294 Western Europe (excluding Germany) 115,782 32,399 19,460 35,932 24,910 228,483 Eastern Europe 9,387 1,357 1,682 135 369 12,930 North America 54,962 63,318 23,884 28,070 5,523 175,757 Central and South America 4,775 852 1,803 396 79 7,905 Asia/Pacific 30,291 4,791 10,425 9,011 628 55,146 Africa 1,502 598 991 888 7 3,986 Other 535
4 232 − 44 17 828
Total 416,676 127,995 73,653 79,624 39,381 737,329 1 Includes impaired loans amounting to € 9.4 billion as of December 31, 2011. 2 Includes irrevocable lending commitments related to consumer credit exposure of € 9.2 billion as of December 31, 2011. 3 Includes the effect of netting agreements and cash collateral received where applicable. Excludes derivatives qualifying for hedge accounting. 4 Loan exposures for Other include lease financing.
Dec 31, 2010
in € m. Loans
1
Irrevocable lending commitments
2 Contingent liabilities OTC derivatives
3 Debt securities available for sale Total
Germany 207,129 24,273 15,758 3,018 7,135 257,313 Western Europe (excluding Germany) 110,930 30,239 18,019 22,213 30,310 211,711 Eastern Europe 8,103 1,844 1,319 836 410 12,512 North America 54,887 59,506 22,063 26,765 6,464 169,685 Central and South America 4,121 575 1,427 1,792 61 7,976 Asia/Pacific 23,562 6,651 8,532 7,247 1,783 47,775 Africa 961 419 911 421 5 2,717 Other 1,332
4 374 26 13 46 1,791
Total 411,025 123,881 68,055 62,305 46,214 711,480 1 Includes impaired loans amounting to € 6.3 billion as of December 31, 2010. 2 Includes irrevocable lending commitments related to consumer credit exposure of € 4.5 billion as of December 31, 2010. 3 Includes the effect of netting agreements and cash collateral received where applicable. Excludes derivatives qualifying for hedge accounting. 4 Loan exposures for Other include lease financing.
Our overall loan book was relatively unchanged as of December 31, 2011, rising to € 417 billion versus € 411 billion as of December 31, 2010.
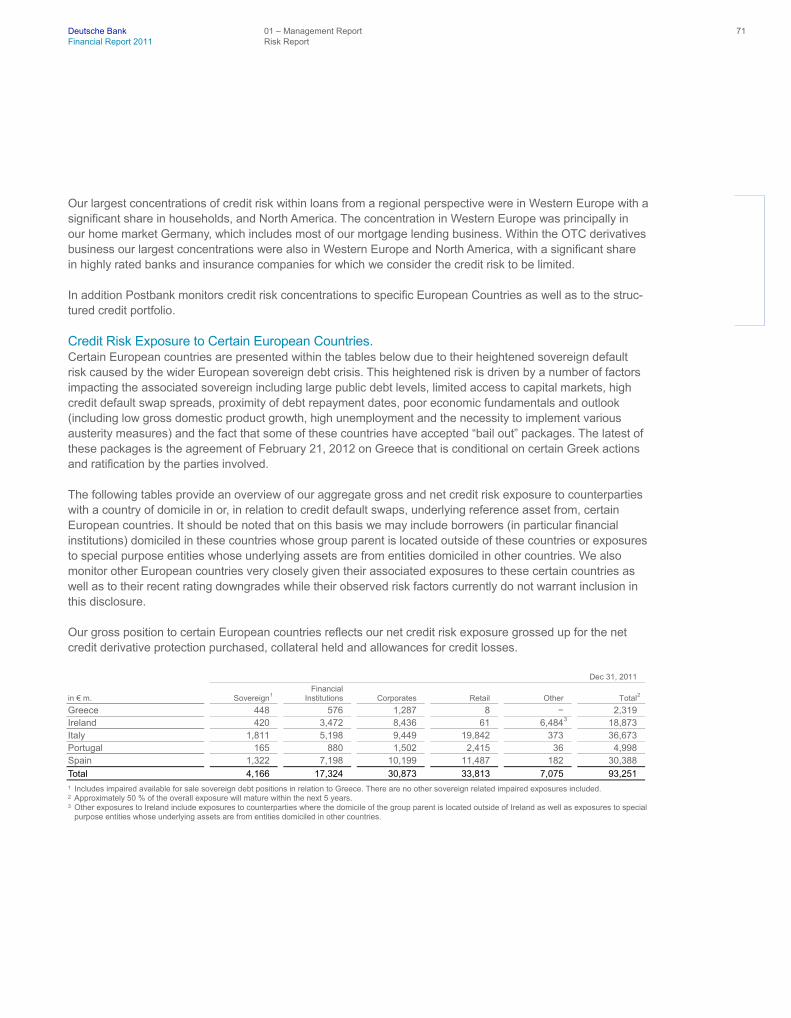
Deutsche Bank 01 – Management Report 71 Financial Report 2011 Risk Report
Our largest concentrations of credit risk within loans from a regional perspective were in Western Europe with a significant share in households, and North America. The concentration in Western Europe was principally in our home market Germany, which includes most of our mortgage lending business. Within the OTC derivatives business our largest concentrations were also in Western Europe and North America, with a significant share in highly rated banks and insurance companies for which we consider the credit risk to be limited.
In addition Postbank monitors credit risk concentrations to specific European Countries as well as to the struc-tured credit portfolio.
Credit Risk Exposure to Certain European Countries. Certain European countries are presented within the tables below due to their heightened sovereign default risk caused by the wider European sovereign debt crisis. This heightened risk is driven by a number of factors impacting the associated sovereign including large public debt levels, limited access to capital markets, high credit default swap spreads, proximity of debt repayment dates, poor economic fundamentals and outlook (including low gross domestic product growth, high unemployment and the necessity to implement various austerity measures) and the fact that some of these countries have accepted “bail out” packages. The latest of these packages is the agreement of February 21, 2012 on Greece that is conditional on certain Greek actions and ratification by the parties involved.
The following tables provide an overview of our aggregate gross and net credit risk exposure to counterparties with a country of domicile in or, in relation to credit default swaps, underlying reference asset from, certain European countries. It should be noted that on this basis we may include borrowers (in particular financial institutions) domiciled in these countries whose group parent is located outside of these countries or exposures to special purpose entities whose underlying assets are from entities domiciled in other countries. We also monitor other European countries very closely given their associated exposures to these certain countries as well as to their recent rating downgrades while their observed risk factors currently do not warrant inclusion in this disclosure.
Our gross position to certain European countries reflects our net credit risk exposure grossed up for the net credit derivative protection purchased, collateral held and allowances for credit losses.
Dec 31, 2011
in € m. Sovereign
1
Financial Institutions
Corporates
Retail
Other
Total
2
Greece 448 576 1,287 8 − 2,319 Ireland 420 3,472 8,436 61 6,484
3 18,873 Italy 1,811 5,198 9,449 19,842 373 36,673 Portugal 165 880 1,502 2,415 36 4,998 Spain 1,322 7,198 10,199 11,487 182 30,388
Total 4,166 17,324 30,873 33,813 7,075 93,251 1 Includes impaired available for sale sovereign debt positions in relation to Greece. There are no other sovereign related impaired exposures included. 2 Approximately 50 % of the overall exposure will mature within the next 5 years. 3 Other exposures to Ireland include exposures to counterparties where the domicile of the group parent is located outside of Ireland as well as exposures to special
purpose entities whose underlying assets are from entities domiciled in other countries.

Deutsche Bank 01 – Management Report 72 Financial Report 2011 Risk Report
The table below provides an overview of our aggregate net credit risk exposure to counterparties with a coun-try of domicile in certain European countries. Exposures are presented after effects of collateral held, guaran-tees received and further risk mitigation. Loan exposures held at amortized cost are presented after deduction of allowance for loan losses.
Dec 31, 2011
in € m. Sovereign
1
Financial Institutions
Corporates
Retail
Others
Total
2
Greece 448 105 324 2 − 879 Ireland 181 1,755 6,593 9 5,084
3 13,622 Italy 1,767 2,296 6,670 8,480 173 19,386 Portugal (45) 519 727 364 36 1,601 Spain 1,318 5,740 7,152 2,018 93 16,321
Total 3,669 10,415 21,466 10,873 5,386 51,809 1 Includes impaired available for sale sovereign debt positions in relation to Greece. There are no other sovereign related impaired exposures included. 2 Approximately 50 % of the overall exposure will mature within the next 5 years. 3 Other exposures to Ireland include exposures to counterparties where the domicile of the group parent is located outside of Ireland as well as exposures to special
purpose entities whose underlying assets are from entities domiciled in other countries.
In arriving at our net exposure the principal cause of the reduction from the gross position is the application of collateral held, in particular with respect to the retail category, but also for financial institutions, predominantly in relation to derivative margining arrangements, as well as for corporates. Other adjustments to arrive at our net exposure include credit derivatives with underlying reference assets domiciled in one of the above countries as well as allowance for credit losses.
The table below provides an overview of our aggregate net credit risk exposure to counterparties with a coun-try of domicile in certain European countries broken down by type of financial instrument. Exposures are pre-sented after effects of collateral held, guarantees received and further risk mitigation but excluding net notional amounts of credit derivatives for protection sold/(bought). Loan exposures held at amortized cost are pre-sented before and after deduction of allowance for loan losses.
Financial assets carried at amortized cost
Financial assets measured at fair value
Financial instruments at fair value through profit or loss Dec 31, 2011
in € m.
Loans before loan loss allowance
Loans after loan loss allowance
Other
1
Financial assets available for sale
2
Derivatives
Other Total
3
Greece 214 200 38 211 100 255 804 Ireland 4,601 4,592 3,022 1,250 2,693 3,242 14,799 Italy 12,834 12,275 3,712 1,243 3,414 (1,787) 18,857 Portugal 1,227 1,206 223 209 243 439 2,320 Spain 7,346 6,910 3,052 3,371 1,936 1,201 16,470
Total 26,222 25,183 10,047 6,284 8,386 3,350 53,250 1 Primarily includes contingent liabilities and undrawn lending commitments. 2 Excludes equities and other equity interests. 3 After loan loss allowances.

Deutsche Bank 01 – Management Report 73 Financial Report 2011 Risk Report
The following table provides an overview of our credit derivative exposure with sovereign and non-sovereign underlying assets domiciled in these European countries. The table presents the notional amounts for protec-tion sold and protection bought on a gross level as well as the resulting net notional position and its fair value.
Notional amounts Dec 31, 2011
in € m. Protection sold
Protection bought
Net protection sold/(bought)
Net fair value
Greece 8,284 (8,209) 75 (75) Ireland 11,203 (12,380) (1,177) 51 Italy 59,890 (59,361) 529 32 Portugal 12,744 (13,463) (719) 36 Spain 35,267 (35,416) (149) 68
Total 127,388 (128,829) (1,441) 112
In line with common industry practice, we use credit default swaps (CDS) as one important instrument to man-age credit risk in order to avoid any undue concentrations in the credit portfolio. CDS contracts are governed by standard ISDA documentation which defines trigger events which result in settlement payouts. Examples of these triggers include bankruptcy of the reference entity, failure of reference entity to meeting contractual obli-gations (e.g. interest or principal repayment) and debt restructuring of the reference entity. These triggers also apply to credit default protection contracts sold. Our purchased credit default swap protection acting as a risk mitigant is predominantly issued by highly rated financial institutions governed under collateral agreements. It is important to note that we also keep control on gross positions before CDS hedging for any potential undue concentrations. While we clearly focus on net risk including hedging/collateral we also very intensively review our gross positions before any CDS hedging in reflection of the potential risk that a CDS trigger event does not occur as expected. Please note that the significant reduction in sovereign risk in relation to certain European countries we achieved in 2011 was not driven by CDS hedging.
For credit protection purposes we strive to avoid any maturity mismatches. However, this depends on the availability of required hedging instruments in the market. Where maturity mismatches cannot be avoided, these positions are tightly monitored. We take into account the sensitivities of hedging instrument and underly-ing asset to neutralize the maturity mismatch.
The aforementioned tables provided on our overall gross and net exposures to certain European countries do not include credit derivative tranches and credit derivatives in relation to our correlation business which, by design, is structured to be credit risk neutral. Additionally the tranched and correlated nature of these positions does not lend itself to a disaggregated notional presentation by country, e.g. as identical notional exposures represent different levels of risk for different tranche levels.

Deutsche Bank 01 – Management Report 74 Financial Report 2011 Risk Report
The table below provides an overview of our aggregate undrawn exposure to counterparties with a country of domicile in certain European countries. Terms and conditions related to any potential limitations of the counter-party being able to draw down on available facilities are included within the specific contractual documentation.
Dec 31, 2011
in € m. Sovereign
Financial Institutions
Corporates
Retail
Others
Total
Greece − 5 121 2 − 128 Ireland − 4 1,130 3 340 1,477 Italy 2 637 3,581 308 − 4,528 Portugal − 33 130 30 − 193 Spain − 313 3,257 593 − 4,163
Total 2 992 8,219 936 340 10,489
In contrast to the above, from a risk management perspective we consider the domicile of the group parent, thereby reflecting the one obligor principle. Also, in our risk management we classify exposure to special pur-pose entities based on the domicile of the underlying assets as opposed the domicile of the special purpose entities. The following table provides our net exposure from a risk management perspective.
in € m. Dec 31, 2011
Greece 840 Ireland 1,570 Italy 18,064 Portugal 1,733 Spain 12,750
Total 34,957
Our above exposure is principally to highly diversified, low risk retail portfolios and small and medium enter-prises in Italy and Spain, as well as stronger corporates and diversified mid cap clients, while our financial institutions exposure is predominantly geared towards Tier 1 banks with very limited single name concentration. Sovereign exposure is moderate and principally in Italy, and there driven by our flow derivatives and market making activities.
The exposures associated with the countries noted above are managed and monitored using the credit process noted within the previous credit risk section including detailed counterparty ratings, ongoing counter-party monitoring as well as our framework for managing concentration risk as documented within our country risk and industry risk sections. In 2011, we established an additional limit framework for the above countries in focus to further avoid undue concentrations. This framework has been complemented by regular management reporting including targeted portfolio reviews of these countries, portfolio de-risking initiatives and stress testing.

Deutsche Bank 01 – Management Report 75 Financial Report 2011 Risk Report
In addition to the risks associated with direct exposure to these countries the risk of potential contagion also exists indirectly (e.g. impact on the Western European banking sector and wider economic contraction in the corporate sector). To manage the implications of these indirect exposures, credit risk management undertakes targeted portfolio reviews and undertakes targeted stress testing for these countries which feed into our wider Group stress testing framework. The results of these exercises are reported to senior management to deter-mine appropriate mitigating actions. The stress testing undertaken on our global portfolio provides us with the ability to simulate the impact of developments on our potential credit losses, rating migrations and capital de-mands.
Sovereign Credit Risk Exposure to certain European Countries The following table provides an overview of our sovereign credit risk exposure to certain European countries.
Dec 31, 2011 Dec 31, 2010
in € m.
Direct Sovereign exposure
1
Net Notional of CDS referencing sovereign debt
Net sovereign exposure
Memo Item: Net fair value of CDS referencing sovereign debt
2
Direct Sovereign exposure
1
Net Notional of CDS referencing sovereign debt
Net sovereign exposure
Memo Item: Net fair value of CDS referencing sovereign debt
2
Greece 433 15 448 (50) 1,510 91 1,601 (69) Ireland 208 (27) 181 (21) 353 (116) 237 (53) Italy 176 1,591 1,767 1 3,482 4,529 8,011 (12) Portugal 116 (161) (45) 16 111 (123) (12) (32) Spain 1,026 292 1,318 (13) 2,109 174 2,283 (75)
Total 1,959 1,710 3,669 (67) 7,565 4,555 12,120 (241) 1 Includes debt classified as financial assets/liabilities at fair value through profit or loss, available for sale and loans carried at amortized cost. 2 The amounts reflect the net fair value (i.e. counterparty credit risk) in relation to credit default swaps referencing sovereign debt of the respective country.
The above shown amounts reflect a net “accounting view” of our sovereign exposure. The reductions com-pared to year-end 2010 reflect targeted risk reductions, paydowns and fair value changes from market price movements within 2011.
The above mentioned direct sovereign exposure included the carrying value of positions held at amortized cost which, as of December 31, 2011, amounted to € 0 million for Greece, € 546 million for Italy and € 752 million for Spain and, as for December 31, 2010 amounted to € 162 million for Greece, € 864 million for Italy and € 969 million for Spain.

Deutsche Bank 01 – Management Report 76 Financial Report 2011 Risk Report
The following table provides an overview of the fair value of our sovereign credit risk exposure to certain Euro-pean countries classified as financial assets at fair value through profit or loss.
Dec 31, 2011 Dec 31, 2010
in € m. Fair value of sovereign debt
Fair value of derivatives with sovereign counterparties (net position)
1
Total fair value of sovereign exposures
Fair value of sovereign debt
Fair value of derivatives with sovereign counterparties (net position)
1
Total fair value of sovereign exposures
Greece 197 25 222 233 − 233 Ireland (32) 7 (25) 135 − 135 Italy (3,325)
2 2,332 (993) (3,415)
2 1,970 (1,445) Portugal 81 4 85 (52) 113 61 Spain 52 28 80 136 24 160
Total (3,027) 2,396 (631) (2,963) 2,107 (856) 1 Includes the impact of master netting and collateral arrangements. 2 Short sovereign debt position for Italy predominantly related to structured trades with corresponding credit derivatives offset.
The following table provides an overview of our sovereign credit risk exposure to certain European countries classified as financial assets available for sale.
Dec 31, 2011 Dec 31, 2010
in € m. Fair value of sovereign debt
Original carrying amount
Accumulated impairment losses recognized in net income (after tax)
Fair value of sovereign debt
Original carrying amount
1
Accumulated impairment losses recognized in net income
Greece 211 494 (368) 1,115 1,114 − Ireland 232 213 − 218 218 − Italy 625 724 − 4,063 4,074 − Portugal 31 46 − 51 51 − Spain 193 194 − 979 937 −
Total 1,292 1,671 (368) 6,426 6,394 − 1 For positions acquired as part of the acquisition of Postbank on December 3, 2010, the original carrying amount reflects the fair value of those positions at that
date.
Credit Exposure from Lending Our lending businesses are subject to credit risk management processes, both at origination and on an ongo-ing basis. For an overview of these processes see pages 55 to 62 within the credit risk section of this report.

Deutsche Bank 01 – Management Report 77 Financial Report 2011 Risk Report
The following table provides an overview of the categories of our loan book and the segregation into a lower, medium and higher risk bucket.
in € m. Dec 31, 2011 Dec 31, 2010
1
Lower risk bucket:
PBC Mortgages 146,253 140,727
Investment Grade / German Mid-Cap 48,412 57,002
GTB 57,876 45,977
PWM 28,813 24,468
PBC small corporates 18,553 17,550
Government collateralized / structured transactions 5,117 9,074
Corporate Investments 6,707
2 7,966
Sub-total lower risk bucket 311,731 302,764
Moderate risk bucket
PBC Consumer Finance 18,815 18,902
Asset Finance (Deutsche Bank sponsored conduits) 17,282 18,465
Collateralized hedged structured transactions 16,949 17,724
Financing of pipeline assets
3 6,619 8,050
Sub-total moderate risk bucket 59,665 63,141
Higher risk bucket
Commercial Real Estate
4 28,398 29,024
Leveraged Finance 4,888
5 6,472
Other
6 11,994 9,624
Sub-total higher risk bucket 45,280 45,120
Total loan book 416,676 411,025 1 Amounts for December 31, 2010, reflect the new business division structure established in 2011. 2 Includes loans amounting to € 3.8 billion in relation to one non-investment grade counterparty relationship. 3 Thereof vendor financing on loans sold in Leveraged Finance amounting to € 5.0 billion and in Commercial Real Estate amounting to € 1.6 billion as of
December 31, 2011 (€ 5.9 billion and € 2.2 billion as of December 31, 2010, respectively). 4 Includes loans from CMBS securitizations. 5 Includes loans from LEMG amounting to € 3.7 billion and from Corporate Finance amounting to € 1.2 billion. 6 Includes financial assets which have been reclassified in accordance with IAS 39 into the loans classification as well as other smaller loans predominately in our
Corporate Banking & Securities corporate division.
The majority of our low risk exposures is associated with our Private & Business Client retail banking activities. 75 % of our loan book at December 31, 2011 was in the low risk category, in line with the prior year end.
Our higher risk bucket was predominantly driven by our commercial real estate exposures. Our credit risk management approach puts strong emphasis specifically on the portfolios we deem to be of higher risk. Portfo-lio strategies and credit monitoring controls are in place for these portfolios. The overall commercial real estate exposures were consistent with the levels reported at December 31, 2010.
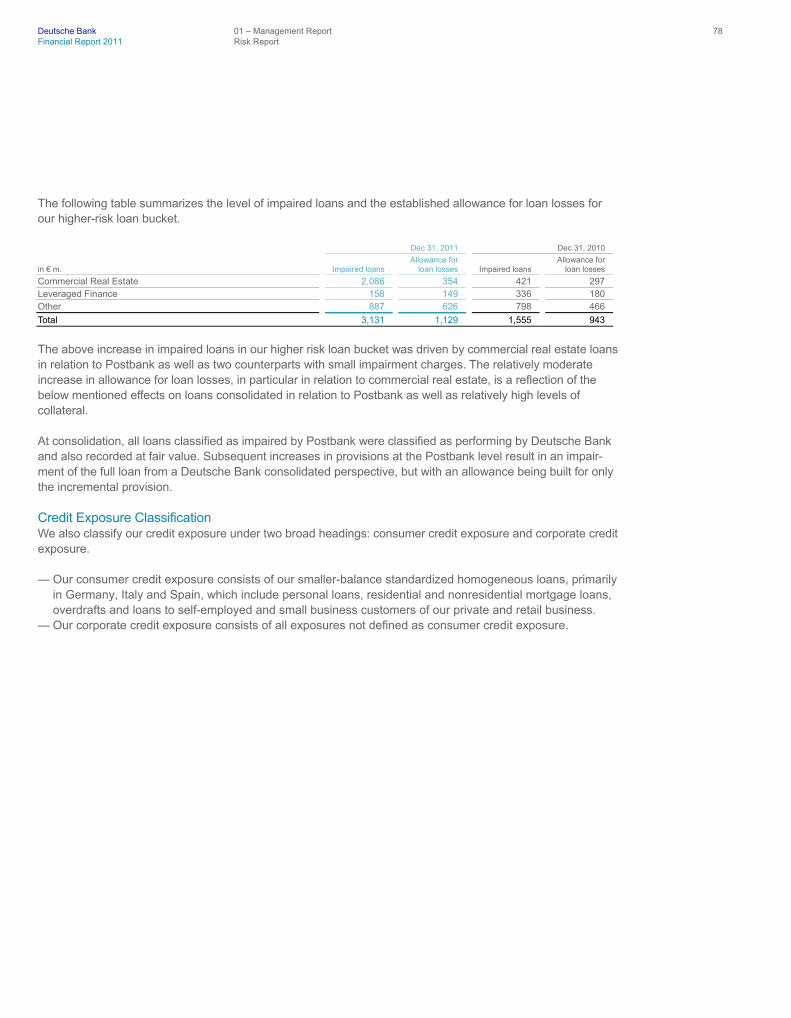
Deutsche Bank 01 – Management Report 78 Financial Report 2011 Risk Report
The following table summarizes the level of impaired loans and the established allowance for loan losses for our higher-risk loan bucket.
Dec 31, 2011 Dec 31, 2010
in € m. Impaired loans Allowance for loan losses Impaired loans
Allowance for loan losses
Commercial Real Estate 2,086 354 421 297 Leveraged Finance 158 149 336 180 Other 887 626 798 466
Total 3,131 1,129 1,555 943
The above increase in impaired loans in our higher risk loan bucket was driven by commercial real estate loans in relation to Postbank as well as two counterparts with small impairment charges. The relatively moderate increase in allowance for loan losses, in particular in relation to commercial real estate, is a reflection of the below mentioned effects on loans consolidated in relation to Postbank as well as relatively high levels of collateral.
At consolidation, all loans classified as impaired by Postbank were classified as performing by Deutsche Bank and also recorded at fair value. Subsequent increases in provisions at the Postbank level result in an impair-ment of the full loan from a Deutsche Bank consolidated perspective, but with an allowance being built for only the incremental provision.
Credit Exposure Classification We also classify our credit exposure under two broad headings: consumer credit exposure and corporate credit exposure.
— Our consumer credit exposure consists of our smaller-balance standardized homogeneous loans, primarily in Germany, Italy and Spain, which include personal loans, residential and nonresidential mortgage loans, overdrafts and loans to self-employed and small business customers of our private and retail business.
— Our corporate credit exposure consists of all exposures not defined as consumer credit exposure.

Deutsche Bank 01 – Management Report 79 Financial Report 2011 Risk Report
Corporate Credit Exposure The following table breaks down several of our main corporate credit exposure categories according to the creditworthiness categories of our counterparties.
Dec 31, 2011
in € m. Loans
1
Irrevocable lending commitments
2 Contingent liabilities OTC derivatives
3 Debt securities available for sale Total
AAA-AA 51,321 21,152 6,535 37,569 22,753 139,330 A 45,085 37,894 24,410 17,039 8,581 133,009 BBB 59,496 36,659 21,002 12,899 5,109 135,165 BB 50,236 21,067 13,986 7,478 2,303 95,070 B 17,650 9,152 6,051 3,007 263 36,123 CCC and below 18,148 2,071 1,669 1,632 371 23,891
Total 241,936 127,995 73,653 79,624 39,380 562,588 1 Includes impaired loans mainly in category CCC and below amounting to € 6.0 billion as of December 31, 2011. 2 Includes irrevocable lending commitments related to consumer credit exposure of € 9.2 billion as of December 31, 2011. 3 Includes the effect of netting agreements and cash collateral received where applicable.
Dec 31, 2010
in € m. Loans
1
Irrevocable lending commitments
2 Contingent liabilities OTC derivatives
3 Debt securities available for sale Total
AAA-AA 62,603 23,068 7,334 23,967 28,881 145,853 A 48,467 31,945 21,318 16,724 7,789 126,243 BBB 56,096 36,542 20,391 8,408 5,128 126,565 BB 44,809 22,084 11,546 7,905 2,390 88,734 B 12,594 7,775 5,454 2,960 632 29,415 CCC and below 17,425 2,467 2,012 2,341 1,394 25,639
Total 241,994 123,881 68,055 62,305 46,214 542,449 1 Includes impaired loans mainly in category CCC and below amounting to € 3.6 billion as of December 31, 2010. 2 Includes irrevocable lending commitments related to consumer credit exposure of € 4.5 billion as of December 31, 2010. 3 Includes the effect of netting agreements and cash collateral received where applicable.
The size of the corporate loan book and level of irrevocable lending commitments and contingent liabilities remained materially consistent with December 31, 2010. The portion of our corporate credit exposure carry-ing an investment-grade rating decreased from 73 % as of December 31, 2010 to 72 % as of December 31, 2011, remaining stable despite challenging macroeconomic environment. The loan exposure shown in the table above does not take into account any collateral, other credit enhancement or credit risk mitigating trans-actions. After consideration of such credit mitigants, we believe that our loan book is well-diversified. The in-crease in our OTC derivatives exposure, primarily took place in relation to investment grade counterparties. The OTC derivatives exposure does not include credit risk mitigants (other than master agreement netting) or collateral (other than cash). Taking these mitigants into account, we believe that the remaining current credit exposure was significantly lower, adequately structured, enhanced or well-diversified and geared towards in-vestment grade counterparties. Our debt securities available for sale decreased in relation to December 31, 2010, reflecting risk reduction in particular with respect to sovereign exposures.

Deutsche Bank 01 – Management Report 80 Financial Report 2011 Risk Report
Risk Mitigation for the Corporate Credit Exposure Our Loan Exposure Management Group (“LEMG”) helps mitigate the risk of our corporate credit exposures. The notional amount of LEMG’s risk reduction activities increased by 1 % from € 54.9 billion as of December 31, 2010, to € 55.3 billion as of December 31, 2011.
As of year-end 2011, LEMG held credit derivatives with an underlying notional amount of € 37.6 billion. The position totaled € 34.6 billion as of December 31, 2010. The credit derivatives used for our portfolio manage-ment activities are accounted for at fair value.
LEMG also mitigated the credit risk of € 17.7 billion of loans and lending-related commitments as of December 31, 2011, through synthetic collateralized loan obligations supported predominantly by financial guarantees and, to a lesser extent, credit derivatives for which the first loss piece has been sold. This position totaled € 20.3 billion as of December 31, 2010.
LEMG has elected to use the fair value option under IAS 39 to report loans and commitments at fair value, provided the criteria for this option are met. The notional amount of LEMG loans and commitments reported at fair value decreased during the year to € 48.3 billion as of December 31, 2011, from € 53.4 billion as of De-cember 31, 2010. By reporting loans and commitments at fair value, LEMG has significantly reduced profit and loss volatility that resulted from the accounting mismatch that existed when all loans and commitments were reported at historical cost while derivative hedges were reported at fair value.
Consumer Credit Exposure The following table presents our total consumer credit exposure, consumer loan delinquencies in terms of loans that are 90 days or more past due, and net credit costs, which are the net provisions charged during the period, after recoveries. Loans 90 days or more past due and net credit costs are both expressed as a percen-tage of total exposure. Regardless of the past due status of the individual loans, in terms of credit quality the mortgage lending and loans to small business customers within the consumer credit exposure are allocated to our lower risk bucket while the consumer finance business is allocated to the moderate risk bucket. This credit risk quality aspect is also reflected by our net credit costs expressed as a percentage of the total exposure supporting them, which is the main credit risk management instrument for these exposures.

Deutsche Bank 01 – Management Report 81 Financial Report 2011 Risk Report
Total exposure in € m.
90 days or more past due as a % of total exposure
1 Net credit costs as a % of total exposure
2
Dec 31, 2011 Dec 31, 2010 Dec 31, 2011 Dec 31, 2010 Dec 31, 2011 Dec 31, 2010
Consumer credit exposure Germany: 135,069 130,317 0.95 % 0.83 % 0.49 % 0.56 %
Consumer and small business financing 19,805 19,055 1.88 % 2.11 % 1.55 % 1.92 % Mortgage lending 115,264 111,262 0.79 % 0.61 % 0.31 % 0.20 %
Consumer credit exposure outside Germany 39,672 38,713 3.93 % 3.27 % 0.61 % 0.86 %
Consumer and small business financing 13,878 13,361 7.22 % 6.39 % 1.31 % 1.96 % Mortgage lending 25,794 25,352 2.15 % 1.63 % 0.23 % 0.13 %
Total consumer credit exposure
3 174,741 169,030 1.63 % 1.39 % 0.52 % 0.66 % 1 As the acquired Postbank loans were initially consolidated at their fair values with a new cash flow expectation, the contractual past due status of acquired loans
is not considered for disclosure purposes. Accordingly, the overall 90 days or more past due ratio reduced when calculated for the combined portfolio as disclosed in 2010, compared to past due ratios for Deutsche Bank excluding Postbank. As a result of this disclosure practice, the combine past due ration in 2011 increased compared to 2010, predominantly because Postbank loans becoming 90 days or more past due since acquisition are not offset by acquired past due Postbank loans with an improved past due status. For Deutsche Bank excluding Postbank, the 90 days or more past due ratio for the total consumer credit exposure remained flat.
2 Ratios per December 31, 2010 refer to Deutsche Bank Group excluding immaterial provisions at Postbank since consolidation, while ratios for December 31, 2011 refer to Deutsche Bank Group including Postbank. Increases in the present value of acquired loans, representing releases of allowances for credit losses established prior to their consolidation at the consolidated entities, are not included but recorded through net interest income (for detailed description see next section “IFRS Impaired Loans”. Taking such amounts into account, the net credit costs as a percentage of total exposure would amount to 0.42 % as of December 31, 2011.
3 Includes impaired loans amounting to € 3.4 billion as of December 31, 2011 and € 2.7 billion as of December 31, 2010.
The volume of our total consumer credit exposure increased by € 5.7 billion, or 3.4 % from year-end 2010 to December 31, 2011. This increase included net exposure increases of € 2.1 billion at Postbank, where increases of € 3.2 billion in Germany were partially offset by reductions of € 1.1 billion outside Germany mainly driven by a portfolio sale. The increase in Germany principally reflected a changed allocation of exposures from corporate to consumer credit exposure within Postbank. The increase of the 90 days or more past due ratio in Germany is driven by the Postbank consolidation. In 2010, the acquired Postbank loans were consolidated with no exposure past due reflecting their status as performing assets at consolidation, which significantly reduced the 90 days or more past due ratio of the combined portfolios that year. This year, the ratio increased compared to 2010 as Postbank loans becoming 90 days or more past due since acquisition are not offset by acquired Postbank loans with an improved past due status. Overall the portfolio quality in Germany improved further, as also evidenced by the improvement in the 90 days or more past due ratio excluding above Postbank effect from 1.77 % in 2010 to 1.58 % this year.
The increase in this ratio in our consumer credit exposure outside Germany is also due to the above consolidation effect, in addition to the effect of changes in charge-off criteria in 2009 which increases the time to full charge-off for certain portfolios. This effect will continue to increase the 90 days or more past due ratio until the portfolio will reach its steady state again, approximately 5 years after the change in charge-off criteria.
The volume of our consumer credit exposure excluding Postbank rose by € 3.6 billion, or 3.9 %, from year-end 2010 to December 31, 2011, mainly driven by our mortgage lending activities. The increase results from volume growth of our portfolio in Germany (up € 1.6 billion) as well as outside Germany (up € 2.0 billion) with strong growth in Italy (up € 981 million), Portugal (up € 491 million) and Poland (up € 420 million). Despite the volume growth, previously initiated measures, e.g. alignments of credit approval parameters and restructuring of collection activities, led to a reduction of net credit costs in all regions, especially in Germany and Poland. In addition Germany was positively impacted by a portfolio sale in the first quarter 2011. This improvement in portfolio quality is reflected in the reduction of the net credit costs as percentage of total exposure excluding Postbank from 0.66 % at year-end 2010 to 0.45 % at December 31, 2011.
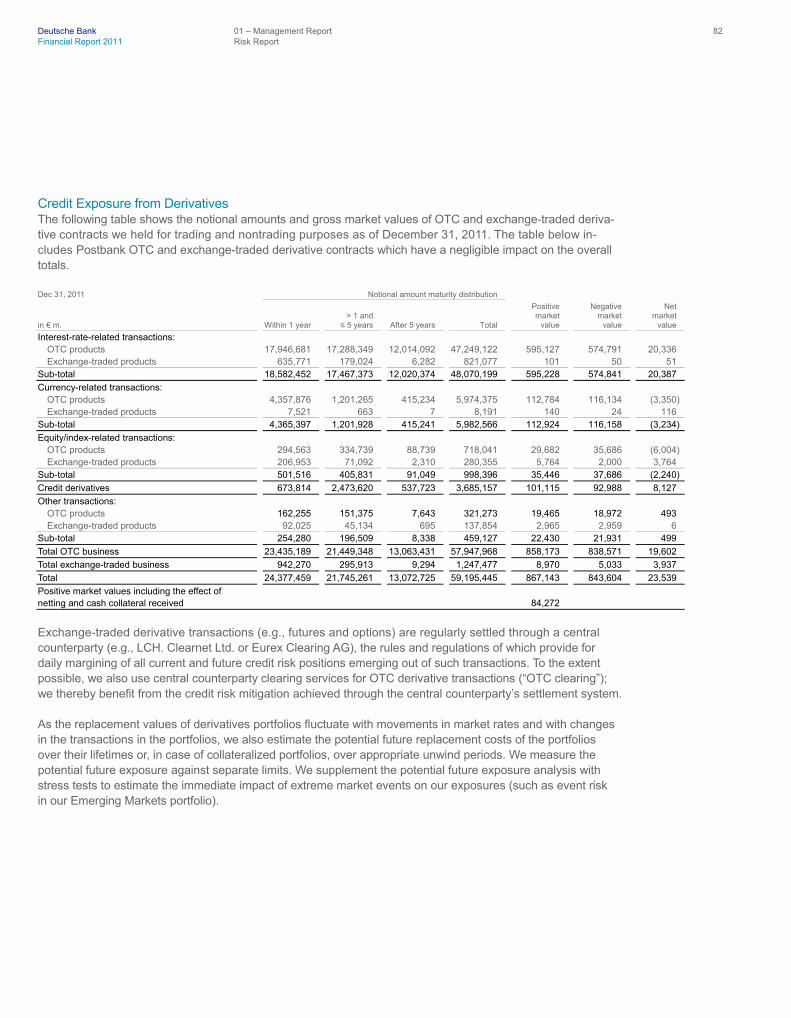
Deutsche Bank 01 – Management Report 82 Financial Report 2011 Risk Report
Credit Exposure from Derivatives The following table shows the notional amounts and gross market values of OTC and exchange-traded deriva-tive contracts we held for trading and nontrading purposes as of December 31, 2011. The table below in-cludes Postbank OTC and exchange-traded derivative contracts which have a negligible impact on the overall totals.
Dec 31, 2011 Notional amount maturity distribution
in € m. Within 1 year > 1 and ≤ 5 years After 5 years Total
Positive market value
Negative market value
Net market value
Interest-rate-related transactions: OTC products 17,946,681 17,288,349 12,014,092 47,249,122 595,127 574,791 20,336 Exchange-traded products 635,771 179,024 6,282 821,077 101 50 51
Sub-total 18,582,452 17,467,373 12,020,374 48,070,199 595,228 574,841 20,387
Currency-related transactions: OTC products 4,357,876 1,201,265 415,234 5,974,375 112,784 116,134 (3,350)Exchange-traded products 7,521 663 7 8,191 140 24 116
Sub-total 4,365,397 1,201,928 415,241 5,982,566 112,924 116,158 (3,234)
Equity/index-related transactions: OTC products 294,563 334,739 88,739 718,041 29,682 35,686 (6,004)Exchange-traded products 206,953 71,092 2,310 280,355 5,764 2,000 3,764
Sub-total 501,516 405,831 91,049 998,396 35,446 37,686 (2,240)
Credit derivatives 673,814 2,473,620 537,723 3,685,157 101,115 92,988 8,127
Other transactions: OTC products 162,255 151,375 7,643 321,273 19,465 18,972 493 Exchange-traded products 92,025 45,134 695 137,854 2,965 2,959 6
Sub-total 254,280 196,509 8,338 459,127 22,430 21,931 499
Total OTC business 23,435,189 21,449,348 13,063,431 57,947,968 858,173 838,571 19,602
Total exchange-traded business 942,270 295,913 9,294 1,247,477 8,970 5,033 3,937
Total 24,377,459 21,745,261 13,072,725 59,195,445 867,143 843,604 23,539
Positive market values including the effect of netting and cash collateral received 84,272
Exchange-traded derivative transactions (e.g., futures and options) are regularly settled through a central counterparty (e.g., LCH. Clearnet Ltd. or Eurex Clearing AG), the rules and regulations of which provide for daily margining of all current and future credit risk positions emerging out of such transactions. To the extent possible, we also use central counterparty clearing services for OTC derivative transactions (“OTC clearing”); we thereby benefit from the credit risk mitigation achieved through the central counterparty’s settlement system.
As the replacement values of derivatives portfolios fluctuate with movements in market rates and with changes in the transactions in the portfolios, we also estimate the potential future replacement costs of the portfolios over their lifetimes or, in case of collateralized portfolios, over appropriate unwind periods. We measure the potential future exposure against separate limits. We supplement the potential future exposure analysis with stress tests to estimate the immediate impact of extreme market events on our exposures (such as event risk in our Emerging Markets portfolio).

Deutsche Bank 01 – Management Report 83 Financial Report 2011 Risk Report
The potential future exposure measure which we use is generally given by a time profile of simulated positive market values of each counterparty’s derivatives portfolio, for which netting and collateralization are considered. For limit monitoring we employ the 95th quantile of the resulting distribution of market values, internally referred to as potential future exposure (“PFE”). The average exposure profiles generated by the same calculation process are used to derive the so-called average expected exposure (“AEE”) measure, which we use to reflect expected future replacement costs within our credit risk economic capital, and the expected positive exposure (“EPE”) measure driving our regulatory capital requirements. While AEE and EPE are generally calculated with respect to a time horizon of one year, the PFE is measured over the entire lifetime of a transaction or netting set for uncollateralized portfolios and over an appropriate unwind period for collateralized portfolios, respec-tively. We also employ the aforementioned calculation process to derive stressed exposure results for input into our credit portfolio stress testing.
Credit Exposure from Nonderivative Trading Assets The following table shows details about the composition of our nonderivative trading assets for the dates speci-fied.
in € m. Dec 31, 2011 Dec 31, 2010
Government paper & agencies 95,336 92,866 Financial institutions & corporates 56,442 73,711 Equities 59,754 66,868 Traded loans 18,039 23,080 Other 11,353 14,766
Total nonderivative trading assets 240,924 271,291
Traded credit products such as bonds in our trading book (excluding Postbank) are managed by a dedicated risk management unit combining our credit and market risk expertise. We use appropriate portfolio limits and ratings-driven thresholds on single-issuer basis, combined with our market risk management tools to risk man-age such positions.
As of December 31, 2011 traded loans included commercial real estate whole loans of € 2.3 billion and leve-raged finance loans of € 967 million (€ 3.0 billion and € 1.5 billion as of December 31, 2010, respectively). In addition to these exposures, the Group had related exposures to irrevocable lending commitments in the leve-raged finance business of € 633 million as of December 31, 2011 (€ 755 million as of December 31, 2010).
Distribution Risk Management We frequently underwrite commitments with the intention to sell down or distribute part of the risk to third par-ties. These commitments include the undertaking to fund bank loans and to provide bridge loans for the issu-ance of public bonds. The risk is that we may not be successful in the distribution of the facilities. In this case, we would have to hold more of the underlying risk than intended for longer periods of time than originally in-tended.
For risk management purposes we treat the full amount of all such commitments as credit exposure requiring credit approval. This approval also includes our intended final hold. Amounts which we intend to sell are classified as trading assets and are subject to fair value accounting. The price volatility is monitored in our market risk process. We protect the value of these assets against adverse market movements via adequate credit docu-mentation for these transactions and market risk hedges (most commonly using related indices), which are also captured in our market risk process.

Deutsche Bank 01 – Management Report 84 Financial Report 2011 Risk Report
Past Due Loans The following table breaks down the nonimpaired past due loan exposure carried at amortized cost according to its past due status, including nonimpaired loans past due more than 90 days but where there is no concern over the creditworthiness of the counterparty.
in € m. Dec 31, 2011 Dec 31, 2010
Loans less than 30 days past due 4,394 4,092 Loans 30 or more but less than 60 days past due 958 973 Loans 60 or more but less than 90 days past due 420 384 Loans 90 days or more past due 907 981
Total loans past due but not impaired 6,678 6,430
The following table presents the aggregated value of collateral – with the fair values of collateral capped at loan outstandings – held by us against our loans past due but not impaired.
in € m. Dec 31, 2011 Dec 31, 2010
Financial and other collateral 3,973 3,484 Guarantees received 158 244
Total collateral held for loans past due but not impaired 4,131 3,728
Impaired Loans Credit Risk Management regularly assesses whether there is objective evidence that a loan or group of loans is impaired. A loan or group of loans is impaired and impairment losses are incurred if:
— there is objective evidence of impairment as a result of a loss event that occurred after the initial recogni-tion of the asset and up to the balance sheet date (a “loss event”),
— the loss event had an impact on the estimated future cash flows of the financial asset or the group of fi-nancial assets, and
— a reliable estimate of the loss amount can be made.
Credit Risk Management’s loss assessments are subject to regular review in collaboration with Group Finance. The results of this review are reported to and approved by an oversight committee comprised of Group Fi-nance and Risk senior management.
Within consolidations we acquired certain loans for which an impairment had been established beforehand by the consolidated entities. These loans were taken onto our balance sheet at their fair values as determined by their expected cash flows which reflected the credit quality of these loans at the time of acquisition. As long as our cash flow expectations regarding these loans have not deteriorated since acquisition, they are not consid-ered impaired loans.

Deutsche Bank 01 – Management Report 85 Financial Report 2011 Risk Report
Impairment Loss and Allowance for Loan Losses If there is evidence of impairment the impairment loss is generally calculated on the basis of discounted ex-pected cash flows using the original effective interest rate of the loan. If the terms of a loan are renegotiated or otherwise modified because of financial difficulties of the borrower without qualifying for a derecognition of the loan, the impairment loss is measured using the original effective interest rate before modification of terms. We reduce the carrying amount of the impaired loan by the use of an allowance account and recognize the amount of the loss in the consolidated statement of income as a component of the provision for credit losses. We re-cord increases to our allowance for loan losses as an increase of the provision for loan losses in our income statement. Charge-offs reduce our allowance while recoveries, if any, are credited to the allowance account. If we determine that we no longer require allowances which we have previously established, we decrease our allowance and record the amount as a reduction of the provision for loan losses in our income statement.
While we assess the impairment for our corporate credit exposures individually, we assess the impairment of our smaller-balance standardized homogeneous loans collectively.
The loan loss provisioning methodology for the majority of our Private & Business Client portfolio is based on statistical models. Our loan portfolio is divided into homogenous and non-homogeneous parts. These parts are further differentiated into sub-portfolios based on the nature of the exposure and the type of the customer. Using historical data the level of loan loss provision for the homogeneous portfolio is automatically calculated using statistical models, based on allowance rates for each respective arrears class (days past due). The non-homogeneous portfolio is characterized by large credit facilities or certain loan categories which are not com-parable due to their size, complexity or quality. These credit facilities undergo a case by case review on a regu-lar basis and once it has been determined that an impairment loss has been incurred, a loan loss allowance is determined according to an expected loss methodology.
Postbank’s methodology for establishing loan loss allowances is similar to ours. Exceptions include the fact that Postbank executes direct charge-offs without first establishing a loan loss allowance and the fact that the loan loss allowances in its retail mortgage portfolio are assessed individually for loans being 180 days or more past due. In reflecting Postbank in our consolidated results, the effects of the aforementioned differences have been aligned to our policies for reporting purposes.
Loan loss allowances established for acquired loans prior to their consolidation, have not been consolidated into our stock of loan loss allowances. Instead, we have considered these loan loss allowances in determining the fair value representing the cost basis of the newly consolidated loans. We reflect subsequent improve-ments in the credit quality of these loans as an appreciation in their carrying value with a corresponding gain recognized in net interest income. Loan loss allowances we establish for acquired loans after their consolida-tion, however, are included in our provision for credit losses and loan loss allowances.

Deutsche Bank 01 – Management Report 86 Financial Report 2011 Risk Report
When it is considered that there is no realistic prospect of recovery and all collateral has been realized or trans-ferred to us, the loan and any associated allowance for loan losses is charged off (the loan and the related allowance for loan losses are removed from the balance sheet). Individually significant loans where specific allowance for loan losses is in place are evaluated at least quarterly on a case-by-case basis. For this category of loans, the number of days past due is an indicator for a charge off but is not a determining factor. A charge off will only take place after considering all relevant information, such as the occurrence of a significant change in the borrower's financial position such that the borrower can no longer pay the obligation, or the proceeds from the collateral are insufficient to completely satisfy the current carrying amount of the loan.
For collectively assessed loans, which are primarily mortgages and consumer finance loans, the timing of a charge off depends on whether there is any underlying collateral and our estimate of the amount collectible. For mortgage loans, the portion of the loan which is uncollateralised is charged off when the mortgage be-comes 840 days past due, at the latest. For consumer finance loans, we write off any portion of the balance which we do not expect to collect at 180 days past due, for credit card receivables, and 270 days past due, for other consumer finance loans.
The following tables present a breakdown of our impaired loans, the components of our allowance for loan losses and the respective coverage ratios by region based on the country of domicile of our counterparties for the dates specified.
Dec 31, 2011 Impaired Loans Loan loss allowance
in € m. Individually assessed
Collectively assessed
Total Individually assessed
Collectively assessed
Total
Impaired loan coverage ratio in %
Germany 1,750 1,474 3,224 832 821 1,653 51 Western Europe (excluding Germany) 2,910 1,675 4,585 841 955 1,796 39 Eastern Europe 52 189 241 36 182 218 90 North America 999 75 1,074 193 153 345 32 Central and South America 40 0 40 28 6 35 86 Asia/Pacific 267 3 270 81 25 106 39 Africa 0 0 0 0 3 3 − Other − 0 0 − 6 6 −
Total 6,018 3,416 9,434 2,011 2,150 4,162 44
Dec 31, 2010 Impaired Loans Loan loss allowance
in € m. Individually assessed
Collectively assessed
Total Individually assessed
Collectively assessed
Total
Impaired loan coverage ratio in %
Germany 996 1,010 2,006 559 453 1,012 50 Western Europe (excluding Germany) 1,153 1,441 2,594 640 997 1,637 63 Eastern Europe 22 245 267 6 186 192 72 North America 1,146 4 1,150 339 4 343 30 Central and South America 43 − 43 27 − 27 63 Asia/Pacific 169 13 182 68 13 81 45 Africa 23 − 23 4 − 4 17 Other − − − − − − −
Total 3,552 2,713 6,265 1,643 1,653 3,296 53

Deutsche Bank 01 – Management Report 87 Financial Report 2011 Risk Report
The following tables present a breakdown of our impaired loans, the components of our allowance for loan losses and the respective coverage ratios by industry sector of our counterparties for the dates specified.
Dec 31, 2011 Impaired Loans Loan loss allowance
in € m. Individually assessed
Collectively assessed Total
Individually assessed
Collectively assessed Total
Impaired loan coverage ratio in %
Banks and insurance 91 0 91 98 16 114 126 Fund management activities 917 0 917 322 211 533 58 Manufacturing 616 162 778 364 158 522 67 Wholesale and retail trade 324 138 462 164 108 272 59 Households 394 2,616 3,010 155 1,409 1,565 52 Commercial real estate activities 2,582 224 2,806 424 68 492 18 Public sector − 0 0 − 1 1 − Other 1,094 276 1,370 484 179 663 48
Total 6,018 3,416 9,434 2,011 2,150 4,162 44
Dec 31, 2010 Impaired Loans Loan loss allowance
in € m. Individually assessed
Collectively assessed
Total
Individually assessed
Collectively assessed
Total
Impaired loan coverage ratio in %
Banks and insurance 81 − 81 82 − 82 100 Fund management activities 841 − 841 298 97 395 41 Manufacturing 603 139 742 332 125 457 62 Wholesale and retail trade 199 113 312 147 111 258 83 Households 163 1,810 1,973 105 965 1,070 54 Commercial real estate activities 740 229 969 259 83 342 35 Public sector − − − − − − − Other 925 422 1,347 420 272 692 56
Total 3,552 2,713 6,265 1,643 1,653 3,296 53
Total impaired loans increased in 2011 by € 3.2 billion or 51 % mainly due to € 1.8 billion new impaired loans from Postbank and two commercial real estate cases in Western Europe (excluding Germany) for which we had to record only small impairment losses.
These movements led to gross increases of € 3.0 billion individually assessed impaired loans, mainly in the commercial real estate sector, partially offset by charge-offs of € 553 million. Our collectively assessed im-paired loans showed gross increases of € 1.2 billion mainly driven by retail portfolios at Postbank as well as increases in our portfolios in Western Europe and U.S., partially offset by € 512 million charge-offs.
Our impaired loans included € 1.5 billion among the loans reclassified to loans and receivables in accordance with IAS 39. For these loans we recorded € 467 million gross increases in impaired loans, partially offset by charge-offs of € 224 million.
Our commitments to lend additional funds to debtors with impaired loans amounted to € 168 million as of December 31, 2011 and € 123 million as of December 31, 2010.
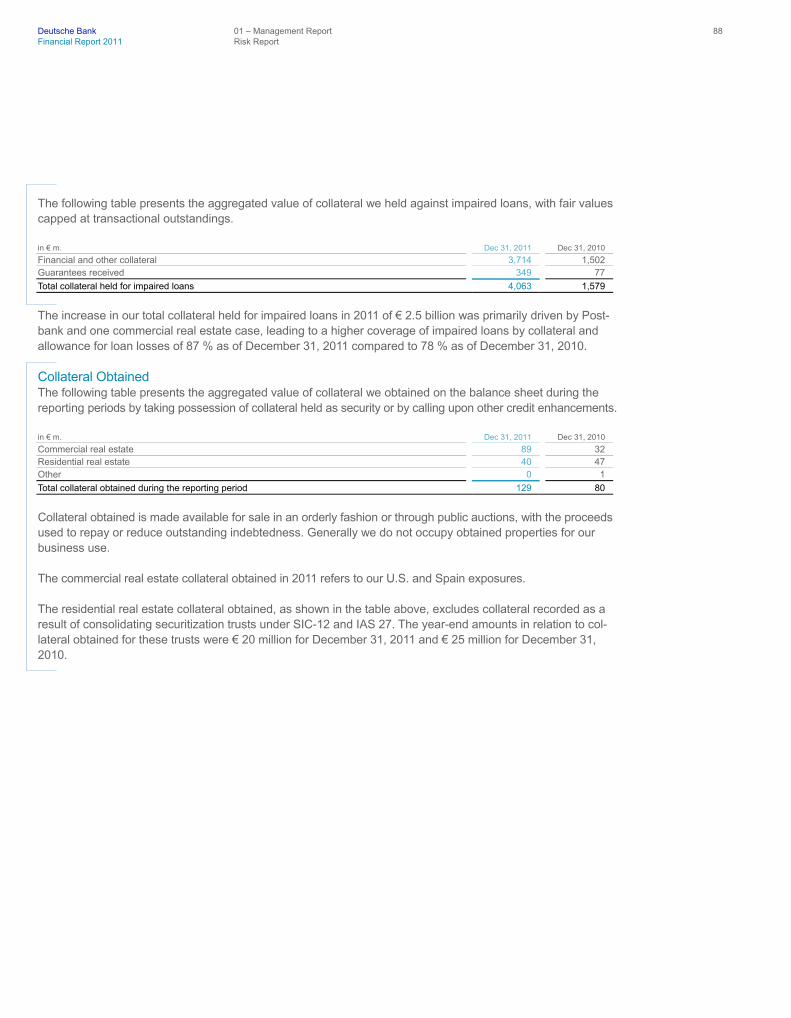
Deutsche Bank 01 – Management Report 88 Financial Report 2011 Risk Report
The following table presents the aggregated value of collateral we held against impaired loans, with fair values capped at transactional outstandings.
in € m. Dec 31, 2011 Dec 31, 2010
Financial and other collateral 3,714 1,502 Guarantees received 349 77
Total collateral held for impaired loans 4,063 1,579
The increase in our total collateral held for impaired loans in 2011 of € 2.5 billion was primarily driven by Post-bank and one commercial real estate case, leading to a higher coverage of impaired loans by collateral and allowance for loan losses of 87 % as of December 31, 2011 compared to 78 % as of December 31, 2010.
Collateral Obtained The following table presents the aggregated value of collateral we obtained on the balance sheet during the reporting periods by taking possession of collateral held as security or by calling upon other credit enhancements.
in € m. Dec 31, 2011 Dec 31, 2010
Commercial real estate 89 32 Residential real estate 40 47 Other 0 1
Total collateral obtained during the reporting period 129 80
Collateral obtained is made available for sale in an orderly fashion or through public auctions, with the proceeds used to repay or reduce outstanding indebtedness. Generally we do not occupy obtained properties for our business use.
The commercial real estate collateral obtained in 2011 refers to our U.S. and Spain exposures.
The residential real estate collateral obtained, as shown in the table above, excludes collateral recorded as a result of consolidating securitization trusts under SIC-12 and IAS 27. The year-end amounts in relation to col-lateral obtained for these trusts were € 20 million for December 31, 2011 and € 25 million for December 31, 2010.

Deutsche Bank 01 – Management Report 89 Financial Report 2011 Risk Report
Movements in the Allowance for Loan Losses The following table presents a breakdown of the movements in our allowance for loan losses for the periods specified.
2011 2010
in € m. Individually assessed
Collectively assessed
Total
Individually assessed
Collectively assessed
Total
Balance, beginning of year 1,643 1,653 3,296 2,029 1,313 3,343
Provision for loan losses 907 925 1,832 562 751 1,313 Net charge-offs: (512) (385) (897) (896) (404) (1,300)
Charge-offs (553) (512) (1,065) (934) (509) (1,443) Recoveries 41 127 168 38 104 143
Changes in the group of consolidated companies − (0) (0) − − − Exchange rate changes/other (26) (43) (69) (53) (6) (60)
Balance, end of year 2,011 2,150 4,162 1,643 1,653 3,296
The following table sets forth a breakdown of the movements in our allowance for loan losses specifically for charge-offs and recoveries, including, with respect to our German loan portfolio, by industry classifications for the periods specified. The breakdown between German and non-German borrowers is based on the country of domicile of our borrowers.
in € m. (unless stated otherwise) 2011 2010
Balance, beginning of year 3,296 3,343
Charge-offs: German:
Banks and insurance (2) (5) Fund management activities − − Manufacturing (93) (43) Wholesale and retail trade (26) (32) Households (excluding mortgages) (273) (338) Households – mortgages (26) (26) Commercial real estate activities (13) (22) Public sector (0) − Other (112) (49)
German total (546) (515) Non-German total (519) (928) Total charge-offs (1,065) (1,443) Recoveries: German:
Banks and insurance 1 1 Fund management activities − − Manufacturing 18 14 Wholesale and retail trade 8 6 Households (excluding mortgages) 93 63 Households – mortgages 1 4 Commercial real estate activities 3 4 Public sector 0 − Other 17 20
German total 142 112 Non-German total 26 31 Total recoveries 168 143 Net charge-offs (897) (1,300) Provision for loan losses 1,832 1,313 Other changes (e.g. exchange rate changes, changes in the group of consolidated companies) (69) (60) Balance, end of year 4,162 3,296 Percentage of total net charge-offs to average loans for the year 0.22 % 0.45 %

Deutsche Bank 01 – Management Report 90 Financial Report 2011 Risk Report
In a weakening economic environment our credit standards kept new provision for loan losses well under con-trol. This included a pro-active management of the homogeneous retail portfolios as well as strict underwriting standards in Corporate Banking & Securities avoiding undue risk concentrations. While focusing on strong quality of our credit portfolio, we have continued the de-risking of higher risk assets.
Our allowance for loan losses as of December 31, 2011 was € 4.2 billion, a 26 % increase from prior year end. The increase in our allowance was principally due to increased new provisions following the first full year con-solidation of Postbank and lower net charge-offs compared to the prior year.
Our net charge-offs amounted to € 897 million in 2011. Of the charge-offs for 2011, € 512 million were related to our corporate credit exposure, of which € 224 million were related to assets which had been reclassified in accordance with IAS 39 in our North America and United Kingdom portfolios, and € 385 million to our con-sumer credit exposure, mainly driven by our German portfolios.
Our provision for loan losses in 2011 was € 1.8 billion, principally driven by € 907 million for our corporate credit exposures, of which € 188 million of new provisions were established relating to assets which had been reclassified in accordance with IAS 39 in Markets and Corporate Finance. The remaining increase reflected impairment charges taken on a number of exposures in the Americas and in Europe in an overall challenging global economic credit environment. Loan loss provisions in our collectively assessed exposure amounted to € 925 million, a 23 % increase from prior year end. This increase in our provisions for loan losses was driven by Postbank, which’s risk cost are for the first time reflected for a full year in our Group accounts. Excluding Postbank, the loan loss provisions in our collectively assessed exposure was reduced due to our retail busi-ness in Germany which contributed lower provisions, despite the challenging economic environment.
Our individually assessed loan loss allowance was € 2.0 billion as of December 31, 2011. The € 368 million increase in 2011 comprises net provisions of € 907 million (including the aforementioned impact from IAS 39 reclassifications), net charge-offs of € 512 million and a € 26 million decrease from currency translation and unwinding effects.
Our collectively assessed loan loss allowance totaled € 2.2 billion as of December 31, 2011, representing an increase of € 497 million against the level reported for the end of 2010 (€ 1.7 billion). Movements in this com-ponent comprised a € 925 million provision, being partially offset by € 385 million net charge-offs and a € 43 million net decrease from currency translation and unwinding effects.
Our allowance for loan losses as of December 31, 2010 was € 3.3 billion, a 1 % decrease from prior year end. The decrease in our allowance was principally due to charge-offs, reductions resulting from currency translation and unwinding effects exceeding our provisions.
Our net charge-offs amounted to € 1.3 billion in 2010. Of the charge-offs for 2010, € 896 million were related to our corporate credit exposure, of which € 607 million were related to assets which had been reclassified in accordance with IAS 39 in our United Kingdom and Asia-Pacific portfolios, and € 404 million to our consumer credit exposure, mainly driven by our German portfolios.
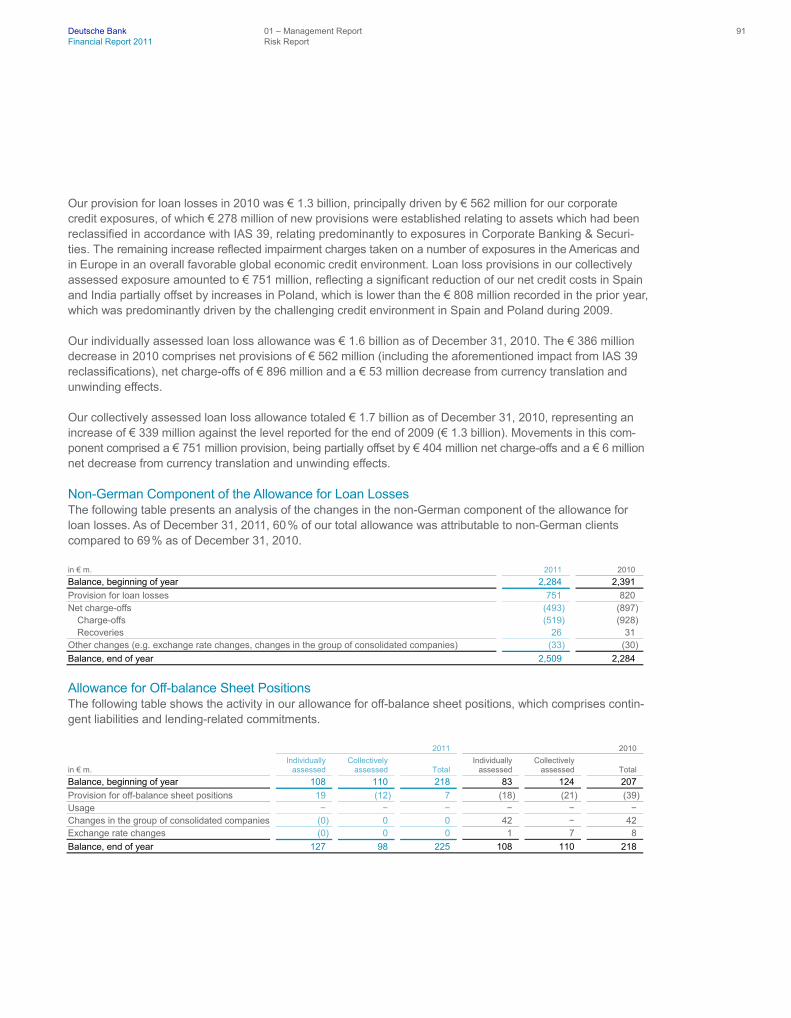
Deutsche Bank 01 – Management Report 91 Financial Report 2011 Risk Report
Our provision for loan losses in 2010 was € 1.3 billion, principally driven by € 562 million for our corporate credit exposures, of which € 278 million of new provisions were established relating to assets which had been reclassified in accordance with IAS 39, relating predominantly to exposures in Corporate Banking & Securi-ties. The remaining increase reflected impairment charges taken on a number of exposures in the Americas and in Europe in an overall favorable global economic credit environment. Loan loss provisions in our collectively assessed exposure amounted to € 751 million, reflecting a significant reduction of our net credit costs in Spain and India partially offset by increases in Poland, which is lower than the € 808 million recorded in the prior year, which was predominantly driven by the challenging credit environment in Spain and Poland during 2009.
Our individually assessed loan loss allowance was € 1.6 billion as of December 31, 2010. The € 386 million decrease in 2010 comprises net provisions of € 562 million (including the aforementioned impact from IAS 39 reclassifications), net charge-offs of € 896 million and a € 53 million decrease from currency translation and unwinding effects.
Our collectively assessed loan loss allowance totaled € 1.7 billion as of December 31, 2010, representing an increase of € 339 million against the level reported for the end of 2009 (€ 1.3 billion). Movements in this com-ponent comprised a € 751 million provision, being partially offset by € 404 million net charge-offs and a € 6 million net decrease from currency translation and unwinding effects.
Non-German Component of the Allowance for Loan Losses The following table presents an analysis of the changes in the non-German component of the allowance for loan losses. As of December 31, 2011, 60 % of our total allowance was attributable to non-German clients compared to 69 % as of December 31, 2010.
in € m. 2011 2010
Balance, beginning of year 2,284 2,391
Provision for loan losses 751 820 Net charge-offs (493) (897)
Charge-offs (519) (928) Recoveries 26 31
Other changes (e.g. exchange rate changes, changes in the group of consolidated companies) (33) (30)
Balance, end of year 2,509 2,284
Allowance for Off-balance Sheet Positions The following table shows the activity in our allowance for off-balance sheet positions, which comprises contin-gent liabilities and lending-related commitments.
2011 2010
in € m. Individually assessed
Collectively assessed
Total Individually assessed
Collectively assessed
Total
Balance, beginning of year 108 110 218 83 124 207
Provision for off-balance sheet positions 19 (12) 7 (18) (21) (39) Usage − − − − − − Changes in the group of consolidated companies (0) 0 0 42 − 42 Exchange rate changes (0) 0 0 1 7 8
Balance, end of year 127 98 225 108 110 218

Deutsche Bank 01 – Management Report 92 Financial Report 2011 Risk Report
Our allowance for off-balance sheet positions was slightly increased by € 7 million to € 225 million as of De-cember 31, 2011. In 2010, we recorded changes in the group of consolidated companies for off-balance sheet allowances following the consolidation of acquisitions amounting to € 34 million for Postbank and € 8 million for Sal. Oppenheim/BHF-BANK.
Treatment of Default Situations under Derivatives Unlike standard loan assets, we generally have more options to manage the credit risk in our OTC derivatives when movement in the current replacement costs of the transactions and the behavior of our counterparty indicate that there is the risk that upcoming payment obligations under the transactions might not be honored. In these situations, we are frequently able under prevailing contracts to obtain additional collateral or terminate the transactions or the related master agreement at short notice.
Derivatives – Credit Valuation Adjustment We establish a counterparty credit valuation adjustment for OTC derivative transactions to cover expected credit losses. The adjustment amount is determined at each reporting date by assessing the potential credit exposure to all counterparties taking into account any collateral held, the effect of any master netting agree-ments, expected loss given default and the credit risk for each counterparty based on market evidence, which may include default levels implied from historic information, fundamental analysis of financial information, and CDS spreads.
The credit valuation adjustments are significant for certain monoline counterparties. For monolines with actively traded CDS, the CVA is calculated using a full CDS-based valuation model. For monolines without actively traded CDS a model based approach is used with various input factors, including relevant market driven de-fault probabilities, the likelihood of an event (either a restructuring or an insolvency), an assessment of any potential settlement in the event of a restructuring, and recovery rates in the event of either restructuring or insolvency. The monoline CVA methodology is reviewed on a quarterly basis by management; since the second quarter of 2011 market based spreads have been used more extensively in the CVA assessment.
We recorded € 1.1 billion in credit valuation adjustments against our aggregate monoline exposures as of December 31, 2011, compared to € 1.2 billion as of December 31, 2010.
The master agreements executed with our clients usually provide for a broad set of standard or bespoke termi-nation rights, which allow us to respond swiftly to a counterparty’s default or to other circumstances which indicate a high probability of failure. When our decision to terminate derivative transactions or the related mas-ter agreement results in a residual net obligation owed by the counterparty, we restructure the obligation into a non-derivative claim and manage it through our regular work-out process. As a consequence, for accounting purposes we typically do not show any nonperforming derivatives.

Deutsche Bank 01 – Management Report 93 Financial Report 2011 Risk Report
Market Risk
The vast majority of our businesses are subject to market risk, defined as the potential for change in the mar-ket value of our trading and investing positions. Risk can arise from adverse changes in interest rates, credit spreads, foreign exchange rates, equity prices, commodity prices and other relevant parameters, such as market volatility and market implied default probabilities.
Market risk arising from Postbank has been included in our reporting since 2010. Postbank conducts its own day-to-day risk management. We have a detailed understanding of Postbank’s activities and receive informa-tion regarding the types and amounts of market risks.
The primary objective of Market Risk Management, a part of our independent Risk function, is to ensure that our business units optimize the risk-reward relationship and do not expose us to unacceptable losses outside of our risk appetite. To achieve this objective, Market Risk Management works closely together with risk takers (“the business units”) and other control and support groups.
We differentiate between three substantially different types of market risk:
— Trading market risk arises primarily through the market-making activities of the Corporate & Investment Bank Group Division. This involves taking positions in debt, equity, foreign exchange, other securities and com-modities as well as in equivalent derivatives.
— Traded default risk arising from defaults and rating migrations. — Nontrading market risk arises in various forms. Equity risk arises primarily from non-consolidated strategic
investments, alternative asset investments and equity compensation. Interest rate risk stems from our non-trading asset and liability positions. Structural foreign exchange risk exposure arises from capital and re-tained earnings in non euro currencies in certain subsidiaries, and represents the bulk of foreign exchange risk in our nontrading portfolio. Other nontrading market risk elements are risks arising from asset manage-ment and fund related activities as well as model risks in Private Business Clients (“PBC”), Global Transac-tion Banking (“GTB”) and Private Wealth Management (“PWM”), which are derived by stressing assumptions of client behavior in combination with interest rate movements.
Trading Market Risk Management Framework at Deutsche Bank Group (excluding Postbank) Our primary instrument to manage trading market risk is the limit setting process. Our Management Board supported by Market Risk Management, sets group-wide value-at-risk and economic capital limits for market risk in the trading book. Market Risk Management sub-allocates this overall limit to our group divisions and individual business units within Corporate & Investment Bank Group division (e.g. Global Rates, Equity, etc.) based on anticipated business plans and risk appetite. Within the individual business units, the business heads establish business limits, by sub-allocating the overall limit down to individual portfolios or geographical regions.
Deutsche Bank 01 – Management Report 94 Financial Report 2011 Risk Report
In practice, Market Risk Management sets key limits, which tend to be global in nature, necessary to capture an exposure to a particular risk factor. Business limits are specific to various factors, including a particular geographical region or specific portfolio.
Value-at-risk and economic capital limits are used for managing all types of market risk at an overall portfolio level. As an additional and complementary tool for managing certain portfolios or risk types, Market Risk Man-agement sets sensitivity and concentration/liquidity limits.
Business units are responsible for adhering to the limits against which exposures are monitored and reported. The market risk limits set by Market Risk Management are monitored on a daily, weekly and monthly basis. Where limits are exceeded, Market Risk Management is responsible for identifying and escalating those ex-cesses, on a timely basis. The Management Board receives daily market risk reports on value-at-risk and limit usage and economic capital.
To manage the exposures inside the limits, the business units apply several risk mitigating measures, most notably the use of:
— Portfolio management: Risk diversification arises in portfolios which consist of a variety of positions. Since some investments are likely to rise in value when others decline, diversification can help to lower the over-all level of risk profile of a portfolio.
— Hedging: Hedging involves taking positions in related financial assets, including derivative products, such as futures, swaps and options. Hedging activities may not always provide effective mitigation against losses due to differences in the terms, specific characteristics or other basis risks that may exist between the hedge instrument and the exposure being hedged.
Trading Market Risk Management Framework at Postbank Postbank’s trading market risk is managed centrally by the Financial Markets division, based on defined risk limits. Aggregate limits are set by the Management Board of Postbank and allocated by the Market Risk Commit-tee to the individual operating business units as sub-limits. The allocation mechanism for market risk limits at Postbank is similar to our economic capital approach. The risk economic capital limits allocated to specific business activities define the level of market risk that is reasonable and desirable for Postbank from an earn-ings perspective.
Market risk at Postbank is monitored on a daily basis using a system of limits based on value-at-risk. In addi-tion, Postbank’s Market Risk Committee has defined sensitivity limits for the trading and banking book as well as for key sub-portfolios.
Quantitative Risk Management Tools Value-at-Risk at Deutsche Bank Group (excluding Postbank) Value-at-risk is a quantitative measure of the potential loss (in value) of trading positions due to market move-ments that will not be exceeded in a defined period of time and with a defined confidence level.

Deutsche Bank 01 – Management Report 95 Financial Report 2011 Risk Report
Our value-at-risk for the trading businesses is based on our own internal value-at-risk model. In October 1998, the German Banking Supervisory Authority (now the BaFin) approved our internal value-at-risk model for calcu-lating the regulatory market risk capital for our general and specific market risks. Since then the model has been periodically refined and approval has been maintained.
We calculate value-at-risk using a 99 % confidence level and a one day holding period. This means we estimate there is a 1 in 100 chance that a mark-to-market loss from our trading positions will be at least as large as the reported value-at-risk. For regulatory reporting, the holding period is ten days.
We use one year of historical market data to calculate value-at-risk. The calculation employs a Monte Carlo Simulation technique, and we assume that changes in risk factors follow a well-defined distribution, e.g. normal, lognormal, or non-normal (T, skew-T, Skew-Normal). To determine our aggregated value-at-risk, we use ob-served correlations between the risk factors during this one year period.
Our value-at-risk model is designed to take into account the following risk factors: interest rates, credit spreads, equity prices, foreign exchange rates and commodity prices, as well as their implied volatilities and common basis risk. The model incorporates both linear and, especially for derivatives, nonlinear effects of the risk factors on the portfolio value.
The value-at-risk measure enables us to apply a constant and uniform measure across all of our trading busi-nesses and products. It allows a comparison of risk in different businesses, and also provides a means of ag-gregating and netting positions within a portfolio to reflect correlations and offsets between different asset classes. Furthermore, it facilitates comparisons of our market risk both over time and against our daily trading results.
When using value-at-risk estimates a number of considerations should be taken into account. These include:
— The use of historical market data may not be a good indicator of potential future events, particularly those that are extreme in nature. This ‘backward-looking’ limitation can cause value-at-risk to understate risk (as in 2008), but can also cause it to be overstated.
— Assumptions concerning the distribution of changes in risk factors, and the correlation between different risk factors, may not hold true, particularly during market events that are extreme in nature. The one day holding period does not fully capture the market risk arising during periods of illiquidity, when positions cannot be closed out or hedged within one day.
— Value-at-risk does not indicate the potential loss beyond the 99th quantile. — Intra-day risk is not captured. — There may be risks in the trading book that are partially or not captured by the value-at-risk model.

Deutsche Bank 01 – Management Report 96 Financial Report 2011 Risk Report
We continually analyze potential weaknesses of our value-at-risk model using statistical techniques, such as back-testing, and also rely on risk management experience. We compare the hypothetical daily profits and losses under the buy-and-hold assumption (in accordance with German regulatory requirements) with the estimates from our value-at-risk model.
The Global Back-testing Committee, with participation from Market Risk Management, Market Risk Opera-tions, Risk Analytics and Instruments, and Finance, meets on a regular basis to review back-testing results of the Group as a whole and of individual businesses. The committee analyzes performance fluctuations and assesses the predictive power of our value-at-risk model, which allows us to improve and adjust the risk esti-mation process accordingly.
We are committed to the ongoing development of our proprietary risk models, and we allocate substantial resources to reviewing and improving them. During 2011, improvements were made to the value-at-risk calcu-lation, including:
— Index-to-constituent basis risk for credit default swaps (CDS); — Event risk for equities; and — Volatility skew for FX and commodities.
We have further developed and improved our process of systematically capturing and evaluating risks currently not captured in our value-at-risk model.
Market Risk Management validates front office models to assist in the risk management of positions. Front office quantitative risk models are subject to model risk. Market Risk Management has developed a model review process to understand, review and improve quantitative models. Market Risk Management assesses the accuracy and transparency of model risk in the quantitative pricing models used for market risk activities, including the valuation of instrument types.
The model approval and review process is performed on an annual basis and involves:
— Ensuring newly designed or recently enhanced models align to design objectives and are fit for intended business purpose;
— Verifying the mathematical integrity of the models and their implementation; — Reviewing performance of all existing models, discussing any changes in model use; — Reviewing results of ongoing calibration processes and testing, and approval of any proposed changes to
the calibration process, instruments or parameter value ranges; — Discussing inconsistent use of models for similar/same products across businesses and establish consis-
tent measures; and — Establishing strict governance around model controls and escalation to senior management of materially
relevant model risk related issues in a timely fashion.
Deutsche Bank 01 – Management Report 97 Financial Report 2011 Risk Report
New Basel 2.5 Regulatory Trading Market Risk Requirements In December 2011 we received model approvals, from the BaFin, for the stressed value-at-risk, incremental risk charge and comprehensive risk measure models. These are additional methods we use to measure mar-ket risk exposures.
— Stressed Value-at-Risk: calculates a stressed value-at-risk measure based on a continuous 1 year period of significant market stress.
— Incremental Risk Charge: captures default and migration risks in addition to the risks already captured in value-at-risk for credit-sensitive positions in the trading book.
— Comprehensive Risk Measure: captures incremental risk for the credit correlation trading portfolio calcu-lated using an internal model subject to qualitative minimum requirements as well as stress testing re-quirements.
— Market Risk Standardized Approach (MRSA): calculates regulatory capital for securitisations and nth-to-default credit derivatives.
Stressed value-at-risk, incremental risk charge and the comprehensive risk measure are calculated for all relevant portfolios. The results from the models are used in the day-to-day risk management of the bank, as well as for defining regulatory capital.
Stressed Value-at-Risk We calculate a stressed value-at-risk measure using a 99 % confidence level and a holding period of one day. For regulatory purposes, the holding period is ten days. Our calculation of stressed value-at-risk utilizes the same systems, trade information and processes as those used for the calculation of value-at-risk. The only difference is that historical market data from a period of significant financial stress (i.e. characterised by high volatilities) is used as an input for the Monte Carlo Simulation.
Incremental Risk Charge (“IRC”) The incremental risk charge is based on our own internal model and is intended to complement the value-at-risk modeling framework. It represents an estimate of the default and migration risks of unsecuritized credit products over a one-year capital horizon at a 99.9 % confidence level, taking into account the liquidity horizons of individual positions or sets of positions. We use a Monte Carlo Simulation for calculating incremental risk charge as the 99.9 % quantile of the portfolio loss distribution over a one-year horizon and for allocating contri-butory incremental risk charge to individual positions. The model captures the default and migration risk in an accurate and consistent quantitative approach for all portfolios.
We calculate the incremental risk charge on a weekly basis. The charge is determined as the higher of the most recent 12 week average of incremental risk charge and the most recent incremental risk charge. The market and position data are collected from front office systems and are subject to strict quality control. The incremental risk charge figures are closely monitored and play a significant role in the management of the portfolios covered by the incremental risk charge calculation. Additionally, the incremental risk charge provides information on the effectiveness of the hedging positions which is reviewed by the risk managers.

Deutsche Bank 01 – Management Report 98 Financial Report 2011 Risk Report
The contributory incremental risk charge of individual positions, which is calculated by allocation, provides the basis for identifying risk concentrations in the portfolio and designing strategies to reduce the overall portfo-lio risk.
We use our credit portfolio model, a core piece of our economic capital methodology, to calculate the incre-mental risk charge. Important parameters for the incremental risk charge calculation are exposures, recovery rates and default probabilities, ratings migrations, maturity, and liquidity horizons of individual positions.
Liquidity horizon settings are set to the time required to sell the position or to hedge all material relevant price risks in a stressed market. Liquidity horizons reflect our actual practice and experience during periods of sys-tematic and idiosyncratic stresses. We have defined the sets of positions used for applying liquidity horizons in a way that meaningfully reflects the differences in liquidity for each set. Risk managers who specialize in each product area have made liquidity determinations based on market conditions for each area, both currently and under periods of stress.
To quantify a loss due to rating migration, a revaluation of a position is performed under the new rating. The probability of joint rating downgrades and defaults is determined by the migration and rating correlations of the incremental risk charge model. These correlations are specified through systematic factors that represent geo-graphical regions and industries. The simulation process incorporates a rollover strategy that is based on the assumption of a constant level of risk. This assumption implies that positions that have experienced default or rating migration over their liquidity horizon are re-balanced at the end of their liquidity horizon to attain the initial level of risk. Correlations between positions with different liquidity horizons are implicitly specified by the de-pendence structure of the underlying systematic and idiosyncratic risk factors, ensuring that portfolio concen-trations are identified across liquidity horizons. In particular, differences between liquidity horizons and maturities of hedges and hedged positions are recognized.
Direct validation of the incremental risk charge through back-testing methods is not possible. The incremental risk charge is subject to validation principles such as the evaluation of conceptual soundness, ongoing monitor-ing, process verification and benchmarking and outcome analysis. The validation of the incremental risk charge methodology is embedded in the validation process for our credit portfolio model, with particular focus on the incremental risk charge specific aspects. The incremental risk charge model validation relies more on indirect methods including stress tests and sensitivity analyses. The incremental risk charge relevant parameters are included in the annual validation cycle established in the current regulatory framework. The incremental risk charge is part of the quarterly Group Wide Stress Test (GWST) using the stress testing functionality within our credit engine. Stressed incremental risk charge figures are reported on group level and submitted to the Stress Testing Oversight Committee (STOC) and Cross Risk Review Committee (CRRC).
Comprehensive Risk Measure (“CRM”) The comprehensive risk measure for the correlation trading portfolio is based on our own internal model. We calculate the comprehensive risk measure based on a Monte Carlo Simulation technique to a 99.9 % confi-dence level and a capital horizon of 1 year. The calculation also employs certain distribution assumptions for the underlying risk factors used. Our comprehensive risk measure model is applied to the eligible correlation trading positions and their hedges, and is designed to take into account the following risk factors: interest rates, credit spreads, recovery rates, counterparty defaults, foreign exchange rates and base correlations, index-to-constituent and base correlation basis risks. Typical products are collateralised debt obligations, nth-to-default credit default swaps (“CDS”), and index- and single-name CDS. The model incorporates concentrations of the portfolio and nonlinear effects via a full revaluation approach.

Deutsche Bank 01 – Management Report 99 Financial Report 2011 Risk Report
Comprehensive risk measure is calculated on a weekly basis. It is determined as the higher of the latest weekly comprehensive risk measure charge from the model, the 12 week average comprehensive risk meas-ure charge, and 8 % of the standardised approach charge for the credit correlation portfolio (comprehensive risk measure floor).
The market and position data are collected from front office systems and are subject to strict quality control. The comprehensive risk measure figures are closely monitored and play a significant role in the management of the correlation trading portfolio. We use historical market data to estimate the risk drivers to the comprehen-sive risk measure, with an equally-weighted trading day history of up to 3 years, depending on the risk driver.
Liquidity horizon settings are set to the time required to sell the position or to hedge all material relevant price risks in a stressed market. Liquidity horizons reflect our actual practice and experience during periods of sys-tematic and idiosyncratic stresses.
We have defined the sets of positions used for applying liquidity horizons in a way that meaningfully reflects the differences in liquidity for each set. Risk managers who specialize in each product area have made liquidity determinations based on market conditions for each area, both currently and under periods of stress.
We continually analyze the potential weaknesses of our comprehensive risk measure model using statistical techniques such as a monthly back-testing process and a quarterly re-calibration of market data. We also rely on risk management experience and expert opinion. As additional validation, a series of stress tests have been defined on the correlation trading portfolio where the shock sizes link into historical distressed market condi-tions.
Market Risk Standardised Approach (MRSA) The specific market risk standardised approach is used to determine the regulatory capital charge for the non-correlation trading portfolio securitisation products and nth-to-default credit swaps. Market Risk Management monitors exposures and addresses risk issues and concentrations.
Longevity risk is the risk of adverse changes in life expectancies resulting in a loss in value on longevity linked policies and transactions. Regulatory capital charge for longevity risk is determined using the Market Risk Standardised Approach as set out in SolvV regulations. For risk management purposes, stress testing and economic capital allocations are also used to monitor and manage longevity risk.

Deutsche Bank 01 – Management Report 100 Financial Report 2011 Risk Report
Value-at-Risk at Postbank Postbank also uses the value-at-risk concept to quantify and monitor the market risk it assumes. Value-at-risk is calculated using a Monte Carlo Simulation. The risk factors taken into account in the value-at-risk include interest rates, equity prices, foreign exchange rates, and volatilities, along with risks arising from changes in credit spreads. Correlation effects between the risk factors are derived from equally-weighted historical data.
Postbank’s trading book value-at-risk is currently not consolidated into the value-at-risk of the remaining Group. However, it is shown separately in the internal value-at-risk report for the Group.
Postbank also performs scenario analyses and stress tests in addition to the value-at-risk calculations. The assumptions underlying the stress tests are reviewed and validated on an ongoing basis.
Economic Capital for Market Risk Economic capital for market risk measures the amount of capital needed to absorb very severe, unexpected losses arising from our exposures over the period of one year. “Very severe” in this context means that eco-nomic capital is set at a level to cover with a probability of 99.98 % of the aggregated unexpected losses within one year. The market risks from Postbank have been included in the Group’s economic capital results.
We calculate economic capital using stress tests and scenario analyses. The stress tests are derived from historically observed severe market shocks. The resulting losses from these stress scenarios are then aggre-gated using correlations observed during periods of market crises, to reflect the increase in correlations which occurs during severe downturns.
Where only limited historical data is available or where market developments lead us to believe that historical data may be a poor indicator of possible future market scenarios, the stress tests are augmented by expert assessments.
The calculation of economic capital for market risk from the trading units is performed weekly. The model in-corporates the following risk factors: interest rates, credit spreads, equity prices, foreign exchange rates and commodity prices. Volatility, credit correlation and common basis risks are also captured.
We also continuously assess and refine our stress tests in an effort to ensure they capture material risks as well as reflect possible extreme market moves. Additionally, risk managers use their expert judgment to define worst case scenarios based upon the knowledge of past extreme market moves. It is possible however, for our market risk positions to lose more value than our economic capital estimates since all downside scenarios cannot be predicted and simulated.

Deutsche Bank 01 – Management Report 101 Financial Report 2011 Risk Report
Value-at-Risk of Trading Units of Our Corporate & Investment Bank Group Division (excluding Postbank) The following table shows the value-at-risk of the trading units of our Corporate & Investment Bank Group Division calculated with a 99 % confidence level and a one-day holding period. Our trading market risk outside of these units is immaterial.
in € m. Dec 31, 2011 Dec 31, 2010
Interest rate risk 53.8 77.4 Equity price risk 13.6 21.3 Foreign exchange risk 25.7 29.0 Commodity price risk 21.0 13.3 Diversification effect (64.1) (70.1)
Total value-at-risk of trading units 50.0 70.9
“Diversification effect” reflects the fact that the total value-at-risk on a given day will be lower than the sum of the value-at-risk relating to the individual risk classes. Simply adding the value-at-risk figures of the individual risk classes to arrive at an aggregate value-at-risk would imply the assumption that the losses in all risk catego-ries occur simultaneously.
The following table shows the average, maximum, and minimum value-at-risk (with a 99 % confidence level and a one-day holding period) of the trading units of our Corporate & Investment Bank Group Division for the periods specified.
Total Diversification effect Interest rate risk Equity price risk Foreign exchange risk
Commodity price risk
in € m. 2011 2010 2011
2010 2011 2010 2011 2010 2011 2010 2011 2010
Average 71.8 95.6 (66.3) (48.6) 70.8 86.8 20.5 21.9 32.5 22.9 14.2 12.7 Maximum 94.3 126.4 (88.6) (88.5) 109.0 113.0 37.6 33.6 64.9 46.4 24.3 21.2 Minimum 44.9 67.5 (41.9) (26.4) 45.6 65.8 12.7 13.6 14.3 10.8 7.0 6.2 The € 23.8 million or 25 % decrease in average value-at-risk observed in 2011 compared to the prior year was driven primarily by broad risk reduction, particularly in interest rate and credit asset classes.
New Basel 2.5 Regulatory Trading Market Risk Measures As discussed under “New Basel 2.5 Regulatory Trading Market Risk Requirements”, the following table shows the stressed value-at-risk (with a 99 % confidence level and a one-day holding period) of the trading units of our Corporate & Investment Bank Group Division.
in € m. Dec 31, 2011
Interest rate risk 117.3 Equity price risk 23.0 Foreign exchange risk 51.8 Commodity price risk 34.2 Diversification effect (114.5)
Total stressed value-at-risk of trading units 111.7

Deutsche Bank 01 – Management Report 102 Financial Report 2011 Risk Report
The following table shows the average, maximum, and minimum stressed value-at-risk (with a 99 % confidence level and a one-day holding period) of the trading units of our Corporate & Investment Bank Group Division for the periods specified.
2011
in € m. Average
1 Maximum
1 Minimum
1
Interest rate risk 130.8 163.5 106.2 Equity price risk 22.5 64.7 15.2 Foreign exchange risk 51.3 105.4 23.0 Commodity price risk 29.2 35.8 19.6 Diversification effect (109.4) (152.3) (77.8)
Total stressed value-at-risk of trading units 124.4 169.5 103.8 1 Average, Maximum and Minimum have been calculated for the period from October 1, 2011 to December 31, 2011.
The following table shows the incremental risk charge (with a 99.9 % confidence level and one-year capital horizon) of the trading units of our Corporate & Investment Bank Group Division.
in € m. Dec 31, 2011
Global Finance and Foreign Exchange 83.8 Global Rates 292.7 Global Credit Trading 222.0 Emerging Markets - Debt 140.9 Other (1.4)
Total incremental risk charge of trading units 738.0
The following table shows the average, maximum, and minimum of the incremental risk charge (with a 99.9 % confidence level and one-year capital horizon) of the trading units of our Corporate & Investment Bank Group Division.
2011
in € m.
Weighted average liquidity horizon in month Average
1 Maximum
1 Minimum
1
Global Finance and Foreign Exchange 6.0 48.0 83.8 6.5 Global Rates 6.0 318.6 358.4 284.7 Global Credit Trading 6.0 302.7 423.3 221.9 Emerging Markets – Debt 6.0 90.0 140.9 23.9 Other 6.0 (1.3) 2.2 (5.5)
Total incremental risk charge of trading units 6.0 758.0 846.3 697.1 1 Average, Maximum and Minimum have been calculated for the period from October 1, 2011 to December 31, 2011.
The following table shows the comprehensive risk measure (with a 99.9 % confidence level and one-year capi-tal horizon) of the trading units of our Corporate & Investment Bank Group Division.
in € m. Dec 31, 2011
Correlation trading 855.7

Deutsche Bank 01 – Management Report 103 Financial Report 2011 Risk Report
The following table shows the maximum, minimum and average of the comprehensive risk measure (with a 99.9 % confidence level and one-year capital horizon) of the trading units of our Corporate & Investment Bank Group Division.
2011
in € m.
Weighted average liquidity horizon in month Average
1 Maximum
1 Minimum
1
Correlation trading 6.0 937.9 1,007.5 848.3 1 Average, Maximum and Minimum have been calculated for the period from October 1, 2011 to December 31, 2011.
As at December 31, 2011, the securitization positions using the market risk standardized approach generated risk weighted assets of € 5.0 billion and capital deduction items of € 2.2 billion.
As at December 31, 2011, the capital charge for longevity risk was € 32.1 million corresponding to risk weighted assets of € 400.9 million.
Value-at-Risk at Postbank The following table shows the value-at-risk of Postbank’s trading book (calculated with a 99 % confidence level and a one-day holding period).
in € m. Dec 31, 2011 Dec 31, 2010
Interest rate risk 3.9 1.8 Equity price risk − 0.2 Foreign exchange risk 0.0 0.0 Commodity price risk − − Diversification effect (0.0) (0.0)
Total value-at-risk of Postbank's trading book 3.9 2.0
The increase in Postbank’s value-at-risk from € 2.0 million at year end 2010 to € 3.9 million as of December 31, 2011 is largely due to the increase of a long position in the short end of the yield curve within the repo book. “Diversification effect” reflects the fact that the total value-at-risk on a given day will be lower than the sum of the value-at-risk relating to the individual risk classes. Simply adding the value-at-risk figures of the individual risk classes to arrive at an aggregate value-at-risk would imply the assumption that the losses in all risk cate-gories occur simultaneously.
The following table shows the average, maximum, and minimum value-at-risk (with a 99 % confidence level and a one-day holding period) of the trading book of Postbank.
Total Diversification effect Interest rate risk Equity price risk
Foreign exchange risk
Commodity price risk
in € m. 2011 2011 2011 2011 2011 2011
Average
1 3.2 (0.2) 3.2 0.1 0.1 − Maximum
1 8.2 (0.0) 8.1 0.4 0.5 − Minimum
1 1.1 (0.8) 1.1 0.0 0.0 − 1 In 2010 the average, maximum and minimum value-at-risk had no material variance for the period since consolidation of Postbank.

Deutsche Bank 01 – Management Report 104 Financial Report 2011 Risk Report
Regulatory Back-testing of Trading Market Risk Back-testing is a procedure used to verify the predictive power of the value-at-risk calculations involving the comparison of hypothetical daily profits and losses under the buy-and-hold assumption with the estimates from the value-at-risk model. An outlier is a hypothetical buy-and-hold trading loss that exceeds our value-at-risk estimate. On average, we would expect a 99 percent confidence level to give rise to two to three outliers in any one year. In our regulatory back-testing in 2011, we observed three global outliers compared to two in 2010. The outliers occurred between August and September following increased market volatility. We continue to believe that our value-at-risk model will remain an appropriate measure for our trading market risk under normal market conditions.
The following graph shows the daily buy-and-hold trading results in comparison to the value-at-risk as of the close of the previous business day for the trading days of the reporting period. Figures are shown in millions of euro and exclude contributions from Postbank’s trading book which is calculated on a stand-alone basis.
50
100
0
(150)
(100)
(50)
Value-at -Risk
1/11 2/11 3/11 4/11 5/11 6/11 7/11 8/11 9/11 10/11 11/11 12/11
Buy -and - hold income of Trading Units
150
in € m.
Buy- and- hold income of Trading Units and Value - at - Risk in 2011
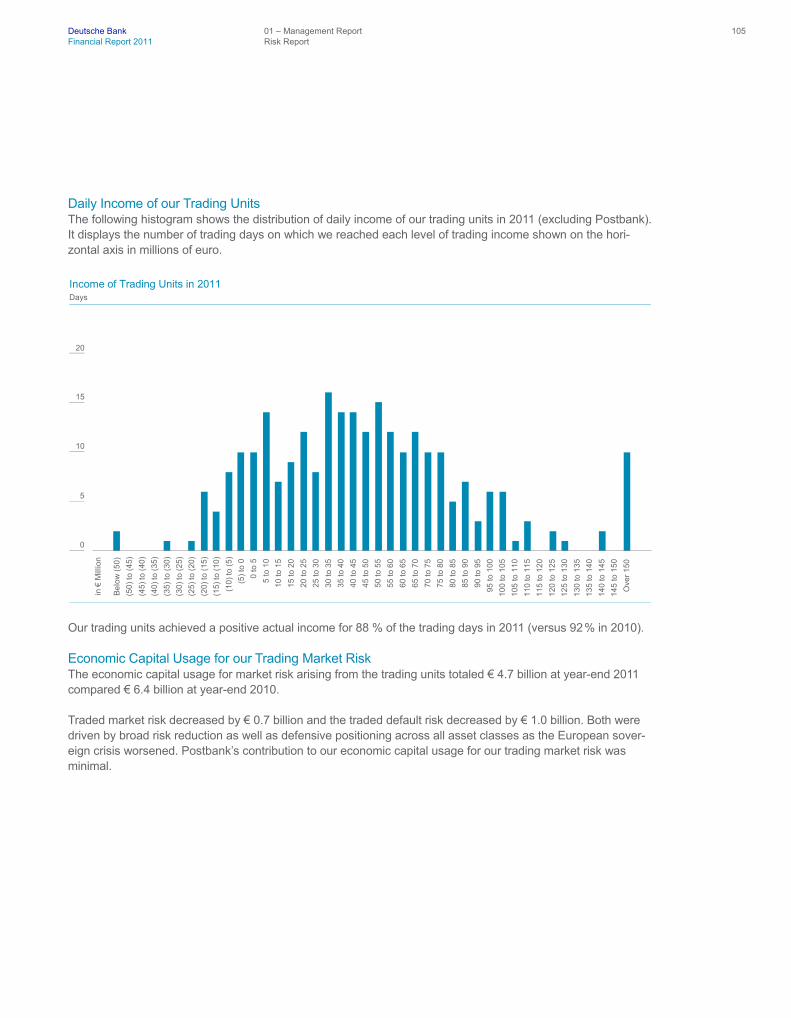
Deutsche Bank 01 – Management Report 105 Financial Report 2011 Risk Report
Daily Income of our Trading Units The following histogram shows the distribution of daily income of our trading units in 2011 (excluding Postbank). It displays the number of trading days on which we reached each level of trading income shown on the hori-zontal axis in millions of euro.
Our trading units achieved a positive actual income for 88 % of the trading days in 2011 (versus 92 % in 2010).
Economic Capital Usage for our Trading Market Risk The economic capital usage for market risk arising from the trading units totaled € 4.7 billion at year-end 2011 compared € 6.4 billion at year-end 2010.
Traded market risk decreased by € 0.7 billion and the traded default risk decreased by € 1.0 billion. Both were driven by broad risk reduction as well as defensive positioning across all asset classes as the European sover-eign crisis worsened. Postbank’s contribution to our economic capital usage for our trading market risk was minimal.
0
5
10
15
Days
Income of Trading Units in 2011
20
(50
) to
(4
5)
(45
) to
(4
0)
(40
) to
(3
5)
5 to
10
10
to 1
5
in €
Mill
ion
(35
) to
(3
0)
(30
) to
(2
5)
(25
) to
(2
0)
(20
) to
(1
5)
(15
) to
(1
0)
(10
) to
(5
)
(5)
to 0
0 to
5
15
to 2
0
20
to 2
5
25
to 3
0
30
to 3
5
35
to 4
0
40
to 4
5
50
to 5
5
55
to 6
0
60
to 6
5
65
to 7
0
70
to 7
5
75
to 8
0
80
to 8
5
85
to 9
0
90
to 9
5
95
to 1
00
45
to 5
0
Ove
r 15
0
10
0 to
10
5
10
5 to
11
0
11
0 to
11
5
11
5 to
12
0
12
0 to
12
5
12
5 to
13
0
13
0 to
13
5
13
5 to
14
0
14
0 to
14
5
14
5 to
15
0
Be
low
(50
)

Deutsche Bank 01 – Management Report 106 Financial Report 2011 Risk Report
Economic capital for traded default risk represents an estimate of the default and migration risks of credit prod-ucts at a 99.98 % confidence level, taking into account the liquidity horizons of the respective sub-portfolios. It covers the following positions:
— Fair value assets in the banking book; — Unsecuritized credit products in the trading book excluding correlation trading portfolio; — Securitized products in the trading book excluding correlation trading portfolio; — Correlation trading portfolio.
The traded default risk economic capital for the correlation trading portfolio is derived by scaling its regulatory capital under the comprehensive risk measure to the economic capital confidence level. The scaling is per-formed by employing Extreme Value Theory.
For all other positions traded default risk economic capital is calculated with our credit portfolio model. In order to capture diversification and concentration effects we perform a joint calculation for traded default risk economic capital and credit risk economic capital. Important parameters for traded default risk are exposures, recovery rates and default probabilities as well as maturities. Exposures, recovery rates and default probabili-ties are derived from market information and external ratings for the trading book and internal assessments for the banking book as for credit risk economic capital. Rating migrations are governed by migration matrices, which are obtained from historical rating time series from rating agencies and internal observations. The probability of joint rating downgrades and defaults is determined by the default and rating correlations of the portfolio model. These correlations are specified through systematic factors that represent countries, geo-graphical regions and industries.
Nontrading Market Risk Management Nontrading Market Risk Management oversees a number of risk exposures resulting from various business activities and initiatives. Due to the variety of risk characteristics, nontrading market risk management is split into three areas:
— Nontrading Market Risk core team – covering market risks in Private and Business Clients, Global Trans-action Banking, Private Wealth Management and Corporate Investments as well as structural foreign ex-change risks, equity compensation risks and pension risks.
— Principal Investments – specializing in the risk-related aspects of our nontrading alternative asset activities and performing regular reviews of the risk profile of the nontrading alternative asset portfolios.
— Asset Management Risk – specializing in risk-related aspects of our asset and fund management business. Key risks in this area arise, from performance and/or principal guarantees and reputational risk related to managing client funds.

Deutsche Bank 01 – Management Report 107 Financial Report 2011 Risk Report
The majority of the interest rate and foreign exchange risks arising from Deutsche Bank’s nontrading asset and liability positions, excluding Postbank, have been transferred through internal hedges to trading books within Corporate & Investment Bank and are therefore reflected and managed through the value-at-risk numbers. Of the remaining risks that have not been transferred through those hedges, foreign exchange risk is mitigated through match funding the investment in the same currency and so only residual risk remains in the portfolios. For these residual positions, there is immaterial interest rate risk remaining from the mismatch between the funding term and the expected maturity of the investment.
Structural foreign exchange risk exposure arises from capital and retained earnings in non-euro currencies in certain subsidiaries, mainly U.S. and U.K. entities, and represents the bulk of foreign exchange risk in our nontrading portfolio.
In addition to the above risks, the Nontrading Market Risk Management team has the mandate to monitor and manage risks arising from our equity compensation plans and pension liabilities. It also manages risks related to asset management activities, primarily resulting from guaranteed funds. Moreover, our Private and Business Clients, Global Transaction Banking and Private Wealth Management businesses are subject to model risk with regard to client deposits as well as savings and loan products. This risk materializes if client behavior in response to interest rate movements deviates substantially from historical observed values.
The Risk Executive Committee and the Capital and Risk Committee supervise nontrading market risk expo-sures. Investment proposals for strategic investments are analyzed by the Group Investment Committee. De-pending on the size, any strategic investment requires approval from the Group Investment Committee, the Management Board or the Supervisory Board. The development of strategic investments is monitored by the Group Investment Committee on a regular basis. Multiple members of the Capital and Risk Committee & Risk Executive Committee are also members of the Group Investment Committee, ensuring a close link between these committees.
Assessment of Market Risk in Nontrading Portfolios (excluding Postbank) Market risk is quantified through the use of stress testing procedures. We use stress tests that are specific to each risk class and which consider, among other factors, large historically observed market moves, the liquidity of each asset class, and changes in client behavior in relation to deposit products. This assessment forms the basis of the economic capital calculations which enable us to actively monitor and manage our nontrading market risk.
Assessment of Market Risk in the Nontrading Portfolios at Postbank Postbank uses the value-at-risk concept to quantify and monitor the market risk it assumes in the banking book. Value-at-risk is calculated using a Monte Carlo Simulation method. The risk factors taken into account in value-at-risk include interest rates, equity prices, foreign exchange rates, and volatilities, along with risks arising from changes in credit spreads. Correlation effects between the risk factors are derived from equally-weighted his-torical data.
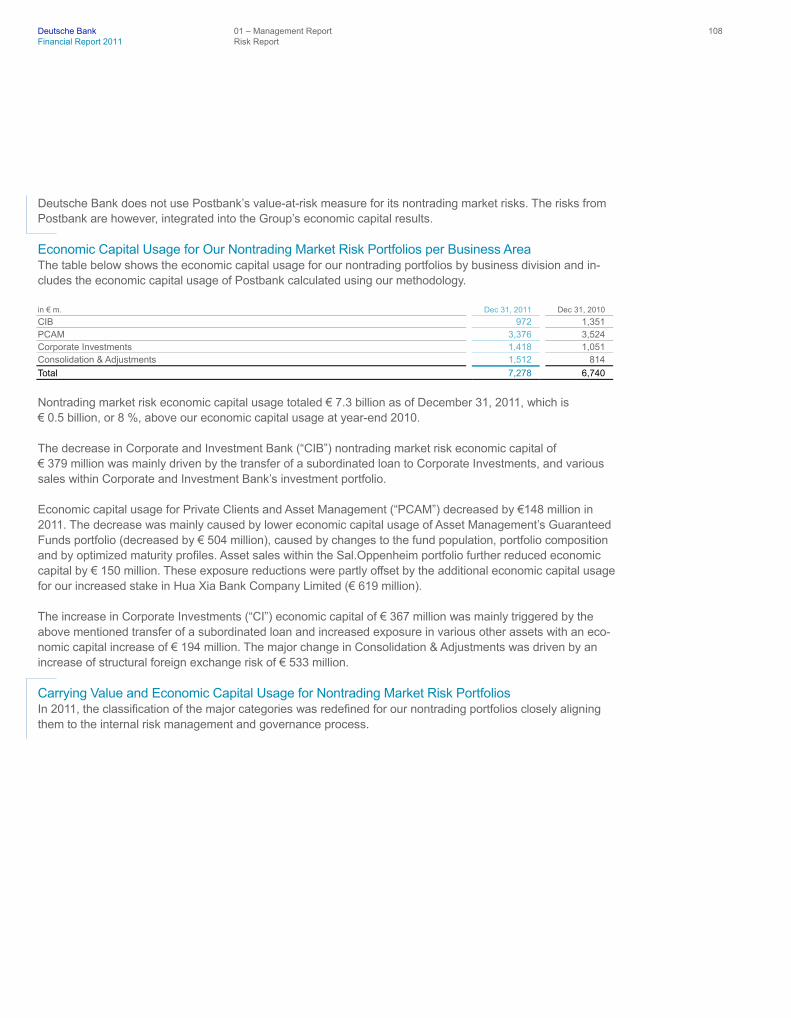
Deutsche Bank 01 – Management Report 108 Financial Report 2011 Risk Report
Deutsche Bank does not use Postbank’s value-at-risk measure for its nontrading market risks. The risks from Postbank are however, integrated into the Group’s economic capital results.
Economic Capital Usage for Our Nontrading Market Risk Portfolios per Business Area The table below shows the economic capital usage for our nontrading portfolios by business division and in-cludes the economic capital usage of Postbank calculated using our methodology.
in € m. Dec 31, 2011 Dec 31, 2010
CIB 972 1,351 PCAM 3,376 3,524 Corporate Investments 1,418 1,051 Consolidation & Adjustments 1,512 814
Total 7,278 6,740
Nontrading market risk economic capital usage totaled € 7.3 billion as of December 31, 2011, which is € 0.5 billion, or 8 %, above our economic capital usage at year-end 2010.
The decrease in Corporate and Investment Bank (“CIB”) nontrading market risk economic capital of € 379 million was mainly driven by the transfer of a subordinated loan to Corporate Investments, and various sales within Corporate and Investment Bank’s investment portfolio.
Economic capital usage for Private Clients and Asset Management (“PCAM”) decreased by €148 million in 2011. The decrease was mainly caused by lower economic capital usage of Asset Management’s Guaranteed Funds portfolio (decreased by € 504 million), caused by changes to the fund population, portfolio composition and by optimized maturity profiles. Asset sales within the Sal.Oppenheim portfolio further reduced economic capital by € 150 million. These exposure reductions were partly offset by the additional economic capital usage for our increased stake in Hua Xia Bank Company Limited (€ 619 million).
The increase in Corporate Investments (“CI”) economic capital of € 367 million was mainly triggered by the above mentioned transfer of a subordinated loan and increased exposure in various other assets with an eco-nomic capital increase of € 194 million. The major change in Consolidation & Adjustments was driven by an increase of structural foreign exchange risk of € 533 million.
Carrying Value and Economic Capital Usage for Nontrading Market Risk Portfolios In 2011, the classification of the major categories was redefined for our nontrading portfolios closely aligning them to the internal risk management and governance process.
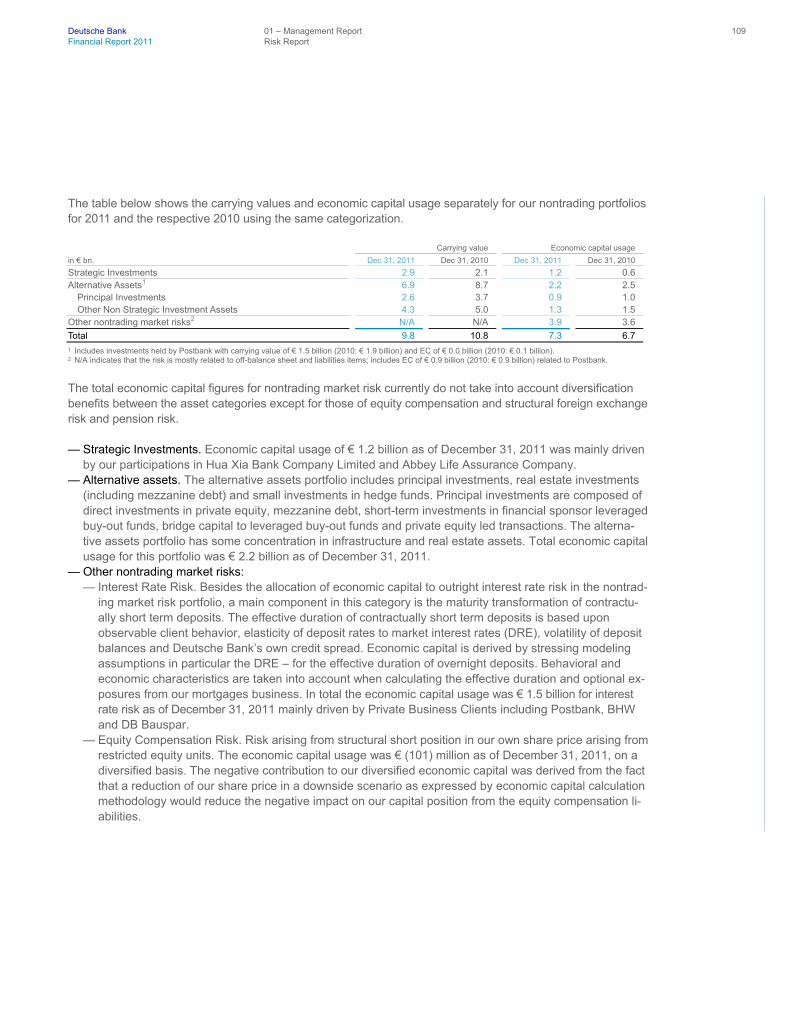
Deutsche Bank 01 – Management Report 109 Financial Report 2011 Risk Report
The table below shows the carrying values and economic capital usage separately for our nontrading portfolios for 2011 and the respective 2010 using the same categorization.
Carrying value Economic capital usage
in € bn. Dec 31, 2011 Dec 31, 2010 Dec 31, 2011 Dec 31, 2010
Strategic Investments 2.9 2.1 1.2 0.6 Alternative Assets
1 6.9 8.7 2.2 2.5 Principal Investments 2.6 3.7 0.9 1.0 Other Non Strategic Investment Assets 4.3 5.0 1.3 1.5
Other nontrading market risks
2 N/A N/A 3.9 3.6
Total 9.8 10.8 7.3 6.7 1 Includes investments held by Postbank with carrying value of € 1.5 billion (2010: € 1.9 billion) and EC of € 0.0 billion (2010: € 0.1 billion). 2 N/A indicates that the risk is mostly related to off-balance sheet and liabilities items; includes EC of € 0.9 billion (2010: € 0.9 billion) related to Postbank.
The total economic capital figures for nontrading market risk currently do not take into account diversification benefits between the asset categories except for those of equity compensation and structural foreign exchange risk and pension risk.
— Strategic Investments. Economic capital usage of € 1.2 billion as of December 31, 2011 was mainly driven by our participations in Hua Xia Bank Company Limited and Abbey Life Assurance Company.
— Alternative assets. The alternative assets portfolio includes principal investments, real estate investments (including mezzanine debt) and small investments in hedge funds. Principal investments are composed of direct investments in private equity, mezzanine debt, short-term investments in financial sponsor leveraged buy-out funds, bridge capital to leveraged buy-out funds and private equity led transactions. The alterna-tive assets portfolio has some concentration in infrastructure and real estate assets. Total economic capital usage for this portfolio was € 2.2 billion as of December 31, 2011.
— Other nontrading market risks: — Interest Rate Risk. Besides the allocation of economic capital to outright interest rate risk in the nontrad-
ing market risk portfolio, a main component in this category is the maturity transformation of contractu-ally short term deposits. The effective duration of contractually short term deposits is based upon observable client behavior, elasticity of deposit rates to market interest rates (DRE), volatility of deposit balances and Deutsche Bank’s own credit spread. Economic capital is derived by stressing modeling assumptions in particular the DRE – for the effective duration of overnight deposits. Behavioral and economic characteristics are taken into account when calculating the effective duration and optional ex-posures from our mortgages business. In total the economic capital usage was € 1.5 billion for interest rate risk as of December 31, 2011 mainly driven by Private Business Clients including Postbank, BHW and DB Bauspar.
— Equity Compensation Risk. Risk arising from structural short position in our own share price arising from restricted equity units. The economic capital usage was € (101) million as of December 31, 2011, on a diversified basis. The negative contribution to our diversified economic capital was derived from the fact that a reduction of our share price in a downside scenario as expressed by economic capital calculation methodology would reduce the negative impact on our capital position from the equity compensation li-abilities.

Deutsche Bank 01 – Management Report 110 Financial Report 2011 Risk Report
— Pension Risk. Risk arising from our defined benefit obligations, including interest rate risk and inflation risk, credit spread risk, equity risk and longevity risk. Economic capital usage, excluding Postbank, was € 141 million as of December 31, 2011. The economic capital charge allocated at Deutsche Bank Group level for respective pension risks of Postbank amounted to € 50 million.
— Structural Foreign Exchange Risk. Our foreign exchange exposure arising from unhedged capital and retained earnings in non-euro currencies in certain subsidiaries. The economic capital usage was € 1.5 billion as of December 31, 2011 on a diversified basis.
— Guaranteed Funds. Economic capital usage was € 931 million as of December 31, 2011.
Value-at-Risk of the Banking Book at Postbank The following table shows the value-at-risk of Postbank’s banking book (calculated with a 99 % confidence level and a one-day holding period). The calculation incorporates all substantial market risk-bearing positions in the banking book, with the majority of the exposure arising from interest rate and credit spread risks.
in € m. Dec 31, 2011 Dec 31, 2010
Average
1 109.1 − Maximum
1 139.7 − Minimum
1 77.7 − Period-end 139.7 121.6
Limit at period-end 165.0 152.3 1 In 2010 the average, maximum and minimum value-at-risk had no material variance for the period since consolidation of Postbank.
Operational Risk
Definition of Operational Risk “Operational risk is the potential for failure (incl. the legal component) in relation to employees, contractual specifications and documentation, technology, infrastructure failure and disasters, external influences and customer relationships.”
Operational risk excludes business and reputational risk.
Organizational Structure The Head of Operational Risk & Business Continuity Management chairs the Operational Risk Management Committee, which is a permanent sub-committee of the Risk Executive Committee and is composed of the operational risk officers from our business divisions and our infrastructure functions. It is the main decision-making committee for all operational risk management matters.

Deutsche Bank 01 – Management Report 111 Financial Report 2011 Risk Report
While the day-to-day operational risk management lies with our business divisions and infrastructure functions, the Operational Risk & Business Continuity Management function manages the cross divisional and cross regional operational risk as well as risk concentrations and ensures a consistent application of our operational risk management strategy across the bank. Based on this Business Partnership Model we ensure close moni-toring and high awareness of operational risk.
Managing Our Operational Risk We manage operational risk based on a Group-wide consistent framework that enables us to determine our operational risk profile in comparison to our risk appetite and systematically identify operational risk themes and concentrations to define risk mitigating measures and priorities.
We apply a number of techniques to efficiently manage the operational risk in our business, for example:
⎯ We perform systematic risk analyses, root cause analyses and lessons learned activities for events above € 1 million to identify inherent areas of risk and to define appropriate risk mitigating actions which are moni-tored for resolution. The prerequisite for these detailed analyses and the timely information of our senior management on the development of the operational risk events and on single larger events is the conti-nuous collection of all losses above € 10,000 arising from operational risk events in our “db-Incident Report-ing System”.
⎯ We systematically utilize information on external events occurring in the banking industry to ensure that similar incidents will not happen to us.
⎯ Key Risk Indicators (“KRI”) are used to monitor the operational risk profile and alert the organization to impending problems in a timely fashion. They allow via our tool “dbScore” the monitoring of the bank’s con-trol culture and business environment and trigger risk mitigating actions. KRIs facilitate the forward looking management of operational risk based on early warning signals returned by the KRIs and as such an allo-cation of capital via the qualitative adjustment.
⎯ In our bottom-up self assessment process, which is conducted at least annually, areas with high risk poten-tial are highlighted and risk mitigating measures to resolve issues are identified. In general, it is performed in our tool “dbSAT”. On a regular basis we conduct risk workshops aiming to evaluate risks specific to coun-tries and local legal entities we are operating in and take appropriate risk mitigating actions.
⎯ In addition to internal and external loss information scenarios are utilized and actions are derived from them. The set of scenarios consists of relevant external scenarios provided by a public database and internal scenarios. The latter are derived to achieve full coverage of the risks.
⎯ Regular operational risk profile reports at Group level for our business divisions, the countries we are oper-ating in and our infrastructure functions are reviewed and discussed with the department’s senior manage-ment. The regular performance of the risk profile reviews enables us to early detect changes to the units risk profile as well as risk concentrations across the Group and to take corrective actions.

Deutsche Bank 01 – Management Report 112 Financial Report 2011 Risk Report
⎯ We assess and approve the impact of changes to the Group’s risk profile as a result of new products, out-sourcings, strategic initiatives and acquisitions and divestments.
⎯ Once operational risks are identified, mitigation is required following the “as low as reasonably practicable (ALARP)” principle by balancing the cost of mitigation with the benefits thereof and formally accepting the residual risk. Risks which contravene applicable national or international regulations and legislation cannot be accepted; once identified, such risks must always be mitigated.
⎯ Within our tracking tool “dbTrack” we monitor risk mitigating measures identified via Operational Risk Man-agement techniques for resolution. Higher than important residual operational risks need to be accepted by the ORMC.
⎯ We perform top risk analyses in which the results of the aforementioned activities are considered. The top risk analyses mainly contribute into the annual operational risk management strategy and planning process. Besides the operational risk management strategic and tactical planning we define capital and expected loss targets which are monitored on a regular basis within the quarterly forecasting process.
⎯ A standardised quality assurance process is applied to quality review risk management decisions and model inputs.
Measuring Our Operational Risks The increase in economic capital is primarily explained by the implementation of a new safety margin applied in our AMA model, intended to cover unforeseen legal risks from the current financial crisis.
in € m. Dec 31, 2011 Dec 31, 2010
CIB 3.873 2.735 PCAM 917 939 CI 56 8
Total economic capital usage for operational risk 4.846 3.682
We calculate and measure the economic and regulatory capital for operational risk using the internal AMA methodology. Economic capital is derived from the 99.98 % percentile and allocated to the businesses and used in performance measurement and resource allocation, providing an incentive to manage operational risk, optimizing economic capital utilization. The regulatory capital operational risk applies the 99.9 % percentile. Our internal AMA capital calculation is based upon the loss distribution approach. Gross losses adjusted for direct recoveries from historical internal and external loss data (Operational Riskdata eXchange Association (ORX) consortium data and external scenarios from a public database), plus internal scenario data are used to esti-mate the risk profile (that is, a loss frequency and a loss severity distribution). Thereafter, the frequency and severity distributions are combined in a Monte Carlo Simulation to generate losses over a one year time hori-zon. Finally, the risk mitigating benefits of insurance are applied to each loss generated in the Monte Carlo Simulation. Correlation and diversification benefits are applied to the net losses in a manner compatible with regulatory requirements to arrive at a net loss distribution at the Group level covering expected and unex-pected losses. Capital is then allocated to each of the business divisions and both a qualitative adjustment (“QA”) and an expected losses deduction are made.

Deutsche Bank 01 – Management Report 113 Financial Report 2011 Risk Report
The QA reflects the effectiveness and performance of the day-to-day operational risk management activities via KRIs and self assessment scores focusing on the business environment and internal control factors. QA is applied as a percentage adjustment to the final capital number. This approach makes qualitative adjustment transparent to the management of the businesses and provides feedback on their risk profile as well as on the success of their management of operational risk. It thus provides incentives for the businesses to continuously improve Operational Risk Management in their areas.
The expected loss for operational risk is based on historical loss experience and expert judgment considering business changes denoting the expected cost of operational losses for doing business. To the extent it is con-sidered in the divisional business plans it is deducted from the AMA capital figure. The unexpected losses for the business divisions (after QA and expected loss) are aggregated to produce the Group AMA capital figure.
Since 2008, we have maintained approval by the BaFin to use the AMA. We are waiting for regulatory approval to integrate Postbank into our regulatory capital calculation.
Our Operational Risk Management Stress Testing Concept We conduct stress testing on a regular basis and isolated from our AMA methodology to analyze the impact of extreme situations on our capital and the profit-and-loss account. In 2011 we introduced a quarterly stress test which is based on impact assessments related to three different stress scenarios with gradually increasing intensity. Additionally, we perform complementary sensitivity analysis and contribute to firm wide stress tests including reverse stress testing.
Our AMA Model Validation and Quality Assurance Concept We independently validate all our AMA model components such as but not limited to scenario analysis, KRIs and risk assessments, expected loss and internal loss data individually. The results of the validation exercise are summarized in validation reports and issues identified followed up for resolution. By this a permanent en-hancement of the methodologies is ensured. Quality Assurance reviews are performed for AMA model compo-nents which require data input provided by Business Divisions and result in capital impact. The data and information is challenged and compared across Business Divisions to ensure consistency and adequacy for any capital reduction or add-on.
Role of Corporate Insurance/Deukona The definition of our insurance strategy and supporting insurance policy and guidelines is the responsibility of our specialized unit Corporate Insurance/Deukona (“CI/D”). CI/D is responsible for our global corporate insur-ance policy which is approved by our Management Board.
CI/D is responsible for acquiring insurance coverage and for negotiating contract terms and premiums. CI/D also has a role in the allocation of insurance premiums to the businesses. CI/D specialists assist in devising the method for reflecting insurance in the capital calculations and in arriving at parameters to reflect the regulatory requirements. They validate the settings of insurance parameters used in the AMA model and provide respec-tive updates. CI/D is actively involved in industry efforts to reflect the effect of insurance in the results of the capital calculations.

Deutsche Bank 01 – Management Report 114 Financial Report 2011 Risk Report
We buy insurance in order to protect ourselves against unexpected and substantial unforeseeable losses. The identification, definition of magnitude and estimation procedures used are based on the recognized insurance terms of “common sense”, “state-of-the-art” and/or “benchmarking”. The maximum limit per insured risk takes into account the reliability of the insurer and a cost/benefit ratio, especially in cases in which the insurance market tries to reduce coverage by restricted/limited policy wordings and specific exclusions.
We maintain a number of captive insurance companies, both primary and re-insurance companies. However, insurance contracts provided are only considered in the modeling/calculation of insurance-related reductions of operational risk capital requirements where the risk is re-insured in the external insurance market.
The regulatory capital figure includes a deduction for insurance coverage amounting to € 491 million. Currently, no other risk transfer techniques beyond insurance are recognized in the AMA model.
CI/D selects insurance partners in strict compliance with the regulatory requirements specified in the Solvency Regulations and the Operational Risks Experts Group recommendation on the recognition of insurance in advanced measurement approaches. The insurance portfolio, as well as CI/D activities are audited by Group Audit on a periodic basis.
Operational Risk at Postbank Postbank’s approach to Operational Risk Management is largely comparable to Deutsche Bank’s approach. The Management Board of Postbank is solely responsible for the management, control, and monitoring of operational risk. The Operational Risk Committee (ORK) commissioned by the Postbank Management Board defines the strategy and framework for controlling operational risk. Day-to-day management of operational risk is the responsibility of the individual units within Postbank. Strategic parameters for managing operational risk, both qualitative as well as quantitative, are part of the overall strategy.
At Postbank the economic capital requirements for operational risk both for Postbank as a whole and for the four business divisions individually have been determined using a standalone internal capital model to calcu-late capital requirements for operational risk. Postbank received the approval by the BaFin for their AMA in December 2010.
Within the consolidation of Postbank the results of the economic capital requirements for operational risk have been recalculated using Deutsche Bank’s economic capital methodology for operational risk based upon pooled data from Deutsche Bank Group and Postbank and are reported in aggregate in section “Overall Risk Position” of this report.
Deutsche Bank 01 – Management Report 115 Financial Report 2011 Risk Report
Liquidity Risk at Deutsche Bank Group (excluding Postbank)
Liquidity risk management safeguards our ability to meet all payment obligations when they come due. Our liquidity risk management framework has been an important factor in maintaining adequate liquidity and in managing our funding profile during 2011.
Liquidity Risk Management Framework The Management Board defines our liquidity risk strategy, and in particular our tolerance for liquidity risk based on recommendations made by Treasury and the Capital and Risk Committee. At least once every year the Management Board will review and approve the limits which are applied to the Group to measure and control liquidity risk as well as the Bank’s long-term funding and issuance plan.
Our Treasury function is responsible for the management of liquidity and funding risk of Deutsche Bank global-ly as defined in the liquidity risk strategy. Our liquidity risk management framework is designed to identify, measure and manage the liquidity risk position of the Group. Treasury reports the Bank’s overall liquidity and funding to the Management Board at least weekly via a Liquidity Scorecard. Our liquidity risk management approach starts at the intraday level (operational liquidity) managing the daily payments queue, forecasting cash flows and factoring in our access to Central Banks. It then covers tactical liquidity risk management deal-ing with access to secured and unsecured funding sources. Finally, the strategic perspective comprises the maturity profile of all assets and liabilities (Funding Matrix) and our issuance strategy.
Our cash-flow based reporting system provides daily liquidity risk information to global and regional manage-ment.
Stress testing and scenario analysis plays a central role in our liquidity risk management framework. This also incorporates an assessment of asset liquidity, i.e. the characteristics of our asset inventory, under various stress scenarios as well as contingent funding requirements from off-balance-sheet commitments. The monthly stress testing results are used in setting our short-term wholesale funding limits (both unsecured and secured) and thereby ensuring we remain within the Board’s overall liquidity risk tolerance.
Short-term Liquidity and Wholesale Funding Our Group-wide reporting system tracks all contractual cash flows from wholesale funding sources on a daily basis over a 12-month horizon. The system captures all cash flows from unsecured as well as from secured funding transactions. Wholesale funding limits, which are calibrated against our stress testing results and are approved by the Management Board according to internal governance, express our maximum tolerance for liquidity risk. These limits apply to the respective cumulative global cash outflows as well as the total volume of unsecured wholesale funding and are monitored on a daily basis. Our liquidity reserves are the primary miti-gant against stresses in short-term wholesale funding markets. At an individual entity level we may set liquidity outflow limits across a broader range of cash flows where this is considered to be meaningful or appropriate.
Deutsche Bank 01 – Management Report 116 Financial Report 2011 Risk Report
Funding Diversification Diversification of our funding profile in terms of investor types, regions, products and instruments is an important element of our liquidity risk management framework. Our core funding resources come from retail clients, long-term capital markets investors and transaction banking clients. Other customer deposits and borrowing from wholesale clients are additional sources of funding. We use wholesale deposits primarily to fund liquid assets. To ensure the additional diversification of its refinancing activities, we have a Pfandbrief license allowing us to issue mortgage Pfandbriefe.
In 2011 we continued to focus on increasing our stable core funding components, while maintaining access to short-term wholesale funding markets, albeit on a relatively low level. Discretionary wholesale funding com-prises a range of products e.g. CD, CP as well as term, call and overnight deposits across tenors up to one year. The acquisition of Postbank significantly increased the volume of our core funding sources. Postbank’s status as a regulated bank and publicly traded company, however, limits our access to its liquidity.
The overall volume of discretionary wholesale funding and secured funding fluctuated between reporting dates based on our underlying business activities. Higher volumes, primarily in secured funding transactions, are largely driven by increased client related securities financing activities as well as intra quarter growth in liquid trading inventories. The growth in discretionary wholesale funding during the year 2011 is mainly a reflection of the growth in cash and liquid trading assets within our Corporate Banking & Securities Corporate Division.
To avoid any unwanted reliance on these short-term funding sources, and to ensure a sound funding profile at the short end, which complies with the defined risk tolerance, we have implemented limit structures (across tenor) to these funding sources, which are derived from our stress testing analysis.

Deutsche Bank 01 – Management Report 117 Financial Report 2011 Risk Report
The following chart shows the composition of our external funding sources (on a consolidated basis including the contribution from Postbank) that contribute to the liquidity risk position as of December 31, 2011 and De-cember 31, 2010, both in euro billion and as a percentage of our total external funding sources.
Funding Matrix We map all funding-relevant assets and all liabilities into time buckets corresponding to their economic maturities to compile a maturity profile (funding matrix). Given that trading assets are typically more liquid than their con-tractual maturities suggest, we determine individual liquidity profiles reflecting their relative liquidity value. We take assets and liabilities from the retail bank (mortgage loans and retail deposits) that show a behavior of being renewed or prolonged regardless of capital market conditions and assign them to time buckets reflecting the expected prolongation. Wholesale banking products are included with their contractual maturities.
0
75
150
225
300
Retail TransactionBanking1
OtherCustomers2
DiscretionaryWholesale
Secured Fundingand Shorts
FinancingVehicles3
Capital Marketsand Equity
December 31, 2010: total € 1,075 billionDecember 31, 2011: total € 1,133 billion
2 Other includes fiduciary, self-funding structures (e.g. X-markets), margin / Prime Brokerage cash balances (shown on a net basis)3 Includes ABCP-Conduits.Reference: Reconciliation to total balance sheet: Derivatives & settlement balances € 899 billion (€ 706 billion), add-back for netting effect for
Margin & Prime Brokerage cash balances (shown on a net basis) € 73 billion (€ 61 billion), other non-funding liabilities € 59 billion (€ 63 billion) for December 31, 2011 and December 31, 2010 respectively; figures may not add up due to rounding.
In € bn.
Composition of external funding sources
1 Sponsored loans (e.g. from Kreditanstalt für Wiederaufbau and European Investment Bank) in the amount of € 4 billion, which were included in Capital Markets and Equity for December 31, 2010, have been reflected under Other Customers. Following a revised allocation of Postbank liabilities to funding during second quarter 2011, € 5 billion and € 6 billion were reallocated from Capital Markets and Equity and Retail, respectively, to Transaction Banking. Values for December 31, 2010, shown above have been adjusted accordingly.
19% 20% 24% 25% 15% 13% 10% 10% 12% 10% 18% 19% 2% 3%
279
173
110
133
23
202
274
112 104
202
29
141
213 213

Deutsche Bank 01 – Management Report 118 Financial Report 2011 Risk Report
The funding matrix identifies the excess or shortfall of assets over liabilities in each time bucket, facilitating management of open liquidity exposures. The funding matrix analysis together with the strategic liquidity planning process, which forecasts the funding supply and demand across business units, provides the key input para-meter for our annual capital market issuance plan. Upon approval by the Management Board the capital mar-ket issuance plan establishes issuing targets for securities by tenor, volume and instrument. As of the year-end 2011, we were long funded in each of the annual time buckets of the funding matrix (2 – 10 years).
Funding and Issuance 2011 can be divided into two halves which were dominated by the evolution of the eurozone sovereign crisis: a fairly stable first six months during which our five year CDS traded in a tight range of 82 – 132 bps, averaging 98 bps and, in contrast, a volatile second six months during which our CDS traded in range of 99 – 316 bps, averaging 184 bps over the period. Although the spreads of our bonds did not exhibit the same level of volatility, a similar contrast between first six months and second half six months could be observed.
Nonetheless, we issued in benchmark format in both six-month periods. By the end of first six months 2011, we raised € 13.3 billion of our yearly requirement of € 19 billion. Over the course of the second half year 2011, we raised a further € 9.2 billion, taking the total to € 22.5 billion for the year, € 3.5 billion more than originally planned. Particularly noteworthy was a € 1.5 billion 2 year note, issued in September 2011. With our second Pfandbrief issuance of € 1 billion in March 2011 we further demonstrated our market access to an alternative, cost efficient funding source.
The average spread of our issuance over the relevant floating index (e.g. Libor) was 65 bps for the full year without material differences between the first half year and the second half year. In response to the weaker market in second half year however, we shortened the average tenor of our issuance from approximately 5 years in the first half year to approximately 4 years in the second half year, resulting in an average of 4.3 years for our issuance for the full year.
In 2012, we have modest refinancing needs of € 15 – 20 billion. We remain confident in our ability to raise private market funding through a variety of channels including benchmark issuances, private placements, cov-ered bonds as well as retail networks and believe we are not overly dependent on any one market segment.
For information regarding the maturity profile of our long-term debt, please refer to Note 31 “Long-Term Debt and Trust Preferred Securities” of our consolidated financial statements.
Transfer Pricing We operate a transfer pricing framework that applies to all businesses and ensures pricing of (i) assets in ac-cordance with their underlying liquidity risk, (ii) liabilities in accordance with their funding maturity and (iii) con-tingent liquidity exposures in accordance with the cost of providing for commensurate liquidity reserves to fund unexpected cash requirements.

Deutsche Bank 01 – Management Report 119 Financial Report 2011 Risk Report
Within this transfer pricing framework we allocate funding and liquidity risk costs and benefits to the firm’s busi-ness units and set financial incentives in line with the firm’s liquidity risk guidelines. Transfer prices are subject to liquidity (term) premiums depending on market conditions. Liquidity premiums are set by Treasury and picked up by a segregated liquidity account. The Treasury liquidity account is the aggregator of long-term liquidity costs. The management and cost allocation of the liquidity account is the key variable for transfer pricing funding costs within Deutsche Bank.
Stress Testing and Scenario Analysis We use stress testing and scenario analysis to evaluate the impact of sudden stress events on our liquidity position. The scenarios we apply have been based on historic events, such as the 1987 stock market crash, the 1990 U.S. liquidity crunch and the September 2001 terrorist attacks, liquidity crisis case studies and hypo-thetical events.
Also incorporated are the lessons learned from the latest financial markets crisis. They include the prolonged term money-market and secured funding freeze, collateral repudiation, reduced fungibility of currencies, stranded syndications as well as other systemic knock-on effects. The scenario types cover institution-specific events (e.g. rating downgrade), market related events (e.g. systemic market risk) as well as a combination of both, which links a systemic market shock with a multi-notch rating downgrade. Those scenarios are subject to regular reviews and reappraisal.
Under each of these scenarios we assume a high degree of roll-overs of maturing loans to non-wholesale customers whereas rollover of liabilities will be partially impaired resulting in a funding gap. In addition we ana-lyze the potential funding requirements from off-balance sheet commitments (e.g. drawings of credit facilities and increased collateral requirements) which could materialize under stress. We then model the steps we would take to counterbalance the resulting net shortfall in funding. Countermeasures would include the Group’s available cash and cash equivalents (over and above cash balances which form an integral part of our exist-ing clearing and settlement activities), as well as asset liquidity from unencumbered securities.
The asset liquidity analysis thereby forms an integral piece of stress testing and tracks the volume and booking location within our consolidated business inventory of unencumbered, liquid assets which we can use to raise liquidity via secured funding transactions. Securities inventories include a wide variety of different securities. As a first step, we segregate illiquid and liquid securities in each inventory. Subsequently we assign liquidity values (haircuts) to different classes of liquid securities. The liquidity of these assets is an important element in pro-tecting us against short-term liquidity squeezes.
The most immediately liquid and highest quality items within the above categories are aggregated and sepa-rately identified as our liquidity reserves. These reserves comprise available cash and cash equivalents, high-ly liquid securities as well as other unencumbered central bank eligible assets. The volume of the liquidity reserves is a function of expected stress result. These reserves are held across the major currencies and loca-tions on which the bank is active. Size and composition are subject to regular senior management review.

Deutsche Bank 01 – Management Report 120 Financial Report 2011 Risk Report
The following table presents the composition of our liquidity reserves for the dates specified.
in € bn. Dec 31, 2011 Dec 31, 2010
Available cash and cash equivalents (held primarily at central banks) 136 66 Highly liquid securities (includes government, government guaranteed and agency securities) 65 52 Other unencumbered central bank eligible securities 18 32
Total liquidity reserves 219 150
Stress testing is fully integrated in our liquidity risk management framework. For this purpose we use the con-tractual wholesale cash flows per currency and product over an eight-week horizon (which we consider the most critical time span in a liquidity crisis) and apply the relevant stress case to all potential risk drivers from on balance sheet and off balance sheet products. Beyond the eight week time horizon we analyze on a quar-terly basis the impact of a more prolonged stress period extending out to twelve months, together with mitiga-tion actions which may include some change of business model. The liquidity stress testing provides the basis for the bank’s contingency funding plans which are approved by the Management Board.
Our stress testing analysis assesses our ability to generate sufficient liquidity under extreme conditions and is a key input when defining our target liquidity risk position. The analysis is performed monthly. The following table shows stress testing results as of December 31, 2011. For each scenario, the table shows what our cu-mulative funding gap would be over an eight-week horizon after occurrence of the triggering event, how much counterbalancing liquidity we could generate via different sources as well as the resulting net liquidity position.
in € bn. Funding Gap
1 Gap Closure
2
Net Liquidity
Position
Systemic market risk 45 226 181 Emerging markets 18 232 215 1 notch downgrade (DB specific) 45 233 188 Downgrade to A-2/P-2 (DB specific) 168 246 78 Combined
3 190 241 51 1 Funding gap caused by impaired rollover of liabilities and other projected outflows. 2 Based on liquidity generation through countermeasures. 3 Combined impact of systemic market risk and downgrade to A-2/P-2.
With the increasing importance of liquidity management in the financial industry, we maintain an active dialo-gue with central banks, supervisors, rating agencies and market participants on liquidity risk-related topics. We participate in a number of working groups regarding liquidity and support efforts to create industry-wide stan-dards to evaluate and manage liquidity risk at financial institutions. In addition to our internal liquidity man-agement systems, the liquidity exposure of German banks is regulated by the Banking Act and regulations issued by the BaFin.
Liquidity Risk at Postbank In general, Postbank’s Financial Markets division is responsible for the centralized operational management of liquidity risk. BHW Bausparkasse AG and its foreign subsidiaries in New York and Luxembourg manage their risks independently using uniform Postbank group-wide procedures and processes. In the event of a liquidity shock, the Liquidity Crisis Committee has clear responsibility and authority over all Postbank units responsible for portfolios as well as all portfolio units at its subsidiaries and foreign branches.

Deutsche Bank 01 – Management Report 121 Financial Report 2011 Risk Report
Postbank’s overarching risk strategy encompasses its strategy for management of liquidity risk. The goal of liquidity management is to ensure that Postbank is solvent at all times - not only under normal conditions, but also in stress situations. Due to its strategic focus as a retail bank, Postbank enjoys a strong refinancing base in its customer business and is therefore relatively independent of the money and capital markets. To guard against unexpected cash outflows, an extensive portfolio consisting of unencumbered highly liquid and ECB-eligible securities is held that can be used to obtain liquidity rapidly through private markets or via regular cen-tral bank operations. To ensure the additional diversification of its refinancing activities, Postbank has a Pfandbrief license allowing it to issue public sector Pfandbriefe and mortgage Pfandbriefe.
At Postbank Liquidity Risk Controlling (until September 30, 2011, Market Risk Controlling) assesses the li-quidity status of Postbank each business day on the basis of liquidity gap analyses and cash flow forecasts, with operational management of risk being performed on the basis of the liquidity status. Risk management is also based on a series of more far-reaching analyses of liquidity management, in addition to regular Post-bank’s Group-wide liquidity and issue planning and also includes regular stress testing. The stress test results as of year-end 2011 support the comfortable liquidity position of Postbank Group. Even under the combined stress impact of the extreme scenario a comfortable liquidity surplus can be observed. This is not least due to the stability of customer deposits and Postbank’s extensive portfolio of ECB-eligible securities.
Maturity Analysis of Financial Liabilities The following table presents a maturity analysis of the earliest contractual undiscounted cash flows for financial liabilities as of December 31, 2011, and 2010.
Dec 31, 2011
in € m. On demand Due within 3 months
Due between 3 and 12 months
Due between 1 and 5 years
Due after 5 years
Noninterest bearing deposits 99,047 − − − − Interest bearing deposits 163,620 277,462 30,600 21,736 16,008 Trading liabilities
1 63,886 − − − − Negative market values from derivative financial instruments
1 838,817 − − − − Financial liabilities designated at fair value through profit or loss 99,182 45,211 6,204 6,695 9,189 Investment contract liabilities
2 − 604 840 1,338 4,643 Negative market values from derivative financial instruments qualifying for hedge accounting
3 452 135 11 1,018 3,170 Central bank funds purchased 2,866 2,050 − − − Securities sold under repurchase agreements 24,781 4,975 1,022 − 19 Securities loaned 7,643 38 − − 451 Other short-term borrowings 48,879 15,471 1,330 − − Long-term debt 3,608 9,691 26,100 83,610 68,256 Trust preferred securities − 167 3,163 5,966 6,359 Other financial liabilities 143,375 3,788 345 660 47 Off-balance sheet loan commitments 87,433 − − − − Financial guarantees 23,684 − − − − Total
4 1,607,273 359,592 69,615 121,025 108,142 1 Trading liabilities and derivatives not qualifying for hedge accounting balances are recorded at fair value. We believe that this best represents the cash flow that
would have to be paid if these positions had to be closed out. Trading liabilities and derivatives not qualifying for hedge accounting balances are shown within “on demand” which management believes most accurately reflects the short-term nature of trading activities. The contractual maturity of the instruments may however extend over significantly longer periods.
2 These are investment contracts where the policy terms and conditions result in their redemption value equaling fair value. See Note 40 “Insurance and Investment Contracts” for more detail on these contracts.
3 Derivatives designated for hedge accounting are recorded at fair value and are shown in the time bucket at which the hedged relationship is expected to terminate. 4 The balances in the table do not agree to the numbers in the Group balance sheet as the cash flows included in the table are undiscounted. This analysis
represents the worst case scenario for the Group if they were required to repay all liabilities earlier than expected. We believe that the likelihood of such an event occurring is remote.

Deutsche Bank 01 – Management Report 122 Financial Report 2011 Risk Report
Dec 31, 2010
in € m. On demand Due within 3 months
Due between 3 and 12 months
Due between 1 and 5 years
Due after 5 years
Noninterest bearing deposits 89,068 − − − − Interest bearing deposits
1 120,154 253,772 31,725 26,178 13,087 Trading liabilities
2 68,859 − − − − Negative market values from derivative financial instruments
2,3 647,195 − − − − Financial liabilities designated at fair value through profit or loss 94,948
4,5 65,093
5 8,348
5 8,057 3,736 Investment contract liabilities
6 − 572 888 1,367 5,071 Negative market values from derivative financial instruments qualifying for hedge accounting
7 852 141 256 1,113 4,257 Central bank funds purchased 4,456 1,848 − − − Securities sold under repurchase agreements 2,384 14,570 3,056 1,585 23 Securities loaned 3,024 54 − − 198 Other short-term borrowings 49,904 13,439 1,495 − − Long-term debt 1,695 11,647 16,879 80,713 58,153 Trust preferred securities − − 2,434 4,481 5,335 Other financial liabilities 119,693 6,160 268 516 22 Off-balance sheet loan commitments 79,522
4 − − − − Financial guarantees 23,272
4 − − − −
Total
8 1,305,026 367,298 65,351 124,011 89,881 1 The maturity split for building saving deposits included in interest bearing deposits was adjusted to reflect the earliest contractual maturity or first call. Previously
the maturity split was based on expected maturities. 2 Trading liabilities and derivatives not qualifying for hedge accounting balances are recorded at fair value. We believe that this best represents the cash flow that
would have to be paid if these positions had to be closed out. Trading liabilities and derivatives not qualifying for hedge accounting balances are shown within “on demand” which management believes most accurately reflects the short-term nature of trading activities. The contractual maturity of the instruments may however extend over significantly longer periods.
3 The initial acquisition accounting for ABN AMRO, which was finalized at March 31, 2011, resulted in a retrospective reduction of € 24 million in the acquisition date fair value of net assets acquired. For more information please refer to Note 04 “Acquisitions and Dispositions”.
4 Prior year numbers have been restated by € 20.8 billion due to the notional amount of some FVO loan commitments which were included in off-balance sheet loan commitments. Furthermore they were adjusted by € 5.7 billion due to the notional amount of some FVO financial guarantees which were included in financial guarantees. Now they are correctly included within financial liabilities designated at fair value through profit and loss.
5 Prior year numbers have been restated. The amounts for certain FVO securities sold under repurchase agreement were moved from the time buckets “due within 3 months” and “due between 3 and 12 months” to “on demand”.
6 These are investment contracts where the policy terms and conditions result in their redemption value equalling fair value. See Note 40 “Insurance and Investment Contracts” for more detail on these contracts.
7 Derivatives designated for hedge accounting are recorded at fair value and are shown in the time bucket at which the hedged relationship is expected to terminate. 8 The balances in the table do not agree to the numbers in the Group balance sheet as the cash flows included in the table are undiscounted. This analysis
represents the worst case scenario for the Group if they were required to repay all liabilities earlier than expected. We believe that the likelihood of such an event occurring is remote. Interest cash flows have been excluded from the table.
Capital Management
Our Treasury function manages our capital at Group level and locally in each region, except that Postbank manages its capital on a group level and locally on its own. The allocation of financial resources, in general, and capital, in particular, favors business portfolios with the highest positive impact on the Group’s profitability and shareholder value. As a result, Treasury periodically reallocates capital among business portfolios.

Deutsche Bank 01 – Management Report 123 Financial Report 2011 Risk Report
Treasury implements our capital strategy, which itself is developed by the Capital and Risk Committee and approved by the Management Board, including the issuance and repurchase of shares. We are committed to maintain our sound capitalization. Overall capital demand and supply are constantly monitored and adjusted, if necessary, to meet the need for capital from various perspectives. These include book equity based on IFRS accounting standards, regulatory capital and economic capital.
The allocation of capital, determination of our funding plan and other resource issues are framed by the Capital and Risk Committee.
Regional capital plans covering the capital needs of our branches and subsidiaries are prepared on a semi-annual basis and presented to the Group Investment Committee. Most of our subsidiaries are subject to legal and regulatory capital requirements. Local Asset and Liability Committees attend to those needs under the stewardship of regional Treasury teams. Furthermore, they safeguard compliance with requirements such as restrictions on dividends allowable for remittance to Deutsche Bank AG or on the ability of our subsidiaries to make loans or advances to the parent bank. In developing, implementing and testing our capital and liquidity, we take such legal and regulatory requirements into account.
Our core currencies are euro, U.S. dollar and pound sterling. Treasury manages the sensitivity of our capital ratios against swings in core currencies. The capital invested into our foreign subsidiaries and branches in non-core currencies is largely hedged against foreign exchange swings, except for the Chinese yuan which we currently do not hedge. Treasury determines which currencies are to be hedged, develops suitable hedging strategies and finally executes these hedges.
Treasury is represented on the investment committee of the largest Deutsche Bank pension fund which sets the investment guidelines. This representation ensures that pension assets are aligned with pension liabilities, thus protecting the bank’s capital base.
Treasury constantly monitors the market for liability management trades. Such trades represent an anticyclical opportunity to create Core Tier 1 capital by buying back Deutsche Bank’s issuances below par.
The Core Tier 1 capital ratio amounted to 9.5 % at year-end 2011. It is already above the 9 % level proposed by the European Banking Authority (EBA) and agreed by the European Council for the EU-Wide Capital Exercise, ahead of the June 30, 2012 deadline. It also covers the shortfall of € 388 million in relation to European Economic Area sovereign exposure which was determined as at September 30, 2011 solely for the purposes of the EU-Wide Capital Exercise. We will strive to adhere to the 9 % threshold by June 30, 2012.
In the first quarter 2011, we changed the methodology used for allocating average active equity to the business segments and to Consolidation & Adjustments in proportion to their regulatory requirements. Under the new methodology economic capital as basis for allocation is substituted by risk weighted assets and certain regulatory capital deduction items. All other items of the capital allocation framework remain unchanged. The total amount allocated continues to be determined based on the higher of our overall economic risk exposure or regulatory capital demand. In 2011, we derive our internal demand for regulatory capital assuming a Tier 1 ratio of 10.0 %. If our average active equity exceeds the higher of the overall economic risk exposure or the regulatory capital demand, this surplus is assigned to Consolidation & Adjustments.
During the period from the 2010 Annual General Meeting (May 27, 2010) until the 2011 Annual General Meeting (May 26, 2011), 28.5 million shares were purchased, of which 0.5 million were purchased via sold put options which were executed by the counterparty at maturity date. 22.0 million of the shares purchased were

Deutsche Bank 01 – Management Report 124 Financial Report 2011 Risk Report
used for equity compensation purposes and 6.5 million shares were used to increase the Group’s Treasury position for future equity compensation. 9.8 million shares were purchased from January 1, 2011 until May 26, 2011, none of which via sold put options. In addition, 10.0 million physically settled call options were purchased in first quarter 2011 to hedge existing equity compensation awards. These call options have a remaining maturity of more than 18 months and were purchased under the above mentioned authorization from the Annual General Meeting to buy back shares by using derivatives. In second quarter 2011, the Group restructured 15.3 million existing call options in order to allow physical settlement according to the above mentioned authorization. These call options have a remaining maturity below 18 months. As of the 2011 Annual General Meeting, the number of shares held in Treasury from buybacks totaled 7.6 million.
The 2011 Annual General Meeting granted the Group’s management board the authority to buy back up to 92.9 million shares before the end of November 2015. Thereof 46.5 million shares can be purchased by using derivatives. These authorizations replaced the authorizations of the 2010 Annual General Meeting. During the period from the 2011 Annual General Meeting until December 31, 2011, 27.4 million shares were purchased, thereof 10.9 million of the shares purchased were used for equity compensation purposes and 16.5 million shares were used to increase the Group’s Treasury position for future equity compensation. As of December 31, 2011, the number of shares held in Treasury from buybacks totaled 24.1 million.
To take advantage of Deutsche Bank’s low share price in the third quarter 2011, Treasury unwound the 10.0 million physically settled call options purchased in first quarter 2011 and entered into new 10.0 million physically settled call options with significant lower strike prices. These call options were purchased under the authorization by the 2011 Annual General Meeting. From the 10.0 million call options, 6.0 million have a remaining maturity of more than 18 months. In addition to these 10 million call options, Treasury restructured additional call options to further hedge the Group’s obligation to deliver shares for equity compensation purposes.
Total outstanding hybrid Tier 1 capital (substantially all noncumulative trust preferred securities) as of Decem-ber 31, 2011, amounted to € 12.7 billion compared to € 12.6 billion as of December 31, 2010. This increase was mainly due to the foreign exchange effects of the strengthened U.S. dollar to the U.S. dollar denominated hybrid Tier 1 capital. In 2011, the Group neither raised nor redeemed any hybrid Tier 1 capital.
In 2011, the Group did not issue any lower Tier 2 capital (qualified subordinated liabilities). Profit participation rights amounted to € 1.2 billion as of December 31, 2011, unchanged to December 31, 2010. Total lower Tier 2 capital as of December 31, 2011, amounted to € 9.4 billion compared to € 10.7 billion as of December 31, 2010. Cumulative preferred securities amounted to € 0.3 billion as of December 31, 2011, unchanged to December 31, 2010.
Capital Management at Postbank Postbank manages its capital by continuously monitoring capital supply and demand. Capital management aims at regulatory as well as at economic capital adequacy, in line with the concept of risk bearing capacity. In general, the capital allocation requires an appropriate return on regulatory capital demand. The capital allocation is approved by Postbank’s Management Board based on a multiyear plan.
Deutsche Bank 01 – Management Report 125 Financial Report 2011 Risk Report
The regulatory and economic capital demand is continously monitored to adjust the available capital if required. Capital demand forecasts are regularly determined and carried forward based on the planned development of the business volume and results as well as expected risk parameter changes. Capital ratios are managed in compliance with the Postbank’s Management Board approved statutory guidelines, by steering the existing and new transaction volume, by issuance of Tier 1 and Tier 2 capital instruments or by executing risk mitigating capital market transactions.
Balance Sheet Management
We manage our balance sheet on a Group level excluding Postbank and, where applicable, locally in each region. In the allocation of financial resources we favor business portfolios with the highest positive impact on our profitability and shareholder value. Our balance sheet management function has the mandate to monitor and analyze balance sheet developments and to track certain market-observed balance sheet ratios. Based on this we trigger discussion and management action by the Capital and Risk Committee. While we monitor IFRS balance sheet developments, our balance sheet management is principally focused on adjusted values as used in our leverage ratio target definition, which is calculated using adjusted total assets and adjusted total equity figures.
Similarly Postbank follows a value-oriented financial management approach that includes balance sheet management.
Leverage Ratio (Target Definition): We calculate our leverage ratio as a non-GAAP financial measure by dividing total assets by total equity. We disclose an adjusted leverage ratio, which is calculated using a target definition, for which the following adjustments are made to the reported IFRS assets and equity:
— Total assets under IFRS are adjusted to reflect additional netting provisions to obtain total assets adjusted. Under IFRS offsetting of financial assets and financial liabilities is required when an entity, (1) currently has a legally enforceable right to set off the recognized amounts; and (2) intends either to settle on a net basis, or to realize the asset and settle the liability simultaneously. IFRS specifically focuses on the inten-tion to settle net in the ordinary course of business, irrespective of the rights in default. As most derivative contracts covered by a master netting agreement do not settle net in the ordinary course of business they must be presented gross under IFRS. Repurchase and reverse repurchase agreements are also pre-sented gross, as they also do not settle net in the ordinary course of business, even when covered by a master netting agreement. It has been industry practice in the U.S. to net the receivables and payables on unsettled regular way trades. This is not permitted under IFRS. We make the netting adjustments de-scribed above in calculating the target definition of the leverage ratio.

Deutsche Bank 01 – Management Report 126 Financial Report 2011 Risk Report
— Total equity under IFRS is adjusted to reflect pro-forma fair value gains and losses on our own debt (post-tax, estimate assuming that substantially all of our own debt was designated at fair value), to obtain total equity adjusted. The tax rate applied for this calculation is a blended uniform tax rate of 35 %.
We apply these adjustments in calculating the leverage ratio according to the target definition to improve com-parability with competitors. The target definition of the leverage ratio is used consistently throughout the Group in managing the business. There will still be differences in the way competitors calculate their leverage ratios compared to our target definition of the leverage ratio. Therefore our adjusted leverage ratio should not be compared to other companies’ leverage ratios without considering the differences in the calculation. Our leverage ratio according to our target definition is not likely to be identical to, nor necessarily indicative of, what our leverage ratio would be under any current or future bank regulatory leverage ratio requirement.
The following table presents the adjustments made in calculating our leverage ratio according to the target definition.
in € bn. Dec 31, 2011 Dec 31, 2010
Total assets (IFRS) 2,164 1,906
Adjustment for additional derivatives netting (782) (601) Adjustment for additional pending settlements netting (105) (86) Adjustment for additional reverse repo netting (10) (8) Total assets (adjusted) 1,267 1,211
Total equity (IFRS) 54.7 50.4
Adjustment for pro-forma fair value gains (losses) on the Group's own debt (post-tax)
1 4.5 2.0 Total equity (adjusted) 59.2 52.4
Leverage ratio based on total equity
According to IFRS 40 38 According to target definition 21 23 1 The estimated cumulative tax effect on pro-forma fair value gains (losses) on such own debt was € (2.4) billion and € (1.1) billion at December 31, 2011 and
December 31, 2010, respectively.
As of December 31, 2011, on a consolidated basis our leverage ratio according to our target definition of 21 has further reduced compared to the prior year-end, and is well below our leverage ratio target of 25. Our leverage ratio calculated as the ratio of total assets under IFRS to total equity under IFRS was 40 as of De-cember 31, 2011, a slight increase compared to 38 at the end of 2010.

Deutsche Bank 01 – Management Report 127 Financial Report 2011 Risk Report
Overall Risk Position
Economic Capital To determine our overall (nonregulatory) risk position, we generally consider diversification benefits across risk types except for business risk, which we aggregate by simple addition.
The table below shows our overall risk position as measured by the economic capital usage calculated for credit, market, operational and business risk for the dates specified.
in € m. Dec 31, 2011 Dec 31, 2010
Economic capital usage Credit risk 12,812 12,785 Market Risk 12,003 13,160
Trading market risk 4,724 6,420 Nontrading market risk 7,278 6,740
Operational risk 4,846 3,682 Diversification benefit across credit, market and operational risk (4,264) (3,534) Sub-total credit, market and operational risk 25,397 26,093
Business risk 980 1,085
Total economic capital usage 26,377 27,178
As of December 31, 2011, our economic capital usage totaled € 26.4 billion, which is € 801 million, or 3 %, below the € 27.2 billion economic capital usage as of December 31, 2010. The lower overall risk position was mainly driven by decreases in trading market risk economic capital reflecting risk reductions as well as defen-sive positioning, off-set by higher operational risk economic capital principally reflecting a new safety margin intended to cover unforeseen legal risks from the current financial crisis.
As of December 31, 2011, the economic capital usage included € 4.3 billion in relation to Postbank, which is € 259 million or 6 % lower than the € 4.6 billion economic capital as at December 31, 2010. This decrease reflects de-risking effects, resulting in a credit risk economic capital reduction of € 1.3 billion, which was partial-ly offset by parameter and model alignment related increases, also in credit risk related economic capital, of € 947 million.
Our economic capital usage for credit risk totaled € 12.8 billion as of December 31, 2011. The increase of € 27 million, a change below 1 %, primarily reflects the effects from our risk reduction initiatives, compensated by the impact from regular recalibrations of the credit risk parameters and other refinements of the credit risk model mainly in relation to Postbank.
Deutsche Bank 01 – Management Report 128 Financial Report 2011 Risk Report
Our economic capital usage for market risk decreased by € 1.2 billion, or 9 %, to € 12.0 billion as of December 31, 2011. The reduction was driven by trading market risk, which decreased by € 1.7 billion, or 26 %, primarily driven by the above mentioned risk reductions and defensive positioning resulting in a lower market risk profile. Non trading market risk economic capital usage increased by € 538 million, or 8 %, primarily reflecting the increase in strategic investment and structural FX positions, which was partially offset by lower economic capi-tal for our Guaranteed Funds portfolio as well as asset sales.
Our economic capital usage for operational risk increased by € 1.2 billion, or 32 %, to € 4.8 billion as of De-cember 31, 2011. The increase is primarily due to the implementation of a new safety margin applied in our AMA model, intended to cover unforeseen legal risks from the current financial crisis.
Business risk economic capital usage, consisting of a strategic risk and a tax risk component, totaled € 980 million as of December 31, 2011 reflecting a moderate reduction of € 105 million or 10 % in comparison to an economic capital usage of 1.1 billion as of December 2010.
The diversification effect of the economic capital usage across credit, market and operational risk increased by € 729 million, or 21 %, as of December 31, 2011 mainly reflecting changes in risk classes as outlined above and the relatively low correlation of operational risk economic capital with both credit and market risk economic capital.
The table below shows the economic capital usage of our business segments for the dates specified.
in € m. Dec 31, 2011 Dec 31, 2010
Corporate & Investment Bank 14,469 16,119 Corporate Banking & Securities 13,175 14,828 Global Transaction Banking 1,294 1,291
Private Clients and Asset Management 8,897 9,394 Asset and Wealth Management 1,703 2,717 Private & Business Clients 7,193 6,677
Corporate Investments 1,618 902 Consolidation & Adjustments 1,393 762
Total economic capital requirement 26,377 27,178
The future allocation of economic capital may change to reflect refinements in our risk measurement methodology.
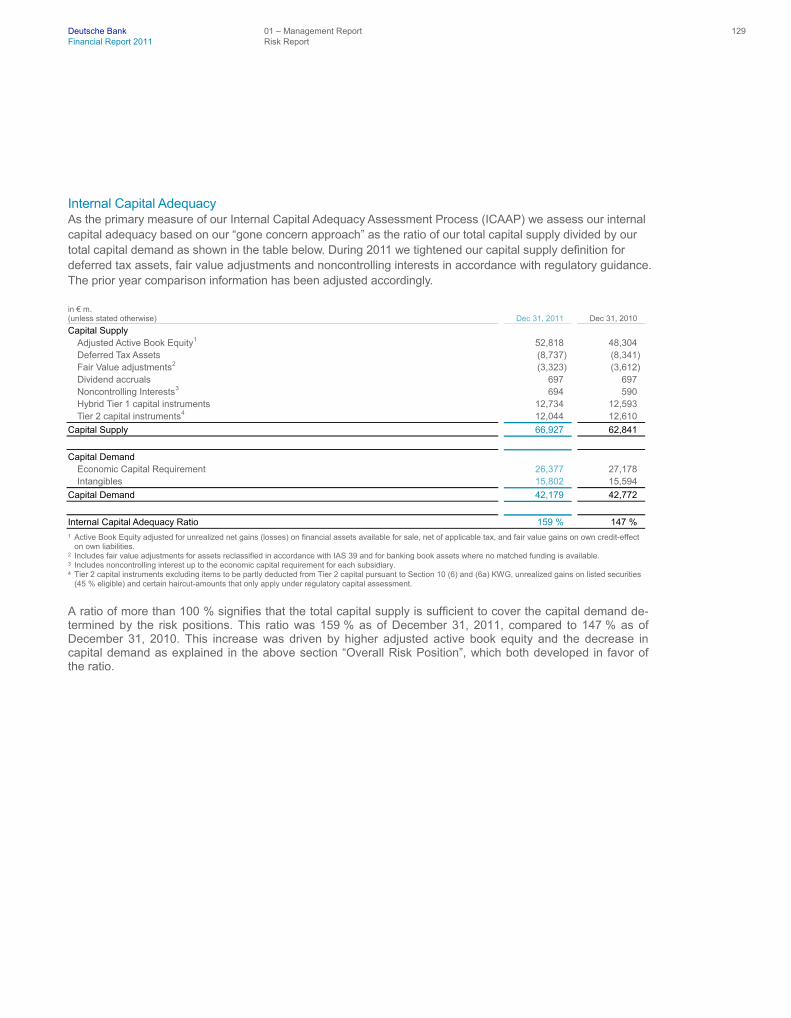
Deutsche Bank 01 – Management Report 129 Financial Report 2011 Risk Report
Internal Capital Adequacy As the primary measure of our Internal Capital Adequacy Assessment Process (ICAAP) we assess our internal capital adequacy based on our “gone concern approach” as the ratio of our total capital supply divided by our total capital demand as shown in the table below. During 2011 we tightened our capital supply definition for deferred tax assets, fair value adjustments and noncontrolling interests in accordance with regulatory guidance. The prior year comparison information has been adjusted accordingly.
in € m. (unless stated otherwise) Dec 31, 2011 Dec 31, 2010
Capital Supply Adjusted Active Book Equity
1 52,818 48,304 Deferred Tax Assets (8,737) (8,341) Fair Value adjustments
2 (3,323) (3,612) Dividend accruals 697 697 Noncontrolling Interests
3 694 590 Hybrid Tier 1 capital instruments 12,734 12,593 Tier 2 capital instruments
4 12,044 12,610
Capital Supply 66,927 62,841
Capital Demand Economic Capital Requirement 26,377 27,178 Intangibles 15,802 15,594
Capital Demand 42,179 42,772
Internal Capital Adequacy Ratio 159 % 147 % 1 Active Book Equity adjusted for unrealized net gains (losses) on financial assets available for sale, net of applicable tax, and fair value gains on own credit-effect
on own liabilities. 2 Includes fair value adjustments for assets reclassified in accordance with IAS 39 and for banking book assets where no matched funding is available. 3 Includes noncontrolling interest up to the economic capital requirement for each subsidiary. 4 Tier 2 capital instruments excluding items to be partly deducted from Tier 2 capital pursuant to Section 10 (6) and (6a) KWG, unrealized gains on listed securities
(45 % eligible) and certain haircut-amounts that only apply under regulatory capital assessment.
A ratio of more than 100 % signifies that the total capital supply is sufficient to cover the capital demand de-termined by the risk positions. This ratio was 159 % as of December 31, 2011, compared to 147 % as of December 31, 2010. This increase was driven by higher adjusted active book equity and the decrease in capital demand as explained in the above section “Overall Risk Position”, which both developed in favor of the ratio.

Deutsche Bank 01 – Management Report 130 Financial Report 2011 Internal Control over Financial Reporting
General Management of Deutsche Bank and its consolidated subsidiaries is responsible for establishing and maintain-ing adequate internal control over financial reporting (“ICOFR”). Our internal control over financial reporting is a process designed under the supervision of our Chairman of the Management Board and our Chief Finan-cial Officer to provide reasonable assurance regarding the reliability of financial reporting and the preparation of the firm’s consolidated financial statements for external reporting purposes in accordance with International Financial Reporting Standards (IFRS). ICOFR includes our disclosure controls and procedures to prevent misstatements.
Risks in financial reporting The main risks in financial reporting are that either financial statements do not present a true and fair view due to inadvertent or intentional errors (fraud) or the publication of financial statements is not done on a timely basis. These risks may reduce investor confidence or cause reputational damage and may have legal conse-quences including banking regulatory interventions. A lack of fair presentation arises when one or more financial statement amounts or disclosures contain misstatements (or omissions) that are material. Misstate-ments could be deemed material if they could individually or collectively influence economic decisions that us-ers make on the basis of the financial statements.
To address those risks of financial reporting, management of the Group has established ICOFR to provide reasonable but not absolute assurance against misstatements. The design of the ICOFR is based on internal control framework established in Internal control – Integrated Framework issued by the Committee of Sponsor-ing Organizations of the Treadway Commission (“COSO”). COSO recommends the establishment of specific objectives to facilitate the design and evaluate adequacy of a control system. As a result in establishing ICOFR, management has adopted the following financial statement objectives:
— Existence – assets and liabilities exist and transactions have occurred. — Completeness – all transactions are recorded, account balances are included in the financial statements. — Valuation – assets, liabilities and transactions are recorded in the financial reports at the appropriate
amounts. — Rights and Obligations and ownership – rights and obligations are appropriately recorded as assets and
liabilities. — Presentation and disclosures – classification, disclosure and presentation of financial reporting is
appropriate. — Safeguarding of assets – unauthorized acquisitions, use or disposition of assets is prevented or detected
in a timely manner.
However, any internal control system, including ICOFR, no matter how well conceived and operated, can pro-vide only reasonable, not absolute, assurance that the objectives of that control system are met. As such, dis-closure controls and procedures or systems for ICOFR may not prevent all error and all fraud. Further, the design of a control system must reflect the fact that there are resource constraints, and the benefits of con-trols must be considered relative to their costs.
Internal Control over Financial Reporting

Deutsche Bank 01 – Management Report 131 Financial Report 2011 Internal Control over Financial Reporting
Organization of Internal Control System Functions involved in the system of internal control over financial reporting Controls within the system of ICOFR are performed by all business functions and infrastructure functions with an involvement in assuring the reliability of these books and records that underlie the financial statements. As a result, the operation of ICOFR involves a large number of staff based mainly in the following functions: Finance, Group Technology and Operations, Risk, and Tax.
Finance is responsible for the periodic preparation of the financial statements and operates independently from the businesses. Within Finance, different departments have control responsibilities which contribute to the overall preparation process:
— Finance specialists for businesses or entities – responsible for assuring the quality of financial data by performing validation and control. They are in close contact with business, infrastructure and legal entity management and employ their specific knowledge to address financial reporting issues arising on products and transactions, as well as validating reserving and other judgmental adjustments. Entity and business related specialists add the perspective of legal entities to the business view and sign-off on the financial reporting of their entities.
— Finance-Group Reporting – responsible for Group-wide activities which include the preparation of group financial and management information, forecasting and planning, and risk reporting. Finance-Group Re-porting sets the reporting timetables, performs the consolidation and aggregation processes, effects the elimination entries for inter and intra group activities, controls the period end and adjustment processes, compiles the Group financial statements, and considers and incorporates comments as to content and presentation made by senior management and external advisors.
— Accounting Policy and Advisory Group (“APAG”) – responsible for developing the Group’s interpretation of International Financial Reporting Standards and their consistent application within the Group. APAG pro-vides accounting advice and consulting services to Finance and the wider business, and ensures the timely resolution of corporate and transaction-specific accounting issues.
— Global Valuation Oversight Group (“GVO”) and business aligned valuation specialists – responsible for developing policies and minimum standards for valuation, providing related implementation guidance when undertaking valuation control work, and challenging and validating valuation control results. They act as the single point of contact on valuation topics for external parties (such as regulators and external auditors).
Deutsche Bank 01 – Management Report 132 Financial Report 2011 Internal Control over Financial Reporting
The operation of ICOFR is also importantly supported by Group Technology and Operations, Risk and Group Tax. Although these functions are not directly involved in the financial preparation process, they significantly contribute to the production of financial information:
— Group Technology and Operations (“GTO”) – responsible for confirming transactions with counterparties, and performing reconciliations both internally and externally of financial information between systems, de-pots and exchanges. GTO also undertake all transaction settlement activity on behalf of the Group and perform reconciliations of nostro account balances.
— Risk – responsible for developing policies and standards for managing credit, market, legal, liquidity and operational risks. Risk identifies and assesses the adequacy of credit and operational provisions.
— Group Tax – responsible for producing income tax related financial data in conjunction with Finance, cov-ering the assessment and planning of current and deferred income taxes and the collection of tax related information. Group Tax monitors the income tax position and controls the provisioning for tax risks.
Controls to minimize the risk of financial reporting misstatement The system of ICOFR consists of a large number of internal controls and procedures to minimize the risk of misstatement of the financial statements. Such controls are integrated into the operating process and include those which:
— are ongoing or permanent in nature such as supervision within written policies and procedures or segrega-tion of duties,
— operate on a periodic basis such as those which are performed as part of the annual financial statement preparation process.
— are preventative or detective in nature. — have a direct or indirect impact on the financial statements themselves. Controls which have an indirect
effect on the financial statements include IT general controls such as system access and deployment con-trols whereas a control with a direct impact could be, for example, a reconciliation which directly supports a balance sheet line item.
— feature automated and/or manual components. Automated controls are control functions embedded within system processes such as application enforced segregation of duty controls and interface checks over the completeness and accuracy of inputs. Manual internal controls are those operated by an individual or group of individuals such as authorization of transactions.

Deutsche Bank 01 – Management Report 133 Financial Report 2011 Internal Control over Financial Reporting
The combination of individual controls encompasses all of the following aspects of the system of ICOFR:
— Accounting policy – design and implementation. Controls to ensure the consistent recording and reporting of the Group’s business activities on a global basis in accordance with authorized accounting policies.
— Reference data. Controls over reference data in relation to the general ledger and on and off-balance sheet transactions including product reference data.
— Transaction approval, capture and confirmation. Controls to ensure the completeness and accuracy of recorded transactions as well as appropriate authorization. Such controls include transaction confirmations which are sent to and received from counterparties to ensure that trade details are corroborated.
— Reconciliation controls, both externally and internally. Inter-system reconciliations are performed between relevant systems for all trades, transactions, positions or relevant parameters. External reconciliations include nostro account, depot and exchange reconciliations.
— Valuation including the independent price verification process (“IPV”). Finance performs IPV controls at least monthly, in order to gain comfort as to the reasonableness of the front office valuation. The results of the IPV processes are assessed on a monthly basis by the Valuation Control Oversight Committee. Business aligned valuation specialists focus on valuation approaches and methodologies for various asset classes and perform IPV for complex derivatives and structured products.
— Taxation. Controls to ensure that tax calculations are performed properly and that tax balances are appro-priately recorded in the financial statements.
— Reserving and judgmental adjustments. Controls to ensure reserving and other judgmentally based ad-justments are authorized and reported in accordance with the approved accounting policies.
— Balance Sheet substantiation. Controls relating to the substantiation of balance sheet accounts to ensure the integrity of general ledger account balances based on supporting evidence.
— Consolidation and other period end reporting controls. At period end, all businesses and regions submit their financial data to the Group for consolidation. Controls over consolidation include the validation of ac-counting entries required to eliminate the effect of inter and intra company activities. Period end reporting controls include general ledger month end close processes and the review of late adjustments.
— Financial Statement disclosure and presentation. Controls over compilation of the financial statements themselves including preparation of disclosure checklists and compliance with the requirements thereof, and review and sign-off of the financial statements by senior Finance management. The financial state-ments are also subject to approval by the Management Board, and the Supervisory Board and its Audit Committee.

Deutsche Bank 01 – Management Report 134 Financial Report 2011 Internal Control over Financial Reporting
Measuring effectiveness of internal control Each year, management of the Group undertakes a formal evaluation of the adequacy and effectiveness of the system of ICOFR. The assessment as of December 31, 2011 encompasses for the first time the ICOFR of Deutsche Postbank AG, which was initially consolidated on December 3, 2010. This evaluation incorporated an assessment of the effectiveness of the control environment as well as the detailed controls which make up the system of ICOFR taking into account:
— The financial misstatement risk of the financial statement line items, considering such factors as materiality and the susceptibility of the particular financial statement item to misstatement.
— The susceptibility of identified controls to failure, considering such factors as the degree of automation, complexity, risk of management override, competence of personnel and the level of judgment required.
These factors, in aggregate, determine the nature and extent of evidence that management requires in order to be able to assess whether or not the operation of the system of ICOFR is effective. The evidence itself is gen-erated from procedures integrated with the daily responsibilities of staff or from procedures implemented spe-cifically for purposes of the ICOFR evaluation. Information from other sources also forms an important component of the evaluation since such evidence may either bring additional control issues to the attention of management or may corroborate findings. Such information sources include:
— Reports on audits carried out by or on behalf of regulatory authorities — External Auditor reports — Reports commissioned to evaluate the effectiveness of outsourced processes to third parties
In addition, Group Audit provides assurance over the design and operating effectiveness of ICOFR by perform-ing periodic and ad-hoc risk-based audits. Reports are produced summarizing the results from each audit performed which are distributed to the responsible managers for the activities concerned. These reports, to-gether with the evidence generated by specific further procedures that Group Audit performs for the purpose also provide evidence to support the annual evaluation by management of the overall operating effectiveness of the ICOFR.
As a result of the evaluation, management has concluded that ICOFR is appropriately designed and operating effectively as of 31. December, 2011.

Deutsche Bank 01 – Management Report 135 Financial Report 2011 Information pursuant to Section 315 (4) of the German Commercial Code and Explanatory
Report
Structure of the Share Capital As of December 31, 2011, Deutsche Bank’s issued share capital amounted to € 2,379,519,078.40 consisting of 929,499,640 ordinary shares without par value. The shares are fully paid up and in registered form. Each share confers one vote.
Restrictions on Voting Rights or the Transfer of Shares Under Section 136 of the German Stock Corporation Act the voting right of the affected shares is excluded by law. As far as the bank held own shares as of December 31, 2010 in its portfolio according to Section 71b of the German Stock Corporation Act no rights could be exercised. We are not aware of any other restrictions on voting rights or the transfer of shares.
Shareholdings which Exceed 10 % of the Voting Rights The German Securities Trading Act (Wertpapierhandelsgesetz) requires any investor whose share of voting rights reaches, exceeds or falls below certain thresholds as the result of purchases, disposals or otherwise, must notify us and the German Federal Financial Supervisory Authority (BaFin) thereof. The lowest threshold is 3 %. We are not aware of any shareholder holding directly or indirectly 10 % or more of the voting rights.
Shares with Special Control Rights Shares which confer special control rights have not been issued.
System of Control of any Employee Share Scheme where the Control Rights are not Exercised Directly by the Employees The employees, who hold Deutsche Bank shares, exercise their control rights as other shareholders in accord-ance with applicable law and the Articles of Association (Satzung).
Rules Governing the Appointment and Replacement of Members of the Management Board Pursuant to the German Stock Corporation Act (Section 84) and the Articles of Association of Deutsche Bank (Section 6) the members of the Management Board are appointed by the Supervisory Board. The number of Management Board members is determined by the Supervisory Board. According to the Articles of Association, the Management Board has at least three members. The Supervisory Board may appoint one member of the Management Board as Chairperson of the Management Board. Members of the Management Board may be appointed for a maximum term of up to five years. They may be re-appointed or have their term extended for one or more terms of up to a maximum of five years each. The German Co-Determination Act (Mitbestim-mungsgesetz; Section 31) requires a majority of at least two thirds of the members of the Supervisory Board to appoint members of the Management Board. If such majority is not achieved, the Mediation Committee shall give, within one month, a recommendation for the appointment to the Management Board. The Supervisory Board will then appoint the members of the Management Board with the majority of its members. If such ap-pointment fails, the Chairperson of the Supervisory Board shall have two votes in a new vote. If a required member of the Management Board has not been appointed, the Local Court (Amtsgericht) in Frankfurt am Main shall, in urgent cases, make the necessary appointments upon motion by any party concerned (Section 85 of the Stock Corporation Act).
Pursuant to the German Banking Act (Kreditwesengesetz) evidence must be provided to the German Federal Financial Supervisory Authority (BaFin) and the Deutsche Bundesbank that the member of the Management Board has adequate theoretical and practical experience of the businesses of the Bank as well as managerial experience before the member is appointed (Sections 24 (1) No. 1 and 33 (2) of the Banking Act).
Information pursuant to Section 315 (4) of the German Commercial Code and Explanatory Report

Deutsche Bank 01 – Management Report 136 Financial Report 2011 Information pursuant to Section 315 (4) of the German Commercial Code and Explanatory
Report
The Supervisory Board may revoke the appointment of an individual as member of the Management Board or as Chairperson of the Management Board for good cause. Such cause includes in particular a gross breach of duties, the inability to manage the Bank properly or a vote of no-confidence by the shareholders’ meeting (Hauptversammlung, referred to as the General Meeting), unless such vote of no-confidence was made for obviously arbitrary reasons.
The BaFin may appoint a special representative and transfer to such special representative the responsibility and powers of individual members of the Management Board if such members are not trustworthy or do not have the required competencies or if the credit institution does not have the required number of Management Board members. If members of the Management Board are not trustworthy or do not have the required expertise or if they have missed a material violation of the principles of sound management or if they have not addressed identified violations, the BaFin may transfer to the special representative the responsibility and powers of the Management Board in its entirety. In any such case, the responsibility and powers of the Management Board members concerned are suspended (Section 45c (1) through (3) of the Banking Act).
If the discharge of a bank’s obligations to its creditors is endangered or if there are valid concerns that effective supervision of the bank is not possible, the BaFin may take temporary measures to avert that risk. It may also prohibit members of the Management Board from carrying out their activities or impose limitations on such activities (Section 46 (1) of the Banking Act). In such case, the Local Court Frankfurt am Main shall, at the request of the BaFin appoint the necessary members of the Management Board, if, as a result of such prohibi-tion, the Management Board does no longer have the necessary number of members in order to conduct the business (Section 46 (2) of the Banking Act).
Rules Governing the Amendment of the Articles of Association Any amendment of the Articles of Association requires a resolution of the General Meeting (Section 179 of the Stock Corporation Act). The authority to amend the Articles of Association in so far as such amendments merely relate to the wording, such as changes of the share capital as a result of the issuance of authorized capital, has been assigned to the Supervisory Board by the Articles of Association of Deutsche Bank (Section 20 (3)). Pursuant to the Articles of Association, the resolutions of the General Meeting are taken by a simple major-ity of votes and, in so far as a majority of capital stock is required, by a simple majority of capital stock, except where law or the Articles of Association determine otherwise (Section 20 (1)). Amendments to the Articles of Association become effective upon their entry in the Commercial Register (Section 181 (3) of the Stock Corpo-ration Act).
Powers of the Management Board to Issue or Buy Back Shares The Management Board is authorized to increase the share capital by issuing new shares for cash and in some circumstances noncash consideration. As of December 31, 2011, Deutsche Bank AG had authorized but unissued capital of € 1,152,000,000 which may be issued in whole or in part until April 30, 2016. Further details are governed by Section 4 of the Articles of Association.
Autorized capital Consideration Pre-emptive rights Expiration date
€ 230,400,000 Cash May be excluded pursuant to Section 186 (3) sentence of the Stock Corporation Act
April 30, 2016
€ 230,400,000 Cash or noncash May be excluded if the capital increase is for noncash consideration with the intent of acquiring a company or holdings in a company
April 30, 2016
€ 691,200,000 Cash May not be excluded April 30, 2016

Deutsche Bank 01 – Management Report 137 Financial Report 2011 Information pursuant to Section 315 (4) of the German Commercial Code and Explanatory
Report
The Management Board is authorized to issue once or more than once, participatory notes that are linked with conversion rights or option rights and/or convertible bonds and/or bonds with warrants. The participatory notes, convertible bonds or bonds with warrants may also be issued by affiliated companies of Deutsche Bank AG. For this purpose share capital was increased conditionally upon exercise of these conversion and/or exchange rights or upon mandatory conversion.
Contingent capital
Expiration date for the issuance of conversion and/or option rights
€ 230,400,000 April 30, 2015 € 230,400,000 April 30, 2016 The Annual General Meeting of May 27, 2010 authorized the Management Board pursuant to Section 71 (1) No. 7 of the Stock Corporation Act to buy and sell, for the purpose of securities trading, own shares of Deutsche Bank AG on or before November 30, 2014, at prices which do not exceed or fall short of the average of the share prices (closing auction prices of the Deutsche Bank share in Xetra trading and/or in a comparable suc-cessor system on the Frankfurt Stock Exchange) on the respective three preceding stock exchange trading days by more than 10 %. In this context, the shares acquired for this purpose may not, at the end of any day, exceed 5 % of the share capital of Deutsche Bank AG.
The Annual General Meeting of May 26, 2011 authorized the Management Board pursuant to Section 71 (1) No. 8 of the Stock Corporation Act to buy, on or before November 30, 2015, own shares of Deutsche Bank AG in a total volume of up to 10 % of the present share capital. Together with own shares acquired for trading pur-poses and/or for other reasons and which are from time to time in the company’s possession or attributable to the company pursuant to Sections 71a et seq. of the Stock Corporation Act, the own shares purchased on the basis of this authorization may not at any time exceed 10 % of the company’s share capital. The own shares may be bought through the stock exchange or by means of a public purchase offer to all shareholders. The countervalue for the purchase of shares (excluding ancillary purchase costs) through the stock exchange may not be more than 10 % higher or lower than the average of the share prices (closing auction prices of the Deutsche Bank share in Xetra trading and/or in a comparable successor system on the Frankfurt Stock Ex-change) on the last three stock exchange trading days before the obligation to purchase. In the case of a pub-lic purchase offer, it may not be more than 10 % higher or lower than the average of the share prices (closing auction prices of the Deutsche Bank share in Xetra trading and/or in a comparable successor system on the Frankfurt Stock Exchange) on the last three stock exchange trading days before the day of publication of the offer. If the volume of shares offered in a public purchase offer exceeds the planned buyback volume, accep-tance must be in proportion to the shares offered in each case. The preferred acceptance of small quantities of up to 50 of the company’s shares offered for purchase per shareholder may be provided for.
The Management Board has also been authorized to dispose of the purchased shares and of any shares pur-chased on the basis of previous authorizations pursuant to Section 71 (1) No. 8 of the Stock Corporation Act in a way other than through the stock exchange or by an offer to all shareholders, provided this is done against contribution-in-kind and excluding shareholders’ pre-emptive rights for the purpose of acquiring companies or shareholdings in companies. In addition, the Management Board has been authorized, in case it disposes of such own shares by offer to all shareholders, to grant to the holders of the option rights, convertible bonds and convertible participatory rights issued by the company and its affiliated companies pre-emptive rights to the extent to which they would be entitled to such rights if they exercised their option and/or conversion rights. Shareholders’ pre-emptive rights are excluded for these cases and to this extent.
The Management Board has also been authorized with the exclusion of shareholders’ pre-emptive rights to use such own shares to issue staff shares to employees and retired employees of the company and its affiliated

Deutsche Bank 01 – Management Report 138 Financial Report 2011 Information pursuant to Section 315 (4) of the German Commercial Code and Explanatory
Report
companies or to use them to service option rights on shares of the company and/or rights or duties to purchase shares of the company granted to employees or members of executive or non-executive management bodies of the company and of affiliated companies.
Furthermore, the Management Board has been authorized with the exclusion of shareholders’ pre-emptive rights to sell such own shares to third parties against cash payment if the purchase price is not substantially lower than the price of the shares on the stock exchange at the time of sale. Use may only be made of this authorization if it has been ensured that the number of shares sold on the basis of this authorization does not exceed 10 % of the company’s share capital at the time this authorization is exercised. Shares that are issued or sold during the validity of this authorization with the exclusion of pre-emptive rights, in direct or analogous application of Section 186 (3) sentence 4 Stock Corporation Act, are to be included in the maximum limit of 10 % of the share capital. Also to be included are shares that are to be issued to service option and/or conversion rights from convertible bonds, bonds with warrants, convertible participatory rights or participatory rights, if these bond or participatory rights are issued during the validity of this authorization with the exclusion of pre-emptive rights in corresponding application of Section 186 (3) sentence 4 Stock Corporation Act.
The Management Board has also been authorized to cancel shares acquired on the basis of this authorization without the execution of this cancellation process requiring a further resolution by the General Meeting.
The Annual General Meeting of May 26, 2011 authorized the Management Board pursuant to Section 71 (1) No. 8 of the Stock Corporation Act to execute the purchase of shares under the resolved authorization also with the use of put and call options or forward purchase contracts. The company may accordingly sell to third parties put options based on physical delivery and buy call options from third parties if it is ensured by the option conditions that these options are fulfilled only with shares which themselves were acquired subject to compliance with the principle of equal treatment. All share purchases based on put or call options are limited to shares in a maximum volume of 5 % of the actual share capital at the time of the resolution by the General Meeting on this authorization. The maturities of the options must end no later than on November 30, 2015.
Deutsche Bank 01 – Management Report 139 Financial Report 2011 Information pursuant to Section 315 (4) of the German Commercial Code and Explanatory
Report
The purchase price to be paid for the shares upon exercise of the options or upon the maturity of the forward purchase may not exceed or fall short by more than 10 % of the average of the share prices (closing auction prices of the Deutsche Bank share in Xetra trading and/or in a comparable successor system on the Frankfurt Stock Exchange) on the last three stock exchange trading days before conclusion of the respective option transaction in each case excluding ancillary purchase costs but taking into account the option premium received or paid. The call option may only be exercised if the purchase price to be paid does not exceed by more than 10 % or fall below 10 % of the average of the share prices (closing auction prices of the Deutsche Bank share in Xetra trading and/or in a comparable successor system on the Frankfurt Stock Exchange) on the last three stock exchange trading days before the acquisition of the shares.
To the sale and cancellation of shares acquired with the use of derivatives the general rules established by the General Meeting apply.
Significant Agreements which Take Effect, Alter or Terminate upon a Change of Control of the Company Following a Takeover Bid Significant agreements which take effect, alter or terminate upon a change of control of the company following a takeover bid have not been entered into.
Agreements for Compensation in Case of a Takeover Bid If a member of the Management Board leaves the bank within the scope of a change of control, he receives a one-off compensation payment described in greater detail in the following Compensation Report.
If the employment relationship with certain executives with global or strategically important responsibility is terminated within a defined period within the scope of a change of control, without a reason for which the executives are responsible, or if these executives terminate their employment relationship because the company has taken certain measures leading to reduced responsibilities, the executives are entitled to a severance payment. The calculation of the severance payment is, in principle, based on 1.5 times to 2.5 times the total annual remuneration (base salary as well as variable – cash and equity-based – compensation) granted before change of control. Here, the development of total remuneration in the three calendar years before change of control is taken into consideration accordingly.
Deutsche Bank 01 – Management Report 140 Financial Report 2011 Compensation Report
The Compensation Report provides information on the principles and the amount of the compensation of the Management Board and Supervisory Board members of Deutsche Bank AG. It complies with the requirements of Section 314 (1) No. 6 of the German Commercial Code (HGB), the German Accounting Standard No. 17 “Reporting on Executive Body Remuneration”, the German regulation on the supervisory requirements for compensation systems of banks (Instituts-Vergütungsverordnung) as well as the recommendations of the German Corporate Governance Code.
Principles of the Compensation System for Management Board Members
About ten years ago, a system of compensation was established for the members of the Management Board that comprised beside the payment of a base salary also variable compensation components, including some granted as equity-based awards. Since then, we have continued to develop the compensation system further.
In May 2010 the Annual General Meeting approved the compensation system on the basis of the Compensa-tion Report applicable at the time. The compensation system that has been enhanced since then will be sub-mitted again for approval to the Annual General Meeting in May 2012.
Responsibility The Supervisory Board is responsible for the compensation system and for determining the individual amounts of compensation for the Management Board members. The Chairman’s Committee supports the Supervisory Board in the process. It advises the Supervisory Board on all issues in connection with the compensation of the members of the Management Board and prepares all of the resolutions on the compensation system and on the determination of the individual compensation of the individual Management Board members.
The Chairman’s Committee of the Supervisory Board comprises a total of four members. Two of them are representatives of the Bank’s employees. The Chairman’s Committee held regular meetings in 2011, and al-ready at the beginning of 2012. Most recently it also prepared the decision on how the amount of the variable compensation for the members of the Management Board for the financial year 2011 is to be assessed.
Principles The compensation system for the members of the Management Board takes initially into account the applica-ble statutory and regulatory requirements. As divergent requirements have been established – around the world – numerous aspects must be considered, and therefore the requirements placed on such a system are extensive and complex. The following presentation focuses on the material and most important criteria of the compensation system and on the process for determining the Management Board members’ compensation.
When designing the structure of the compensation system, determining the compensation and structuring its disbursal, we focus on ensuring a close link between the interests of the Management Board members and the interests of the shareholders. This takes place on the one hand on the basis of specific key financial figures which have a connection to the performance of the Deutsche Bank share and on the other hand by granting compensation elements that are equity-based. The equity-based compensation components are directly linked to the performance of the Deutsche Bank share and only become valid for payment over a period of several years. Stock options are not awarded as a compensation component.
The competitiveness compared with other companies in the market is a further important criterion for the struc-turing and determination of the compensation.
Compensation Report

Deutsche Bank 01 – Management Report 141 Financial Report 2011 Compensation Report
Furthermore, the compensation system is aligned with performance and success targets. Special importance is attached to its long-term focus, as well as appropriateness and sustainability criteria. The members of the Management Board are motivated through the structure of the compensation system to avoid unreasonably high risks, to achieve the objectives set out in the Bank’s strategies and to continuously further a positive de-velopment of the Bank.
Compensation for the Management Board members is determined on the basis of the compensation system by means of several criteria. These include the overall results of Deutsche Bank as well as the relative per-formance of the Deutsche Bank share in comparison to selected peer institutions. Within the framework of its discretionary scope, the Supervisory Board takes adequately into account in particular risk aspects and contri-butions to the Bank’s success by the respective organizational unit as well as by the individual Management Board members themselves, which are considered based on financial and non-financial parameters. This procedure also fulfils regulatory requirements by thus going beyond a purely formula-based assessment. Most of the variable compensation components are determined on the basis of a multi-year assessment in order to avoid assessing business performance on the basis of a single year only.
The Supervisory Board regularly reviews the compensation framework for the Management Board members with regard to market trends and changing legal and regulatory requirements. If the Supervisory Board be-lieves a change is required, it will adjust the framework accordingly. In the context of this review and the deter-mination of the variable compensation the Supervisory Board uses the expertise of independent external compensation and, if necessary, legal consultants.
Compensation Structure The compensation structure approved by the Supervisory Board for the individual Management Board mem-bers is reflected in their contractual agreements. The compensation is divided into both non-performance-related and performance-related components.
Non-Performance-Related Components The non-performance-related components primarily comprise the base salary. It is disbursed in twelve equal monthly payments. The last adjustment to the base salaries took effect as of January 1, 2010.
Furthermore, non-performance-related components include other benefits, which comprise the monetary value of non-cash benefits such as company cars and drivers, insurance premiums, expenses for company-related social functions and security measures, including payments, if applicable, of taxes on these benefits as well as taxable reimbursements of expenses.
Performance-Related Components (Variable Compensation) The variable compensation is performance-related. It consists in principal of two components, a bonus and a Long-Term Performance Award. In line with the compensation practice in the investment banking sector gener-ally, a Management Board member with responsibility for the Corporate & Investment Bank Group Division (CIB) also receives an additional division-related compensation component (Division Incentive).

Deutsche Bank 01 – Management Report 142 Financial Report 2011 Compensation Report
Bonus The total bonus is determined on the basis of two components (bonus components 1 and 2). Their levels de-pend on the development of the return on equity (before income tax), which is a key factor influencing the share price performance. The first component of the bonus is determined through a comparison of the planned and actually achieved return on equity. The second component of the bonus is based on the actually achieved return on equity level. The two components are each assessed over a two-year period: the year for which the bonus is determined and the respective preceding year. This ensures that the assessment is based not just on a short-term development of the return on equity.
The total bonus to be granted is calculated on the basis of a total target figure, which is divided in half into the two components specified above (target figures 1 and 2). The individual total target figure is € 1,150,000 for an ordinary Management Board member and € 4,000,000 for the Management Board Chairman. This means that the target figures 1 and 2 each amount to € 575,000 for an ordinary Management Board member and € 2,000,000 each for the Management Board Chairman.
The target figures 1 and 2 are each multiplied with an annually calculated factor (factors 1 and 2) to calculate the respective bonus components 1 and 2.
The calculated total bonus is determined as follows.
The level of factor 1, which is used for calculating bonus component 1, is determined on the basis of the actu-ally achieved return on equity of a given year as a ratio of the plan figure defined for that year. The ratio result-ing from this is the level of achievement, which is calculated as described above for two consecutive years. If the actually achieved return on equity is negative for a given year, the level of achievement for this year is set to zero. Factor 1 is the average of the levels of achievement calculated for the two years. The average of the levels of achievement for the two years being assessed must come to at least 50 %. If it falls below this mini-mum level, the factor is set to zero and a bonus component 1 is not granted. Bonus component 1 is linked to the level of factor 1, resulting in a corresponding linear increase or decrease starting from the target figure. There is an upper limit that is set at 150 % of the target figure. An average of a level of achievement of more than 150 % therefore does not lead to higher compensation.
+Total Bonus =Bonus component 1 Bonus component 2Target figure 1 x factor 1 Target figure 2 x factor 2

Deutsche Bank 01 – Management Report 143 Financial Report 2011 Compensation Report
The following chart shows the level of factor 1 depending on the level of achievement calculated according to the method described above.
Factor 2 is determined on the basis of the actually achieved return on equity over a two-year period. The initial basis is an annual return on equity of 18 %. If this figure is achieved, it is linked to a multiplier of 1.0. For each percentage point of deviation, upwards or downwards, the multiplier is increased or reduced in steps of 0.05; in the process, intermediate values are calculated as well. The multiplier can amount to a maximum of 1.5, which corresponds to a return on equity of 28 % or more. In contrast, if the return on equity sinks below a minimum level of 4 %, the multiplier is zero. To determine factor 2, the average is formed from the multipliers of the two assessment years and has to amount to a minimum of 0.5.
The following chart shows the level of the multiplier depending on the actually achieved return on equity for a given year.
0
0.5
1.0
1.5
Factor
Level of achievement(actual/plan comparison) in %
(2 year average)
Bonus: Component 1
10 30 50 70 90 110 130 150 1700
0
1.5
4 8 12 16 20 24 28 32 36 Actual RoE of a year in %
0.5
1.0
Multiplier
Bonus: Component 2
0
Deutsche Bank 01 – Management Report 144 Financial Report 2011 Compensation Report
Specific extraordinary effects (e.g., gains for the sale of legacy investments) are not taken into account when determining the return on equity which is the basis for the factors.
The two bonus components are added together, resulting in a total bonus. If, for example, the factors for the two bonus components are 1.0 each, the total bonus amounts to the respective total target figure. The calcu-lated total bonus is capped at 1.5 times the total target figure. If defined minimum levels are not reached for both of the bonus components, no bonus is paid.
Furthermore, the Supervisory Board carries out an additional assessment that can result in an increase or reduction by up to 50 % of the calculated total bonus amount. The objective in this context is to adequately take additional aspects into account, for example, the individual contributions to performance or risk-related factors in light of regulatory requirements. As a result, under the most favorable conditions, the total bonus can amount to a maximum of 2.25 times the total target figure.
Long-Term Performance Award The level of the Long-Term Performance Award (LTPA) is tied to the total shareholder return of Deutsche Bank in relation to the average total shareholder returns of a select group of six comparable leading banks (calculated in euro). The result thereof is the Relative Total Shareholder Return (RTSR). The LTPA is calculated from the average of the annual RTSR for the last three financial years (reporting year and the two preceding years). The criteria used to select the peer group are the generally comparable business activities, the size and the interna-tional presence.
The six leading banks are:
— Banco Santander and BNP Paribas (both from the eurozone), — Barclays and Credit Suisse (both from Europe outside the eurozone), as well as — JPMorgan Chase and Goldman Sachs (both from the USA).
The LTPA for the Management Board members is in turn determined on the basis of a pre-defined target figure multiplied by a percentage based on the achieved RTSR. The target figure is € 2,175,000 for an ordinary Man-agement Board member and € 4,800,000 for the Management Board Chairman. Like the bonus, the LTPA also has an upper limit (cap). If the three-year average of the RTSR is greater than 100 %, then the value of the LTPA increases proportionately to an upper limit of 125 % of the target figure. If the three-year average of the RTSR is lower than 100 %, however, the value declines disproportionately, as follows. If the RTSR is calcu-lated to be between 90 % and 100 %, the value is reduced for each lower percentage point by 3 percentage points. The value is reduced by another 2 percentage points for each lower percentage point between 70 % and 90 %; and by another 3 percentage points for each percentage point under 70 %. If the three-year average does not exceed 60 %, no LTPA is granted.

Deutsche Bank 01 – Management Report 145 Financial Report 2011 Compensation Report
This relation can be seen in the following chart.
Division Incentive The previously described Division Incentive, which the Management Board members with responsibility for the CIB Group Division receive, serves to ensure our compensation remains competitive. In determining the Divi-sion Incentive, the success of the CIB Group Division is assessed on the basis of income before income taxes and total net revenues as well as the division´s development, also in relation to our competitors and the de-fined targets. Furthermore, decisive factors also comprise the development and management of costs as well as risk-relevant aspects (e.g., risk-weighted assets, value-at-risk, economic capital). Individual contributions to success of the responsible Management Board members are appropriately taken into account.
Long-Term Incentive/Sustainability The total amount from the bonus, LTPA and, if applicable, Division Incentive is mostly granted on a deferred basis or spread out over several years. This ensures a long-term incentive effect over a multiannual period of time.
At least 60 % of the total variable compensation is granted on a deferred basis. Not less than half of this de-ferred portion comprises equity-based compensation components, while the remaining portion is granted as deferred cash compensation. Both compensation components are deferred over a several year period, subse-quently followed by holding periods for the equity-based compensation components. During the period until disbursement or delivery, the compensation portions awarded on a deferred basis may be forfeited.
A maximum of 40 % of the total variable compensation is granted on a non-deferred basis. However, at least half of this consists of equity-based compensation components and only the remaining portion is paid out di-rectly in cash. There is a three-years holding period for the portion awarded as equities, which is subject to specific forfeiture conditions.
Of the entire variable compensation, no more than a maximum of 20 % is paid out in cash immediately, while at least 80 % is disbursed or delivered at a later date.
10 30 50 70 90 100 110 120 130 RTSR in %(3 year average)
20 40 60 80
Factor
0
0.5
1.0
1.5
Long-Term Performance Award
0

Deutsche Bank 01 – Management Report 146 Financial Report 2011 Compensation Report
The following chart shows how the variable compensation components are split and structured.
Restricted Equity Awards The portion of the variable compensation that is equity-based and deferred is granted in the form of conditional entitlements to the future delivery of shares as Restricted Equity Awards. At least 50 % of the deferred variable compensation is comprised of Restricted Equity Awards. These are governed by the Deutsche Bank Equity Plan, which grants the right to receive Deutsche Bank shares after a specified period of time. Restricted Equity Awards vest in four equal tranches. The first tranche vests approximately one and a half years after the grant-ing of the awards. The remaining tranches each subsequently vest in regular intervals of one additional year.
After the individual tranches of the Restricted Equity Awards vest, they are subsequently subject to an addi-tional holding period; only after this holding period has expired may the equities of the respective tranche be disposed of. The additional holding period of the first tranche is three years, for the second tranche two years, and for the third and fourth tranche one year. Accordingly, Management Board members are first permitted to dispose of the first three tranches of the Restricted Equity Awards approximately four and a half years after they are granted, and of the fourth tranche after approximately five and a half years.
Split / structure of variable compensation
Variable Compensationtotal
max. 50%Upfront Cash
min. 50%EUA
max. 50 %RIA
min.50 %REA
equity-based
deferred
cash
deferred
max. 40 %immediate disbursement or delivery after
holding period
min. 60 %disbursement or delivery deferred (and if applicable after holding period)
RIA = Restricted Incentive AwardsEUA = Equity Upfront Awards
REA = Restricted Equity Awards
equity-based
holding period
holding period
cash
thereof
disbursement or delivery of at least 80 % at later dates
thereof

Deutsche Bank 01 – Management Report 147 Financial Report 2011 Compensation Report
The value of the Restricted Equity Awards is subject to the performance of the Deutsche Bank share price over the period until the holding periods end and is thus linked to a sustained development of long-term value. Par-ticipants in the Deutsche Bank Equity Plan are not entitled to receive dividends until the shares are delivered to them.
Restricted Incentive Awards The portion of the deferred compensation that is not equity-based is granted as deferred cash compensation (Restricted Incentive Awards). This comprises a maximum 50 % of the deferred variable compensation. Re-stricted Incentive Awards are granted on the basis of the Deutsche Bank Restricted Incentive Plan. Like the Restricted Equity Awards, the Restricted Incentive Awards also vest in four equal tranches. The first tranche vests approximately one and a half years after it is granted. The remaining tranches each subsequently vest in intervals of one year. Payment takes place upon vesting. The deferred cash compensation is thus stretched out over a period of approximately four and a half years.
Upfront Awards The Upfront Awards, as described above, amount to a maximum of 40 % of the total variable compensation. However, no more than half of this is paid out in cash immediately (Upfront Cash). The remaining portion is granted as equity-based compensation in the form of Equity Upfront Awards. Like the Restricted Equity Awards, the Equity Upfront Awards are granted on the basis of the Deutsche Bank Equity Plan. Accordingly, Equity Upfront Awards are conditional entitlements to the future delivery of shares. They have a holding period of three years, and only after this holding period has expired may the awards be disposed of. During this time, their value is subject to the development of long-term value, as these awards are also linked to the perform-ance of the Deutsche Bank share.
The following chart shows the payment date for the cash compensation and the spread over time for the dis-bursement or the delivery of the other variable compensation components in the five consecutive years follow-ing the grant year.
Restricted Equity Awards
Timeframe for disbursement or delivery and non-forfeiture
100%
100%
25%
25%
25%
25%
25%
25%
25%
25% 25%
25%
25%
25%
Upfront Cash
Equity Upfront Awards
Restricted Incentive Awards
100%
Grant year
1st subsequent
year
2ndsubsequent
year
3rdsubsequent
year
4thsubsequent
year
5thsubsequent
year
Disbursement or delivery (vesting of RIAs at the same time)Vesting followed by a holding period until disbursement or delivery; subject to individual forfeiture conditions during the holding period

Deutsche Bank 01 – Management Report 148 Financial Report 2011 Compensation Report
As the awards presented in the table above do not bear interest or entitlement to dividends until their dis-bursement or delivery, a one-time premium is added upon grant (2011: 5 %).
Forfeiture Conditions Because some of the compensation components are deferred or spread out over several years (Restricted Equity Awards, Restricted Incentive Awards and Equity Upfront Awards) a long-term incentive effect is ensured as they are subject to certain forfeiture conditions until vesting or the end of the holding periods. Awards may be fully or partially forfeited, for example, due to individual misconduct (including a breach of regulations) or to an extraordinary termination, and, with regard to Restricted Equity Awards and Restricted Incentive Awards, also due to a negative Group result or to individual negative contributions to results. The forfeiture conditions make an essential contribution to the long-term nature of the compensation.
Limitations in the event of exceptional developments In the event of exceptional developments (e.g., sale of large investments), the total compensation for each Management Board member is limited to a maximum amount. A payment of variable compensation elements will not take place if the payment of variable compensation components is prohibited or restricted by the Ger-man Federal Financial Supervisory Authority in accordance with existing statutory requirements.
Hedging of Risk Members of the Management Board are not permitted to limit or cancel out the risk in connection with their compensation through hedging or other countermeasures.
Management Board Compensation
Base Salary In 2011, the Management Board members’ annual base salaries remained unchanged to previous year. The ordinary Management Board members´ annual base salary was € 1,150,000 gross each; the annual base salary of the Management Board Chairman was € 1,650,000 gross.
Variable Compensation The Supervisory Board, based on a proposal of the Chairman’s Committee, determined the variable compen-sation for the members of the Management Board for the 2011 financial year. The amounts for the bonuses and LTPAs (and where applicable the Division Incentive) were determined for all Management Board members on the basis of the existing compensation system.
Due to the development of the return on equity in the relevant two-year assessment period, the factor in regard to bonus component 1 was about 0.61 while the factor in regard to bonus component 2 was about 0.64.
The Relative Total Shareholder Return as the basis for the calculation of the LTPA in the year 2011 was about 111 % (2010: 93 %; 2009: 99 %). Thus, the average of the last three years (2009 until 2011) was about 101 %. Therefore the payable amount of the LTPA was slightly above the respective target figures.

Deutsche Bank 01 – Management Report 149 Financial Report 2011 Compensation Report
In exercising its discretionary scope to determine the bonus (and correspondingly the Division Incentive), the Supervisory Board took into account the performance of the bank and the individual divisions in terms of reve-nues, income, risk, capital strength and liquidity, both in absolute terms and based on the competitive environ-ment. Furthermore, the factors taken into account also comprised the Bank’s further strategic development, the expansion of its market position, the progress of integration within the Group as well as the renown gained in the market through national and international awards. The decision was also taken in consideration of the globally difficult economic environment. Further details are provided in the relevant sections of the Operating and Financial Review page 4.
Compensation (collectively and individually) In accordance with the provisions of German Accounting Standard No. 17, the members of the Management Board received in the 2011 financial year compensation for their service on the Management Board totaling € 26,444,081 (2010: € 32,434,836). Thereof, € 8,550,000 (2010: € 9,412,500) was for base salaries, € 17,194,081 (2010: € 17,816,227) was performance-related components with long-term incentives and € 700,000 (2010: € 5,206,109) was performance-related components without long-term incentives. In addition, there were other benefits amounting to € 879,591 (2010: € 795,338), so that total compensation of the Man-agement Board members was € 27,323,672 (2010: € 33,230,174).
On an individual basis, the Management Board members received the following compensation components for their service on the Management Board for or in the years 2011 and 2010.
Members of the Management Board
Non- performance- related components Performance-related components
without long-term incentives
with long-term incentives
non-share-based share-based
in € Base salary immediately paid out
Restricted Incentive Award(s)
Equity Upfront Award(s) (with holding period)
Restricted Equity Award(s) (deferred with additional holding period) Total
Dr. Josef Ackermann 2011 1,650,000 100,000 693,139 105,000 3,750,075 6,298,214 2010 1,650,000 1,034,322 − 1,086,038 2,534,089 6,304,449
Dr. Hugo Bänziger 2011 1,150,000 100,000 96,706 105,000 1,424,884 2,876,590 2010 1,150,000 523,428 − 549,599 824,399 3,047,426
Michael Cohrs
1 2010 862,500 577,533 − 606,410 1,350,943 3,397,386 Jürgen Fitschen 2011 1,150,000 100,000 72,530 105,000 1,424,884 2,852,414
2010 1,150,000 507,790 − 533,180 799,770 2,990,740 Anshuman Jain 2011 1,150,000 100,000 248,885 105,000 4,207,384 5,811,269
2010 1,150,000 992,752 − 1,042,390 4,367,413 7,552,555 Stefan Krause 2011 1,150,000 100,000 96,706 105,000 1,424,884 2,876,590
2010 1,150,000 539,066 − 566,019 849,029 3,104,114 Hermann-Josef Lamberti 2011 1,150,000 100,000 96,706 105,000 1,424,884 2,876,590
2010 1,150,000 507,790 − 533,180 799,770 2,990,740 Rainer Neske 2011 1,150,000 100,000 72,530 105,000 1,424,884 2,852,414
2010 1,150,000 523,428 − 549,599 824,399 3,047,426
Total 2011 8,550,000 700,000 1,377,202 735,000 15,081,879 26,444,081
Total 2010 9,412,500 5,206,109 − 5,466,415 12,349,812 32,434,836 1 Member of the Management Board until September 30, 2010. Due to U.S. tax rules applicable to Mr. Cohrs the vesting of all awards granted to him for the financial year 2010 was
accelerated prior to maturity and the awards were immediately taxed. The net euro amount of cash awards was booked into a euro account and the net amount of shares was booked into a securities account both blocked in favor of the Bank. They are subject to the payment and forfeiture conditions which already applied to these awards before their premature vesting.

Deutsche Bank 01 – Management Report 150 Financial Report 2011 Compensation Report
The number of share awards in the form of Equity Upfront Awards (EUA) and Restricted Equity Awards (REA) granted in 2012 for the year 2011 to each member of the Management Board was determined by dividing the respective euro amounts by € 34.04, the XETRA closing price of a Deutsche Bank share on February 1, 2012 (prior year: € 44.42 on February 2, 2011).
As a result, the number of share awards granted was as follows (rounded):
Members of the Management Board
Units Year
Equity Upfront Award(s)
(with holding period)
Restricted Equity Award(s)
(deferred with additional
holding period)
Dr. Josef Ackermann 2011 3,084 110,166 2010 24,449 57,048
Dr. Hugo Bänziger 2011 3,084 41,859 2010 12,372 18,559
Michael Cohrs
1 2010 13,651 30,412 Jürgen Fitschen 2011 3,084 41,859
2010 12,003 18,004 Anshuman Jain 2011 3,084 123,601
2010 23,466 98,320 Stefan Krause 2011 3,084 41,859
2010 12,742 19,113 Hermann-Josef Lamberti 2011 3,084 41,859
2010 12,003 18,004 Rainer Neske 2011 3,084 41,859
2010 12,372 18,559 1 Member of the Management Board until September 30, 2010. In the presentation of the compensation amounts, the following should be noted with regard to the Restricted Incentive Awards.
In accordance with German Accounting Standard No. 17, the Restricted Incentive Awards, as a deferred, non-equity-based compensation component subject to certain (forfeiture) conditions, must be recognized in the total compensation for the year of their disbursal (i.e. in the financial year in which the unconditional payment takes place) and not in the year they are originally granted. This means that the total compensation amounts presented above do not include the Restricted Incentive Awards granted by the Supervisory Board to the Man-agement Board members for 2011 amounting to € 15,081,873, but instead include the first tranche of the Re-stricted Equity Awards (including an adjustment linked to our return on equity) granted in the preceding year (2010 for the financial year 2009) totaling € 1,377,202.
Deutsche Bank 01 – Management Report 151 Financial Report 2011 Compensation Report
The following table provides details on the Restricted Incentive Awards on an individualized basis awarded to the members in active service on the Management Board in 2011. The information shown presents the amounts paid in the financial year as well as the amounts originally granted along with the respective financial year the amounts were awarded for.
Members of the Management Board
Amounts in € Year
1
Allocation over periods/
tranches
2 Amount awarded
Amount granted
(i.e. paid out) in 2011
3
Dr. Josef Ackermann 2011 2013 to 2016 / 4 3,750,075 − 2010 2012 to 2015 / 4 2,534,089 − 2009 2011 to 2013 / 3 1,925,000 693,139
Dr. Hugo Bänziger 2011 2013 to 2016 / 4 1,424,883 − 2010 2012 to 2015 / 4 824,399 − 2009 2011 to 2013 / 3 268,575 96,706
Jürgen Fitschen 2011 2013 to 2016 / 4 1,424,883 − 2010 2012 to 2015 / 4 799,770 − 2009 2011 to 2013 / 3 201,431 72,530
Anshuman Jain 2011 2013 to 2016 / 4 4,207,383 − 2010 2012 to 2015 / 4 4,367,413 − 2009 2011 to 2013 / 3 691,210 248,885
Stefan Krause 2011 2013 to 2016 / 4 1,424,883 − 2010 2012 to 2015 / 4 849,029 − 2009 2011 to 2013 / 3 268,575 96,706
Hermann-Josef Lamberti 2011 2013 to 2016 / 4 1,424,883 − 2010 2012 to 2015 / 4 799,770 − 2009 2011 to 2013 / 3 268,575 96,706
Rainer Neske 2011 2013 to 2016 / 4 1,424,883 − 2010 2012 to 2015 / 4 824,399 − 2009 2011 to 2013 / 3 201,431 72,530
Total 2011 15,081,873 –
2010 10,998,869 –
2009 3,824,797 1,377,202 1 Financial year the award was originally issued for (in regard to the service on the Management Board). 2 Number of equal tranches. 3 The Restricted Incentive Awards awarded for the 2009 financial year contain a variable component (RoE-linked adjustment) so that the disbursal, i.e. the amount
paid out, in the context of the first tranche differs from the amount originally awarded.
The following table shows the non-performance-related other benefits for the 2011 and 2010 financial years.
Members of the Management Board Other benefits
in € 2011 2010
Dr. Josef Ackermann 176,256 148,723 Dr. Hugo Bänziger 50,535 54,833 Michael Cohrs
1 − 56,218 Jürgen Fitschen 151,700 130,171 Anshuman Jain 63,214 77,671 Stefan Krause 228,878 136,953 Hermann-Josef Lamberti 103,485 91,505 Rainer Neske 105,523 99,264
Total 879,591 795,338 1 Member of the Management Board until September 30, 2010.
Management Board members do not receive any compensation for mandates on boards of our subsidiaries.
Deutsche Bank 01 – Management Report 152 Financial Report 2011 Compensation Report
Pension and transitional benefits
The Supervisory Board generally allocates an entitlement to the Management Board members to pension plan benefits. Only the Management Board members who have functional responsibility for the CIB Group Division and receive a Division Incentive do not receive such an entitlement. These entitlements involve a contribution-oriented pension plan. Under this pension plan, a personal pension account has been set up for each partici-pating member of the Management Board after appointment to the Management Board. A contribution is made annually into this pension account. This annual contribution is calculated using an individual contribution rate on the basis of each member’s base salary and total bonus up to a defined ceiling and accrues interest cre-dited in advance, determined by means of an age-related factor, at an average rate of 6 % per year up to the age of 60. From the age of 61 on, the pension account is credited with an annual interest payment of 6 % up to the date of retirement. The annual payments, taken together, form the pension amount which is available to pay the future pension benefit. Under defined conditions, the pension may also become due for payment before a regular pension event (age limit, disability or death) has occurred. The pension right is vested from the start.
Based on former contractual commitments Dr. Ackermann and Mr. Lamberti are principally entitled to an addi-tional monthly pension payment of € 29,400 each after they have left the Management Board.
Furthermore, Dr. Ackermann, Dr. Bänziger and Mr. Lamberti are in principle entitled to a transition payment for a period of six months after leaving office. Exceptions to this arrangement exist where, for instance, the Man-agement Board member gives cause for summary dismissal. The transition payment a Management Board member would have received over this six-months period if he had left on December 31, 2011, or on Decem-ber 31, 2010, was € 2,825,000 for Dr. Ackermann and € 1,150,000 each for Dr. Bänziger and Mr. Lamberti.
In addition, if Dr. Ackermann and Mr. Lamberti leave office after reaching the age of 60, they are each subse-quently entitled, in principle, directly after the end of the six-month transition period, to a payment of first 75 % and then 50 % of the sum of salary and total bonus (last total target figure), each for a period of 24 months. This payment ends no later than six months after the end of the Annual General Meeting in the year in which the Management Board member reaches his 65th birthday.

Deutsche Bank 01 – Management Report 153 Financial Report 2011 Compensation Report
The following table shows the annual service costs for pension benefits and transition payments for the years 2011 and 2010 and the corresponding defined benefit obligations each as of December 31, 2011, and Decem-ber 31, 2010, for the individual members of the Management Board. The different sizes of the balances are due to the different lengths of service on the Management Board, the respective age-related factors, the differ-ent contribution rates as well as the individual pensionable compensation amounts and the previously men-tioned additional individual entitlements.
Members of the Management Board
1
in €
Service cost for pension benefits and transition payments, in the year
Present value of the defined benefit obligation for pension benefits and transition payments, end of year
Dr. Josef Ackermann
2 2011 876,760 18,753,007 2010 608,720 13,236,187
Dr. Hugo Bänziger 2011 508,011 2,786,879 2010 573,444 2,161,491
Jürgen Fitschen 2011 222,585 565,984 2010 226,196 307,348
Stefan Krause 2011 470,827 1,345,800 2010 500,183 825,181
Hermann-Josef Lamberti 2011 486,920 12,463,973 2010 532,496 11,177,275
Rainer Neske 2011 462,655 1,066,022 2010 420,559 575,398
1 Other members of the Management Board are not entitled to such benefits after appointment to the Management Board. 2 Due to Dr Ackermann´s planned departure from the Management Board of Deutsche Bank AG after the end of the regular Annual General Meeting in 2012 instead
of his departure, as originally planned, after the end of the Annual General Meeting in 2013, the period for the receipt of the transition payment is extended by another year. Accordingly this extended receipt of payments leads essentially to the increase of obligations as stated in the table before.
Other benefits upon premature termination
The Management Board members are in principle entitled to receive a severance payment upon a premature termination of their appointment at the bank’s initiative, if the bank is not entitled to revoke the appointment or give notice under the contractual agreement for cause. The severance payment, as a rule, will not exceed the lesser of two annual compensation amounts and the claims to compensation for the remaining term of the contract. The calculation of the compensation is based on the annual compensation for the previous finan-cial year.
If a Management Board member leaves office in connection with a change of control, he is also, under certain conditions, entitled in principle to a severance payment. The severance payment, as a rule, will not exceed the lesser of three annual compensation amounts and the claims to compensation for the remaining term of the contract. The calculation of the compensation is based again on the annual compensation for the previous financial year.
The severance payment mentioned above is determined by the Supervisory Board subject to its sole discretion. In principle, the disbursement of the severance payment takes place in two installments; the second installment is subject to certain forfeiture conditions until vesting.

Deutsche Bank 01 – Management Report 154 Financial Report 2011 Compensation Report
Expense for Long-Term Incentive Components
The following table presents the compensation expense recognized in the respective years for long-term incen-tive components of compensation not vested immediately granted for service on the Management Board.
Members of the Management Board Amount expensed for
share-based compensation
components non-share-based compensation
components
in € 2011 2010 2011 2010
Dr. Josef Ackermann 2,020,850 1,743,667 2,152,404 1,078,425 Dr. Hugo Bänziger 440,182 559,896 386,704 150,461 Michael Cohrs
1 − 1,480,333 − 130,210 Jürgen Fitschen 309,459 286,314 359,601 112,839 Anshuman Jain 1,471,955 1,840,641 1,818,626 387,205 Stefan Krause 364,503 379,403 395,591 150,461 Hermann-Josef Lamberti 434,736 578,987 377,816 150,461 Rainer Neske 314,911 286,314 368,488 112,839 1 Member of the Management Board until September 30, 2010.
Management Board Share Ownership
As of February 17, 2012 and February 18, 2011, respectively, the current members of our Management Board held the following numbers of our shares and share awards.
Members of the Management Board Number of shares
Number of share awards
1
Dr. Josef Ackermann 2012 600,534 296,784 2011 560,589 259,596
Dr. Hugo Bänziger 2012 69,849 115,383 2011 55,531 100,520
Jürgen Fitschen 2012 181,907 110,978 2011 169,008 92,671
Anshuman Jain 2012 552,697 346,703 2011 457,192 414,906
Stefan Krause 2012 − 116,307 2011 − 71,363
Hermann-Josef Lamberti 2012 139,402 114,459 2011 125,291 98,626
Rainer Neske 2012 51,088 111,902 2011 60,509 90,875
Total 2012 1,595,477 1,212,516
Total 2011 1,428,120 1,128,557 1 Including the share awards Mr. Fitschen, Mr. Jain and Mr. Neske received in connection with their employment prior to their appointments to the Management
Board. The share awards listed in the table have different vesting and allocation dates. The last share awards will be allocated in August 2017.

Deutsche Bank 01 – Management Report 155 Financial Report 2011 Compensation Report
To counterbalance the economic disadvantages for share award owners resulting from the capital increase which took place in September 2010, additional share awards were granted. Each Management Board member who was already appointed in September 2010 received additional share awards of approximately 9.59 % of his outstanding share awards as of September 21, 2010 of the same category (in total 76,767 share awards for all Management Board members together). The respective share awards are included in the number of share awards as presented in the table above.
The current members of our Management Board held an aggregate of 1,595,477 of our shares on February 17, 2012, amounting to approximately 0.17 % of our shares issued on that date. They held an aggregate of 1,428,120 of our shares on February 18, 2011, amounting to approximately 0.16 % of our shares issued on that date.
The number of shares delivered in 2011 to the members of the Management Board active in 2011 from de-ferred compensation awards granted in prior years amounted to 295,902.
Compensation System for Supervisory Board Members
The principles of the compensation of the Supervisory Board members are set forth in our Articles of Associa-tion, which our shareholders amend from time to time at the Annual General Meeting. Such compensation provisions were last amended at our Annual General Meeting on May 24, 2007.
The following provisions apply to the 2011 financial year: compensation consists of a fixed remuneration of € 60,000 per year and a dividend-based bonus of € 100 per year for every full or fractional € 0.01 increment by which the dividend we distribute to our shareholders exceeds € 1.00 per share. Each member of the Supervisory Board also receives annual remuneration linked to our long-term profits of € 100 for each € 0.01 by which the average earnings per share (diluted), reported in our financial statements in accordance with the ac-counting principles to be applied in each case on the basis of the net income figures for the three previous financial years, exceed the amount of € 4.00.
These amounts are increased by 100 % for every membership in a committee of the Supervisory Board. Com-mittee chairpersons receive an increase of 200 %. These provisions do not apply to the Mediation Committee formed pursuant to Section 27 (3) of the Co-Determination Act. The Supervisory Board Chairman is paid four times the base compensation of a regular member, and does not receive incremental increases for committee work. The deputy to the Supervisory Board chairman is paid one and a half times the base compensation of a regular member. In addition, the members of the Supervisory Board receive a meeting fee of € 1,000 for each Supervisory Board and committee meeting they attend. Furthermore, in our interest, the members of the Su-pervisory Board will be included in any financial liability insurance policy held in an appropriate amount by us, with the corresponding premiums being paid by us.
We also reimburse members of the Supervisory Board for all cash expenses and any value added tax (Umsatzsteuer, at present 19 %) they incur in connection with their roles as members of the Supervisory Board. Employee representatives on the Supervisory Board also continue to receive their employee benefits. For Supervisory Board members who served for only part of the year, we pay a portion of the total compensation based on the number of months they served, rounding up to whole months.

Deutsche Bank 01 – Management Report 156 Financial Report 2011 Compensation Report
The members of the Nomination Committee, which was first formed after the Annual General Meeting in 2008, waived all remuneration, including the meeting fee, for their Nomination Committee work for 2009 and the following years, as in the previous years.
Supervisory Board Compensation for Fiscal Year 2011 We compensate our Supervisory Board members after the end of each fiscal year. In January 2012, we paid each Supervisory Board member the fixed portion of their remuneration and meeting fees for services in 2011. In addition, we will generally pay each Supervisory Board member remuneration linked to our long-term per-formance as well as a dividend-based bonus, as defined in our Articles of Association, and expect to do so again for their services in 2011. Assuming that the Annual General Meeting in May 2012 approves the pro-posed dividend of € 0.75 per share, the Supervisory Board will receive a total remuneration of € 2,608,600 (2010: € 2,453,000).
Individual members of the Supervisory Board received the following compensation for the 2011 financial year (excluding statutory value added tax).
Members of the Supervisory Board Compensation for fiscal year 2011 Compensation for fiscal year 2010
in € Fixed Variable
7 Meeting fee Total Fixed Variable Meeting fee Total
Dr. Clemens Börsig 240,000 28,800 23,000 291,800 240,000 − 31,000 271,000 Karin Ruck 210,000 25,200 17,000 252,200 210,000 − 25,000 235,000 Wolfgang Böhr 60,000 7,200 6,000 73,200 60,000 − 9,000 69,000 Dr. Karl-Gerhard Eick 180,000 21,600 12,000 213,600 180,000 − 13,000 193,000 Heidrun Förster
1 − − − − 70,000 − 14,000 84,000 Katherine Garrett-Cox
2 40,000 4,800 3,000 47,800 − − − − Alfred Herling 120,000 14,400 11,000 145,400 85,000 − 12,000 97,000 Gerd Herzberg 60,000 7,200 6,000 73,200 60,000 − 9,000 69,000 Sir Peter Job
3 75,000 12,600 8,000 95,600 180,000 − 14,000 194,000 Prof. Dr. Henning Kagermann 120,000 14,400 12,000 146,400 120,000 − 13,000 133,000 Peter Kazmierczak
4 50,000 6,000 6,000 62,000 30,000 − 3,000 33,000 Martina Klee 60,000 7,200 6,000 73,200 60,000 − 9,000 69,000 Suzanne Labarge 120,000 14,400 11,000 145,400 120,000 − 13,000 133,000 Maurice Lévy 60,000 7,200 5,000 72,200 60,000 − 7,000 67,000 Henriette Mark 120,000 14,400 12,000 146,400 120,000 − 15,000 135,000 Gabriele Platscher 60,000 7,200 6,000 73,200 60,000 − 9,000 69,000 Dr. Theo Siegert 145,000 17,400 13,000 175,400 120,000 − 12,000 132,000 Dr. Johannes Teyssen 60,000 7,200 6,000 73,200 60,000 − 8,000 68,000 Marlehn Thieme 120,000 14,400 11,000 145,400 120,000 − 13,000 133,000 Tilman Todenhöfer 120,000 14,400 11,000 145,400 120,000 − 18,000 138,000 Stefan Viertel 60,000 7,200 6,000 73,200 25,000 − 2,000 27,000 Renate Voigt
5 10,000 1,200 − 11,200 − − − − Werner Wenning 60,000 7,200 6,000 73,200 60,000 − 8,000 68,000 Leo Wunderlich
6 − − − − 30,000 − 6,000 36,000
Total 2,150,000 261,600 197,000 2,608,600 2,190,000 − 263,000 2,453,000 1 Member until July 31, 2010. 2 Member since May 26, 2011. 3 Member until May 26, 2011. 4 Member until October 25, 2011. 5 Member since November 30, 2011. 6 Member until June 30, 2010. 7 Variable compensation for a regular member of € 7,200 is made up of a dividend-based amount of € 0 and an amount of € 7,200 linked to the long-term
performance of the company.

Deutsche Bank 01 – Management Report 157 Financial Report 2011 Corporate Social Responsibility
Deutsche Bank must be competitive and financially successful to create value for all stakeholders and our sustainability and corporate citizenship activities aim to ensure that we create lasting value. Integrating sus-tainability in our core business and investing in society are therefore paramount.
Sustainability
Increasing resource productivity and identifying clean sources for growth are essential in the face of increasing energy demand and resource scarcity as well as the impact of greenhouse gas emissions. In 2011, our Envi-ronmental Steering Committee, with the support of the external Climate Change Advisory Board, continued to work with business heads to align our business strategy with these long-term economic trends. This will ensure that Deutsche Bank supports the emerging needs of clients in their transition to a low-carbon, resource-efficient global economy.
We are building on a climate change strategy which identifies three mutually reinforcing roles: our core busi-nesses are supporting investments in energy and resource efficiency; we are using our influence to encourage action on energy and environmental security; and we are reducing our own environmental impacts. Our certi-fied Sustainability Management System proves the envelope for our activities in these areas.
Our approach to managing environmental and social risks was strengthened further in 2011 when we intro-duced the Environmental and Social Reputational Risk Framework. It is a part of our due diligence process and focuses on activities in sensitive sectors such as Metals and Mining, Oil and Gas as well as agriculture.
The Framework provides guidance on evaluating the risks of transactions, counterparties and business prac-tices and how these risks should be managed and mitigated within the business. Furthermore our new policy on cluster munitions demands to exit existing relationships and not to engage in new business with cluster munitions manufacturers, distributors and companies that produce key components of cluster munitions.
Core business activities Sustainability provides opportunities in areas including emissions trading, sustainable fund management, and financing and advisory services for clean-tech businesses.
Corporate Social Responsibility
Deutsche Bank 01 – Management Report 158 Financial Report 2011 Corporate Social Responsibility
Corporate & Investment Bank Corporate & Investment Bank is building on its leadership in carbon offsets and emissions trading as well as finance and advisory for clean energy companies and low carbon energy infrastructure.
We maintained our leading role in the international emissions trading market, being involved in more than 85 Clean Development Mechanism and Joint Implementation projects. These projects are expected to generate 215 million emission credits by the end 2012. One notable project was the purchase of Certified Emission Reductions from Henan Province in China that will help finance geothermal heat pump technology in up to 40 million square meters of real estate over five years. Energy Risk magazine recognized Deutsche Bank as “European Emissions House of the Year”.
Despite the challenging market and regulatory environment, we were active throughout the year in advising, arranging or financing nearly 3 gigawatts of renewable energy projects in North America, Europe and the Mid-dle East. An example of our innovative financing was a non-recourse revolving construction finance facility that will allow US-based company SunEdison to expand to 1.1 gigawatts of solar projects across North America. We also played key roles in the first in a series of major wind farm deals in Québec, Canada by financing 373 megawatts of generation capacity - the project Seigneurie de Beaupré was named “PFI 2011 Americas Rene-wables Deal of the Year”. Deutsche Bank was also named “Best Renewable Energy Finance House - Europe” by Environmental Finance and Carbon Finance magazines for the second consecutive year.
Our ability to help clean-tech companies to raise capital saw several landmark deals over the past year. They included co-advising on the U.S.$ 2.3 billion sale of smart meter company Landis+Gyr to Toshiba and the sale of 60 % of Sunpower to Total for U.S.$ 1.3 billion. Our securities joint venture in China, Zhong De, completed the largest IPO on the Shanghai Stock Exchange with a U.S.$ 1.43 billion deal for Sinovel, one of the leading producers of wind power machinery.
Private Clients and Asset Management We are integrating environmental, social and governance (ESG) issues in our asset management business. As of December 2011 we managed € 2.52 billion in ESG-related and climate change focused funds, further im-plemented the ESG policy for European funds and adopted ESG into the proxy voting policy in Germany.

Deutsche Bank 01 – Management Report 159 Financial Report 2011 Corporate Social Responsibility
Through these funds, we help finance sustainable energy investments to address climate change globally. Some of these funds also are targeted to improve living conditions in developing countries. We also invest directly in sustainable businesses through RREEF Capital Partners and RREEF Sustainable Advisors – both part of Asset Management’s alternatives investment platform. The two will make either public securities or private equity investments in sustainable and climate change-related projects and companies around the world. Launches in 2011 included the € 265 million European Energy Efficiency Fund, sponsored by the European Investment Bank, and the Africa Agriculture and Trade Investment Fund which has € 85 million to invest in enhancing the competitiveness of African export producers and manufacturers, and is sponsored by the Ger-man Government and Kreditanstalt für Wiederaufbau (KfW). These funds complement the Global Climate Partnership Fund launched in 2010, which made investments in 2011 in Europe, Asia and Latin America.
DB Advisors was named “Best ESG Asset Manager in Germany” by World Finance magazine, recognizing its leadership in integrating ESG strategies in investment decision making. New institutional product launches included ESG Emerging Markets External Debt and ESG Total Return AAA High Grade Fixed Income.
DWS Investments launched several new retail products, including two closed-end “green” funds. Furthermore it is enhancing consideration of ESG risks in the investment process, including several ESG training workshops and seminars for Asset Management staff in 2011.
Our over 2,800 retail branches worldwide also distribute green credit products and offer sustainable investment opportunities. Loans and credit lines allow private and business clients to finance energy efficient and renewa-ble energy technologies as well as the purchase of low emission vehicles.
For more information on sustainability at our core business please go to www.banking-on-green.com/business.
Eco-efficiency Minimizing our direct environmental impacts supports our business objectives by increasing energy efficiency and cutting costs. We also benefit by applying the knowledge gained in managing our own properties efficiently to our property investment activities.
We continued the process of reducing our carbon footprint by 20 % per annum. This policy has been in place since 2008 and will achieve carbon neutrality for our operations from 2013. Two-thirds of the energy used in our operations came from renewable sources in 2011 and we purchased 295,000 t carbon offsets to complete the 20 % emissions reduction.
Deutsche Bank 01 – Management Report 160 Financial Report 2011 Corporate Social Responsibility
Improved energy efficiency of our buildings is the main way to reduce costs and emissions. Our progress in this area is symbolized by the Deutsche Bank Towers in Frankfurt. We completed the move of Group Head-quarters back into the refurbished towers, whose high environmental performance was confirmed by Platinum certification on the international LEED standard. The building’s energy consumption will be 55 % lower than previously and with a third of the energy from renewable sources. The US Green Building Council awarded Deutsche Bank its inaugural International Leadership Award, recognizing our industry-leading work in deliver-ing LEED facilities around the world, our advances towards carbon neutrality and our investment in alternative energies and low-carbon technologies.
For more information on eco-efficiency please go to www.banking-on-green.com/greendata.
Corporate Citizenship
Companies should invest in the societies in which they operate. The social capital that comes from this benefits everyone. In 2011, we dedicated € 83.1 million to educational initiatives and social projects, to art and music as well as to corporate volunteering activities.
Education: Enabling talent Deutsche Bank is committed to promoting equality of opportunity around the world. A key focus of our support is on programs that help talented young people from disadvantaged backgrounds to prepare for a university education. In 2011, the “IntoUniversity” initiative in the United Kingdom was honored as “the best contribution to improving educational performance.” Deutsche Bank Foundation supports the initiative STUDIENKOMPASS, which provided support to around 1,400 young people in 2011 in Germany: 90 % of the participants plan to pursue a university degree. 15 Deutsche Bank employees volunteer as mentors in “Fair Talent”, a comprehen-sive long-term educational program that starts as early as at elementary and secondary school-level.
Social Investments: Creating opportunity We leverage our global presence and develop innovative solutions that create new opportunities to help people put unemployment and poverty behind them. In the US, Deutsche Bank supports projects such as “Living Cit-ies”, dedicated to the social and economic stabilization of communities with underdeveloped infrastructures. This commitment has been consistently honored as “outstanding” by the Federal Reserve Bank for the past 20 years. In the UK, we launched the Impact Investment Fund I, which invests in socially beneficial companies with commercially viable business models. As a leader in microfinance, we assist people to set up their own small businesses in developing and emerging market countries. And in the year under review, we gave 20,000 South African children a new chance in life.

Deutsche Bank 01 – Management Report 161 Financial Report 2011 Corporate Social Responsibility
Art and Music: Fostering creativity More than 200,000 visitors in seven Latin American museums over a two-year period – these are the record-breaking numbers of the exhibition “Beuys and Beyond – Teaching as Art”, featuring works of art from the Deutsche Bank Collection. Another success was achieved with “Globe. For Frankfurt and the World”, a series of events took place with 70 international artists in spring 2011 to mark the opening of our modernized Group headquarters in Frankfurt am Main. The conceptual artist Roman Ondák was selected to be “Artist of the Year 2012” – his works will be presented in a solo exhibition in the Deutsche Guggenheim in Berlin.
The long-standing partnership between Deutsche Bank and the Berliner Philharmoniker enabled the orches-tra’s innovative Digital Concert Hall that makes classical music accessible to people around the world. The season opening concert alone in 2011 was attended by an audience of 9,000 on db.com. And since 2002, more than 21,000 young people from all parts of society have taken part in the education programme of the Berliner Philharmoniker.
Employee Engagement: Pass on your passion Deutsche Bank has encouraged its staff members to do volunteer work for more than 20 years. As mentors, as advisors to non-profit organizations or as volunteers in team challenges, they accept responsibility in society at a very personal level. 19 000 employees were corporate volunteers and supported almost 3 000 community partners in 2011 – this represents an increase from 21 % to 24 % of in just one year. In Germany, Hong Kong and Singapore this outstanding commitment was honored via various awards. The objective of “Pass on your passion”, a new initiative launched in 2011, is to inspire other people to make a difference through volunteering and thus build social capital.
Our “Corporate Social Responsibility Report 2011” provides additional information on how we implement our sustainability strategy as well as our corporate citizenship program.

Deutsche Bank 01 – Management Report 162 Financial Report 2011 Employees
As of December 31, 2011 we employed a total of 100,996 staff members as compared to 102,062 as of Decem-ber 31, 2010. We calculate our employee figures on a full-time equivalent basis, meaning we include propor-tionate numbers of part-time employees.
The following table shows our numbers of full-time equivalent employees as of December 31, 2011, 2010 and 2009.
Employees
1 Dec 31, 2011 Dec 31, 2010 Dec 31, 2009
Germany 47,323 49,265 27,321 Europe (outside Germany), Middle East and Africa 24,187 23,806 22,031 Asia/Pacific 18,351 17,779 16,518 North America
2,3 10,700 10,811 10,815 Central and South America 435 401 368
Total employees
3 100,996 102,062 77,053 1 Full-time equivalent employees; Deutsche Postbank aligned its FTE definition to Deutsche Bank which reduced the Group number as of December 31, 2011 by
260 (prior periods not restated); in 2010, the employees of Kazakhstan previously shown in Asia/Pacific were assigned to Europe (outside Germany), Middle East and Africa; numbers for 2009 (6 employees) have been reclassified to reflect this. In 2011, 257 FTE of Sal Oppenheim Germany have been assigned directly to Austria, Luxembourg and Switzerland (Europe outside Germany).
2 Primarily the United States. 3 The nominal headcount of The Cosmopolitan of Las Vegas is 4,256 as of December 31, 2011 compared to 4,147 as of December 31, 2010. The headcount
number is composed of full time and part time employees and is not part of the full time equivalent employees figures.
The number of our employees decreased in 2011 by 1,066 or 1.0 % due to the following factors:
— The number of Corporate & Investment Bank Group Division staff decreased by 429 due to exceptionally tough markets particularly for Corporate Banking & Securities.
— The number of PCAM staff declined by 1,743. This was primarily attributable to progress made in Private & Business Clients with the integration of Deutsche Postbank and the sale of noncore businesses in India.
— In our Infrastructure operations, employee headcount at our service centers in India, the Philippines, the UK and the US continued to grow. Staff numbers at these service centers increased by about 1,255 in 2011. The overall headcount in the other Infrastructure areas remained virtually unchanged against end of 2010.
Post-Employment Benefit Plans
We sponsor a number of post-employment benefit plans on behalf of our employees, both defined contribution plans and defined benefit plans.
In our globally coordinated accounting process covering defined benefit plans with a defined benefit obligation exceeding € 2 million our global actuary reviews the valuations provided by locally appointed actuaries in each country.
By applying our global principles for determining the financial and demographic assumptions we ensure that the assumptions are unbiased and mutually compatible and that they follow the best estimate and ongoing plan principles.
Employees

Deutsche Bank 01 – Management Report 163 Financial Report 2011 Employees
For a further discussion on our employee benefit plans see Note 34 “Employee Benefits” to our consolidated financial statements.
A new culture of performance at Deutsche Bank
Deutsche Bank is committed to ensuring a high performance culture driving our business results. We are build-ing and strengthening our culture based on a set of very clear principles:
— everyone knows what is expected of them — we differentiate performance — and everyone knows where they stand
As set out in our Management Agenda we have refocused our senior managers on these principles and up-dated people processes and training support.
We expect this to be a long-term process involving the entire bank, however it can help us to reach an impor-tant milestone on the path to a new performance culture at Deutsche Bank.
Diversity: equal opportunities as the driver of success
In a globalized world, mixed teams have been shown to be more successful, as it is only by integrating different perspectives and experiences that client-oriented solutions can be delivered. Systematic diversity management is therefore of crucial importance in our personnel strategy. Orientation for this is provided by our Diversity Mission Statement, which is a part of Deutsche Bank’s operating policies and which all of our HR measures are designed to comply with.
Deutsche Bank’s global Diversity Mission Statement We aim to foster an inclusive culture that values the diverse mix of our employees, utilizes their talents and helps them realize their full potential.
Global Priorities — Accountability and Leadership: Fully integrate diversity and inclusion into the mindset of all employees
across the company; — Gender: Increase female mobility and senior representation at all levels at Deutsche Bank; — Generational: Create an environment where all generations feel they can progress, succeed, innovative
and create value/profit for the company (as defined by them).

Deutsche Bank 01 – Management Report 164 Financial Report 2011 Employees
Declaration of the DAX 30 Increasing the percentage of women in senior management positions is a strategic initiative to drive business success. Deutsche Bank along with the other DAX 30 companies in Germany signed the “Dax 30” self com-mitment. Under the voluntary commitment, Deutsche Bank Group plans to increase the worldwide proportion of its female senior executives at the Managing Director and Director levels to 25 % by the end of 2018 and the proportion of female officers (with the titles Managing Director, Director, Vice President, Assistant Vice Presi-dent and Associate) to 35 % by the end of 2018, subject to applicable laws. Deutsche Bank met the 2011 se-nior executive target of 17 % and outperformed the officer target of 29.3 %, by reaching 29.7 %.
DB People Survey 2011: the results
In 2011, as in the previous year, 74 % of the bank’s staff – over 60,000 employees – took part in the Group-wide DB People Survey. For twelve years now, Deutsche Bank has been conducting regular employee surveys to assess employee commitment to the bank and opinions on other aspects of working at the bank such as corporate culture, leadership and strategy. The level of employee participation in the survey has risen since it was launched and remains at a high level, a clear sign that staff values this feedback tool.
Note: In 2011 Deutsche Bank moved away from analyzing index scores towards analyzing % agreement scores.
The commitment index (72 %) shows that staff have consistently high levels of loyalty to the company. The bank tracks a variety of other measures in the surveys which show very positive levels for client focus and strategy in particular.
60
70
50
DB Commitment % Agreement Score
1999 2000 2001 2002 2003 2004 2005 2006 2007 2008 2010 2011
DB Commitment Index Score
2009
Index ceiling = 100 / %
Commitment Index
80
66
7270
67 67 68 68 68
7174
77
74
7376
73 72

Deutsche Bank 01 – Management Report 165 Financial Report 2011 Outlook
The Global Economy We expect the global economy to decelerate slightly in 2012; however, economic momentum should begin to pick up slowly in the second half of the year. Over the course of 2012, we expect to see an annualized in-crease in global GDP of 3.25 %. Considering the under-utilized capacities in the industrial nations and the positive basis effects of energy prices, the global inflation rate will decline from nearly 4.5 % in 2011 to around 3.5 % in 2012. Although we project a recovery in global economic growth to 4 % in 2013, the global inflation rate should remain below 3.5 %.
The ongoing slowing of economic growth is originated in the industrial countries, in particular, in the eurozone. We expect that once the stricter budget rules are enacted and their observance is more strictly and institution-ally anchored, and once greater success is achieved in the consolidation and reform programs of the countries affected, the sovereign debt crisis in the eurozone will gradually become less severe. Furthermore, the liquidity provided to banks through the three-year tender of the European Central Bank should mitigate the situation at the banks themselves and provide easing ahead of the massive volume of bond refinancing that southern European countries will require this spring. However, the eurozone economy might have slid into a technical recession during the winter period 2011/2012, so that even with a recovery over the course of the year, GDP is likely to decline by 0.5 %. On an annualized basis, Germany will probably be the only larger country within the eurozone that will not shrink, though the economy may stagnate. In contrast, we believe there will be a signifi-cant decline in GDP in some of the southern European countries. Driven by external demand and a smaller impact from fiscal consolidation, growth in the eurozone should pick up again in 2013 and reach 1 %, the same rate as in Germany.
For the U.S., we are projecting an increasing growth rate over the course of the year. At 2.5 % annualized, it should be slightly higher than last year. Companies in the non-financial sector continue to be in a very robust financial shape. Furthermore, there were increasing indications at the beginning of the year that the housing market has started to reach a floor, after declining five years. Regarding U.S. unemployment figures, a turn-around became apparent recently, which could at least stabilize consumption at the current relatively moderate rate of expansion. The U.S. economy is likely to continue its expansion in 2013 with an annualized growth rate of 3 %.
Over the course of 2011, as the catch-up effects in world trade tapered off, the growth rate in emerging mar-kets declined only slightly. With the receding risk of inflation, a few Latin American countries and, recently, both China and Israel reacted with an easing of monetary policy. The emerging markets’ more robust domestic demand, compared with industrial countries, together with the scope they will probably continue to use for monetary and fiscal policies, should limit the impact industrial countries’ weaknesses will have on the emerging markets. In Asia (excluding Japan) GDP growth in 2012 should come to nearly 7 %, which is only slightly below the 7.25 % seen in 2011. With the gradual recovery of the global economy and the reconstruction investments in Japan to rectify the damages caused by the catastrophe last March, the Japanese economy should stabilize and expand on an annualized basis of 0.75 %. Asia (excluding Japan) and Japan will probably contribute to faster global GDP growth in 2013. Growth rates could increase to 7.4 % and 1.1 %, respectively. For Latin America, we expect GDP growth to slow from 4.25 % to 3.75 % in 2012 and again increase to 4.2 % in 2013.
Outlook

Deutsche Bank 01 – Management Report 166 Financial Report 2011 Outlook
Uncertainties for the economic outlook are primarily due to the political developments in Europe. The resched-uling of Greek debt and the second rescue package for Greece are crucial. However, the markets could lose trust in the reform efforts of other countries, especially if the economic trend continues downwards. The pend-ing decisions on the specific conditions of the eurozone rescue mechanisms imply a significant potential for conflict, which could lead to massive disruptions on the financial markets. Meanwhile, the national debt level in the U.S. has reached 100 % of GDP. Considering the political stalemate there, a renewed escalation with need for a further rising of the debt ceiling is considered possible during the election campaign. Moreover, the cur-rent acceleration of the American economy could turn out to be unsustainable. In the Middle East, the conflict in connection with the Iranian nuclear program could become much more severe.
The Banking Industry The banking business is likely to be heavily influenced again by macroeconomic developments and regulatory changes in the next two years. In Europe the industry would probably face a decline in revenues and profits should the European sovereign crisis continue, whereas in the US a slowdown in growth would impact profita-bility.
Investment banking industry revenues may decline in 2012, especially in areas heavily impacted by regulatory changes. The strategic withdrawal of several providers – mainly driven by regulatory measures that make certain activities substantially more expensive and less lucrative – should, by contrast, enable well-positioned, well-capitalized banks to win market share. Simultaneously, this may allow these banks to at least partly com-pensate, via economies of scale, for the generally lower earnings potential. For the investment banking indus-try as a whole, lower revenues and higher capital requirements are likely to permanently reduce both profitability ratios and employee compensation levels.
Asset management performance will probably once again hinge on the direction taken in the global investment markets and the risk appetite of investors. This is likely to depend first and foremost on whether and how the sovereign debt crisis in Europe can be brought closer to a solution. In a positive scenario, the growth forces in the countries under pressure would be unleashed, credible and successful efforts would be taken to reduce budget deficits and external support would be provided as appropriate. Accordingly, the major risk banks are facing is a further escalation of the debt crisis particularly in Europe, but also in the U.S.
The technical recession in the eurozone expected in winter will probably leave a negative stamp on both lend-ing and deposit volumes in the traditional corporate and retail business in Europe. Client demand for credit is expected to decline. However, credit supply by banks will also decrease due to expected increased defaults and persistently high refinancing costs. Moreover, households’ deposits with banks might increase only slowly or possibly even decrease. The countries affected by the crisis will probably be impacted most by these devel-opments, whereas more robust economies such as those in Germany and Scandinavia could easily see further growth. The prolonged low interest rates may cause additional difficulties for the banking industry as they bring further pressure for revenues from maturity transformation and thus for margins. This suggests that net interest income is likely to fall.
Deutsche Bank 01 – Management Report 167 Financial Report 2011 Outlook
Other uncertainties for the banking sector lie in the implementation of already adopted regulations and the introduction of further legislation that is already under discussion in some cases. While the majority of the measures to increase financial stability involve sensible changes to the framework of the industry, their cumula-tive effect is often underestimated. The same applies to the risks which emerge from substantial variations in the scope and implementation of new regulations, from the potential for regulatory arbitrage and from market fragmentation. Some of the ideas currently being debated – for example, the unilateral introduction of a finan-cial transaction tax only in the eurozone – would not be conductive to the objective of achieving a more robust and resilient financial system. The banks are confronted with the task of significantly reducing their risk-weighted assets, which they must manage without damaging relations with their private and corporate clients.
Overall, the banks face immense challenges over the next two years. In the end, and mostly unintended by policymakers, the disintermediation process of the pre-crisis years may resume as financing activities shift further from banks’ balance sheets towards the capital markets and other businesses migrate into the less regulated shadow banking system. Banks will have to build up larger capital buffers and adjust to a much stric-ter regulatory environment which, in some cases, will demand that they redefine their business models and compel them to adapt to a permanently lower profitability level. Given the external (and presumably sustained) headwinds, many banks are increasingly likely to concentrate more on their strengths in certain market seg-ments and regions, and intensify their focus on cost discipline. These developments will be exacerbated by a prospective slowdown in GDP growth and by the sovereign debt crisis that is casting its shadow over the Eu-ropean banks in particular.
The Deutsche Bank Group Deutsche Bank like all other financial institutions will continue to be impacted both by the changing competitive landscape and a stricter regulatory environment and it continues to operate in an environment that exposes it to significant litigation risks. Risk management, capital adequacy and balance sheet efficiency will remain increa-singly important as competitive differentiators. Deutsche Bank Management has improved our capital, liquidity and refinancing structures, which are crucial for future success. Over the course of 2011 we increased the core Tier 1 capital ratio significantly. We fulfill the requirements of the European Banking Authority and Basel 2.5, and we are well prepared for the Basel 3 requirements. In this context, Deutsche Bank will retain a balanced divi-dend policy which considers capital requirements and total shareholder return.
Our global business model comprising Corporate Banking & Securities, Global Transaction Banking, Asset and Wealth management and Private & Business Clients with a solid distribution network especially in our German home market should provide long-term profitable opportunities for us. The recalibration within Corporate Banking & Securities significantly improved Deutsche Bank’s risk profile. Additionally, we strengthened our earnings by expanding our activities in the GTB and PCAM businesses. In 2012 and beyond, we should be able to further benefit from our strengthened set-up as a global investment bank and as a home market leader with greater stability in revenues and a more balanced earnings mix. Additionally, we are also continuing to focus on our performance and improving efficiency.

Deutsche Bank 01 – Management Report 168 Financial Report 2011 Outlook
Our Corporate Investments group division enhances the bank’s portfolio management and risk management capability. It has management responsibility for certain assets and is therefore exposed to the opportunities and risks arising from the holdings in its portfolio. The risks implied are closely monitored and managed.
Overall, Deutsche Bank is strongly positioned to exploit the competitive opportunities in the current environment.
Corporate Banking & Securities The investment banking environment in 2012 and 2013 will be impacted by new regulation and ongoing macro concerns over Europe’s sovereign debt crisis, potential slowdown in Emerging Markets and the sustainability of the U.S. recovery. This means that volatility will remain a constant theme but we believe that capital markets activity will be robust. Corporate Finance fee pools should increase in 2012, subject to normalization of market conditions, as corporate balance sheets remain healthy and financial institutions are likely to further increase funding and capital levels. Trading volumes may increase if investor sentiment improves. However, margins may face downward pressure in products with lower capital requirements (e.g., foreign exchange and cash equities) as competition increases, while more capital intensive structured products may see margins rise as a result of some industry participants scaling back due to the impact of new regulation.
Corporate Banking & Securities is expected to continue to benefit from the further integration of the investment bank. This integration, started in 2010, enables us to better service corporate clients across a broad range of products, eliminate duplication across both front office and support functions, and increase collaboration be-tween all areas of the business. We will continue to focus on both client flows and solutions while maintaining strong asset efficiency (especially given upcoming regulatory changes) and minimizing risk exposures.
In Sales & Trading, we expect revenues from flow products such as foreign exchange, money markets, interest rates and cash equities will be affected by ongoing volatility but should remain robust given our leading client market shares, notwithstanding market conditions. In addition we expect to benefit from our continued invest-ments in electronic trading and direct market access platforms. We will continue to focus on our Prime Finance franchise where we have built up a market leading position. Emerging markets trading and commodities will also remain key growth areas as demand increases.

Deutsche Bank 01 – Management Report 169 Financial Report 2011 Outlook
In 2012 and 2013 and assuming that market conditions stabilize we expect the corporate finance fee pool to increase. Debt issuance is expected to increase driven by M&A related activity and financial disintermediation and as financial institutions seek additional term funding and capital, although there may be pressure on corpo-rate fundamentals if global growth slows. We anticipate equity issuance to increase given the large backlog of deals from the second half of 2011 as recapitalization and privatization deals come to market. M&A activity is expected to be robust as a cyclical recovery continues, subject to the assumption that volatility subsides and stability returns. Deutsche Bank is well positioned to capitalize on all these trends and build further momentum in our corporate finance franchise.
Global Transaction Banking The outlook for global transaction banking over the next two years will likely be influenced by a number of critical factors. The comparatively low interest rate levels seen in most markets during 2010 and 2011 will pers-ist. Additionally, a slow-down in global growth, a potential recession in Europe and the continuation of the sove-reign debt crisis could adversely impact revenues. Furthermore, regulation will continue to pose a challenge to the overall banking industry.
Deutsche Bank’s Global Transaction Banking (GTB) business will be impacted by these environmental chal-lenges. The sustained momentum of profitable growth and client acquisition in recent years, together with its leading position in major markets, leaves Global Transaction Banking well-placed to attract new clients even in challenging conditions. The business is focusing on deepening its client relationships with Complex Corporates and Institutional Clients in existing regions while pushing further growth in certain Emerging Markets. In addi-tion, initiatives to further re-balance our earnings mix to reduce dependency on interest rates continue. The successful integration of parts of ABN AMRO’s corporate and commercial banking activities acquired in the Netherlands in 2010 further strengthens Global Transaction Banking’s footprint in Europe by creating a second home market for corporate clients and achieving deeper client coverage and complementary product offerings. The business is expected to continue to capitalize on synergies resulting from the integration of the Corporate & Investment Banking activities. Closer co-operation with other areas of the Corporate & Investment Bank as part of the ongoing integration will ensure that a wider range of clients will benefit from Global Transaction Banking’s services.
Asset and Wealth Management The outlook for the asset and wealth management business will be influenced by several converse factors in 2012 and beyond. The assumed recovery in markets in 2012 is expected to result in an increase in revenues from commissions and performance fees. Long term trends, including the ongoing shift from state pension dependency to private retirement funding, ageing populations in mature markets, and growing wealth in emerg-ing economies, will also positively impact revenues and new invested assets opportunities over the next years. Conversely, revenues may come under pressure in the near term if market volatility reoccurs and investors continue to retreat to cash or simpler, lower fee products.

Deutsche Bank 01 – Management Report 170 Financial Report 2011 Outlook
In the second half of 2011, global financial markets experienced increased volatility leading to lower investor confidence and outflows across equity and cash products, especially affecting active asset managers such as Deutsche Bank´s Asset Management (AM). While markets showed signs of stabilization towards end of the year, unresolved macroeconomic issues continue to be a major force in the asset management industry.
The adoption and implementation of multiple new reforms continues to be a major challenge for asset manag-ers, especially where uncertainty of the impact exists. New and pending regulation may increase costs and restrictions on asset managers and could impact the competitive landscape and lead to changing business models especially for larger players and bank-owned asset managers. As part of our continual effort to main-tain an optimal business mix and be among the market leaders in each of our businesses, we announced on November 22, 2011 that we are conducting a strategic review of our global Asset Management division. The strategic review is focusing in particular on how recent regulatory changes and associated costs and changes in the competitive landscape are impacting the business and its growth prospects on a bank platform. The review covers all of the Asset Management division globally except for the DWS franchise in Germany, Europe and Asia, which we have already determined is a core part of our retail offering in those markets. Results from the strategic review may cause AM to reorganize and refocus operations.
Nevertheless, operating leverage obtained in AM via platform re-engineering and cost efficiency efforts contin-ued through 2011 and complimented by the Complexity Reduction Program, underpin the ability of the busi-ness to benefit from improved capital markets and growth in the economy, as well as absorb the potential for modest market volatility or investor comfort towards fixed income, lower fee products. In addition, AM is well positioned to gain from the aforementioned long term trends in the industry.
With operating results now solidly positive, cost base under control, and continued efficiency benefits expected from bank-wide complexity reduction and other initiatives, the outlook for AM for 2012 and 2013 is positive. The business is expected to benefit significantly from continued stabilization and growth of equity markets, growing investor interest in alternative products including real estate, and deployment of sidelined investor capital into higher-growth and higher-fee products to compensate for losses over past few years.
Any further market shocks, prolonged periods of uncertainty or recessionary trends could undermine the ability of Asset Management to meet profit targets.

Deutsche Bank 01 – Management Report 171 Financial Report 2011 Outlook
Private Wealth Management (PWM) expects to benefit of growing wealth markets and maintain or increase market share in the fragmented competitive environment for 2012 and beyond. Clear focus on (Ultra) High Net Worth Individuals and Key Client segment will contribute significant results due to strong leverage of the exist-ing platform within Deutsche Bank Group and close co-operation with Corporate & Investment Banking. PWM’s business model with strong coverage of emerging markets will allow balancing challenges in mature markets, increased regulatory framework and political environment. In general, PWM is less exposed to impacts from fiscal policy since its business model focuses on onshore opportunities in already existing large and developed onshore markets.
Fundamental economic downturn during the past months however showed considerable divergence between regions and markets. Within the eurozone PWM will seek to strengthen its home market leadership with its two strong brands of Deutsche Bank and Sal. Oppenheim. PWM’s Asia/Pacific growth strategy is aligned to Deutsche Bank’s management agenda with organic growth through hiring and intensified co-operation with CIB. In Asia/Pacific as well as in Americas it is planned to further capitalize on organic growth momentum and the-reby target top three market position in Asia/Pacific and top five in Americas. In Europe (except home market) productivity is expected to be further improved and top five market position in Middle East and Russia and Eastern Europe (REE) is targeted. The Sal. Oppenheim integration and positioning within Deutsche Bank Group delivered positive results in 2011 and Sal. Oppenheim should perform well in 2012 and beyond. In vari-ous regions, IT and process improvements are planned to enable growth initiatives and to improve cost efficiency.
Deutsche Bank’s Asset and Wealth Management (AWM) continues to be a leading and diversified global ser-vice provider, strongly positioned to benefit from the market indicators outlined above.
Private & Business Clients For countries Private & Business Clients (PBC) operates in the overall macro-economic outlook is mixed. GDP growth in the home market Germany has a slightly positive outlook for 2012 and even better outlook for 2013, while the GDP outlook for most of the European countries with PBC presences is rather flat or slightly negative. Asia, however, continues its resilient growth path. A further significant decline in economic growth might result in higher unemployment rates, increasing credit loss provisions and lower business growth.
PBC currently faces further uncertainties in its operating environment with respect to the development of in-vestment product markets, especially depending on further progress of the European sovereign debt crisis. Continued low interest rates in 2012 might also negatively affect revenues in PBC.
The success of Private & Business Clients is based on a solid business model: With the combination of advi-sory banking and consumer banking PBC has built a leading position in its home market, Germany, accompa-nied by strong positions in other important European markets, and growth investments in key Asian countries.
Deutsche Bank 01 – Management Report 172 Financial Report 2011 Outlook
In Advisory Banking Germany, we expect to be able to reinforce our market position, continuing our success in deposit gathering and low-risk mortgage production as well as strengthening our investment and insurance product business. With the ongoing organizational realignment we will seek to further enhance our value prop-osition and improve our delivery on customer preferences.
Postbank will further pursue its growth path in Consumer Banking in Germany while further reducing non-core risk positions. Deutsche Bank and Postbank together are expected to continue their successful realization of synergies on the revenue and cost side. Effects from the exercise of the mandatory exchangeable bond, the put/call option and a potential domination agreement might support the delivery of synergies in 2012.
However, the above mentioned economic risks are also relevant to the intensified Deutsche Bank/Postbank cooperation. On the cost side, there is a risk that synergies do not realize or realize later than foreseen. Addi-tionally, there is a risk that the costs to achieve the synergies are higher than expected. These risks are miti-gated to the extent possible by a bottom up revalidation of synergy measures with ongoing tracking and reporting to senior management.
Capitalizing on our advisory strength in Europe, we intend to further develop PBC’s profitable franchise as an affluent proposition with a focus on wealthy regions. PBC’s Asian growth option will be leveraged by the 19.99 % stake in Hua Xia Bank in China coupled with intensified cooperation, as well as further organic growth in India.
PBC is expected to continue on its growth path towards its € 3 billion income before income taxes ambition, envisaged to be realized after the completion of the full integration of Postbank.

Consolidated Financial Statements Consolidated Statement of Income – 175 Consolidated Statement of Comprehensive Income – 176 Consolidated Balance Sheet – 177 Consolidated Statement of Changes in Equity – 178 Consolidated Statement of Cash Flows – 180 Notes to the Consolidated Financial Statements including Table of Content – 181

Deutsche Bank 02 – Consolidated Financial Statements 174 Financial Report 2011
(This page intentionally left blank)

Deutsche Bank 02 – Consolidated Financial Statements 175 Financial Report 2011 Consolidated Statement of Income
in € m. Notes 2011 2010 2009
Interest and similar income 6 34,878 28,779 26,953 Interest expense 6 17,433 13,196 14,494 Net interest income 6 17,445 15,583 12,459
Provision for credit losses 19 1,839 1,274 2,630 Net interest income after provision for credit losses 15,606 14,309 9,829
Commissions and fee income 7 11,544 10,669 8,911 Net gains on financial assets/liabilities at fair value through profit or loss 6 3,058 3,354 7,109 Net gains (losses) on financial assets available for sale 8 123 201 (403) Net income (loss) from equity method investments 17 (264) (2,004) 59 Other income (loss) 9 1,322 764 (183) Total noninterest income 15,783 12,984 15,493
Compensation and benefits 33, 34 13,135 12,671 11,310 General and administrative expenses 10 12,657 10,133 8,402 Policyholder benefits and claims 207 485 542 Impairment of intangible assets 24 − 29 (134) Restructuring activities − − − Total noninterest expenses 25,999 23,318 20,120
Income before income taxes 5,390 3,975 5,202
Income tax expense 35 1,064 1,645 244
Net income 4,326 2,330 4,958
Net income (loss) attributable to noncontrolling interests 194 20 (15) Net income attributable to Deutsche Bank shareholders 4,132 2,310 4,973
Earnings per Common Share
in € Notes 2011 2010 2009
Earnings per common share:
1 11 Basic € 4.45 € 3.07 € 7.21 Diluted
2 € 4.30 € 2.92 € 6.94
Number of shares in million:
1 Denominator for basic earnings per share – weighted-average shares outstanding
928.0 753.3 689.4
Denominator for diluted earnings per share – adjusted weighted-average shares after assumed conversions
957.3 790.8 716.7
1 The number of average basic and diluted shares outstanding has been adjusted for all periods before October 6, 2010 to reflect the effect of the bonus element of the subscription rights issue in connection with the capital increase.
2 Includes numerator effect of assumed conversions. For further detail please see Note 11 “Earnings per Common Share”.
The accompanying notes are an integral part of the Consolidated Financial Statements.
Consolidated Statement of Income

Deutsche Bank 02 – Consolidated Financial Statements 176 Financial Report 2011 Consolidated Statement of Comprehensive Income
in € m. 2011 2010 2009
Net income recognized in the income statement 4,326 2,330 4,958
Other comprehensive income
Actuarial gains (losses) related to defined benefit plans, before tax
1 707 135 (792) Unrealized net gains (losses) on financial assets available for sale:
2 Unrealized net gains (losses) arising during the period, before tax (697) 83 523 Net (gains) losses reclassified to profit or loss, before tax (11) 39 556
Unrealized net gains (losses) on derivatives hedging variability of cash flows:
2 Unrealized net gains (losses) arising during the period, before tax (141) (78) 118 Net (gains) losses reclassified to profit or loss, before tax 3 4 6
Unrealized net gains (losses) on assets classified as held for sale, before tax
3 25 (25) − Foreign currency translation:
2 Unrealized net gains (losses) arising during the period, before tax 1,291 920 40 Net (gains) losses reclassified to profit or loss, before tax − (6) 11
Unrealized net gains (losses) from equity method investments (5) (26) 85 Tax on net gains (losses) in other comprehensive income 75 211 (141) Other comprehensive income, net of tax 1,247 1,257 406
Total comprehensive income, net of tax 5,573 3,587 5,364
Attributable to: Noncontrolling interests 155 4 (1) Deutsche Bank shareholders 5,418 3,583 5,365 1 In the Consolidated Statement of Comprehensive Income, actuarial gains (losses) related to defined benefit plans, before tax are disclosed within other
comprehensive income (loss) starting 2011. The corresponding deferred taxes are included in the position tax on net gains (losses) in other comprehensive income. The prior periods were adjusted accordingly. In the Consolidated Balance Sheet, actuarial gains (losses) related to defined benefit plans, net of tax, are recognized in retained earnings.
2 Excluding unrealized net gains (losses) from equity method investments. 3 Please refer to Note 25 “Non-Current Assets and Disposal Groups Held for Sale” for additional information.
The accompanying notes are an integral part of the Consolidated Financial Statements.
Consolidated Statement of Comprehensive Income

Deutsche Bank 02 – Consolidated Financial Statements 177 Financial Report 2011 Consolidated Balance Sheet
in € m. Notes Dec 31, 2011 Dec 31, 2010
Assets: Cash and due from banks 15,928 17,157 Interest-earning deposits with banks 162,000 92,377 Central bank funds sold and securities purchased under resale agreements 20, 21 25,773 20,365 Securities borrowed 20, 21 31,337 28,916 Financial assets at fair value through profit or loss
Trading assets 240,924 271,291 Positive market values from derivative financial instruments 859,582 657,780 Financial assets designated at fair value through profit or loss 180,293 171,926
Total financial assets at fair value through profit or loss of which € 87 billion and € 91 billion were pledged to creditors and can be sold or repledged at December 31, 2011, and 2010, respectively 12, 14, 21, 36 1,280,799 1,100,997
Financial assets available for sale of which € 9 billion and € 4 billion were pledged to creditors and can be sold or repledged at December 31, 2011, and 2010, respectively 16, 20, 21 45,281 54,266
Equity method investments 17 3,759 2,608 Loans
of which € 3 billion were pledged to creditors and can be sold or repledged each year ending December 31, 2011 and 2010 18, 19 412,514 407,729
Property and equipment 22 5,509 5,802 Goodwill and other intangible assets 24 15,802 15,594 Other assets 25, 26 154,794 149,229 Assets for current tax 35 1,870 2,249 Deferred tax assets 35 8,737 8,341 Total assets 2,164,103 1,905,630 Liabilities and equity: Deposits 27 601,730 533,984 Central bank funds purchased and securities sold under repurchase agreements 20, 21 35,311 27,922 Securities loaned 20, 21 8,089 3,276 Financial liabilities at fair value through profit or loss 12, 14, 36
Trading liabilities 63,886 68,859 Negative market values from derivative financial instruments
1 838,817 647,195 Financial liabilities designated at fair value through profit or loss 118,318 130,154 Investment contract liabilities 7,426 7,898
Total financial liabilities at fair value through profit or loss 1,028,447 854,106 Other short-term borrowings 30 65,356 64,990 Other liabilities 25, 26 187,816 181,827 Provisions 19, 28 2,621 2,204 Liabilities for current tax 35 2,524 2,736 Deferred tax liabilities 35 1,789 2,307 Long-term debt 31 163,416 169,660 Trust preferred securities 31 12,344 12,250 Total liabilities 2,109,443 1,855,262 Common shares, no par value, nominal value of € 2.56 32 2,380 2,380 Additional paid-in capital 23,695 23,515 Retained earnings
1 30,119 25,975 Common shares in treasury, at cost 32 (823) (450) Accumulated other comprehensive income, net of tax (1,981) (2,601) Total shareholders’ equity 53,390 48,819 Noncontrolling interests 1,270 1,549 Total equity 54,660 50,368 Total liabilities and equity 2,164,103 1,905,630 1 The initial acquisition accounting for ABN AMRO, which was finalized at March 31, 2011, resulted in a retrospective adjustment of retained earnings of
€ (24) million for December 31, 2010.
The accompanying notes are an integral part of the Consolidated Financial Statements.
Consolidated Balance Sheet
Deutsche Bank 02 – Consolidated Financial Statements 178 Financial Report 2011 Consolidated Statement of Changes in Equity
in € m. Common shares (no par value)
Additional paid-in capital
Retained earnings
1
Common shares in treasury, at cost
Equity classified as obligation to purchase common shares
Balance as of December 31, 2008 1,461 14,961 20,074 (939) (3) Total comprehensive income, net of tax
2 − − 4,973 − − Common shares issued 128 830 − − − Cash dividends paid − − (309) − − Actuarial gains (losses) related to defined benefit plans, net of tax − − (679) − − Net change in share awards in the reporting period − (688) − − − Treasury shares distributed under share-based compensation plans − − − 1,313 − Tax benefits related to share-based compensation plans − 35 − − − Additions to Equity classified as obligation to purchase common shares − − − − (5) Deductions from Equity classified as obligation to purchase common shares − − − − 8 Option premiums and other effects from options on common shares − (149) − − − Purchases of treasury shares − − − (19,238) − Sale of treasury shares − − − 18,816 − Net gains (losses) on treasury shares sold − (177) − − − Other − 18 (3) − − Balance as of December 31, 2009 1,589 14,830 24,056 (48) − Total comprehensive income, net of tax
2 − − 2,286 − − Common shares issued 791 9,413 − − − Cash dividends paid − − (465) − − Actuarial gains (losses) related to defined benefit plans, net of tax − − 94 − − Net change in share awards in the reporting period − (296) − − − Treasury shares distributed under share-based compensation plans − − − 1,439 − Tax benefits related to share-based compensation plans − (11) − − − Additions to Equity classified as obligation to purchase common shares − − − − (93) Deductions from Equity classified as obligation to purchase common shares − − − − 93 Option premiums and other effects from options on common shares − (115) − − − Purchases of treasury shares − − − (15,366) − Sale of treasury shares − − − 13,525 − Net gains (losses) on treasury shares sold − − − − − Other − (306) 4 − − Balance as of December 31, 2010 2,380 23,515 25,975 (450) − Total comprehensive income, net of tax
2 − − 4,132 − − Common shares issued − − − − − Cash dividends paid − − (691) − − Actuarial gains (losses) related to defined benefit plans, net of tax − − 666 − − Net change in share awards in the reporting period − 153 − − − Treasury shares distributed under share-based compensation plans − − − 1,108 − Tax benefits related to share-based compensation plans − (76) − − − Additions to Equity classified as obligation to purchase common shares − − − − − Deductions from Equity classified as obligation to purchase common shares − − − − − Option premiums and other effects from options on common shares − (131) − − − Purchases of treasury shares − − − (13,781) − Sale of treasury shares − − − 12,300 − Net gains (losses) on treasury shares sold − (32) − − − Other − 266 37 − − Balance as of December 31, 2011 2,380 23,695 30,119 (823) −
1 The initial acquisition accounting for ABN AMRO, which was finalized at March 31, 2011, resulted in a retrospective adjustment of retained earnings of € (24) million for December 31, 2010. 2 Excluding actuarial gains (losses) related to defined benefit plans, net of tax.
Consolidated Statement of Changes in Equity

Deutsche Bank 02 – Consolidated Financial Statements 179 Financial Report 2011 Consolidated Statement of Changes in Equity
Unrealized net gains (losses) on financial assets available for sale, net of applicable tax and other
3
Unrealized net gains (losses) on derivatives hedging variability of cash flows, net of tax
3
Unrealized net gains (losses) on assets classified as held for sale, net of tax
Foreign currency translation, net of tax
3
Unrealized net gains (losses) from equity method investments
Accumulated other comprehensiveincome, net of tax
2
Total shareholders' equity
Noncontrolling interests Total equity
(855) (346) − (3,628) (22) (4,851) 30,703 1,211 31,914 669 212 − 107 83 1,071 6,044 (1) 6,043 − − − − − − 958 − 958 − − − − − − (309) − (309) − − − − − − (679) − (679) − − − − − − (688) − (688) − − − − − − 1,313 − 1,313 − − − − − − 35 − 35 − − − − − − (5) − (5) − − − − − − 8 − 8 − − − − − − (149) − (149) − − − − − − (19,238) − (19,238) − − − − − − 18,816 − 18,816 − − − − − − (177) − (177) − − − − − − 15 112 127 (186) (134) − (3,521) 61 (3,780) 36,647 1,322 37,969 73 (45) (11) 1,188 (26) 1,179 3,465 (8) 3,457 − − − − − − 10,204 − 10,204 − − − − − − (465) − (465) − − − − − − 94 12 106 − − − − − − (296) − (296) − − − − − − 1,439 − 1,439 − − − − − − (11) − (11) − − − − − − (93) − (93) − − − − − − 93 − 93 − − − − − − (115) − (115) − − − − − − (15,366) − (15,366) − − − − − − 13,525 − 13,525 − − − − − − − − − − − − − − − (302) 223 (79) (113) (179) (11) (2,333) 35 (2,601) 48,819 1,549 50,368 (504) (47) 11 1,167 (7) 620 4,752 162 4,914 − − − − − − − − − − − − − − − (691) − (691) − − − − − − 666 (7) 659 − − − − − − 153 − 153 − − − − − − 1,108 − 1,108 − − − − − − (76) − (76) − − − − − − − − − − − − − − − − − − − − − − − − (131) − (131) − − − − − − (13,781) − (13,781) − − − − − − 12,300 − 12,300 − − − − − − (32) − (32) − − − − − − 303 (434) (131) (617) (226) − (1,166) 28 (1,981) 53,390 1,270 54,660
3 Excluding unrealized net gains (losses) from equity method investments.
The accompanying notes are an integral part of the Consolidated Financial Statements.

Deutsche Bank 02 – Consolidated Financial Statements 180 Financial Report 2011 Consolidated Statement of Cash Flows
in € m. 2011 2010 2009 Net income 4,326 2,330 4,958 Cash flows from operating activities: Adjustments to reconcile net income to net cash provided by (used in) operating activities:
Provision for credit losses 1,839 1,274 2,630 Restructuring activities − − − Gain on sale of financial assets available for sale, equity method investments, and other (841) (363) (656) Deferred income taxes, net (387) 315 (296) Impairment, depreciation and other amortization, and accretion 3,697 4,255 1,782 Share of net income from equity method investments (222) (457) (189)
Income adjusted for noncash charges, credits and other items 8,412 7,354 8,229 Adjustments for net change in operating assets and liabilities:
Interest-earning time deposits with banks (53,427) (34,806) 4,583 Central bank funds sold, securities purchased under resale agreements, securities borrowed (8,202) 26,368 (4,203) Financial assets designated at fair value through profit or loss (11,582) (24,502) 24,890 Loans (7,092) (2,823) 17,213 Other assets (17,962) (5,894) 21,960 Deposits 66,168 22,656 (57,330) Financial liabilities designated at fair value through profit or loss and investment contract liabilities (8,389) 53,450 (7,061) Central bank funds purchased, securities sold under repurchase agreements, securities loaned 12,622 (40,709) (40,644) Other short-term borrowings 1,689 18,509 2,592 Other liabilities 21,476 2,851 (15,645) Senior long-term debt (5,991) (3,457) (7,150) Trading assets and liabilities, positive and negative market values from derivative financial instruments, net
1 10,558 (17,664) 40,023 Other, net (478) (5,009) (1,243)
Net cash provided by (used in) operating activities 7,802 (3,676) (13,786) Cash flows from investing activities: Proceeds from:
Sale of financial assets available for sale 21,948 10,652 9,023 Maturities of financial assets available for sale 10,635 4,181 8,938 Sale of equity method investments 336 250 574 Sale of property and equipment 101 108 39
Purchase of: Financial assets available for sale (19,606) (14,087) (12,082) Equity method investments (602) (145) (3,730) Property and equipment (794) (873) (592)
Net cash received in (paid for) business combinations/divestitures 348 8,580 (20) Other, net (451) (1,189) (1,749) Net cash provided by (used in) investing activities 11,915 7,477 401 Cash flows from financing activities: Issuances of subordinated long-term debt 76 1,341 457 Repayments and extinguishments of subordinated long-term debt (715) (229) (1,448) Issuances of trust preferred securities 37 90 1,303 Repayments and extinguishments of trust preferred securities (45) (51) − Capital increase − 10,060 − Purchases of treasury shares (13,781) (15,366) (19,238) Sale of treasury shares 12,229 13,519 18,111 Dividends paid to noncontrolling interests (4) (7) (5) Net change in noncontrolling interests (266) 200 109 Cash dividends paid (691) (465) (309) Net cash provided by (used in) financing activities (3,160) 9,092 (1,020) Net effect of exchange rate changes on cash and cash equivalents (964) 1,911 690 Net increase (decrease) in cash and cash equivalents 15,593 14,804 (13,715) Cash and cash equivalents at beginning of period 66,353 51,549 65,264 Cash and cash equivalents at end of period 81,946 66,353 51,549 Net cash provided by (used in) operating activities include
Income taxes paid (received), net 1,327 784 (520) Interest paid 17,743 13,740 15,878 Interest and dividends received 35,216 29,456 28,211
Cash and cash equivalents comprise Cash and due from banks 15,928 17,157 9,346 Interest-earning demand deposits with banks (not included: time deposits of € 95,982 m. as of December 31, 2011, and € 43,181 m. and € 5,030 m. as of December 31, 2010 and 2009) 66,018 49,196 42,203
Total 81,946 66,353 51,549
1 The initial acquisition accounting for ABN AMRO, which was finalized at March 31, 2011, resulted in a retrospective adjustment of retained earnings of € (24) million for December 31, 2010.
The accompanying notes are an integral part of the Consolidated Financial Statements.
Consolidated Statement of Cash Flows

Deutsche Bank 02 – Consolidated Financial Statements 181 Financial Report 2011 Notes to the Consolidated Financial Statements
Notes to the Consolidated Financial Statements 01 – Significant Accounting Policies – 182 02 – Critical Accounting Estimates – 214 03 – Recently Adopted and New Accounting Pronouncements – 222 04 – Acquisitions and Dispositions – 226 05 – Business Segments and Related Information – 243 Notes to the Consolidated Income Statement 06 – Net Interest Income and Net Gains (Losses) on Financial Assets/Liabilities at Fair Value through Profit or Loss – 254 07 – Commissions and Fee Income – 256 08 – Net Gains (Losses) on Financial Assets Available for Sale – 257 09 – Other Income – 258 10 – General and Administrative Expenses – 258 11 – Earnings per Common Share – 259 Notes to the Consolidated Balance Sheet 12 – Financial Assets/Liabilities at Fair Value through Profit or Loss – 261 13 – Amendments to IAS 39 and IFRS 7, “Reclassification of Financial Assets” – 263 14 – Financial Instruments carried at Fair Value – 265 15 – Fair Value of Financial Instruments not carried at Fair Value – 280 16 – Financial Assets Available for Sale – 283 17 – Equity Method Investments – 284 18 – Loans – 286 19 – Allowance for Credit Losses – 287 20 – Derecognition of Financial Assets – 288 21 – Assets Pledged and Received as Collateral – 289 22 – Property and Equipment – 290 23 – Leases – 291 24 – Goodwill and Other Intangible Assets – 293 25 – Non-Current Assets and Disposal Groups Held for Sale – 304 26 – Other Assets and Other Liabilities – 307 27 – Deposits – 308 28 – Provisions – 308 29 – Credit related Commitments and Contingent Liabilities – 315 30 – Other Short-Term Borrowings – 316 31 – Long-Term Debt and Trust Preferred Securities – 317 Additional Notes 32 – Common Shares – 318 33 – Share-Based Compensation Plans – 319 34 – Employee Benefits – 323 35 – Income Taxes – 330 36 – Derivatives – 334 37 – Regulatory Capital – 336 38 – Related Party Transactions – 343 39 – Information on Subsidiaries – 347 40 – Insurance and Investment Contracts – 348 41 – Current and Non-Current Assets and Liabilities – 352 42 – Events after the Reporting Date – 354 43 – Supplementary Information to the Consolidated Financial Statements according to Section 315a HGB – 354 44 – Shareholdings – 356
Notes to the Consolidated Financial Statements
Deutsche Bank 02 – Consolidated Financial Statements 182 Financial Report 2011 Notes to the Consolidated Financial Statements 01 – Significant Accounting Policies
01 – Significant Accounting Policies
Basis of Accounting Deutsche Bank Aktiengesellschaft (“Deutsche Bank” or the “Parent”) is a stock corporation organized under the laws of the Federal Republic of Germany. Deutsche Bank together with all entities in which Deutsche Bank has a controlling financial interest (the “Group”) is a global provider of a full range of corporate and investment banking, private clients and asset management products and services. For a discussion of the Group’s busi-ness segment information, see Note 05 “Business Segments and Related Information”.
The accompanying consolidated financial statements are stated in euros, the presentation currency of the Group. All financial information presented in million euros has been rounded to the nearest million. The con-solidated financial statements have been prepared in accordance with International Financial Reporting Stan-dards (“IFRS”) as issued by the International Accounting Standards Board (“IASB”) and endorsed by the European Union (“EU”). The Group’s application of IFRS results in no differences between IFRS as issued by the IASB and IFRS as endorsed by the EU.
Risk disclosures under IFRS 7, “Financial Instruments: Disclosures” about the nature and extent of risks arising from financial instruments are incorporated herein by reference to the portions marked by a bracket in the margins of the Risk Report.
The preparation of financial statements under IFRS requires management to make estimates and assumptions for certain categories of assets and liabilities. Areas where this is required include the fair value of certain finan-cial assets and liabilities, the reclassification of financial assets, the impairment of loans and provision for off-balance-sheet positions, the impairment of other financial assets and non-financial assets, the recognition and measurement of deferred tax assets, and the accounting for legal and regulatory contingencies and uncertain tax positions. These estimates and assumptions affect the reported amounts of assets and liabilities and dis-closure of contingent assets and liabilities at the balance sheet date, and the reported amounts of revenue and expenses during the reporting period. Actual results could differ from management’s estimates. Refer to Note 02 “Critical Accounting Estimates” for a description of the critical accounting estimates and judgments used in the preparation of the financial statements.
Valuation Approach for Collateralized Derivative Contracts In the second quarter 2011, the Group’s valuation approach for substantially all of its collateralized derivative contracts moved to using the overnight indexed swap (OIS) curve in order to more consistently manage the interest rate and funding risks associated with collateralized derivatives in line with their pricing. This change in approach to OIS did not have a material impact on the Group’s consolidated financial statements in 2011.
Assignment of Revenue Components in CIB The presentation of prior period CIB revenues was adjusted during the first half of 2010 following a review of the assignment of specific revenue components to the product categories. The review resulted in a transfer of negative revenues of € 325 million from Loan Products to Sales & Trading (debt and other products) in 2009. In addition, Sales & Trading (equity) revenues were reduced by € 83 million in 2009, with corresponding offsetting effects in Sales & Trading (debt and other products). These adjustments had no impact on CIB’s total revenues.

Deutsche Bank 02 – Consolidated Financial Statements 183 Financial Report 2011 Notes to the Consolidated Financial Statements 01 – Significant Accounting Policies
Assignment of Revenue Components in PCAM The presentation of PCAM product revenues was modified in the first quarter 2011 following a review of the assignment of specific revenue components to the product components. In order to facilitate comparability, revenues of € 73 million and € 70 million were transferred from credit products to deposits and payment ser-vices in 2010 and 2009, respectively. This adjustment had no impact on PCAM’s total revenues.
Insurance In the second quarter 2010, the Group changed the presentation of the fees and net settlements associated with longevity insurance and reinsurance contracts. It was determined that the net presentation of cash flows under individual longevity insurance and reinsurance contracts reflected the actual settlement of those cash flows and therefore better reflected the nature of such contracts. This change in presentation resulted in a transfer of € 102 million of expenses from Other income to Policyholder benefits and claims in 2011, and an amount of € 117 million in 2010.
Software Amortization Periods Since the second quarter 2010, the Group has applied amortization periods of five or ten years for capitalized costs relating to certain purchased or internally developed software for which prior amortization period was three years. The change did not have a material impact on the Group’s consolidated financial statements in the periods presented and also will not have a material impact on future periods.
Allowance for Loan Losses The Group applies estimates in determining the allowance for loan losses in its homogeneous loan portfolio which use statistical models based on historical experience. On a regular basis the Group performs procedures to align input parameters and model assumptions with historically evidenced loss levels. Alignment of input parameters and model assumptions in 2010 and 2009 led to a lower level of provisions for credit losses of € 28 million and € 145.8 million in 2010 and 2009, respectively. No such alignments were made in 2011.
Change in the Functional Currency of a Significant Operation On January 1, 2010, the functional currency of Deutsche Bank Aktiengesellschaft, London Branch (“London Branch”) and certain other London-based subsidiaries was changed from pound sterling to euro.
These entities’ functional currency had previously been determined to be pound sterling on the basis that the currency of their primary economic environment was based on pound sterling. However during 2009 it was determined that the London Branch’s operating environment, mix of business and balance sheet composition had gradually changed over time. To better reflect this change, London Branch management undertook to manage their operations in euro from January 1, 2010. To implement this decision, procedures were put in place for London Branch to hedge all non-euro exposures, sell profits into euro and report internally in euro.

Deutsche Bank 02 – Consolidated Financial Statements 184 Financial Report 2011 Notes to the Consolidated Financial Statements 01 – Significant Accounting Policies
The effect of the change in functional currency to euro was applied prospectively in these consolidated finan-cial statements. The Group translated all items into the new functional currency using the exchange rate as at January 1, 2010. Exchange differences arising from the translation of the foreign operation previously recorded in other comprehensive income were not reclassified to profit or loss and remain in other comprehensive in-come until the entities are disposed of or sold.
Significant Accounting Policies The following is a description of the significant accounting policies of the Group. Other than as previously de-scribed, these policies have been consistently applied for 2009, 2010 and 2011.
Principles of Consolidation The financial information in the consolidated financial statements includes that for the parent company, Deutsche Bank AG, together with its subsidiaries, including certain special purpose entities (“SPEs”), pre-sented as a single economic unit.
Subsidiaries The Group’s subsidiaries are those entities which it controls. The Group controls entities when it has the power to govern the financial and operating policies of the entity, generally accompanying a shareholding, either di-rectly or indirectly, of more than one half of the voting rights. The existence and effect of potential voting rights that are currently exercisable or convertible are considered in assessing whether the Group controls an entity.
The Group sponsors the formation of SPEs and interacts with non-sponsored SPEs for a variety of reasons, including allowing clients to hold investments in separate legal entities, allowing clients to invest jointly in alternative assets, for asset securitization transactions, and for buying or selling credit protection. When assessing whether to consolidate an SPE, the Group evaluates a range of factors, including whether (1) the activities of the SPE are being conducted on behalf of the Group according to its specific business needs so that the Group obtains the benefits from the SPE’s operations, (2) the Group has decision-making powers to obtain the majority of the benefits, (3) the Group obtains the majority of the benefits of the activities of the SPE, or (4) the Group retains the majority of the residual ownership risks related to the assets in order to obtain the benefits from its activities.
The consolidation assessment considers the exposures that both Deutsche Bank and third parties have in relation to the SPE via derivatives, debt and equity instruments and other instruments. The Group consolidates an SPE if an assessment of the relevant factors indicates that it controls the SPE.
Subsidiaries are consolidated from the date on which control is transferred to the Group and are no longer consolidated from the date that control ceases.

Deutsche Bank 02 – Consolidated Financial Statements 185 Financial Report 2011 Notes to the Consolidated Financial Statements 01 – Significant Accounting Policies
The Group reassesses consolidation status at least at every quarterly reporting date. Therefore, any changes in structure are considered when they occur. This includes changes to any contractual arrangements the Group has, including those newly executed with the entity, and is not only limited to changes in ownership.
The Group reassesses its treatment of SPEs for consolidation when there is an overall change in the SPE’s arrangements or when there has been a substantive change in the relationship between the Group and an SPE. The circumstances that would indicate that a reassessment for consolidation is necessary include, but are not limited to, the following:
— substantive changes in ownership of the SPE, such as the purchase of more than an insignificant addi-tional interest or disposal of more than an insignificant interest in the SPE;
— changes in contractual or governance arrangements of the SPE; — additional activities undertaken in the structure, such as providing a liquidity facility beyond the terms es-
tablished originally or entering into a transaction with an SPE that was not contemplated originally; and — changes in the financing structure of the entity.
In addition, when the Group concludes that the SPE might require additional support to continue in business, and such support was not contemplated originally, and, if required, the Group would provide such support for reputational or other reasons, the Group reassesses the need to consolidate the SPE.
The reassessment of control over the existing SPEs does not automatically lead to consolidation or deconsoli-dation. In making such a reassessment, the Group may need to change its assumptions with respect to loss probabilities, the likelihood of additional liquidity facilities being drawn in the future and the likelihood of future actions being taken for reputational or other purposes. All currently available information, including current market parameters and expectations (such as loss expectations on assets), which would incorporate any market changes since inception of the SPE, is used in the reassessment of consolidation conclusions.
All intercompany transactions, balances and unrealized gains on transactions between Group companies are eliminated on consolidation. Consistent accounting policies are applied throughout the Group for the purposes of consolidation. Issuances of a subsidiary’s stock to third parties are treated as noncontrolling interests.
At the date that control of a subsidiary is lost, the Group a) derecognizes the assets (including attributable goodwill) and liabilities of the subsidiary at their carrying amounts, b) derecognizes the carrying amount of any noncontrolling interests in the former subsidiary (including any components in accumulated other comprehen-sive income attributable to the subsidiary), c) recognizes the fair value of the consideration received and any distribution of the shares of the subsidiary, d) recognizes any investment retained in the former subsidiary at its fair value and e) recognizes any resulting difference of the above items as a gain or loss in the income statement. Any amounts recognized in prior periods in other comprehensive income in relation to that sub-sidiary would be reclassified to the consolidated statement of income at the date that control is lost.

Deutsche Bank 02 – Consolidated Financial Statements 186 Financial Report 2011 Notes to the Consolidated Financial Statements 01 – Significant Accounting Policies
Assets held in an agency or fiduciary capacity are not assets of the Group and are not included in the Group’s consolidated balance sheet.
Business Combinations and Noncontrolling Interests The Group uses the acquisition method to account for business combinations. At the date the Group obtains control of the subsidiary, the cost of an acquisition is measured at the fair value of the consideration given, in-cluding any cash or non cash consideration (equity instruments) transferred, any contingent consideration, any previously held equity interest in the acquiree and liabilities incurred or assumed. The excess of the aggregate of the cost of an acquisition and any noncontrolling interest in the acquiree over the Group’s share of the fair value of the identifiable net assets acquired is recorded as goodwill. If the aggregate of the acquisition cost and any noncontrolling interest is below the fair value of the identifiable net assets (negative goodwill), a gain may be reported in other income. Acquisition-related costs are recognized as expenses in the period in which they are incurred.
The accounting at the acquisition date may be based on provisional amounts. Adjustments to the provisional amounts are made by the Group if new information about facts and circumstances that existed at the acquisi-tion date is obtained within one year (referred to as the measurement period) which, if known, would have affected the amounts initially recognized. Where a measurement period adjustment is identified, the Group adjusts the fair values of identifiable assets and liabilities and goodwill in the measurement period as if the accounting for the business combination had been completed at the acquisition date. Comparative information for prior periods presented in financial statements is accordingly revised if the acquisition date relates to prior reporting periods. The effects of measurement period adjustments may also cause changes in depreciation and amortization recognized in prior periods.
In business combinations achieved in stages (“step acquisitions”), a previously held equity interest in the acquiree is remeasured to its acquisition-date fair value and the resulting gain or loss, if any, is recognized in profit or loss. Amounts recognized in prior periods in other comprehensive income associated with the previously held investment would be reclassified to the consolidated statement of income at the date that control is obtained, as if the Group had disposed of the previously held equity interest.
Noncontrolling interests are shown in the consolidated balance sheet as a separate component of equity, which is distinct from the Group’s shareholders’ equity. The net income attributable to noncontrolling interests is separately disclosed on the face of the consolidated statement of income. Changes in the ownership interest in subsidiaries which do not result in a change of control are treated as transactions between equity holders and are reported in additional paid-in capital (APIC).

Deutsche Bank 02 – Consolidated Financial Statements 187 Financial Report 2011 Notes to the Consolidated Financial Statements 01 – Significant Accounting Policies
Associates and Jointly Controlled Entities An associate is an entity in which the Group has significant influence, but not a controlling interest, over the operating and financial management policy decisions of the entity. Significant influence is generally presumed when the Group holds between 20 % and 50 % of the voting rights. The existence and effect of potential voting rights that are currently exercisable or convertible are considered in assessing whether the Group has significant influence. Among the other factors that are considered in determining whether the Group has significant influence are representation on the board of directors (supervisory board in the case of German stock corporations) and material intercompany transactions. The existence of these factors could require the application of the equity method of accounting for a particular investment even though the Group’s investment is less than 20 % of the voting stock.
A jointly controlled entity exists when the Group has a contractual arrangement with one or more parties to undertake activities through entities which are subject to joint control.
Investments in associates and jointly controlled entities are accounted for under the equity method of accounting. The Group’s share of the results of associates and jointly controlled entities is adjusted to conform to the accounting policies of the Group and are reported in the consolidated statement of income as net income (loss) from equity method investments. The Group’s share in the associate’s profits and losses resulting from inter-company sales is eliminated on consolidation.
If the Group previously held an equity interest in an entity (for example, as available for sale) and subsequently gained significant influence, the previously held equity interest held is remeasured to fair value and any gain or loss is recognized in the consolidated statement of income. Any amounts previously recognized in other com-prehensive income associated with the equity interest would be reclassified to the consolidated statement of income at the date the Group gains significant influence, as if the Group had disposed of the previously held equity interest.
Under the equity method of accounting, the Group’s investments in associates and jointly controlled entities are initially recorded at cost including any directly related transaction costs incurred in acquiring the associate, and subsequently increased (or decreased) to reflect both the Group’s pro-rata share of the post-acquisition net income (or loss) of the associate or jointly controlled entity and other movements included directly in the equity of the associate or jointly controlled entity. Goodwill arising on the acquisition of an associate or a jointly con-trolled entity is included in the carrying value of the investment (net of any accumulated impairment loss). As goodwill is not reported separately it is not specifically tested for impairment. Rather, the entire equity method investment is tested for impairment.
At each balance sheet date, the Group assesses whether there is any objective evidence that the investment in an associate or jointly controlled entity is impaired. If there is objective evidence of an impairment, an impair-ment test is performed by comparing the investment’s recoverable amount, which is the higher of its value in use and fair value less costs to sell, with its carrying amount. An impairment loss recognized in prior periods is only reversed if there has been a change in the estimates used to determine the investment’s recoverable amount since the last impairment loss was recognized. If this is the case the carrying amount of the investment is increased to its higher recoverable amount. That increase is a reversal of an impairment loss.
Deutsche Bank 02 – Consolidated Financial Statements 188 Financial Report 2011 Notes to the Consolidated Financial Statements 01 – Significant Accounting Policies
Equity method losses in excess of the Group’s carrying value of the investment in the entity are charged against other assets held by the Group related to the investee. If those assets are written down to zero, a determination is made whether to report additional losses based on the Group’s obligation to fund such losses.
At the date that the Group ceases to have significant influence over the associate or jointly controlled entity the Group recognizes a gain or loss on the disposal of the equity method investment equal to the difference between the sum of the fair value of any retained investment and the proceeds from disposing of the associate and the then carrying amount of the investment. Amounts recognized in prior periods in other comprehensive income in relation to the associate or jointly controlled entity would be reclassified to the consolidated state-ment of income.
Any retained investment is accounted for as a financial instrument as described in the section entitled “Finan-cial Assets and Liabilities” as follows.
Non-Current Assets Held for Sale and Discontinued Operations Individual non-current non-financial assets (and disposal groups) are classified as held for sale if they are available for immediate sale in their present condition subject only to the customary sales terms of such as-sets (and disposal groups) and their sale is considered highly probable. For a sale to be highly probable, management must be committed to a sales plan and actively looking for a buyer. Furthermore, the assets (and disposal groups) must be actively marketed at a reasonable sales price in relation to their current fair value and the sale should be expected to be completed within one year. Non-current non-financial assets (and disposal groups) which meet the criteria for held for sale classification are measured at the lower of their carrying amount and fair value less costs to sell and are presented within “Other assets” and “Other liabilities” in the balance sheet. The comparatives are not re-presented when non-current assets (and disposal groups) are classified as held for sale. If the disposal group contains financial instruments, no adjustment to their carrying amounts is permitted.
Discontinued operations are presented separately in the income statement if an entity or a component of an entity has been disposed of or is classified as held for sale and (a) represents a separate major line of busi-ness or geographical area of operations, (b) is part of a single coordinated plan to dispose of a separate ma-jor line of business or geographical area of operations, or (c) is a subsidiary acquired exclusively with a view to resale. Net income (loss) from discontinued operations includes the net total of net income (loss) before tax from discontinued operations and discontinued operations tax expense. Similarly the net cash flows attributa-ble to the operating, investing and financing activities of discontinued operations have to be presented sepa-rately. The comparative income statement and cash flow information is re-presented for discontinued operations.
Deutsche Bank 02 – Consolidated Financial Statements 189 Financial Report 2011 Notes to the Consolidated Financial Statements 01 – Significant Accounting Policies
Foreign Currency Translation The consolidated financial statements are prepared in euros, which is the presentation currency of the Group. Various entities in the Group use a different functional currency, being the currency of the primary economic environment in which the entity operates.
An entity records foreign currency revenues, expenses, gains and losses in its functional currency using the exchange rates prevailing at the dates of recognition.
Monetary assets and liabilities denominated in currencies other than the entity’s functional currency are trans-lated at the period end closing rate. Foreign exchange gains and losses resulting from the translation and settlement of these items are recognized in the consolidated statement of income as net gains (losses) on financial assets/liabilities at fair value through profit or loss in order to align the translation amounts with those recognized from foreign currency related transactions (derivatives) which hedge these monetary assets and liabilities.
Nonmonetary items that are measured at historical cost are translated using the historical exchange rate at the date of the transaction. Translation differences on nonmonetary items which are held at fair value through profit or loss are recognized in profit or loss. Translation differences on available for sale nonmonetary items (equity securities) are included in other comprehensive income. Once the available for sale nonmonetary item is sold, the related cumulative translation difference is transferred to the consolidated statement of income as part of the overall gain or loss on sale of the item.
For purposes of translation into the presentation currency, assets, liabilities and equity of foreign operations are translated at the period end closing rate, and items of income and expense are translated into euro at the rates prevailing on the dates of the transactions, or average rates of exchange where these approximate actual rates. The exchange differences arising on the translation of a foreign operation are included in other comprehensive income. For foreign operations that are subsidiaries the amount of exchange differences attributable to any noncontrolling interest is recognized in noncontrolling interests.
Upon disposal of a foreign subsidiary and associate (which results in loss of control or significant influence over that operation) the total cumulative exchange differences recognized in other comprehensive income are re-classified to profit or loss.
Upon partial disposal of a foreign operation that is a subsidiary and which does not result in loss of control, the proportionate share of cumulative exchange differences is reclassified from other comprehensive income to noncontrolling interests as this is deemed a transaction with equity holders. For a partial disposal of an associ-ate which does not result in a loss of significant influence, the proportionate share of cumulative exchange differences is reclassified from other comprehensive income to profit or loss.

Deutsche Bank 02 – Consolidated Financial Statements 190 Financial Report 2011 Notes to the Consolidated Financial Statements 01 – Significant Accounting Policies
Interest, Fees and Commissions Revenue is recognized when the amount of revenue and associated costs can be reliably measured, it is probable that economic benefits associated with the transaction will be realized, and the stage of completion of the transaction can be reliably measured. This concept is applied to the key revenue generating activities of the Group as follows.
Net Interest Income – Interest from all interest-bearing assets and liabilities is recognized as net interest in-come using the effective interest method. The effective interest rate is a method of calculating the amortized cost of a financial asset or a financial liability and of allocating the interest income or expense over the relevant period using the estimated future cash flows. The estimated future cash flows used in this calculation include those determined by the contractual terms of the asset or liability, all fees that are considered to be integral to the effective interest rate, direct and incremental transaction costs, and all other premiums or discounts.
Once an impairment loss has been recognized on a loan or available for sale debt security financial asset, although the accrual of interest in accordance with the contractual terms of the instrument is discontinued, interest income is recognized based on the rate of interest that was used to discount future cash flows for the purpose of measuring the impairment loss. For a loan this would be the original effective interest rate, but a new effective interest rate would be established each time an available for sale debt security is impaired as impairment is measured to fair value and would be based on a current market rate.
When financial assets are reclassified from trading or available for sale to loans a new effective interest rate is established based on the fair value at the date of the reclassification and on a best estimate of future expected cash flows.
Commission and Fee Income – The recognition of fee revenue (including commissions) is determined by the purpose of the fees and the basis of accounting for any associated financial instruments. If there is an asso-ciated financial instrument, fees that are an integral part of the effective interest rate of that financial instrument are included within the effective yield calculation. However, if the financial instrument is carried at fair value through profit or loss, any associated fees are recognized in profit or loss when the instrument is initially recog-nized, provided there are no significant unobservable inputs used in determining its fair value. Fees earned from services that are provided over a specified service period are recognized over that service period. Fees earned for the completion of a specific service or significant event are recognized when the service has been completed or the event has occurred.
Loan commitment fees related to commitments that are not accounted for at fair value through profit or loss are recognized in commissions and fee income over the life of the commitment if it is unlikely that the Group will enter into a specific lending arrangement. If it is probable that the Group will enter into a specific lending ar-rangement, the loan commitment fee is deferred until the origination of a loan and recognized as an adjustment to the loan’s effective interest rate.
Performance-linked fees or fee components are recognized when the performance criteria are fulfilled.

Deutsche Bank 02 – Consolidated Financial Statements 191 Financial Report 2011 Notes to the Consolidated Financial Statements 01 – Significant Accounting Policies
The following fee income is predominantly earned from services that are provided over a period of time: invest-ment fund management fees, fiduciary fees, custodian fees, portfolio and other management and advisory fees, credit-related fees and commission income. Fees predominantly earned from providing transaction-type ser-vices include underwriting fees, corporate finance fees and brokerage fees.
Expenses that are directly related and incremental to the generation of fee income are presented net in Com-missions and Fee Income.
Arrangements involving multiple services or products – If the Group contracts to provide multiple products, services or rights to a counterparty, an evaluation is made as to whether an overall fee should be allocated to the different components of the arrangement for revenue recognition purposes. Structured trades executed by the Group are the principal example of such arrangements and are assessed on a transaction by transaction basis. The assessment considers the value of items or services delivered to ensure that the Group’s continuing involvement in other aspects of the arrangement are not essential to the items delivered. It also assesses the value of items not yet delivered and, if there is a right of return on delivered items, the probability of future delivery of remaining items or services. If it is determined that it is appropriate to look at the arrangements as separate components, the amounts received are allocated based on the relative value of each component.
If there is no objective and reliable evidence of the value of the delivered item or an individual item is required to be recognized at fair value then the residual method is used. The residual method calculates the amount to be recognized for the delivered component as being the amount remaining after allocating an appropriate amount of revenue to all other components.
Financial Assets and Liabilities The Group classifies its financial assets and liabilities into the following categories: financial assets and liabili-ties at fair value through profit or loss, loans, financial assets available for sale (“AFS”) and other financial liabilities. The Group does not classify any financial instruments under the held-to-maturity category. Appro-priate classification of financial assets and liabilities is determined at the time of initial recognition or when reclassified in the consolidated balance sheet.
Financial instruments classified at fair value through profit or loss and financial assets classified as AFS are recognized on trade date, which is the date on which the Group commits to purchase or sell the asset or issue or repurchase the financial liability. All other financial instruments are recognized on a settlement date basis.
Financial Assets and Liabilities at Fair Value through Profit or Loss The Group classifies certain financial assets and financial liabilities as either held for trading or designated at fair value through profit or loss. They are carried at fair value and presented as financial assets at fair value through profit or loss and financial liabilities at fair value through profit or loss, respectively. Related realized and unrealized gains and losses are included in net gains (losses) on financial assets/liabilities at fair value through profit or loss. Interest on interest earning assets such as trading loans and debt securities and divi-dends on equity instruments are presented in interest and similar income for financial instruments at fair value through profit or loss.

Deutsche Bank 02 – Consolidated Financial Statements 192 Financial Report 2011 Notes to the Consolidated Financial Statements 01 – Significant Accounting Policies
Trading Assets and Liabilities – Financial instruments are classified as held for trading if they have been origi-nated, acquired or incurred principally for the purpose of selling or repurchasing them in the near term, or they form part of a portfolio of identified financial instruments that are managed together and for which there is evi-dence of a recent actual pattern of short-term profit-taking. Also included in this category are physical com-modities held by the Group’s commodity trading business, at fair value less costs to sell.
Financial Instruments Designated at Fair Value through Profit or Loss – Certain financial assets and liabilities that do not meet the definition of trading assets and liabilities are designated at fair value through profit or loss using the fair value option. To be designated at fair value through profit or loss, financial assets and liabilities must meet one of the following criteria: (1) the designation eliminates or significantly reduces a measurement or recognition inconsistency; (2) a group of financial assets or liabilities or both is managed and its performance is evaluated on a fair value basis in accordance with a documented risk management or investment strategy; or (3) the instrument contains one or more embedded derivatives unless: (a) the embedded derivative does not significantly modify the cash flows that otherwise would be required by the contract; or (b) it is clear with little or no analysis that separation is prohibited. In addition, the Group allows the fair value option to be designated only for those financial instruments for which a reliable estimate of fair value can be obtained.
Loan Commitments Certain loan commitments are designated at fair value through profit or loss under the fair value option. As indicated under the discussion of “Derivatives and Hedge Accounting”, some loan commitments are classified as financial liabilities at fair value through profit or loss. All other loan commitments remain off-balance sheet. Therefore, the Group does not recognize and measure changes in fair value of these off-balance sheet loan commitments that result from changes in market interest rates or credit spreads. However, as specified in the discussion “Impairment of loans and provision for off-balance sheet positions”, these off-balance sheet loan commitments are assessed for impairment individually and, where appropriate, collectively.
Loans Loans include originated and purchased non-derivative financial assets with fixed or determinable payments that are not quoted in an active market and which are not classified as financial assets at fair value through profit or loss or financial assets AFS. An active market exists when quoted prices are readily and regularly available from an exchange, dealer, broker, industry group, pricing service or regulatory agency and those prices represent actual and regularly occurring market transactions on an arm’s length basis.
Deutsche Bank 02 – Consolidated Financial Statements 193 Financial Report 2011 Notes to the Consolidated Financial Statements 01 – Significant Accounting Policies
Loans not acquired in a business combination or in an asset purchase are initially recognized at their trans-action price, which is the cash amount advanced to the borrower. In addition, the net of direct and incre-mental transaction costs and fees are included in the initial carrying amount of loans. These loans are subsequently measured at amortized cost using the effective interest method less impairment.
Loans which have been acquired as either part of a business combination or as an asset purchase are initially recognized at fair value at the acquisition date. The fair value at the acquisition date incorporates expected cash flows which consider the credit quality of these loans including any incurred losses. Interest income is recognized using the effective interest method. Subsequent to the acquisition date the Group assesses whether there is objective evidence of impairment in line with the policies described in the section entitled “Impairment of Loans and Provisions for Off Balance Sheet Positions”. If the loans are determined to be impaired then a loan loss allowance is recognized with a corresponding charge to the provision for credit losses line in the consolidated statement of income. Any subsequent improvements in the credit quality of these loans is recognized immediately through an adjustment to the current carrying value and a correspond-ing gain is recognized in interest income.
Financial Assets Classified as Available for Sale Financial assets that are not classified as at fair value through profit or loss or as loans are classified as AFS. A financial asset classified as AFS is initially recognized at its fair value plus transaction costs that are directly attributable to the acquisition of the financial asset. The amortization of premiums and accretion of discount are recorded in net interest income. Financial assets classified as AFS are carried at fair value with the changes in fair value reported in other comprehensive income, unless the asset is subject to a fair value hedge, in which case changes in fair value resulting from the risk being hedged are recorded in other income. For monetary financial assets classified as AFS (debt instruments), changes in carrying amounts relating to changes in for-eign exchange rate are recognized in the consolidated statement of income and other changes in carrying amount are recognized in other comprehensive income as indicated above. For financial assets classified as AFS that are nonmonetary items (equity instruments), the gain or loss that is recognized in other comprehen-sive income includes any related foreign exchange component.
Financial assets classified as AFS are assessed for impairment as discussed in the section entitled “Impairment of financial assets classified as Available for Sale”. Realized gains and losses are reported in net gains (losses) on financial assets available for sale. Generally, the weighted-average cost method is used to determine the cost of financial assets. Unrealized gains and losses recorded in other comprehensive income are transferred to the consolidated statement of income on disposal of an available for sale asset and reported in net gains (losses) on financial assets available for sale.

Deutsche Bank 02 – Consolidated Financial Statements 194 Financial Report 2011 Notes to the Consolidated Financial Statements 01 – Significant Accounting Policies
Financial Liabilities Except for financial liabilities at fair value through profit or loss, financial liabilities are measured at amortized cost using the effective interest method.
Financial liabilities include long-term and short-term debt issued which are initially measured at fair value, which is the consideration received, net of transaction costs incurred. Repurchases of issued debt in the market are treated as extinguishments and any related gain or loss is recorded in the consolidated statement of income. A subsequent sale of own bonds in the market is treated as a reissuance of debt.
Reclassification of Financial Assets The Group may reclassify certain financial assets out of the financial assets at fair value through profit or loss classification (trading assets) and the AFS classification into the loans classification. For assets to be reclassi- fied there must be a clear change in management intent with respect to the assets since initial recognition and the financial asset must meet the definition of a loan at the reclassification date. Additionally, there must be an intent and ability to hold the asset for the foreseeable future at the reclassification date. There is no single specific period that defines foreseeable future. Rather, it is a matter requiring management judgment. In exercising this judgment, the Group established the following minimum requirements for what constitutes foreseeable future. At the time of reclassification,
— there must be no intent to dispose of the asset through sale or securitization within one year and no inter-nal or external requirement that would restrict the Group’s ability to hold or require sale; and
— the business plan going forward should not be to profit from short-term movements in price.
Financial assets proposed for reclassification which meet these criteria are considered based on the facts and circumstances of each financial asset under consideration. A positive management assertion is required after taking into account the ability and plausibility to execute the strategy to hold.
In addition to the above criteria the Group also requires that persuasive evidence exists to assert that the expected repayment of the asset exceeds the estimated fair value and the returns on the asset will be opti-mized by holding it for the foreseeable future.
Financial assets are reclassified at their fair value at the reclassification date. Any gain or loss already recognized in the consolidated statement of income is not reversed. The fair value of the instrument at reclassification date becomes the new amortized cost of the instrument. The expected cash flows on the financial instruments are estimated at the reclassification date and these estimates are used to calculate a new effective interest rate for the instruments. If there is a subsequent increase in expected future cash flows on reclassified assets as a result of increased recoverability, the effect of that increase is recognized as an adjustment to the effective interest rate from the date of the change in estimate rather than as an adjustment to the carrying amount of the asset at the date of the change in estimate. If there is a subsequent decrease in expected future cash flows the asset would be assessed for impairment as discussed in the section entitled “Impairment of Loans and Provision for Off-Balance Sheet Positions”. Any change in the timing of the cash flows of reclassified assets which are not deemed impaired are recorded as an adjustment to the carrying amount of the asset.

Deutsche Bank 02 – Consolidated Financial Statements 195 Financial Report 2011 Notes to the Consolidated Financial Statements 01 – Significant Accounting Policies
For instruments reclassified from AFS to loans any unrealized gain or loss recognized in other comprehensive income is subsequently amortized into interest income using the effective interest rate of the instrument. If the instrument is subsequently impaired any unrealized loss which is held in accumulated other comprehensive income for that instrument at that date is immediately recognized in the consolidated statement of income as a loan loss provision.
To the extent that assets categorized as loans are repaid, restructured or eventually sold and the amount re-ceived is less than the carrying value at that time, then a loss would be recognized in the consolidated statement of income as a component of the provision for credit losses, if the loan is impaired, or otherwise in other income, if the loan is not impaired.
Determination of Fair Value Fair value is defined as the price at which an asset or liability could be exchanged in an arm’s length transac-tion between knowledgeable, willing parties, other than in a forced or liquidation sale. The fair value of instru-ments that are quoted in active markets is determined using the quoted prices where they represent those at which regularly and recently occurring transactions take place. The Group uses valuation techniques to estab-lish the fair value of instruments where prices quoted in active markets are not available. Therefore, where possible, parameter inputs to the valuation techniques are based on observable data derived from prices of relevant instruments traded in an active market. These valuation techniques involve some level of management estimation and judgment, the degree of which will depend on the price transparency for the instrument or mar-ket and the instrument’s complexity. Refer to Note 02 “Critical Accounting Estimates” section “Fair Value Esti-mates – Methods of Determining Fair Value” for further discussion of the accounting estimates and judgments required in the determination of fair value.
Recognition of Trade Date Profit If there are significant unobservable inputs used in the valuation technique, the financial instrument is recog-nized at the transaction price and any profit implied from the valuation technique at trade date is deferred. Using systematic methods, the deferred amount is recognized over the period between trade date and the date when the market is expected to become observable, or over the life of the trade (whichever is shorter). Such methodology is used because it reflects the changing economic and risk profile of the instrument as the market develops or as the instrument itself progresses to maturity. Any remaining trade date deferred profit is recog-nized in the consolidated statement of income when the transaction becomes observable or the Group enters into off-setting transactions that substantially eliminate the instrument’s risk. In the rare circumstances that a trade date loss arises, it would be recognized at inception of the transaction to the extent that it is probable that a loss has been incurred and a reliable estimate of the loss amount can be made. Refer to Note 02 “Critical Accounting Estimates” section “Fair Value Estimates – Methods of Determining Fair Value” for further discus-sion of the estimates and judgments required in assessing observability of inputs and risk mitigation.

Deutsche Bank 02 – Consolidated Financial Statements 196 Financial Report 2011 Notes to the Consolidated Financial Statements 01 – Significant Accounting Policies
Derivatives and Hedge Accounting Derivatives are used to manage exposures to interest rate, foreign currency, credit and other market price risks, including exposures arising from forecast transactions. All freestanding contracts that are considered derivatives for accounting purposes are carried at fair value on the consolidated balance sheet regardless of whether they are held for trading or nontrading purposes.
Gains and losses on derivatives held for trading are included in net gains (losses) on financial assets/liabilities at fair value through profit or loss.
The Group makes commitments to originate loans it intends to sell. Such positions are classified as financial assets/liabilities at fair value through profit or loss, and related gains and losses are included in net gains (losses) on financial assets/liabilities at fair value through profit or loss. Loan commitments that can be settled net in cash or by delivering or issuing another financial instrument are classified as derivatives. Market value guarantees provided on specific mutual fund products offered by the Group are also accounted for as de-rivatives and carried at fair value, with changes in fair value recorded in net gains (losses) on financial as-sets/liabilities at fair value through profit or loss.
Certain derivatives entered into for nontrading purposes, which do not qualify for hedge accounting but are otherwise effective in offsetting the effect of transactions on noninterest income and expenses, are recorded in other assets or other liabilities with both realized and unrealized changes in fair value recorded in the same noninterest income and expense captions as those affected by the transaction being offset. The changes in fair value of all other derivatives not qualifying for hedge accounting are recorded in net gains and losses on finan-cial assets/liabilities at fair value through profit or loss.
Embedded Derivatives Some hybrid contracts contain both a derivative and a non-derivative component. In such cases, the derivative component is termed an embedded derivative, with the non-derivative component representing the host contract. If the economic characteristics and risks of embedded derivatives are not closely related to those of the host contract, and the hybrid contract itself is not carried at fair value through profit or loss, the embedded derivative is bifurcated and reported at fair value, with gains and losses recognized in net gains (losses) on financial assets/liabilities at fair value through profit or loss. The host contract will continue to be accounted for in accordance with the appropriate accounting standard. The carrying amount of an embedded derivative is reported in the same consolidated balance sheet line item as the host contract. Certain hybrid instruments have been designated at fair value through profit or loss using the fair value option.

Deutsche Bank 02 – Consolidated Financial Statements 197 Financial Report 2011 Notes to the Consolidated Financial Statements 01 – Significant Accounting Policies
Hedge Accounting For accounting purposes there are three possible types of hedges: (1) hedges of changes in the fair value of assets, liabilities or unrecognized firm commitments (fair value hedges); (2) hedges of the variability of future cash flows from highly probable forecast transactions and floating rate assets and liabilities (cash flow hedges); and (3) hedges of the translation adjustments resulting from translating the functional currency financial statements of foreign operations into the presentation currency of the parent (hedges of net investments in foreign operations).
When hedge accounting is applied, the Group designates and documents the relationship between the hedging instrument and the hedged item as well as its risk management objective and strategy for undertaking the hedging transactions, and the nature of the risk being hedged. This documentation includes a description of how the Group will assess the hedging instrument’s effectiveness in offsetting the exposure to changes in the hedged item’s fair value or cash flows attributable to the hedged risk. Hedge effectiveness is assessed at in-ception and throughout the term of each hedging relationship. Hedge effectiveness is always assessed, even when the terms of the derivative and hedged item are matched.
Hedging derivatives are reported as other assets and other liabilities. In the event that a derivative is sub-sequently de-designated from a hedging relationship, it is transferred to financial assets/liabilities at fair value through profit or loss. Subsequent changes in fair value are recognized in net gains (losses) on financial as-sets/liabilities at fair value through profit or loss.
For hedges of changes in fair value, the changes in the fair value of the hedged asset, liability or unrecognized firm commitment, or a portion thereof, attributable to the risk being hedged are recognized in the consolidated statement of income along with changes in the entire fair value of the derivative. When hedging interest rate risk, any interest accrued or paid on both the derivative and the hedged item is reported in interest income or expense and the unrealized gains and losses from the hedge accounting fair value adjustments are reported in other income. When hedging the foreign exchange risk of an AFS security, the fair value adjustments related to the security’s foreign exchange exposures are also recorded in other income. Hedge ineffectiveness is reported in other income and is measured as the net effect of changes in the fair value of the hedging instrument and changes in the fair value of the hedged item arising from changes in the market rate or price related to the risk(s) being hedged.
If a fair value hedge of a debt instrument is discontinued prior to the instrument’s maturity because the derivative is terminated or the relationship is de-designated, any remaining interest rate-related fair value adjustments made to the carrying amount of the debt instrument (basis adjustments) are amortized to interest income or expense over the remaining term of the original hedging relationship. For other types of fair value adjustments and whenever a fair value hedged asset or liability is sold or otherwise derecognized any basis adjustments are included in the calculation of the gain or loss on derecognition.

Deutsche Bank 02 – Consolidated Financial Statements 198 Financial Report 2011 Notes to the Consolidated Financial Statements 01 – Significant Accounting Policies
For hedges of variability in future cash flows, there is no change to the accounting for the hedged item and the derivative is carried at fair value, with changes in value reported initially in other comprehensive income to the extent the hedge is effective. These amounts initially recorded in other comprehensive income are subsequently reclassified into the consolidated statement of income in the same periods during which the forecast transaction affects the consolidated statement of income. Thus, for hedges of interest rate risk, the amounts are amortized into interest income or expense at the same time as the interest is accrued on the hedged transaction.
Hedge ineffectiveness is recorded in other income and is measured as changes in the excess (if any) in the absolute cumulative change in fair value of the actual hedging derivative over the absolute cumulative change in the fair value of the hypothetically perfect hedge.
When hedges of variability in cash flows attributable to interest rate risk are discontinued, amounts remaining in accumulated other comprehensive income are amortized to interest income or expense over the remaining life of the original hedge relationship, unless the hedged transaction is no longer expected to occur in which case the amount will be reclassified into other income immediately. When hedges of variability in cash flows attributable to other risks are discontinued, the related amounts in accumulated other comprehensive income are reclassified into either the same consolidated statement of income caption and period as profit or loss from the forecast transaction, or into other income when the forecast transaction is no longer expected to occur.
For hedges of the translation adjustments resulting from translating the functional currency financial statements of foreign operations (hedges of net investments in foreign operations) into the functional currency of the par-ent, the portion of the change in fair value of the derivative due to changes in the spot foreign exchange rates is recorded as a foreign currency translation adjustment in other comprehensive income to the extent the hedge is effective; the remainder is recorded as other income in the consolidated statement of income.
Changes in fair value of the hedging instrument relating to the effective portion of the hedge are subsequently recognized in profit or loss on disposal of the foreign operations.
Impairment of Financial Assets At each balance sheet date, the Group assesses whether there is objective evidence that a financial asset or a group of financial assets is impaired. A financial asset or group of financial assets is impaired and impairment losses are incurred if:
— there is objective evidence of impairment as a result of a loss event that occurred after the initial recogni-tion of the asset and up to the balance sheet date (“a loss event”);
— the loss event had an impact on the estimated future cash flows of the financial asset or the group of fi-nancial assets and
— a reliable estimate of the loss amount can be made.

Deutsche Bank 02 – Consolidated Financial Statements 199 Financial Report 2011 Notes to the Consolidated Financial Statements 01 – Significant Accounting Policies
Impairment of Loans and Provision for Off-Balance Sheet Positions The Group first assesses whether objective evidence of impairment exists individually for loans that are indi-vidually significant. It then assesses collectively for loans that are not individually significant and loans which are significant but for which there is no objective evidence of impairment under the individual assessment.
To allow management to determine whether a loss event has occurred on an individual basis, all significant counterparty relationships are reviewed periodically. This evaluation considers current information and events related to the counterparty, such as the counterparty experiencing significant financial difficulty or a breach of contract, for example, default or delinquency in interest or principal payments.
If there is evidence of impairment leading to an impairment loss for an individual counterparty relationship, then the amount of the loss is determined as the difference between the carrying amount of the loan(s), including accrued interest, and the present value of expected future cash flows discounted at the loan’s original effective interest rate or the effective interest rate established upon reclassification to loans, including cash flows that may result from foreclosure less costs for obtaining and selling the collateral. The carrying amount of the loans is reduced by the use of an allowance account and the amount of the loss is recognized in the consolidated statement of income as a component of the provision for credit losses.
The collective assessment of impairment is principally to establish an allowance amount relating to loans that are either individually significant but for which there is no objective evidence of impairment, or are not indivi-dually significant but for which there is, on a portfolio basis, a loss amount that is probable of having occurred and is reasonably estimable. The loss amount has three components. The first component is an amount for transfer and currency convertibility risks for loan exposures in countries where there are serious doubts about the ability of counterparties to comply with the repayment terms due to the economic or political situation pre-vailing in the respective country of domicile. This amount is calculated using ratings for country risk and trans-fer risk which are established and regularly reviewed for each country in which the Group does business. The second component is an allowance amount representing the incurred losses on the portfolio of smaller-balance homogeneous loans, which are loans to individuals and small business customers of the private and retail business. The loans are grouped according to similar credit risk characteristics and the allow-ance for each group is determined using statistical models based on historical experience. The third com-ponent represents an estimate of incurred losses inherent in the group of loans that have not yet been individually identified or measured as part of the smaller-balance homogeneous loans. Loans that were found not to be impaired when evaluated on an individual basis are included in the scope of this component of the allowance.
Once a loan is identified as impaired, although the accrual of interest in accordance with the contractual terms of the loan is discontinued, the accretion of the net present value of the written down amount of the loan due to the passage of time is recognized as interest income based on the original effective interest rate of the loan.
At each balance sheet date, all impaired loans are reviewed for changes to the present value of expected future cash flows discounted at the loan’s original effective interest rate. Any change to the previously rec-ognized impairment loss is recognized as a change to the allowance account and recorded in the consoli-dated statement of income as a component of the provision for credit losses.
Deutsche Bank 02 – Consolidated Financial Statements 200 Financial Report 2011 Notes to the Consolidated Financial Statements 01 – Significant Accounting Policies
When it is considered that there is no realistic prospect of recovery and all collateral has been realized or transferred to the Group, the loan and any associated allowance is charged off (the loan and the related allowance are removed from the balance sheet). Individually significant loans where specific loan loss provi-sions are in place are evaluated at least quarterly on a case-by-case basis. For this category of loans, the number of days past due is an indicator for a charge-off but is not a determining factor. A charge-off will only take place after considering all relevant information, such as the occurrence of a significant change in the borrower’s financial position such that the borrower can no longer pay the obligation, or the proceeds from the collateral are insufficient to completely satisfy the current carrying amount of the loan.
For collectively assessed loans, which are primarily mortgages and consumer finance loans, the timing of a charge-off depends on whether there is any underlying collateral and the Group’s estimate of the amount collectible. For mortgage loans, the portion of the loan which is uncollateralized is charged off when the mortgage becomes 840 days past due, at the latest. For consumer finance loans, any portion of the balance which the Bank does not expect to collect is written off at 180 days past due for credit card receivables, and 270 days past due for other consumer finance loans.
Subsequent recoveries, if any, result in a reduction in the allowance account and are recorded in the consol-idated statement of income as a component of the provision for credit losses.
The process to determine the provision for off-balance sheet positions is similar to the methodology used for loans. Any loss amounts are recognized as an allowance in the consolidated balance sheet within provisions and charged to the consolidated statement of income as a component of the provision for credit losses.
If in a subsequent period the amount of a previously recognized impairment loss decreases and the decrease is due to an event occurring after the impairment was recognized, the impairment loss is reversed by reducing the allowance account accordingly. Such reversal is recognized in profit or loss.
Impairment of Financial Assets Classified as Available for Sale For financial assets classified as AFS, management assesses at each balance sheet date whether there is objective evidence that an individual asset is impaired.
In the case of equity investments classified as AFS, objective evidence includes a significant or prolonged decline in the fair value of the investment below cost. In the case of debt securities classified as AFS, impair-ment is assessed based on the same criteria as for loans.
If there is evidence of impairment, any amounts previously recognized in other comprehensive income are recognized in the consolidated statement of income for the period, reported in net gains (losses) on financial assets available for sale. This amount is determined as the difference between the acquisition cost (net of any principal repayments and amortization) and current fair value of the asset less any impairment loss on that investment previously recognized in the consolidated statement of income.

Deutsche Bank 02 – Consolidated Financial Statements 201 Financial Report 2011 Notes to the Consolidated Financial Statements 01 – Significant Accounting Policies
When an AFS debt security is impaired, any subsequent decreases in fair value are recognized in the con-solidated statement of income as it is considered further impairment. Any subsequent increases are also rec-ognized in the consolidated statement of income until the asset is no longer considered impaired. When the fair value of the AFS debt security recovers to at least amortized cost it is no longer considered impaired and sub-sequent changes in fair value are reported in other comprehensive income.
Reversals of impairment losses on equity investments classified as AFS are not reversed through the consoli-dated statement of income; increases in their fair value after impairment are recognized in other comprehensive income.
Derecognition of Financial Assets and Liabilities Financial Asset Derecognition A financial asset is considered for derecognition when the contractual rights to the cash flows from the financial asset expire, or the Group has either transferred the contractual right to receive the cash flows from that asset, or has assumed an obligation to pay those cash flows to one or more recipients, subject to certain criteria.
The Group derecognizes a transferred financial asset if it transfers substantially all the risks and rewards of ownership.
The Group enters into transactions in which it transfers previously recognized financial assets but retains sub-stantially all the associated risks and rewards of those assets; for example, a sale to a third party in which the Group enters into a concurrent total return swap with the same counterparty. These types of transactions are accounted for as secured financing transactions.
In transactions in which substantially all the risks and rewards of ownership of a financial asset are neither retained nor transferred, the Group derecognizes the transferred asset if control over that asset is not retained, i.e., if the transferee has the practical ability to sell the transferred asset. The rights and obligations retained in the transfer are recognized separately as assets and liabilities, as appropriate. If control over the asset is re-tained, the Group continues to recognize the asset to the extent of its continuing involvement, which is deter-mined by the extent to which it remains exposed to changes in the value of the transferred asset.

Deutsche Bank 02 – Consolidated Financial Statements 202 Financial Report 2011 Notes to the Consolidated Financial Statements 01 – Significant Accounting Policies
The derecognition criteria are also applied to the transfer of part of an asset, rather than the asset as a whole, or to a group of similar financial assets in their entirety, when applicable. If transferring a part of an asset, such part must be a specifically identified cash flow, a fully proportionate share of the asset, or a fully proportionate share of a specifically-identified cash flow.
If an existing financial asset is replaced by another asset from the same counterparty on substantially different terms, or if the terms of the financial asset are substantially modified, the existing financial asset is derecog-nized and a new asset is recognized. Any difference between the respective carrying amounts is recognized in the consolidated statement of income.
Securitization The Group securitizes various consumer and commercial financial assets, which is achieved via the sale of these assets to an SPE, which in turn issues securities to investors. The transferred assets may qualify for derecognition in full or in part, under the policy on derecognition of financial assets. Synthetic securitization structures typically involve derivative financial instruments for which the policies in the “Derivatives and Hedge Accounting” section would apply. Those transfers that do not qualify for derecognition may be reported as secured financing or result in the recognition of continuing involvement liabilities. The investors and the securi-tization vehicles generally have no recourse to the Group’s other assets in cases where the issuers of the financial assets fail to perform under the original terms of those assets.
Interests in the securitized financial assets may be retained in the form of senior or subordinated tranches, interest only strips or other residual interests (collectively referred to as “retained interests”). Provided the Group’s retained interests do not result in consolidation of an SPE, nor in continued recognition of the trans-ferred assets, these interests are typically recorded in financial assets at fair value through profit or loss and carried at fair value. Consistent with the valuation of similar financial instruments, fair value of retained tranches or the financial assets is initially and subsequently determined using market price quotations where available or internal pricing models that utilize variables such as yield curves, prepayment speeds, default rates, loss severity, interest rate volatilities and spreads. The assumptions used for pricing are based on observable transactions in similar securities and are verified by external pricing sources, where available. Where observable transactions in similar securities and other external pricing sources are not available, management judgment as described in the section entitled “Fair Value Estimates” must be used to determine fair value.
Gains or losses on securitization depend in part on the carrying amount of the transferred financial assets, allocated between the financial assets derecognized and the retained interests based on their relative fair values at the date of the transfer.
Derecognition of Financial Liabilities A financial liability is derecognized when the obligation under the liability is discharged or canceled or expires. If an existing financial liability is replaced by another from the same lender on substantially different terms, or the terms of the existing liability are substantially modified, such an exchange or modification is treated as a derecognition of the original liability and the recognition of a new liability, and the difference in the respective carrying amounts is recognized in the consolidated statement of income.

Deutsche Bank 02 – Consolidated Financial Statements 203 Financial Report 2011 Notes to the Consolidated Financial Statements 01 – Significant Accounting Policies
Repurchase and Reverse Repurchase Agreements Securities purchased under resale agreements (“reverse repurchase agreements”) and securities sold under agreements to repurchase (“repurchase agreements”) are treated as collateralized financings and are recognized initially at fair value, being the amount of cash disbursed and received, respectively. The party disbursing the cash takes possession of the securities serving as collateral for the financing and having a market value equal to, or in excess of the principal amount loaned. The securities received under reverse repurchase agreements and securities delivered under repurchase agreements are not recognized on, or derecognized from, the balance sheet, unless the risks and rewards of ownership are obtained or relinquished. Securities delivered under repurchase agreements which are not derecognized from the balance sheet and where the counterparty has the right by contract or custom to sell or repledge the collateral are disclosed as such on the face of the con-solidated balance sheet.
The Group has chosen to apply the fair value option to certain repurchase and reverse repurchase portfolios that are managed on a fair value basis.
The Group offsets reverse repurchase agreements and repurchase agreements with the same counterparty, maturity, currency and central securities depository (CSD) for transactions governed by legally enforceable master netting agreements when simultaneous settlement is intended.
Interest earned on reverse repurchase agreements and interest incurred on repurchase agreements is reported as interest income and interest expense, respectively.
Securities Borrowed and Securities Loaned Securities borrowed transactions generally require the Group to deposit cash with the securities lender. In a securities loaned transaction, the Group generally receives either cash collateral, in an amount equal to or in excess of the market value of securities loaned, or securities. The Group monitors the fair value of securities borrowed and securities loaned and additional collateral is disbursed or obtained, if necessary.
The amount of cash advanced or received is recorded as securities borrowed and securities loaned, respectively.
The securities borrowed are not themselves recognized in the financial statements. If they are sold to third parties, the obligation to return the securities is recorded as a financial liability at fair value through profit or loss and any subsequent gain or loss is included in the consolidated statement of income in net gain (loss) on financial assets/liabilities at fair value through profit or loss. Securities lent to counterparties are also retained on the consolidated balance sheet.
Fees received or paid are reported in interest income and interest expense, respectively. Securities lent to counterparties which are not derecognized from the consolidated balance sheet and where the counterparty has the right by contract or custom to sell or repledge the collateral are disclosed as such on the face of the consolidated balance sheet.
Deutsche Bank 02 – Consolidated Financial Statements 204 Financial Report 2011 Notes to the Consolidated Financial Statements 01 – Significant Accounting Policies
Offsetting Financial Instruments Financial assets and liabilities are offset, with the net amount presented in the consolidated balance sheet, only if the Group holds a currently enforceable legal right to set off the recognized amounts, and there is an intention to settle on a net basis or to realize an asset and settle the liability simultaneously. In all other situations they are presented gross. When financial assets and financial liabilities are offset in the consolidated balance sheet, the associated income and expense items will also be offset in the consolidated statement of income, unless specifically prohibited by an applicable accounting standard.
Property and Equipment Property and equipment includes own-use properties, leasehold improvements, furniture and equipment and software (operating systems only). Own-use properties are carried at cost less accumulated depreciation and accumulated impairment losses. Depreciation is generally recognized using the straight-line method over the estimated useful lives of the assets. The range of estimated useful lives is 25 to 50 years for property and 3 to 10 years for furniture and equipment. Leasehold improvements are capitalized and subsequently depreciated on a straight-line basis over the shorter of the term of the lease and the estimated useful life of the improvement, which generally ranges from 3 to 10 years. Depreciation of property and equipment is included in general and administrative expenses. Maintenance and repairs are also charged to general and administrative expenses. Gains and losses on disposals are included in other income.
Property and equipment are tested for impairment at least annually and an impairment charge is recorded to the extent the recoverable amount, which is the higher of fair value less costs to sell and value in use, is less than its carrying amount. Value in use is the present value of the future cash flows expected to be derived from the asset. After the recognition of impairment of an asset, the depreciation charge is adjusted in future periods to reflect the asset’s revised carrying amount. If an impairment is later reversed, the depreciation charge is adjusted prospectively.
Properties leased under a finance lease are capitalized as assets in property and equipment and depreciated over the terms of the leases.
Investment Property The Group generally uses the cost model for valuation of investment property, and the carrying value is included on the consolidated balance sheet in other assets. When the Group issues liabilities that are backed by invest-ment property, which pay a return linked directly to the fair value of, or returns from, specified investment prop-erty assets, it has elected to apply the fair value model to those specific investment property assets. The Group engages, as appropriate, external real estate experts to determine the fair value of the investment property by using recognized valuation techniques. In cases in which prices of recent market transactions of comparable properties are available, fair value is determined by reference to these transactions.

Deutsche Bank 02 – Consolidated Financial Statements 205 Financial Report 2011 Notes to the Consolidated Financial Statements 01 – Significant Accounting Policies
Goodwill and Other Intangible Assets Goodwill arises on the acquisition of subsidiaries, associates and jointly controlled entities, and represents the excess of the aggregate of the cost of an acquisition and any noncontrolling interest in the acquiree over the fair value of the identifiable net assets acquired at the date of the acquisition. For each business combination any noncontrolling interest in the acquiree is measured either at fair value or at the noncontrolling interest’s proportionate share of the acquiree’s identifiable net assets.
For the purpose of calculating goodwill, fair values of acquired assets, liabilities and contingent liabilities are determined by reference to market values or by discounting expected future cash flows to present value. This discounting is either performed using market rates or by using risk-free rates and risk-adjusted expected future cash flows.
Goodwill on the acquisition of subsidiaries is capitalized and reviewed for impairment annually, or more frequently if there are indications that impairment may have occurred. For the purposes of impairment testing, goodwill acquired in a business combination is allocated to cash-generating units which are the smallest identifiable groups of assets that generate cash inflows largely independent of the cash inflows from other assets or groups of assets and that are expected to benefit from the synergies of the combination and considering the business level at which goodwill is monitored for internal management purposes. In identifying whether cash inflows from an asset (or a group of assets) are largely independent of the cash inflows from other assets (or groups of assets) various factors are considered including how management monitors the entity’s operations or makes decisions about continuing or disposing of the entity’s assets and operations. On this basis, the Group’s primary cash-generating units are Corporate Banking & Securities, Global Transaction Banking, Asset Management and Private Wealth Management within the Asset and Wealth Management segment, Private & Business Clients and Corporate Investments.
In addition, for certain nonintegrated investments which are not allocated to the respective segments’ primary cash-generating units, goodwill is tested individually for impairment on the level of each of these nonintegrated investments.
Goodwill on the acquisition of associates and jointly controlled entities is included in the cost of the investments and the entire carrying amount of the equity method investment is reviewed for impairment annually, or more frequently if there is an indication that impairment may have occurred.
If goodwill has been allocated to a cash-generating unit and an operation within that unit is disposed of, the attributable goodwill is included in the carrying amount of the operation when determining the gain or loss on its disposal.

Deutsche Bank 02 – Consolidated Financial Statements 206 Financial Report 2011 Notes to the Consolidated Financial Statements 01 – Significant Accounting Policies
Intangible assets are recognized separately from goodwill when they are separable or arise from contractual or other legal rights and their fair value can be measured reliably. Intangible assets that have a finite useful life are stated at cost less any accumulated amortization and accumulated impairment losses. Customer-related intangible assets that have a finite useful life are amortized over periods of between 1 and 20 years on a straight-line basis based on their expected useful life. Mortgage servicing rights are carried at cost and amortized in proportion to, and over the estimated period of, net servicing revenue. The assets are tested for impairment and their useful lives reaffirmed at least annually.
Certain intangible assets have an indefinite useful life; these are primarily investment management agreements related to retail mutual funds. These indefinite life intangibles are not amortized but are tested for impairment at least annually or more frequently if events or changes in circumstances indicate that impairment may have occurred.
Costs related to software developed or obtained for internal use are capitalized if it is probable that future eco-nomic benefits will flow to the Group, and the cost can be measured reliably. Capitalized costs are amortized using the straight-line method over the asset’s useful life which is deemed to be either three years, five years or ten years. Eligible costs include external direct costs for materials and services, as well as payroll and pay-roll-related costs for employees directly associated with an internal-use software project. Overhead costs, as well as costs incurred during the research phase or after software is ready for use, are expensed as incurred. Capitalized software costs are tested for impairment either annually if still under development or when there is an indication of impairment once the software is in use.
On acquisition of insurance businesses, the excess of the purchase price over the acquirer’s interest in the net fair value of the identifiable assets, liabilities and contingent liabilities is accounted for as an intangible asset. This intangible asset represents the present value of future cash flows over the reported liability at the date of acquisition. This is known as value of business acquired (“VOBA”).
The VOBA is amortized at a rate determined by considering the profile of the business acquired and the expected depletion in its value. The VOBA acquired is reviewed regularly for any impairment in value and any reductions are charged as an expense to the consolidated statement of income.
Financial Guarantees Financial guarantee contracts are contracts that require the issuer to make specified payments to reimburse the holder for a loss it incurs because a specified debtor fails to make payments when due in accordance with the terms of a debt instrument. Such financial guarantees are given to banks, financial institutions and other parties on behalf of customers to secure loans, overdrafts and other banking facilities.

Deutsche Bank 02 – Consolidated Financial Statements 207 Financial Report 2011 Notes to the Consolidated Financial Statements 01 – Significant Accounting Policies
The Group has chosen to apply the fair value option to certain written financial guarantees that are managed on a fair value basis. Financial guarantees that the Group has not designated at fair value are recognized initially in the financial statements at fair value on the date the guarantee is given. Subsequent to initial recogni-tion, the Group’s liabilities under such guarantees are measured at the higher of the amount initially recognized, less cumulative amortization, and the best estimate of the expenditure required to settle any financial obligation as of the balance sheet date. These estimates are determined based on experience with similar transactions and history of past losses, and management’s determination of the best estimate.
Any increase in the liability relating to guarantees is recorded in the consolidated statement of income in provi-sion for credit losses.
Leasing Transactions The Group enters into lease contracts, predominantly for premises, as a lessee. The terms and conditions of these contracts are assessed and the leases are classified as operating leases or finance leases according to their economic substance at inception of the lease.
Assets held under finance leases are initially recognized on the consolidated balance sheet at an amount equal to the fair value of the leased property or, if lower, the present value of the minimum lease payments. The corresponding liability to the lessor is included in the consolidated balance sheet as a finance lease obligation. The discount rate used in calculating the present value of the minimum lease payments is either the interest rate implicit in the lease, if it is practicable to determine, or the incremental borrowing rate. Contingent rentals are recognized as expense in the periods in which they are incurred.
Operating lease rentals payable are recognized as an expense on a straight-line basis over the lease term, which commences when the lessee controls the physical use of the property. Lease incentives are treated as a reduction of rental expense and are also recognized over the lease term on a straight-line basis. Contingent rentals arising under operating leases are recognized as an expense in the period in which they are incurred.
Sale-Leaseback Arrangements If a sale-leaseback transaction results in a finance lease, any excess of sales proceeds over the carrying amount of the asset is not immediately recognized as income by a seller-lessee but is deferred and amortized over the lease term.
If a sale-leaseback transaction results in an operating lease, the timing of the profit recognition is a function of the difference between the sales price and fair value. When it is clear that the sales price is at fair value, the profit (the difference between the sales price and carrying value) is recognized immediately. If the sales price is below fair value, any profit or loss is recognized immediately, except that if the loss is compensated for by future lease payments at below market price, it is deferred and amortized in proportion to the lease payments over the period the asset is expected to be used. If the sales price is above fair value, the excess over fair value is deferred and amortized over the period the asset is expected to be used.

Deutsche Bank 02 – Consolidated Financial Statements 208 Financial Report 2011 Notes to the Consolidated Financial Statements 01 – Significant Accounting Policies
Employee Benefits Pension Benefits The Group provides a number of pension plans. In addition to defined contribution plans, there are retirement benefit plans accounted for as defined benefit plans. The assets of all the Group’s defined contribution plans are held in independently-administered funds. Contributions are generally determined as a percentage of salary and are expensed based on employee services rendered, generally in the year of contribution.
All retirement benefit plans accounted for as defined benefit plans are valued using the projected unit-credit method to determine the present value of the defined benefit obligation and the related service costs. Under this method, the determination is based on actuarial calculations which include assumptions about demographics, salary increases and interest and inflation rates. Actuarial gains and losses are recognized in shareholders’ equity and presented in the consolidated statement of comprehensive income in the period in which they occur. The majority of the Group’s benefit plans are funded.
Other Post-Employment Benefits In addition, the Group maintains unfunded contributory post-employment medical plans for a number of current and retired employees who are mainly located in the United States. These plans pay stated percentages of eligible medical and dental expenses of retirees after a stated deductible has been met. The Group funds these plans on a cash basis as benefits are due. Analogous to retirement benefit plans these plans are valued using the projected unit-credit method. Actuarial gains and losses are recognized in full in the period in which they occur in shareholders’ equity and presented in the consolidated statement of comprehensive income.
Refer to Note 34 “Employee Benefits” for further information on the accounting for pension benefits and other post-employment benefits.
Termination benefits Termination benefits arise when employment is terminated by the Group before the normal retirement date, or whenever an employee accepts voluntary redundancy in exchange for these benefits. The Group recognizes termination benefits as a liability and an expense if the Group is demonstrably committed to a detailed formal plan without realistic possibility of withdrawal. In the case of an offer made to encourage voluntary redundancy, termination benefits are measured based on the number of employees expected to accept the offer. Benefits falling due more than twelve months after the end of the reporting period are discounted to their present value. The discount rate is determined by reference to market yields on high-quality corporate bonds.
Share-Based Compensation Compensation expense for awards classified as equity instruments is measured at the grant date based on the fair value of the share-based award. For share awards, the fair value is the quoted market price of the share reduced by the present value of the expected dividends that will not be received by the employee and adjusted for the effect, if any, of restrictions beyond the vesting date. In case an award is modified such that its fair value immediately after modification exceeds its fair value immediately prior to modification, a remeasurement takes place and the resulting increase in fair value is recognized as additional compensation expense.
Deutsche Bank 02 – Consolidated Financial Statements 209 Financial Report 2011 Notes to the Consolidated Financial Statements 01 – Significant Accounting Policies
The Group records the offsetting amount to the recognized compensation expense in additional paid-in capital (APIC). Compensation expense is recorded on a straight-line basis over the period in which employees perform services to which the awards relate or over the period of the tranches for those awards delivered in tranches. Estimates of expected forfeitures are periodically adjusted in the event of actual forfeitures or for changes in expectations. The timing of expense recognition relating to grants which, due to early retirement provisions, include a nominal but nonsubstantive service period are accelerated by shortening the amortization period of the expense from the grant date to the date when the employee meets the eligibility criteria for the award, and not the vesting date. For awards that are delivered in tranches, each tranche is considered a separate award and amortized separately.
Compensation expense for share-based awards payable in cash is remeasured to fair value at each balance sheet date, and recognized over the vesting period in which the related employee services are rendered. The related obligations are included in other liabilities until paid.
Obligations to Purchase Common Shares Forward purchases of Deutsche Bank shares, and written put options where Deutsche Bank shares are the underlying, are reported as obligations to purchase common shares if the number of shares is fixed and physical settlement for a fixed amount of cash is required. At inception the obligation is recorded at the present value of the settlement amount of the forward or option. For forward purchases and written put options of Deutsche Bank shares, a corresponding charge is made to shareholders’ equity and reported as equity classified as an obligation to purchase common shares.
The liabilities are accounted for on an accrual basis, and interest costs, which consist of time value of money and dividends, on the liability are reported as interest expense. Upon settlement of such forward purchases and written put options, the liability is extinguished and the charge to equity is reclassified to common shares in treasury.
Deutsche Bank common shares subject to such forward contracts are not considered to be outstanding for purposes of basic earnings per share calculations, but are for dilutive earnings per share calculations to the extent that they are, in fact, dilutive.
Put and call option contracts with Deutsche Bank shares as the underlying where the number of shares is fixed and physical settlement is required are not classified as derivatives. They are transactions in the Group’s equity. All other derivative contracts in which Deutsche Bank shares are the underlying are recorded as financial assets/ liabilities at fair value through profit or loss.
Income Taxes The Group recognizes the current and deferred tax consequences of transactions that have been included in the consolidated financial statements using the provisions of the respective jurisdictions’ tax laws. Current and deferred taxes are charged or credited to other comprehensive income if the tax relates to items that are charged or credited directly to other comprehensive income.

Deutsche Bank 02 – Consolidated Financial Statements 210 Financial Report 2011 Notes to the Consolidated Financial Statements 01 – Significant Accounting Policies
Deferred tax assets and liabilities are recognized for future tax consequences attributable to temporary differ-ences between the financial statement carrying amounts of existing assets and liabilities and their respective tax bases, unused tax losses and unused tax credits. Deferred tax assets are recognized only to the extent that it is probable that sufficient taxable profit will be available against which those unused tax losses, unused tax credits and deductible temporary differences can be utilized.
Deferred tax assets and liabilities are measured based on the tax rates that are expected to apply in the period that the asset is realized or the liability is settled, based on tax rates and tax laws that have been enacted or substantively enacted at the balance sheet date.
Current tax assets and liabilities are offset when (1) they arise from the same tax reporting entity or tax group of reporting entities, (2) the legally enforceable right to offset exists and (3) they are intended to be settled net or realized simultaneously.
Deferred tax assets and liabilities are offset when the legally enforceable right to offset current tax assets and liabilities exists and the deferred tax assets and liabilities relate to income taxes levied by the same taxing authority on either the same tax reporting entity or tax group of reporting entities.
Deferred tax liabilities are provided on taxable temporary differences arising from investments in subsidiaries, branches and associates and interests in joint ventures except when the timing of the reversal of the temporary difference is controlled by the Group and it is probable that the difference will not reverse in the foreseeable future. Deferred income tax assets are provided on deductible temporary differences arising from such invest-ments only to the extent that it is probable that the differences will reverse in the foreseeable future and sufficient taxable income will be available against which those temporary differences can be utilized.
Deferred tax related to fair value remeasurement of AFS investments, cash flow hedges and other items, which are charged or credited directly to other comprehensive income, is also credited or charged directly to other com-prehensive income and subsequently recognized in the consolidated statement of income once the underlying gain or loss to which the deferred tax relates is realized.
For share-based payment transactions, the Group may receive a tax deduction related to the compensation paid in shares. The amount deductible for tax purposes may differ from the cumulative compensation expense recorded. At any reporting date, the Group must estimate the expected future tax deduction based on the current share price. If the amount deductible, or expected to be deductible, for tax purposes exceeds the cumulative compensation expense, the excess tax benefit is recognized directly in equity. If the amount deduct-ible, or expected to be deductible, for tax purposes is less than the cumulative compensation expense, the shortfall is recognized in the Group’s consolidated statement of income for the period.
The Group’s insurance business in the United Kingdom (Abbey Life Assurance Company Limited) is subject to income tax on the policyholder’s investment returns (policyholder tax). This tax is included in the Group’s income tax expense/benefit even though it is economically the income tax expense/benefit of the policyholder, which reduces/increases the Group’s liability to the policyholder.

Deutsche Bank 02 – Consolidated Financial Statements 211 Financial Report 2011 Notes to the Consolidated Financial Statements 01 – Significant Accounting Policies
Provisions Provisions are recognized if the Group has a present legal or constructive obligation as a result of past events, if it is probable that an outflow of resources will be required to settle the obligation, and a reliable estimate can be made of the amount of the obligation.
The amount recognized as a provision is the best estimate of the consideration required to settle the present obligation as of the balance sheet date, taking into account the risks and uncertainties surrounding the obligation.
If the effect of the time value of money is material, provisions are discounted and measured at the present value of the expenditure expected to be required to settle the obligation, using a pre-tax rate that reflects the current market assessments of the time value of money and the risks specific to the obligation. The increase in the provision due to the passage of time is recognized as interest expense.
When some or all of the economic benefits required to settle a provision are expected to be recovered from a third party (for example, because the obligation is covered by an insurance policy), an asset is recognized if it is virtually certain that reimbursement will be received.
Consolidated Statement of Cash Flows For purposes of the consolidated statement of cash flows, the Group’s cash and cash equivalents include highly liquid investments that are readily convertible into cash and which are subject to an insignificant risk of change in value. Such investments include cash and balances at central banks and demand deposits with banks.
The Group’s assignment of cash flows to the operating, investing or financing category depends on the business model (“management approach”). For the Group the primary operating activity is to manage financial assets and financial liabilities. Therefore, the issuance and management of long-term borrowings is a core operating activity which is different than for a non-financial company, where borrowing is not a principal revenue producing activity and thus is part of the financing category.
The Group views the issuance of senior long-term debt as an operating activity. Senior long-term debt comprises structured notes and asset-backed securities, which are designed and executed by CIB business lines and which are revenue generating activities. The other component is debt issued by Treasury, which is considered interchangeable with other funding sources; all of the funding costs are allocated to business activities to es-tablish their profitability.

Deutsche Bank 02 – Consolidated Financial Statements 212 Financial Report 2011 Notes to the Consolidated Financial Statements 01 – Significant Accounting Policies
Cash flows related to subordinated long-term debt and trust preferred securities are viewed differently than those related to senior-long term debt because they are managed as an integral part of the Group’s capital, primarily to meet regulatory capital requirements. As a result they are not interchangeable with other operating liabilities, but can only be interchanged with equity and thus are considered part of the financing category.
The amounts shown in the consolidated statement of cash flows do not precisely match the movements in the consolidated balance sheet from one period to the next as they exclude non-cash items such as movements due to foreign exchange translation and movements due to changes in the group of consolidated companies.
Movements in balances carried at fair value through profit or loss represent all changes affecting the carrying value. This includes the effects of market movements and cash inflows and outflows. The movements in balances carried at fair value are usually presented in operating cash flows.
Insurance The Group’s insurance business issues two types of contracts:
Insurance Contracts – These are annuity and universal life contracts under which the Group accepts significant insurance risk from another party (the policyholder) by agreeing to compensate the policyholder if a specific uncertain future event adversely affects the policyholder. Such contracts remain insurance contracts until all rights and obligations are extinguished or expire. As allowed by IFRS, the Group retained the accounting poli-cies for insurance contracts which it applied prior to the adoption of IFRS (U.S. GAAP). These accounting policies are described further below.
Non-Participating Investment Contracts (“Investment Contracts”) – These contracts do not contain significant insurance risk or discretionary participation features. These are measured and reported consistently with other financial liabilities, which are classified as financial liabilities at fair value through profit or loss.
Financial assets held to back annuity contracts have been classified as financial instruments AFS. Financial assets held for other insurance and investment contracts have been designated as fair value through profit or loss under the fair value option.
Insurance Contracts Premiums for single premium business are recognized as income when received. This is the date from which the policy is effective. For regular premium contracts, receivables are recognized at the date when payments are due. Premiums are shown before deduction of commissions. When policies lapse due to non-receipt of premiums, all related premium income accrued but not received from the date they are deemed to have lapsed, net of related expense, is offset against premiums.
Claims are recorded as an expense when they are incurred, and reflect the cost of all claims arising during the year, including policyholder profit participations allocated in anticipation of a participation declaration.
The aggregate policy reserves for universal life insurance contracts are equal to the account balance, which represents premiums received and investment returns credited to the policy, less deductions for mortality costs and expense charges. For other unit-linked insurance contracts the policy reserve represents the fair value of the underlying assets.

Deutsche Bank 02 – Consolidated Financial Statements 213 Financial Report 2011 Notes to the Consolidated Financial Statements 01 – Significant Accounting Policies
For annuity contracts, the liability is calculated by estimating the future cash flows over the duration of the in force contracts and discounting them back to the valuation date allowing for the probability of occurrence. The assumptions are fixed at the date of acquisition with suitable provisions for adverse deviations (PADs). This calculated liability value is tested against a value calculated using best estimate assumptions and interest rates based on the yield on the amortized cost of the underlying assets. Should this test produce a higher value, the liability amount would be reset.
Aggregate policy reserves include liabilities for certain options attached to the Group’s unit-linked pension products. These liabilities are calculated based on contractual obligations using actuarial assumptions.
Liability adequacy tests are performed for the insurance portfolios on the basis of estimated future claims, costs, premiums earned and proportionate investment income. For long duration contracts, if actual experience regarding investment yields, mortality, morbidity, terminations or expense indicate that existing contract liabilities, along with the present value of future gross premiums, will not be sufficient to cover the present value of future benefits and to recover deferred policy acquisition costs, then a premium deficiency is recognized.
The costs directly attributable to the acquisition of incremental insurance and investment business are deferred to the extent that they are expected to be recoverable out of future margins in revenues on these contracts. These costs will be amortized systematically over a period no longer than that in which they are expected to be recovered out of these future margins.
Investment Contracts All of the Group’s investment contracts are unit-linked. These contract liabilities are determined using current unit prices multiplied by the number of units attributed to the contract holders as of the balance sheet date.
As this amount represents fair value, the liabilities have been classified as financial liabilities at fair value through profit or loss. Deposits collected under investment contracts are accounted for as an adjustment to the invest-ment contract liabilities. Investment income attributable to investment contracts is included in the consolidated statement of income. Investment contract claims reflect the excess of amounts paid over the account balance released. Investment contract policyholders are charged fees for policy administration, investment manage-ment, surrenders or other contract services.
The financial assets for investment contracts are recorded at fair value with changes in fair value, and offsetting changes in the fair value of the corresponding financial liabilities, recorded in profit or loss.
Deutsche Bank 02 – Consolidated Financial Statements 214 Financial Report 2011 Notes to the Consolidated Financial Statements 02 – Critical Accounting Estimates
Reinsurance Premiums ceded for reinsurance and reinsurance recoveries on policyholder benefits and claims incurred are reported in income and expense as appropriate. Assets and liabilities related to reinsurance are reported on a gross basis when material. Amounts ceded to reinsurers from reserves for insurance contracts are estimated in a manner consistent with the reinsured risk. Accordingly, revenues and expenses related to reinsurance agree-ments are recognized in a manner consistent with the underlying risk of the business reinsured.
All new material reinsurance arrangements are subject to local Board approval. Once transacted they are subject to regular credit risk review including an assessment of the full exposure and any lending and collateral provision. Impairment is determined in accordance with the Group’s accounting policy “Impairment of Financial Assets”.
02 – Critical Accounting Estimates
Certain of the accounting policies described in Note 01 “Significant Accounting Policies” require critical accounting estimates that involve complex and subjective judgments and the use of assumptions, some of which may be for matters that are inherently uncertain and susceptible to change. Such critical accounting estimates could change from period to period and have a material impact on the Group’s financial condition, changes in financial condition or results of operations. Critical accounting estimates could also involve estimates where management could have reasonably used another estimate in the current accounting period. The Group has identified the following significant accounting policies that involve critical accounting estimates.
Fair Value Estimates Certain of the Group’s financial instruments are carried at fair value with changes in fair value recognized in the consolidated statement of income. This includes trading assets and liabilities and financial assets and liabilities designated at fair value through profit or loss. In addition, financial assets that are classified as AFS are carried at fair value with the changes in fair value reported in other comprehensive income. Derivatives held for non-trading purposes are carried at fair value with changes in value recognized through the consolidated statement of income, except where they are designated in cash flow or net investment hedge accounting relationships when changes in fair value of the effective portion of the hedge are reflected directly in other comprehensive income.
Deutsche Bank 02 – Consolidated Financial Statements 215 Financial Report 2011 Notes to the Consolidated Financial Statements 02 – Critical Accounting Estimates
Trading assets include debt and equity securities, derivatives held for trading purposes, commodities and trad-ing loans. Trading liabilities consist primarily of derivative liabilities and short positions. Financial assets and liabilities which are designated at fair value through profit or loss, under the fair value option, include repur-chase and reverse repurchase agreements, certain loans and loan commitments, debt and equity securities and structured note liabilities. Private equity investments in which the Group does not have a controlling finan-cial interest or significant influence are also carried at fair value either as trading instruments, designated as at fair value through profit or loss or as AFS instruments.
Fair value is defined as the price at which an asset or liability could be exchanged in an arm’s length transac-tion between knowledgeable, willing parties, other than in a forced or liquidation sale.
In reaching estimates of fair value, management judgment needs to be exercised. The areas requiring significant management judgment are identified, documented and reported to senior management as part of the valuation control framework and the standard monthly reporting cycle. The Group’s specialist model validation and valuation groups focus attention on the areas of subjectivity and judgment.
The level of management judgment required in establishing fair value of financial instruments for which there is a quoted price in an active market is minimal. Similarly there is little subjectivity or judgment required for instruments valued using valuation models that are standard across the industry and where all parameter inputs are quoted in active markets.
The level of subjectivity and degree of management judgment required is more significant for those instruments valued using specialized and sophisticated models and those where some or all of the parameter inputs are not observable. Management judgment is required in the selection and application of appropriate parameters, assumptions and modeling techniques. In particular, where data are obtained from infrequent market trans-actions extrapolation and interpolation techniques must be applied. In addition, where no market data are available, parameter inputs are determined by assessing other relevant sources of information such as historical data, fundamental analysis of the economics of the transaction and proxy information from similar transactions with appropriate adjustments to reflect the terms of the actual instrument being valued and current market conditions. Where different valuation techniques indicate a range of possible fair values for an instrument, management has to establish what point within the range of estimates best represents fair value. Further, some valuation adjustments may require the exercise of management judgment to achieve fair value.
Methods of Determining Fair Value A substantial percentage of the Group’s financial assets and liabilities carried at fair value are based on, or derived from, observable prices or inputs. The availability of observable prices or inputs varies by product and market, and may change over time. For example, observable prices or inputs are usually available for: liquid securities; exchange traded derivatives; over-the-counter (OTC) derivatives transacted in liquid trading markets such as interest rate swaps, foreign exchange forward and option contracts in G7 currencies; and equity swap and option contracts on listed securities or indices. If observable prices or inputs are available, they are utilized in the determination of fair value and, as such, fair value can be determined without significant judgment. This includes instruments for which the fair value is derived from a valuation model that is standard across the industry and the inputs are directly observable. This is the case for many generic swap and option contracts.

Deutsche Bank 02 – Consolidated Financial Statements 216 Financial Report 2011 Notes to the Consolidated Financial Statements 02 – Critical Accounting Estimates
In other markets or for certain instruments, observable prices or inputs are not available, and fair value is determined using valuation techniques appropriate for the particular instrument. For example, instruments subject to valuation techniques include: trading loans and other loans or loan commitments designated at fair value through profit or loss, under the fair value option; new, complex and long-dated OTC derivatives; trans-actions in immature or limited markets; distressed debt securities and loans; private equity securities and retained interests in securitizations of financial assets. The application of valuation techniques to determine fair value involves estimation and management judgment, the extent of which will vary with the degree of complexity and liquidity in the market. Valuation techniques include industry standard models based on discounted cash flow analysis, which are dependent upon estimated future cash flows and the discount rate used. For more complex products, the valuation models include more complex modeling techniques, parameters and assumptions, such as volatility, correlation, prepayment speeds, default rates and loss severity. Management judgment is required in the selection and application of the appropriate parameters, assumptions and modeling techniques. Because the objective of using a valuation technique is to establish the price at which market participants would currently transact, the valuation techniques incorporate all factors that the Group believes market participants would consider in setting a transaction price.
Valuation adjustments are an integral part of the fair value process that requires the exercise of judgment. In making appropriate valuation adjustments, the Group follows methodologies that consider factors such as bid-offer spread valuation adjustments, liquidity, and credit risk (both counterparty credit risk in relation to financial assets and the Group’s own credit risk in relation to financial liabilities which are at fair value through profit or loss).
The fair value of the Group’s financial liabilities which are at fair value through profit or loss (e.g., OTC derivative liabilities and structured note liabilities designated at fair value through profit or loss) incorporates the change in the Group’s own credit risk of the financial liability. For derivative liabilities the Group considers its own credit-worthiness by assessing all counterparties’ potential future exposure to us, taking into account any collateral provided, the effect of any master netting agreements, expected loss given default and the Group’s own credit risk based on historic default levels. The change in the Group’s own credit risk for structured note liabilities is calculated by discounting the contractual cash flows of the instrument using the rate at which similar instruments would be issued at the measurement date. The resulting fair value is an estimate of the price at which the specific liability would be exchanged at the measurement date with another market participant.

Deutsche Bank 02 – Consolidated Financial Statements 217 Financial Report 2011 Notes to the Consolidated Financial Statements 02 – Critical Accounting Estimates
Under IFRS, if there are significant unobservable inputs used in the valuation technique as of the trade date the financial instrument is recognized at the transaction price and any trade date profit is deferred. Management judgment is required in determining whether there exist significant unobservable inputs in the valuation technique. Once deferred the decision to subsequently recognize the trade date profit requires a careful assessment of the then current facts and circumstances supporting observability of parameters and/or risk mitigation.
The Group has established internal control procedures over the valuation process to provide assurance over the appropriateness of the fair values applied. If fair value is determined by valuation models, the assumptions and techniques within the models are independently validated by a specialist group. Price and parameter inputs, assumptions and valuation adjustments are subject to verification and review processes. If the price and parameter inputs are observable, they are verified against independent sources.
If prices and parameter inputs or assumptions are not observable, the appropriateness of fair value is subject to additional procedures to assess its reasonableness. Such procedures include performing revaluations using independently generated models, assessing the valuations against appropriate proxy instruments, performing sensitivity analysis and extrapolation techniques, and considering other benchmarks. Assessment is made as to whether the valuation techniques yield fair value estimates that are reflective of the way the market operates by calibrating the results of the valuation models against market transactions. These procedures require the application of management judgment.
Other valuation controls include review and analysis of daily profit and loss, validation of valuation through close out profit and loss and Value-at-Risk back-testing.
Fair Value Estimates Used in Disclosures Under IFRS, the financial assets and liabilities carried at fair value are required to be disclosed according to the valuation method used to determine their fair value. Specifically, segmentation is required between those valued using quoted market prices in an active market (level 1), valuation techniques based on observable parameters (level 2) and valuation techniques using significant unobservable parameters (level 3). This disclo-sure is provided in Note 14 “Financial Instruments carried at Fair Value”. The financial assets held at fair value categorized in level 3 were € 47.6 billion at December 31, 2011, compared to € 46.7 billion at December 31, 2010. The financial liabilities held at fair value categorized in level 3 were € 13.4 billion at December 31, 2011 and € 13.0 billion at December 31, 2010. Management judgment is required in determining the category to which certain instruments should be allocated. This specifically arises when the valuation is determined by a number of parameters, some of which are observable and others are not. Further, the classification of an instrument can change over time to reflect changes in market liquidity and therefore price transparency.

Deutsche Bank 02 – Consolidated Financial Statements 218 Financial Report 2011 Notes to the Consolidated Financial Statements 02 – Critical Accounting Estimates
In addition to the fair value hierarchy disclosure in Note 14 “Financial Instruments carried at Fair Value”, the Group provides a sensitivity analysis of the impact upon the level 3 financial instruments of using a reasonably possible alternative for the unobservable parameter. The determination of reasonably possible alternatives requires significant management judgment.
For financial instruments measured at amortized cost (which includes loans, deposits and short and long term debt issued) the Group discloses the fair value. This disclosure is provided in Note 15 “Fair Value of Financial Instruments not carried at Fair Value”. Generally there is limited or no trading activity in these instruments and therefore the fair value determination requires significant management judgment.
Reclassification of Financial Assets The Group classifies financial assets into the following categories: financial assets at fair value through profit or loss, financial assets AFS or loans. The appropriate classification of financial assets is determined at the time of initial recognition. In addition, under the amendments to IAS 39 and IFRS 7, “Reclassification of Financial Assets” which were approved by the IASB and endorsed by the EU in October 2008, it is permissible to reclassify certain financial assets out of financial assets at fair value through profit or loss (trading assets) and the AFS classifications into the loans classification. For assets to be reclassified there must be a clear change in manage-ment intent with respect to the assets since initial recognition and the financial asset must meet the definition of a loan at the reclassification date. Additionally, there must be an intent and ability to hold the asset for the foreseeable future at the reclassification date. There is no ability for subsequent reclassification back to the trading or AFS classifications. Refer to Note 13 “Amendments to IAS 39 and IFRS 7, ‘Reclassification of Financial Assets’” for further information on the assets reclassified by the Group.
Significant management judgment and assumptions are required to identify assets eligible under the amendments for which expected repayment exceeds estimated fair value. Significant management judgment and assumptions are also required to estimate the fair value of the assets identified (as described in “Fair Value Estimates”) at the date of reclassification, which becomes the amortized cost base under the loan classification. The task facing management in both these matters can be particularly challenging in the highly volatile and uncertain economic and financial market conditions such as those which existed in the third and fourth quarters of 2008. The change of intent to hold for the foreseeable future is another matter requiring significant management judgment. The change in intent is not simply determined because of an absence of attractive prices nor is foreseeable future defined as the period until the return of attractive prices. Refer to Note 01 “Significant Accounting Policies” section “Reclassification of Financial Assets” for the Group’s minimum requirements for what constitutes foreseeable future.

Deutsche Bank 02 – Consolidated Financial Statements 219 Financial Report 2011 Notes to the Consolidated Financial Statements 02 – Critical Accounting Estimates
Impairment of Loans and Provision for Off-Balance Sheet Positions The accounting estimates and judgments related to the impairment of loans and provision for off-balance sheet positions is a critical accounting estimate for the Corporate Banking & Securities and Private & Business Clients corporate divisions because the underlying assumptions used for both the individually and collectively assessed impairment can change from period to period and may significantly affect the Group’s results of operations.
In assessing assets for impairment, management judgment is required, particularly in circumstances of economic and financial uncertainty, such as those of the recent financial crisis, when developments and changes to ex-pected cash flows can occur both with greater rapidity and less predictability.
The provision for credit losses totaled € 1,839 million, € 1,274 million and € 2,630 million for the years ended December 31, 2011, 2010 and 2009.
The determination of the impairment allowance required for loans which are deemed to be individually significant often requires the use of considerable management judgment concerning such matters as local economic conditions, the financial performance of the counterparty and the value of any collateral held, for which there may not be a readily accessible market. In certain situations, such as for certain leveraged loans, the Group may assess the enterprise value of the borrower to assess impairment. This requires use of considerable management judgment regarding timing of exit and the market value of the borrowing entity. The actual amount of the future cash flows and their timing may differ from the estimates used by management and consequently may cause actual losses to differ from the reported allowances.
The impairment allowance for portfolios of smaller-balance homogenous loans, such as those to individuals and small business customers of the private and retail business, and for those loans which are individually significant but for which no objective evidence of impairment exists, is determined on a collective basis. The collective impairment allowance is calculated on a portfolio basis using statistical models which incorporate numerous estimates and judgments. The Group performs a regular review of the models and underlying data and assumptions. The probability of defaults, loss recovery rates, and judgments concerning the ability of borrowers in foreign countries to transfer the foreign currency necessary to comply with debt repayments, among other things, are all taken into account during this review. For further discussion of the methodologies used to determine the Group’s allowance for credit losses, see Note 01 “Significant Accounting Policies”.
Impairment of Other Financial Assets Equity method investments and financial assets classified as AFS are evaluated for impairment on a quarterly basis, or more frequently if events or changes in circumstances indicate that these assets are impaired. If there is objective evidence of an impairment of an associate or jointly-controlled entity, an impairment test is per-formed by comparing the investments’ recoverable amount, which is the higher of its value in use and fair value less costs to sell, with its carrying amount. In the case of equity investments classified as AFS, objective evidence of impairment would include a significant or prolonged decline in fair value of the investment below cost. It could also include specific conditions in an industry or geographical area or specific information regarding the financial condition of the company, such as a downgrade in credit rating. In the case of debt securities classified as AFS, impairment is assessed based on the same criteria as for loans. If information becomes available after the Group makes its evaluation, the Group may be required to recognize impairment in the future. Because the

Deutsche Bank 02 – Consolidated Financial Statements 220 Financial Report 2011 Notes to the Consolidated Financial Statements 02 – Critical Accounting Estimates
estimate for impairment could change from period to period based upon future events that may or may not occur, the Group considers this to be a critical accounting estimate. The impairment reviews for equity method invest-ments and financial assets AFS resulted in net impairment charges of € 1,140 million in 2011, € 2,588 million in 2010 and € 1,125 million in 2009. For additional information see Note 08 “Net Gains (Losses) on Financial As-sets Available for Sale” and Note 17 “Equity Method Investments”.
Impairment of Non-financial Assets Certain non-financial assets, including goodwill and other intangible assets, are subject to impairment review. The Group records impairment losses on assets in this category when the Group believes that their carrying value may not be recoverable. A reversal of an impairment loss (excluding goodwill) is recognized immediately.
Goodwill and other intangible assets are tested for impairment on an annual basis, or more frequently if events or changes in circumstances, such as an adverse change in business climate, indicate that these assets may be impaired. The determination of the recoverable amount in the impairment assessment requires estimates based on quoted market prices, prices of comparable businesses, present value or other valuation techniques, or a combination thereof, necessitating management to make subjective judgments and assumptions. Because these estimates and assumptions could result in significant differences to the amounts reported if underlying circumstances were to change, the Group considers this estimate to be critical. As of December 31, 2011 and 2010, goodwill had carrying amounts of € 11.0 billion and € 10.8 billion, respectively, and other intangible as-sets had carrying amounts in each of these years of € 4.8 billion. Evaluation of impairment of these assets is a significant estimate for multiple businesses.
In 2011, impairments on intangible assets included a charge of € 2 million related to the write-down of permits for a renewable energy investment in CB&S. In 2010, other intangible assets impairment losses of € 41 million were recorded, of which € 29 million related to customer-related intangible assets recorded in GTB and a loss of € 12 million recorded on the write-down of purchased software included in AWM. In 2009, goodwill and other intangible assets impairment losses of € 157 million were recorded, of which € 151 million related to investments in Corporate Investments. In addition, € 291 million were recorded as reversals of impairment losses of other intangible assets in Asset and Wealth Management, which had been taken in the fourth quarter of 2008. For further discussion on goodwill and other intangible assets, see Note 24 “Goodwill and Other Intangible Assets”.

Deutsche Bank 02 – Consolidated Financial Statements 221 Financial Report 2011 Notes to the Consolidated Financial Statements 02 – Critical Accounting Estimates
Deferred Tax Assets The Group recognizes deferred tax assets and liabilities for the future tax consequences attributable to temporary differences between the financial statement carrying amounts of existing assets and liabilities and their respective tax bases, unused tax losses and unused tax credits. Deferred tax assets are recognized only to the extent that it is probable that sufficient taxable profit will be available against which those unused tax losses, unused tax credits or deductible temporary differences can be utilized. This assessment requires significant management judgments and assumptions. In determining the amount of deferred tax assets, the Group uses historical tax capacity and profitability information and, if relevant, forecasted operating results, based upon approved business plans, including a review of the eligible carry-forward periods, available tax planning opportunities and other relevant considerations. Each quarter, the Group re-evaluates its estimate related to deferred tax assets, including its assumptions about future profitability. As of December 31, 2011 and December 31, 2010 the amount of unrecognized deferred tax assets was € 2.4 billion and € 2.6 billion, respectively, and the amount of recognized deferred tax assets was € 8.7 billion and € 8.3 billion, respectively.
The Group believes that the accounting estimate related to the deferred tax assets is a critical accounting estimate because the underlying assumptions can change from period to period. For example, tax law changes or variances in future projected operating performance could result in a change of the deferred tax asset. If the Group was not able to realize all or part of its net deferred tax assets in the future, an adjustment to its deferred tax assets would be charged to income tax expense or directly to equity in the period such determination was made. If the Group was to recognize previously unrecognized deferred tax assets in the future, an adjustment to its deferred tax asset would be credited to income tax expense or directly to equity in the period such determination was made.
For further information on the Group’s deferred taxes see Note 35 “Income Taxes”.
Legal and Regulatory Contingencies and Uncertain Tax Positions The Group conducts its business in many different legal, regulatory and tax environments, and, accordingly, legal claims, regulatory proceedings or uncertain income tax positions may arise.
The use of estimates is important in determining provisions for potential losses that may arise from litigation, regulatory proceedings and uncertain income tax positions. The Group estimates and provides for potential losses that may arise out of litigation, regulatory proceedings and uncertain income tax positions to the extent that such losses are probable and can be estimated, in accordance with IAS 37, “Provisions, Contingent Liabilities and Contingent Assets” or IAS 12, “Income Taxes”, respectively. Significant judgment is required in making these estimates and the Group’s final liabilities may ultimately be materially different.

Deutsche Bank 02 – Consolidated Financial Statements 222 Financial Report 2011 Notes to the Consolidated Financial Statements 03 – Recently Adopted and New Accounting Pronouncements
Contingencies in respect of legal matters are subject to many uncertainties and the outcome of individual matters is not predictable with assurance. Significant judgment is required in assessing probability and making estimates in respect of contingencies, and the Group’s final liability may ultimately be materially different. The Group’s total liability in respect of litigation, arbitration and regulatory proceedings is determined on a case-by-case basis and represents an estimate of probable losses after considering, among other factors, the progress of each case, the Group’s experience and the experience of others in similar cases, and the opinions and views of legal counsel. Predicting the outcome of the Group’s litigation matters is inherently difficult, particularly in cases in which claimants seek substantial or indeterminate damages. See Note 28 “Provisions” for information on the Group’s judicial, regulatory and arbitration proceedings.
03 – Recently Adopted and New Accounting Pronouncements
Recently Adopted Accounting Pronouncements The following are those accounting pronouncements which are relevant to the Group and which have been adopted during 2011 in the preparation of these consolidated financial statements.
IAS 24 In November 2009, the IASB issued a revised version of IAS 24, “Related Party Disclosures” (“IAS 24 R”). IAS 24 R provides a partial exemption from the disclosure requirements for government-related entities. Addi-tionally, the definition of a related party is amended to clarify that an associate includes subsidiaries of an as-sociate and a joint venture includes subsidiaries of the joint venture. Following this clarification, the number of related parties has increased significantly and prior year numbers were adjusted as a result of the adoption of IAS 24 R. The revised standard was effective for annual periods beginning on or after January 1, 2011. The adoption of the revised standard did not have a material impact on the Group’s consolidated financial state-ments.
Improvements to IFRS 2010 In May 2010, the IASB issued amendments to IFRS, which resulted from the IASB’s annual improvement project. They comprise amendments that result in accounting changes for presentation, recognition or mea-surement purposes as well as terminology or editorial amendments related to a variety of individual IFRS. Most of the amendments were effective for annual periods beginning on or after January 1, 2011. The adoption of the amendments did not have a material impact on the Group’s consolidated financial statements.
New Accounting Pronouncements The following accounting pronouncements were not effective as of December 31, 2011 and therefore have not been applied in preparing these financial statements.

Deutsche Bank 02 – Consolidated Financial Statements 223 Financial Report 2011 Notes to the Consolidated Financial Statements 03 – Recently Adopted and New Accounting Pronouncements
IFRS 7 In October 2010, the IASB issued amendments to IFRS 7, “Disclosures – Transfers of Financial Assets”. The amendments comprise additional disclosures on transfer transactions of financial assets (for example, securitizations), including possible effects of any risks that may remain with the transferor of the assets. Addi-tional disclosures are also required if a disproportionate amount of transfer transactions are undertaken around the end of a reporting period. The amendments are effective for annual periods beginning on or after July 1, 2011, with earlier application permitted. The adoption of the amendments is not expected to have a material impact on the Group’s consolidated financial statements.
IAS 1 In June 2011, the IASB issued amendments to IAS 1, “Presentation of Financial Statements” to require com-panies to group together items within other comprehensive income (“OCI”) that may be reclassified to the statement of income. The amendments also reaffirm existing requirements that items in OCI and profit or loss should be presented as either a single statement or two separate statements. The amendments are effective for annual periods beginning on or after July 1, 2012, with earlier application permitted. While approved by the IASB, the amendments have yet to be endorsed by the EU. The adoption of the amendments is not expected to have a material impact on presentation of other comprehensive income in the consolidated financial state-ments.
IFRS 10, IFRS 11, IFRS 12, IAS 27 and IAS 28 In May 2011, the IASB issued IFRS 10, “Consolidated Financial Statements”, IFRS 11, “Joint Arrangements”, IFRS 12, “Disclosures of Interests in Other Entities”, a revised version of IAS 27, “Separate Financial Statements”, and a revised version of IAS 28, “Investment in Associates and Joint Ventures” which have been amended for conforming changes based on the issuance of IFRS 10 and IFRS 11.
IFRS 10 replaces IAS 27, “Consolidated and Separate Financial Statements” and SIC-12, “Consolidation – Special Purpose Entities”, and establishes a single control model that applies to all entities, including those that were previously considered special purpose entities under SIC-12. An investor controls an investee when it has both exposure to variable returns from the investee, and the ability to affect those returns through its power over the investee. The assessment of control is based on all facts and circumstances and the conclusion is reassessed if there is an indication that there are changes in facts and circumstances.
IFRS 11 supersedes IAS 31, “Interests in Joint Ventures” and SIC-13, “Jointly-controlled Entities – Non-monetary Contributions by Venturers”. IFRS 11 classifies joint arrangements as either joint operations or joint ventures and focuses on the nature of the rights and obligations of the arrangement. IFRS 11 requires the use of the equity method of accounting for joint arrangements by eliminating the option to use the proportionate consolidation method, which is not applied by the Group.
IFRS 12 requires an entity to disclose the nature, associated risks, and financial effects of interests in subsidiaries, joint arrangements, associates and unconsolidated structured entities. IFRS 12 requires more comprehensive disclosure in comparison to IAS 27 or SIC-12.

Deutsche Bank 02 – Consolidated Financial Statements 224 Financial Report 2011 Notes to the Consolidated Financial Statements 03 – Recently Adopted and New Accounting Pronouncements
Each of the standards are effective for annual periods beginning on or after January 1, 2013, with earlier application permitted as long as each of the other standards are also early applied. However, entities are permitted to include any of the disclosure requirements in IFRS 12 into their consolidated financial statements without early adopting IFRS 12. While approved by the IASB, each of the standards has yet to be endorsed by the EU. The Group is currently evaluating the potential impact that the adoption of the standards will have on its consolidated financial statements.
IAS 19 In June 2011, the IASB issued amendments to IAS 19, “Employee Benefits” (“IAS 19 R”). IAS 19 R eliminates the option for deferred recognition of all changes in the present value of the defined benefit obligation and in the fair value of plan assets (including the corridor approach which is not applied by the Group). In addition, IAS 19 R requires a net interest approach which will replace the expected return on plan assets and will en-hance the disclosure requirements for defined benefit plans. The amendments are effective for annual periods beginning on or after January 1, 2013, with earlier application permitted. While approved by the IASB, the amendments have yet to be endorsed by the EU. The Group is currently evaluating the potential impact that the adoption of the amendments will have on its consolidated financial statements.
IFRS 13 In May 2011, the IASB issued IFRS 13, “Fair Value Measurement” which establishes a single source of guid-ance for fair value measurement under IFRS. IFRS 13 provides a revised definition of fair value and guidance on how it should be applied where its use is already required or permitted by other standards within IFRS and introduces more comprehensive disclosure requirements on fair value measurement. IFRS 13 is effective for annual periods beginning on or after January 1, 2013, with earlier application permitted. While approved by the IASB, the standard has yet to be endorsed by the EU. The Group is currently evaluating the potential impact that the adoption of the standard will have on its consolidated financial statements.
IAS 32 and IFRS 7 In December 2011, the IASB issued amendments to IAS 32, “Offsetting Financial Assets and Financial Liabili-ties” (“IAS 32 R”) to clarify the requirements for offsetting financial instruments. IAS 32 R clarifies (a) the mean-ing of an entity’s current legally enforceable right of set-off; and (b) when gross settlement systems may be considered equivalent to net settlement. The amendments are effective for annual periods beginning on or after January 1, 2014, with earlier application permitted.
In December 2011, the IASB also issued amendments to IFRS 7, “Disclosures – Offsetting Financial Assets and Financial Liabilities” (“IFRS 7 R”) requiring extended disclosures to allow investors to better compare fi-nancial statements prepared in accordance with IFRS or U.S. GAAP. The amendments are effective for annual periods beginning on or after January 1, 2013, with earlier application permitted.
While approved by the IASB, each of the amendments has yet to be endorsed by the EU. The Group is cur-rently evaluating the potential impact that the adoption of the amendments will have on its consolidated finan-cial statements.

Deutsche Bank 02 – Consolidated Financial Statements 225 Financial Report 2011 Notes to the Consolidated Financial Statements 03 – Recently Adopted and New Accounting Pronouncements
IFRS 9 and IFRS 9 R IFRS 9 – In November 2009, the IASB issued IFRS 9, “Financial Instruments”, as a first step in its project to replace IAS 39, “Financial Instruments: Recognition and Measurement”. IFRS 9 introduces new requirements for how an entity should classify and measure financial assets that are in the scope of IAS 39. The standard requires all financial assets to be classified on the basis of the entity’s business model for managing the finan-cial assets, and the contractual cash flow characteristics of the financial asset. A financial asset is measured at amortized cost if two criteria are met: (a) the objective of the business model is to hold the financial asset for the collection of the contractual cash flows, and (b) the contractual cash flows under the instrument solely represent payments of principal and interest. Even if a financial asset meets the criteria to be measured at amortized cost, it can be designated at fair value through profit or loss under the fair value option, if doing so would sig-nificantly reduce or eliminate an accounting mismatch. If a financial asset does not meet the business model and contractual terms criteria to be measured at amortized cost, then it is subsequently measured at fair value. IFRS 9 also removes the requirement to separate embedded derivatives from financial asset hosts. It requires a hybrid contract with a financial asset host to be classified in its entirety at either amortized cost or fair value. IFRS 9 requires reclassifications when the entity’s business model changes, which is expected to be an infrequent occurrence; in this case, the entity is required to reclassify affected financial assets pro-spectively. There is specific guidance for contractually linked instruments that create concentrations of credit risk, which is often the case with investment tranches in a securitization. In addition to assessing the instru-ment itself against the IFRS 9 classification criteria, management should also “look through” to the underlying pool of instruments that generate cash flows to assess their characteristics. To qualify for amortized cost, the investment must have equal or lower credit risk than the weighted-average credit risk in the underlying pool of instruments, and those instruments must meet certain criteria. If a “look through” is impracticable, the tranche must be classified at fair value through profit or loss. Under IFRS 9, all equity investments should be measured at fair value. However, management has an option to present in other comprehensive income unrealized and realized fair value gains and losses on equity investments that are not held for trading. Such designation is available on initial recognition on an instrument-by-instrument basis and is irrevocable. There is no subsequent recycling of fair value gains and losses to profit or loss; however, dividends from such investments will continue to be recognized in profit or loss.
IFRS 9 R – In October 2010, the IASB issued a revised version of IFRS 9, “Financial Instruments” (“IFRS 9 R”). The revised standard adds guidance on the classification and measurement of financial liabilities. IFRS 9 R requires entities with financial liabilities designated at fair value through profit or loss to recognize changes in the fair value due to changes in the liability’s credit risk in other comprehensive income. However, if recogniz-ing these changes in other comprehensive income creates an accounting mismatch, an entity would present the entire change in fair value within profit or loss. There is no subsequent recycling of the amounts recorded in other comprehensive income to profit or loss, but accumulated gains or losses may be transferred within equity.
Deutsche Bank 02 – Consolidated Financial Statements 226 Financial Report 2011 Notes to the Consolidated Financial Statements 04 – Acquisitions and Dispositions
Based on the amendments to IFRS 9, IFRS 9 R and IFRS 7, “Mandatory Effective Date and Transition Guid-ance” issued by the IASB in December 2011, IFRS 9 and IFRS 9 R are effective for annual periods beginning on or after January 1, 2015, with earlier application permitted. Once adopted, IFRS 9 should be applied to all financial instruments outstanding as of the effective date, as if the classification and measurement under IFRS 9 had always applied, but comparative periods do not need to be restated.
For annual periods beginning before January 1, 2015, an entity may elect to apply either IFRS 9 or IFRS 9 R. While approved by the IASB, both IFRS 9 and IFRS 9 R have yet to be endorsed by the EU.
In November 2011, the IASB tentatively decided to consider making limited modifications to IFRS 9 and IFRS 9 R. It is unclear at this time what modifications will actually be adopted or if this could impact the effective date and EU endorsement.
04 – Acquisitions and Dispositions
The following business combinations which have been effected since 2010 are accounted for in accordance with the revised IFRS 3 R, “Business Combinations”, which the Group adopted as of January 1, 2010. Accordingly, disclosures provided for these transactions are made on the basis of IFRS 3 R. However, both the accounting applied as well as disclosures provided for business combinations, which were effected prior to January 1, 2010, remain under the governance of the predecessor standard IFRS 3 (2004).
Business Combinations completed in 2011 In 2011, the Group completed several acquisitions that were accounted for as business combinations. Of these transactions, none were individually significant and they are therefore presented in the aggregate. The follow-ing table summarizes the aggregated fair value amounts related to these business combinations.

Deutsche Bank 02 – Consolidated Financial Statements 227 Financial Report 2011 Notes to the Consolidated Financial Statements 04 – Acquisitions and Dispositions
Preliminary Fair Value of Assets Acquired and Liabilities Assumed as of the Acquisition Date in € m.
Cash consideration transferred 13 Fair value of call option held to acquire outstanding interests 10 Fair value of contingent consideration 3 Fair value of pre-existing stakes 12 Total purchase consideration, including fair value of the Group’s equity interest held before the business combination 38
Recognized amounts of identifiable assets acquired and liabilities assumed:
1 Cash and cash equivalents 1 Interest-earning time deposits with banks 2 Financial assets at fair value through profit or loss 2 All other assets 21 Long-term debt 10 All other liabilities 2 Total identifiable net assets 14
Goodwill 25 Negative goodwill 1
Total identifiable net assets and goodwill acquired, less negative goodwill 38 1 By major class of assets acquired and liabilities assumed.
Among these transactions is the step-acquisition of the outstanding interests in Deutsche UFG Capital Man-agement (“DUCM”), one of Russia’s largest independent asset management companies. The transaction closed on November 11, 2011, following the exercise of a purchase option on the remaining 60 % stake. DUCM was allocated to the Corporate Division Asset and Wealth Management.
Since acquisition, the aggregated contribution in 2011 to the Group’s net revenues and net profit or loss after tax related to these businesses amounted to € 2 million and less than € (1) million, respectively. Had these acquisitions all been effective on January 1, 2011, their impact on the Group’s net revenues and net profit or loss after tax for 2011 would have amounted to € 4 million and less than € (1) million, respectively.
Business Combinations completed in 2010 Deutsche Postbank Following the successful conclusion of the voluntary public takeover offer (“PTO”) by Deutsche Bank to the shareholders of Deutsche Postbank AG (“Postbank”), the PTO settled on December 3, 2010 (“closing date”). Together with Postbank shares already held before the PTO, the Group gained control by holding 113.7 million Postbank shares, equal to 51.98 % of all voting rights in Postbank. Accordingly, the Group commenced con-solidation of Postbank Group as of December 3, 2010. Taking into account certain financial instruments on Postbank shares held by the Group prior to the closing, as of December 3, 2010, the consolidation of Postbank was based on a total equity interest of 79.40 %.

Deutsche Bank 02 – Consolidated Financial Statements 228 Financial Report 2011 Notes to the Consolidated Financial Statements 04 – Acquisitions and Dispositions
The following paragraphs provide detailed disclosures on the Postbank acquisition, specifically: a description of Postbank’s business activities and the expected impact from their integration on the Group; the takeover offer; the Deutsche Bank capital increase; the treatment of the Group’s equity investment and other financial instruments on Postbank shares held at the closing date; a proposed domination and profit and loss transfer agreement with Postbank; the purchase price allocation and other acquisition-related information.
Description of Postbank’s business activities and the expected impact from their integration on the Group. Postbank Group is one of the major providers of banking and other financial services in Germany. Its business activities comprise retail banking, business with corporate customers, capital markets activities as well as home savings loans (via the BHW Group which is part of the Postbank Group). In its Transaction Banking division, Postbank offers back office services for other financial services providers. Its business focuses on Germany and is complemented by selected engagements, principally in Western Europe and North America.
The Group’s Management Agenda Phase 4 provides for a focus on core businesses in the Private Clients and Asset Management (PCAM) Group Division and home market leadership. In this context, the majority share-holding in Postbank further strengthens the PCAM Group Division, in particular the Private & Business Cli-ents (PBC) Corporate Division, and enables the Group to strengthen and expand its leading position in the German home market. The combination of Deutsche Bank and Postbank offers significant cost and revenue synergy potential and growth opportunities. Furthermore, the inclusion of Postbank businesses in the Group’s consolidated results increased the level of retail banking earnings and strengthened and diversified the Group’s refinancing basis due to the increased volumes in retail customer deposits.
Takeover Offer. The price per Postbank share offered in the PTO amounted to € 25.00. The acceptance period under the PTO commenced with the publication of the offer document on October 7, 2010 and ended with expiry of the additional acceptance period on November 24, 2010. The offer was accepted for 48.2 million Postbank shares, corresponding to 22.03 % of the Postbank share capital and voting rights. Therefore, the total cash consideration paid on December 3, 2010 for the Postbank shares acquired in the PTO amounted to € 1,205 million.
Deutsche Bank announced on November 30, 2010 that it had sold 0.5 million Postbank shares and on December 3, 2010 that it had sold a further 3.9 million Postbank shares both to a third party for a consideration of € 23.96 and € 21.75 per Postbank share, respectively. The sale, which was intended to avoid a delayed completion of the PTO that would have resulted from U.S. merger control proceedings, led to an intermediate legal shareholding of less than 50 % in Postbank. Along with the sale, Deutsche Bank concluded forward purchase contracts corresponding to the aforementioned number of Postbank shares with this third party for a cash consideration of € 23.96 and € 21.75 per Postbank share, respectively, plus a transaction fee of approxi-mately € 0.03 and € 0.015 per share, respectively. The forward purchase contracts settled on December 10, 2010, following satisfaction of U.S. antitrust review and bank regulatory approval requirements. As a result, the Group increased its shareholding in Postbank to 51.98 % (equal to 113.7 million Postbank shares), the ultimate level achieved through the PTO. Although the shares had been legally sold to a third party, the Group retained the risks and rewards of those shares. It was deemed to be virtually certain that U.S. antitrust approval would be obtained so that the potential voting rights from those shares were included in the consolidation analysis for financial reporting purposes. Accordingly, the date of acquisition of the Postbank Group was determined as December 3, 2010.

Deutsche Bank 02 – Consolidated Financial Statements 229 Financial Report 2011 Notes to the Consolidated Financial Statements 04 – Acquisitions and Dispositions
Capital Increase of Deutsche Bank. In close coordination with the PTO, Deutsche Bank also implemented a capital increase from authorized capital against cash contributions. The capital increase was completed on October 6, 2010. In total, 308.6 million new registered no-par value shares (common shares) were issued, resulting in gross proceeds of € 10.2 billion. The net proceeds of € 10.1 billion raised from the issuance (after expenses of about € 0.1 billion net of tax) were primarily intended to cover the capital consumption from the con-solidation of the Postbank Group, and, in addition, to support the existing capital base.
Treatment of the Group’s equity investment and other financial instruments on Postbank held at the closing date. Prior to obtaining control, the Group directly held 29.95 % of the shares and voting rights of Postbank, giving it the ability to significantly influence Postbank’s financial and operating policies. Accordingly, this investment was accounted for using the equity method.
In addition, the Group had subscribed to a mandatory exchangeable bond (“MEB”) issued by Deutsche Post. The MEB was acquired by Deutsche Bank in February 2009 as part of a wider acquisition agreement with Deutsche Post regarding Postbank shares. According to the acquisition agreement, the MEB was to be fully exchanged in 2012 for 60 million Postbank shares, or a 27.42 % stake. For accounting purposes, the MEB constituted an equity investment with risk and reward characteristics substantially similar to an ownership inter-est in the Postbank shares and therefore was included as part of the equity method investment. Upon recogni-tion of the MEB, the equity method investment also contained an embedded derivative related to a profit sharing agreement with Deutsche Post on Deutsche Bank shares issued which were received as consideration by Deutsche Post. The embedded derivative was bifurcated as the risks and rewards from the profit sharing were not clearly and closely related to the host contract. The initial fair value of the embedded derivative was € 201 million which reduced the cost of the equity method investment in Postbank. Subsequent changes in the fair value of the options were reflected in profit or loss. The final value of the receivable arising from the embedded derivative, which was no longer remeasured since Deutsche Post sold all Deutsche Bank shares received as consideration for the initial acquisition of 50 million Postbank shares, amounted to € 677 million. The receivable was reported separately in other assets and, upon maturity of the MEB in February 2012, was offset with the corresponding collateral received (liability).
During the third quarter 2010, the carrying amount of the equity method investment had been adjusted for a charge of approximately € 2.3 billion recognized in the Group’s income statement within the line item “Net in-come (loss) from equity method investments”. Since the Group had a clearly documented intention to gain control over Postbank and to commence consolidation in the fourth quarter 2010, this had to be reflected in the determination of the value in use of the equity method investment. Therefore, the charge had been determined based on the carrying amount of the Group’s equity method investment in Postbank as of September 30, 2010 and an assumed fair value of the Postbank shares equal to the price of € 25.00 offered by Deutsche Bank in the PTO. This charge was allocated to the Corporate Investments Group Division.

Deutsche Bank 02 – Consolidated Financial Statements 230 Financial Report 2011 Notes to the Consolidated Financial Statements 04 – Acquisitions and Dispositions
On December 3, 2010, the date when control over Postbank was obtained, the Group remeasured to fair value its existing equity method investment in Postbank in accordance with IFRS 3 R. The fair value of the equity method investment was determined on the basis of the offer price of € 25.00, totaling an acquisition-date fair value of € 3,139 million. Considering the net share of profits attributable to the existing Postbank investment in the fourth quarter 2010, the balance of the equity method investment had increased by approximately € 22 million. Accordingly, as of the closing date the remeasurement resulted in a corresponding loss of € 22 mil-lion recognized in the Group’s income statement of the fourth quarter 2010 within the line item “Net income (loss) from equity method investments”. In accordance with IFRS 3 R, net losses recognized in other comprehensive income of € 6 million attributable to the Group’s equity method investment in Postbank up to the closing date have been reclassified to the Group’s income statement of the fourth quarter 2010. These effects were allo-cated to the Corporate Investments Group Division.
Along with the MEB, Deutsche Bank and Deutsche Post had also entered into put and call options for another 26.4 million Postbank shares held by Deutsche Post (12.07 % stake) which were exercisable between Febru-ary 2012 and February 2013. The put and call options were reported as a derivative financial instrument measured at fair value through profit or loss.
Upon consolidation, the put and call option structure with Deutsche Post on Postbank shares was reclassified to an equity instrument due to the fact that it became a physically settled derivative on shares in a consolidated subsidiary settled for a fixed amount of cash. Therefore, its fair value of € 560 million (derivative liability) was reclassified into equity (additional paid-in capital). Correspondingly, for the respective shares under the put and call option structure, a liability was recognized at the present value of the expected purchase price, due to the requirement to purchase these shares under the put option agreement. The liability to purchase of € 1,286 million was recognized with a corresponding debit to equity (additional paid-in capital).
The following table summarizes the direct shareholdings and the MEB held by the Group in Postbank as well as the noncontrolling interests as of the acquisition date.
Number of Postbank shares (in million)
Stake in %
Direct shareholding in Postbank before the PTO 65.5 29.95 Shares acquired in PTO 48.2 22.03 Total direct ownership 113.7 51.98
MEB 60.0 27.42 Total Group equity interest 173.7 79.40
Noncontrolling interests in Postbank 45.1 20.60
Total Postbank shares 218.8 100.00
Following the acquisition, the Group extended its direct ownership interest in Postbank through additional share purchases in the market to 53.14 % at year-end 2011. Please refer to subsection “Acquisitions and Dis-positions of Noncontrolling Interests while Retaining Control” in this Note for information on related changes in the Group’s ownership interests.

Deutsche Bank 02 – Consolidated Financial Statements 231 Financial Report 2011 Notes to the Consolidated Financial Statements 04 – Acquisitions and Dispositions
With the subsequent conversion of the MEB on February 27, 2012, the Group further increased its direct inter-est in Postbank by 60 million shares or 27.42 ppt. Because the MEB had already been considered as an equity investment in the first place, its conversion did not result in any change in the Group’s consolidated Postbank stake and therefore had no impact on the Group’s total equity and profit or loss. With exercise of Deutsche Post’s put option on February 28, 2012, the Group’s direct interest and consolidated stake in Postbank further increased by 26.4 million shares or 12.07 ppt. Upon exercise, the recognized liability to purchase Postbank shares was settled. The exercise of the option did not have a material impact on the Group’s total equity. As of February 28, 2012 and along with additional shares acquired after the reporting date, Deutsche Bank in-creased its total direct ownership in Postbank to 93.7 %.
Domination and profit and loss transfer agreement. Subsequent to the acquisition, in January 2012, the Group announced the beginning of negotiations with Postbank on a domination and profit and loss transfer agreement according to Section 291 of the German Stock Corporation Act. Such agreements are commonly used in Ger-man corporate practice to, amongst others, enhance control and allow for tax grouping. Parties to this agree-ment are DB Finanzholding GmbH (a wholly-owned subsidiary of Deutsche Bank) as controlling company, and Postbank as dependent company. It is expected that the agreement will be finalized by the end of March 2012. To come into force, the domination and profit and loss transfer agreement would require approval at the Annual General Meeting of Postbank on June 5, 2012 and entry into the Commercial Register of Postbank. Once concluded and effective, minority shareholders of Postbank will receive compensation payments or, at their choice, a settlement payment which will be determined in the domination and profit and loss transfer agree-ment.
Purchase Price Allocation and Other Acquisition-related Information. Due to closing of the acquisition shortly before year-end 2010 and given its complexity, the initial acquisition accounting for Postbank had not been finalized at December 31, 2010. In completing the acquisition accounting in the fourth quarter 2011, the “Purchase Price Allocation and Other Acquisition-related Information” as of the closing date, which were pre-viously disclosed for Postbank, have been updated to reflect adjustments existing at the acquisition date and identified during the measurement period under IFRS 3 R.
The following table summarizes the final acquisition-date status of the consideration transferred and the fair value of the Postbank equity method investment held before the business combination. In considering certain adjustments made during the measurement period, it also details, as of December 3, 2010, the final fair value amounts of assets acquired and liabilities assumed for the Postbank Group, a noncontrolling interest and goodwill acquired in the business combination. The measurement period adjustments reflected refinements of the initial fair value of certain assets acquired and liabilities assumed. They are based on facts and circum-stances existing as of the acquisition date and did not result from intervening events subsequent to the acquisi-tion date. The adjustments were mainly a result of updated information considered on expected cash flows and parameters used for the valuation of the acquired loan portfolio as well as for long-term debt assumed, refined parameters applied in the intangible asset valuation and the finalization of the fair valuation of the derivatives portfolio, with the latter resulting in a nearly proportional increase of financial assets and liabilities at fair value through profit or loss.

Deutsche Bank 02 – Consolidated Financial Statements 232 Financial Report 2011 Notes to the Consolidated Financial Statements 04 – Acquisitions and Dispositions
Fair Value of Assets Acquired and Liabilities Assumed as of the Acquisition Date
in € m. Provisional Amounts
1
Measurement Period Adjustments
Final Amounts
Consideration transferred
Cash consideration transferred for PTO settlement 1,205 − 1,205 Deduction for settlement of pre-existing relationship 176 (73) 103 Net consideration transferred 1,029 73 1,102
Fair value of the Group’s equity interests in Postbank held before the business combination Equity method investment (excluding embedded derivative)
2 3,139 − 3,139
Total purchase consideration 4,168 73 4,241
Recognized amounts of identifiable assets acquired and liabilities assumed
3 Cash and cash equivalents 8,752 − 8,752 Financial assets at fair value through profit or loss 36,961 850 37,811 Financial assets available for sale 33,716 16 33,732 Loans 129,300 577 129,877 Intangible assets 1,557 (200) 1,357 All other assets 27,840 (52) 27,788 Deposits 139,859 − 139,859 Financial liabilities at fair value through profit or loss 31,983 857 32,840 Long-term debt 38,577 754 39,331 All other liabilities 24,813 (363) 24,450 Total identifiable net assets 2,894 (57) 2,837
Noncontrolling interest in Postbank 599 (12) 587 Deduction for settlement of pre-existing relationship 176 (73) 103 Total identifiable net assets attributable to Deutsche Bank shareholders 2,119 28 2,147
Goodwill acquired by the Group 2,049 45 2,094
Total identifiable net assets and goodwill acquired attributable to Deutsche Bank shareholders 4,168 73 4,241 1 Provisional amounts as previously reported in Note 04 “Acquisitions and Dispositions” of Deutsche Bank’s 2010 report. 2 Included a 29.95 % direct shareholding and the MEB which were both accounted for under the equity method. 3 By major class of assets acquired and liabilities assumed.
In finalizing the purchase price allocation during the measurement period, the Group reduced the initial acquisi-tion-date fair values of Postbank’s net assets by € 57 million. The net decrease mainly related to measurement period adjustments made to the acquisition-date fair values of derivative financial instruments classified as financial assets and liabilities at fair value through profit or loss, certain liabilities classified as long-term debt, the acquired loan and securities portfolio and separately identified intangible assets. Accordingly, the initial amount of goodwill recognized at December 31, 2010 of € 2,049 million increased by € 45 million to € 2,094 million and the noncontrolling interest in Postbank was reduced by € 12 million. During 2011 and in connection with these adjustments, the Group recorded income before income taxes of € 6 million.
Deutsche Bank 02 – Consolidated Financial Statements 233 Financial Report 2011 Notes to the Consolidated Financial Statements 04 – Acquisitions and Dispositions
The following table provides information about major classes of receivables that were acquired from Postbank on December 3, 2010 and that the Group classified as loans as of the acquisition date.
in € m.
Contractually required cash flows including interest (undiscounted) 153,499 Less: Best estimate at the acquisition date of such contractual cash flows not expected to be collected 3,370
Cash flows expected to be collected
1 150,129 1 Represents undiscounted expected principal and interest cash flows upon acquisition.
The acquisition-date fair value corresponding to these acquired receivables as derived by the Group amounted to € 129.9 billion, comprising both loans and advances to customers and to banks. This amount also includes investment securities which the Group classified as loans with a fair value of € 22.5 billion.
As part of the final purchase price allocation, the Group recognized intangible assets of approximately € 1.4 billion included in the fair value of identifiable net assets acquired. These amounts represented both intangible assets included in the balance sheet of Postbank as well as those intangible assets which were ultimately identified in the purchase price allocation. The intangible assets mainly comprise customer relation-ships (€ 588 million), the Postbank trademark (€ 411 million) as well as software (€ 282 million).
Goodwill arising from the acquisition of Postbank was determined under the proportionate interest approach (“partial goodwill method”) pursuant to IFRS 3 R. The goodwill largely reflects the value from revenue and cost synergies expected from the acquisition of Postbank. The goodwill, which has been fully assigned to PBC, is not deductible for tax purposes.
Included in all other liabilities of the opening balance sheet is the acquisition-date fair value of contingent liabili-ties recognized for certain obligations identified in the purchase price allocation. Their aggregated final amount totaled € 109 million, compared to the initial amount of € 110 million recorded at year-end 2010. The timing and actual amount of outflow are uncertain. It is expected that the majority of the liabilities will be settled over the next four years. During 2011 and in relation to a settlement, the respective obligation was reduced and therefore an amount of € 66 million of these contingent liabilities was reversed to the income statement. The Group continues to analyze the development of these obligations and the potential timing of outflows.
The noncontrolling interests of € 587 million presented in the table of fair value of assets acquired and liabilities assumed above were determined at their proportionate share of Postbank’s identifiable net assets (“partial goodwill method”) measured at fair value as of the closing date.

Deutsche Bank 02 – Consolidated Financial Statements 234 Financial Report 2011 Notes to the Consolidated Financial Statements 04 – Acquisitions and Dispositions
Before the business combination, Deutsche Bank and Postbank were parties to certain transactions considered as pre-existing relationships. Among these transactions were various financial instruments included in the course of the parties’ regular interbank and hedging activities, certain bonds issued by the Group or by Postbank which were held by the other party and specific payment services provided to the Group by Post-bank. All of these instruments were eliminated upon consolidation of Postbank. The aggregated acquisition-date fair value of the financial instruments totaled € 103 million, which was considered as a deduction in the determination of the consideration transferred and its allocation to Postbank’s net assets acquired. The set-tlement of certain of these financial instruments issued by Deutsche Bank and held by Postbank resulted in an extinguishment loss of € 1 million, which was included in other income of the Group’s consolidated income statement of the fourth quarter 2010.
In addition, the Group and Postbank are parties to a comprehensive, mutually beneficial cooperation agree-ment. The agreement was entered into in 2008 in context of the acquisition of a noncontrolling interest in Post-bank and encompassed financing and investment products, business banking and commercial loans as well as customer-oriented services. The agreement also covered areas such as sourcing and IT-infrastructure.
Acquisition-related costs borne by the Group as the acquirer amounted to € 12 million which were recognized in general and administrative expenses in the Group’s income statement for 2010.
For the year 2011, Postbank contributed net revenues and net income after tax (including amortization of fair value adjustments from the final purchase price allocation) of € 4.8 billion and € 798 million, respectively, to the Group’s income statement. Refinements relating to the amortization of the initial fair value adjustments from the purchase price allocation resulted in income before income taxes of € 166 million recorded in 2011. Net reve-nues contributed in 2011 included impairment charges of € 465 million related to Greek government bonds, which resulted in a negative € 326 million impact on net income after tax.
Following consolidation commencing on December 3, 2010, for the year 2010 Postbank had contributed net revenues and net income after tax (including amortization of fair value adjustments from the purchase price allocation) of € 423 million and € 62 million, respectively, to the Group’s income statement. Considering certain transaction and integration costs of € 48 million recorded on the Group level, the Postbank consolidation im-pact on PBC’s income before income taxes attributable to DB shareholders in 2010 had amounted to € 30 million.
If consolidation had been effective as of January 1, 2010, Postbank’s pro-forma contribution to the Group’s net revenues and net income after tax in 2010 would have been € 3.8 billion and € 138 million, respectively. This pro-forma performance information was determined on the basis of Postbank’s stand-alone results for the year 2010 and did not include any notional amortization of fair value adjustments from the purchase price alloca-tion for the period January 1, 2010 through December 31, 2010, any consolidation adjustments or the re-valuation charge which the Group had actually recorded in the third and fourth quarter of 2010 on its previous equity method investment in Postbank.

Deutsche Bank 02 – Consolidated Financial Statements 235 Financial Report 2011 Notes to the Consolidated Financial Statements 04 – Acquisitions and Dispositions
ABN AMRO On April 1, 2010, Deutsche Bank completed the acquisition of parts of ABN AMRO Bank N.V.’s (“ABN AMRO”) commercial banking activities in the Netherlands for an initial consideration of € 700 million paid in cash in the second quarter 2010. The amount of the consideration was reduced in the fourth quarter 2010 by € 13 million to € 687 million, following preliminary adjustments made to the closing balance sheet of the acquired busi-nesses. The closing of the acquisition followed the approval by the European Commission (EC) and other regulatory bodies. As of the closing date, Deutsche Bank obtained control over the acquired businesses and accordingly commenced consolidation in the second quarter 2010. The acquisition is a key element in Deutsche Bank’s strategy of further expanding its GTB and PCAM businesses.
The acquisition included 100 % of the voting equity interests in the acquired businesses and encompassed the following activities:
— two corporate client units in Amsterdam and Eindhoven, serving large corporate clients, — 13 commercial branches that serve small and medium-sized enterprises, — Rotterdam-based bank Hollandsche Bank Unie N.V. (“HBU”), and — IFN Finance B.V., the Dutch part of ABN AMRO’s factoring unit IFN Group.
The two corporate client units, the 13 branches and HBU were included in a separate legal entity prior to the acquisition which was renamed as Deutsche Bank Nederland N.V. immediately after the acquisition. Both Deutsche Bank Nederland N.V. and IFN Finance B.V. have become direct subsidiaries of Deutsche Bank. The acquired businesses are using the Deutsche Bank brand name and are part of the Group’s Global Transaction Banking Corporate Division.
At year-end 2010, the initial acquisition accounting for the business combination had not been finalized, in particular pending the finalization of fair value adjustments for certain parts of the opening balance sheet of the acquired businesses. The allocation of the consideration transferred to the acquisition-date fair value of net assets acquired had resulted in preliminary negative goodwill of € 216 million which was recognized in the Group’s income statement for 2010. The main reason that had led to the recognition of negative goodwill was the divestiture of parts of ABN AMRO’s Dutch commercial banking business and factoring services as required by the EC, following the acquisition of ABN AMRO Holding N.V. by a consortium of The Royal Bank of Scotland, Fortis Bank and Banco Santander in October 2007. The gain recognized was tax-exempt.
Finalization of the initial acquisition accounting for the business combination in the first quarter 2011 resulted in a reduction of € 24 million in the acquisition-date fair value of net assets acquired. Accordingly, the preliminary negative goodwill of € 216 million was reduced to € 192 million. Pursuant to IFRS 3, the finalization of the pur-chase price allocation had to be applied retrospectively as of the acquisition date. Therefore, retained earnings as of December 31, 2010 were reduced by € 24 million.

Deutsche Bank 02 – Consolidated Financial Statements 236 Financial Report 2011 Notes to the Consolidated Financial Statements 04 – Acquisitions and Dispositions
The final summary computation of the consideration transferred and its allocation to net assets acquired as of the acquisition date is presented below.
Fair Value of Assets Acquired and Liabilities Assumed as of the Acquisition Date in € m.
Consideration transferred
Cash consideration transferred 700 Purchase price adjustment (13)
Total purchase consideration 687
Recognized amounts of identifiable assets acquired and liabilities assumed
1 Cash and cash equivalents 113 Interest-earning time deposits with banks 71 Financial assets at fair value through profit or loss 779 Loans 9,802 Intangible assets 168 All other assets 810 Deposits 8,211 Financial liabilities at fair value through profit or loss 895 All other liabilities 1,758 Total identifiable net assets 879
Negative goodwill 192
Total identifiable net assets acquired, less negative goodwill 687 1 By major class of assets acquired and liabilities assumed.
As part of the purchase price allocation, customer relationships of € 168 million were identified as amortizing intangible assets. Furthermore, under the terms and conditions of the acquisition, ABN AMRO is providing initial credit risk coverage for 75 % of ultimate credit losses of the acquired loan portfolio (excluding IFN Fi-nance B.V.). The maximum credit risk coverage is capped at 10 % of the portfolio volume. As of the acquisition date, the fair value of the guarantee totaled € 544 million, which is amortized over the expected average life-time of the underlying portfolio.
The following table provides information about financial assets that were acquired from ABN AMRO on April 1, 2010 and that the Group classified as loans as of the acquisition date.
in € m.
Contractually required cash flows including interest (undiscounted) 11,503 Less: Best estimate at the acquisition date of such contractual cash flows not expected to be collected 245
Cash flows expected to be collected
1 11,258 1 Represents undiscounted expected principal and interest cash flows upon acquisition.
In respect of acquisition-related costs, € 15 million were recognized in general and administrative expenses in the Group’s income statement for 2010, and € 8 million were incurred and recognized in 2009 and 2008.
For the year 2011, ABN AMRO accounted for net revenues and a net loss after tax of € 554 million and € 153 million, respectively, in the Group’s income statement. This included the amortization of fair value adjust-ments from the purchase price allocation and an adjustment to the amortization of the upfront premium in-cluded in the purchase consideration representing credit protection to be provided by the seller. The latter adjustment was reflected in noninterest expenses and included charges of € 53 million related to the year 2010 (within segment reporting assigned to C&A) and € 34 million related to the first half of 2011 (in segment report-ing recorded in GTB). The respective amortization expense for the second half of 2011 amounted to € 88 mil-lion.

Deutsche Bank 02 – Consolidated Financial Statements 237 Financial Report 2011 Notes to the Consolidated Financial Statements 04 – Acquisitions and Dispositions
Since the acquisition and excluding the above gain recognized from negative goodwill, for the year 2010 the acquired businesses contributed net revenues and net income after tax of € 405 million and € 35 million, re-spectively, to the Group’s income statement. If the acquisition had been effective as of January 1, 2010, the effect on the Group’s net revenues and net income after tax in 2010 (excluding the above mentioned gain from negative goodwill) would have been € 501 million and € 77 million, respectively.
Sal. Oppenheim On March 15, 2010, Deutsche Bank closed the acquisition of 100 % of the voting equity interests in Luxem-bourg-based Sal. Oppenheim jr. & Cie. S.C.A. (“Sal. Oppenheim S.C.A.”), the holding company of the Sal. Op-penheim Group, for a total purchase price of € 1,261 million paid in cash. Of the purchase price, € 275 million was paid for BHF Asset Servicing GmbH (“BAS”), which, at the date of acquisition, had already been classified as asset held for sale and therefore was treated as a separate transaction distinct from the remaining Sal. Oppenheim Group. As all significant legal and regulatory approvals had been obtained by January 29, 2010, the date of acquisition was set at that date and, accordingly, the Group commenced consolidation of Sal. Oppenheim in the first quarter 2010. As of the reporting date, the acquisition-date fair value of the total con-sideration transferred for the Sal. Oppenheim Group and BAS amounted to € 1,261 million. According to the framework agreement reached in the fourth quarter 2009, the former shareholders of Sal. Oppenheim S.C.A. have the option of acquiring a long-term shareholding of up to 20 % in the German subsidiary Sal. Oppenheim jr. & Cie. AG & Co. KGaA. As of the reporting date, the acquisition-date fair value of the option is zero.
The acquisition enables the Group to strengthen its Asset and Wealth Management activities among high-net-worth private clients, family offices and trusts in Europe and especially in Germany. Sal. Oppenheim Group’s independent wealth management activities are being expanded under the established brand name of the tradi-tional private bank, while preserving its private bank character. Its integrated asset management concept for private and institutional clients is to be retained.
As a result of the acquisition, the Group obtained control over Sal. Oppenheim S.C.A., which subsequently became a wholly-owned subsidiary of Deutsche Bank. All Sal. Oppenheim Group operations, including all of its asset and wealth management activities, the investment bank, BHF-BANK Group (“BHF-BANK”), BAS and the private equity fund of funds business managed in the separate holding Sal. Oppenheim Private Equity Partners S.A. were transferred to Deutsche Bank. Upon the acquisition, all of the Sal. Oppenheim Group businesses were integrated into the Group’s Asset and Wealth Management Corporate Division, except that BHF-BANK and BAS initially became part of the Corporate Investments Group Division. During the second quarter 2010, BHF-BANK and BAS were also transferred to the Corporate Division Asset and Wealth Management. For information on the subsequent business designation of BHF-BANK in 2011, please refer to Note 05 “Business Segments and Related Information”.
The sale of BAS to Bank of New York Mellon was consummated in August 2010. Also, as part of the Sal. Op-penheim Group, the Group acquired Services Généraux de Gestion S.A. and its subsidiaries, which were on-sold in the first quarter 2010. Over the course of the year 2010, Sal. Oppenheim Group discontinued most of its investment banking activities via sale or wind-down. The Equity Trading & Derivatives and Capital Markets Sales and Research units were acquired by Australia’s Macquarie Group in the second quarter 2010. In De-cember 2010, Deutsche Bank had announced exclusive negotiations with Liechtenstein’s LGT Group concern-ing the contemplated sale of BHF-BANK. Accordingly, the Group had classified BHF-BANK as a disposal group held for sale as of December 31, 2010. For information on the further development in 2011, please also refer to Note 25 “Non-Current Assets and Disposal Groups Held for Sale”.

Deutsche Bank 02 – Consolidated Financial Statements 238 Financial Report 2011 Notes to the Consolidated Financial Statements 04 – Acquisitions and Dispositions
As of the reporting date, the acquisition-date fair value of the total consideration transferred for the Sal. Op-penheim Group and BAS was € 1,261 million. According to the framework agreement reached with the former shareholders of Sal. Oppenheim S.C.A., the purchase price might increase by up to € 476 million net payable in 2015, provided that certain risk positions (in particular legal and credit risk) do not materialize through 2015. As of the reporting date, the fair value estimate of the contingent consideration is zero.
The final fair value amounts recognized for the Sal. Oppenheim Group (excluding BAS) as of the acquisition date were as follows:
Fair Value of Assets Acquired and Liabilities Assumed as of the Acquisition Date in € m.
Consideration transferred
Cash consideration transferred 986 Fair value of contingent consideration −
Total purchase consideration 986
Recognized amounts of identifiable assets acquired and liabilities assumed
1 Cash and cash equivalents 2,638 Interest-earning time deposits with banks 3,298 Central bank funds sold and securities purchased under resale agreements 889 Financial assets at fair value through profit or loss 6,626 Financial assets available for sale 6,174 Loans 5,609 Intangible assets 162 Assets classified as held for sale 1,884 All other assets 2,677 Deposits 18,461 Central bank funds purchased and securities sold under repurchase agreements 796 Financial liabilities at fair value through profit or loss 5,443 Long-term debt 1,737 Liabilities classified as held for sale 1,836 All other liabilities 1,534 Total identifiable net assets 150
Noncontrolling interests in Sal. Oppenheim Group 8 Total identifiable net assets attributable to Deutsche Bank shareholders 142
Goodwill 844
Total identifiable net assets and goodwill acquired attributable to Deutsche Bank shareholders 986 1 By major class of assets acquired and liabilities assumed.
The acquisition resulted in the recognition of goodwill of € 844 million which largely consists of synergies ex-pected by combining certain operations in the asset and wealth management areas as well as an increased market presence in these businesses in Germany, Luxembourg, Switzerland and Austria. The goodwill is not deductible for tax purposes. Intangible assets included in the identifiable net assets acquired mainly represent software, customer relationships and the Sal. Oppenheim trademark. As part of the purchase price allocation, Deutsche Bank recognized a contingent liability of € 251 million for a large population of items relating to cer-tain businesses acquired from Sal. Oppenheim Group. The timing and actual amount of outflow are uncertain. It is expected that these obligations will be settled over the next four years. The Group continues to analyze the risks and the potential timing of outflows.

Deutsche Bank 02 – Consolidated Financial Statements 239 Financial Report 2011 Notes to the Consolidated Financial Statements 04 – Acquisitions and Dispositions
The following table provides information about financial assets that were acquired from Sal. Oppenheim and that the Group classified as loans as of the acquisition date.
in € m.
Contractually required cash flows including interest (undiscounted) 6,940 Less: Best estimate at the acquisition date of such contractual cash flows not expected to be collected 1,187
Cash flows expected to be collected
1 5,753 1 Represents undiscounted expected principal and interest cash flows upon acquisition.
Following the acquisition but on the date of closing, Deutsche Bank made a capital injection of € 195 million into the new subsidiary Sal. Oppenheim S.C.A. This amount does not form part of the purchase consideration and accordingly is not included in the aforementioned goodwill calculation.
In respect of acquisition-related costs, € 2 million were recognized in general and administrative expenses in the Group’s income statement for 2010. In addition, € 11 million were incurred and recognized in 2009.
Following the acquisition, for the year 2010 the Sal. Oppenheim Group (excluding BAS) contributed net reve-nues and a net loss after tax of € 568 million and € 308 million, respectively, to the Group’s income statement. If the acquisition had been effective as of January 1, 2010, the contribution to the Group’s net revenues and net income in 2010 would have been € 599 million and a loss of € 336 million, respectively.
Other Business Combinations completed in 2010 Other business combinations, not being individually material, which were finalized in 2010, included the step-acquisition of an additional 47.5 % interest in an existing associate domiciled in the Philippines. The acquisition resulted in a controlling ownership interest of 95 % and the consolidation of the investment in the first quarter 2010. The total consideration of € 6 million paid in cash was allocated to net assets acquired (including liabilities assumed) of € 10 million, resulting in negative goodwill of € 4 million which was recognized in other income in the Group’s income statement of the first quarter 2010. The investment was integrated into CB&S.
Also in 2010, the Group acquired 100 % of the voting rights of a U.S. based investment advisor company for a total consideration of € 2 million which was fully allocated to goodwill. Consolidation of the company commenced in the fourth quarter 2010. The investment was integrated into CB&S.

Deutsche Bank 02 – Consolidated Financial Statements 240 Financial Report 2011 Notes to the Consolidated Financial Statements 04 – Acquisitions and Dispositions
The fair value amounts recognized for these business combinations as of the acquisition date were as follows.
Fair Value of Assets Acquired and Liabilities Assumed as of the Acquisition Date in € m.
Total purchase consideration, including fair value of the Group’s equity interest held before the business combination 8
Recognized amounts of identifiable assets acquired and liabilities assumed:
1 Cash and cash equivalents 3 Financial assets available for sale 14 All other assets 1 Long-term debt 7 All other liabilities 1 Total identifiable net assets 10
Noncontrolling interests − Total identifiable net assets attributable to Deutsche Bank shareholders 10
Goodwill 2 Negative goodwill 4
Total identifiable net assets and goodwill acquired attributable to Deutsche Bank shareholders, less negative goodwill 8 1 By major class of assets acquired and liabilities assumed.
Since the acquisition, these businesses collectively contributed net revenues and net income after tax of € 2 million each to the Group’s income statement for the year 2010. If the acquisitions had been effective as of January 1, 2010, the effect on the Group’s net revenues and net income after tax in 2010 also would have been € 2 million each.
Business Combinations finalized in 2009 In 2009, the Group finalized several acquisitions that were accounted for as business combinations. Of these transactions, none were individually significant and are, therefore, presented in the aggregate. These transac-tions involved the acquisition of interests of 100 % respectively for a total consideration of € 22 million, including cash payments of € 20 million and costs of € 2 million directly related to these acquisitions. The aggregated purchase prices were initially allocated as other intangible assets of € 21 million, reflecting customer relation-ships, and goodwill of € 1 million. Among these transactions is the acquisition of Dresdner Bank’s Global Agency Securities Lending business which closed on November 30, 2009. The business is operating from offices in London, New York and Frankfurt and was integrated into Global Transaction Banking. The completion of this transaction added one of the largest third-party agency securities lending providers to the Group’s existing cus-tody platform, closing a strategic product gap in the securities servicing area.

Deutsche Bank 02 – Consolidated Financial Statements 241 Financial Report 2011 Notes to the Consolidated Financial Statements 04 – Acquisitions and Dispositions
The aggregate impact from these acquisitions on the Group’s 2009 balance sheet was as follows.
Fair Value of Assets Acquired and Liabilities Assumed as of the Acquisition Date
in € m.
Carrying value before the acquisition
Adjustments to fair value Fair value
Assets: Cash and due from banks − − − Goodwill − 1 1 Other intangible assets − 21 21 All remaining assets − − −
Total assets − 22 22
Liabilities: Long-term debt − − − All remaining liabilities − 3 3
Total liabilities − 3 3
Net assets − 19 19
Total liabilities and equity − 22 22
In finalizing these business combinations in 2010, the aggregated purchase prices were allocated as other intangible assets of € 16 million, reflecting customer relationships, and goodwill of € 6 million.
Their related effect on net revenues and net profit or loss after tax of the Group in 2009 was € 1 million and € (1) million, respectively.
Potential Profit or Loss Impact of Business Combinations finalized in 2009 If the business combinations described above which were finalized in 2009 had all been effective as of Janu-ary 1, 2009, the effect on the Group’s net revenues and net profit or loss after tax in 2009 would have been € 22 million and less than € 1 million, respectively.
Acquisitions and Dispositions of Noncontrolling Interests while Retaining Control During 2011 and 2010, the Group completed acquisitions and dispositions of noncontrolling interests related to its investments in subsidiaries where the Group is not the sole owner and which did not result in the loss of control over the respective subsidiaries. In accordance with IAS 27 R, they were accounted for as equity transac-tions between the Group and outside shareholders with no gain or loss recognized in the Group’s income statement. The net cash consideration paid in 2011 and 2010 on these transactions totaled € 77 million and € 13 million, respectively. The carrying amounts of the related controlling and noncontrolling interests were adjusted to reflect the changes regarding the Group’s interests in these subsidiaries. Any difference between the fair values of the consideration transferred or received and the amounts by which the noncontrolling interests were adjusted is recognized directly in shareholders’ equity.

Deutsche Bank 02 – Consolidated Financial Statements 242 Financial Report 2011 Notes to the Consolidated Financial Statements 04 – Acquisitions and Dispositions
The following table summarizes for 2011 and 2010 the aggregated effect of changes in the Group’s ownership interests recorded for these subsidiaries during the respective periods. Ownership changes for 2011 mainly related to the consolidated interest in Postbank. Subsequent to the step-acquisition in December 2010, the Group had increased its direct shareholdings in Postbank from 51.98 % to a 53.14 % stake at year-end 2011 through additional shares purchased in the market.
in € m. 2011 2010
Deutsche Bank’s ownership interests as at beginning of the period 6,363 136 Net increase in Deutsche Bank’s ownership interests 56 76 Deutsche Bank’s share of net income or loss 822 (11) Deutsche Bank’s share of other comprehensive income (427) 29 Deutsche Bank’s share of other equity changes 375 (49)
Deutsche Bank’s ownership interests at the end of the period 7,189 181
Dispositions During 2011, 2010 and 2009, the Group finalized several dispositions of subsidiaries/businesses. These disposals mainly included several businesses the Group had previously classified as held for sale, among them the sale of Postbank’s Indian subsidiary Deutsche Postbank Home Finance Ltd. in the first quarter 2011 and BHF Asset Servicing GmbH in the third quarter 2010, a business already classified held for sale as part of the acquisition of the Sal. Oppenheim Group in the first quarter 2010. The total cash consideration received for these disposi-tions in 2011, 2010 and 2009 was € 368 million, € 281 million and € 51 million, respectively. The table below includes the assets and liabilities that were included in these disposals.
in € m. 2011 2010 2009
Cash and cash equivalents 21 45 49 All remaining assets 1,383 2,180 15 Total assets disposed 1,404 2,225 64
Total liabilities disposed 1,039 1,932 73
Also included in these dispositions completed in 2011 and 2010 were several divestitures in which the Group retained noncontrolling interests in the former subsidiaries. None of these disposal transactions were individu-ally significant. The interests retained in the former subsidiaries were recognized initially at fair value as of the date when control was lost, on which date these interests were subsequently accounted for under the equity method. While there was no gain or loss on these dispositions in 2011, the resulting net gain recognized on these divestitures in 2010 totaled € 15 million, and is included in other income. Of that net gain recognized in 2010, € 5 million are related to the remeasurement to fair value of the interests retained in these former sub-sidiaries.

Deutsche Bank 02 – Consolidated Financial Statements 243 Financial Report 2011 Notes to the Consolidated Financial Statements 05 – Business Segments and Related Information
05 – Business Segments and Related Information
The following segment information has been prepared in accordance with the “management approach”, which requires presentation of the segments on the basis of the internal reports about components of the entity which are regularly reviewed by the chief operating decision-maker in order to allocate resources to a segment and to assess its performance.
Business Segments The following business segments represent the Group’s organizational structure as reflected in its internal management reporting systems.
The Group is organized into three group divisions, which are further subdivided into corporate divisions. As of December 31, 2011, the group divisions and corporate divisions were as follows:
The Corporate & Investment Bank (CIB), which combines the Group’s corporate banking and securities activities (including sales and trading and corporate finance activities) with the Group’s transaction banking activities. CIB serves corporate and institutional clients, ranging from medium-sized enterprises to multinational corporations, banks and sovereign organizations. Within CIB, the Group manages these activities in two global corporate divisions: Corporate Banking & Securities (CB&S) and Global Transaction Banking (GTB).
— CB&S is made up of the Markets and Corporate Finance business divisions. These businesses offer finan-cial products worldwide, ranging from the underwriting of stocks and bonds to the tailoring of structured so-lutions for complex financial requirements.
— GTB is primarily engaged in the gathering, transferring, safeguarding and controlling of assets for its cli-ents throughout the world. It provides processing, fiduciary and trust services to corporations, financial institu-tions and governments and their agencies.
Private Clients and Asset Management (PCAM), which combines the Group’s asset management, private wealth management and private and business client activities. Within PCAM, the Group manages these activi-ties in two global corporate divisions: Asset and Wealth Management (AWM) and Private & Business Clients (PBC).
— AWM is composed of the business divisions Asset Management (AM), which focuses on managing assets on behalf of institutional clients and providing mutual funds and other retail investment vehicles, and Pri-vate Wealth Management (PWM), which focuses on the specific needs of high-net-worth clients, their fami-lies and selected institutions.
— PBC serves retail and affluent clients as well as small corporate customers with a full range of retail bank-ing products.
Corporate Investments (CI), which manages certain alternative assets of the Group and other debt and equity positions.
Changes in the composition of segments can arise from either changes in management responsibility, or from acquisitions and divestitures.
Deutsche Bank 02 – Consolidated Financial Statements 244 Financial Report 2011 Notes to the Consolidated Financial Statements 05 – Business Segments and Related Information
The following describes changes in management responsibilities with a significant impact on segmental reporting:
— Effective January 1, 2011, the exposure in Actavis Group was transferred from the Corporate Division Corporate Banking & Securities to the Group Division CI.
— Effective January 1, 2011, BHF-BANK was transferred from the Business Division Private Wealth Man-agement within the Corporate Division Asset and Wealth Management to the Group Division CI.
— With effect from July 1, 2010, an integrated management structure for the whole of the Corporate & Investment Bank Group Division was implemented following changes in the Management Board, and in the responsi-bility for Corporate Finance and Global Transaction Banking. The structure is intended to accelerate growth as a top-tier Corporate & Investment bank and allow for delivery of the Group’s targets. During the third quarter 2011, the former Capital Markets Sales business unit within the Corporate Division Global Transaction Banking was transferred to the Corporate Division Corporate Banking & Securities. In addition, a portfolio consisting of short-term lending transactions with German mid-cap clients was transferred from the Corporate Division Corporate Banking & Securities to the Corporate Division Global Transaction Bank-ing in order to leverage the adjacencies between the cash management, trade financing and short-term lending activities with these clients.
— On April 1, 2009, management responsibility for The Cosmopolitan of Las Vegas property changed from the Corporate Division CB&S to the Group Division CI.
— During the first quarter 2009, management responsibility for certain assets changed from the Corporate Division AWM to the Group Division CI. These assets included Maher Terminals, a consolidated infrastruc-ture investment, and RREEF Global Opportunity Fund III, a consolidated real estate investment fund.
The following describes acquisitions and divestitures which had a significant impact on the Group’s segment operations:
— On November 11, 2011, the Group completed the step-acquisition of Deutsche UFG Capital Management (“DUCM”), one of Russia’s largest independent asset management companies. The transaction followed Deutsche Bank’s exercise of a purchase option on the remaining 60 % stake. Deutsche Bank now fully controls the acquiree, which was previously accounted for under the equity method. DUCM was allocated to the Corporate Division AWM.
— On December 3, 2010, the Group consolidated Deutsche Postbank AG for the first time following the success-ful conclusion and settlement of a voluntary public takeover offer. As of that date, the investment in Post-bank is included in the Corporate Division PBC.
— On April 1, 2010, the Group completed the acquisition of parts of the commercial banking activities of ABN AMRO Bank N.V. (“ABN AMRO”) in the Netherlands. These are included in the Corporate Division GTB.
— On March 15, 2010, the Group acquired the Sal. Oppenheim Group, which was included in the Corporate Division AWM, with the exception of its BHF-BANK operations, which were included in the Group Division CI. In the second quarter 2010, the BHF-BANK operations were transferred to the Business Division PWM within the Corporate Division AWM. This change is reflected in the presentation of the year ended Decem-ber 31, 2010.
— In November 2009, the Group completed the acquisition of Dresdner Bank’s Global Agency Securities Lending business from Commerzbank AG. The business is included in the Corporate Division GTB.

Deutsche Bank 02 – Consolidated Financial Statements 245 Financial Report 2011 Notes to the Consolidated Financial Statements 05 – Business Segments and Related Information
— On February 25, 2009, the Group completed the acquisition of a minority stake in Deutsche Postbank AG, one of Germany’s major financial services providers. As of that date, the Group also entered into a manda-torily-exchangeable bond as well as options to increase its stake in the future. All components of the transaction were included in the Group Division CI until the first-time consolidation of Postbank on Decem-ber 3, 2010.
— In June 2008, the Group consolidated Maher Terminals LLC and Maher Terminals of Canada Corp, collec-tively and hereafter referred to as Maher Terminals, a privately held operator of port terminal facilities in North America. RREEF Infrastructure acquired all third party investors’ interests in the North America Infra-structure Fund, whose sole underlying investment was Maher Terminals. The investment is included in the Group Division CI since the first quarter of 2009.
Measurement of Segment Profit or Loss Segment reporting requires a presentation of the segment results based on management reporting methods, including a reconciliation between the results of the business segments and the consolidated financial state-ments, which is presented in the “Reconciliation of Segmental Results of Operations to Consolidated Results of Operations” section of this note. The information provided about each segment is based on the internal reports about segment profit or loss, assets and other information which are regularly reviewed by the chief operating decision-maker.
Management reporting for the Group is generally based on IFRS. Non-IFRS compliant accounting methods are rarely used and represent either valuation or classification differences. The largest valuation differences relate to measurement at fair value in management reporting versus measurement at amortized cost under IFRS (for example, for certain financial instruments in the Group’s treasury books in CB&S and PBC) and to the recogni-tion of trading results from own shares in revenues in management reporting (mainly in CB&S) and in equity under IFRS. The major classification difference relates to noncontrolling interest, which represents the net share of minority shareholders in revenues, provision for credit losses, noninterest expenses and income tax expenses. Noncontrolling interest is reported as a component of pre-tax income for the businesses in man-agement reporting (with a reversal in Consolidation & Adjustments, or C&A) and a component of net income appropriation under IFRS.
Revenues from transactions between the business segments are allocated on a mutually-agreed basis. Internal service providers, which operate on a nonprofit basis, allocate their noninterest expenses to the recipient of the service. The allocation criteria are generally based on service level agreements and are either determined based upon “price per unit”, “fixed price” or “agreed percentages”. Since the Group’s business activities are diverse in nature and its operations are integrated, certain estimates and judgments have been made to apportion revenue and expense items among the business segments.

Deutsche Bank 02 – Consolidated Financial Statements 246 Financial Report 2011 Notes to the Consolidated Financial Statements 05 – Business Segments and Related Information
The management reporting systems follow a “matched transfer pricing concept” in which the Group’s external net interest income is allocated to the business segments based on the assumption that all positions are funded or invested via the wholesale money and capital markets. Therefore, to create comparability with those competitors who have legally independent units with their own equity funding, the Group allocates the net notional interest credit on its consolidated capital (after deduction of certain related charges such as hedg-ing of net investments in certain foreign operations) to the business segments, in proportion to each business segment’s allocated average active equity.
Management uses certain measures for equity and related ratios as part of its internal reporting system because it believes that these measures provide it with a more useful indication of the financial performance of the busi-ness segments. The Group discloses such measures to provide investors and analysts with further insight into how management operates the Group’s businesses and to enable them to better understand the Group’s re-sults. These measures include:
— Average Active Equity: The Group uses average active equity to calculate several ratios. However, active equity is not a measure provided for in IFRS and therefore the Group’s ratios based on average active eq-uity should not be compared to other companies’ ratios without considering the differences in the calcula-tion. The items for which the average shareholders’ equity is adjusted are average accumulated other comprehensive income excluding foreign currency translation (all components net of applicable taxes) as well as average dividends, for which a proposal is accrued on a quarterly basis and which are paid after the approval by the Annual General Meeting following each year. In the first quarter 2011, the Group changed the methodology used for allocating average active equity to the business segments and to Con-solidation & Adjustments in proportion to their regulatory requirements. Under the new methodology eco-nomic capital as the basis for allocation is substituted by risk weighted assets and certain regulatory capital deduction items. All other items of the capital allocation framework remain unchanged. The total amount allocated continues to be determined based on the higher of the Group’s overall economic risk ex-posure or regulatory capital demand. In 2011, the Group derives its internal demand for regulatory capital assuming a Tier 1 ratio of 10.0 %. If the Group’s average active equity exceeds the higher of the overall economic risk exposure or the regulatory capital demand, this surplus is assigned to Consolidation & Adjustments.
— Return on Average Active Equity in % is defined as income before income taxes less noncontrolling interest as a percentage of average active equity. These returns, which are based on average active equity, should not be compared to those of other companies without considering the differences in the calculation of such ratios.

Deutsche Bank 02 – Consolidated Financial Statements 247 Financial Report 2011 Notes to the Consolidated Financial Statements 05 – Business Segments and Related Information
Segmental Results of Operations The following tables present the results of the business segments, including the reconciliation to the consoli-dated results under IFRS, for the years ended December 31, 2011, 2010 and 2009, respectively.
2011 Corporate & Investment Bank Private Clients and Asset Management Corporate Investments
Total Management Report
in € m. (unless stated otherwise)
Corporate Banking & Securities
Global Transaction Banking
Total
Asset and Wealth Management
Private & Business Clients
Total
Net revenues
1 14,885 3,608 18,493 3,762 10,617 14,379 394 33,266
Provision for credit losses 304 158 462 55 1,309 1,364 14 1,840
Total noninterest expenses 11,650 2,327 13,977 2,941 7,336 10,277 1,492 25,746 therein:
Depreciation, depletion and amortization 43 6 49 25 167 192 262 504 Severance payments 81 14 95 27 221 248 60 403 Policyholder benefits and claims 207 − 207 0 − 0 − 207 Impairment of intangible assets − − − − − − − − Restructuring activities − − − − − − − −
Noncontrolling interests 27 − 27 (1) 190 189 (2) 213
Income (loss) before income taxes4 2,905 1,123 4,028 767 1,782 2,549 (1,111) 5,466
Cost/income ratio 78 % 64 % 76 % 78 % 69 % 71 % N/M 77 % Assets
2,3 1,727,156 96,404 1,796,954 58,601 335,516 394,094 25,203 2,152,949 Expenditures for additions to long-lived assets 44 7 51 37 181 218 97 367 Risk-weighted assets 228,711 26,986 255,698 16,344 95,472 111,816 11,848 379,362 Average active equity
5 18,113 2,448 20,561 5,289 11,274 16,563 1,130 38,254 Pre-tax return on average active equity 16 % 46 % 20 % 15 % 16 % 15 % (98) % 14 %
1 Includes: Net interest income 7,787 1,690 9,478 620 6,983 7,603 161 17,242 Net revenues from external customers 15,773 3,374 19,146 3,776 9,930 13,705 364 33,215 Net intersegment revenues (887) 234 (653) (14) 687 674 30 51 Net income (loss) from equity method investments 23 2 25 41 140 182 (473) (266)
2 Includes: Equity method investments 1,005 43 1,047 193 2,043 2,236 438 3,722
N/M – Not meaningful 3 The sum of corporate divisions does not necessarily equal the total of the corresponding group division because of consolidation items between corporate divisions, which are eliminated
at the group division level. The same approach holds true for the sum of group divisions compared to Total Management Reporting. 4 The Group also uses an adjusted income (loss) before income taxes (IBIT) for the calculation of its pre-tax return on average active equity (target definition). IBIT is adjusted to exclude a
net positive impact of € 236 million related to the stake in Hua Xia Bank (PBC). 5 For management reporting purposes goodwill and other intangible assets with indefinite useful lives are explicitly assigned to the respective divisions. Starting 2011, the Group’s average active equity
is allocated to the business segments and to Consolidation & Adjustments in proportion to their regulatory capital requirements, which comprises of the regulatory capital required to support risk weighted assets and certain capital deduction items, goodwill and unamortized other intangible assets. Prior periods were adjusted accordingly.
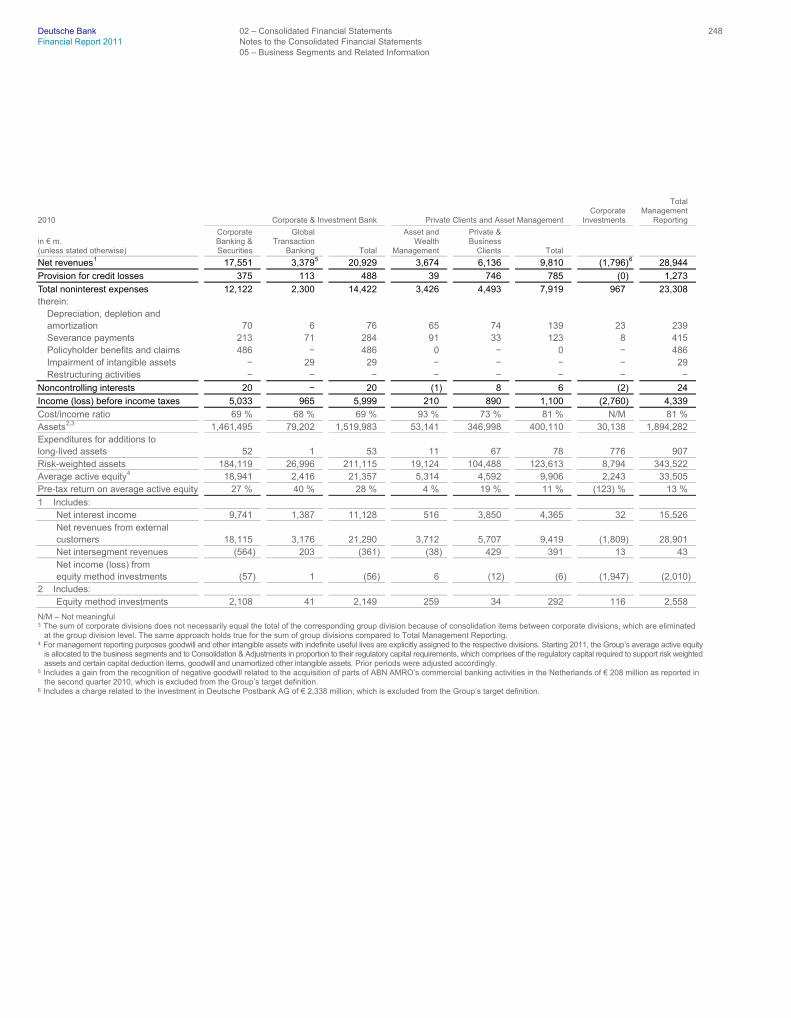
Deutsche Bank 02 – Consolidated Financial Statements 248 Financial Report 2011 Notes to the Consolidated Financial Statements 05 – Business Segments and Related Information
2010 Corporate & Investment Bank Private Clients and Asset Management Corporate Investments
Total Management Reporting
in € m. (unless stated otherwise)
Corporate Banking & Securities
Global Transaction Banking
Total
Asset and Wealth Management
Private & Business Clients
Total
Net revenues
1 17,551 3,379
5 20,929 3,674 6,136 9,810 (1,796)
6 28,944
Provision for credit losses 375 113 488 39 746 785 (0) 1,273
Total noninterest expenses 12,122 2,300 14,422 3,426 4,493 7,919 967 23,308 therein:
Depreciation, depletion and amortization 70 6 76 65 74 139 23 239 Severance payments 213 71 284 91 33 123 8 415 Policyholder benefits and claims 486 − 486 0 − 0 − 486 Impairment of intangible assets − 29 29 − − − − 29 Restructuring activities − − − − − − − −
Noncontrolling interests 20 − 20 (1) 8 6 (2) 24
Income (loss) before income taxes 5,033 965 5,999 210 890 1,100 (2,760) 4,339
Cost/income ratio 69 % 68 % 69 % 93 % 73 % 81 % N/M 81 % Assets
2,3 1,461,495 79,202 1,519,983 53,141 346,998 400,110 30,138 1,894,282 Expenditures for additions to long-lived assets 52 1 53 11 67 78 776 907 Risk-weighted assets 184,119 26,996 211,115 19,124 104,488 123,613 8,794 343,522 Average active equity
4 18,941 2,416 21,357 5,314 4,592 9,906 2,243 33,505 Pre-tax return on average active equity 27 % 40 % 28 % 4 % 19 % 11 % (123) % 13 %
1 Includes: Net interest income 9,741 1,387 11,128 516 3,850 4,365 32 15,526 Net revenues from external customers 18,115 3,176 21,290 3,712 5,707 9,419 (1,809) 28,901 Net intersegment revenues (564) 203 (361) (38) 429 391 13 43 Net income (loss) from equity method investments (57) 1 (56) 6 (12) (6) (1,947) (2,010)
2 Includes: Equity method investments 2,108 41 2,149 259 34 292 116 2,558
N/M – Not meaningful 3 The sum of corporate divisions does not necessarily equal the total of the corresponding group division because of consolidation items between corporate divisions, which are eliminated
at the group division level. The same approach holds true for the sum of group divisions compared to Total Management Reporting. 4 For management reporting purposes goodwill and other intangible assets with indefinite useful lives are explicitly assigned to the respective divisions. Starting 2011, the Group’s average active equity
is allocated to the business segments and to Consolidation & Adjustments in proportion to their regulatory capital requirements, which comprises of the regulatory capital required to support risk weighted assets and certain capital deduction items, goodwill and unamortized other intangible assets. Prior periods were adjusted accordingly.
5 Includes a gain from the recognition of negative goodwill related to the acquisition of parts of ABN AMRO’s commercial banking activities in the Netherlands of € 208 million as reported in the second quarter 2010, which is excluded from the Group’s target definition.
6 Includes a charge related to the investment in Deutsche Postbank AG of € 2,338 million, which is excluded from the Group’s target definition.
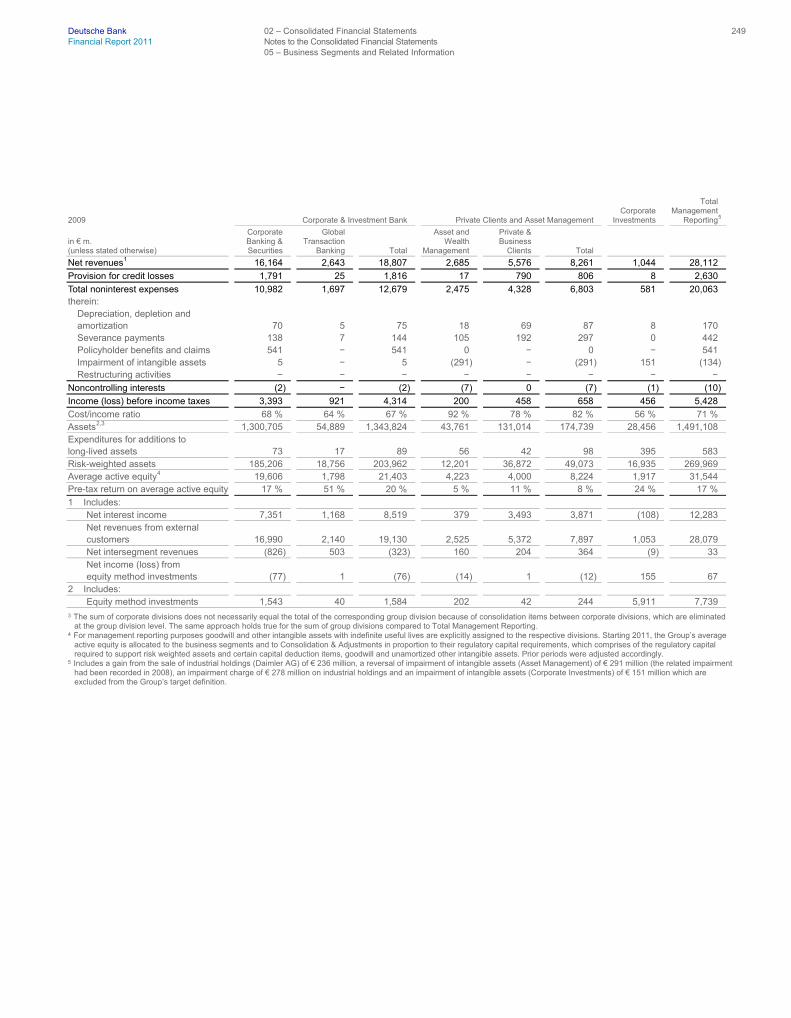
Deutsche Bank 02 – Consolidated Financial Statements 249 Financial Report 2011 Notes to the Consolidated Financial Statements 05 – Business Segments and Related Information
2009 Corporate & Investment Bank Private Clients and Asset Management Corporate Investments
Total Management Reporting
5
in € m. (unless stated otherwise)
Corporate Banking & Securities
Global Transaction Banking
Total
Asset and Wealth Management
Private & Business Clients
Total
Net revenues
1 16,164 2,643 18,807 2,685 5,576 8,261 1,044 28,112
Provision for credit losses 1,791 25 1,816 17 790 806 8 2,630
Total noninterest expenses 10,982 1,697 12,679 2,475 4,328 6,803 581 20,063 therein:
Depreciation, depletion and amortization 70 5 75 18 69 87 8 170 Severance payments 138 7 144 105 192 297 0 442 Policyholder benefits and claims 541 − 541 0 − 0 − 541 Impairment of intangible assets 5 − 5 (291) − (291) 151 (134)Restructuring activities − − − − − − − −
Noncontrolling interests (2) − (2) (7) 0 (7) (1) (10)
Income (loss) before income taxes 3,393 921 4,314 200 458 658 456 5,428
Cost/income ratio 68 % 64 % 67 % 92 % 78 % 82 % 56 % 71 % Assets
2,3 1,300,705 54,889 1,343,824 43,761 131,014 174,739 28,456 1,491,108 Expenditures for additions to long-lived assets 73 17 89 56 42 98 395 583 Risk-weighted assets 185,206 18,756 203,962 12,201 36,872 49,073 16,935 269,969 Average active equity
4 19,606 1,798 21,403 4,223 4,000 8,224 1,917 31,544 Pre-tax return on average active equity 17 % 51 % 20 % 5 % 11 % 8 % 24 % 17 %
1 Includes: Net interest income 7,351 1,168 8,519 379 3,493 3,871 (108) 12,283 Net revenues from external customers 16,990 2,140 19,130 2,525 5,372 7,897 1,053 28,079 Net intersegment revenues (826) 503 (323) 160 204 364 (9) 33 Net income (loss) from equity method investments (77) 1 (76) (14) 1 (12) 155 67
2 Includes: Equity method investments 1,543 40 1,584 202 42 244 5,911 7,739
3 The sum of corporate divisions does not necessarily equal the total of the corresponding group division because of consolidation items between corporate divisions, which are eliminated at the group division level. The same approach holds true for the sum of group divisions compared to Total Management Reporting.
4 For management reporting purposes goodwill and other intangible assets with indefinite useful lives are explicitly assigned to the respective divisions. Starting 2011, the Group’s average active equity is allocated to the business segments and to Consolidation & Adjustments in proportion to their regulatory capital requirements, which comprises of the regulatory capital required to support risk weighted assets and certain capital deduction items, goodwill and unamortized other intangible assets. Prior periods were adjusted accordingly.
5 Includes a gain from the sale of industrial holdings (Daimler AG) of € 236 million, a reversal of impairment of intangible assets (Asset Management) of € 291 million (the related impairment had been recorded in 2008), an impairment charge of € 278 million on industrial holdings and an impairment of intangible assets (Corporate Investments) of € 151 million which are excluded from the Group’s target definition.

Deutsche Bank 02 – Consolidated Financial Statements 250 Financial Report 2011 Notes to the Consolidated Financial Statements 05 – Business Segments and Related Information
Reconciliation of Segmental Results of Operations to Consolidated Results of Operations The following table presents a reconciliation of the total results of operations and total assets of the Group’s business segments under management reporting systems to the consolidated financial statements for the years ended December 31, 2011, 2010 and 2009, respectively.
2011 2010 2009
in € m.
Total Management Reporting
Consoli- dation & Adjustments
Total Consolidated
Total Management Reporting
Consoli- dation & Adjustments
Total Consolidated
Total Management Reporting
Consoli- dation & Adjustments
Total Consolidated
Net revenues
1 33,266 (38) 33,228 28,944 (377) 28,567 28,112 (159) 27,952 Provision for credit losses 1,840 (1) 1,839 1,273 0 1,274 2,630 (0) 2,630 Noninterest expenses 25,746 253 25,999 23,308 10 23,318 20,063 57 20,120 Noncontrolling interests 213 (213) − 24 (24) − (10) 10 −
Income (loss) before income taxes 5,466 (77) 5,390 4,339 (363) 3,975 5,428 (226) 5,202
Assets 2,152,949 11,154 2,164,103 1,894,282 11,348 1,905,630 1,491,108 9,556 1,500,664 Risk-weighted assets 379,362 1,884 381,246 343,522 2,683 346,204 269,969 3,507 273,476 Average active equity 2 38,254 12,195 50,449 33,505 7,848 41,353 31,544 3,069 34,613 1 Net interest income and noninterest income. 2 The increase in Average Active Equity in Consolidation & Adjustments reflects the capital build up the bank is undertaking in light of increasing external capital requirements under the
revised Basel 2.5 and Basel 3 framework. We expect capital to be allocated back to our business divisions, in particular those most affected by the aforementioned regulatory changes, as we adjust our internal requirements in lieu of external developments.
In 2011, loss before income taxes in Consolidation & Adjustments (C&A) was € 77 million. Noninterest expenses were driven by bank levies of € 247 million, primarily related to Germany and the UK. In 2011, the main adjust-ments to net revenues in C&A were:
— Adjustments related to positions which were measured at fair value for management reporting purposes and measured at amortized cost under IFRS. These adjustments, which increased net revenues by approximately € 25 million, essentially relate to two partly offsetting effects. The widening of the credit spread of the Group’s own debt resulted in a gain. Economically hedged short-term positions as well as economically hedged debt issuance trades resulted in a net loss, mainly driven by movements in interest rates in both euro and U.S. dollar.
— Hedging of net investments in certain foreign operations decreased net revenues by approximately € 215 million.
— The remainder of net revenues was due to net interest revenues which were not allocated to the business segments and items outside the management responsibility of the business segments. Such items include net funding expenses on non-divisionalized assets/liabilities, e.g. deferred tax assets/liabilities, and net in-terest revenues related to tax refunds and accruals.
Noncontrolling interests are deducted from income before income taxes of the divisions and reversed in C&A. The increase compared to the prior year was mainly due to the consolidation of Postbank.

Deutsche Bank 02 – Consolidated Financial Statements 251 Financial Report 2011 Notes to the Consolidated Financial Statements 05 – Business Segments and Related Information
In 2010, loss before income taxes in C&A was € 363 million. Noninterest expenses included the receipt of insur-ance payments which were partly offset by charges for litigation provisions as well as other items outside the management responsibility of the business segments. The main adjustments to net revenues in C&A in 2010 were:
— Adjustments related to positions which were measured at fair value for management reporting purposes and measured at amortized cost under IFRS. These adjustments, which decreased net revenues by approximately € 210 million, related to economically hedged short-term positions as well as economically hedged debt issuance trades and were mainly driven by movements in interest rates in both euro and U.S. dollar.
— Hedging of net investments in certain foreign operations decreased net revenues by approximately € 245 million.
— The remainder of net revenues was due to net interest expenses which were not allocated to the business segments and items outside the management responsibility of the business segments. Such items include net funding expenses on non-divisionalized assets/liabilities, e.g. deferred tax assets/liabilities, and net in-terest expenses related to tax refunds and accruals.
In 2009, loss before income taxes in C&A was € 226 million. Noninterest expenses included charges related to litigation provisions and other items outside the management responsibility of the business segments. Partly offsetting were value-added tax benefits. The main adjustments to net revenues in C&A in 2009 were:
— Adjustments related to positions which were measured at fair value for management reporting purposes and measured at amortized cost under IFRS. These adjustments, which decreased net revenues by ap-proximately € 535 million, relate to economically hedged short-term positions as well as economically hedged debt issuance trades and were mainly driven by movements in short-term interest rates in both euro and U.S. dollar.
— Hedging of net investments in certain foreign operations decreased net revenues by approximately € 225 million.
— Derivative contracts used to hedge effects on shareholders’ equity, resulting from obligations under share-based compensation plans, resulted in an increase of approximately € 460 million.
— The remainder of net revenues was due to net interest expenses which were not allocated to the business segments and items outside the management responsibility of the business segments. Such items include net funding expenses on non-divisionalized assets/liabilities, e.g. deferred tax assets/liabilities, and net in-terest expenses related to tax refunds and accruals.
Assets and risk-weighted assets in C&A reflect corporate assets, such as deferred tax assets and central clear-ing accounts, outside of the management responsibility of the business segments.
Average active equity assigned to C&A reflects the residual amount of equity that is not allocated to the seg-ments as described in the “Measurement of Segment Profit or Loss” section of this Note.
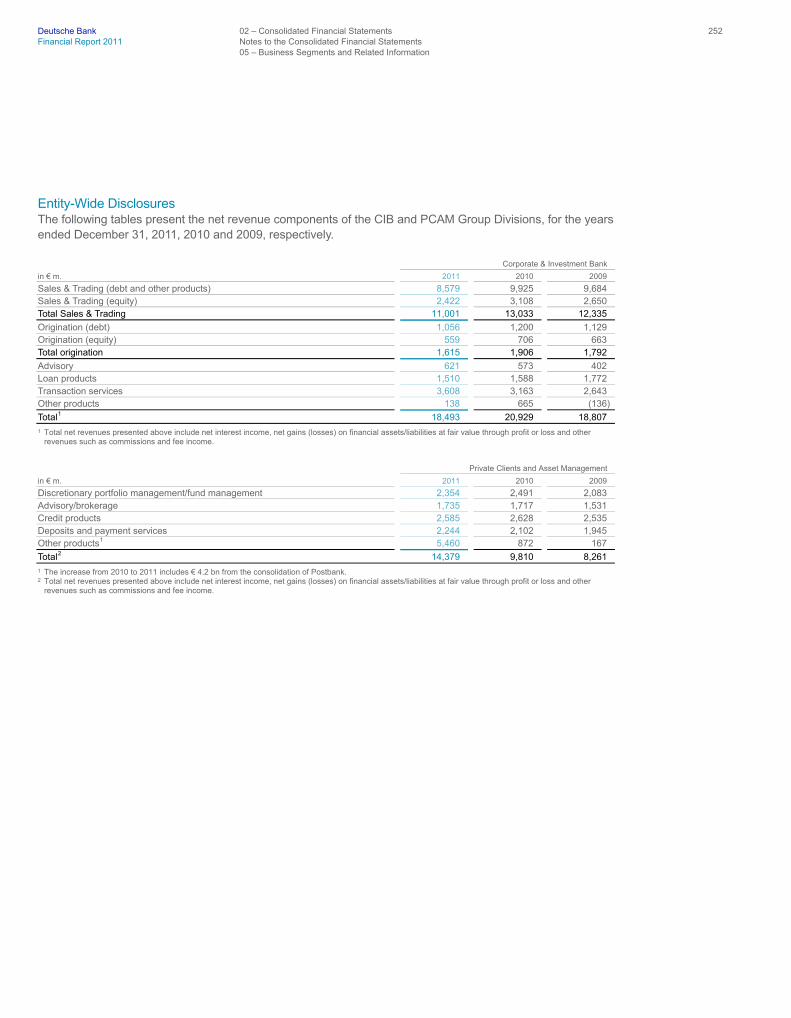
Deutsche Bank 02 – Consolidated Financial Statements 252 Financial Report 2011 Notes to the Consolidated Financial Statements 05 – Business Segments and Related Information
Entity-Wide Disclosures The following tables present the net revenue components of the CIB and PCAM Group Divisions, for the years ended December 31, 2011, 2010 and 2009, respectively.
Corporate & Investment Bank
in € m. 2011 2010 2009
Sales & Trading (debt and other products) 8,579 9,925 9,684 Sales & Trading (equity) 2,422 3,108 2,650 Total Sales & Trading 11,001 13,033 12,335
Origination (debt) 1,056 1,200 1,129 Origination (equity) 559 706 663 Total origination 1,615 1,906 1,792
Advisory 621 573 402 Loan products 1,510 1,588 1,772 Transaction services 3,608 3,163 2,643 Other products 138 665 (136)
Total
1 18,493 20,929 18,807 1 Total net revenues presented above include net interest income, net gains (losses) on financial assets/liabilities at fair value through profit or loss and other
revenues such as commissions and fee income.
Private Clients and Asset Management
in € m. 2011 2010 2009
Discretionary portfolio management/fund management 2,354 2,491 2,083 Advisory/brokerage 1,735 1,717 1,531 Credit products 2,585 2,628 2,535 Deposits and payment services 2,244 2,102 1,945 Other products
1 5,460 872 167
Total
2 14,379 9,810 8,261 1 The increase from 2010 to 2011 includes € 4.2 bn from the consolidation of Postbank. 2 Total net revenues presented above include net interest income, net gains (losses) on financial assets/liabilities at fair value through profit or loss and other
revenues such as commissions and fee income.

Deutsche Bank 02 – Consolidated Financial Statements 253 Financial Report 2011 Notes to the Consolidated Financial Statements 05 – Business Segments and Related Information
The following table presents total net revenues (before provisions for credit losses) by geographic area for the years ended December 31, 2011, 2010 and 2009, respectively. The information presented for CIB and PCAM has been classified based primarily on the location of the Group’s office in which the revenues are recorded. The information for CI and C&A is presented on a global level only, as management responsibility for these areas is held centrally.
in € m. 2011 2010 2009
Germany: CIB 2,600 2,864 2,353 PCAM 9,983 5,699 4,769
Total Germany 12,583 8,563 7,122
Europe, Middle East and Africa: CIB 7,775 8,258 8,485 PCAM 3,007 2,693 2,479
Total Europe, Middle East and Africa
1 10,782 10,951 10,964
Americas (primarily United States): CIB 4,908 6,420 5,295 PCAM 981 1,032 724
Total Americas 5,889 7,452 6,020
Asia/Pacific: CIB 3,210 3,387 2,672 PCAM 408 387 289
Total Asia/Pacific 3,618 3,774 2,961
CI 394 (1,796) 1,044 Consolidation & Adjustments (38) (377) (159)
Consolidated net revenues
2 33,228 28,567 27,952 1 For the years ended December 31, 2011, 2010 and 2009 the United Kingdom accounted for approximately 60 % of these revenues. 2 Consolidated net revenues comprise interest and similar income, interest expenses and total noninterest income (including net commission and fee income).
Revenues are attributed to countries based on the location in which the Group’s booking office is located. The location of a transaction on the Group’s books is sometimes different from the location of the headquarters or other offices of a customer and different from the location of the Group’s personnel who entered into or facilitated the transaction. Where the Group records a transaction involving its staff and customers and other third parties in different locations frequently depends on other considerations, such as the nature of the transaction, regulatory considerations and transaction processing considerations.

Deutsche Bank 02 – Consolidated Financial Statements 254 Financial Report 2011 Notes to the Consolidated Income Statement 06 – Net Interest Income and Net Gains (Losses) on Financial Assets/Liabilities at Fair Value
through Profit or Loss
06 – Net Interest Income and Net Gains (Losses) on Financial Assets/Liabilities at Fair Value through Profit or Loss
Net Interest Income The following are the components of interest and similar income and interest expense.
in € m. 2011 2010 2009
Interest and similar income: Interest-earning deposits with banks 794 691 633 Central bank funds sold and securities purchased under resale agreements 977 446 320 Securities borrowed 155 133 67 Financial assets at fair value through profit or loss 15,376 15,589 13,634 Interest income on financial assets available for sale 935 700 496 Dividend income on financial assets available for sale 148 137 91 Loans 14,914 10,222 10,555 Other 1,579 861 1,157
Total interest and similar income 34,878 28,779 26,953
Interest expense: Interest-bearing deposits 6,779 3,800 5,119 Central bank funds purchased and securities sold under repurchase agreements 426 301 280 Securities loaned 343 278 269 Financial liabilities at fair value through profit or loss 6,515 6,019 4,503 Other short-term borrowings 479 375 798 Long-term debt 1,835 1,490 2,612 Trust preferred securities 813 781 680 Other 243 152 233
Total interest expense 17,433 13,196 14,494
Net interest income 17,445 15,583 12,459
Interest income recorded on impaired financial assets was € 83 million, € 146 million and € 133 million for the years ended December 31, 2011, 2010 and 2009, respectively.
Notes to the Consolidated Income Statement

Deutsche Bank 02 – Consolidated Financial Statements 255 Financial Report 2011 Notes to the Consolidated Income Statement 06 – Net Interest Income and Net Gains (Losses) on Financial Assets/Liabilities at Fair Value
through Profit or Loss
Net Gains (Losses) on Financial Assets/Liabilities at Fair Value through Profit or Loss The following are the components of net gains (losses) on financial assets/liabilities at fair value through profit or loss.
in € m. 2011 2010 2009
Trading income: Sales & Trading (equity) (1,293) 198 1,125 Sales & Trading (debt and other products) 3,356 3,564 4,223
Total Sales & Trading 2,063 3,762 5,348 Other trading income 686 (104) 286
Total trading income 2,749 3,658 5,634
Net gains (losses) on financial assets/liabilities designated at fair value through profitor loss:
Breakdown by financial asset/liability category: Securities purchased/sold under resale/repurchase agreements (20) 35 (73) Securities borrowed/loaned (0) − (2) Loans and loan commitments (894) (331) 3,929 Deposits (368) (13) (162) Long-term debt
1 1,772 83 (2,550) Other financial assets/liabilities designated at fair value through profit or loss (181) (78) 333
Total net gains (losses) on financial assets/liabilities designated at fair value through profit or loss 309 (304) 1,475
Total net gains (losses) on financial assets/liabilities at fair value through profit or loss 3,058 3,354 7,109 1 Includes € (20) million, € 39 million and € (176) million from securitization structures for the years ended December 31, 2011, 2010 and 2009, respectively. Fair
value movements on related instruments of € (108) million, € 163 million and € (49) million for December 31, 2011, 2010 and 2009, respectively, are reported within trading income. Both are reported under Sales & Trading (debt and other products). The total of these gains and losses represents the Group’s share of the losses in these consolidated securitization structures.
Combined Overview The Group’s trading and risk management businesses include significant activities in interest rate instruments and related derivatives. Under IFRS, interest and similar income earned from trading instruments and financial instruments designated at fair value through profit or loss (e.g., coupon and dividend income), and the costs of funding net trading positions, are part of net interest income. The Group’s trading activities can periodically shift income between net interest income and net gains (losses) of financial assets/liabilities at fair value through profit or loss depending on a variety of factors, including risk management strategies. In order to provide a more business-focused presentation, the Group combines net interest income and net gains (losses) of financial assets/liabilities at fair value through profit or loss by group division and by product within the Corporate & Investment Bank.
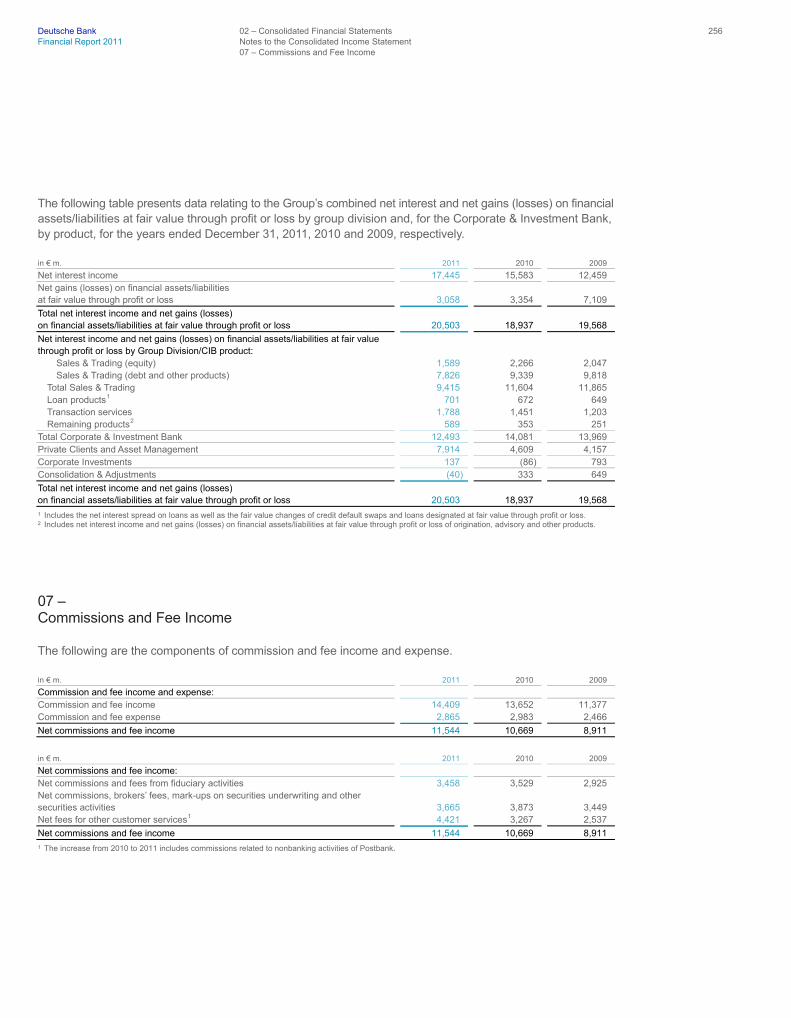
Deutsche Bank 02 – Consolidated Financial Statements 256 Financial Report 2011 Notes to the Consolidated Income Statement 07 – Commissions and Fee Income
The following table presents data relating to the Group’s combined net interest and net gains (losses) on financial assets/liabilities at fair value through profit or loss by group division and, for the Corporate & Investment Bank, by product, for the years ended December 31, 2011, 2010 and 2009, respectively.
in € m. 2011 2010 2009
Net interest income 17,445 15,583 12,459 Net gains (losses) on financial assets/liabilities at fair value through profit or loss 3,058 3,354 7,109
Total net interest income and net gains (losses) on financial assets/liabilities at fair value through profit or loss 20,503 18,937 19,568
Net interest income and net gains (losses) on financial assets/liabilities at fair value through profit or loss by Group Division/CIB product:
Sales & Trading (equity) 1,589 2,266 2,047 Sales & Trading (debt and other products) 7,826 9,339 9,818
Total Sales & Trading 9,415 11,604 11,865 Loan products
1 701 672 649 Transaction services 1,788 1,451 1,203 Remaining products
2 589 353 251 Total Corporate & Investment Bank 12,493 14,081 13,969 Private Clients and Asset Management 7,914 4,609 4,157 Corporate Investments 137 (86) 793 Consolidation & Adjustments (40) 333 649
Total net interest income and net gains (losses) on financial assets/liabilities at fair value through profit or loss 20,503 18,937 19,568 1 Includes the net interest spread on loans as well as the fair value changes of credit default swaps and loans designated at fair value through profit or loss. 2 Includes net interest income and net gains (losses) on financial assets/liabilities at fair value through profit or loss of origination, advisory and other products.
07 – Commissions and Fee Income
The following are the components of commission and fee income and expense.
in € m. 2011 2010 2009
Commission and fee income and expense: Commission and fee income 14,409 13,652 11,377 Commission and fee expense 2,865 2,983 2,466
Net commissions and fee income 11,544 10,669 8,911
in € m. 2011 2010 2009
Net commissions and fee income: Net commissions and fees from fiduciary activities 3,458 3,529 2,925 Net commissions, brokers’ fees, mark-ups on securities underwriting and other securities activities 3,665 3,873 3,449 Net fees for other customer services
1 4,421 3,267 2,537
Net commissions and fee income 11,544 10,669 8,911 1 The increase from 2010 to 2011 includes commissions related to nonbanking activities of Postbank.

Deutsche Bank 02 – Consolidated Financial Statements 257 Financial Report 2011 Notes to the Consolidated Income Statement 08 – Net Gains (Losses) on Financial Assets Available for Sale
08 – Net Gains (Losses) on Financial Assets Available for Sale
The following are the components of net gains (losses) on financial assets available for sale.
in € m. 2011 2010 2009
Net gains (losses) on financial assets available for sale: Net gains (losses) on debt securities: (223) 58 37
Net gains (losses) from disposal 285 74 119 Impairments (508)
1 (16) (82) Net gains (losses) on equity securities: 289 120 (295)
Net gains (losses) from disposal / remeasurement 383 164 443 Impairments (94) (44) (738)
Net gains (losses) on loans: 17 18 (56) Net gains (losses) from disposal 24 36 9 Impairments (7) (18) (81) Reversal of impairments − 0 16
Net gains (losses) on other equity interests: 39 5 (89) Net gains (losses) from disposal 56 40 − Impairments (17) (35) (89)
Total net gains (losses) on financial assets available for sale 123 201 (403) 1 Includes impairments of € (527) million on Greek government bonds, partly offset by reversals of impairments on debt securities recorded in prior periods.
Financial assets available for sale included Greek government bonds which were substantially acquired by Deutsche Bank as part of its acquisition of Postbank on December 3, 2010. Based on developments in the second quarter 2011, Deutsche Bank determined as of June 30, 2011 that there was objective evidence of impairment of all Greek government bonds classified as available for sale. As of that date all unrealized losses reported in accumulated other comprehensive income attributable to such bonds were recognized in the con-solidated statement of income. Subsequent to June 30, 2011, fair value losses attributable to the impaired Greek bonds were also recognized in income. As a result of this impairment Deutsche Bank recognized in 2011 a loss before income taxes of € 527 million, which had a negative impact of € 368 million on net income. As of December 31, 2011, the average fair value of the Greek bonds was approximately 30 % of the notional.
Please refer also to Note 16 “Financial Assets available for Sale” of this report. More information on financial assets/liabilities related to certain European countries is included on page 76 of this report (unaudited).
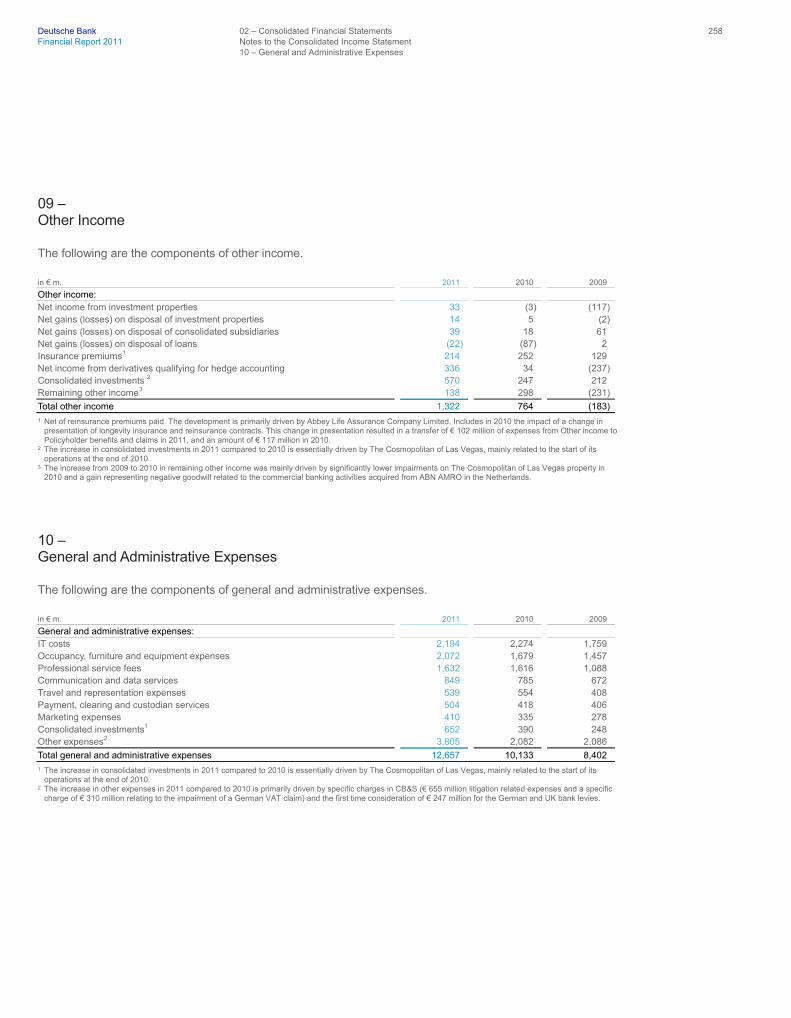
Deutsche Bank 02 – Consolidated Financial Statements 258 Financial Report 2011 Notes to the Consolidated Income Statement 10 – General and Administrative Expenses
09 – Other Income
The following are the components of other income.
in € m. 2011 2010 2009
Other income: Net income from investment properties 33 (3) (117) Net gains (losses) on disposal of investment properties 14 5 (2) Net gains (losses) on disposal of consolidated subsidiaries 39 18 61 Net gains (losses) on disposal of loans (22) (87) 2 Insurance premiums
1 214 252 129 Net income from derivatives qualifying for hedge accounting 336 34 (237) Consolidated investments 2 570 247 212 Remaining other income
3 138 298 (231)
Total other income 1,322 764 (183) 1 Net of reinsurance premiums paid. The development is primarily driven by Abbey Life Assurance Company Limited. Includes in 2010 the impact of a change in
presentation of longevity insurance and reinsurance contracts. This change in presentation resulted in a transfer of € 102 million of expenses from Other income to Policyholder benefits and claims in 2011, and an amount of € 117 million in 2010.
2 The increase in consolidated investments in 2011 compared to 2010 is essentially driven by The Cosmopolitan of Las Vegas, mainly related to the start of its operations at the end of 2010.
3 The increase from 2009 to 2010 in remaining other income was mainly driven by significantly lower impairments on The Cosmopolitan of Las Vegas property in 2010 and a gain representing negative goodwill related to the commercial banking activities acquired from ABN AMRO in the Netherlands.
10 – General and Administrative Expenses
The following are the components of general and administrative expenses.
in € m. 2011 2010 2009
General and administrative expenses: IT costs 2,194 2,274 1,759 Occupancy, furniture and equipment expenses 2,072 1,679 1,457 Professional service fees 1,632 1,616 1,088 Communication and data services 849 785 672 Travel and representation expenses 539 554 408 Payment, clearing and custodian services 504 418 406 Marketing expenses 410 335 278 Consolidated investments1 652 390 248 Other expenses
2 3,805 2,082 2,086
Total general and administrative expenses 12,657 10,133 8,402 1 The increase in consolidated investments in 2011 compared to 2010 is essentially driven by The Cosmopolitan of Las Vegas, mainly related to the start of its
operations at the end of 2010. 2 The increase in other expenses in 2011 compared to 2010 is primarily driven by specific charges in CB&S (€ 655 million litigation related expenses and a specific
charge of € 310 million relating to the impairment of a German VAT claim) and the first time consideration of € 247 million for the German and UK bank levies.

Deutsche Bank 02 – Consolidated Financial Statements 259 Financial Report 2011 Notes to the Consolidated Income Statement 11 – Earnings per Common Share
11 – Earnings per Common Share
Basic earnings per common share amounts are computed by dividing net income (loss) attributable to Deutsche Bank shareholders by the average number of common shares outstanding during the year. The average number of common shares outstanding is defined as the average number of common shares issued, reduced by the average number of shares in treasury and by the average number of shares that will be acquired under physically-settled forward purchase contracts, and increased by undistributed vested shares awarded under deferred share plans.
Diluted earnings per share assumes the conversion into common shares of outstanding securities or other contracts to issue common stock, such as share options, convertible debt, unvested deferred share awards and forward contracts. The aforementioned instruments are only included in the calculation of diluted earnings per share if they are dilutive in the respective reporting period.
The following table presents the computation of basic and diluted earnings per share for the years ended December 31, 2011, 2010 and 2009, respectively.
in € m. 2011 2010 2009
Net income (loss) attributable to Deutsche Bank shareholders – numerator for basic earnings per share 4,132 2,310 4,973
Effect of dilutive securities: Forwards and options − − − Convertible debt (13) 3 2
Net income (loss) attributable to Deutsche Bank shareholders after assumed conversions – numerator for diluted earnings per share 4,119 2,313 4,975
Number of shares in m. Weighted-average shares outstanding – denominator for basic earnings per share 928.0 753.3 689.4
Effect of dilutive securities: Forwards 0.0 0.0 0.0 Employee stock compensation options 0.0 0.0 0.1 Convertible debt 1.5 2.1 0.7 Deferred shares 27.8 35.4 26.4 Other (including trading options) 0.0 0.0 0.1
Dilutive potential common shares 29.3 37.5 27.3 Adjusted weighted-average shares after assumed conversions – denominator for diluted earnings per share 957.3 790.8 716.7
in € 2011 2010 2009
Basic earnings per share 4.45 3.07 7.21 Diluted earnings per share 4.30 2.92 6.94

Deutsche Bank 02 – Consolidated Financial Statements 260 Financial Report 2011 Notes to the Consolidated Income Statement 11 – Earnings per Common Share
On October 6, 2010, Deutsche Bank AG completed a capital increase with subscription rights. As the subscrip-tion price of the new shares was lower than the market price of the existing shares, the capital increase in-cluded a bonus element. According to IAS 33, the bonus element is the result of an implicit change in the number of shares outstanding for all periods prior to the capital increase without a fully proportionate change in resources. As a consequence, the weighted average number of shares outstanding has been adjusted retro-spectively for all periods before October 6, 2010.
As of December 31, 2011, 2010 and 2009, the following instruments were outstanding and were not included in the calculation of diluted earnings per share, because to do so would have been anti-dilutive.
Number of shares in m. 2011 2010 2009
Forward purchase contracts − − − Convertible debt 0.2 − − Put options sold − − − Call options sold − − − Employee stock compensation options 0.3 0.4 0.3 Deferred shares − − −

Deutsche Bank 02 – Consolidated Financial Statements 261 Financial Report 2011 Notes to the Consolidated Balance Sheet 12 – Financial Assets/Liabilities at Fair Value through Profit or Loss
12 – Financial Assets/Liabilities at Fair Value through Profit or Loss
The following are the components of financial assets and liabilities at fair value through profit or loss.
in € m. Dec 31, 2011 Dec 31, 2010
Trading assets: Trading securities 214,087 238,283 Other trading assets
1 26,837 33,008 Total trading assets 240,924 271,291
Positive market values from derivative financial instruments 859,582 657,780
Financial assets designated at fair value through profit or loss: Securities purchased under resale agreements 117,284 108,912 Securities borrowed 27,261 27,887 Loans 24,220 23,254 Other financial assets designated at fair value through profit or loss 11,528 11,873
Total financial assets designated at fair value through profit or loss 180,293 171,926
Total financial assets at fair value through profit or loss 1,280,799 1,100,997 1 Includes traded loans of € 18,039 million and € 23,080 million at December 31, 2011 and 2010 respectively.
in € m. Dec 31, 2011 Dec 31, 2010
Trading liabilities: Trading securities 60,005 65,183 Other trading liabilities 3,881 3,676
Total trading liabilities 63,886 68,859
Negative market values from derivative financial instruments 838,817 647,195
Financial liabilities designated at fair value through profit or loss: Securities sold under repurchase agreements 93,606 107,999 Loan commitments 1,192 572 Long-term debt 13,889 15,280 Other financial liabilities designated at fair value through profit or loss 9,631 6,303
Total financial liabilities designated at fair value through profit or loss 118,318 130,154
Investment contract liabilities
1 7,426 7,898
Total financial liabilities at fair value through profit or loss 1,028,447 854,106 1 These are investment contracts where the policy terms and conditions result in their redemption value equaling fair value. See Note 40 “Insurance and Investment
Contracts”, for more detail on these contracts.
Loans and Loan Commitments designated at Fair Value through Profit or Loss The Group has designated various lending relationships at fair value through profit or loss. Lending facilities consist of drawn loan assets and undrawn irrevocable loan commitments. The maximum exposure to credit risk on a drawn loan is its fair value. The Group’s maximum exposure to credit risk on drawn loans, including securities purchased under resale agreements and securities borrowed, was € 169 billion and € 160 billion as of December 31, 2011, and 2010, respectively. Exposure to credit risk also exists for undrawn irrevocable loan commitments and is predominantly counterparty credit risk.
The credit risk on the securities purchased under resale agreements and securities borrowed designated under the fair value option is mitigated by the holding of collateral. The valuation of these instruments takes into account the credit enhancement in the form of the collateral received. As such there is no material movement during the year or cumulatively due to movements in counterparty credit risk on these instruments.
Notes to the Consolidated Balance Sheet
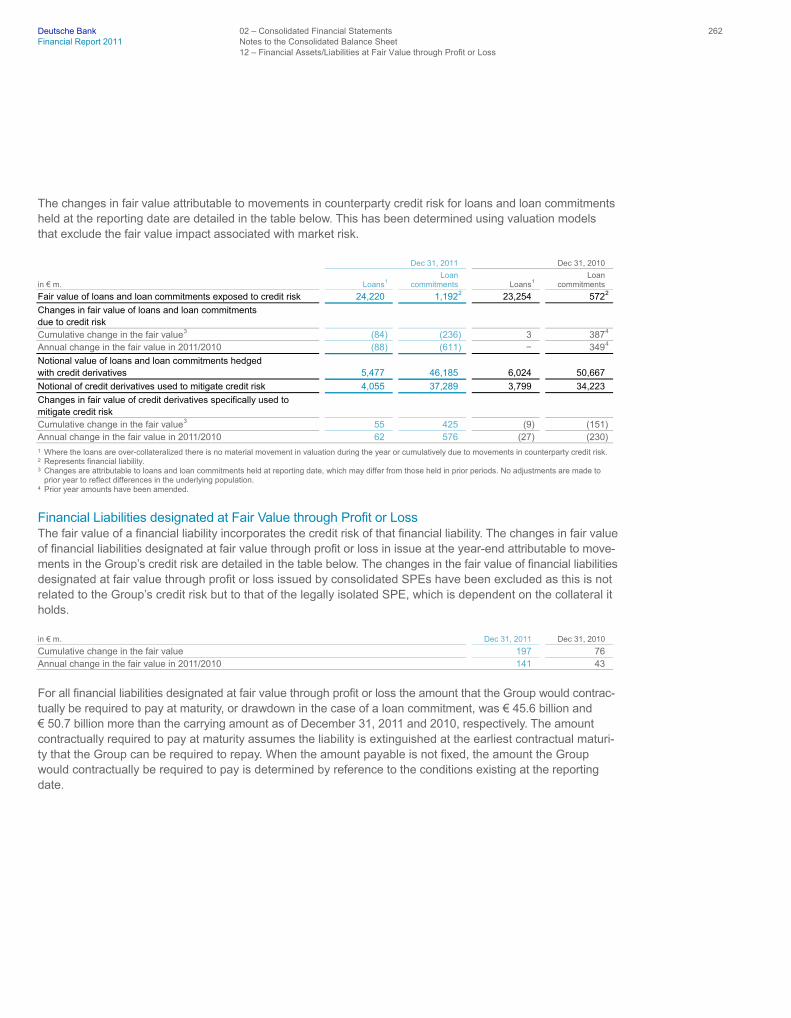
Deutsche Bank 02 – Consolidated Financial Statements 262 Financial Report 2011 Notes to the Consolidated Balance Sheet 12 – Financial Assets/Liabilities at Fair Value through Profit or Loss
The changes in fair value attributable to movements in counterparty credit risk for loans and loan commitments held at the reporting date are detailed in the table below. This has been determined using valuation models that exclude the fair value impact associated with market risk.
Dec 31, 2011 Dec 31, 2010
in € m. Loans
1
Loan commitments Loans
1
Loan commitments
Fair value of loans and loan commitments exposed to credit risk 24,220 1,192
2 23,254 572
2
Changes in fair value of loans and loan commitments due to credit risk
Cumulative change in the fair value
3 (84) (236) 3 387
4 Annual change in the fair value in 2011/2010 (88) (611) − 349
4
Notional value of loans and loan commitments hedged with credit derivatives 5,477 46,185 6,024 50,667
Notional of credit derivatives used to mitigate credit risk 4,055 37,289 3,799 34,223
Changes in fair value of credit derivatives specifically used to mitigate credit risk
Cumulative change in the fair value
3 55 425 (9) (151) Annual change in the fair value in 2011/2010 62 576 (27) (230) 1 Where the loans are over-collateralized there is no material movement in valuation during the year or cumulatively due to movements in counterparty credit risk. 2 Represents financial liability. 3 Changes are attributable to loans and loan commitments held at reporting date, which may differ from those held in prior periods. No adjustments are made to
prior year to reflect differences in the underlying population. 4 Prior year amounts have been amended.
Financial Liabilities designated at Fair Value through Profit or Loss The fair value of a financial liability incorporates the credit risk of that financial liability. The changes in fair value of financial liabilities designated at fair value through profit or loss in issue at the year-end attributable to move-ments in the Group’s credit risk are detailed in the table below. The changes in the fair value of financial liabilities designated at fair value through profit or loss issued by consolidated SPEs have been excluded as this is not related to the Group’s credit risk but to that of the legally isolated SPE, which is dependent on the collateral it holds.
in € m. Dec 31, 2011 Dec 31, 2010
Cumulative change in the fair value 197 76 Annual change in the fair value in 2011/2010 141 43 For all financial liabilities designated at fair value through profit or loss the amount that the Group would contrac-tually be required to pay at maturity, or drawdown in the case of a loan commitment, was € 45.6 billion and € 50.7 billion more than the carrying amount as of December 31, 2011 and 2010, respectively. The amount contractually required to pay at maturity assumes the liability is extinguished at the earliest contractual maturi-ty that the Group can be required to repay. When the amount payable is not fixed, the amount the Group would contractually be required to pay is determined by reference to the conditions existing at the reporting date.

Deutsche Bank 02 – Consolidated Financial Statements 263 Financial Report 2011 Notes to the Consolidated Balance Sheet 13 – Amendments to IAS 39 and IFRS 7, “Reclassification of Financial Assets”
The majority of the difference between the fair value of financial liabilities designated at fair value through profit or loss and the contractual cash flows which will occur at maturity is attributable to undrawn loan commitments where the contractual cash flow at maturity assumes full drawdown of the facility. The difference between the fair value and the contractual amount repayable at maturity excluding the amount of undrawn loan commitments designated at fair value through profit or loss was € 0.6 billion and € 0.6 billion as of December 31, 2011, and 2010, respectively.
13 – Amendments to IAS 39 and IFRS 7, “Reclassification of Financial Assets”
Under the amendments to IAS 39 and IFRS 7, issued in October 2008, certain financial assets were reclassi-fied in the second half of 2008 and the first quarter 2009 from the financial assets at fair value through profit or loss and the available for sale classifications into the loans classification. No reclassifications have been made since the first quarter 2009.
The Group identified assets, eligible under the amendments, for which at the reclassification date it had a clear change of intent and ability to hold for the foreseeable future rather than to exit or trade in the short term. The reclassifications were made at the fair value of the assets at the reclassification date.
The following table details the carrying values, unrealized fair value losses in accumulated other comprehen-sive income, ranges of effective interest rates based on weighted average rates by business and expected recoverable cash flows estimated at reclassification date.
in € bn. (unless stated otherwise)
Trading assets reclassified to loans
Financial assets available for sale reclassified to loans
Carrying value at reclassification date 26.6 11.4 Unrealized fair value losses in accumulated other comprehensive income − (1.1) Effective interest rates at reclassification date:
upper range 13.1 % 9.9 % lower range 2.8 % 3.9 %
Expected recoverable cash flows at reclassification date 39.6 17.6

Deutsche Bank 02 – Consolidated Financial Statements 264 Financial Report 2011 Notes to the Consolidated Balance Sheet 13 – Amendments to IAS 39 and IFRS 7, “Reclassification of Financial Assets”
The following table shows carrying values and fair values by asset type as of December 31, 2011 and Decem-ber 31, 2010 of the assets reclassified in 2008 and 2009.
Dec 31, 2011 Dec 31, 2010
in € m. Carrying value Fair value Carrying value Fair Value
Trading assets reclassified to loans: Securitized assets
1 6,733 5,501 8,438 7,035 Debt securities 859 823 1,016 923 Loans 7,754 7,117 8,544 7,945
Total trading assets reclassified to loans 15,346 13,441 17,998 15,903
Financial assets available for sale reclassified to loans: Securitized assets
1 6,220 5,359 7,378 6,521 Loans 1,337 1,427 1,306 1,284
Total financial assets available for sale reclassified to loans 7,557 6,786 8,684 7,805
Total financial assets reclassified to loans 22,903 20,227 26,682 23,708 1 Securitized assets consists of mortgage- and asset-backed securities.
Sales of reclassified assets are individually subject to a governance and approval process to determine if a sale is the best course of action for the Group’s overall profitability, capital position and regulatory com-pliance. During 2011 the Group sold reclassified assets with a carrying value of € 1.1 billion. Of the sales that occurred in 2011 all were assets that were previously classified as trading, including € 0.6 billion of asset-backed securities. These sales resulted in net gains of € 34 million. The aforementioned governance and approval process determined that the assets sold were due to circumstances that were not foreseeable at the time of the reclassification, including amendments to the capital rules that led to significantly higher absolute capital requirements for the Group as a whole.
In addition to sales, the decrease in the carrying value of reclassified assets previously classified as trading includes € 622 million attributable to restructuring of mortgage-backed securities and € 587 million attributa-ble to the maturing of loans. The decrease also includes redemptions and maturities of € 1.2 billion of asset-backed securities previously classified as available for sale. Provisions for credit losses taken during the period were mostly against loans formerly classified as trading in the commercial real estate and leveraged lending businesses.
The unrealized fair value gains (losses) that would have been recognized in profit or loss and the net gains (losses) that would have been recognized in other comprehensive income if the reclassifications had not been made are shown in the table below.
in € m. 2011 2010 2009
Unrealized fair value gains (losses) on the reclassified trading assets, gross of provisions for credit losses (11) 120 (884) Impairment losses on the reclassified financial assets available for sale which were impaired (16) (7) (9) Net gains (losses) recognized in other comprehensive income representing additionalunrealized fair value gains (losses) on the reclassified financial assets available for sale which were not impaired
133 251 1,147

Deutsche Bank 02 – Consolidated Financial Statements 265 Financial Report 2011 Notes to the Consolidated Balance Sheet 14 – Financial Instruments carried at Fair Value
After reclassification, the pre-tax contribution of all reclassified assets to the income statement was as follows.
in € m. 2011 2010 2009
Interest income 691
1 1,154 1,368 Provision for credit losses (186) (278) (1,047) Other income
2 34 1 −
Income before income taxes on reclassified trading assets 539 877 321
Interest income 153 146 227 Provision for credit losses (1) − (205) Other income
2 − (1) −
Income before income taxes on reclassified financial assets available for sale 152 145 22 1 The significant decrease in Interest Income for 2011 is mostly due to the restructuring of loans to Actavis Group that occurred in 2010 and are no longer part of the
reclassified asset population. 2 Predominantly relates to gains and losses from the sale of reclassified assets.
Prior to their reclassification, assets reclassified in 2009 contributed fair value losses of € 252 million to the income statement for the year ended December 31, 2008 and fair value losses of € 48 million to the income statement for the year ended December 31, 2009.
Prior to their reclassification, assets reclassified from trading in 2008 contributed fair value losses of € 1.8 billion to the income statement for the year ended December 31, 2008. Assets reclassified from available for sale during 2008 contributed, prior to their reclassification, impairment charges of € 174 million to the income statement and additional unrealized losses of € 736 million to the consolidated statement of comprehensive income for the year ended December 31, 2008.
14 – Financial Instruments carried at Fair Value
Valuation Methods and Control The Group has an established valuation control framework which governs internal control standards, method-ologies, and procedures over the valuation process.
Prices Quoted in Active Markets: The fair value of instruments that are quoted in active markets are determined using the quoted prices where they represent those at which regularly and recently occurring transactions take place.
Valuation Techniques: The Group uses valuation techniques to establish the fair value of instruments where prices, quoted in active markets, are not available. Valuation techniques used for financial instruments include modeling techniques, the use of indicative quotes for proxy instruments, quotes from less recent and less regular transactions and broker quotes.
Deutsche Bank 02 – Consolidated Financial Statements 266 Financial Report 2011 Notes to the Consolidated Balance Sheet 14 – Financial Instruments carried at Fair Value
For some financial instruments a rate or other parameter, rather than a price, is quoted. Where this is the case then the market rate or parameter is used as an input to a valuation model to determine fair value. For some instruments, modeling techniques follow industry standard models for example, discounted cash flow analysis and standard option pricing models. These models are dependent upon estimated future cash flows, discount factors and volatility levels. For more complex or unique instruments, more sophisticated modeling techniques are required, and may rely upon assumptions or more complex parameters such as correlations, prepayment speeds, default rates and loss severity.
Frequently, valuation models require multiple parameter inputs. Where possible, parameter inputs are based on observable data or are derived from the prices of relevant instruments traded in active markets. Where observable data is not available for parameter inputs then other market information is considered. For example, indicative broker quotes and consensus pricing information is used to support parameter inputs where they are available. Where no observable information is available to support parameter inputs then they are based on other relevant sources of information such as prices for similar transactions, historic data, economic fundamentals, and research information, with appropriate adjustment to reflect the terms of the actual instrument being valued and current market conditions.
Valuation Adjustments: Valuation adjustments are an integral part of the valuation process. In making appropriate valuation adjustments, the Group follows methodologies that consider factors such as bid/offer spreads, liquid-ity and counterparty credit risk. Bid/offer spread valuation adjustments are required to adjust mid market valua-tions to the appropriate bid or offer valuation. The bid or offer valuation is the best representation of the fair value for an instrument, and therefore its fair value. The carrying value of a long position is adjusted from mid to bid, and the carrying value of a short position is adjusted from mid to offer. Bid/offer valuation adjustments are determined from bid-offer prices observed in relevant trading activity and in quotes from other broker-dealers or other knowledgeable counterparties. Where the quoted price for the instrument is already a bid/offer price then no bid/offer valuation adjustment is necessary. Where the fair value of financial instruments is derived from a modeling technique then the parameter inputs into that model are normally at a mid-market level. Such instru-ments are generally managed on a portfolio basis and valuation adjustments are taken to reflect the cost of closing out the net exposure the Bank has to each of the input parameters. These adjustments are determined from bid/offer prices observed in relevant trading activity and quotes from other broker-dealers.
Where complex valuation models are used, or where less-liquid positions are being valued, then bid/offer levels for those positions may not be available directly from the market, and therefore the close-out cost of these positions, models and parameters must be estimated. When these adjustments are designed, the Group closely examines the valuation risks associated with the model as well as the positions themselves, and the resulting adjustments are closely monitored on an ongoing basis.
Counterparty credit valuation adjustments are required to cover expected credit losses to the extent that the valuation technique does not already include an expected credit loss factor. For example, a valuation adjustment is required to cover expected credit losses on over-the-counter derivatives which are typically not reflected in mid-market or bid/offer quotes. The adjustment amount is determined at each reporting date by assessing the potential credit exposure to all counterparties taking into account any collateral held, the effect of any master netting agreements, expected loss given default and the credit risk for each counterparty based on market evidence, which may include default levels implied from historic information, fundamental analysis of finan-cial information, and Credit Default Swaps (CDS) spreads.

Deutsche Bank 02 – Consolidated Financial Statements 267 Financial Report 2011 Notes to the Consolidated Balance Sheet 14 – Financial Instruments carried at Fair Value
Similarly, in establishing the fair value of derivative liabilities the Group considers its own creditworthiness on derivatives by assessing all counterparties’ potential future exposure to the Group, taking into account any collateral held, the effect of any master netting agreements, expected loss given default and the credit risk of the Group based on historic default levels of entities of the same credit quality.
Where there is uncertainty in the assumptions used within a modeling technique, an additional adjustment is taken to calibrate the model price to the expected market price of the financial instrument. Typically, such trans-actions have bid/offer levels which are less observable, and these adjustments aim to estimate the bid/offer by computing the risk-premium associated with the transaction. Where a financial instrument is part of a group of transactions risk managed on a portfolio basis, but where the trade itself is of sufficient complexity that the cost of closing it out would be higher than the cost of closing out its component risks, then an additional adjustment is taken to reflect this fact.
Validation and Control: The Group has an independent specialist valuation group within the Finance function which oversees and develops the valuation control framework and manages the valuation control processes. The mandate of this specialist function includes the performance of the valuation control process for the complex derivative businesses as well as the continued development of valuation control methodologies and the valuation policy framework. Results of the valuation control process are collected and analyzed as part of a standard monthly reporting cycle. Variances of differences outside of preset and approved tolerance levels are escalated both within the Finance function and with Senior Business Management for review, resolution and, if required, adjustment.
For instruments where fair value is determined from valuation models, the assumptions and techniques used within the models are independently validated by an independent specialist model validation group that is part of the Group’s Risk Management function.
Quotes for transactions and parameter inputs are obtained from a number of third party sources including ex-changes, pricing service providers, firm broker quotes and consensus pricing services. Price sources are examined and assessed to determine the quality of fair value information they represent, with greater em-phasis given to those possessing greater valuation certainty and relevance. The results are compared against actual transactions in the market to ensure the model valuations are calibrated to market prices.
Price and parameter inputs to models, assumptions and valuation adjustments are verified against independ-ent sources. Where they cannot be verified to independent sources due to lack of observable information, the estimate of fair value is subject to procedures to assess its reasonableness. Such procedures include performing revaluation using independently generated models (including where existing models are independently recali-brated), assessing the valuations against appropriate proxy instruments and other benchmarks, and perform-ing extrapolation techniques. Assessment is made as to whether the valuation techniques yield fair value estimates that are reflective of market levels by calibrating the results of the valuation models against market transactions where possible.

Deutsche Bank 02 – Consolidated Financial Statements 268 Financial Report 2011 Notes to the Consolidated Balance Sheet 14 – Financial Instruments carried at Fair Value
Management Judgment: In reaching estimates of fair value management judgment needs to be exercised. The areas requiring significant management judgment are identified, documented and reported to senior manage-ment as part of the valuation control framework and the standard monthly reporting cycle. The specialist model validation and valuation groups focus attention on the areas of subjectivity and judgment.
The level of management judgment required in establishing fair value of financial instruments for which there is a quoted price in an active market is usually minimal. Similarly there is little subjectivity or judgment required for instruments valued using valuation models which are standard across the industry and where all parameter inputs are quoted in active markets.
The level of subjectivity and degree of management judgment required is more significant for those instruments valued using specialized and sophisticated models and where some or all of the parameter inputs are not observable. Management judgment is required in the selection and application of appropriate parameters, assumptions and modeling techniques. In particular, where data is obtained from infrequent market trans-actions then extrapolation and interpolation techniques must be applied. In addition, where no market data is available then parameter inputs are determined by assessing other relevant sources of information such as historical data, fundamental analysis of the economics of the transaction and proxy information from similar transactions and making appropriate adjustment to reflect the actual instrument being valued and current mar-ket conditions. Where different valuation techniques indicate a range of possible fair values for an instrument then management has to establish what point within the range of estimates best represents the fair value. Further, some valuation adjustments may require the exercise of management judgment to ensure they achieve fair value.
Fair Value Hierarchy The financial instruments carried at fair value have been categorized under the three levels of the IFRS fair value hierarchy as follows:
Level 1 – Instruments valued using quoted prices in active markets: These are instruments where the fair value can be determined directly from prices which are quoted in active, liquid markets and where the instrument observed in the market is representative of that being priced in the Group’s inventory.
These instruments include: high-liquidity treasuries and derivative, equity and cash products traded on high-liquidity exchanges.

Deutsche Bank 02 – Consolidated Financial Statements 269 Financial Report 2011 Notes to the Consolidated Balance Sheet 14 – Financial Instruments carried at Fair Value
Level 2 – Instruments valued with valuation techniques using observable market data: These are instruments where the fair value can be determined by reference to similar instruments trading in active markets, or where a technique is used to derive the valuation but where all inputs to that technique are observable.
These instruments include: many over-the-counter (OTC) derivatives; many investment-grade listed credit bonds; some credit default swaps (CDS); many collateralized debt obligations (CDO); and many less-liquid equities.
Level 3 – Instruments valued using valuation techniques using market data which is not directly observable: These are instruments where the fair value cannot be determined directly by reference to market-observable information, and some other pricing technique must be employed. Instruments classified in this category have an element which is unobservable and which has a significant impact on the fair value.
These instruments include: more-complex OTC derivatives; distressed debt; highly-structured bonds; illiquid asset-backed securities (ABS); illiquid CDOs (cash and synthetic); monoline exposures; private equity place-ments; many commercial real estate (CRE) loans; illiquid loans; and some municipal bonds.
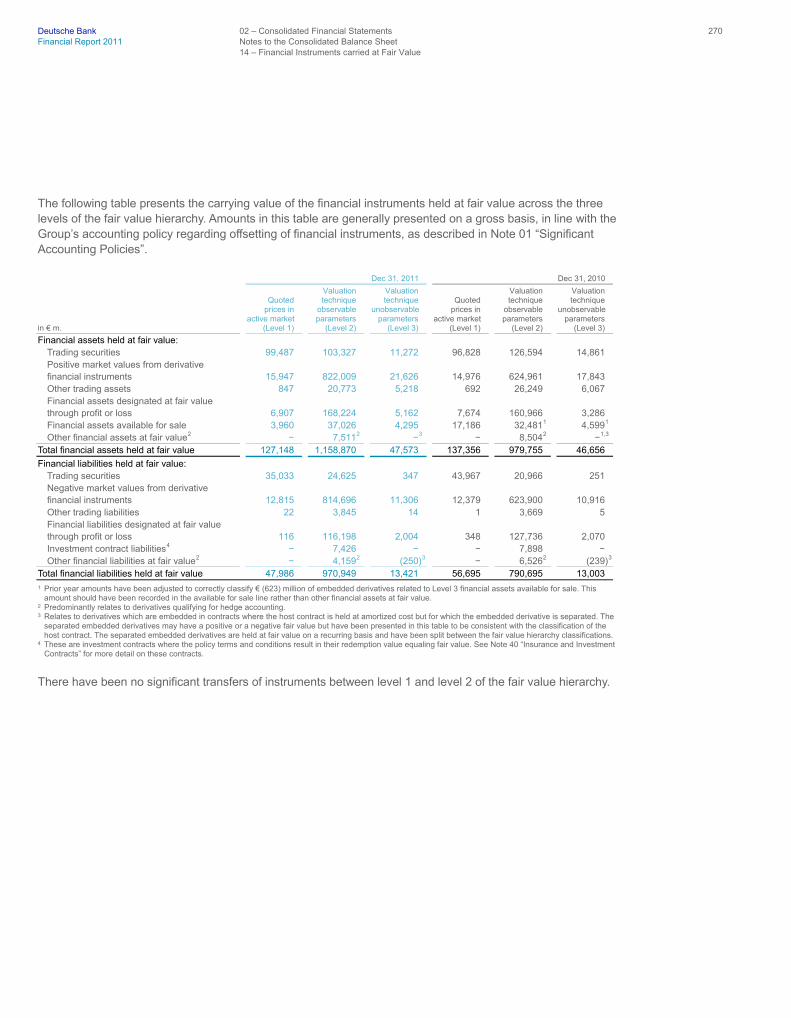
Deutsche Bank 02 – Consolidated Financial Statements 270 Financial Report 2011 Notes to the Consolidated Balance Sheet 14 – Financial Instruments carried at Fair Value
The following table presents the carrying value of the financial instruments held at fair value across the three levels of the fair value hierarchy. Amounts in this table are generally presented on a gross basis, in line with the Group’s accounting policy regarding offsetting of financial instruments, as described in Note 01 “Significant Accounting Policies”.
Dec 31, 2011 Dec 31, 2010
in € m.
Quoted prices in active market (Level 1)
Valuation technique observable parameters (Level 2)
Valuation techniqueunobservable parameters (Level 3)
Quoted prices inactive market (Level 1)
Valuation technique observable parameters (Level 2)
Valuation technique unobservable parameters (Level 3)
Financial assets held at fair value: Trading securities 99,487 103,327 11,272 96,828 126,594 14,861 Positive market values from derivative financial instruments 15,947 822,009 21,626 14,976 624,961 17,843 Other trading assets 847 20,773 5,218 692 26,249 6,067 Financial assets designated at fair value through profit or loss 6,907 168,224 5,162 7,674 160,966 3,286 Financial assets available for sale 3,960 37,026 4,295 17,186 32,481
1 4,599
1 Other financial assets at fair value
2 − 7,511
2 −
3 − 8,504
2 −
1,3 Total financial assets held at fair value 127,148 1,158,870 47,573 137,356 979,755 46,656
Financial liabilities held at fair value: Trading securities 35,033 24,625 347 43,967 20,966 251 Negative market values from derivative financial instruments 12,815 814,696 11,306 12,379 623,900 10,916 Other trading liabilities 22 3,845 14 1 3,669 5 Financial liabilities designated at fair value through profit or loss 116 116,198 2,004 348 127,736 2,070 Investment contract liabilities
4 − 7,426 − − 7,898 − Other financial liabilities at fair value
2 − 4,159
2 (250)
3 − 6,526
2 (239)
3 Total financial liabilities held at fair value 47,986 970,949 13,421 56,695 790,695 13,003 1 Prior year amounts have been adjusted to correctly classify € (623) million of embedded derivatives related to Level 3 financial assets available for sale. This
amount should have been recorded in the available for sale line rather than other financial assets at fair value. 2 Predominantly relates to derivatives qualifying for hedge accounting. 3 Relates to derivatives which are embedded in contracts where the host contract is held at amortized cost but for which the embedded derivative is separated. The
separated embedded derivatives may have a positive or a negative fair value but have been presented in this table to be consistent with the classification of the host contract. The separated embedded derivatives are held at fair value on a recurring basis and have been split between the fair value hierarchy classifications.
4 These are investment contracts where the policy terms and conditions result in their redemption value equaling fair value. See Note 40 “Insurance and Investment Contracts” for more detail on these contracts.
There have been no significant transfers of instruments between level 1 and level 2 of the fair value hierarchy.

Deutsche Bank 02 – Consolidated Financial Statements 271 Financial Report 2011 Notes to the Consolidated Balance Sheet 14 – Financial Instruments carried at Fair Value
Valuation Techniques The following is an explanation of the valuation techniques used in establishing the fair value of the different types of financial instruments that the Group trades.
Sovereign, Quasi-sovereign and Corporate Debt and Equity Securities: Where there are no recent transactions then fair value may be determined from the last market price adjusted for all changes in risks and information since that date. Where a close proxy instrument is quoted in an active market then fair value is determined by adjusting the proxy value for differences in the risk profile of the instruments. Where close proxies are not available then fair value is estimated using more complex modeling techniques. These techniques include discounted cash flow models using current market rates for credit, interest, liquidity and other risks. For equity securities modeling techniques may also include those based on earnings multiples.
Mortgage- and Other Asset-Backed Securities (ABS): These instruments include residential and commercial mortgage-backed securities and other asset-backed securities including CDOs. ABS have specific characteris-tics as they have different underlying assets and the issuing entities have different capital structures. The complexity increases further where the underlying assets are themselves ABS, as is the case with many of the CDO instruments.
Where no reliable external pricing is available, ABS are valued, where applicable, using either relative value analysis which is performed based on similar transactions observable in the market, or industry-standard valuation models incorporating available observable inputs. The industry standard external models calculate principal and interest payments for a given deal based on assumptions that can be independently price tested. The inputs include prepayment speeds, loss assumptions (timing and severity) and a discount rate (spread, yield or discount margin). These inputs/assumptions are derived from actual transactions, external market research and market indices where appropriate.
Loans: For certain loans fair value may be determined from the market price on a recently occurring transac-tion adjusted for all changes in risks and information since that transaction date. Where there are no recent market transactions then broker quotes, consensus pricing, proxy instruments or discounted cash flow mod-els are used to determine fair value. Discounted cash flow models incorporate parameter inputs for credit risk, interest rate risk, foreign exchange risk, loss given default estimates and amounts utilized given default, as appropriate. Credit risk, loss given default and utilization given default parameters are determined using infor-mation from the loan or CDS markets, where available and appropriate.
Leveraged loans can have transaction-specific characteristics which can limit the relevance of market-observed transactions. Where similar transactions exist for which observable quotes are available from external pricing services then this information is used with appropriate adjustments to reflect the transaction differences. When no similar transactions exist, a discounted cash flow valuation technique is used with credit spreads derived from the appropriate leveraged loan index, incorporating the industry classification, subordination of the loan, and any other relevant information on the loan and loan counterparty.
Deutsche Bank 02 – Consolidated Financial Statements 272 Financial Report 2011 Notes to the Consolidated Balance Sheet 14 – Financial Instruments carried at Fair Value
Over-The-Counter Derivative Financial Instruments: Market standard transactions in liquid trading markets, such as interest rate swaps, foreign exchange forward and option contracts in G7 currencies, and equity swap and option contracts on listed securities or indices are valued using market standard models and quoted parameter inputs. Parameter inputs are obtained from pricing services, consensus pricing services and recently occurring transactions in active markets wherever possible.
More complex instruments are modeled using more sophisticated modeling techniques specific for the instrument and are calibrated to available market prices. Where the model output value does not calibrate to a relevant market reference then valuation adjustments are made to the model output value to adjust for any difference. In less active markets, data is obtained from less frequent market transactions, broker quotes and through extrapolation and interpolation techniques. Where observable prices or inputs are not available, management judgment is required to determine fair values by assessing other relevant sources of information such as his-torical data, fundamental analysis of the economics of the transaction and proxy information from similar trans-actions.
Financial Liabilities Designated at Fair Value through Profit or Loss under the Fair Value Option: The fair value of financial liabilities designated at fair value through profit or loss under the fair value option incorporates all market risk factors including a measure of the Group’s credit risk relevant for that financial liability. The financial liabilities include structured note issuances, structured deposits, and other structured securities issued by consolidated vehicles, which may not be quoted in an active market. The fair value of these financial liabilities is determined by discounting the contractual cash flows using the relevant credit-adjusted yield curve. The market risk parameters are valued consistently to similar instruments held as assets, for example, any deriva-tives embedded within the structured notes are valued using the same methodology discussed in the “Over-The-Counter Derivative Financial Instruments” section above.
Where the financial liabilities designated at fair value through profit or loss under the fair value option are col-lateralized, such as securities loaned and securities sold under repurchase agreements, the credit enhance-ment is factored into the fair valuation of the liability.
Investment Contract Liabilities: Assets which are linked to the investment contract liabilities are owned by the Group. The investment contract obliges the Group to use these assets to settle these liabilities. Therefore, the fair value of investment contract liabilities is determined by the fair value of the underlying assets (i.e., amount payable on surrender of the policies).

Deutsche Bank 02 – Consolidated Financial Statements 273 Financial Report 2011 Notes to the Consolidated Balance Sheet 14 – Financial Instruments carried at Fair Value
Analysis of Financial Instruments with Fair Value Derived from Valuation Techniques Containing Significant Unobservable Parameters (Level 3) The table below presents the financial instruments categorized in level 3 followed by an analysis and discus-sion of the financial instruments so categorized. Some of the instruments in level 3 of the fair value hierarchy have identical or similar offsetting exposures to the unobservable input. However, according to IFRS they are required to be presented as gross assets and liabilities in the table below.
in € m. Dec 31, 2011 Dec 31, 2010
Financial assets held at fair value: Trading securities:
Sovereign and quasi-sovereign obligations 1,045 576 Mortgage- and other asset-backed securities 3,724 6,302 Corporate debt securities and other debt obligations 5,979 7,406 Equity securities 524 577
Total trading securities 11,272 14,861 Positive market values from derivative financial instruments 21,626 17,843 Other trading assets 5,218 6,067 Financial assets designated at fair value through profit or loss:
Loans 4,496 2,740 Other financial assets designated at fair value through profit or loss 666 546
Total financial assets designated at fair value through profit or loss 5,162 3,286 Financial assets available for sale 4,295 4,599
1 Other financial assets at fair value − −
1 Total financial assets held at fair value 47,573 46,656
Financial liabilities held at fair value: Trading securities 347 251 Negative market values from derivative financial instruments 11,306 10,916 Other trading liabilities 14 5 Financial liabilities designated at fair value through profit or loss:
Loan commitments 1,194 572 Long-term debt 801 1,481 Other financial liabilities designated at fair value through profit or loss 9 17
Total financial liabilities designated at fair value through profit or loss 2,004 2,070 Other financial liabilities at fair value (250) (239) Total financial liabilities held at fair value 13,421 13,003 1 Prior year amounts have been adjusted to correctly classify € (623) million of embedded derivatives related to Level 3 financial assets available for sale. This
amount should have been recorded in the available for sale line rather than other financial assets at fair value.
Trading Securities: Certain illiquid emerging market corporate bonds and illiquid highly structured corporate bonds are included in this level of the hierarchy. In addition, some of the holdings of notes issued by securitization entities, commercial and residential mortgage-backed securities, collateralized debt obligation securities and other asset-backed securities are reported here. The decrease in the balance during the period is mainly due to transfers of assets from level 3 to level 2 due to improved observability of input parameters used to value these instruments.
Positive and Negative Market Values from Derivative Financial Instruments: Derivatives categorized in this level of the fair value hierarchy are valued based on one or more significant unobservable parameters. The unobservable parameters may include certain correlations, certain longer-term volatilities, certain prepayment rates, credit spreads and other transaction-specific parameters.

Deutsche Bank 02 – Consolidated Financial Statements 274 Financial Report 2011 Notes to the Consolidated Balance Sheet 14 – Financial Instruments carried at Fair Value
The following derivatives are included within this level of the hierarchy: customized CDO derivatives in which the underlying reference pool of corporate assets is not closely comparable to regularly market-traded indices; certain tranched index credit derivatives; certain options where the volatility is unobservable; certain basket options in which the correlations between the referenced underlying assets are unobservable; longer-term interest rate option derivatives; multi-currency foreign exchange derivatives; and certain credit default swaps for which the credit spread is not observable.
During the period the market value of derivatives increased. This increase was due to both mark-to-market gains on the instruments and transfers of derivative assets from level 2 to level 3 of the hierarchy due to unob-servability of input parameters used to value these instruments.
Other Trading Instruments: Other trading instruments classified in level 3 of the fair value hierarchy mainly consist of traded loans valued using valuation models based on one or more significant unobservable parameters. The loan balance reported in this level of the fair value hierarchy comprises illiquid leveraged loans and illiquid residential and commercial mortgage loans. The balance was reduced in the year mainly due to the net impact of purchases and sales of level 3 assets across a range of businesses.
Financial Assets/Liabilities designated at Fair Value through Profit or Loss: Certain corporate loans and struc-tured liabilities which were designated at fair value through profit or loss under the fair value option are catego-rized in this level of the fair value hierarchy. The corporate loans are valued using valuation techniques which incorporate observable credit spreads, recovery rates and unobservable utilization parameters. Revolving loan facilities are reported in the third level of the hierarchy because the utilization in the event of the default pa-rameter is significant and unobservable.
In addition, certain hybrid debt issuances designated at fair value through profit or loss containing embedded derivatives are valued based on significant unobservable parameters. These unobservable parameters include single stock volatility correlations. The increase in the balance during the period is primarily due to the issuance of new loans.
Financial Assets Available for Sale: Unlisted equity instruments are reported in this level of the fair value hierar-chy where there is no close proxy and the market is very illiquid.

Deutsche Bank 02 – Consolidated Financial Statements 275 Financial Report 2011 Notes to the Consolidated Balance Sheet 14 – Financial Instruments carried at Fair Value
Reconciliation of financial instruments classified in Level 3 The table below presents a reconciliation of financial instruments categorized in level 3 of the fair value hierar-chy. Although some of the instruments in level 3 of the fair value hierarchy have identical or similar offsetting exposures to the unobservable input, they are required to be presented as gross assets and liabilities in the table below. Further, certain instruments are hedged with instruments in level 1 or level 2 but the table below does not include the gains and losses on these hedging instruments. Additionally, both observable and unob-servable parameters may be used to determine the fair value of an instrument classified within level 3 of the fair value hierarchy; the gains and losses presented below are attributable to movements in both the ob-servable and unobservable parameters.
Transfers in and transfers out of level 3 during the year are recorded at their fair value at the beginning of year in the table below. For instruments transferred into level 3 the table shows the gains and losses and cash flows on the instruments as if they had been transferred at the beginning of the year. Similarly for instruments trans-ferred out of level 3 the table does not show any gains or losses or cash flows on the instruments during the year since the table is presented as if they have been transferred out at the beginning of the year.
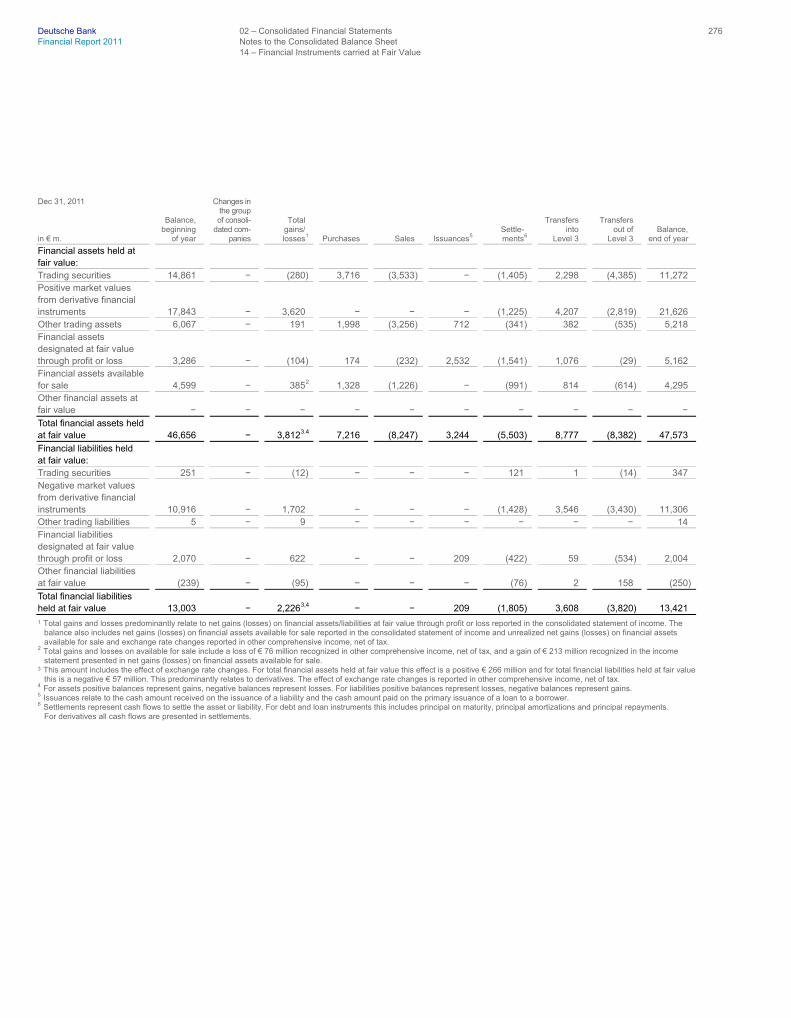
Deutsche Bank 02 – Consolidated Financial Statements 276 Financial Report 2011 Notes to the Consolidated Balance Sheet 14 – Financial Instruments carried at Fair Value
Dec 31, 2011 in € m.
Balance, beginning of year
Changes in the group of consoli- dated com- panies
Total gains/ losses
1 Purchases Sales Issuances
5 Settle- ments
6
Transfers into Level 3
Transfers out of Level 3
Balance,end of year
Financial assets held at fair value:
Trading securities 14,861 − (280) 3,716 (3,533) − (1,405) 2,298 (4,385) 11,272 Positive market values from derivative financial instruments
17,843 − 3,620 − − − (1,225) 4,207 (2,819) 21,626
Other trading assets 6,067 − 191 1,998 (3,256) 712 (341) 382 (535) 5,218 Financial assets designated at fair value through profit or loss
3,286 − (104) 174 (232) 2,532 (1,541) 1,076 (29) 5,162
Financial assets available for sale 4,599 − 385
2 1,328 (1,226) − (991) 814 (614) 4,295 Other financial assets at fair value − − − − − − − − − −
Total financial assets held at fair value 46,656 − 3,812
3.4 7,216 (8,247) 3,244 (5,503) 8,777 (8,382) 47,573
Financial liabilities held at fair value:
Trading securities 251 − (12) − − − 121 1 (14) 347 Negative market values from derivative financial instruments
10,916 − 1,702 − − − (1,428) 3,546 (3,430) 11,306
Other trading liabilities 5 − 9 − − − − − − 14 Financial liabilities designated at fair value through profit or loss
2,070 − 622 − − 209 (422) 59 (534) 2,004
Other financial liabilities at fair value (239) − (95) − − − (76) 2 158 (250)
Total financial liabilities held at fair value
13,003 − 2,226
3,4 − − 209 (1,805) 3,608 (3,820) 13,421 1 Total gains and losses predominantly relate to net gains (losses) on financial assets/liabilities at fair value through profit or loss reported in the consolidated statement of income. The
balance also includes net gains (losses) on financial assets available for sale reported in the consolidated statement of income and unrealized net gains (losses) on financial assets available for sale and exchange rate changes reported in other comprehensive income, net of tax.
2 Total gains and losses on available for sale include a loss of € 76 million recognized in other comprehensive income, net of tax, and a gain of € 213 million recognized in the income statement presented in net gains (losses) on financial assets available for sale.
3 This amount includes the effect of exchange rate changes. For total financial assets held at fair value this effect is a positive € 266 million and for total financial liabilities held at fair value this is a negative € 57 million. This predominantly relates to derivatives. The effect of exchange rate changes is reported in other comprehensive income, net of tax.
4 For assets positive balances represent gains, negative balances represent losses. For liabilities positive balances represent losses, negative balances represent gains. 5 Issuances relate to the cash amount received on the issuance of a liability and the cash amount paid on the primary issuance of a loan to a borrower. 6 Settlements represent cash flows to settle the asset or liability. For debt and loan instruments this includes principal on maturity, principal amortizations and principal repayments.
For derivatives all cash flows are presented in settlements.

Deutsche Bank 02 – Consolidated Financial Statements 277 Financial Report 2011 Notes to the Consolidated Balance Sheet 14 – Financial Instruments carried at Fair Value
Dec 31, 2010 in € m.
Balance, beginning of year
Changes in the group of consoli- dated com- panies
1
Total gains/ losses
2 Purchases Sales Issuances
6 Settle- ments
7
Transfers into Level 3
Transfers out of Level 3
Balance,end of year
Financial assets held at fair value:
Trading securities 15,609 6 1,437 5,479 (6,292) − (1,412) 4,299 (4,265) 14,861 Positive market values from derivative financial instruments
25,211 74 589 32 (71) − (2,997) 1,111 (6,106) 17,843
Other trading assets 10,782 − (1) 1,439 (1,427) 173 (1,511) 424 (3,812) 6,067 Financial assets designated at fair value through profit or loss
3,410 − (97) 294 (23) 1,627 (1,909) 54 (70) 3,286
Financial assets available for sale 3,167 717
8 151
3 1,648 (491) − (351) 881 (1,123) 4,599
8
Other financial assets at fair value 41 −
8 − − − − (41) − − −
8
Total financial assets held at fair value 58,220 797 2,079
4,5 8,892 (8,304) 1,800 (8,221) 6,769 (15,376) 46,656
Financial liabilities held at fair value:
Trading securities 431 − 119 − − − (182) 3 (120) 251 Negative market values from derivative financial instruments
15,591 11 2,092 − − − (1,952) 1,531 (6,357) 10,916
Other trading liabilities 283 17 (271) − − − − − (24) 5 Financial liabilities designated at fair value through profit or loss
2,621 − 258 − − 448 (977) 180 (460) 2,070
Other financial liabilities at fair value (757) − 40 − − − 32 446 − (239)
Total financial liabilities held at fair value 18,169 28 2,238
4,5 − − 448 (3,079) 2,160 (6,961) 13,003 1 Amounts recorded in the changes in the group of consolidated companies predominantly relate to the consolidation of Postbank at December 3, 2010. 2 Total gains and losses predominantly relate to net gains (losses) on financial assets/liabilities at fair value through profit or loss reported in the consolidated statement of income. The
balance also includes net gains (losses) on financial assets available for sale reported in the consolidated statement of income and unrealized net gains (losses) on financial assets available for sale and exchange rate changes reported in other comprehensive income, net of tax.
3 Total gains and losses on available for sale include a gain of € 21 million recognized in other comprehensive income, net of tax, and a gain of € 38 million recognized in the income statement presented in net gains (losses) on financial assets available for sale.
4 This amount includes the effect of exchange rate changes. For total financial assets held at fair value this effect is a positive € 1.3 billion and for total financial liabilities held at fair value this is a negative € 184 million. This predominantly relates to derivatives. The effect of exchange rate changes is reported in other comprehensive income, net of tax.
5 For assets positive balances represent gains, negative balances represent losses. For liabilities positive balances represent losses, negative balances represent gains. 6 Issuances relate to the cash amount received on the issuance of a liability and the cash amount paid on the primary issuance of a loan to a borrower. 7 Settlements represent cash flows to settle the asset or liability. For debt and loan instruments this includes principal on maturity, principal amortizations and principal repayments.
For derivatives all cash flows are presented in settlements. 8 Prior year amounts have been adjusted to correctly classify € (623) million of embedded derivatives related to Level 3 financial assets available for sale. This amount should have been
recorded in the available for sale line rather than other financial assets at fair value.
Deutsche Bank 02 – Consolidated Financial Statements 278 Financial Report 2011 Notes to the Consolidated Balance Sheet 14 – Financial Instruments carried at Fair Value
Sensitivity Analysis of Unobservable Parameters Where the value of financial instruments is dependent on unobservable parameter inputs, the precise level for these parameters at the balance sheet date might be drawn from a range of reasonably possible alternatives. In preparing the financial statements, appropriate levels for these unobservable input parameters are chosen so that they are consistent with prevailing market evidence and in line with the Group’s approach to valuation control detailed above. Were the Group to have marked the financial instruments concerned using parameter values drawn from the extremes of the ranges of reasonably possible alternatives then as of December 31, 2011 it could have increased fair value by as much as € 3.5 billion or decreased fair value by as much as € 4.2 billion. As of December 31, 2010, it could have increased fair value by as much as € 3.6 billion or decreased fair value by as much as € 3.9 billion. In estimating these impacts, the Group either re-valued certain financial instruments using reasonably possible alternative parameter values, or used an approach based on its valuation adjustment methodology for bid/offer spread valuation adjustments. Bid/offer spread valuation adjustments reflect the amount that must be paid in order to close out a holding in an instrument or component risk and as such they reflect factors such as market illiquidity and uncertainty.
This disclosure is intended to illustrate the potential impact of the relative uncertainty in the fair value of finan-cial instruments for which valuation is dependent on unobservable input parameters. However, it is unlikely in practice that all unobservable parameters would be simultaneously at the extremes of their ranges of rea-sonably possible alternatives. Hence, the estimates disclosed above are likely to be greater than the true un-certainty in fair value at the balance sheet date. Furthermore, the disclosure is not predictive or indicative of future movements in fair value.
For many of the financial instruments considered here, in particular derivatives, unobservable input parameters represent only a subset of the parameters required to price the financial instrument, the remainder being ob-servable. Hence for these instruments the overall impact of moving the unobservable input parameters to the extremes of their ranges might be relatively small compared with the total fair value of the financial instrument. For other instruments, fair value is determined based on the price of the entire instrument, for example, by adjusting the fair value of a reasonable proxy instrument. In addition, all financial instruments are already carried at fair values which are inclusive of valuation adjustments for the cost to close out that instrument and hence already factor in uncertainty as it reflects itself in market pricing. Any negative impact of uncertainty calculated within this disclosure, then, will be over and above that already included in the fair value contained in the finan-cial statements.

Deutsche Bank 02 – Consolidated Financial Statements 279 Financial Report 2011 Notes to the Consolidated Balance Sheet 14 – Financial Instruments carried at Fair Value
The table below provides a breakdown of the sensitivity analysis by type of instrument. Where the exposure to an unobservable parameter is offset across different instruments then only the net impact is disclosed in the table.
Dec 31, 2011 Dec 31, 2010
in € m.
Positive fair value movement from using reasonable possible alternatives
Negative fair value movement from using reasonable possible alternatives
Positive fair value movement from using reasonable possible alternatives
Negative fair value movement from using reasonable possible alternatives
Derivatives: Credit 1,971 2,957 2,065 2,724 Equity 238 137 185 103 Interest related 94 114 143 157 Hybrid 415 293 321 121 Other 189 170 117 69
Securities: Debt securities 217 217 303 282 Equity securities 9 9 91 60 Mortgage- and asset-backed 5 5 77 59
Loans: Leveraged loans − − 3 3 Commercial loans − − 51 9 Traded loans 343 342 278 287
Total 3,481 4,244 3,634 3,874
Total Gains or Losses on Level 3 Instruments held or in Issue at the Reporting Date The total gains or losses are not due solely to unobservable parameters. Many of the parameter inputs to the valuation of instruments in this level of the hierarchy are observable and the gain or loss is partly due to move-ments in these observable parameters over the period. Many of the positions in this level of the hierarchy are economically hedged by instruments which are categorized in other levels of the fair value hierarchy. The off-setting gains and losses that have been recorded on all such hedges are not included in the table below, which only shows the gains and losses related to the level 3 classified instruments themselves held at the reporting date.
in € m. Dec 31, 2011 Dec 31, 2010
Financial assets held at fair value: Trading securities 113 943 Positive market values from derivative financial instruments 4,627 2,755 Other trading assets 238 150 Financial assets designated at fair value through profit or loss 12 (61) Financial assets available for sale 334 (30) Other financial assets at fair value − (31) Total financial assets held at fair value 5,324 3,726
Financial liabilities held at fair value: Trading securities (3) (109) Negative market values from derivative financial instruments (2,775) (75) Other trading liabilities 14 (4) Financial liabilities designated at fair value through profit or loss (765) (194) Other financial liabilities at fair value 106 29 Total financial liabilities held at fair value (3,423) (353)
Total 1,901 3,373
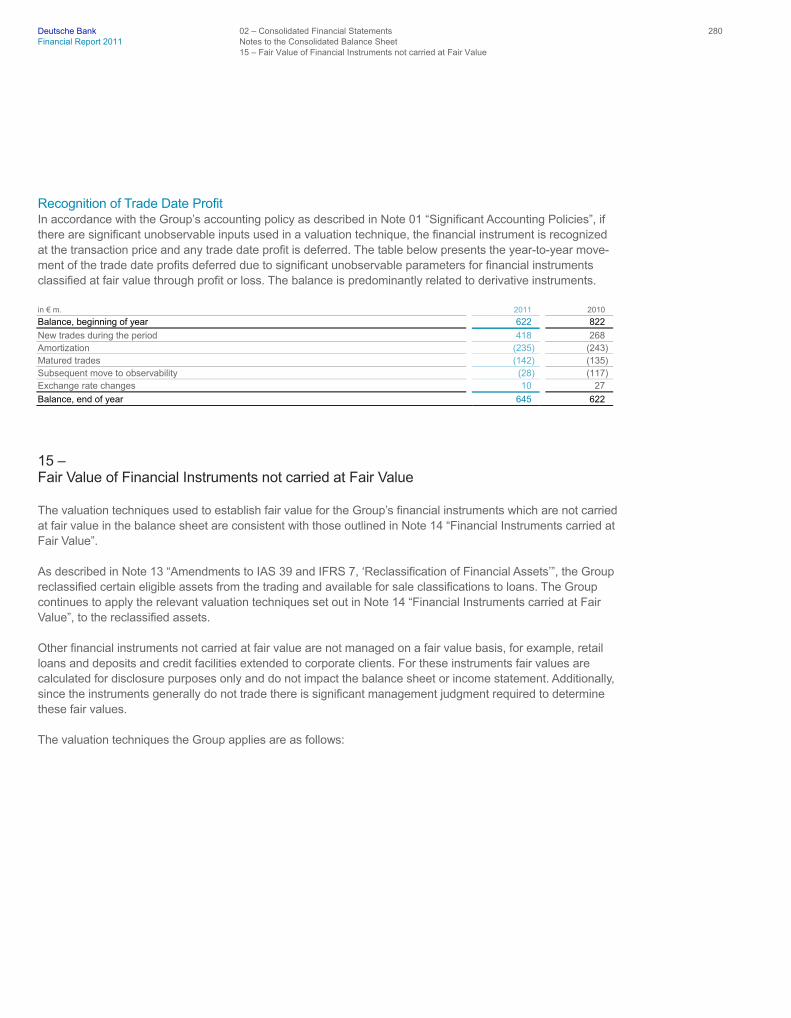
Deutsche Bank 02 – Consolidated Financial Statements 280 Financial Report 2011 Notes to the Consolidated Balance Sheet 15 – Fair Value of Financial Instruments not carried at Fair Value
Recognition of Trade Date Profit In accordance with the Group’s accounting policy as described in Note 01 “Significant Accounting Policies”, if there are significant unobservable inputs used in a valuation technique, the financial instrument is recognized at the transaction price and any trade date profit is deferred. The table below presents the year-to-year move-ment of the trade date profits deferred due to significant unobservable parameters for financial instruments classified at fair value through profit or loss. The balance is predominantly related to derivative instruments.
in € m. 2011 2010
Balance, beginning of year 622 822
New trades during the period 418 268 Amortization (235) (243) Matured trades (142) (135) Subsequent move to observability (28) (117) Exchange rate changes 10 27
Balance, end of year 645 622
15 – Fair Value of Financial Instruments not carried at Fair Value
The valuation techniques used to establish fair value for the Group’s financial instruments which are not carried at fair value in the balance sheet are consistent with those outlined in Note 14 “Financial Instruments carried at Fair Value”.
As described in Note 13 “Amendments to IAS 39 and IFRS 7, ‘Reclassification of Financial Assets’”, the Group reclassified certain eligible assets from the trading and available for sale classifications to loans. The Group continues to apply the relevant valuation techniques set out in Note 14 “Financial Instruments carried at Fair Value”, to the reclassified assets.
Other financial instruments not carried at fair value are not managed on a fair value basis, for example, retail loans and deposits and credit facilities extended to corporate clients. For these instruments fair values are calculated for disclosure purposes only and do not impact the balance sheet or income statement. Additionally, since the instruments generally do not trade there is significant management judgment required to determine these fair values.
The valuation techniques the Group applies are as follows:

Deutsche Bank 02 – Consolidated Financial Statements 281 Financial Report 2011 Notes to the Consolidated Balance Sheet 15 – Fair Value of Financial Instruments not carried at Fair Value
Short-term financial instruments: The carrying value represents a reasonable estimate of fair value for the following financial instruments which are predominantly short-term.
Assets Liabilities
Cash and due from banks Deposits Interest-earning deposits with banks Central bank funds purchased and securities sold under
repurchase agreements Central bank funds sold and securities purchased under resale agreements
Securities loaned
Securities borrowed Other short-term borrowings Other assets Other liabilities
For longer-term financial instruments within these categories, fair value is determined by discounting contractual cash flows using rates which could be earned for assets with similar remaining maturities and credit risks and, in the case of liabilities, rates at which the liabilities with similar remaining maturities could be issued, at the balance sheet date.
Loans: Fair value is determined using discounted cash flow models that incorporate parameter inputs for credit risk, interest rate risk, foreign exchange risk, loss given default estimates and amounts utilized given default, as appropriate. Credit risk, loss given default and utilization given default parameters are determined using infor-mation from the loan or credit default swap markets, where available and appropriate.
For retail lending portfolios with a large number of homogenous loans (e.g., German residential mortgages), the fair value is calculated on a portfolio basis by discounting the portfolio’s contractual cash flows using risk-free interest rates. This present value calculation is then adjusted for credit risk by discounting at the margins which could be earned on similar loans if issued at the balance sheet date. For other portfolios the present value calculation is adjusted for credit risk by calculating the expected loss over the estimated life of the loan based on various parameters including probability of default and loss given default and level of collateralization. The fair value of corporate lending portfolios is estimated by discounting a projected margin over expected maturities using parameters derived from the current market values of collateralized loan obligation (CLO) transactions collateralized with loan portfolios that are similar to the Group’s corporate lending portfolio.
Securities purchased under resale agreements, securities borrowed, securities sold under repurchase agree-ments and securities loaned: Fair value is derived from valuation techniques by discounting future cash flows using the appropriate credit risk-adjusted discount rate. The credit risk-adjusted discount rate includes con-sideration of the collateral received or pledged in the transaction. These products are typically short-term and highly collateralized, therefore the fair value is not significantly different to the carrying value.
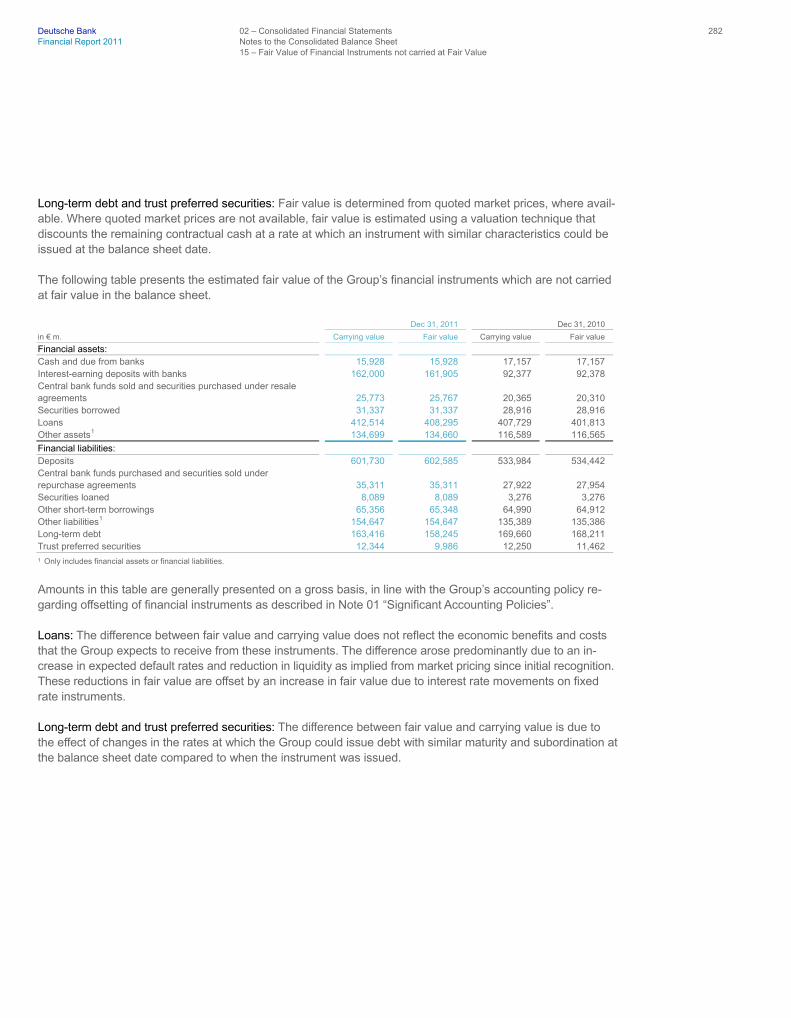
Deutsche Bank 02 – Consolidated Financial Statements 282 Financial Report 2011 Notes to the Consolidated Balance Sheet 15 – Fair Value of Financial Instruments not carried at Fair Value
Long-term debt and trust preferred securities: Fair value is determined from quoted market prices, where avail-able. Where quoted market prices are not available, fair value is estimated using a valuation technique that discounts the remaining contractual cash at a rate at which an instrument with similar characteristics could be issued at the balance sheet date.
The following table presents the estimated fair value of the Group’s financial instruments which are not carried at fair value in the balance sheet.
Dec 31, 2011 Dec 31, 2010
in € m. Carrying value Fair value Carrying value Fair value
Financial assets: Cash and due from banks 15,928 15,928 17,157 17,157 Interest-earning deposits with banks 162,000 161,905 92,377 92,378 Central bank funds sold and securities purchased under resale agreements 25,773 25,767 20,365 20,310 Securities borrowed 31,337 31,337 28,916 28,916 Loans 412,514 408,295 407,729 401,813 Other assets
1 134,699 134,660 116,589 116,565
Financial liabilities: Deposits 601,730 602,585 533,984 534,442 Central bank funds purchased and securities sold under repurchase agreements 35,311 35,311 27,922 27,954 Securities loaned 8,089 8,089 3,276 3,276 Other short-term borrowings 65,356 65,348 64,990 64,912 Other liabilities
1 154,647 154,647 135,389 135,386 Long-term debt 163,416 158,245 169,660 168,211 Trust preferred securities 12,344 9,986 12,250 11,462 1 Only includes financial assets or financial liabilities.
Amounts in this table are generally presented on a gross basis, in line with the Group’s accounting policy re-garding offsetting of financial instruments as described in Note 01 “Significant Accounting Policies”.
Loans: The difference between fair value and carrying value does not reflect the economic benefits and costs that the Group expects to receive from these instruments. The difference arose predominantly due to an in-crease in expected default rates and reduction in liquidity as implied from market pricing since initial recognition. These reductions in fair value are offset by an increase in fair value due to interest rate movements on fixed rate instruments.
Long-term debt and trust preferred securities: The difference between fair value and carrying value is due to the effect of changes in the rates at which the Group could issue debt with similar maturity and subordination at the balance sheet date compared to when the instrument was issued.

Deutsche Bank 02 – Consolidated Financial Statements 283 Financial Report 2011 Notes to the Consolidated Balance Sheet 16 – Financial Assets Available for Sale
16 – Financial Assets Available for Sale
The following are the components of financial assets available for sale:
in € m. Dec 31, 2011 Dec 31, 2010
Debt securities: German government 5,207 4,053 U.S. Treasury and U.S. government agencies 1,015 1,633 U.S. local (municipal) governments 605 563 Other foreign governments 10,919 17,688 Corporates 18,856 19,901 Other asset-backed securities 1,273 1,780 Mortgage-backed securities, including obligations of U.S. federal agencies 731 154 Other debt securities 775 442
Total debt securities 39,381 46,214
Equity securities: Equity shares 1,632 3,296 Investment certificates and mutual funds 236 132
Total equity securities 1,868 3,428
Other equity interests 1,116 2,251
Loans 2,916 2,373
Total financial assets available for sale 45,281 54,266
The decrease in debt securities available for sale 2011 was mainly driven by maturities and disposals of securi-ties, partly offset by increases from the change in classification of assets related to the BHF-BANK disposal group, which was classified as held for sale until April 2011. The decline in equity securities available for sale was primarily driven by the application of equity method accounting for the Group’s stake in Hua Xia Bank from February 2011.
Financial assets available for sale included Greek government bonds with a fair value of € 211 million as of December 31, 2011 and € 1.1 billion as of December 31, 2010. Substantially all of these bonds were acquired by Deutsche Bank as part of its acquisition of Postbank on December 3, 2010. The Group categorized Greek government bonds in Level 2 of the IFRS fair value hierarchy. Fair values as of December 31, 2011 were es-tablished from market data received from independent pricing sources.
Please also refer to Note 08 “Net Gains (Losses) on Financial Assets available for Sale” of this report. More information on financial assets/liabilities related to certain European countries is included on page 76 of this report (unaudited).

Deutsche Bank 02 – Consolidated Financial Statements 284 Financial Report 2011 Notes to the Consolidated Balance Sheet 17 – Equity Method Investments
17 – Equity Method Investments
Investments in associates and jointly controlled entities are accounted for using the equity method of accounting.
As of December 31, 2011 the following investees were significant, representing 75 % of the carrying value of equity method investments.
Investment
1 Ownership percentage
Actavis Equity S.à r.l., Munsbach
2 0.00 % BrisConnections Investment Trust, Kedron 35.59 % Huamao Property Holdings Ltd., George Town
3 0.00 % Hua Xia Bank Company Limited, Beijing
3 19.99 % Rongde Asset Management Company Limited, Beijing 40.70 % Station Holdco LLC, Wilmington 25.00 % 1 All significant equity method investments are investments in associates. 2 Equity method accounting based on subordinated financing arrangement. 3 The Group has significant influence over the investee through board seats or other measures.
Summarized aggregated financial information of significant equity method investees follows.
in € m. Dec 31, 2011 Dec 31, 2010
Total assets 147,793 131,002 Total liabilities 137,862 128,745 Revenues 5,478 4,988 Net income (loss) 696 (709) The following are the components of the net income (loss) from all equity method investments.
in € m. 2011 2010 2009
Net income (loss) from equity method investments: Pro-rata share of investees’ net income (loss) 222 457 189 Net gains (losses) on disposal of equity method investments 29 14 21 Impairments (515) (2,475) (151)
Total net income (loss) from equity method investments (264) (2,004) 59
2011 included an impairment of € 457 million related to Actavis Group, a generic pharmaceutical group.
In 2010 a charge of approximately € 2.3 billion attributable to the equity method investment in Deutsche Post-bank AG prior to consolidation was included. On December 3, 2010, Deutsche Bank gained a controlling majority in Postbank shares and commenced consolidation of the Postbank Group as of that date. As a consequence the Group ceased equity method accounting for its investment in Postbank. Further detail is included in Note 04 “Acquisitions and Dispositions”.
There was no unrecognized share of losses of an investee, neither for the period, nor cumulatively.
Deutsche Bank 02 – Consolidated Financial Statements 285 Financial Report 2011 Notes to the Consolidated Balance Sheet 17 – Equity Method Investments
Equity method investments for which there were published price quotations had a carrying value of € 2.2 billion and a fair value of € 2.1 billion as of December 31, 2011, and a carrying value of € 280 million and a fair value of € 561 million as of December 31, 2010. In 2011 Hua Xia Bank is included for the first time.
The investees have no significant contingent liabilities to which the Group is exposed.
In 2011 and 2010, none of the Group’s investees experienced any significant restrictions to transfer funds in the form of cash dividends, or repayment of loans or advances.
Hua Xia Bank. On May 6, 2010, Deutsche Bank announced that it had signed a binding agreement to sub-scribe for newly issued shares in Hua Xia Bank Co. Ltd. (“Hua Xia Bank”) for a total subscription price of RMB 5.6 billion (€ 587 million). Deutsche Bank’s subscription was part of a private placement of Hua Xia Bank shares to its three largest shareholders with an overall issuance value of up to RMB 20.8 billion (€ 2.2 billion). Upon final settlement of the transaction, which was effective with the registration of the new shares on April 26, 2011, this investment increased Deutsche Bank’s equity stake in Hua Xia Bank from 17.12 % to 19.99 % of issued capital.
The purchase of the newly issued shares was subject to substantive regulatory approvals to be granted by various Chinese regulatory agencies. The last substantive regulatory approval, which resulted in Deutsche Bank having a claim to receive the additional shares and the associated voting rights, was received on Febru-ary 11, 2011.
Upon this date, the new shares to be issued have been taken into consideration when assessing Deutsche Bank’s level of influence in accordance with IAS 28, “Investments in Associates”, because they represent po-tential voting rights.
As of February 11, 2011, Deutsche Bank’s influence was represented by the existing voting rights of 17.12 % and the potential voting rights of 2.87 %. The resulting 19.99 % of the voting power is considered to evidence significant influence because it is materially equal to the 20 % of the voting power upon which significant influ-ence is generally presumed to exist. Furthermore, Deutsche Bank’s significant influence is evidenced by the fact that Deutsche Bank has successfully negotiated its stake increase with Hua Xia Bank’s management and the other stakeholders and is represented on four of six of Hua Xia Bank Board Committees.
The equity method of accounting has been applied from February 11, 2011.
Upon reclassifying the investment from Financial assets available for sale to Equity method investments in the first quarter 2011, Deutsche Bank used the remeasurement approach by analogy to IFRS 3R, “Business Com-binations”. As a result unrealized net gains of € 263 million previously recorded in Other comprehensive in-come were reclassified into Net gains (losses) on financial assets available for sale in the income statement.
The reclassification of the investment and the increase of the equity stake resulted in an increase of the bal-ance sheet position Equity method investments by € 2.0 billion as of December 31, 2011.

Deutsche Bank 02 – Consolidated Financial Statements 286 Financial Report 2011 Notes to the Consolidated Balance Sheet 18 – Loans
Station Holdco LLC. On June 17, 2011, the Las Vegas based hotel and casino operator, Station Casinos, com-pleted its plan of reorganization and emerged from bankruptcy. As a result of the restructuring Deutsche Bank owns 25 % of the non-voting equity in the restructured entity Station Holdco LLC and has the right to appoint a director or directors to two of its eight board seats. Consequently, the equity method of accounting has been applied since June 17, 2011.
18 – Loans
The following table presents the Group’s loans by industry classification.
in € m. Dec 31, 2011 Dec 31, 2010
Banks and insurance 35,308 38,798 Manufacturing 22,754 20,748 Households (excluding mortgages) 38,657 35,115 Households – mortgages 135,531 132,235 Public sector 16,412 24,113 Wholesale and retail trade 15,045 13,637 Commercial real estate activities 46,143 44,120 Lease financing 1,679 2,321 Fund management activities 24,952 27,964 Other 80,576 72,841 Gross loans 417,057 411,892
(Deferred expense)/unearned income 381 867 Loans less (deferred expense)/unearned income 416,676 411,025
Less: Allowance for loan losses 4,162 3,296
Total loans 412,514 407,729

Deutsche Bank 02 – Consolidated Financial Statements 287 Financial Report 2011 Notes to the Consolidated Balance Sheet 19 – Allowance for Credit Losses
19 – Allowance for Credit Losses
The allowance for credit losses consists of an allowance for loan losses and an allowance for off-balance sheet positions.
The following table presents a breakdown of the movements in the Group’s allowance for loan losses for the periods specified.
2011 2010 2009
in € m. Individually assessed
Collectively assessed
Total
Individually assessed
Collectively assessed Total
Individually assessed
Collectively assessed Total
Allowance, beginning of year 1,643 1,653 3,296 2,029 1,313 3,343 977 961 1,938
Provision for loan losses 907 925 1,832 562 751 1,313 1,789 808 2,597 Net charge-offs: (512) (385) (897) (896) (404) (1,300) (637) (419) (1,056)
Charge-offs (553) (512) (1,065) (934) (509) (1,443) (670) (552) (1,222)Recoveries 41 127 168 38 104 143 33 133 166
Changes in the group of consolidated companies − (0) (0) − − − − − − Exchange rate changes/other (26) (43) (69) (53) (6) (60) (101) (37) (137)
Allowance, end of year 2,011 2,150 4,162 1,643 1,653 3,296 2,029 1,313 3,343
The following table presents the activity in the Group’s allowance for off-balance sheet positions, which con-sists of contingent liabilities and lending commitments.
2011 2010 2009
in € m. Individually assessed
Collectively assessed
Total Individually assessed
Collectively assessed
Total Individually assessed
Collectively assessed
Total
Allowance, beginning of year 108 110 218 83 124 207 98 112 210
Provision for off-balance sheet positions 19 (12) 7 (18) (21) (39) 21 12 33 Usage − − − − − − (45) − (45)Changes in the group of consolidated companies (0) 0 0 42 − 42 − − − Exchange rate changes/other (0) 0 0 1 7 8 10 − 10
Allowance, end of year 127 98 225 108 110 218 83 124 207
In 2010 the Group recorded changes in the group of consolidated companies for off-balance sheet allowances following the consolidation of acquisitions amounting to € 34 million for Postbank Group and € 8 million for Sal. Oppenheim/BHF-BANK.
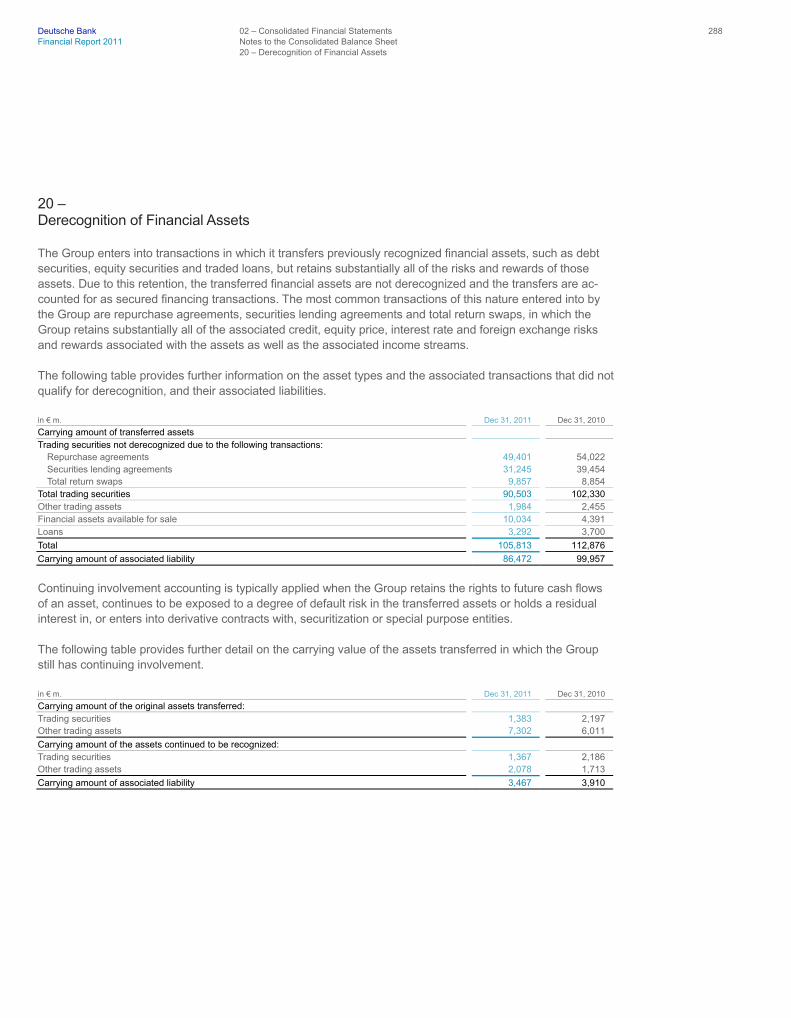
Deutsche Bank 02 – Consolidated Financial Statements 288 Financial Report 2011 Notes to the Consolidated Balance Sheet 20 – Derecognition of Financial Assets
20 – Derecognition of Financial Assets
The Group enters into transactions in which it transfers previously recognized financial assets, such as debt securities, equity securities and traded loans, but retains substantially all of the risks and rewards of those assets. Due to this retention, the transferred financial assets are not derecognized and the transfers are ac-counted for as secured financing transactions. The most common transactions of this nature entered into by the Group are repurchase agreements, securities lending agreements and total return swaps, in which the Group retains substantially all of the associated credit, equity price, interest rate and foreign exchange risks and rewards associated with the assets as well as the associated income streams.
The following table provides further information on the asset types and the associated transactions that did not qualify for derecognition, and their associated liabilities.
in € m. Dec 31, 2011 Dec 31, 2010
Carrying amount of transferred assets Trading securities not derecognized due to the following transactions:
Repurchase agreements 49,401 54,022 Securities lending agreements 31,245 39,454 Total return swaps 9,857 8,854
Total trading securities 90,503 102,330 Other trading assets 1,984 2,455 Financial assets available for sale 10,034 4,391 Loans 3,292 3,700
Total 105,813 112,876
Carrying amount of associated liability 86,472 99,957
Continuing involvement accounting is typically applied when the Group retains the rights to future cash flows of an asset, continues to be exposed to a degree of default risk in the transferred assets or holds a residual interest in, or enters into derivative contracts with, securitization or special purpose entities.
The following table provides further detail on the carrying value of the assets transferred in which the Group still has continuing involvement.
in € m. Dec 31, 2011 Dec 31, 2010
Carrying amount of the original assets transferred: Trading securities 1,383 2,197 Other trading assets 7,302 6,011
Carrying amount of the assets continued to be recognized: Trading securities 1,367 2,186 Other trading assets 2,078 1,713
Carrying amount of associated liability 3,467 3,910

Deutsche Bank 02 – Consolidated Financial Statements 289 Financial Report 2011 Notes to the Consolidated Balance Sheet 21 – Assets Pledged and Received as Collateral
21 – Assets Pledged and Received as Collateral
The Group pledges assets primarily for repurchase agreements and securities borrowing agreements which are generally conducted under terms that are usual and customary to standard securitized borrowing contracts. In addition, the Group pledges collateral against other borrowing arrangements and for margining purposes on OTC derivative liabilities. The carrying value of the Group’s assets pledged as collateral for liabilities or contingent liabilities is as follows.
in € m. Dec 31, 2011 Dec 31, 2010
Interest-earning deposits with banks 71 930 Financial assets at fair value through profit or loss 83,862 101,109 Financial assets available for sale 11,886 3,362 Loans 17,619 15,867 Other 330 181
Total 113,768 121,449
Assets transferred where the transferee has the right to sell or repledge are disclosed on the face of the bal-ance sheet. As of December 31, 2011, and December 31, 2010, these amounts were € 99 billion and € 98 billion, respectively.
As of December 31, 2011, and December 31, 2010, the Group had received collateral with a fair value of € 304 billion and € 269 billion, respectively, arising from securities purchased under reverse repurchase agreements, securities borrowed, derivatives transactions, customer margin loans and other transactions. These transactions were generally conducted under terms that are usual and customary for standard secured lending activities and the other transactions described. The Group, as the secured party, has the right to sell or repledge such collateral, subject to the Group returning equivalent securities upon completion of the transaction. As of December 31, 2011 and December 31, 2010, the Group had resold or repledged € 262 billion and € 249 billion, respectively. This was primarily to cover short sales, securities loaned and securities sold under repurchase agreements.

Deutsche Bank 02 – Consolidated Financial Statements 290 Financial Report 2011 Notes to the Consolidated Balance Sheet 22 – Property and Equipment
22 – Property and Equipment
in € m.
Owner occupied properties
Furniture and equipment
Leasehold improvements
Construction- in-progress Total
Cost of acquisition:
Balance as of January 1, 2010 1,469 2,741 1,592 466 6,268
Changes in the group of consolidated companies 1,045 200 (8) 4 1,241 Additions 115 417 156 185 873 Transfers 2,208 398 60 (361) 2,305 Reclassifications (to)/from 'held for sale' (161) (21) (4) − (186) Disposals 33 247 55 − 335 Exchange rate changes 3 133 72 4 212 Balance as of December 31, 2010 4,646 3,621 1,813 298 10,378
Changes in the group of consolidated companies (18) (2) − − (20) Additions 31 309 111 343 794 Transfers 1 263 127 (209) 182 Reclassifications (to)/from 'held for sale' (354) (108) − (4) (466) Disposals 57 179 95 − 331 Exchange rate changes 53 29 17 1 100 Balance as of December 31, 2011 4,302 3,933 1,973 429 10,637
Accumulated depreciation and impairment:
Balance as of January 1, 2010 589 1,926 971 5 3,491
Changes in the group of consolidated companies − (1) (13) − (14) Depreciation 47 293 154 − 494 Impairment losses 6 22 − − 28 Reversals of impairment losses − − − − − Transfers 704 (13) (4) (5) 682 Reclassifications (to)/from 'held for sale' (2) − − − (2) Disposals 16 187 39 − 242 Exchange rate changes 2 92 45 − 139 Balance as of December 31, 2010 1,330 2,132 1,114 − 4,576
Changes in the group of consolidated companies (1) 1 − − − Depreciation 86 389 138 − 613 Impairment losses 137 5 1 − 143 Reversals of impairment losses − − − − − Transfers (4) 76 (7) − 65 Reclassifications (to)/from 'held for sale' (94) 3 (2) − (93) Disposals 19 149 74 − 242 Exchange rate changes 22 28 16 − 66 Balance as of December 31, 2011 1,457 2,485 1,186 − 5,128
Carrying amount:
Balance as of December 31, 2010 3,316 1,489 699 298 5,802
Balance as of December 31, 2011 2,845 1,448 787 429 5,509
In 2010 the Group changed the accounting treatment of The Cosmopolitan of Las Vegas previously accounted for as investment property under other assets and reclassified it to property and equipment due to the start of its operations at the end of 2010. In 2011 an impairment charge of € 135 million on owner occupied property was taken for The Cosmopolitan of Las Vegas to reflect lower revenue expectations.

Deutsche Bank 02 – Consolidated Financial Statements 291 Financial Report 2011 Notes to the Consolidated Balance Sheet 23 – Leases
Impairment losses on property and equipment are recorded within general and administrative expenses in the income statement.
In the first quarter 2011 the Group headquarters in Frankfurt am Main previously accounted for as property and equipment was classified as held for sale. For further details on the assets held for sale please refer to Note 25 “Non-Current Assets and Disposal Groups Held for Sale”.
The carrying value of items of property and equipment on which there is a restriction on sale was € 191 million as of December 31, 2011.
Commitments for the acquisition of property and equipment were € 21 million at year-end 2011.
23 – Leases
The Group is lessee under lease arrangements covering property and equipment.
Finance Lease Commitments Most of the Group’s finance lease arrangements are made under usual terms and conditions. The Group has one significant lease contract that includes a bargain purchase option to acquire the building at expiration of the leasing contract.
The following table presents the net carrying value for each class of leasing assets held under finance leases.
in € m. Dec 31, 2011 Dec 31, 2010
Land and buildings 86 87 Furniture and equipment 1 2 Other 1 3
Net carrying value 88 92
Additionally, the Group has sublet leased assets classified as finance leases with a net carrying value of € 5 million as of December 31, 2010. There were no sublet leased assets as of December 31, 2011.

Deutsche Bank 02 – Consolidated Financial Statements 292 Financial Report 2011 Notes to the Consolidated Balance Sheet 23 – Leases
The future minimum lease payments required under the Group’s finance leases were as follows.
in € m. Dec 31, 2011 Dec 31, 2010
Future minimum lease payments: not later than one year 10 17 later than one year and not later than five years 39 65 later than five years 4 73
Total future minimum lease payments 53 155
less: Future interest charges 7 111
Present value of finance lease commitments 46 44
Future minimum sublease payments of € 14 million are expected to be received under non-cancelable sub-leases as of December 31, 2011. As of December 31, 2010, future minimum sublease payments of € 105 million were expected. As of December 31, 2011, the amount of contingent rent recognized in the income statement was € 0.7 million. As of December 31, 2010, contingent rent was € 1 million. The contingent rent is based on market interest rates, such as three months EURIBOR; below a certain rate the Group receives a rebate.
Operating Lease Commitments The Group leases the majority of its offices and branches under long-term agreements. Most of the lease con-tracts are made under usual terms and conditions, which means they include options to extend the lease by a defined amount of time, price adjustment clauses and escalation clauses in line with general office rental mar-ket conditions. However the lease agreements do not include any clauses that impose any restriction on the Group’s ability to pay dividends, engage in debt financing transactions or enter into further lease agreements. The Group has one significant lease contract which contains five options to extend the lease each for a period of five years and there is no purchase option in this specific lease.
The future minimum lease payments required under the Group’s operating leases were as follows.
in € m. Dec 31, 2011 Dec 31, 2010
Future minimum rental payments: not later than one year 891 831 later than one year and not later than five years 2,572 2,316 later than five years 2,246 2,074
Total future minimum rental payments 5,709 5,221
less: Future minimum rentals to be received 204 248
Net future minimum rental payments 5,505 4,973
The total future minimum rental payments included € 484 million for the Group headquarters in Frankfurt am Main that was sold and leased back on December 1, 2011. The Group entered into a 181 months leaseback arrangement for the entire facility in connection with the transaction.
In 2011, the rental payments for lease and sublease agreements amounted to € 859 million. This included charges of € 899 million for minimum lease payments and € 0.2 million for contingent rents as well as € 41 million related to sublease rentals received.

Deutsche Bank 02 – Consolidated Financial Statements 293 Financial Report 2011 Notes to the Consolidated Balance Sheet 24 – Goodwill and Other Intangible Assets
24 – Goodwill and Other Intangible Assets
Goodwill Changes in Goodwill The changes in the carrying amount of goodwill, as well as gross amounts and accumulated impairment losses of goodwill, for the years ended December 31, 2011, and 2010, are shown below by cash-generating units (CGU). The Group’s primary CGUs are Corporate Banking & Securities (CB&S), Global Transaction Banking (GTB), Asset Management (AM) and Private Wealth Management (PWM) within the Asset and Wealth Man-agement (AWM) segment, Private & Business Clients (PBC) and Corporate Investments (CI).
Goodwill allocated to cash-generating units
in € m.
Corporate Banking & Securities
Global Transaction Banking
Asset Management
Private Wealth Management
Private & Business Clients
Corporate Investments Others Total
Balance as of January 1, 2010 3,104 453 1,788 927 974 − 174 7,420
Goodwill acquired during the year 2 − 67 765 2,049 − 13 2,896 Purchase accounting adjustments − 5 − (4) − − − 1 Transfers − 3 12 (15) − − − − Reclassification from (to) 'held for sale' − − (7) − − − (13) (20)Goodwill related to dispositions without being classified as 'held for sale' − − − − − − − − Impairment losses
1 − − − − − − − − Exchange rate changes/other 226 26 128 63 2 − 20 465
Balance as of December 31, 2010 3,332 487 1,988 1,736 3,025 − 194 10,762
Gross amount of goodwill 3,332 487 1,988 1,736 3,025 230 678 11,476
Accumulated impairment losses − − − − − (230) (484) (714)
Balance as of January 1, 2011 3,332 487 1,988 1,736 3,025 − 194 10,762
Goodwill acquired during the year − − 25 − − − − 25 Purchase accounting adjustments − (11) 8 (8) 45 − − 34 Transfers 44 (44) − − − − − − Reclassification from (to) 'held for sale' (4) − − − (5) − − (9)Goodwill related to dispositions without being classified as 'held for sale' − − − − − − − − Impairment losses
1 − − − − − − − − Exchange rate changes/other 81 8 42 26 1 − 3 161
Balance as of December 31, 2011 3,453 440 2,063 1,754 3,066 − 197 10,973
Gross amount of goodwill 3,453 440 2,063 1,754 3,066 230 692 11,698
Accumulated impairment losses − − − − − (230) (495) (725)1 Impairment losses of goodwill are recorded as impairment of intangible assets in the income statement.
Deutsche Bank 02 – Consolidated Financial Statements 294 Financial Report 2011 Notes to the Consolidated Balance Sheet 24 – Goodwill and Other Intangible Assets
In addition to the primary CGUs, the segments CB&S and CI carry goodwill resulting from the acquisition of nonintegrated investments which are not allocated to the respective segments’ primary CGUs. Such goodwill is summarized as “Others” in the table above. The nonintegrated investment in CI consists of Maher Terminals LLC and Maher Terminals of Canada Corp., collectively and hereafter referred to as Maher Terminals, which was transferred from AM to CI effective January 1, 2009.
In 2011, additions to goodwill of € 25 million related to the step-acquisition of the outstanding interests in Deutsche UFG Capital Management in November 2011. With the purchase price allocation for this investment still subject to finalization, the initial amount of goodwill, which was allocated to AM, may change during the measurement period in 2012. Purchase accounting adjustments recorded against goodwill in 2011 amounted to a net € 34 million, mainly including refinements of € 45 million in connection with the finalization of the acqui-sition accounting for Deutsche Postbank AG (“Postbank”; PBC) and € (11) million from the conclusion of a contingent purchase consideration payment related to the full acquisition of DB HedgeWorks (GTB) in 2008. With the change in management responsibility for the former Capital Markets Sales business unit in the third quarter 2011 (see Note 05 “Business Segments and Related Information”), goodwill of € 44 million related to the respective business was transferred from GTB to CB&S.
No impairment of goodwill was recorded in 2011.
In 2010, additions to goodwill totaled approximately € 2.9 billion. This included an amount of € 2,049 million related to the acquisition of a controlling interest in Postbank in December 2010, which had been allocated to PBC. The acquisition of the Sal. Oppenheim Group (including its subsidiary BHF-BANK AG (“BHF-BANK”), excluding BHF Asset Servicing GmbH (“BAS”)) in the first quarter 2010 resulted in the recognition of goodwill of € 844 million, of which € 832 million was assigned to PWM (€ 765 million) and AM (€ 67 million). Following the contemplated sale of BHF-BANK and its classification as a disposal group held for sale, related goodwill of € 13 million associated with the acquisition of that unit was reclassified to the disposal group in the fourth quar-ter 2010. Furthermore, the acquisition of a U.S. based investment advisor company contributed € 2 million of goodwill to CB&S. Due to the designated sale of a subsidiary in the AM Business Division, an amount of € 7 million had been assigned to the respective disposal group held for sale.
No impairment of goodwill was recorded in 2010.
In 2009, a goodwill impairment loss of € 151 million was recorded in CI related to its nonintegrated investment in Maher Terminals, following the continued negative outlook for container and business volumes. The fair value less costs to sell of the investment was determined based on a discounted cash flow model.

Deutsche Bank 02 – Consolidated Financial Statements 295 Financial Report 2011 Notes to the Consolidated Balance Sheet 24 – Goodwill and Other Intangible Assets
Goodwill Impairment Test For the purposes of impairment testing, goodwill acquired in a business combination is allocated to cash-generating units which are the smallest identifiable groups of assets that generate cash inflows largely independent of the cash inflows from other assets or groups of assets and that are expected to benefit from the synergies of the combination. In identifying whether cash inflows from an asset (or a group of assets) are largely independent of the cash inflows from other assets (or groups of assets) various factors are considered, including how management monitors the entity’s operations or makes decisions about continuing or disposing of the entity’s assets and operations. On this basis, the Group’s primary cash-generating units are as outlined above. “Other” goodwill is tested individually for impairment on the level of each of the nonintegrated investments.
Goodwill is tested for impairment annually in the fourth quarter by comparing the recoverable amount of each goodwill carrying cash-generating unit with its carrying amount. The carrying amount of a cash-generating unit is derived based on the amount of equity allocated to a cash-generating unit. The carrying amount also considers the amount of goodwill and unamortized intangible assets of a cash-generating unit. The recoverable amount is the higher of a cash-generating unit’s fair value less costs to sell and its value in use. The annual goodwill impairment tests in 2011, 2010 and 2009 did not result in an impairment loss of goodwill of the Group’s primary cash-generating units as the recoverable amount for these cash-generating units was higher than their respec-tive carrying amount.
The following sections describe how the Group determines the recoverable amount of its primary goodwill carrying cash-generating units and provides information on certain key assumptions on which management based its determination of the recoverable amount.
Recoverable Amount The Group determines the recoverable amount of its primary cash-generating units on the basis of value in use and employs a valuation model based on discounted cash flows (“DCF”). The DCF model employed by the Group reflects the specifics of the banking business and its regulatory environment. The model calculates the present value of the estimated future earnings that are distributable to shareholders after fulfilling the respective regulatory capital requirements.

Deutsche Bank 02 – Consolidated Financial Statements 296 Financial Report 2011 Notes to the Consolidated Balance Sheet 24 – Goodwill and Other Intangible Assets
The DCF model uses earnings projections and respective capitalization assumptions based on financial plans agreed by management which, for purposes of the goodwill impairment test, are extrapolated to a five-year period and are discounted to their present value. Estimating future earnings and capital requirements involves judgment, considering past and actual performance as well as expected developments in the respective markets, in the overall macroeconomic and regulatory environment. Earnings projections beyond the initial five-year period are, where applicable, adjusted to derive a sustainable level and assumed to increase by or converging towards a constant long-term growth rate of 3.6 % (2010: 3.7 %), which is based on expectations for the development of gross domestic product and inflation, and are captured in the terminal value.
Key Assumptions and Sensitivities Key Assumptions: The value in use of a cash-generating unit is sensitive to the earnings projections, to the discount rate applied and, to a much lesser extent, to the long-term growth rate. The discount rates applied have been determined based on the capital asset pricing model which is comprised of a risk-free interest rate, a market risk premium and a factor covering the systematic market risk (beta factor). The values for the risk-free interest rate, the market risk premium and the beta factors are determined using external sources of information. Business-specific beta factors are determined based on a respective group of peer companies. Variations in all of these components might impact the calculation of the discount rates.
The pre-tax discount rates, which are determined implicitly based on post-tax rates, applied to determine the value in use of the primary cash-generating units in 2011 and 2010 are as follows.
Primary cash-generating units Discount rate (pre-tax)
2011 2010
Corporate & Investment Bank Corporate Banking & Securities 14.3 % 13.9 % Global Transaction Banking 12.1 % 11.7 %
Private Clients and Asset Management Asset Management 12.5 % 12.5 % Private Wealth Management 11.9 % 12.2 % Private & Business Clients 13.5 % 13.1 % The following table summarizes descriptions of key assumptions underlying the projected future earnings, management’s approach to determining the values assigned to key assumptions as well as the uncertainty associated with the key assumption and potential events and circumstances that could have a negative effect for the Group’s primary cash-generating units.
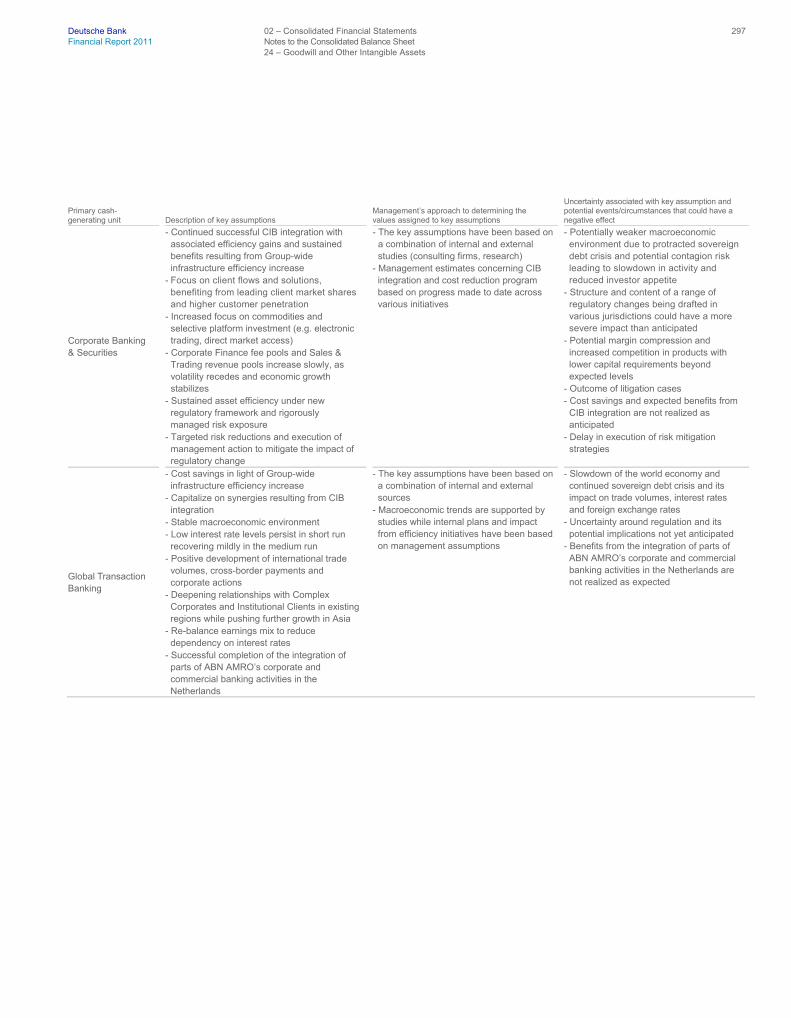
Deutsche Bank 02 – Consolidated Financial Statements 297 Financial Report 2011 Notes to the Consolidated Balance Sheet 24 – Goodwill and Other Intangible Assets
Primary cash-generating unit Description of key assumptions
Management’s approach to determining the values assigned to key assumptions
Uncertainty associated with key assumption and potential events/circumstances that could have a negative effect
Corporate Banking & Securities
- Continued successful CIB integration with associated efficiency gains and sustained benefits resulting from Group-wide infrastructure efficiency increase
- Focus on client flows and solutions, benefiting from leading client market shares and higher customer penetration
- Increased focus on commodities and selective platform investment (e.g. electronic trading, direct market access)
- Corporate Finance fee pools and Sales & Trading revenue pools increase slowly, as volatility recedes and economic growth stabilizes
- Sustained asset efficiency under new regulatory framework and rigorously managed risk exposure
- Targeted risk reductions and execution of management action to mitigate the impact of regulatory change
- The key assumptions have been based on a combination of internal and external studies (consulting firms, research)
- Management estimates concerning CIB integration and cost reduction program based on progress made to date across various initiatives
- Potentially weaker macroeconomic environment due to protracted sovereign debt crisis and potential contagion risk leading to slowdown in activity and reduced investor appetite
- Structure and content of a range of regulatory changes being drafted in various jurisdictions could have a more severe impact than anticipated
- Potential margin compression and increased competition in products with lower capital requirements beyond expected levels
- Outcome of litigation cases - Cost savings and expected benefits from
CIB integration are not realized as anticipated
- Delay in execution of risk mitigation strategies
Global Transaction Banking
- Cost savings in light of Group-wide infrastructure efficiency increase
- Capitalize on synergies resulting from CIB integration
- Stable macroeconomic environment - Low interest rate levels persist in short run
recovering mildly in the medium run - Positive development of international trade
volumes, cross-border payments and corporate actions
- Deepening relationships with Complex Corporates and Institutional Clients in existing regions while pushing further growth in Asia
- Re-balance earnings mix to reduce dependency on interest rates
- Successful completion of the integration of parts of ABN AMRO’s corporate and commercial banking activities in the Netherlands
- The key assumptions have been based on a combination of internal and external sources
- Macroeconomic trends are supported by studies while internal plans and impact from efficiency initiatives have been based on management assumptions
- Slowdown of the world economy and continued sovereign debt crisis and its impact on trade volumes, interest rates and foreign exchange rates
- Uncertainty around regulation and its potential implications not yet anticipated
- Benefits from the integration of parts of ABN AMRO’s corporate and commercial banking activities in the Netherlands are not realized as expected

Deutsche Bank 02 – Consolidated Financial Statements 298 Financial Report 2011 Notes to the Consolidated Balance Sheet 24 – Goodwill and Other Intangible Assets
Primary cash-generating unit Description of key assumptions
Management’s approach to determining the values assigned to key assumptions
Uncertainty associated with key assumption and potential events/circumstances that could have a negative effect
Asset Management
- Cost savings in light of Group-wide infrastructure efficiency increase and AM platform optimization
- Continuing recovery in equity and real estate markets
- Market appetite to regain prior losses stimulating alternative assets investments and new product development
- Asset Management’s overall internal strategy continuously driven by
Wealth creation and activation, Growth of the retirement market, Insurance outsourcing, New packaging innovation, Institutionalization of alternatives, Separation of alpha and beta, Climate Change and sustainable investing - Plan assumes going concern for total AM
- The key assumptions have been based on a combination of internal and external sources
- Macroeconomic data and market data based on DB Research forecasts
- Reoccurrence of market volatility or market shocks
- Continuation of geopolitical unrest and fiscal instability
- Prolonged periods of uncertainty - Recessionary trends - Investors continue to hold assets out of
the markets, retreat to cash or simpler, lower fee products
- Cost savings are not achieved to the extent planned
- Uncertainty around regulation and its potential implications not yet anticipated
- Potential impact from strategic review of certain parts of the business announced in November 2011
Private Wealth Management
- Cost savings in light of Group-wide infrastructure efficiency increase
- Growing wealth markets - Maintained or increased market share in the
fragmented competitive environment - Clear focus on (Ultra)-High-Net-Worth
Individuals and key clients - Strong coverage of emerging markets - Focus on onshore opportunities in already
existing large and developed markets - Home market leadership in Germany with
two strong brands (Deutsche Bank and Sal. Oppenheim)
- Organic growth strategy in Asia/Pacific and Americas as well as intensified co-operation with CIB
- Continued positive contribution from Sal. Oppenheim
- Improved productivity in Europe - IT and process improvements to enable
growth initiatives and to improve cost efficiency
- The key assumptions have been based on a combination of internal and external sources
- Macroeconomic data and market data based on DB Research forecast
- Growth potential across markets based on external sources (strategy consultan-cies) and historical performance
- Sal. Oppenheim targets based on separate integration analyses and strategy
- Major industry threats, i.e. market volatility, European sovereign debt crisis, increasing costs from regulatory changes
- Business/execution risks, i.e. under achievement of 2012 net new money targets if European sovereign debt crisis affects DB’s stability, loss of high quality relationship managers
- Difficulties in executing organic growth strategies through certain restrictions, e.g. unable to hire relationship managers
- Cost savings following efficiency gains and expected IT/process improvements are not realized as anticipated
Private & Business Clients
- Cost savings in light of Group-wide infrastructure efficiency increase
- Leading position in home market Germany, strong position in other European markets and growth options in key Asian countries
- Achievement of synergies between Deutsche Bank and Postbank on the revenue and the cost side
- Market share gains in Germany via customer and volume gains using the strong advisory proposition
- Leveraging stake in and cooperation with Hua Xia Bank in China and further organic growth in India
- The key assumptions have been based on a combination of internal and external sources
- All assumptions regarding PBC’s future development are supported by respective projects and initiatives
- All initiatives were based on a business case developed by management validated by internal and external data
- Significant economic decline potentially resulting in higher unemployment rates, increasing credit loss provisions and lower business growth
- Continued low interest rates - Risk that synergies related to Postbank
acquisition are not realized or are realized later than foreseen
- Costs to achieve the synergies are higher than foreseen

Deutsche Bank 02 – Consolidated Financial Statements 299 Financial Report 2011 Notes to the Consolidated Balance Sheet 24 – Goodwill and Other Intangible Assets
Sensitivities: In validating the value in use determined for the cash-generating units, certain external factors as well as the major value drivers of each cash-generating unit are reviewed regularly. Particularly in the second half of 2011, share prices of banking stocks were volatile, suffering from the pronounced uncertainty of market participants. In this environment, Deutsche Bank’s market capitalization remained below book value. In order to test the resilience of the value in use, key assumptions used in the DCF model (for example, the discount rate and the earnings projections) are sensitized. Management believes that the only circumstances where reason-able possible changes in key assumptions could cause an impairment were in respect of Corporate Banking & Securities and Private & Business Clients. For CB&S, the recoverable amount was 129 % of the carrying amount. An increase of 14 % in the post-tax discount rate or a decrease of 14 % in projected earnings in every year of the initial five-year period, assuming unchanged values for the other assumptions, could cause the recoverable amount to equal the carrying amount. For PBC, the recoverable amount was 137 % of the carrying amount. The respective increase in the post-tax discount rate would be 23 %, while the respective decrease in projected earnings would be 21 %.
The recoverable amounts of all remaining primary cash-generating units were substantially in excess of their respective carrying amounts. In light of the strategic review of certain parts of the AM business announced in the fourth quarter 2011, the Group performed a review for the CGU AM. Considering facts and circumstances as of December 31, 2011, there was no indication that the goodwill allocated to AM might be impaired.
However, certain political or global risks for the banking industry such as a further escalation of the European sovereign debt crisis, uncertainties regarding the implementation of already adopted regulation and the intro-duction of legislation that is already under discussion as well as a prospective slowdown of GDP growth may negatively impact the performance forecasts of certain of the Group’s cash-generating units and, thus, could result in an impairment of goodwill in the future.
Other Intangible Assets Other intangible assets are separated into purchased and internally generated intangible assets. While purchased intangible assets are further split into unamortized and amortized other intangible assets, internally generated intangible assets solely consist of amortized internally developed software.
As of December 31, 2011, the carrying amount of other intangible assets of € 4.8 billion remained nearly un-changed compared to the previous year. Its net decrease of € 4 million during 2011 mainly consisted of addi-tions to internally developed software (€ 476 million), effects from the finalization of the Postbank purchase price allocation (€ (200) million) and amortization expense (€ (386) million) related to these intangible assets.
The carrying amount of other intangible assets as of December 31, 2010 of € 4.8 billion reflected net increases during the year of € 2.1 billion, mainly including additions related to the acquisitions of Postbank, Sal. Oppen-heim and the Dutch commercial banking business of ABN AMRO (€ 1.9 billion), amortization expense (€ (262) million) and positive effects from exchange rate changes (€ 175 million).
The changes of other intangible assets by asset classes for the years ended December 31, 2011, and 2010, are as follows.

Deutsche Bank 02 – Consolidated Financial Statements 300 Financial Report 2011 Notes to the Consolidated Balance Sheet 24 – Goodwill and Other Intangible Assets
Purchased intangible assets
Internally generated intangible assets
Total other intangible assets
Unamortized Amortized Amortized
in € m.
Retail investment management agreements
Other
Total unamortized purchased intangible assets
Customer- related intangible assets
Value of business acquired
Contract- based intangible assets
Software and other
Total amortized purchased intangible assets
Software
Cost of acquisition/manufacture: Balance as of January 1, 2010 808 9 817 609 743 690 551 2,593 507 3,917 Additions − 2 2 29 11 13 68 121 316 439 Changes in the group of consolidated companies − 413 413 1,055 − 14 251 1,320 163 1,896 Disposals − 10 10 − − 6 16 22 52 84 Reclassifications from (to) 'held for sale' − 3 3 (27) − − (30) (57) (7) (61)Transfers − − − (10) − − 3 (7) (2) (9)Exchange rate changes 62 1 63 33 26 52 30 141 30 234 Balance as of December 31, 2010 870 418 1,288 1,689 780 763 857 4,089 955 6,332 Additions − 4 4 30 10 37 28 105 476 585 Changes in the group of consolidated companies − 29 29 (247) − 32 − (215) (26) (212)Disposals − 1 1 − − 1 11 12 11 24 Reclassifications from (to) 'held for sale' − − − 26 − (165) 33 (106) 6 (100)Transfers − (3) (3) − − 12 (3) 9 13 19 Exchange rate changes 24 (1) 23 (2) 24 20 5 47 12 82 Balance as of December 31, 2011 894 446 1,340 1,496 814 698 909 3,917 1,425 6,682 Accumulated amortization and impairment:
Balance as of January 1, 2010 89 − 89 279 73 114 282 748 331 1,168 Amortization for the year − − − 80 28 41 77 226 36 262
1
Changes in the group of consolidated companies − − − − − − 36 36 − 36 Disposals − − − (1) − 5 13 17 49 66 Reclassifications from (to) 'held for sale' − − − (2) − − (2) (4) (1) (5)Impairment losses − − − 29 − − 12 41 − 41
2
Reversals of impairment losses − − − − − − − − − − Transfers − − − (1) − − 3 2 2 4 Exchange rate changes 7 1 8 15 3 7 11 36 15 59 Balance as of December 31, 2010 96 1 97 401 104 157 406 1,068 334 1,499 Amortization for the year − − − 117 22 40 122 301 85 386
3
Changes in the group of consolidated companies − − − − − − (7) (7) (6) (13)Disposals − − − − − − 9 9 7 16 Reclassifications from (to) 'held for sale'
− −
− 22 − (97) 27 (48)
5 (43)
Impairment losses − 2 2 − − − − − − 2
4
Reversals of impairment losses − − − − − − − − − − Transfers − − − (1) − 1 (36) (36) 41 5 Exchange rate changes 3 (1) 2 2 4 6 7 19 12 33 Balance as of December 31, 2011 99 2 101 541 130 107 510 1,288 464 1,853 Carrying amount: As of December 31, 2010 774 417 1,191 1,288 676 606 451 3,021 621 4,833 As of December 31, 2011 795 444 1,239 955 684 591 399 2,629 961 4,829 1 Of which € 249 million were included in general and administrative expenses and € 13 million were recorded in commissions and fee income. The latter related to the amortization of
mortgage servicing rights. 2 Of which € 29 million were recorded as impairment of intangible assets. 3 Of which € 380 million were included in general and administrative expenses and € 6 million were recorded in commissions and fee income. The latter related to the amortization of
mortgage servicing rights. 4 In 2011, impairments on unamortized intangible assets reflected a charge of € 2 million recorded in CB&S. The impairment related to the writedown of permits for a renewable energy
investment.

Deutsche Bank 02 – Consolidated Financial Statements 301 Financial Report 2011 Notes to the Consolidated Balance Sheet 24 – Goodwill and Other Intangible Assets
Amortized Intangible Assets In 2011, additions to amortized purchased intangible assets of € 105 million mainly included capitalized pay-ments pertaining to new servicing arrangements related to the Group’s depository receipts programs (cus-tomer-related intangible assets of € 30 million), capitalized expenses for purchased software (€ 28 million) and deferred policy acquisition costs (DAC; € 10 million) related to incremental costs of acquiring investment man-agement contracts which are commissions payable to intermediaries and business counterparties of the Group’s insurance business (see Note 40 “Insurance and Investment Contracts”). Furthermore, the capitaliza-tion of expenses incurred in relation to the Group’s activities related to the development of internally generated software (€ 476 million) contributed to the increase of this intangible asset category.
Changes in the group of consolidated companies in 2011 mainly related to the finalization of the purchase price allocation for the acquisition of Postbank which resulted in net refinements of € (200) million reflected in several classes of other intangible assets. These included adjustments to customer-related amortizing intangible as-sets of € (247) million, mainly representing refinements to customer relationships. Further adjustments related to internally developed software (€ (20) million), beneficial contracts (€ 32 million) and trademarks (net € 35 million, thereof € 29 million related to the Postbank trademark which is classified as unamortized other intangible asset).
Net reclassifications to the held-for-sale category of € (58) million (comprising acquisition cost of € (106) million and accumulated amortization and impairment of € (48) million) mainly represented the classification impact of a disposal group allocated to CB&S in the third quarter 2011 (refer to Note 25 “Non-Current Assets and Dis-posal Groups Held for Sale”).
In 2010, the allocation of purchase prices related to the acquisitions of Postbank, Sal. Oppenheim (including BHF-BANK, but excluding BAS) and the Dutch commercial banking activities from ABN AMRO, which had resulted in the identification and initial recognition of amortized intangible assets of approximately € 1.3 billion capitalized in the Group’s consolidated balance sheet. The amount mainly included customer-related intangible assets of approximately € 1.1 billion (Postbank € 836 million, ABN AMRO € 168 million, Sal. Oppenheim € 66 million) and purchased software of € 214 million (Postbank € 142 million, Sal. Oppenheim € 72 million). Also, these acquisitions involved the capitalization of € 163 million of internally developed software to the Group’s consolidated balance sheet, of which € 156 million were attributable to Postbank.
Furthermore, in 2010 the Group recorded additions to amortized intangible assets of € 121 million, mainly representing capitalized expenses for purchased software of € 68 million, customer-related intangible assets of € 29 million and the capitalization of € 11 million of DAC related to incremental costs of acquiring investment management contracts. Due to the Group classifying its subsidiary BHF-BANK as a disposal group held for sale, the related carrying amounts for amortizing intangible assets of € 55 million were reclassified to other assets.
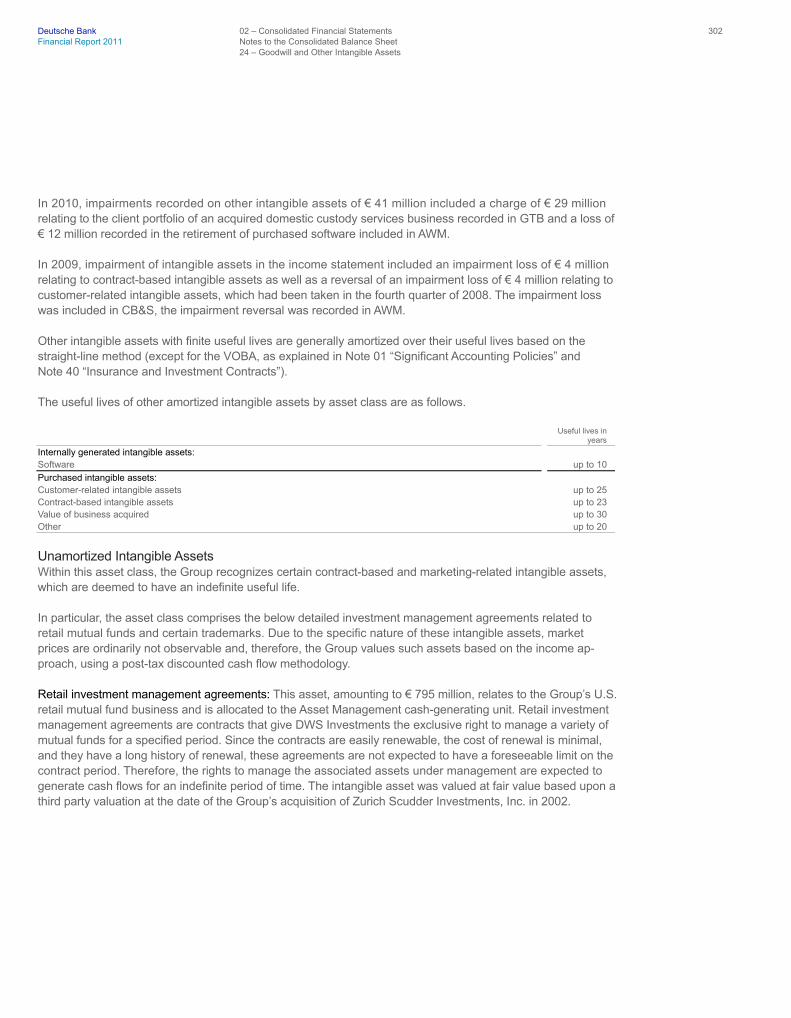
Deutsche Bank 02 – Consolidated Financial Statements 302 Financial Report 2011 Notes to the Consolidated Balance Sheet 24 – Goodwill and Other Intangible Assets
In 2010, impairments recorded on other intangible assets of € 41 million included a charge of € 29 million relating to the client portfolio of an acquired domestic custody services business recorded in GTB and a loss of € 12 million recorded in the retirement of purchased software included in AWM.
In 2009, impairment of intangible assets in the income statement included an impairment loss of € 4 million relating to contract-based intangible assets as well as a reversal of an impairment loss of € 4 million relating to customer-related intangible assets, which had been taken in the fourth quarter of 2008. The impairment loss was included in CB&S, the impairment reversal was recorded in AWM.
Other intangible assets with finite useful lives are generally amortized over their useful lives based on the straight-line method (except for the VOBA, as explained in Note 01 “Significant Accounting Policies” and Note 40 “Insurance and Investment Contracts”).
The useful lives of other amortized intangible assets by asset class are as follows.
Useful lives in years
Internally generated intangible assets: Software up to 10
Purchased intangible assets: Customer-related intangible assets up to 25 Contract-based intangible assets up to 23 Value of business acquired up to 30 Other up to 20 Unamortized Intangible Assets Within this asset class, the Group recognizes certain contract-based and marketing-related intangible assets, which are deemed to have an indefinite useful life.
In particular, the asset class comprises the below detailed investment management agreements related to retail mutual funds and certain trademarks. Due to the specific nature of these intangible assets, market prices are ordinarily not observable and, therefore, the Group values such assets based on the income ap-proach, using a post-tax discounted cash flow methodology.
Retail investment management agreements: This asset, amounting to € 795 million, relates to the Group’s U.S. retail mutual fund business and is allocated to the Asset Management cash-generating unit. Retail investment management agreements are contracts that give DWS Investments the exclusive right to manage a variety of mutual funds for a specified period. Since the contracts are easily renewable, the cost of renewal is minimal, and they have a long history of renewal, these agreements are not expected to have a foreseeable limit on the contract period. Therefore, the rights to manage the associated assets under management are expected to generate cash flows for an indefinite period of time. The intangible asset was valued at fair value based upon a third party valuation at the date of the Group’s acquisition of Zurich Scudder Investments, Inc. in 2002.

Deutsche Bank 02 – Consolidated Financial Statements 303 Financial Report 2011 Notes to the Consolidated Balance Sheet 24 – Goodwill and Other Intangible Assets
In 2011, which also considered the announced strategic review of certain parts of the AM business, and 2010, there was no impairment as the recoverable amount of the retail investment management agreements, calcu-lated as fair value less costs to sell, exceeded its carrying amount. The fair value was determined using the multi-period excess earnings method.
In 2009, a reversal of an impairment loss of € 287 million was recognized and recorded in the line item im-pairment of intangible assets in the income statement. A related impairment loss had been taken in the fourth quarter of 2008. The impairment reversal was related to retail investment management agreements for certain open end funds and was recorded in AWM. The impairment reversal was due to an increase in fair value as a result of increases in market values of invested assets as well as in current and projected operating results and cash flows of investment management agreements. The recoverable amount of the asset was calculated as fair value less costs to sell, using the multi-period excess earnings method.
Postbank trademark: As a result of the preliminary purchase price allocation, the Group identified and recognized in December 2010 the Postbank trademark at an initial amount of € 382 million (see Note 04 “Acquisitions and Dispositions”). In finalizing the purchase price allocation in 2011, the fair value of the Postbank trademark increased to € 411 million. The intangible asset is allocated to the Private & Business Clients cash-generating unit. Since the trademark is expected to generate cash flows for an indefinite period of time, it is classified as unamortized intangible asset. The trademark intangible was valued at fair value based on third party valuation as of the acquisition date.
In 2011 and 2010, there was no impairment as the recoverable amount of the Postbank trademark, calculated as fair value less costs to sell, exceeded its carrying amount. The fair value of the trademark was determined based on the income approach, using the relief-from-royalty method.
Sal. Oppenheim trademark: The purchase price allocation performed in relation to the acquisition of the Sal. Oppenheim Group in 2010 resulted in the identification and recognition of the Sal. Oppenheim trademark amounting to € 27 million. The asset is allocated to the Private Wealth Management cash-generating unit. The useful life for the trademark is assumed to be indefinite and, hence, not subject to amortization. The intangible asset was valued at fair value based upon a third party valuation performed as of the acquisition date.
In 2011 and 2010, there was no impairment as the recoverable amount of the Sal. Oppenheim trademark, calculated as fair value less costs to sell, exceeded its carrying amount. The fair value of the Sal. Oppenheim trademark was determined using the relief-from-royalty method.

Deutsche Bank 02 – Consolidated Financial Statements 304 Financial Report 2011 Notes to the Consolidated Balance Sheet 25 – Non-Current Assets and Disposal Groups Held for Sale
25 – Non-Current Assets and Disposal Groups Held for Sale
Within the balance sheet non-current assets and disposal groups held for sale are reported in other assets and other liabilities. This note provides further explanation on the nature and the financial impact of the non-current assets and disposal groups held for sale as of December 31, 2011 and 2010.
Non-Current Assets and Disposal Groups Held for Sale as of December 31, 2011 As of the balance sheet date, total assets and liabilities held for sale amounted to € 2.4 billion (2010: € 13.5 billion) and € 1.7 billion (2010: € 12.6 billion). The following table summarizes the major classes.
in € m. Dec 31, 2011 Dec 31, 2010
Cash, due and deposits from banks, Central bank funds sold and securities purchased under resale agreements − 1,124 Trading assets, Derivatives, Financial assets designated at fair value though P&L 2,012 3,653 Financial assets available for sale 115 4,489 Loans − 2,630 Property and equipment 41 230 Other assets 198 1,342
Total assets classified as held for sale 2,366 13,468
Deposits, Central bank funds purchased and securities sold under repurchase agreements − 7,538 Trading liabilities, Derivatives, Financial liabilities designated at fair value though P&L − 2,651 Long-term debt − 1,796 Other liabilities 1,669 613
Total liabilities classified as held for sale 1,669 12,598
In 2011, the Group classified a disposal group within the Corporate Division Corporate Banking & Securities as held for sale. The disposal group consists of € 2.1 billion assets and € 1.7 billion liabilities as of December 31, 2011. The assets mainly include traded loans, mortgage servicing rights and financial guarantees. The disposal group is expected to be sold in 2012. The classification as held for sale led to an impairment loss of € 22 million which was recognized in Other income in 2011.
Additionally, the Group classified an investment in an associate and several disposal groups within the Corpo-rate Division Corporate Banking & Securities as held for sale in 2011. All assets are expected to be sold within one year. The classification of the investment in an associate led to an impairment loss of € 2 million which was recognized in Other income in the fourth quarter of 2011. All other classifications did not result in any impair-ment loss. Within the Corporate Division Asset & Wealth Management the group also classified several dis-posal groups as held for sale. The related assets are expected to be sold within one year and mainly include property and equipment. The classification did not result in any impairment loss.

Deutsche Bank 02 – Consolidated Financial Statements 305 Financial Report 2011 Notes to the Consolidated Balance Sheet 25 – Non-Current Assets and Disposal Groups Held for Sale
As of December 31, 2011, no unrealized net gains or losses (December 31, 2010: unrealized net losses of € 11 million) relating to non-current assets and disposal groups classified as held for sale, were recognized directly in Accumulated other comprehensive income (loss). These unrealized net gains remain in equity until the assets are sold, at which time the gains will be reclassified from equity to profit or loss.
Disposals in 2011 Division Disposal Financial impact 1 Date of the disposal
Corporate Investments The Group headquarters in Frankfurt am Main The classification of € 592 million property and equipment as held for sale in the first quarter 2011 resulted in an initial impairment loss of € 34 million and an additional impair-ment loss of € 13 million in the second quarter 2011. On final settlement in the fourth quarter 2011, after adjustments for retained assets, we sold assets of € 528 million resulting in an impairment of € 37 million, i.e. a reversal of € 10 million compared to the total impairments in the first half of 2011.
Fourth quarter of 2011
Corporate Banking & Securities
An investment in an associate, a subsidiary that mainly included a German real estate investment property asset and several disposal groups
None In 2011
Asset & Wealth Man-agement
A subsidiary and several assets (previously acquired as part of the acquisition of the Sal. Oppenheim Group)
None In 2011
Private & Business Clients
A non-core business activity The classification as a disposal group with a related goodwill of € 5 million resulted in an impairment loss of € 3 million recognized in the second quarter 2011.
Second quarter of 2011
Private & Business Clients
Postbank’s Indian subsidiary Deutsche Postbank Home Finance Ltd.
None First quarter of 2011
1 Impairment losses and reversals are included in Other income.
Changes in Classification in 2011 BHF-BANK As of December 31, 2010, the Group had classified its investment in BHF-BANK AG (“BHF-BANK”) as a dis-posal group within the Group Division Corporate Investments held for sale because of exclusive sale negotia-tions held with Liechtenstein’s LGT Group (“LGT”).
On April 18, 2011, Deutsche Bank and LGT announced that they ended negotiations on the sale of BHF-BANK. The parties decided not to pursue the transaction further following discussions between themselves and with the competent supervisory authorities. Accordingly, from the date of the announcement all assets and liabilities of the BHF-BANK disposal group were no longer classified as held for sale. The change in classification did not have any material effect on valuation.

Deutsche Bank 02 – Consolidated Financial Statements 306 Financial Report 2011 Notes to the Consolidated Balance Sheet 25 – Non-Current Assets and Disposal Groups Held for Sale
On July 7, 2011, the Group announced that it had commenced negotiations for the sale of BHF-BANK with RHJ International, through its wholly owned subsidiary Kleinwort Benson Group. Completion of the sale would be dependent, among other things, on approvals from competent authorities. Given the uncertainty created by outstanding substantive approvals, the Group does not consider held for sale classification appropriate and will not reclassify the disposal group as held for sale until such approvals are given.
Non-current Assets and Disposal Groups Held for Sale as of December 31, 2010 Division Non-current assets and disposal groups held for sale Financial impact1 Additional information
Corporate Investments BHF-BANK Classification as held for sale triggered an impairment loss of € 62 million before tax which was recognized during the fourth quarter 2010. Recognition of this impairment also resulted in a release of € 16 million of deferred tax liabilities in 2010.
Changes in classification in 2011
Corporate Banking & Securities
An investment in an associate The initial classification of the investment in an associate as held for sale on Septem-ber 30, 2010 resulted in an impairment loss of € 72 million recorded in net income (loss) from equity method investments in the third quarter 2010. During the fourth quarter 2010, an additional impairment of € 40 million was included in Other income.
Disposals in 2011
Corporate Banking & Securities
A subsidiary that mainly included a German real estate investment property asset
None Disposals in 2011
Asset & Wealth Man-agement
A subsidiary and several private equity investments that were previously acquired as part of the acquisition of the Sal. Oppenheim Group
The goodwill related to the subsidiary classi-fied as held for sale was € 7 million as of December 31, 2010.
Disposals in 2011
Private & Business Clients
Postbank’s Indian subsidiary Deutsche Postbank Home Finance Ltd.
None Disposals in 2011
1 Impairment losses and reversals are included in Other income.
Disposals in 2010
Division Disposal Financial impact1 Date of the disposal
Corporate Banking & Securities
A disposal group An impairment loss of € 2 million was recorded in 2010.
Second quarter of 2010
Asset & Wealth Management
BHF Asset Servicing GmbH
An impairment loss of €4 million was recorded in 2010.
Third quarter of 2010
Asset & Wealth Management
Several assets previously acquired as part of the acquisition of the Sal. Oppenheim Group
None Fourth quarter of 2010
1 Impairment losses and reversals are included in Other income.

Deutsche Bank 02 – Consolidated Financial Statements 307 Financial Report 2011 Notes to the Consolidated Balance Sheet 26 – Other Assets and Other Liabilities
Changes in Classification in 2010
Division Changes in classification Financial impact1 Date and reason for the changes in classification
Corporate Banking & Securities
Several disposal groups, investments in associates and a loan
None Third quarter of 2010, since the date of the disposal was no longer predictable due to changed market conditions
1 Impairment losses and reversals are included in Other income.
26 – Other Assets and Other Liabilities
The following are the components of other assets and other liabilities.
in € m. Dec 31, 2011 Dec 31, 2010
Other assets: Brokerage and securities related receivables
Cash/margin receivables 63,772 46,132 Receivables from prime brokerage 9,652 11,324 Pending securities transactions past settlement date 3,479 4,834 Receivables from unsettled regular way trades 45,907 41,133
Total brokerage and securities related receivables 122,810 103,423 Accrued interest receivable 3,598 3,941 Assets held for sale 2,366 13,468 Other 26,020 28,397
Total other assets 154,794 149,229
in € m. Dec 31, 2011 Dec 31, 2010
Other liabilities: Brokerage and securities related payables
Cash/margin payables 58,419 42,596 Payables from prime brokerage 32,255 27,772 Pending securities transactions past settlement date 2,823 3,137 Payables from unsettled regular way trades 46,236 42,641
Total brokerage and securities related payables 139,733 116,146 Accrued interest payable 3,665 3,956 Liabilities held for sale 1,669 12,598 Other 42,749 49,127
Total other liabilities 187,816 181,827
For further details on the assets and liabilities held for sale please refer to Note 25 “Non-Current Assets and Disposal Groups Held for Sale”.

Deutsche Bank 02 – Consolidated Financial Statements 308 Financial Report 2011 Notes to the Consolidated Balance Sheet 28 – Provisions
27 – Deposits
The following are the components of deposits.
in € m. Dec 31, 2011 Dec 31, 2010
Noninterest-bearing demand deposits 99,047 89,068 Interest-bearing deposits
Demand deposits 163,618 120,154 Time deposits 202,979 183,861 Savings deposits 136,087 140,901
Total interest-bearing deposits 502,684 444,916
Total deposits 601,730 533,984
28 – Provisions
The following table presents movements by class of provisions.
in € m. Home Savings Business
Operational/ Litigation Other Total
1
Balance as of January 1, 2010 19 758 322 1,099
Changes in the group of consolidated companies 842 44 306 1,192 New provisions 18 318 207 543 Amounts used (9) (511) (132) (652) Unused amounts reversed − (130) (102) (232) Effects from exchange rate fluctuations/Unwind of discount (4) 44 19 59 Other − (7) (17)
2 (24)
Balance as of December 31, 2010 866 516 603 1,985
Changes in the group of consolidated companies − 0 10 10 New provisions 166 860 312 1,338 Amounts used (124) (370) (172) (666) Unused amounts reversed (5) (197) (116) (318) Effects from exchange rate fluctuations/Unwind of discount 16 5 2 23 Other − 7 18
2 25
Balance as of December 31, 2011 919 822 655 2,396 1 For the remaining portion of provisions as disclosed on the consolidated balance sheet, please see Note 19 “Allowance for Credit Losses”, in which allowances for
credit related off-balance sheet positions are disclosed. 2 Includes mainly reclassifications (to)/from liabilities held for sale.

Deutsche Bank 02 – Consolidated Financial Statements 309 Financial Report 2011 Notes to the Consolidated Balance Sheet 28 – Provisions
Classes of Provisions Home Savings provisions arise out of the home savings business of Deutsche Postbank Group and Deutsche Bank Bauspar-Aktiengesellschaft. In home savings, a customer enters into a building loan agreement, whereby the customer becomes entitled to borrow on a building loan once the customer has on deposit with the lending bank a targeted amount of money. In connection with the building loan agreement, arrangement fees are charged and interest is paid on deposited amounts at a rate that is typically lower than that paid on other bank deposits. In the event the customer determines not to make the borrowing, the customer becomes entitled to a retroactive interest bonus, reflecting the difference between the low contract savings interest rate and a fixed interest rate, currently substantially above market rate. The home savings provision relates to the potential interest bonus and arrangement fee reimbursement liability. The model for the calculation of the potential inter-est bonus liability includes parameters for the percentage of customer base impacted, applicable bonus rate, customer status and timing of payment. Other factors impacting the provision are available statistical data relating to customer behavior and the general environment likely to affect the business in the future.
Operational/Litigation provisions arise out of operational risk, which is the potential for failure (including the legal component) in relation to employees, contractual specifications and documentation, technology, infra-structure failure and disasters, external influences and customer relationships. This excludes business and reputational risk. Operational risk issues may result in demands from customers, counterparties and regulatory bodies or in legal proceedings.
Other provisions include several specific items arising from a variety of different circumstances, including a contingent liability relating to certain businesses acquired from Sal. Oppenheim Group (see Note 04 “Acquisi-tions and Dispositions”), deferred sales commissions, the provision for the United Kingdom bank levy and a provision under the credit card business cooperation of Deutsche Bank and Hua Xia Bank (see Note 38 “Related Party Transactions”).
Other provisions also include amounts for mortgage repurchase demands. From 2005 through 2008, as part of Deutsche Bank’s U.S. residential mortgage loan business, Deutsche Bank sold approximately U.S.$ 84 billion of private label securities and U.S.$ 71 billion of loans through whole loan sales, including to U.S. government-sponsored entities such as the Federal Home Loan Mortgage Corporation and the Federal National Mortgage Association. Deutsche Bank has been presented with demands to repurchase loans or indemnify purchasers, other investors or financial insurers with respect to losses allegedly caused by material breaches of represen-tations and warranties. Deutsche Bank’s general practice is to process valid repurchase demands that are presented in compliance with contractual rights. Where Deutsche Bank believes no such valid basis for repur-chase demands exists, Deutsche Bank rejects them and no longer considers them outstanding for Deutsche Bank’s tracking purposes.
As of December 31, 2011, Deutsche Bank has approximately U.S.$ 638 million of outstanding mortgage repur-chase demands (based on original principal balance of the loans). Against these outstanding demands, Deutsche Bank has established provisions that are not material and that Deutsche Bank believes to be ade-quate. There are other potential loan repurchase demands that, based on past experience, Deutsche Bank anticipates will be made but for which Deutsche Bank cannot reliably estimate the timing or level. Deutsche Bank also does not know whether its past success rate in rebutting such demands will be a good predicator of future success. Mortgage repurchase demands that are asserted via legal proceedings against Deutsche Bank, whether following rejection by Deutsche Bank or otherwise, are classified under Operational/Litigation.
Deutsche Bank 02 – Consolidated Financial Statements 310 Financial Report 2011 Notes to the Consolidated Balance Sheet 28 – Provisions
As of December 31, 2011, Deutsche Bank has completed repurchases and otherwise settled claims on loans with an original principal balance of approximately U.S.$ 2.4 billion. In connection with those repurchases and settlements, Deutsche Bank has obtained releases for potential claims on approximately U.S.$ 39.5 billion of loans sold by Deutsche Bank as described above.
Contingent Liabilities Contingent liabilities can arise from present obligations and from possible obligations arising from past events. The Group recognizes a provision for potential loss only when there is a present obligation arising from a past event that is probable to result in an economic outflow and that can be reliably estimated. For significant con-tingent liabilities for which the possibility of a future loss is more than remote, the Group estimates the possible loss where the Group believes that an estimate can be made.
The Group operates in a legal and regulatory environment that exposes it to significant litigation risks. As a result, the Group is involved in litigation, arbitration and regulatory proceedings in Germany and in a number of jurisdictions outside Germany, including the United States, arising in the ordinary course of business. The Group’s material contingent liabilities that are more than remote relate to the legal and regulatory matters de-scribed below, some of which consist of a number of claims. In respect of certain of these matters provisions have also been taken, which in the aggregate constitute a significant portion of the Operational/Litigation provi-sion. The provision, if any, or the estimated loss in respect of each, where such an estimate can be made, has not been disclosed for individual matters because the Group has concluded that such disclosure can be ex-pected to seriously prejudice their outcome.
In determining for which of the matters the possibility of a loss is more than remote, and then estimating the possible loss for those matters, the Group takes into consideration a number of factors, including but not lim-ited to the nature of the claim and its underlying facts, the procedural posture and litigation history of each case, the Group’s experience and the experience of others in similar cases (to the extent this is known to the Group), prior settlement discussions, available indemnities and the opinions and views of legal counsel. There are other disclosed matters for which the possibility of a loss is more than remote but for which such an estimate cannot be made. For those matters where an estimate can be made, the Group currently estimates that, as of December 31, 2011, the aggregate future loss the possibility of which is more than remote is € 2.2 billion in excess of provisions for such matters.
This estimated possible loss, as well as any provisions taken, is based upon currently available information and is subject to significant judgment and a variety of assumptions, variables and known and unknown uncer-tainties. These uncertainties may include inaccuracies in or incompleteness of the information available to the Group, particularly at the preliminary stages of matters, and erroneous assumptions by the Group as to future rulings of courts or other tribunals or the likely actions or positions taken by regulators or adversaries. Moreover, estimates of possible loss for these matters are often not amenable to the use of statistical or other quantitative analytical tools frequently used in making judgments and estimates, and are subject to even greater degrees of uncertainty than in many other areas where the Group must exercise judgment and make estimates.

Deutsche Bank 02 – Consolidated Financial Statements 311 Financial Report 2011 Notes to the Consolidated Balance Sheet 28 – Provisions
The matters for which the Group determines that the possibility of a future loss is more than remote will change from time to time, as will the matters as to which an estimate can be made and the estimated possible loss for such matters. Actual results may prove to be significantly higher or lower than the estimate of possible loss in those matters where such an estimate was made. In addition, loss may be incurred in matters with respect to which the Group believed the likelihood of loss was remote. In particular, the estimated aggregate possible loss does not represent the Group’s potential maximum loss exposure for those matters.
The Group may settle litigation or regulatory proceedings prior to a final judgment or determination of liability. It may do so to avoid the cost, management efforts or negative business, regulatory or reputational conse-quences of continuing to contest liability, even when the Group believes it has valid defenses to liability. It may also do so when the potential consequences of failing to prevail would be disproportionate to the costs of set-tlement. Furthermore, the Group may, for similar reasons, reimburse counterparties for their losses even in situations where it does not believe that it is legally compelled to do so.
Kirch Litigation. In May 2002, Dr. Leo Kirch personally and as an assignee of two entities of the former Kirch Group, i.e., PrintBeteiligungs GmbH and the group holding company TaurusHolding GmbH & Co. KG, initiated legal action against Dr. Rolf-E. Breuer and Deutsche Bank AG alleging that a statement made by Dr. Breuer (then the Spokesman of Deutsche Bank AG’s Management Board) in an interview with Bloomberg television on February 4, 2002 regarding the Kirch Group was in breach of laws and resulted in financial damage.
On January 24, 2006, the German Federal Supreme Court sustained the action for the declaratory judgment only in respect of the claims assigned by PrintBeteiligungs GmbH. Such action and judgment did not require a proof of any loss caused by the statement made in the interview. PrintBeteiligungs GmbH is the only company of the Kirch Group which was a borrower of Deutsche Bank AG. Claims by Dr. Kirch personally and by Tau-rusHolding GmbH & Co. KG were dismissed. In May 2007, Dr. Kirch filed an action for payment of approxi-mately € 1.3 billion plus interest as assignee of PrintBeteiligungs GmbH against Deutsche Bank AG and Dr. Breuer. On February 22, 2011, the District Court Munich I dismissed the lawsuit in its entirety. Dr. Kirch has filed an appeal against the decision. In these proceedings Dr. Kirch has to prove that such statement caused financial damages to PrintBeteiligungs GmbH and the amount thereof.
On December 31, 2005, KGL Pool GmbH filed a lawsuit against Deutsche Bank AG and Dr. Breuer. The law-suit is based on alleged claims assigned from various subsidiaries of the former Kirch Group. KGL Pool GmbH seeks a declaratory judgment to the effect that Deutsche Bank AG and Dr. Breuer are jointly and severally liable for damages as a result of the interview statement and the behavior of Deutsche Bank AG in respect of several subsidiaries of the Kirch Group. In December 2007, KGL Pool GmbH supplemented this lawsuit by a motion for payment of approximately € 2.0 billion plus interest as compensation for the purported damages which two subsidiaries of the former Kirch Group allegedly suffered as a result of the statement by Dr. Breuer. On March 31, 2009, the District Court Munich I dismissed the lawsuit in its entirety. The plaintiff appealed the decision. The appellate court has begun taking evidence and recommended that the parties consider a settle-ment of all legal proceedings pending between Deutsche Bank and Dr. Kirch and related parties. Deutsche Bank holds the view that the claims have no basis and neither the causality of the interview statement for any

Deutsche Bank 02 – Consolidated Financial Statements 312 Financial Report 2011 Notes to the Consolidated Balance Sheet 28 – Provisions
damages nor the scope of the claimed damages has been sufficiently substantiated. Dr. Kirch passed away in July 2011. The death of Dr. Kirch has no impact on the proceedings. On March 1, 2012, after thorough review, Deutsche Bank did not accept an out-of-court settlement proposal.
Mortgage-Related and Asset-Backed Securities Matters. Deutsche Bank AG, along with certain affiliates (collectively referred to as “Deutsche Bank”), have received subpoenas and requests for information from certain regulators and government entities concerning its activities regarding the origination, purchase, secu-ritization, sale and/or trading of mortgage loans, residential mortgage-backed securities (RMBS), collateral-ized debt obligations, asset-backed commercial paper and credit derivatives. Deutsche Bank is cooperating fully in response to those subpoenas and requests for information.
Deutsche Bank has been named as defendant in numerous civil litigations in various roles as issuer or un-derwriter in RMBS offerings. These cases include purported class action suits, actions by individual purchas-ers of securities, and actions by insurance companies that guaranteed payments of principal and interest for particular tranches of securities offerings. Although the allegations vary by lawsuit, these cases generally allege that the RMBS offering documents contained material misrepresentations and omissions, including with regard to the underwriting standards pursuant to which the underlying mortgage loans were issued, or assert that various representations or warranties relating to the loans were breached at the time of origination.
Deutsche Bank and several current or former employees were named as defendants in a putative class ac-tion commenced on June 27, 2008, relating to two Deutsche Bank-issued RMBS offerings. Following a me-diation, the parties reported to the court that they had reached a preliminary agreement to settle the case. In response, the court closed the case without prejudice to reopening it for the purpose of concluding class action settlement procedures. A settlement agreement has not been finalized and there is no assurance that it will be. If it is, the settlement will be subject to certain terms and conditions including court approval.
Deutsche Bank is a defendant in putative class actions relating to its role, along with other financial institu-tions, as underwriter of RMBS issued by various third-parties and their affiliates including Countrywide Finan-cial Corporation, IndyMac MBS, Inc., Novastar Mortgage Corporation, and Residential Accredit Loans, Inc. These cases are in various stages up through discovery. A settlement in a putative class action brought on behalf of purchasers of RMBS issued by affiliates of Wells Fargo Asset Securities Corporation received final court approval on November 14, 2011.
Deutsche Bank 02 – Consolidated Financial Statements 313 Financial Report 2011 Notes to the Consolidated Balance Sheet 28 – Provisions
Deutsche Bank is a defendant in various non-class action lawsuits by alleged purchasers of, and counterpar-ties involved in transactions relating to, RMBS, and their affiliates, including Allstate Insurance Company, Assured Guaranty Municipal Corp., Cambridge Place Investments Management Inc., the Federal Deposit Insurance Corporation (as conservator for Franklin Bank S.S.B.), the Federal Home Loan Bank of Boston, the Federal Home Loan Bank of San Francisco, the Federal Home Loan Bank of Seattle, the Federal Housing Finance Agency (as conservator for Fannie Mae and Freddie Mac), Mass Mutual Life Insurance Company, Moneygram Payment Systems, Inc., Phoenix Light SF Limited, Stichting Pensioenfonds ABP, The Charles Schwab Corporation, The Union Central Life Insurance Company, The Western and Southern Life Insurance Co., the West Virginia Investment Management Board and Sealink Funding Limited. These civil litigations are in various stages up through discovery.
In the actions against Deutsche Bank solely as an underwriter of other issuers’ RMBS offerings, Deutsche Bank has contractual rights to indemnification from the issuers, but those indemnity rights may in whole or in part prove effectively unenforceable where the issuers are now in bankruptcy or otherwise defunct.
Deutsche Bank entered into a settlement with the National Credit Union Administration (NCUA), as conserva-tor for five failed credit unions, to resolve potential claims relating to RMBS purchased by the five credit un-ions. Under the terms of the settlement, which was announced by the NCUA on November 14, 2011, Deutsche Bank paid U.S.$ 145 million.
On February 6, 2012, the United States District Court for the Southern District of New York issued an order dismissing claims brought by Dexia SA/NV and Teachers Insurance and Annuity Association of America, and their affiliates. The court dismissed some of the claims with prejudice and granted the plaintiffs leave to re-plead other claims.
A number of other entities have threatened to assert claims against Deutsche Bank in connection with various RMBS offerings and other related products, and Deutsche Bank has entered into agreements with a number of these entities to toll the relevant statute of limitations. It is possible that these potential claims may have a material impact on Deutsche Bank.
Deutsche Bank was named as a defendant in an action filed in New York State Supreme Court by eleven special purpose entities affiliated with IKB Deutsche Industriebank AG in connection with six CDOs backed by RMBS collateral that Deutsche Bank arranged and sold to plaintiffs in 2006 and 2007. Plaintiffs alleged that Deutsche Bank misstated and otherwise failed to disclose that these CDOs were affected by certain impair-ments and conflicts of interest, including impairments to the underlying collateral and the alleged involvement of certain short counterparties in the process by which collateral was selected. Plaintiffs asserted numerous causes of action under New York state law, including among others, fraud, negligent misrepresentation, re-scission, fraudulent conveyance and unjust enrichment. This litigation has been settled and a stipulation of dismissal has been filed with the Court.
On May 3, 2011, the United States Department of Justice (USDOJ) filed a civil action against Deutsche Bank AG and MortgageIT, Inc. in the United States District Court for the Southern District of New York. The USDOJ filed an amended complaint on August 22, 2011. The amended complaint, which asserts claims under the U.S. False Claims Act and common law, alleges that Deutsche Bank AG, DB Structured Products, Inc., MortgageIT, Inc. and Deutsche Bank Securities Inc. (DBSI) submitted false certifications to the Department of Housing and Urban Development’s Federal Housing Administration (FHA) concerning MortgageIT, Inc.’s compliance with FHA requirements for quality controls and concerning whether individual loans qualified for FHA insur-ance. As set forth in the amended complaint, the FHA has paid U.S.$ 368 million in insurance claims on

Deutsche Bank 02 – Consolidated Financial Statements 314 Financial Report 2011 Notes to the Consolidated Balance Sheet 28 – Provisions
mortgages that are allegedly subject to false certifications. The amended complaint seeks recovery of treble damages and indemnification of future losses on loans insured by FHA, and as set forth in the filings, the government seeks over U.S.$ 1 billion in damages. On September 23, 2011, the defendants filed a motion to dismiss the amended complaint. Following a hearing on December 21, 2011, the court granted the USDOJ leave to file a second amended complaint.
Auction Rate Securities Litigation. Deutsche Bank AG and DBSI have been named as defendants in 21 ac-tions asserting various claims under the federal securities laws and state common law arising out of the sale of auction rate preferred securities and auction rate securities (together, “ARS”). Of those 21 actions, seven are pending and fourteen have been resolved and dismissed with prejudice. Deutsche Bank AG and DBSI were the subjects of a putative class action, filed in the United States District Court for the Southern District of New York, asserting various claims under the federal securities laws on behalf of all persons or entities who pur-chased and continue to hold ARS offered for sale by Deutsche Bank AG and DBSI between March 17, 2003 and February 13, 2008. In December 2010, the court dismissed the putative class action with prejudice. After initially filing a notice of appeal, the plaintiff voluntarily withdrew and dismissed the appeal in December 2011. Deutsche Bank AG was also named as a defendant, along with ten other financial institutions, in two putative class actions, filed in the United States District Court for the Southern District of New York, asserting violations of the antitrust laws. The putative class actions allege that the defendants conspired to artificially support and then, in February 2008, restrain the ARS market. On or about January 26, 2010, the court dismissed the two putative class actions. The plaintiffs have filed appeals of the dismissals.
Trust Preferred Securities Litigation. Deutsche Bank AG and certain of its affiliates and officers are the subject of a consolidated putative class action, filed in the United States District Court for the Southern District of New York, asserting claims under the federal securities laws on behalf of persons who purchased certain trust pre-ferred securities issued by Deutsche Bank and its affiliates between October 2006 and May 2008. Claims are asserted under Sections 11, 12(a)(2), and 15 of the Securities Act of 1933 that registration statements and prospectuses for such securities contained material misstatements and omissions. An amended and consoli-dated class action complaint was filed on January 25, 2010. On August 19, 2011, the court granted in part and denied in part the defendants’ motion to dismiss. Defendants have moved for reconsideration of the portion of the decision denying the motion to dismiss. On September 20, 2011, plaintiffs filed a second amended com-plaint, which no longer includes claims based on the October 2006 issuance of securities.
Deutsche Bank 02 – Consolidated Financial Statements 315 Financial Report 2011 Notes to the Consolidated Balance Sheet 29 – Credit related Commitments and Contingent Liabilities
Interbank Offered Rates Matters. Deutsche Bank AG has received various subpoenas and requests for infor-mation from certain regulators and governmental entities in the United States and abroad, including the U.S. Department of Justice, the U.S. Commodity Futures Trading Commission, the U.S. Securities and Exchange Commission, and the European Commission, in connection with setting interbank offered rates for various currencies. These inquiries relate to various periods between 2005 and 2011. Deutsche Bank is cooperating with these investigations. In addition, a number of civil actions, including putative class actions, have been filed in federal courts in the United States against Deutsche Bank AG, an affiliate and numerous other banks on behalf of certain parties who allege that they transacted in LIBOR-based financial instruments and that the defendants manipulated, through various means, the U.S. dollar LIBOR rate and prices of U.S. dollar LIBOR-based derivatives in various markets. Claims for damages are asserted under various legal theories, includ-ing violations of the Commodity Exchange Act and the antitrust laws. The civil actions have been consoli-dated for pre-trial purposes in the United States District Court for the Southern District of New York. The litigations are in their early stages.
29 – Credit related Commitments and Contingent Liabilities
In the normal course of business the Group regularly enters into irrevocable lending commitments as well as contingent liabilities consisting of financial and performance guarantees, standby letters of credit and indemnity agreements on behalf of its customers. Under these contracts the Group is required to perform under an obli-gation agreement or to make payments to the beneficiary based on a third party’s failure to meet its obligations. For these instruments it is not known to the Group in detail, if, when and to which extent claims will be made. The Group considers these instruments in monitoring the credit exposure and may require collateral to mitigate inherent credit risk. If the credit risk monitoring provides sufficient perception about a loss from an expected claim, a provision is established and recorded on the balance sheet.
The following table shows the Group’s irrevocable lending commitments and lending related contingent liabili-ties without considering collateral or provisions. It shows the maximum potential utilization of the Group in case all these liabilities entered into must be fulfilled. The table therefore does not show the expected future cash flows from these liabilities as many of them will expire without being drawn and arising claims will be honored by the customers or can be recovered from proceeds of arranged collateral.
in € m. Dec 31, 2011 Dec 31, 2010
Irrevocable lending commitments 127,995 123,881 Contingent liabilities 73,653 68,055
Total 201,648 191,936

Deutsche Bank 02 – Consolidated Financial Statements 316 Financial Report 2011 Notes to the Consolidated Balance Sheet 30 – Other Short-Term Borrowings
Government Assistance In the course of its business, the Group regularly applies for and receives government support by means of Export Credit Agency (“ECA”) guarantees covering transfer and default risks for the financing of exports and investments into Emerging Markets and, to a lesser extent, developed markets for Structured Trade & Export Finance business. Almost all export-oriented states have established such ECAs to support their domestic exporters. The ECAs act in the name and on behalf of the government of their respective country and are either constituted directly as governmental departments or organized as private companies vested with the official mandate of the government to act on its behalf. Terms and conditions of such ECA guarantees granted for short-term, mid-term and long-term financings are quite comparable due to the fact that most of the ECAs act within the scope of the Organisation for Economic Cooperation and Development (“OECD”) consensus rules. The OECD consensus rules, an intergovernmental agreement of the OECD member states, define benchmarks to ensure that a fair competition between different exporting nations will take place.
In some countries dedicated funding programs with governmental support are offered for ECA-covered financ-ings. On a selective basis, the Group makes use of such programs. In certain financings, the Group also rece-ives government guarantees from national and international governmental institutions as collateral to support financings in the interest of the respective governments. The majority of such ECA guarantees received by the Group were issued either by the Euler-Hermes Kreditversicherungs AG acting on behalf of the Federal Repub-lic of Germany or by the Commodity Credit Corporation acting on behalf of the United States.
30 – Other Short-Term Borrowings
The following are the components of other short-term borrowings.
in € m. Dec 31, 2011 Dec 31, 2010
Other short-term borrowings: Commercial paper 30,807 31,322 Other 34,549 33,668
Total other short-term borrowings 65,356 64,990

Deutsche Bank 02 – Consolidated Financial Statements 317 Financial Report 2011 Notes to the Consolidated Balance Sheet 31 – Long-Term Debt and Trust Preferred Securities
31 – Long-Term Debt and Trust Preferred Securities
Long-Term Debt The following table presents the Group’s long-term debt by earliest contractual maturity.
in € m. Due in 2012
Due in 2013
Due in 2014
Due in 2015
Due in 2016
Due after 2016
Total Dec 31, 2011
Total Dec 31, 2010
Senior debt: Bonds and notes:
Fixed rate 14,576 11,373 10,961 12,021 9,900 46,075 104,906 105,711 Floating rate 11,424 10,530 5,176 3,202 3,150 13,253 46,735 51,596
Subordinated debt: Bonds and notes:
Fixed rate 428 1,519 576 987 702 2,569 6,781 7,213 Floating rate 3,889 501 250 55 − 299 4,994 5,140
Total long-term debt 30,317 23,923 16,963 16,265 13,752 62,196 163,416 169,660
The Group did not have any defaults of principal, interest or other breaches with respect to its liabilities in 2011 and 2010.
Trust Preferred Securities The following table summarizes the Group’s fixed and floating rate trust preferred securities, which are perpe-tual instruments, redeemable at specific future dates at the Group’s option.
in € m. Dec 31, 2011 Dec 31, 2010
Fixed rate 11,402 11,218 Floating rate 942 1,032
Total trust preferred securities 12,344 12,250

Deutsche Bank 02 – Consolidated Financial Statements 318 Financial Report 2011 Additional Notes 32 – Common Shares
32 – Common Shares
Common Shares Deutsche Bank’s share capital consists of common shares issued in registered form without par value. Under German law, each share represents an equal stake in the subscribed capital. Therefore, each share has a nominal value of € 2.56, derived by dividing the total amount of share capital by the number of shares.
Number of shares Issued and fully paid Treasury shares Outstanding
Common shares, January 1, 2010 620,859,015 (683,695) 620,175,320
Shares issued under share-based compensation plans − − − Capital increase 308,640,625 − 308,640,625 Shares purchased for treasury − (325,966,381) (325,966,381) Shares sold or distributed from treasury − 316,212,796 316,212,796
Common shares, December 31, 2010 929,499,640 (10,437,280) 919,062,360
Shares issued under share-based compensation plans − − − Capital increase − − − Shares purchased for treasury − (381,738,342) (381,738,342) Shares sold or distributed from treasury − 367,286,623 367,286,623
Common shares, December 31, 2011 929,499,640 (24,888,999) 904,610,641
There are no issued ordinary shares that have not been fully paid.
Shares purchased for treasury consist of shares held by the Group for a period of time, as well as any shares purchased with the intention of being resold in the short-term. In addition, the Group has bought back shares for equity compensation purposes. All such transactions were recorded in shareholders’ equity and no reve-nues and expenses were recorded in connection with these activities. As of December 31, 2011, the number of shares held in treasury totaled 24,888,999 shares. This treasury stock will be used for future share-based compensation.
Authorized Capital The Management Board is authorized to increase the share capital by issuing new shares for cash and in some circumstances noncash consideration. As of December 31, 2011, Deutsche Bank AG had authorized but unissued capital of € 1,152,000,000 which may be issued in whole or in part until April 30, 2016. Further details are governed by Section 4 of the Articles of Association.
Autorized capital Consideration Pre-emptive rights Expiration date
€ 230,400,000 Cash May be excluded pursuant to Section 186 (3) sentence of the Stock Corporation Act
April 30, 2016
€ 230,400,000 Cash or noncash May be excluded if the capital increase is for noncash consideration with the intent of acquiring a company or holdings in a company
April 30, 2016
€ 691,200,000 Cash May not be excluded April 30, 2016
Additional Notes
Deutsche Bank 02 – Consolidated Financial Statements 319 Financial Report 2011 Additional Notes 33 – Share-Based Compensation Plans
Conditional Capital The Management Board is authorized to issue once or more than once, participatory notes that are linked with conversion rights or option rights and/or convertible bonds and/or bonds with warrants. The participatory notes, convertible bonds or bonds with warrants may also be issued by affiliated companies of Deutsche Bank AG. For this purpose share capital was increased conditionally upon exercise of these conversion and/or exchange rights or upon mandatory conversion.
Contingent capital
Expiration date for the issuance of conversion and/or option rights
€ 230,400,000 April 30, 2015 € 230,400,000 April 30, 2016
Dividends The following table presents the amount of dividends proposed or declared for the years ended December 31, 2011, 2010 and 2009, respectively.
2011 (proposed) 2010 2009
Cash dividends declared (in € m.)
1 697 697 466 Cash dividends declared per common share (in €) 0.75 0.75 0.75 1 Cash dividend for 2011 is based on the number of shares issued as of December 31, 2011.
No dividends have been declared since the balance sheet date.
33 – Share-Based Compensation Plans
Share-Based Compensation Plans used for Granting New Awards in 2011 In 2011, the Group made grants of share-based compensation under the DB Equity Plan. All awards represent a contingent right to receive Deutsche Bank common shares after a specified period of time. The award recipi-ent is not entitled to receive dividends during the vesting period of the award.
The share awards granted under the terms and conditions of the DB Equity Plan may be forfeited fully or partly if the recipient voluntarily terminates employment before the end of the relevant vesting period. Vesting usually continues after termination of employment in cases such as redundancy or retirement. Vesting is accelerated if the recipient’s termination of employment is due to death or disability.

Deutsche Bank 02 – Consolidated Financial Statements 320 Financial Report 2011 Additional Notes 33 – Share-Based Compensation Plans
The awards made in 2011 were granted in accordance with German compensation regulation for financial institutions entitled Instituts-Vergütungsverordnung (InstitutsVergV). For all employees 50 % of their deferred awards were granted in equity. For all regulated employees according to InstitutsVergV regulation, a further holding period applies upon vesting before employees are permitted to sell their shares.
In countries where legal or other restrictions hinder the delivery of shares, a cash plan variant of the DB Equity Plan was used for granting awards (as in previous years from 2007 onwards).
In 2010 the Group introduced a new employee share ownership plan entitled Global Share Purchase Plan (GSPP). As of December 31, 2011, entities in 36 countries enrolled in the new plan.
The following table sets forth the basic terms of these share plans.
Plan Vesting schedule Early retirement provisions Eligibility
DB Equity Plan
Annual Award 1/3 : 12 months1 1/3 : 24 months1 1/3 : 36 months1 Yes
Select employees as annual retention
Retention/New Hire Individual specification2 Select employees to attract or retain key staff
Annual Award – Upfront Vesting immediately at grant3 No Regulated employees Global Share Purchase Plan (GSPP)
Broad-based employee share ownership plan
100 % : 12 months No Employee plan in select countries granting up to ten shares per employee
1 For regulated employees share delivery after a further retention period of six months. 2 Weighted average relevant service period: 23 months 3 For regulated employees share delivery after a retention period of six months.
The Group has other local share-based compensation plans, none of which, individually or in the aggregate, are material to the consolidated financial statements.

Deutsche Bank 02 – Consolidated Financial Statements 321 Financial Report 2011 Additional Notes 33 – Share-Based Compensation Plans
Share-Based Compensation Plans used for Granting Awards prior to 2011 Prior to 2011, the Group granted share-based compensation under a number of other plans. The following table summarizes the main features of these plans.
Plan Vesting schedule Early retirement provisions Eligibility Last grant in
Restricted Equity Units (REU) Plan Annual Award 80 % : 48 months1
Yes Select employees as annual retention
2006 20 % : 54 months
DB Share Scheme Off Cycle Award Individual specification
No Select employees to attract or retain key staff
2006
Global Share Plan – Germany – 100 % : 12 months No All employee plan granting up to ten shares per employee
2008
Global Partnership Plan Equity Units Annual Award 80 % : 24 months2
No Management Board members
2008 20 % : 42 months
DB Equity Plan Annual Award
50 % : 24 months No
Select employees as annual retention
2009 (under this vesting schedule)
25 % : 36 months 25 % : 48 months
Retention/New Hire Individual specification
No Select employees to attract or retain key staff
DB Equity Plan Annual Award
Graded vesting in nine equal tranches between 12 months and 45 months
Yes Select employees as annual retention
2010 (under this vesting schedule)
or cliff vesting after 45 months
Retention/New Hire Individual specification
No Select employees to attract or retain key staff
1 With delivery after further 6 months. 2 With delivery after further 18 months.
All Plans represent a contingent right to receive Deutsche Bank common shares after a specified period of time. The award recipient is not entitled to receive dividends before the settlement of the award.
An award, or portion of it, may be forfeited if the recipient voluntarily terminates employment before the end of the relevant vesting period. Early retirement provisions for the REU Plan or DB Equity Plan, however, allow continued vesting after voluntary termination of employment when certain conditions regarding age or tenure are fulfilled. Vesting usually continues after termination of employment in certain cases, such as redundancy or retirement. Vesting is accelerated if the recipient’s termination of employment is due to death or disability.

Deutsche Bank 02 – Consolidated Financial Statements 322 Financial Report 2011 Additional Notes 33 – Share-Based Compensation Plans
In countries where legal or other restrictions hinder the delivery of shares, a cash plan variant of the DB Equity Plan was used for granting awards from 2007 onwards.
Activity for Share Plans The following table summarizes the activity in plans involving share awards, which are those plans granting a contingent right to receive Deutsche Bank common shares after a specified period of time. It also includes the grants under the cash plan variant of the DB Equity Plan.
in thousands of units (except per share data)
Global Partnership Plan Equity Units
DB Share Scheme/REU/ DB Equity Plan
Global Share Plan/ Global Share Purchase Plan Total
Weighted-average grant date fair value per unit
Balance as of December 31, 2009 242 50,114 − 50,356 € 49.61
Granted − 43,942 151 44,093 € 43.46 Issued (92) (20,668) − (20,760) € 69.75 Forfeited − (4,774) − (4,774) € 39.19
Balance as of December 31, 2010 150 68,614 151 68,915 € 40.31
Granted 5 27,804 213 28,022 € 40.54 Issued (155) (23,838) (157) (24,150) € 49.12 Forfeited − (3,092) − (3,092) € 37.86
Balance as of December 31, 2011 − 69,488 207 69,695 € 37.37
In addition to the amounts shown in the table above, approximately 28.3 million shares were issued to plan participants in February 2012, resulting from the vesting of DB Equity Plan awards granted in prior years.
Furthermore, in February 2012 the Group granted awards of approximately 36.0 million units, with an average fair value of € 31.79 per unit under the DB Equity Plan with modified plan conditions for 2012. Approximately 1.1 million units of these grants were made under the cash plan variant of this DB Equity Plan.
Compensation Expense Compensation expense for awards settled in equity instruments is measured at the grant date based on the fair value of the share-based award.
Compensation expense for share-based awards payable in cash is re-measured to fair value at each balance sheet date, and the related obligations are included in other liabilities until paid. For awards granted under the cash plan version of the DB Equity Plan, re-measurement is based on the current market price of Deutsche Bank common shares.
A further description of the underlying accounting principles can be found in Note 01 “Significant Accounting Policies”.
Deutsche Bank 02 – Consolidated Financial Statements 323 Financial Report 2011 Additional Notes 34 – Employee Benefits
The Group recognized compensation expense related to its significant share-based compensation plans as follows:
in € m. 2011 2010 2009
DB Global Partnership Plan − 1 4 DB Global Share Plan/DB Global Share Purchase Plan 6 3 6 DB Share Scheme/Restricted Equity Units Plan/DB Equity Plan 1,283 1,173 637
Total 1,289 1,177 647
Of the compensation expense recognized in 2011, 2010 and 2009 approximately € 28 million, € 24 million and € 22 million, respectively, was attributable to the cash-settled plan variants.
Share-based payment transactions which will result in a cash payment give rise to a liability, which amounted to approximately € 35 million, € 33 million and € 26 million for the years ended December 31, 2011, 2010 and 2009 respectively.
As of December 31, 2011, 2010 and 2009, unrecognized compensation cost related to non-vested share-based compensation was approximately € 0.6 billion, € 1.0 billion and € 0.4 billion respectively.
34 – Employee Benefits
Deferred Compensation The Group granted cash awards to selected employees with deferred settlement. Each award consists of three tranches each amounting to one third of the grant volume. The three tranches vest one, two and three years, respectively, after grant date. As soon as a tranche vests it is paid out, net of those parts of the awards forfeited before vesting. Generally each tranche is expensed over its vesting period. As a rule, the awards are only paid out to the employee if there is a non-terminated employment relationship between the employee and Deutsche Bank at the respective vesting date. The awards are subject to additional forfeiture rules, for example if em-ployees are in breach of internal policies or law.
Awards granted to selected employees at the senior management level in February 2010 are also subject to performance-indexed forfeiture rules based on regulatory rules requiring that parts of the awards will not be paid out if defined performance metrics are not met. From 2011 onwards certain forfeiture rules are only appli-cable to senior management and employees who are specifically identified under the regulatory requirements of the German Compensation Regulation for Institutions (InstitutsVergV).
Deutsche Bank 02 – Consolidated Financial Statements 324 Financial Report 2011 Additional Notes 34 – Employee Benefits
The volume of awards granted under the terms and conditions of the DB Restricted Incentive Plan was approx-imately € 1.0 billion in February 2011 and € 0.5 billion in February 2010.
In February 2012, new awards totaling approximately € 1.1 billion were granted under the terms and conditions of the DB Restricted Incentive Plan.
In addition, the Group granted share awards which are described in Note 33 “Share-Based Compensation Plans”.
Post-employment Benefit Plans Nature of Plans The Group sponsors a number of post-employment benefit plans on behalf of its employees, both defined contribution plans and defined benefit plans. The Group’s plans are accounted for based on the nature and substance of the plan. The Group’s defined benefit plans are classified into retirement benefit plans, such as pension plans, and post-employment medical plans.
The majority of the Group’s defined benefit plan commitments relate to beneficiaries of retirement benefit plans in Germany, the United Kingdom and the United States. For such plans, the value of a participant’s accrued benefit is based primarily on each employee’s remuneration and length of service. The Group maintains vari-ous external pension trusts to fund the majority of its retirement benefit plan obligations.
The Group also maintains various post-employment medical programs for a number of current and retired employees who are mainly located in the United States. These programs pay stated percentages of medical expenses of eligible retirees after a stated deductible has been met. The Group accrues for these obligations over the service of the employee and pays the benefits from Group assets when the benefits become due. Once a retiree is eligible for Medicare the retiree is no longer eligible under a Group medical program and the Group makes a contribution to a Health Reimbursement Account for that retiree.
The Group’s Pensions Risk Committee oversees risks related to the Group’s post-employment benefit plans around the world. Within this context it develops and maintains guidelines for governance and risk management, including funding, asset allocation and actuarial assumption setting.
The Group’s funding policy is to maintain coverage of the defined benefit obligation (“DBO”) by plan assets within a range of 90 % to 100 % of the obligation, subject to meeting any local statutory requirements. Never-theless, the Group has determined that certain plans should remain unfunded, e.g. where it is not tax-efficient to fund. Obligations for the Group’s unfunded plans are accrued on the balance sheet.
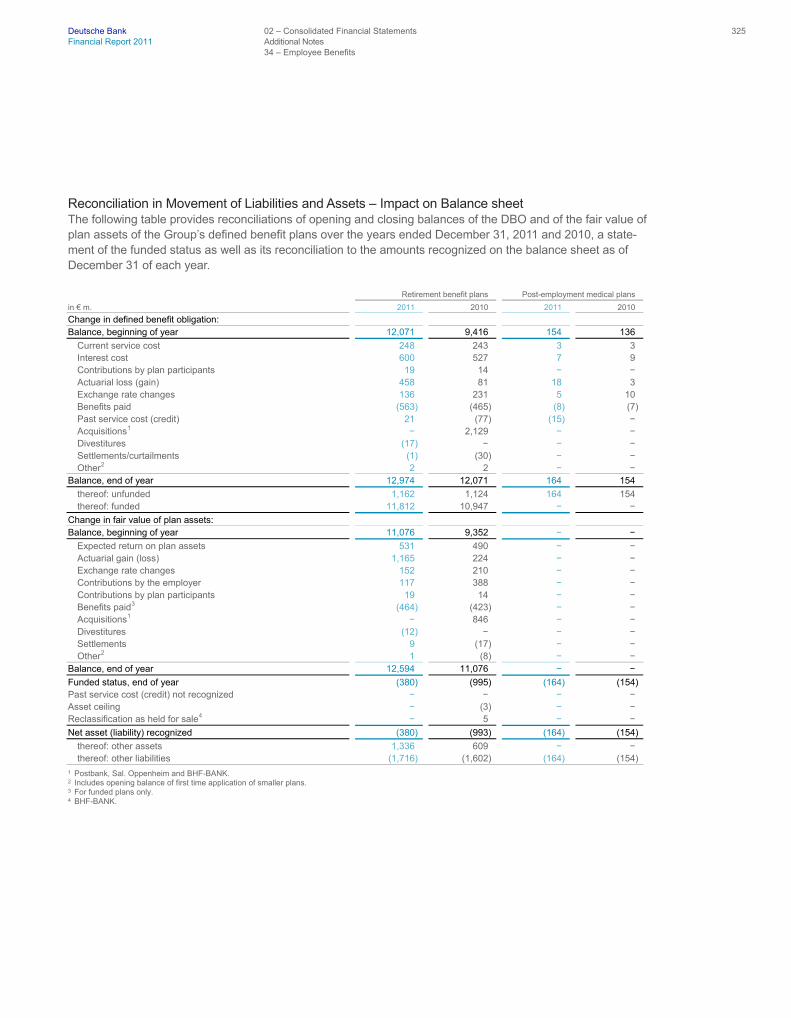
Deutsche Bank 02 – Consolidated Financial Statements 325 Financial Report 2011 Additional Notes 34 – Employee Benefits
Reconciliation in Movement of Liabilities and Assets – Impact on Balance sheet The following table provides reconciliations of opening and closing balances of the DBO and of the fair value of plan assets of the Group’s defined benefit plans over the years ended December 31, 2011 and 2010, a state-ment of the funded status as well as its reconciliation to the amounts recognized on the balance sheet as of December 31 of each year.
Retirement benefit plans Post-employment medical plans
in € m. 2011 2010 2011 2010
Change in defined benefit obligation: Balance, beginning of year 12,071 9,416 154 136
Current service cost 248 243 3 3 Interest cost 600 527 7 9 Contributions by plan participants 19 14 − − Actuarial loss (gain) 458 81 18 3 Exchange rate changes 136 231 5 10 Benefits paid (563) (465) (8) (7) Past service cost (credit) 21 (77) (15) − Acquisitions
1 − 2,129 − − Divestitures (17) − − − Settlements/curtailments (1) (30) − − Other
2 2 2 − − Balance, end of year 12,974 12,071 164 154
thereof: unfunded 1,162 1,124 164 154 thereof: funded 11,812 10,947 − −
Change in fair value of plan assets: Balance, beginning of year 11,076 9,352 − −
Expected return on plan assets 531 490 − − Actuarial gain (loss) 1,165 224 − − Exchange rate changes 152 210 − − Contributions by the employer 117 388 − − Contributions by plan participants 19 14 − − Benefits paid
3 (464) (423) − − Acquisitions
1 − 846 − − Divestitures (12) − − − Settlements 9 (17) − − Other
2 1 (8) − − Balance, end of year 12,594 11,076 − −
Funded status, end of year (380) (995) (164) (154) Past service cost (credit) not recognized − − − − Asset ceiling − (3) − − Reclassification as held for sale
4 − 5 − −
Net asset (liability) recognized (380) (993) (164) (154)
thereof: other assets 1,336 609 − − thereof: other liabilities (1,716) (1,602) (164) (154)
1 Postbank, Sal. Oppenheim and BHF-BANK. 2 Includes opening balance of first time application of smaller plans. 3 For funded plans only. 4 BHF-BANK.

Deutsche Bank 02 – Consolidated Financial Statements 326 Financial Report 2011 Additional Notes 34 – Employee Benefits
Actuarial Methodology and Assumptions December 31 is the measurement date for all plans. All plans are valued by independent qualified actuaries using the projected unit credit method.
The principal actuarial assumptions applied to determine the DBO and expenses were as follows. They are provided in the form of weighted averages.
2011 2010 2009
Assumptions used for retirement benefit plans
to determine defined benefit obligations, end of year Discount rate 4.8 % 5.1 % 5.4 % Rate of price inflation 2.5 % 2.5 % 2.7 % Rate of nominal increase in future compensation levels 3.4 % 3.3 % 3.4 % Rate of nominal increase for pensions in payment 2.5 % 2.4 % 2.4 %
to determine expense, year ended Discount rate 5.1 % 5.4 % 5.6 % Rate of price inflation 2.5 % 2.7 % 2.1 % Rate of nominal increase in future compensation levels 3.3 % 3.4 % 3.0 % Rate of nominal increase for pensions in payment 2.4 % 2.4 % 1.8 % Expected rate of return on plan assets
1 4.9 % 5.0 % 4.5 %
Assumptions used for post-employment medical plans to determine defined benefit obligations, end of year
Discount rate 4.5 % 5.3 % 5.9 % to determine expense, year ended
Discount rate 5.3 % 5.9 % 6.1 %
Assumed life expectancy at age 65 for a male aged 65 at measurement date 19.4 19.4 19.4 for a male aged 45 at measurement date 21.6 21.6 21.5 for a female aged 65 at measurement date 22.9 22.8 22.8 for a female aged 45 at measurement date 25.0 24.9 24.8
1 The expected rate of return on assets for determining expense in 2012 is 4.5 %.
For the Group’s most significant plans, the discount rate assumption at each measurement date is set based on a high quality corporate bond yield curve approach reflecting the actual timing and amount of the future benefit payments for the respective plan. A consistent assumption is used across the eurozone based on the assumption applicable for Germany. For other plans, the discount rate is based on high quality corporate or government bond yields as appropriate at each measurement date with a duration consistent with the respec-tive plan’s obligations.
The price inflation assumptions in the eurozone and the United Kingdom are set with reference to market im-plied measures of inflation based on inflation swap rates in those markets at the measurement date. For other countries, it is typically based on long term forecasts by Consensus Economics Inc.
The future compensation level increase assumptions are developed separately for each plan, where relevant, reflecting a building block approach from the price inflation assumption and reflecting the Group’s reward structure or policies in each market.
The nominal increase for pensions in payment assumptions are developed separately, where relevant, for each plan, reflecting a building block approach from the price inflation assumption and reflecting relevant local statutory and plan-specific requirements.
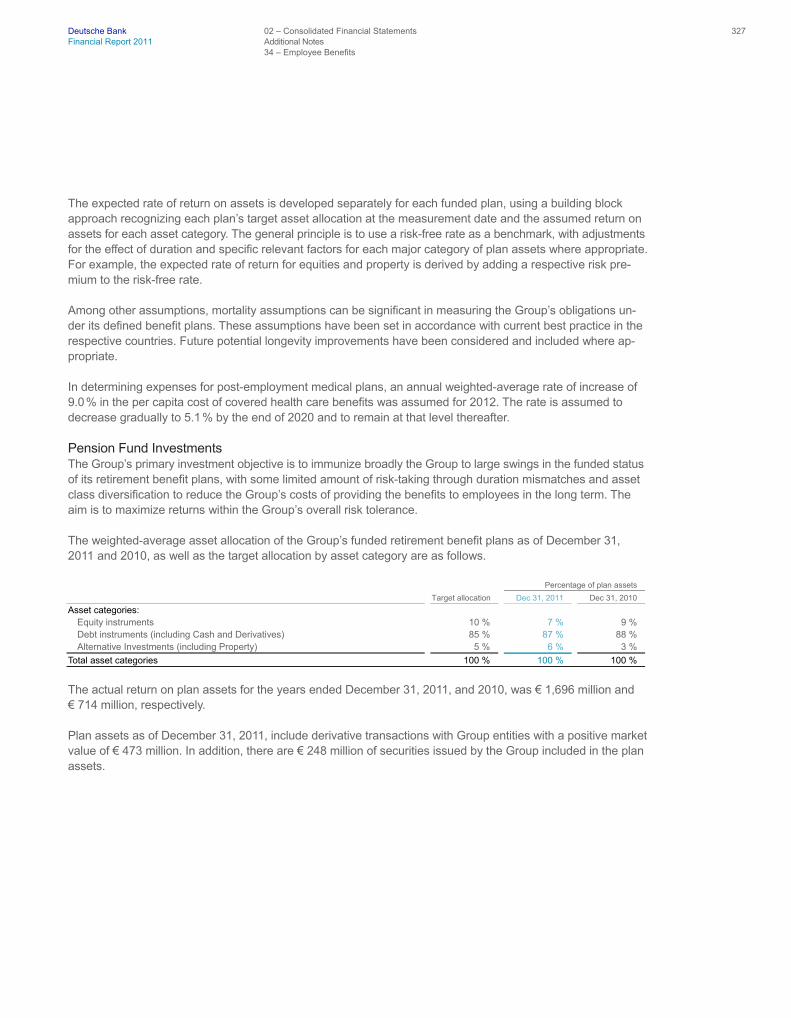
Deutsche Bank 02 – Consolidated Financial Statements 327 Financial Report 2011 Additional Notes 34 – Employee Benefits
The expected rate of return on assets is developed separately for each funded plan, using a building block approach recognizing each plan’s target asset allocation at the measurement date and the assumed return on assets for each asset category. The general principle is to use a risk-free rate as a benchmark, with adjustments for the effect of duration and specific relevant factors for each major category of plan assets where appropriate. For example, the expected rate of return for equities and property is derived by adding a respective risk pre-mium to the risk-free rate.
Among other assumptions, mortality assumptions can be significant in measuring the Group’s obligations un-der its defined benefit plans. These assumptions have been set in accordance with current best practice in the respective countries. Future potential longevity improvements have been considered and included where ap-propriate.
In determining expenses for post-employment medical plans, an annual weighted-average rate of increase of 9.0 % in the per capita cost of covered health care benefits was assumed for 2012. The rate is assumed to decrease gradually to 5.1 % by the end of 2020 and to remain at that level thereafter.
Pension Fund Investments The Group’s primary investment objective is to immunize broadly the Group to large swings in the funded status of its retirement benefit plans, with some limited amount of risk-taking through duration mismatches and asset class diversification to reduce the Group’s costs of providing the benefits to employees in the long term. The aim is to maximize returns within the Group’s overall risk tolerance.
The weighted-average asset allocation of the Group’s funded retirement benefit plans as of December 31, 2011 and 2010, as well as the target allocation by asset category are as follows.
Percentage of plan assets
Target allocation Dec 31, 2011 Dec 31, 2010
Asset categories: Equity instruments 10 % 7 % 9 % Debt instruments (including Cash and Derivatives) 85 % 87 % 88 % Alternative Investments (including Property) 5 % 6 % 3 %
Total asset categories 100 % 100 % 100 %
The actual return on plan assets for the years ended December 31, 2011, and 2010, was € 1,696 million and € 714 million, respectively.
Plan assets as of December 31, 2011, include derivative transactions with Group entities with a positive market value of € 473 million. In addition, there are € 248 million of securities issued by the Group included in the plan assets.
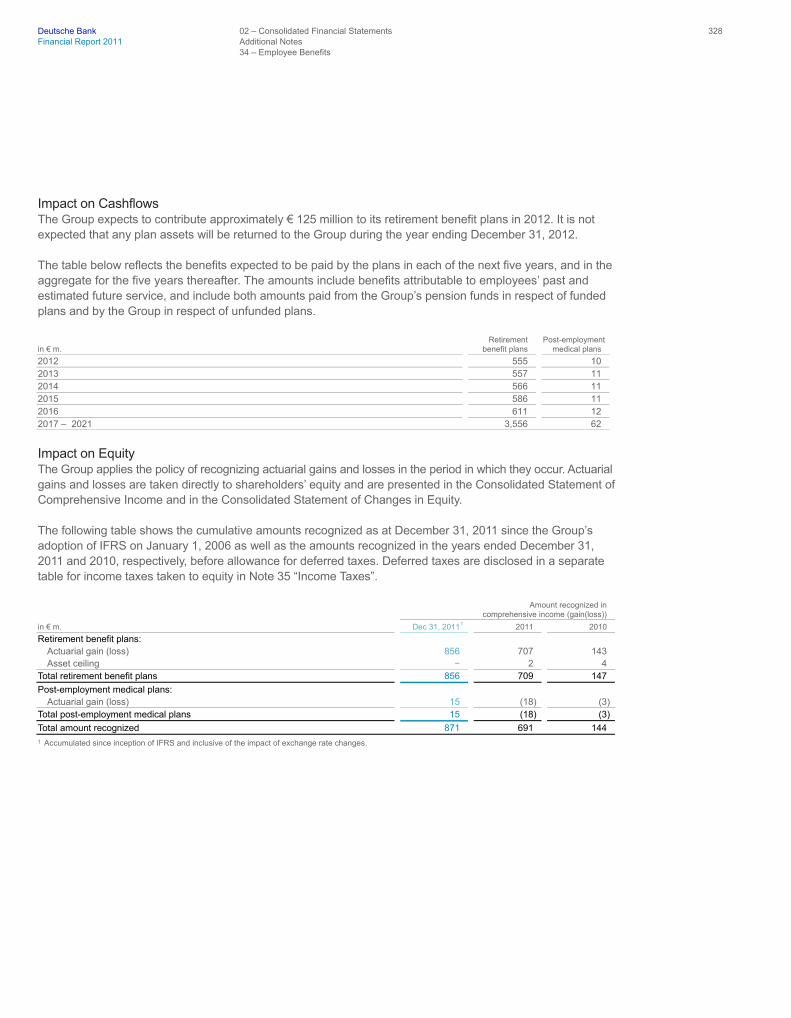
Deutsche Bank 02 – Consolidated Financial Statements 328 Financial Report 2011 Additional Notes 34 – Employee Benefits
Impact on Cashflows The Group expects to contribute approximately € 125 million to its retirement benefit plans in 2012. It is not expected that any plan assets will be returned to the Group during the year ending December 31, 2012.
The table below reflects the benefits expected to be paid by the plans in each of the next five years, and in the aggregate for the five years thereafter. The amounts include benefits attributable to employees’ past and estimated future service, and include both amounts paid from the Group’s pension funds in respect of funded plans and by the Group in respect of unfunded plans.
in € m. Retirement benefit plans
Post-employment medical plans
2012 555 10 2013 557 11 2014 566 11 2015 586 11 2016 611 12 2017 – 2021 3,556 62 Impact on Equity The Group applies the policy of recognizing actuarial gains and losses in the period in which they occur. Actuarial gains and losses are taken directly to shareholders’ equity and are presented in the Consolidated Statement of Comprehensive Income and in the Consolidated Statement of Changes in Equity.
The following table shows the cumulative amounts recognized as at December 31, 2011 since the Group’s adoption of IFRS on January 1, 2006 as well as the amounts recognized in the years ended December 31, 2011 and 2010, respectively, before allowance for deferred taxes. Deferred taxes are disclosed in a separate table for income taxes taken to equity in Note 35 “Income Taxes”.
Amount recognized in comprehensive income (gain(loss))
in € m. Dec 31, 2011
1 2011 2010
Retirement benefit plans: Actuarial gain (loss) 856 707 143 Asset ceiling − 2 4
Total retirement benefit plans 856 709 147
Post-employment medical plans: Actuarial gain (loss) 15 (18) (3)
Total post-employment medical plans 15 (18) (3)
Total amount recognized 871 691 144 1 Accumulated since inception of IFRS and inclusive of the impact of exchange rate changes.

Deutsche Bank 02 – Consolidated Financial Statements 329 Financial Report 2011 Additional Notes 34 – Employee Benefits
Experience Impacts on Liabilities and Assets The following table shows the amounts for the current and the previous four measurement dates of the DBO, the fair value of plan assets and the funded status as well as the experience adjustments on the obligation and the plan assets for the annual periods up to the measurement date.
in € m. Dec 31, 2011 Dec 31, 2010 Dec 31, 2009 Dec 31, 2008 Dec 31, 2007
Retirement benefit plans: Defined benefit obligation 12,974 12,071 9,416 8,189 8,518
thereof: experience adjustments (loss (gain)) 25 (83) (72) 24 (68) Fair Value of plan assets 12,594 11,076 9,352 8,755 9,331
thereof: experience adjustments (gain (loss)) 1,165 224 92 (221) (266) Funded status (380) (995) (64) 566 813
Post-employment medical plans: Defined benefit obligation 164 154 136 119 116
thereof: experience adjustments (loss (gain)) 8 1 − (5) (17) Funded status (164) (154) (136) (119) (116)
Impact on Expense The Group’s compensation and benefits expenses include the following expenses for defined benefit plans and other selected employee benefits, recognized in the Consolidated Statement of Income for the years ended December 31, 2011, 2010 and 2009.
in € m. 2011 2010 2009
Expenses for retirement benefit plans: Current service cost 248 243 186 Interest cost 600 527 457 Expected return on plan assets (531) (490) (403) Past service cost (credit) recognized immediately 21 (77) 18 Settlements/curtailments (9) (14) 1
Total retirement benefit plans 329 189 259
Expenses for post-employment medical plans: Current service cost 3 3 3 Interest cost 7 9 7 Past service cost (credit) recognized immediately (15) − −
Total post-employment medical plans (5) 12 10
Total expenses defined benefit plans 324 201 269
Total expenses for defined contribution plans 351 239 203
Total expenses for post-employment benefits 675 440 472
Disclosures of other selected employee benefits Employer contributions to mandatory German social security pension plan 226 171 162 Expenses for cash retention plans 936 662 688 Expenses for severance payments 503 588 629
Expected expenses for 2012 are € 300 million for the retirement benefit plans and € 11 million for the post-employment medical plans.

Deutsche Bank 02 – Consolidated Financial Statements 330 Financial Report 2011 Additional Notes 35 – Income Taxes
The increase in expenses for post-employment benefits in 2011 compared to 2010 is mainly caused by the full-year impact of the consolidation of Postbank and the change in indexation of occupational pensions in defer-ment from Retail Price Index (RPI) to Consumer Price Index (CPI) due to a UK Government announcement which led to a past service credit of € 104 million recognized in the 2010 expense.
The weighted average remaining service period of active plan members at measurement date for retirement benefit plans is ten years and for post-employment medical plans is six years.
Sensitivity to Key Assumptions The following table presents the sensitivity to key assumptions of the defined benefit obligation as of December 31, 2011 and 2010, respectively, and the aggregate of the key expense elements (service cost, interest cost, expected return on plan assets) for the years ended December 31, 2012 and 2011, respectively. The figures reflect the effect of adjusting each assumption in isolation.
Increase/(decrease) Defined benefit obligation as at Expenses for
in € m. Dec 31, 2011 Dec 31, 2010 2012 2011
Retirement benefit plans sensitivity: Discount rate (fifty basis point decrease) 960 935 5 5 Rate of price inflation (fifty basis point increase) 555 545 40 35 Rate of real increase in future compensation levels (fifty basis point increase) 105 105 10 10 Longevity (improvement by ten percent)
1 255 245 15 15 Expected rate of return (fifty basis point decrease) − − 65 55
Post-employment medical plans sensitivity: Health care cost rate (100 basis point increase) 17 19 2 2 Health care cost rate (100 basis point decrease) (15) (17) (1) (2)
1 Improvement by ten percent on longevity means that the probability of death at each age is reduced by ten percent. The sensitivity has, broadly, the effect of increasing the expected longevity at age 65 by about one year.
35 – Income Taxes
The components of income tax expense (benefit) for 2011, 2010 and 2009 are as follows.
in € m. 2011 2010 2009
Current tax expense (benefit): Tax expense (benefit) for current year 1,683 1,339 970 Adjustments for prior years (232) (9) (430)
Total current tax expense (benefit) 1,451 1,330 540
Deferred tax expense (benefit): Origination and reversal of temporary difference, unused tax losses and tax credits (143) 700 570 Effect of changes in tax law and/or tax rate 110 7 3 Adjustments for prior years (354) (392) (869)
Total deferred tax expense (benefit) (387) 315 (296)
Total income tax expense (benefit) 1,064 1,645 244
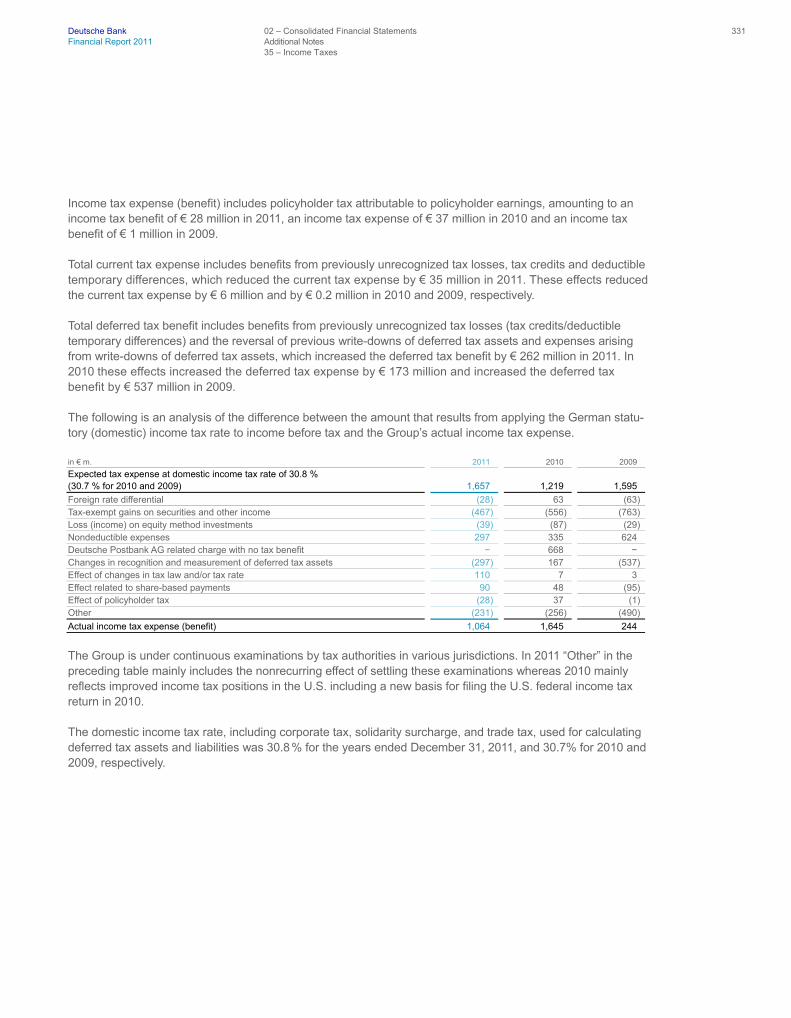
Deutsche Bank 02 – Consolidated Financial Statements 331 Financial Report 2011 Additional Notes 35 – Income Taxes
Income tax expense (benefit) includes policyholder tax attributable to policyholder earnings, amounting to an income tax benefit of € 28 million in 2011, an income tax expense of € 37 million in 2010 and an income tax benefit of € 1 million in 2009.
Total current tax expense includes benefits from previously unrecognized tax losses, tax credits and deductible temporary differences, which reduced the current tax expense by € 35 million in 2011. These effects reduced the current tax expense by € 6 million and by € 0.2 million in 2010 and 2009, respectively.
Total deferred tax benefit includes benefits from previously unrecognized tax losses (tax credits/deductible temporary differences) and the reversal of previous write-downs of deferred tax assets and expenses arising from write-downs of deferred tax assets, which increased the deferred tax benefit by € 262 million in 2011. In 2010 these effects increased the deferred tax expense by € 173 million and increased the deferred tax benefit by € 537 million in 2009.
The following is an analysis of the difference between the amount that results from applying the German statu-tory (domestic) income tax rate to income before tax and the Group’s actual income tax expense.
in € m. 2011 2010 2009
Expected tax expense at domestic income tax rate of 30.8 % (30.7 % for 2010 and 2009) 1,657 1,219 1,595
Foreign rate differential (28) 63 (63) Tax-exempt gains on securities and other income (467) (556) (763) Loss (income) on equity method investments (39) (87) (29) Nondeductible expenses 297 335 624 Deutsche Postbank AG related charge with no tax benefit − 668 − Changes in recognition and measurement of deferred tax assets (297) 167 (537) Effect of changes in tax law and/or tax rate 110 7 3 Effect related to share-based payments 90 48 (95) Effect of policyholder tax (28) 37 (1) Other (231) (256) (490)
Actual income tax expense (benefit) 1,064 1,645 244
The Group is under continuous examinations by tax authorities in various jurisdictions. In 2011 “Other” in the preceding table mainly includes the nonrecurring effect of settling these examinations whereas 2010 mainly reflects improved income tax positions in the U.S. including a new basis for filing the U.S. federal income tax return in 2010.
The domestic income tax rate, including corporate tax, solidarity surcharge, and trade tax, used for calculating deferred tax assets and liabilities was 30.8 % for the years ended December 31, 2011, and 30.7% for 2010 and 2009, respectively.

Deutsche Bank 02 – Consolidated Financial Statements 332 Financial Report 2011 Additional Notes 35 – Income Taxes
Income taxes charged or credited to equity (other comprehensive income/additional paid in capital) are as follows.
in € m. 2011 2010 2009
Actuarial gains/losses related to defined benefit plans (50) (29) 113 Financial assets available for sale:
Unrealized net gains (losses) arising during the period 173 (59) (195) Net gains/losses reclassified to profit or loss (11) (47) (214)
Derivatives hedging variability of cash flows: Unrealized net gains (losses) arising during the period 92 30 90 Net (gains) losses reclassified to profit or loss (1) (1) (2)
Other equity movement: Unrealized net gains (losses) arising during the period (129) 320 54 Net (gains) losses reclassified to profit or loss 1 (3) 13
Income taxes (charged) credited to other comprehensive income
1 75 211 (141)
Other income taxes (charged) credited to equity 46 30 (35) 1 Starting in 2011 actuarial gains/losses related to defined benefit plans are presented as part of other comprehensive income. Prior period numbers were adjusted
accordingly.
Major components of the Group’s gross deferred income tax assets and liabilities are as follows.
in € m. Dec 31, 2011 Dec 31, 2010
1
Deferred tax assets: Unused tax losses 2,375 2,637 Unused tax credits 185 189 Deductible temporary differences:
Trading activities 10,686 8,627 Property and equipment 806 780 Other assets 2,560 2,152 Securities valuation 1,209 1,117 Allowance for loan losses 525 594 Other provisions 1,178 1,314 Other liabilities 775 1,919
Total deferred tax assets pre offsetting 20,299 19,329
Deferred tax liabilities: Taxable temporary differences:
Trading activities 9,370 8,070 Property and equipment 49 62 Other assets 1,103 2,470 Securities valuation 790 758 Allowance for loan losses 348 124 Other provisions 414 897 Other liabilities 1,277 914
Total deferred tax liabilities pre offsetting 13,351 13,295 1 Based on updated mapping procedures in 2011 prior period numbers were adjusted accordingly.

Deutsche Bank 02 – Consolidated Financial Statements 333 Financial Report 2011 Additional Notes 35 – Income Taxes
After offsetting, deferred tax assets and liabilities are presented on the balance sheet as follows.
in € m. Dec 31, 2011 Dec 31, 2010
Presented as deferred tax assets 8,737 8,341 Presented as deferred tax liabilities 1,789 2,307
Net deferred tax assets 6,948 6,034
The change in the balance of deferred tax assets and deferred tax liabilities does not equal the deferred tax expense/(benefit). This is due to (1) deferred taxes that are booked directly to equity, (2) the effects of ex-change rate changes on tax assets and liabilities denominated in currencies other than euro, (3) the acquisition and disposal of entities as part of ordinary activities and (4) the reclassification of deferred tax assets and lia-bilities which are presented on the face of the balance sheet as components of other assets and liabilities.
As of December 31, 2011 and 2010, no deferred tax assets were recognized for the following items.
in € m. Dec 31, 2011
1 Dec 31, 2010
1
Deductible temporary differences (296) (676)
Not expiring (3,342) (4,206) Expiring in subsequent period (45) (6) Expiring after subsequent period (2,143) (1,801)
Unused tax losses (5,530) (6,013)
Expiring in subsequent period − − Expiring after subsequent period (101) (67)
Unused tax credits (101) (67) 1 Amounts in the table refer to deductible temporary differences, unused tax losses and tax credits for federal income tax purposes.
Deferred tax assets were not recognized on these items because it is not probable that future taxable profit will be available against which the unused tax losses, unused tax credits and deductible temporary differences can be utilized.
As of December 31, 2011 and December 31, 2010, the Group recognized deferred tax assets of € 1.5 billion and € 3.3 billion, respectively that exceed deferred tax liabilities in entities which have suffered a loss in either the current or preceding period. This is based on management’s assessment that it is probable that the respective entities will have taxable profits against which the unused tax losses, unused tax credits and deductible temporary differences can be utilized. Generally, in determining the amounts of deferred tax assets to be recognized, management uses historical profitability information and, if relevant, forecasted operating results, based upon approved business plans, including a review of the eligible carry-forward periods, tax planning opportunities and other relevant considerations.
As of December 31, 2011 and December 31, 2010, the Group had temporary differences associated with the Group’s parent company’s investments in subsidiaries, branches and associates and interests in joint ventures of € 135 million and € 106 million respectively, in respect of which no deferred tax liabilities were recognized.
Deutsche Bank 02 – Consolidated Financial Statements 334 Financial Report 2011 Additional Notes 36 – Derivatives
36 – Derivatives
Derivative Financial Instruments and Hedging Activities Derivative contracts used by the Group include swaps, futures, forwards, options and other similar types of contracts. In the normal course of business, the Group enters into a variety of derivative transactions for both trading and risk management purposes. The Group’s objectives in using derivative instruments are to meet customers’ risk management needs and to manage the Group’s exposure to risks.
In accordance with the Group’s accounting policy relating to derivatives and hedge accounting as described in Note 01 “Significant Accounting Policies”, all derivatives are carried at fair value in the balance sheet regard-less of whether they are held for trading or non-trading purposes.
Derivatives held for Trading Purposes Sales and Trading The majority of the Group’s derivatives transactions relate to sales and trading activities. Sales activities in-clude the structuring and marketing of derivative products to customers to enable them to take, transfer, modify or reduce current or expected risks. Trading includes market-making, positioning and arbitrage activities. Mar-ket-making involves quoting bid and offer prices to other market participants, enabling revenue to be generated based on spreads and volume. Positioning means managing risk positions in the expectation of benefiting from favorable movements in prices, rates or indices. Arbitrage involves identifying and profiting from price differen-tials between markets and products.
Risk Management The Group uses derivatives in order to reduce its exposure to market risks as part of its asset and liability management. This is achieved by entering into derivatives that hedge specific portfolios of fixed rate financial instruments and forecast transactions as well as strategic hedging against overall balance sheet exposures. The Group actively manages interest rate risk through, among other things, the use of derivative contracts. Utilization of derivative financial instruments is modified from time to time within prescribed limits in response to changing market conditions, as well as to changes in the characteristics and mix of the related assets and liabilities.
Derivatives qualifying for Hedge Accounting The Group applies hedge accounting if derivatives meet the specific criteria described in Note 01 “Significant Accounting Policies”.
Fair Value Hedge Accounting The Group enters into fair value hedges, using primarily interest rate swaps and options, in order to protect itself against movements in the fair value of fixed-rate financial instruments due to movements in market inter-est rates.

Deutsche Bank 02 – Consolidated Financial Statements 335 Financial Report 2011 Additional Notes 36 – Derivatives
The following table presents the value of derivatives held as fair value hedges.
in € m. Assets 2011
Liabilities 2011
Assets 2010
Liabilities 2010
Derivatives held as fair value hedges 7,485 2,741 8,447 5,823 For the years ended December 31, 2011 and 2010, gains of € 2.2 billion and € 0.7 billion, respectively, were recognized on the hedging instruments. For the same periods, the results on the hedged items, which were attributable to the hedged risk, were losses of € 1.5 billion and € 0.6 billion, respectively.
Cash Flow Hedge Accounting The Group enters into cash flow hedges, using interest rate swaps and foreign exchange forwards, in order to protect itself against exposure to variability in interest rates and exchange rates.
The following table presents the value of derivatives held as cash flow hedges.
in € m. Assets 2011
Liabilities 2011
Assets 2010
Liabilities 2010
Derivatives held as cash flow hedges 0 436 1 268 A schedule indicating the periods when hedged cash flows are expected to occur and when they are expected to affect the income statement is as follows.
in € m. Within 1 year 1–3 years 3–5 years Over 5 years
As of December 31, 2011 Cash inflows from assets 46 83 75 302 Cash outflows from liabilities (4) (4) − −
Net cash flows 2011 42 79 75 302
As of December 31, 2010 Cash inflows from assets 47 84 56 254 Cash outflows from liabilities (27) (50) (39) (63)
Net cash flows 2010 20 34 17 191
Of these expected future cash flows, most will arise in relation to the Group’s largest cash flow hedging pro-gram, Maher Terminals LLC. The Abbey Life Assurance Company Limited cash flow hedge was terminated during 2011.
For the years ended December 31, 2011 and 2010, balances of € (455) million and € (321) million, respectively, were reported in equity related to cash flow hedging programs. Of these, € (26) million and € (44) million, re-spectively, related to terminated programs. These amounts will be released to the income statement as appro-priate.
For the years ended December 31, 2011 and 2010, losses of € 92 million and € 44 million, respectively, were recognized in other comprehensive income in respect of effective cash flow hedging.

Deutsche Bank 02 – Consolidated Financial Statements 336 Financial Report 2011 Additional Notes 37 – Regulatory Capital
For the years ended December 31, 2011 and 2010, gains of € 42 million and € 60 million, respectively, were removed from equity and included in the income statement.
For the year ended December 31, 2011 no gains or losses were recognized due to hedge ineffectiveness, and for the year ended December 31, 2010, € 3 million of losses were recognized.
As of December 31, 2011 the longest term cash flow hedge matures in 2027.
Net Investment Hedge Accounting Using foreign exchange forwards and swaps, the Group enters into hedges of translation adjustments resulting from translating the financial statements of net investments in foreign operations into the reporting currency of the parent at period end spot rates.
The following table presents the value of derivatives held as net investment hedges.
in € m. Assets 2011
Liabilities 2011
Assets 2010
Liabilities 2010
Derivatives held as net investment hedges 76 1,610 81 528 For the years ended December 31, 2011 and 2010, losses of € 218 million and € 197 million, respectively, were recognized due to hedge ineffectiveness which includes the forward points element of the hedging instruments.
37 – Regulatory Capital
Capital Management The Group’s Treasury function manages capital at Group level and locally in each region, except that Postbank manages its capital on a group level and locally on its own. The allocation of financial resources, in general, and capital, in particular, favors business portfolios with the highest positive impact on the Group’s profitability and shareholder value. As a result, Treasury periodically reallocates capital among business portfolios.
Treasury implements the Group’s capital strategy, which itself is developed by the Capital and Risk Commit-tee and approved by the Management Board, including the issuance and repurchase of shares. The Group is committed to maintain its sound capitalization. Overall capital demand and supply are constantly monitored and adjusted, if necessary, to meet the need for capital from various perspectives. These include book equity based on IFRS accounting standards, regulatory capital and economic capital.

Deutsche Bank 02 – Consolidated Financial Statements 337 Financial Report 2011 Additional Notes 37 – Regulatory Capital
The allocation of capital, determination of the Group’s funding plan and other resource issues are framed by the Capital and Risk Committee.
Regional capital plans covering the capital needs of the Group’s branches and subsidiaries are prepared on a semi-annual basis and presented to the Group Investment Committee. Most of the Group’s subsidiaries are subject to legal and regulatory capital requirements. Local Asset and Liability Committees attend to those needs under the stewardship of regional Treasury teams. Furthermore, they safeguard compliance with requirements such as restrictions on dividends allowable for remittance to Deutsche Bank AG or on the ability of its subsidi-aries to make loans or advances to the parent bank. In developing, implementing and testing the Group’s capi-tal and liquidity, the Group takes such legal and regulatory requirements into account.
The Group’s core currencies are euro, U.S. dollar and pound sterling. Treasury manages the sensitivity of the Group’s capital ratios against swings in core currencies. The capital invested into the Group’s foreign subsidiar-ies and branches in non-core currencies is largely hedged against foreign exchange swings, except for the Chinese yuan that the Group currently does not hedge. Treasury determines which currencies are to be hedged, develops suitable hedging strategies and finally executes these hedges.
Treasury is represented on the investment committee of the largest Deutsche Bank pension fund which sets the investment guidelines. This representation ensures that pension assets are aligned with pension liabilities, thus protecting the bank’s capital base.
Treasury constantly monitors the market for liability management trades. Such trades represent an anticyclical opportunity to create Core Tier 1 capital by buying back Deutsche Bank’s issuances below par.
The Core Tier 1 capital ratio amounted to 9.5 % at year-end 2011. It is already above the 9 % level proposed by the European Banking Authority (EBA) and agreed by the European Council for the EU Wide Capital Exer-cise, ahead of the June 30, 2012 deadline. It also covers the shortfall of € 388 million in relation to European Economic Area sovereign exposure which was determined as at September 30, 2011 solely for the purposes of the EU-Wide Capital Exercise. The Group will strive to adhere to the 9 % threshold by June 30, 2012.
In the first quarter 2011, the Group changed the methodology used for allocating average active equity to the business segments and to Consolidation & Adjustments in proportion to their regulatory requirements. Under the new methodology economic capital as basis for allocation is substituted by risk weighted assets and certain regulatory capital deduction items. All other items of the capital allocation framework remain unchanged. The total amount allocated continues to be determined based on the higher of the Group’s overall economic risk exposure or regulatory capital demand. In 2011, the Group derives its internal demand for regulatory capital assuming a Tier 1 ratio of 10.0 %. If the Group’s average active equity exceeds the higher of the overall eco-nomic risk exposure or the regulatory capital demand, this surplus is assigned to Consolidation & Adjustments.
During the period from the 2010 Annual General Meeting (May 27, 2010) until the 2011 Annual General Meet-ing (May 26, 2011), 28.5 million shares were purchased, of which 0.5 million were purchased via sold put op-tions which were executed by the counterparty at maturity date. 22.0 million of the shares purchased were used for equity compensation purposes and 6.5 million shares were used to increase the Group’s Treasury position for future equity compensation. 9.8 million shares were purchased from January 1, 2011 until May 26, 2011, none of which via sold put options. In addition, 10.0 million physically settled call options were purchased in first quarter 2011 to hedge existing equity compensation awards. These call options have a remaining matur-ity of more than 18 months and were purchased under the above mentioned authorization from the Annual General Meeting to buy back shares by using derivatives. In second quarter 2011, the Group restructured

Deutsche Bank 02 – Consolidated Financial Statements 338 Financial Report 2011 Additional Notes 37 – Regulatory Capital
15.3 million existing call options in order to allow physical settlement according to the above mentioned autho-rization. These call options have a remaining maturity below 18 months. As of the 2011 Annual General Meet-ing, the number of shares held in Treasury from buybacks totaled 7.6 million.
The 2011 Annual General Meeting granted the Group’s Management Board the authority to buy back up to 92.9 million shares before the end of November 2015. Thereof 46.5 million shares can be purchased by using derivatives. These authorizations replaced the authorizations of the 2010 Annual General Meeting. During the period from the 2011 Annual General Meeting until December 31, 2011, 27.4 million shares were purchased, thereof 10.9 million of the shares purchased were used for equity compensation purposes and 16.5 million shares were used to increase the Group’s Treasury position for future equity compensation. As of December 31, 2011, the number of shares held in Treasury from buybacks totaled 24.1 million.
To take advantage of Deutsche Bank’s low share price in the third quarter 2011, Treasury unwound the 10.0 million physically settled call options purchased in first quarter 2011 and entered into new 10.0 million physically settled call option with significant lower strike prices. These call options were purchased under the authorization from the 2011 Annual General Meeting. From the 10.0 million call options, 6.0 million have a remaining maturity of more than 18 months. In addition to these 10 million call options, the Group restructured additional call options to further hedge the Group’s obligation to deliver shares for equity compensation purposes.
Total outstanding hybrid Tier 1 capital (substantially all noncumulative trust preferred securities) as of December 31, 2011, amounted to € 12.7 billion compared to € 12.6 billion as of December 31, 2010. This increase was mainly due to the foreign exchange effects of the strengthened U.S. dollar to the U.S. dollar denominated hybrid Tier 1 capital. In 2011, the Group neither raised nor redeemed any hybrid Tier 1 capital.
In 2011, the Group did not issue any lower Tier 2 capital (qualified subordinated liabilities). Profit participation rights amounted to € 1.2 billion as of December 31, 2011, unchanged to December 31, 2010. Total lower Tier 2 capital as of December 31, 2011, amounted to € 9.4 billion compared to € 10.7 billion as of December 31, 2010. Cumulative preferred securities amounted to € 0.3 billion as of December 31, 2011, unchanged to December 31, 2010.
Capital Management at Postbank Postbank manages its capital by continuously monitoring capital supply and demand. Capital management aims at regulatory as well as at economic capital adequacy, in line with the concept of risk bearing capacity. In general, the capital allocation requires an appropriate return on regulatory capital demand. The capital alloca-tion is approved by Postbank’s Management Board based on a multiyear plan.
The regulatory and economic capital demand is permanently monitored to adjust the available capital if re-quired. Capital demand forecasts are regularly determined and carried forward based on the planned devel-opment of the business volume and results as well as expected risk parameter changes. Capital ratios are managed in compliance with the Postbank’s Management Board approved statutory guidelines, by steering the existing and new transaction volume, by issuance of Tier 1 and Tier 2 capital instruments or by executing risk mitigating capital market transactions.
Deutsche Bank 02 – Consolidated Financial Statements 339 Financial Report 2011 Additional Notes 37 – Regulatory Capital
Capital Adequacy Since 2008, Deutsche Bank has calculated and published consolidated capital ratios for the Deutsche Bank group of institutions pursuant to the Banking Act and the Solvency Regulation (“Solvabilitätsverordnung”), which implemented the revised capital framework of the Basel Committee from 2004 (“Basel 2”) into German law. Starting with December 31, 2011, the calculation of the Group’s capital ratios incorporates the amended capital requirements for trading book and securitization positions following the Capital Requirements Direc-tive 3, also known as “Basel 2.5”, as implemented in the German Banking Act and the Solvency Regulation.
The Basel 2.5 framework introduced the model based risk measures stressed value-at-risk, incremental risk charge and comprehensive risk within market risk for banks applying an internal model approach:
— Stressed Value-at-Risk: calculates a stressed value-at-risk measure based on a continuous 1 year period of significant market stress.
— Incremental Risk Charge (“IRC”): captures default and migration risks in addition to the risks already cap-tured in value-at-risk for credit-sensitive positions in the trading book.
— Comprehensive Risk Measure (“CRM”): captures incremental risk for the credit correlation trading portfolio calculated using an internal model subject to qualitative minimum requirements as well as stress testing requirements. The CRM must be calculated weekly and is determined as the higher of the latest weekly CRM charge from the model, the twelve weeks average CRM charge, and the market risk standardized approach charge for the credit correlation portfolio, the so-called CRM Floor.
— Market Risk Standardized Approach (“MRSA”): calculates regulatory capital for securitisations and nth-to-default credit derivatives.
In addition, Basel 2.5 regulations require as part of the market risk capital charge the calculation of the specific market risk of securitization trading positions, which are not eligible for the comprehensive risk measure, based on the market risk standardized approach.
Basel 2.5 also requires identifying re-securitization positions in the trading and banking book which receive an increased risk-weighting and result in higher capital charges for credit risk and market risk, respectively.
The group of companies consolidated for banking regulatory purposes (“group of institutions”) includes all subsidiaries as defined in the German Banking Act that are classified as banks, financial services institutions, investment management companies, financial enterprises, payment institutions or ancillary services enterprises. It does not include insurance companies or companies outside the finance sector.

Deutsche Bank 02 – Consolidated Financial Statements 340 Financial Report 2011 Additional Notes 37 – Regulatory Capital
For financial conglomerates, however, insurance companies are included in an additional capital adequacy (also “solvency margin”) calculation. Since October 2007, the Group is a financial conglomerate. The Group’s solvency margin as a financial conglomerate remains dominated by its banking activities.
A bank’s total regulatory capital, also referred to as “Own Funds”, is divided into three tiers: Tier 1, Tier 2 and Tier 3 capital, and the sum of Tier 1 and Tier 2 capital is also referred to as “Regulatory Banking Capital”.
— Tier 1 capital consists primarily of common share capital, additional paid-in capital, retained earnings and certain hybrid capital components such as noncumulative trust preferred securities, also referred to as Ad-ditional Tier 1 capital. Common shares in treasury, goodwill and other intangible assets are deducted from Tier 1 capital. Other regulatory adjustments entail the exclusion of capital from entities outside the group of institutions and the reversal of capital effects under the fair value option on financial liabilities due to own credit risk. Tier 1 capital without hybrid capital components is referred to as Core Tier 1 capital.
— Tier 2 capital consists primarily of cumulative trust preferred securities, certain profit participation rights and long-term subordinated debt, as well as 45 % of unrealized gains on certain listed securities.
— Certain items must be deducted from Tier 1 and Tier 2 capital. Primarily these include deductible invest-ments in unconsolidated banking, financial and insurance entities where the Group holds more than 10 % of the capital (in case of insurance entities 20 % either of the capital or of voting rights unless included in the solvency margin calculation of the financial conglomerate), the amount by which the expected loss for exposures to central governments, institutions and corporate and retail exposures as measured under the bank’s internal ratings based approach (“IRBA”) model exceeds the value adjustments and provisions for such exposures, the expected losses for certain equity exposures, securitization positions not included in the risk-weighted assets and the value of securities delivered to a counterparty plus any replacement cost to the extent the required payment by the counterparty has not been made within five business days after delivery provided the transaction has been allocated to the bank’s trading book. Starting with December 31, 2011, the deduction for securitization positions calculated according to Basel 2 is replaced by a calculation according to Basel 2.5.
— Tier 3 capital consists mainly of certain short-term subordinated debt. The amount of subordinated debt that may be included as Tier 2 capital is limited to 50 % of Tier 1 capital. Total Tier 2 capital is limited to 100 % of Tier 1 capital.
The Core Tier 1 and the Tier 1 capital ratio are the principal measures of capital adequacy for internationally active banks. The ratios compare a bank’s regulatory Core Tier 1 and Tier 1 capital with its credit risks, market risks and operational risks pursuant to Basel 2.5 (which the Group refers to collectively as the “risk-weighted assets” or “RWA”). In the calculation of the risk-weighted assets the Group uses BaFin approved internal mod-els for all three risk types. More than 90 % of the Group’s exposure relating to asset and off-balance sheet credit risks (excluding Postbank) is measured using internal rating models under the so-called advanced IRBA. For December 31, 2010, the vast majority of the Group’s market risk component was a multiple of its value-at-risk figure, which was calculated for regulatory purposes based on the Group’s internal models.Starting with December 31, 2011, the market risk component includes a multiple of the stressed value-at-risk and the value-at-risk, as well as the incremental risk charge and the comprehensive risk measure on the Group’s correlation trading portfolio. All of which are all calculated on the basis of the Group’s BaFin approved internal models. The market risk component now also includes securitizations in the trading book outside the correlation trading
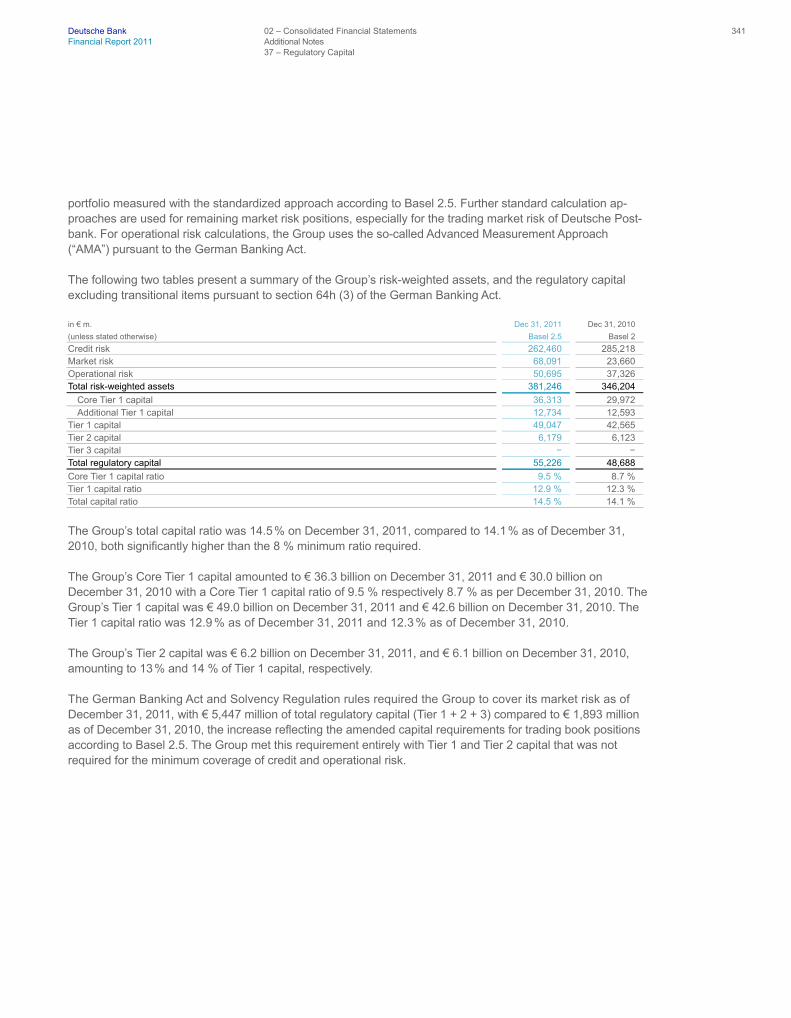
Deutsche Bank 02 – Consolidated Financial Statements 341 Financial Report 2011 Additional Notes 37 – Regulatory Capital
portfolio measured with the standardized approach according to Basel 2.5. Further standard calculation ap-proaches are used for remaining market risk positions, especially for the trading market risk of Deutsche Post-bank. For operational risk calculations, the Group uses the so-called Advanced Measurement Approach (“AMA”) pursuant to the German Banking Act.
The following two tables present a summary of the Group’s risk-weighted assets, and the regulatory capital excluding transitional items pursuant to section 64h (3) of the German Banking Act.
in € m. Dec 31, 2011 Dec 31, 2010
(unless stated otherwise) Basel 2.5 Basel 2
Credit risk 262,460 285,218 Market risk 68,091 23,660 Operational risk 50,695 37,326 Total risk-weighted assets 381,246 346,204
Core Tier 1 capital 36,313 29,972 Additional Tier 1 capital 12,734 12,593
Tier 1 capital 49,047 42,565 Tier 2 capital 6,179 6,123 Tier 3 capital − − Total regulatory capital 55,226 48,688
Core Tier 1 capital ratio 9.5 % 8.7 % Tier 1 capital ratio 12.9 % 12.3 % Total capital ratio 14.5 % 14.1 % The Group’s total capital ratio was 14.5 % on December 31, 2011, compared to 14.1 % as of December 31, 2010, both significantly higher than the 8 % minimum ratio required.
The Group’s Core Tier 1 capital amounted to € 36.3 billion on December 31, 2011 and € 30.0 billion on December 31, 2010 with a Core Tier 1 capital ratio of 9.5 % respectively 8.7 % as per December 31, 2010. The Group’s Tier 1 capital was € 49.0 billion on December 31, 2011 and € 42.6 billion on December 31, 2010. The Tier 1 capital ratio was 12.9 % as of December 31, 2011 and 12.3 % as of December 31, 2010.
The Group’s Tier 2 capital was € 6.2 billion on December 31, 2011, and € 6.1 billion on December 31, 2010, amounting to 13 % and 14 % of Tier 1 capital, respectively.
The German Banking Act and Solvency Regulation rules required the Group to cover its market risk as of December 31, 2011, with € 5,447 million of total regulatory capital (Tier 1 + 2 + 3) compared to € 1,893 million as of December 31, 2010, the increase reflecting the amended capital requirements for trading book positions according to Basel 2.5. The Group met this requirement entirely with Tier 1 and Tier 2 capital that was not required for the minimum coverage of credit and operational risk.
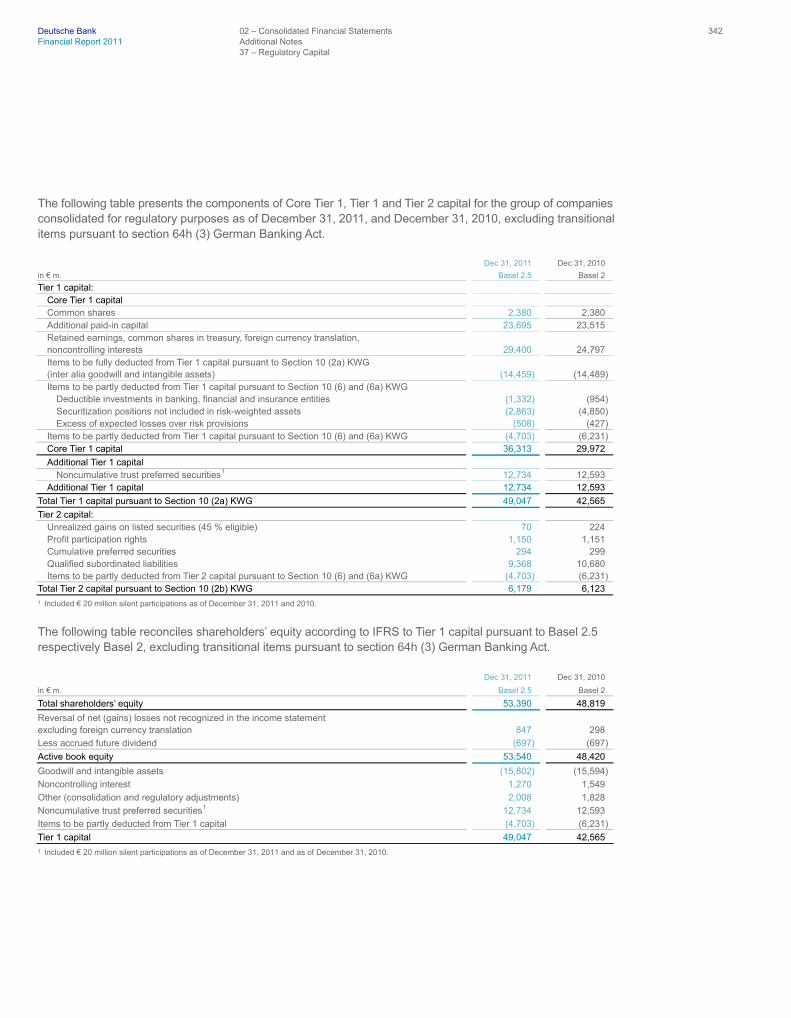
Deutsche Bank 02 – Consolidated Financial Statements 342 Financial Report 2011 Additional Notes 37 – Regulatory Capital
The following table presents the components of Core Tier 1, Tier 1 and Tier 2 capital for the group of companies consolidated for regulatory purposes as of December 31, 2011, and December 31, 2010, excluding transitional items pursuant to section 64h (3) German Banking Act.
Dec 31, 2011 Dec 31, 2010
in € m. Basel 2.5 Basel 2
Tier 1 capital: Core Tier 1 capital Common shares 2,380 2,380 Additional paid-in capital 23,695 23,515 Retained earnings, common shares in treasury, foreign currency translation, noncontrolling interests 29,400 24,797 Items to be fully deducted from Tier 1 capital pursuant to Section 10 (2a) KWG (inter alia goodwill and intangible assets) (14,459) (14,489) Items to be partly deducted from Tier 1 capital pursuant to Section 10 (6) and (6a) KWG
Deductible investments in banking, financial and insurance entities (1,332) (954) Securitization positions not included in risk-weighted assets (2,863) (4,850) Excess of expected losses over risk provisions (508) (427)
Items to be partly deducted from Tier 1 capital pursuant to Section 10 (6) and (6a) KWG (4,703) (6,231) Core Tier 1 capital 36,313 29,972
Additional Tier 1 capital Noncumulative trust preferred securities
1 12,734 12,593 Additional Tier 1 capital 12,734 12,593
Total Tier 1 capital pursuant to Section 10 (2a) KWG 49,047 42,565
Tier 2 capital: Unrealized gains on listed securities (45 % eligible) 70 224 Profit participation rights 1,150 1,151 Cumulative preferred securities 294 299 Qualified subordinated liabilities 9,368 10,680 Items to be partly deducted from Tier 2 capital pursuant to Section 10 (6) and (6a) KWG (4,703) (6,231)
Total Tier 2 capital pursuant to Section 10 (2b) KWG 6,179 6,123 1 Included € 20 million silent participations as of December 31, 2011 and 2010.
The following table reconciles shareholders’ equity according to IFRS to Tier 1 capital pursuant to Basel 2.5 respectively Basel 2, excluding transitional items pursuant to section 64h (3) German Banking Act.
Dec 31, 2011 Dec 31, 2010
in € m. Basel 2.5 Basel 2
Total shareholders’ equity 53,390 48,819
Reversal of net (gains) losses not recognized in the income statement excluding foreign currency translation 847 298
Less accrued future dividend (697) (697)
Active book equity 53,540 48,420
Goodwill and intangible assets (15,802) (15,594)
Noncontrolling interest 1,270 1,549
Other (consolidation and regulatory adjustments) 2,008 1,828
Noncumulative trust preferred securities
1 12,734 12,593
Items to be partly deducted from Tier 1 capital (4,703) (6,231)
Tier 1 capital 49,047 42,565 1 Included € 20 million silent participations as of December 31, 2011 and as of December 31, 2010.

Deutsche Bank 02 – Consolidated Financial Statements 343 Financial Report 2011 Additional Notes 38 – Related Party Transactions
Basel 2.5 requires, in the same way as already Basel 2, the deduction of goodwill from Tier 1 capital. However, for a transitional period the partial inclusion of certain goodwill components in Tier 1 capital is allowed pursuant to German Banking Act Section 64h (3). While such goodwill components are not included in the regulatory capital and capital adequacy ratios shown above, the Group makes use of this transition rule in its capital adequacy reporting to the German regulatory authorities.
As of December 31, 2011, the transitional item amounted to € 319 million compared to € 390 million as of December 31, 2010. In the Group’s reporting to the German regulatory authorities, the Tier 1 capital, total regulatory capital and the total risk-weighted assets shown above were increased by this amount. Corres-pondingly, the Group’s Tier 1 and total capital ratios reported to the German regulatory authorities including this item were 12.9 % and 14.6 %, respectively, on December 31, 2011 compared to 12.4 % and 14.2 %, respectively, on December 31, 2010.
Failure to meet minimum capital requirements can result in orders to suspend or reduce dividend payments or other profit distributions on regulatory capital and discretionary actions by the BaFin that, if undertaken, could have a direct material effect on the Group’s businesses. The Group complied with the regulatory capital adequacy requirements in 2011.
38 – Related Party Transactions
Parties are considered to be related if one party has the ability to directly or indirectly control the other party or exercise significant influence over the other party in making financial or operational decisions. The Group’s related parties include
— key management personnel, close family members of key management personnel and entities which are controlled, significantly influenced by, or for which significant voting power is held by key management personnel or their close family members,
— subsidiaries, joint ventures and associates and their respective subsidiaries, and — post-employment benefit plans for the benefit of Deutsche Bank employees.
The Group has several business relationships with related parties. Transactions with such parties are made in the ordinary course of business and on substantially the same terms, including interest rates and collateral, as those prevailing at the time for comparable transactions with other parties. These transactions also did not involve more than the normal risk of collectibility or present other unfavorable features.
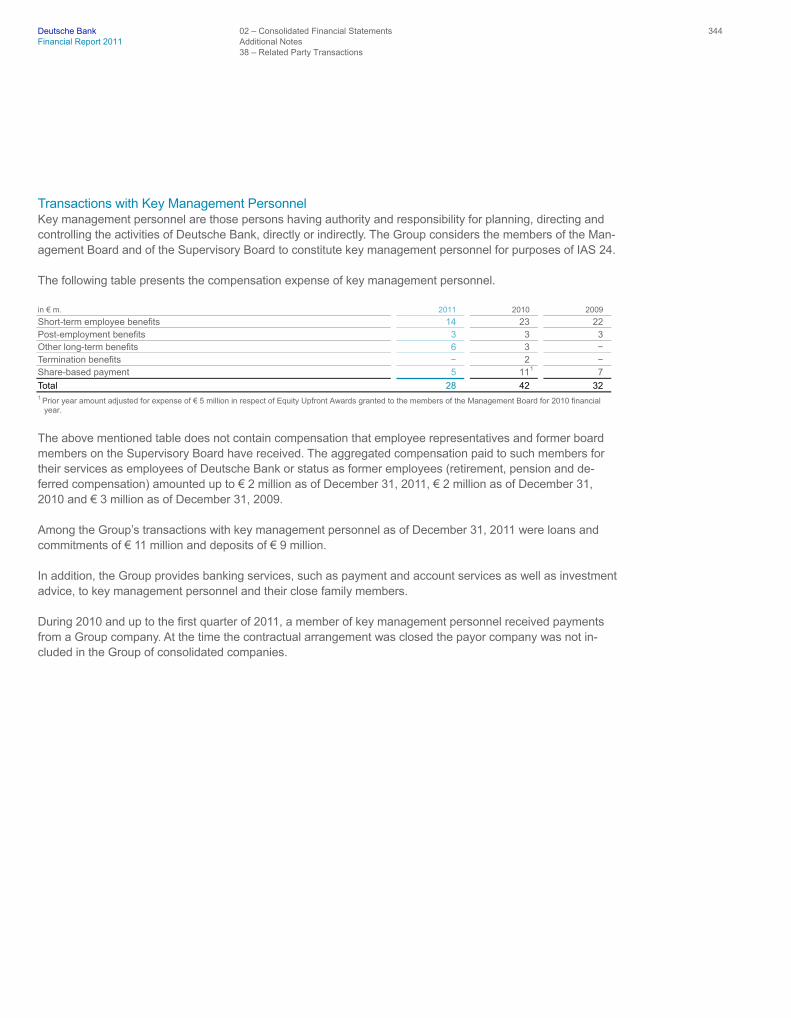
Deutsche Bank 02 – Consolidated Financial Statements 344 Financial Report 2011 Additional Notes 38 – Related Party Transactions
Transactions with Key Management Personnel Key management personnel are those persons having authority and responsibility for planning, directing and controlling the activities of Deutsche Bank, directly or indirectly. The Group considers the members of the Man-agement Board and of the Supervisory Board to constitute key management personnel for purposes of IAS 24.
The following table presents the compensation expense of key management personnel.
in € m. 2011 2010 2009
Short-term employee benefits 14 23 22 Post-employment benefits 3 3 3 Other long-term benefits 6 3 − Termination benefits − 2 − Share-based payment 5 11
1 7
Total 28 42 32 1 Prior year amount adjusted for expense of € 5 million in respect of Equity Upfront Awards granted to the members of the Management Board for 2010 financial
year.
The above mentioned table does not contain compensation that employee representatives and former board members on the Supervisory Board have received. The aggregated compensation paid to such members for their services as employees of Deutsche Bank or status as former employees (retirement, pension and de-ferred compensation) amounted up to € 2 million as of December 31, 2011, € 2 million as of December 31, 2010 and € 3 million as of December 31, 2009.
Among the Group’s transactions with key management personnel as of December 31, 2011 were loans and commitments of € 11 million and deposits of € 9 million.
In addition, the Group provides banking services, such as payment and account services as well as investment advice, to key management personnel and their close family members.
During 2010 and up to the first quarter of 2011, a member of key management personnel received payments from a Group company. At the time the contractual arrangement was closed the payor company was not in-cluded in the Group of consolidated companies.

Deutsche Bank 02 – Consolidated Financial Statements 345 Financial Report 2011 Additional Notes 38 – Related Party Transactions
Transactions with Subsidiaries, Joint Ventures and Associates Transactions between Deutsche Bank AG and its subsidiaries meet the definition of related party transactions. If these transactions are eliminated on consolidation, they are not disclosed as related party transactions. Transactions between the Group and its associated companies and joint ventures also qualify as related party transactions. Pursuant to a revised version of IAS 24, “Related Party Disclosures” (“IAS 24 R”) the definition of a related party has been amended, in part, to clarify that an associate includes subsidiaries of an associate and a joint venture includes subsidiaries of the joint ventures. IAS 24 R was applied retrospectively for 2010.
Loans in € m. 2011 2010
1
Loans outstanding, beginning of year 4,329 1,002
Loans issued during the year 1,211
2 3,585
3 Loan repayment during the year 307 148 Changes in the group of consolidated companies (13) (126) Exchange rate changes/other (62) 16 Loans outstanding, end of year
4 5,158 4,329
Other credit risk related transactions: Allowance for loan losses 53 32 Provision for loan losses 22 26 Guarantees and commitments 262 255 1 Prior year numbers were adjusted as a result of the adoption of IAS 24 R. 2 The increase in loans issued during 2011 is mainly related to the restructuring of a loan transaction. 3 The increase in loans issued during 2010 is mainly related to the restructuring of a loan transaction. Related interest income earned amounted to € 230 million
during 2011 and € 24 million during 2010 since the restructuring in the fourth quarter 2010. 4 Loans past due were nil as of December 31, 2011 and 2010. For the above loans the Group held collateral of € 963 million and € 299 million as of December 31,
2011 and December 31, 2010, respectively.
Deposits in € m. 2011 2010
1
Deposits outstanding, beginning of year 220 369
Deposits received during the year 258 162 Deposits repaid during the year 190 220 Changes in the group of consolidated companies (41) (93) Exchange rate changes/other 0 2
Deposits outstanding, end of year
2 247 220 1 Prior year numbers were adjusted as a result of the adoption of IAS 24 R. 2 The deposits are unsecured.
Other Transactions Trading assets and positive market values from derivative financial transactions with associated companies amounted to € 221 million as of December 31, 2011 and € 149 million as of December 31, 2010. Trading liabili-ties and negative market values from derivative financial transactions with associated companies amounted to € 19 million as of December 31, 2011 and € 15 million as of December 31, 2010.

Deutsche Bank 02 – Consolidated Financial Statements 346 Financial Report 2011 Additional Notes 38 – Related Party Transactions
Other transactions with related parties also reflected the following:
Xchanging etb GmbH: The Group holds a stake of 49 % in Xchanging etb GmbH and accounts for it under the equity method. Xchanging etb GmbH is the holding company of Xchanging Transaction Bank GmbH (“XTB”). Two of the five executive directors of Xchanging etb GmbH and two members of the supervisory board of XTB are employees of the Group. The Group’s arrangements with Xchanging includes two outsourcing agreements with XTB. The first agreement relates to the provision of security settlement services with a contractual maturity until May 2016. The second agreement relates to the service relationship between XTB and Sal. Oppenheim with a contractual maturity until December 2014. The outsourcing arrangements are aimed at reducing costs without compromising service quality. In 2011 and 2010, the Group received services from XTB with a volume of € 104 million and € 113 million, respectively. In 2011 and 2010, the Group provided supply services (e.g., IT and real estate-related services) with volumes of € 20 million, respectively, to XTB.
Hua Xia Bank: The Group holds a stake of 19.99 % in Hua Xia Bank and has accounted for this associate under the equity method since February 11, 2011. Further details are included in Note 17 “Equity Method In-vestments”. In 2006, Deutsche Bank and Hua Xia Bank jointly established a credit card business cooperation as one of the major pillars of their strategic partnership. The cooperation targets the establishment of a future-oriented credit card business in China comprising the international know-how of the Group in the credit card business and local expertise of Hua Xia Bank. In 2011 a provision of € 50 million has been recognized for the cooperation. This provision captures the Group’s estimated obligation from the cooperation as of December 31, 2011 should the agreement not be extended beyond the current termination date of May 2013.
Transactions with Pension Plans Under IFRS, certain post-employment benefit plans are considered as related parties. The Group has business relationships with a number of its pension plans pursuant to which it provides financial services to these plans, including investment management services. The Group’s pension funds may hold or trade Deutsche Bank shares or securities. A summary of transactions with related party pension plans follows.
in € m. 2011 2010
Deutsche Bank securities held in plan assets: Equity shares 4 − Bonds − 16 Other securities 244 83
Total 248 99
Property occupied by/other assets used by Deutsche Bank 0 − Derivatives: Market value for which Deutsche Bank (or subsidiary) is a counterparty 473 (2) Derivatives: Notional amount for which Deutsche Bank (or subsidiary) is a counterparty 14,244 14,966 Fees paid from Fund to any Deutsche Bank asset manager(s) 24 24

Deutsche Bank 02 – Consolidated Financial Statements 347 Financial Report 2011 Additional Notes 39 – Information on Subsidiaries
39 – Information on Subsidiaries
Deutsche Bank AG is the direct or indirect holding company for the Group’s subsidiaries.
Significant Subsidiaries The following table presents the significant subsidiaries Deutsche Bank AG owns, directly or indirectly as of December 31, 2011.
Subsidiary Place of Incorporation
Taunus Corporation
1 Delaware, United States Deutsche Bank Trust Company Americas
2 New York, United States Deutsche Bank Securities Inc.
3 Delaware, United States Deutsche Bank Luxembourg S.A.
4 Luxembourg Deutsche Bank Privat- und Geschäftskunden Aktiengesellschaft
5 Frankfurt am Main, Germany DB Finanz-Holding GmbH
6 Frankfurt am Main, Germany DB Valoren S.à.r.l.
7 Luxembourg DB Equity S.à.r.l.
8 Luxembourg Deutsche Postbank AG
9 Bonn, Germany 1 This company is a holding company for most of the Group's subsidiaries in the United States. Effective February 1, 2012, Taunus Corporation is no longer a
holding company for Deutsche Bank Trust Company Americas, and Deutsche Bank Trust Corp. has become the top-level U.S. holding company through which Deutsche Bank Trust Company Americas is held.
2 Deutsche Bank Trust Company Americas is a New York State-chartered bank which originates loans and other forms of credit, accepts deposits, arranges financings and provides numerous other commercial banking and financial services.
3 Deutsche Bank Securities Inc. is a U.S. SEC-registered broker dealer and is a member of the New York Stock Exchange and regulated by the Financial Industry Regulatory Authority. It is also regulated by the individual state securities authorities in the states in which it operates.
4 The primary business of this company comprises treasury and markets activities, especially as a major supplier of euro liquidity for Deutsche Bank Group. Further business activities are the international loan business, where the bank acts as lending office for continental Europe and as risk hub for the loan exposure management group, and private banking.
5 The company serves private individuals, affluent clients and small business clients with banking products. 6 The company holds the majority stake in Deutsche Postbank AG. 7 This company is a holding company for Deutsche Bank subgroups in Australia, New Zealand, and Singapore. It is also the holding company for DB Equity S.à.r.l. 8 The company holds a part of the stake in Deutsche Postbank AG. 9 The business activities of this company and its subsidiaries comprise retail banking, business with corporate customers, capital markets activities as well as home
savings loans.
The Group owns 100 % of the equity and voting interests in these subsidiaries, except for Deutsche Postbank AG, of which the Group owns shares representing 53.14 % of the equity and voting rights as of December 31, 2011, and, taking into account certain financial instruments held by us, a total equity interest of 80.56 %. Exer-cise of the aforementioned financial instruments in the first quarter 2012 resulted in an increase of direct own-ership in Postbank (further detail is included in Note 04 “Acquisitions and Dispositions”). These subsidiaries prepare financial statements as of December 31, 2011 and are included in the Group’s consolidated financial statements. Their principal countries of operation are the same as their countries of incorporation.
Subsidiaries may have restrictions on their ability to transfer funds, including payment of dividends and repay-ment of loans, to Deutsche Bank AG. Reasons for the restrictions include:
— Central bank restrictions relating to local exchange control laws — Central bank capital adequacy requirements — Local corporate laws, for example limitations regarding the transfer of funds to the parent when the respec-
tive entity has a loss carried forward not covered by retained earnings or other components of capital.

Deutsche Bank 02 – Consolidated Financial Statements 348 Financial Report 2011 Additional Notes 40 – Insurance and Investment Contracts
Subsidiaries where the Group owns 50 percent or less of the Voting Rights The Group also consolidates certain subsidiaries although it owns 50 percent or less of the voting rights. Most of those subsidiaries are special purpose entities (“SPEs”) that are sponsored by the Group for a variety of purposes.
In the normal course of business, the Group becomes involved with SPEs, primarily through the following types of transactions: asset securitizations, commercial paper programs, repackaging and investment products, mutual funds, structured transactions, leasing and closed-end funds. The Group’s involvement includes trans-ferring assets to the entities, entering into derivative contracts with them, providing credit enhancement and liquidity facilities, providing investment management and administrative services, and holding ownership or other investment interests in the entities.
Investees where the Group owns more than half of the Voting Rights The Group owns directly or indirectly more than half of the voting rights of investees but does not have control over these investees when
— another investor has the power over more than half of the voting rights by virtue of an agreement with the Group, or
— another investor has the power to govern the financial and operating policies of the investee under a sta-tute or an agreement, or
— another investor has the power to appoint or remove the majority of the members of the board of directors or equivalent governing body and the investee is controlled by that board or body, or when
— another investor has the power to cast the majority of votes at meetings of the board of directors or equiva-lent governing body and control of the entity is by that board or body.
40 – Insurance and Investment Contracts
Liabilities arising from Insurance and Investment Contracts Dec 31, 2011 Dec 31, 2010
in € m. Gross Reinsurance Net Gross Reinsurance Net
Insurance contracts 4,706 (163) 4,543 4,899 (158) 4,741 Investment contracts 7,426 − 7,426 7,898 − 7,898
Total 12,132 (163) 11,969 12,797 (158) 12,639
Generally, amounts relating to reinsurance contracts are reported gross unless they have an immaterial impact on their respective balance sheet line items.
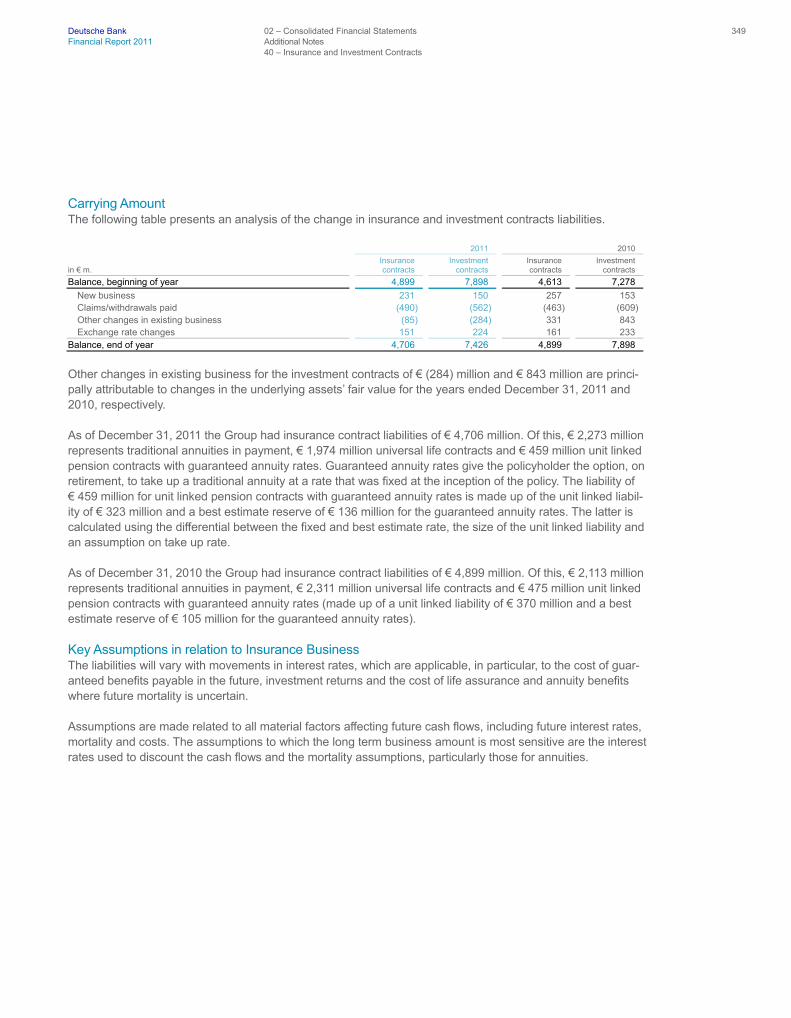
Deutsche Bank 02 – Consolidated Financial Statements 349 Financial Report 2011 Additional Notes 40 – Insurance and Investment Contracts
Carrying Amount The following table presents an analysis of the change in insurance and investment contracts liabilities.
2011 2010
in € m. Insurance contracts
Investment contracts
Insurance contracts
Investment contracts
Balance, beginning of year 4,899 7,898 4,613 7,278
New business 231 150 257 153 Claims/withdrawals paid (490) (562) (463) (609) Other changes in existing business (85) (284) 331 843 Exchange rate changes 151 224 161 233
Balance, end of year 4,706 7,426 4,899 7,898
Other changes in existing business for the investment contracts of € (284) million and € 843 million are princi-pally attributable to changes in the underlying assets’ fair value for the years ended December 31, 2011 and 2010, respectively.
As of December 31, 2011 the Group had insurance contract liabilities of € 4,706 million. Of this, € 2,273 million represents traditional annuities in payment, € 1,974 million universal life contracts and € 459 million unit linked pension contracts with guaranteed annuity rates. Guaranteed annuity rates give the policyholder the option, on retirement, to take up a traditional annuity at a rate that was fixed at the inception of the policy. The liability of € 459 million for unit linked pension contracts with guaranteed annuity rates is made up of the unit linked liabil-ity of € 323 million and a best estimate reserve of € 136 million for the guaranteed annuity rates. The latter is calculated using the differential between the fixed and best estimate rate, the size of the unit linked liability and an assumption on take up rate.
As of December 31, 2010 the Group had insurance contract liabilities of € 4,899 million. Of this, € 2,113 million represents traditional annuities in payment, € 2,311 million universal life contracts and € 475 million unit linked pension contracts with guaranteed annuity rates (made up of a unit linked liability of € 370 million and a best estimate reserve of € 105 million for the guaranteed annuity rates).
Key Assumptions in relation to Insurance Business The liabilities will vary with movements in interest rates, which are applicable, in particular, to the cost of guar-anteed benefits payable in the future, investment returns and the cost of life assurance and annuity benefits where future mortality is uncertain.
Assumptions are made related to all material factors affecting future cash flows, including future interest rates, mortality and costs. The assumptions to which the long term business amount is most sensitive are the interest rates used to discount the cash flows and the mortality assumptions, particularly those for annuities.

Deutsche Bank 02 – Consolidated Financial Statements 350 Financial Report 2011 Additional Notes 40 – Insurance and Investment Contracts
The assumptions are set out below:
Interest Rates Interest rates are used that reflect a best estimate of future investment returns taking into account the nature and terms of the assets used to support the liabilities. Suitable margins for default risk are allowed for in the assumed interest rate.
Mortality Mortality rates are based on published tables, adjusted appropriately to take into account changes in the un-derlying population mortality since the table was published, company experience and forecast changes in future mortality. If appropriate, a margin is added to assurance mortality rates to allow for adverse future deviations. Annuitant mortality rates are adjusted to make allowance for future improvements in pensioner longevity. Improvements in annuitant mortality are based on a percentage of the medium cohort projection subject to a minimum of rate of improvement of 1.25 % per annum.
Costs For non-linked contracts, allowance is made explicitly for future expected per policy costs.
Other Assumptions The take-up rate of guaranteed annuity rate options on pension business is assumed to be 66 % for the year ended December 31, 2011 and 64 % for the year ended December 31, 2010.
Key Assumptions impacting Value of Business Acquired (VOBA) The opening VOBA arising on the purchase of Abbey Life Assurance Company Limited was determined by capitalizing the present value of the future cash flows of the business over the reported liability at the date of acquisition. If assumptions were required about future mortality, morbidity, persistency and expenses, they were determined on a best estimate basis taking into account the business’s own experience. General economic assumptions were set considering the economic indicators at the date of acquisition.
The rate of VOBA amortization is determined by considering the profile of the business acquired and the expected depletion in future value. At the end of each accounting period, the remaining VOBA is tested against the future net profit expected related to the business that was in force at the date of acquisition.
If there is insufficient net profit, the VOBA will be written down to its supportable value.

Deutsche Bank 02 – Consolidated Financial Statements 351 Financial Report 2011 Additional Notes 40 – Insurance and Investment Contracts
Key Changes in Assumptions Upon acquisition of Abbey Life Assurance Company Limited in October 2007, liabilities for insurance contracts were recalculated from a regulatory basis to a best estimate basis in line with the provisions of IFRS 4. The non-economic assumptions set at that time have not been changed but the economic assumptions have been reviewed in line with changes in key economic indicators. For annuity contracts, the liability was valued using the locked-in basis determined at the date of acquisition.
Sensitivity Analysis (in respect of Insurance Contracts only) The following table presents the sensitivity of the Group’s profit before tax and equity to changes in some of the key assumptions used for insurance contract liability calculations. For each sensitivity test, the impact of a reasonably possible change in a single factor is shown with other assumptions left unchanged.
Impact on profit before tax Impact on equity
in € m. 2011 2010 2011 2010
Variable: Mortality (worsening by ten percent)
1 (12) (12) (9) (9) Renewal expense (ten percent increase) (3) (2) (2) (1) Interest rate (one percent increase) 17 14 (116) (112) 1 The impact of mortality assumes a ten percent decrease in annuitant mortality and a ten percent increase in mortality for other business.
For certain insurance contracts, the underlying valuation basis contains a Provision for Adverse Deviations (“PADs”). For these contracts, any worsening of expected future experience would not change the level of reserves held until all the PADs have been eroded while any improvement in experience would not result in an increase to these reserves. Therefore, in the sensitivity analysis, if the variable change represents a worsening of experience, the impact shown represents the excess of the best estimate liability over the PADs held at the balance sheet date. As a result, the figures disclosed in this table should not be used to imply the impact of a different level of change and it should not be assumed that the impact would be the same if the change occurred at a different point in time.

Deutsche Bank 02 – Consolidated Financial Statements 352 Financial Report 2011 Additional Notes 41 – Current and Non-Current Assets and Liabilities
41 – Current and Non-Current Assets and Liabilities
The following tables present an analysis of each asset and liability line item by amounts recovered or settled within or after one year as of December 31, 2011 and 2010.
Asset items as of December 31, 2011.
Amounts recovered or settled Total
in € m. within one year after one year Dec 31, 2011
Cash and due from banks 15,928 − 15,928 Interest-earning deposits with banks 160,834 1,166 162,000 Central bank funds sold and securities purchased under resale agreements 25,297 476 25,773 Securities borrowed 31,310 27 31,337 Financial assets at fair value through profit or loss 1,252,616 28,183 1,280,799 Financial assets available for sale 7,511 37,770 45,281 Equity method investments − 3,759 3,759 Loans 133,236 279,278 412,514 Property and equipment − 5,509 5,509 Goodwill and other intangible assets − 15,802 15,802 Other assets 144,102 10,692 154,794 Assets for current tax 1,646 224 1,870 Total assets before deferred tax assets 1,772,480 382,886 2,155,366
Deferred tax assets 8,737
Total assets 2,164,103
Liability items as of December 31, 2011.
Amounts recovered or settled Total
in € m. within one year after one year Dec 31, 2011
Deposits 568,628 33,102 601,730 Central bank funds purchased and securities sold under repurchase agreements 35,292 19 35,311 Securities loaned 7,638 451 8,089 Financial liabilities at fair value through profit or loss 1,010,015 18,432 1,028,447 Other short-term borrowings 65,356 − 65,356 Other liabilities 179,294 8,522 187,816 Provisions 2,621 − 2,621 Liabilities for current tax 1,381 1,143 2,524 Long-term debt 30,317 133,099 163,416 Trust preferred securities 2,600 9,744 12,344 Total liabilities before deferred tax liabilities 1,903,142 204,512 2,107,654
Deferred tax liabilities 1,789
Total liabilities 2,109,443

Deutsche Bank 02 – Consolidated Financial Statements 353 Financial Report 2011 Additional Notes 41 – Current and Non-Current Assets and Liabilities
Asset items as of December 31, 2010, follow.
Amounts recovered or settled Total
in € m. within one year after one year Dec 31, 2010
Cash and due from banks 17,157 − 17,157 Interest-earning deposits with banks 91,471 906 92,377 Central bank funds sold and securities purchased under resale agreements 19,923 442 20,365 Securities borrowed 28,916 − 28,916 Financial assets at fair value through profit or loss 1,069,579 31,418 1,100,997 Financial assets available for sale 7,859 46,407 54,266 Equity method investments − 2,608 2,608 Loans 128,157 279,572 407,729 Property and equipment − 5,802 5,802 Goodwill and other intangible assets − 15,594 15,594 Other assets 137,751 11,478 149,229 Assets for current tax 2,048 201 2,249 Total assets before deferred tax assets 1,502,861 394,428 1,897,289
Deferred tax assets 8,341
Total assets 1,905,630
Liability items as of December 31, 2010, follow.
Amounts recovered or settled Total
in € m. within one year after one year Dec 31, 2010
Deposits
1 494,719 39,265 533,984 Central bank funds purchased and securities sold under repurchase agreements 26,314 1,608 27,922 Securities loaned 3,078 198 3,276 Financial liabilities at fair value through profit or loss
2 833,666 20,440 854,106 Other short-term borrowings 64,990 − 64,990 Other liabilities 169,192 12,635 181,827 Provisions 2,204 − 2,204 Liabilities for current tax 960 1,776 2,736 Long-term debt 28,870 140,790 169,660 Trust preferred securities 1,334 10,916 12,250 Total liabilities before deferred tax liabilities 1,625,327 227,628 1,852,955
Deferred tax liabilities 2,307
Total liabilities 1,855,262 1 The maturity split for building saving deposits included in interest bearing deposits was adjusted to reflect the earliest contractual maturity or first call. Previously
the maturity split was based on expected maturities. 2 The initial acquisition accounting for ABN AMRO, which was finalized at March 31, 2011 resulted in a retrospective reduction of € 24 million in the acquisition date
fair value of net assets acquired. For more information please refer to Note 04 “Acquisitions and Dispositions”.

Deutsche Bank 02 – Consolidated Financial Statements 354 Financial Report 2011 Additional Notes 43 – Supplementary Information to the Consolidated Financial Statements according to Section
315a HGB
42 – Events after the Reporting Date
On February 27, 2012, Deutsche Bank has exchanged the Mandatory Exchangeable Bond (MEB) in 60 million Postbank shares (27.4 %) and on February 28, 2012, Deutsche Post AG has exercised its option to put 26.4 million shares (12.1 %). As a result, Deutsche Bank owns an additional 86.4 million Postbank shares (39.5 %), leading to a total Postbank holding of 204.9 million shares (93.7 %). The settlement of MEB and put option has no impact on Deutsche Bank’s regulatory capital and liquidity position. See Note 04 “Acquisitions and Disposi-tions” for further details.
On February 28, 2012, Deutsche Bank announced that it is in exclusive negotiations with Guggenheim Part-ners on the sale of its Asset Management businesses that are subject to a previously-announced strategic review. The businesses include DWS Americas, the Americas mutual fund business; DB Advisors, the global institutional asset management business; Deutsche Insurance Asset Management, the global insurance asset management business; and RREEF, the global alternative asset management business. These negotiations are not yet finalized and we cannot reliably assess the financial effects of a potential sale.
43 – Supplementary Information to the Consolidated Financial Statements according to Section 315a HGB
As required by Section 315a German Commercial Code (“HGB”), the consolidated financial statements pre-pared in accordance with IFRS must provide additional disclosures which are given below.
Staff Costs in € m. 2011 2010
Staff costs:
Wages and salaries 11,071 10,786 Social security costs 2,064 1,885
thereof: those relating to pensions 675 440
Total 13,135 12,671
Staff The average number of effective staff employed in 2011 was 101,836 (2010: 82,434) of whom 44,865 (2010: 34,529) were women. Part-time staff is included in these figures proportionately. An average of 53,153 (2010: 51,268) staff members worked outside Germany.
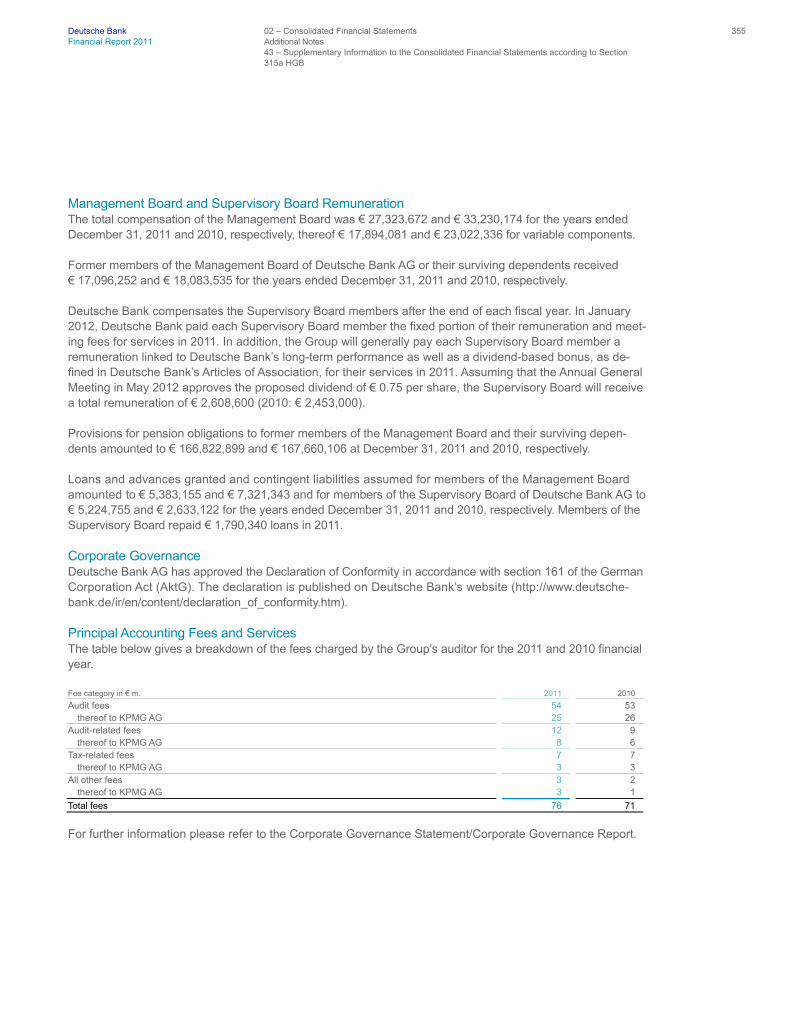
Deutsche Bank 02 – Consolidated Financial Statements 355 Financial Report 2011 Additional Notes 43 – Supplementary Information to the Consolidated Financial Statements according to Section
315a HGB
Management Board and Supervisory Board Remuneration The total compensation of the Management Board was € 27,323,672 and € 33,230,174 for the years ended December 31, 2011 and 2010, respectively, thereof € 17,894,081 and € 23,022,336 for variable components.
Former members of the Management Board of Deutsche Bank AG or their surviving dependents received € 17,096,252 and € 18,083,535 for the years ended December 31, 2011 and 2010, respectively.
Deutsche Bank compensates the Supervisory Board members after the end of each fiscal year. In January 2012, Deutsche Bank paid each Supervisory Board member the fixed portion of their remuneration and meet-ing fees for services in 2011. In addition, the Group will generally pay each Supervisory Board member a remuneration linked to Deutsche Bank’s long-term performance as well as a dividend-based bonus, as de-fined in Deutsche Bank’s Articles of Association, for their services in 2011. Assuming that the Annual General Meeting in May 2012 approves the proposed dividend of € 0.75 per share, the Supervisory Board will receive a total remuneration of € 2,608,600 (2010: € 2,453,000).
Provisions for pension obligations to former members of the Management Board and their surviving depen-dents amounted to € 166,822,899 and € 167,660,106 at December 31, 2011 and 2010, respectively.
Loans and advances granted and contingent liabilities assumed for members of the Management Board amounted to € 5,383,155 and € 7,321,343 and for members of the Supervisory Board of Deutsche Bank AG to € 5,224,755 and € 2,633,122 for the years ended December 31, 2011 and 2010, respectively. Members of the Supervisory Board repaid € 1,790,340 loans in 2011.
Corporate Governance Deutsche Bank AG has approved the Declaration of Conformity in accordance with section 161 of the German Corporation Act (AktG). The declaration is published on Deutsche Bank’s website (http://www.deutsche-bank.de/ir/en/content/declaration_of_conformity.htm).
Principal Accounting Fees and Services The table below gives a breakdown of the fees charged by the Group’s auditor for the 2011 and 2010 financial year.
Fee category in € m. 2011 2010
Audit fees 54 53 thereof to KPMG AG 25 26
Audit-related fees 12 9 thereof to KPMG AG 8 6
Tax-related fees 7 7 thereof to KPMG AG 3 3
All other fees 3 2 thereof to KPMG AG 3 1
Total fees 76 71
For further information please refer to the Corporate Governance Statement/Corporate Governance Report.
Deutsche Bank 02 – Consolidated Financial Statements 356 Financial Report 2011 Additional Notes 44 – Shareholdings
44 – Shareholdings
Subsidiaries – 357
Special Purpose Entities – 378
Companies accounted for at equity – 392
Other Companies, where the holding equals or exceeds 20 % – 396
Holdings in large corporations, where the holding exceeds 5 % of the voting rights – 398
The following pages show the Shareholdings of Deutsche Bank Group pursuant to Section 313 (2) of the German Commercial Code (“HGB”).
Footnotes:
1 Controlled via managing general partner. 2 Controlled due to board membership. 3 Controlled, as potential currently exercisable voting rights are held, which can increase Deutsche Bank
Group’s interest to above 50 %. 4 Special Fund. 5 Controlled. 6 The company made use of the exemption offered by Section 264b HGB. 7 Only specified assets and related liabilities (silos) of this entity were consolidated. 8 Consists of 772 individual Trusts (only varying in series number / duration) which purchase a municipal
debt security and issue short puttable exempt adjusted receipts (SPEARs) and long inverse floating exempt receipts (LIFERs) which are then sold to investors.
9 Accounted for at equity due to significant influence. 10 Not controlled. 11 Classified as Special Purpose Entity not to be accounted for at equity under IFRS. 12 Classified as Special Purpose Entity not to be consolidated under IFRS. 13 No significant influence. 14 Not accounted for at equity as classified as at fair value. 15 Not consolidated or accounted for at equity as classified as securities available for sale. 16 Shares are held as collateral. 17 No control and significant influence, as a third party holds potential currently exercisable voting rights,
which can reduce Deutsche Bank Group’s interest to less than 20 %.

Deutsche Bank 02 – Consolidated Financial Statements 357 Financial Report 2011 Additional Notes 44 – Shareholdings
Subsidiaries
Serial
No. Name of company Domicile of company Footnote
Share of
Capital
in %
1 Deutsche Bank Aktiengesellschaft Frankfurt am Main
2 Abbey Life Assurance Company Limited London 100.0
3 Abbey Life Trust Securities Limited London 100.0
4 Abbey Life Trustee Services Limited London 100.0
5 ABFS I Incorporated Baltimore 100.0
6 ABS Leasing Services Company Chicago 100.0
7 ABS MB Limited Baltimore 100.0
8 Absolute Energy S.r.l. Rome 100.0
9 AC VII Privatkunden GmbH & Co. KG Munich 1 0.0
10 Accounting Solutions Holding Company, Inc. Wilmington 100.0
11 ADARA Beteiligungs- und Verwaltungs GmbH Cologne 100.0
12 ADD ONE GmbH & Co. KG Munich 1 0.0
13 Advent Chestnut VI GmbH & Co. KG Munich 1 0.1
14 Affordable Housing I LLC Wilmington 100.0
15 Agripower Buddosò Società Agricola a Responsabilità Limitata Pesaro 2, 3 9.0
16 AheadCom Beteiligungs-GmbH Frankfurt 100.0
17 Airport Club für International Executives GmbH Frankfurt 84.0
18 Alex. Brown Financial Services Incorporated Baltimore 100.0
19 Alex. Brown Investments Incorporated Baltimore 100.0
20 Alex. Brown Management Services, Inc. Baltimore 100.0
21 Alfred Herrhausen Gesellschaft - Das internationale Forum der Deutschen Bank - mbH Berlin 100.0
22 Allsar Inc. Wilmington 100.0
23 AMADEUS II 'D' GmbH & Co. KG Munich 100.0
24 America/Asia Private Equity Portfolio (PE-US/ASIA) GmbH & Co. KG Munich 1 0.2
25 Americas Trust Servicios de Consultoria, S.A. Madrid 100.0
26 Antelope Pension Trustee Services Limited London 100.0
27 AO DB Securities (Kazakhstan) Almaty 100.0
28 AP Far East Limited Hong Kong 100.0
29 Apex Fleet Inc. Wilmington 100.0
30 APOLLON Vermögensverwaltungsgesellschaft mbH Cologne 100.0
31 Aqueduct Capital S.à r.l. Luxembourg 100.0
32 Arche Investments Limited London 100.0
33 Argent Incorporated Baltimore 100.0
34 ATHOS Beteiligungs- und Verwaltungs-GmbH Cologne 100.0
35 Autumn Leasing Limited London 100.0
36 Avatar Finance George Town 100.0
37 AXOS Beteiligungs- und Verwaltungs-GmbH Cologne 100.0
38 B.T. Vordertaunus (Luxembourg), S.à r.l. Luxembourg 100.0
39 B.T.I. Investments London 100.0
40 B.V. Matura Handelmaatschappij Amsterdam 100.0
41 BAG Frankfurt 4 100.0
42 Baincor Nominees Pty. Limited Sydney 100.0
43 Bainpro Nominees Pty. Limited Sydney 100.0
44 Bainsec Nominees Pty. Limited Sydney 100.0
45 BAL Servicing Corporation Wilmington 100.0
46 Bank Sal. Oppenheim jr. & Cie. (Schweiz) AG Zurich 100.0
47 Bankers International Corporation New York 100.0
48 Bankers International Corporation (Brasil) Ltda. Sao Paulo 100.0
49 Bankers Trust Caribe Capital Markets, Inc. Hato Rey 100.0
50 Bankers Trust International Finance (Jersey) Limited St. Helier 100.0
51 Bankers Trust International Limited London 100.0
52 Bankers Trust Investments Limited London 100.0
53 Bankers Trust Nominees Limited London 100.0
54 Barkly Investments Ltd. St. Helier 100.0
Subsidiaries

Deutsche Bank 02 – Consolidated Financial Statements 358 Financial Report 2011 Additional Notes 44 – Shareholdings
Subsidiaries
Serial
No. Name of company Domicile of company Footnote
Share of
Capital
in %
55 Bayan Delinquent Loan Recovery 1 (SPV-AMC), Inc. Makati City 100.0
56 Beachwood Properties Corp. Wilmington 5 0.0
57 Bebek Varlik Yönetym A.S. Istanbul 100.0
58 Betriebs-Center für Banken AG Frankfurt 100.0
59 Betriebs-Center für Banken Processing GmbH Frankfurt 100.0
60 BfI-Beteiligungsgesellschaft für Industriewerte mbH Frankfurt 100.0
61 BHF Club Deal GmbH Frankfurt 100.0
62 BHF Grundbesitz-Verwaltungsgesellschaft mbH Frankfurt 100.0
63 BHF Grundbesitz-Verwaltungsgesellschaft mbH & Co. am Kaiserlei OHG Frankfurt 100.0
64 BHF Immobilien-GmbH Frankfurt 100.0
65 BHF Lux Immo S.A. Luxembourg 100.0
66 BHF PEP I Beteiligungsgesellschaft mbH Cologne 100.0
67 BHF PEP II Beteiligungsgesellschaft mbH Cologne 100.0
68 BHF PEP III Beteiligungsgesellschaft mbH Cologne 100.0
69 BHF Private Equity Management GmbH Frankfurt 100.0
70 BHF Private Equity Portfolio GmbH & Co. Beteiligungs KG Nr. 1 Munich 1 0.4
71 BHF Private Equity Portfolio GmbH & Co. Beteiligungs KG Nr. 2 Munich 1 0.3
72 BHF Private Equity Portfolio GmbH & Co. Beteiligungs KG Nr. 3 Munich 1 0.4
73 BHF Private Equity Treuhand- und Beratungsgesellschaft mbH Frankfurt 100.0
74 BHF Trust Management Gesellschaft für Vermögensverwaltung mbH Frankfurt 100.0
75 BHF Zurich Family Office AG Zurich 100.0
76 BHF-BANK (Schweiz) AG Zurich 100.0
77 BHF-BANK Aktiengesellschaft Frankfurt 100.0
78 BHF-BANK International S.A. Luxembourg 100.0
79 BHF-Betriebsservice GmbH Frankfurt 100.0
80 BHW - Gesellschaft für Wohnungswirtschaft mbH Hameln 100.0
81 BHW - Gesellschaft für Wohnungswirtschaft mbH & Co. Immobilienverwaltungs KG Hameln 100.0
82 BHW Bausparkasse Aktiengesellschaft Hameln 100.0
83 BHW Direktservice GmbH Hameln 100.0
84 BHW Eurofinance B.V. Arnhem 100.0
85 BHW Financial S.r.l. Verona 100.0
86 BHW Gesellschaft für Vorsorge mbH Hameln 100.0
87 BHW Holding Aktiengesellschaft Berlin 100.0
88 BHW Invest, Société à responsabilité limitée Luxembourg 100.0
89 BHW Kreditservice GmbH Hameln 100.0
90 BHW-Immobilien GmbH Hameln 100.0
91 Billboard Partners L.P. George Town 99.9
92 Biomass Holdings S.à r.l. Luxembourg 100.0
93 Bleeker Investments Limited Wilmington 100.0
94 Blue Cork, Inc. Wilmington 100.0
95 Blue Ridge CLO Holding Company LLC Wilmington 100.0
96 Bluewater Creek Management Co. Wilmington 100.0
97 BNA Nominees Pty. Limited Sydney 100.0
98 Bonsai Investment AG Frauenfeld 100.0
99 Borfield S.A. Montevideo 100.0
100 BRIMCO, S. de R.L. de C.V. Mexico City 100.0
101 Britannia Limited London 100.0
102 Broome Investments Limited Wilmington 100.0
103 BS 2 Y.K. Tokyo 100.0
104 BT American Securities (Luxembourg), S.à r.l. Luxembourg 100.0
105 BT Commercial Corporation Wilmington 100.0
106 BT CTAG Nominees Limited London 100.0
107 BT Globenet Nominees Limited London 100.0
108 BT International (Nigeria) Limited Lagos 100.0

Deutsche Bank 02 – Consolidated Financial Statements 359 Financial Report 2011 Additional Notes 44 – Shareholdings
Subsidiaries
Serial
No. Name of company Domicile of company Footnote
Share of
Capital
in %
109 BT Maulbronn GmbH Eschborn 100.0
110 BT Milford (Cayman) Limited George Town 100.0
111 BT Muritz GmbH Eschborn 100.0
112 BT Nominees (Singapore) Pte Ltd Singapore 100.0
113 BT Opera Trading S.A. Paris 100.0
114 BT Pension Fund Trustees Limited (in member's voluntary liquidation) London 100.0
115 BT Sable, L.L.C. Wilmington 100.0
116 BT Vordertaunus Verwaltungs- und Beteiligungsgesellschaft mbH Eschborn 100.0
117 BT/ABKB Partnership Management Los Angeles 99.9
118 BTAS Cayman GP George Town 100.0
119 BTD Nominees Pty. Limited Sydney 100.0
120 BTFIC - Portugal, Gestao e Investimentos (Sociedade Unipessoal) S.A. Funchal 100.0
121 BTVR Investments No. 1 Limited St. Helier 100.0
122 Business Support One Y.K. Tokyo 100.0
123 Buxtal Pty Limited Sydney 100.0
124 C. J. Lawrence Inc. Wilmington 100.0
125 CAM DREI Initiator GmbH & Co. KG Cologne 1 14.5
126 CAM Initiator Treuhand GmbH & Co. KG Cologne 100.0
127 CAM PE Verwaltungs GmbH & Co. KG Cologne 100.0
128 CAM Private Equity Consulting & Verwaltungs-GmbH Cologne 100.0
129 CAM Private Equity Evergreen GmbH & Co. KG UBG Cologne 1 0.0
130 CAM Private Equity Nominee GmbH & Co. KG Cologne 100.0
131 CAM Private Equity Verwaltungs-GmbH Cologne 100.0
132 CAM Secondary Select I Beteiligungs GmbH Cologne 100.0
133 CAM Secondary Select I GmbH & Co. KG Cologne 1 0.0
134 CAM SEL I Initiator GmbH & Co. KG Cologne 1 15.3
135 CAM SEL II Initiator GmbH & Co. KG Cologne 1 15.3
136 CAM Select I Beteiligungs GmbH Cologne 100.0
137 CAM Select I GmbH & Co. KG Cologne 1 0.0
138 CAM Select II Beteiligungs GmbH Cologne 100.0
139 CAM Select II GmbH & Co. KG Cologne 1 0.0
140 3160343 Canada Inc. Toronto 100.0
141 3613950 Canada, Inc. Toronto 100.0
142 Caneel Bay Holding Corp. Chicago 5 0.0
143 Cape Acquisition Corp. Wilmington 100.0
144 CapeSuccess Inc. Wilmington 100.0
145 CapeSuccess LLC Wilmington 82.6
146 Capital Solutions Exchange Inc. Wilmington 100.0
147 Cardales UK Limited Liverpool 100.0
148 Career Blazers Consulting Services, Inc. Albany 100.0
149 Career Blazers Contingency Professionals, Inc. Albany 100.0
150 Career Blazers Learning Center of Los Angeles, Inc. Los Angeles 100.0
151 Career Blazers LLC Wilmington 100.0
152 Career Blazers Management Company, Inc. Albany 100.0
153 Career Blazers New York, Inc. Albany 100.0
154 Career Blazers of Ontario, Inc. London, Ontario 100.0
155 Career Blazers Personnel Services of Washington, D.C., Inc. Washington D.C. 100.0
156 Career Blazers Personnel Services, Inc. Albany 100.0
157 Career Blazers Service Company, Inc. Wilmington 100.0
158 Caribbean Resort Holdings, Inc. New York 5 0.0
159 CarVal Master Fundo de Investimento em Direitos Creditórios Sao Paulo 100.0
160 Cashforce International Credit Support B.V. Rotterdam 100.0
161 Castlewood Expansion Partners, L.P. Wilmington 87.5
162 Castor LLC Wilmington 5 0.0
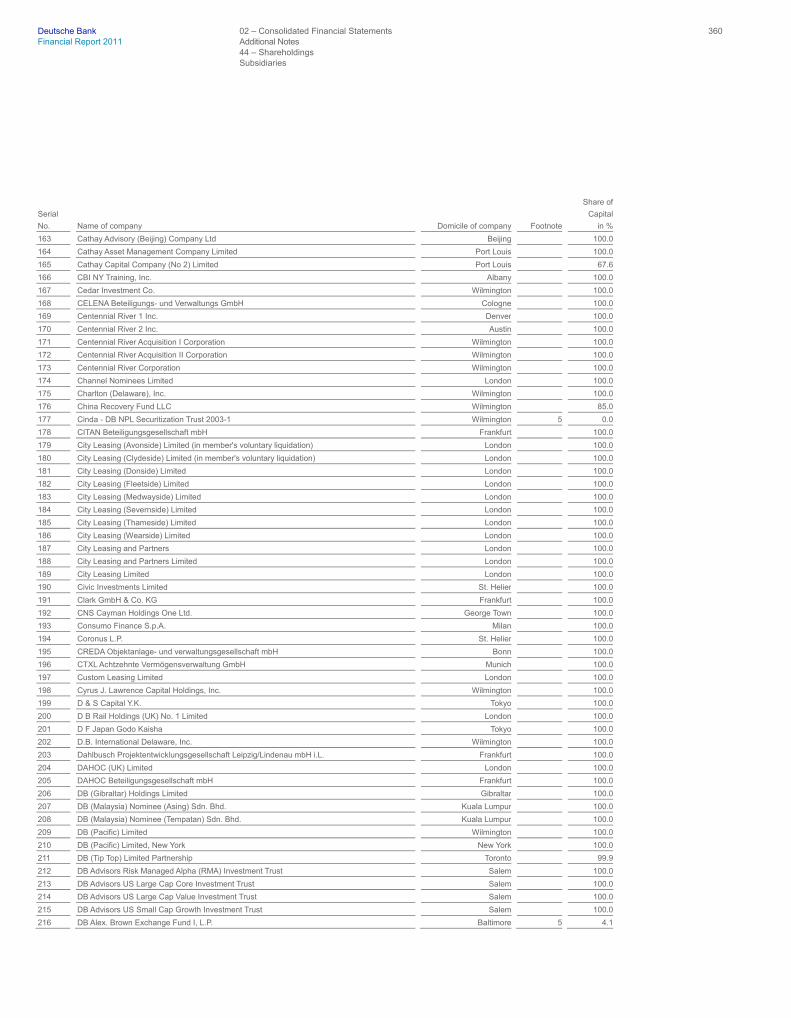
Deutsche Bank 02 – Consolidated Financial Statements 360 Financial Report 2011 Additional Notes 44 – Shareholdings
Subsidiaries
Serial
No. Name of company Domicile of company Footnote
Share of
Capital
in %
163 Cathay Advisory (Beijing) Company Ltd Beijing 100.0
164 Cathay Asset Management Company Limited Port Louis 100.0
165 Cathay Capital Company (No 2) Limited Port Louis 67.6
166 CBI NY Training, Inc. Albany 100.0
167 Cedar Investment Co. Wilmington 100.0
168 CELENA Beteiligungs- und Verwaltungs GmbH Cologne 100.0
169 Centennial River 1 Inc. Denver 100.0
170 Centennial River 2 Inc. Austin 100.0
171 Centennial River Acquisition I Corporation Wilmington 100.0
172 Centennial River Acquisition II Corporation Wilmington 100.0
173 Centennial River Corporation Wilmington 100.0
174 Channel Nominees Limited London 100.0
175 Charlton (Delaware), Inc. Wilmington 100.0
176 China Recovery Fund LLC Wilmington 85.0
177 Cinda - DB NPL Securitization Trust 2003-1 Wilmington 5 0.0
178 CITAN Beteiligungsgesellschaft mbH Frankfurt 100.0
179 City Leasing (Avonside) Limited (in member's voluntary liquidation) London 100.0
180 City Leasing (Clydeside) Limited (in member's voluntary liquidation) London 100.0
181 City Leasing (Donside) Limited London 100.0
182 City Leasing (Fleetside) Limited London 100.0
183 City Leasing (Medwayside) Limited London 100.0
184 City Leasing (Severnside) Limited London 100.0
185 City Leasing (Thameside) Limited London 100.0
186 City Leasing (Wearside) Limited London 100.0
187 City Leasing and Partners London 100.0
188 City Leasing and Partners Limited London 100.0
189 City Leasing Limited London 100.0
190 Civic Investments Limited St. Helier 100.0
191 Clark GmbH & Co. KG Frankfurt 100.0
192 CNS Cayman Holdings One Ltd. George Town 100.0
193 Consumo Finance S.p.A. Milan 100.0
194 Coronus L.P. St. Helier 100.0
195 CREDA Objektanlage- und verwaltungsgesellschaft mbH Bonn 100.0
196 CTXL Achtzehnte Vermögensverwaltung GmbH Munich 100.0
197 Custom Leasing Limited London 100.0
198 Cyrus J. Lawrence Capital Holdings, Inc. Wilmington 100.0
199 D & S Capital Y.K. Tokyo 100.0
200 D B Rail Holdings (UK) No. 1 Limited London 100.0
201 D F Japan Godo Kaisha Tokyo 100.0
202 D.B. International Delaware, Inc. Wilmington 100.0
203 Dahlbusch Projektentwicklungsgesellschaft Leipzig/Lindenau mbH i.L. Frankfurt 100.0
204 DAHOC (UK) Limited London 100.0
205 DAHOC Beteiligungsgesellschaft mbH Frankfurt 100.0
206 DB (Gibraltar) Holdings Limited Gibraltar 100.0
207 DB (Malaysia) Nominee (Asing) Sdn. Bhd. Kuala Lumpur 100.0
208 DB (Malaysia) Nominee (Tempatan) Sdn. Bhd. Kuala Lumpur 100.0
209 DB (Pacific) Limited Wilmington 100.0
210 DB (Pacific) Limited, New York New York 100.0
211 DB (Tip Top) Limited Partnership Toronto 99.9
212 DB Advisors Risk Managed Alpha (RMA) Investment Trust Salem 100.0
213 DB Advisors US Large Cap Core Investment Trust Salem 100.0
214 DB Advisors US Large Cap Value Investment Trust Salem 100.0
215 DB Advisors US Small Cap Growth Investment Trust Salem 100.0
216 DB Alex. Brown Exchange Fund I, L.P. Baltimore 5 4.1

Deutsche Bank 02 – Consolidated Financial Statements 361 Financial Report 2011 Additional Notes 44 – Shareholdings
Subsidiaries
Serial
No. Name of company Domicile of company Footnote
Share of
Capital
in %
217 DB Alex. Brown Holdings Incorporated Wilmington 100.0
218 DB Alps Corporation Wilmington 100.0
219 DB Alternative Trading Inc. Wilmington 100.0
220 DB Americas Asset Management Corp. Wilmington 100.0
221 DB Americas Funding Corp. Wilmington 100.0
222 DB Americas Infrastructure Holdings, L.L.C. Wilmington 100.0
223 DB Aotearoa Investments Limited George Town 100.0
224 DB Beteiligungs-Holding GmbH Frankfurt 100.0
225 DB Bluebell Investments (Cayman) Partnership George Town 100.0
226 DB Broker GmbH Frankfurt 100.0
227 DB Canada GIPF - I Corp. Calgary 100.0
228 DB Capital Management, Inc. Wilmington 100.0
229 DB Capital Markets (Deutschland) GmbH Frankfurt 100.0
230 DB Capital Markets Asset Management Holding GmbH Frankfurt 100.0
231 DB Capital Partners (Asia), L.P. George Town 99.7
232 DB Capital Partners (Europe) 2000 - A Founder Partner LP Wilmington 80.0
233 DB Capital Partners (Europe) 2000 - B Founder Partner LP Wilmington 80.0
234 DB Capital Partners Asia GP, Limited George Town 100.0
235 DB Capital Partners Europe 2002 Founder Partner LP Wilmington 80.0
236 DB Capital Partners General Partner Limited London 100.0
237 DB Capital Partners Latin America, G.P. Limited George Town 100.0
238 DB Capital Partners, Inc. Wilmington 100.0
239 DB Capital Partners, Latin America, LP George Town 80.2
240 DB Capital, Inc. Wilmington 100.0
241 DB Cartera de Inmuebles 1, S.A.U. Pozuelo de Alarcón 100.0
242 DB Chambers LLC Wilmington 100.0
243 DB Chestnut Holdings Limited George Town 100.0
244 DB Commodities Canada Ltd. Toronto 100.0
245 DB Commodity Services LLC Wilmington 100.0
246 DB Concerto (LP) Limited George Town 100.0
247 DB Concerto Limited George Town 100.0
248 DB Consortium S. Cons. a r.l. in liquidazione Milan 100.0
249 DB Consorzio S. Cons. a r. l. Milan 100.0
250 DB Corporate Advisory (Malaysia) Sdn. Bhd. Kuala Lumpur 100.0
251 DB Crest Limited St. Helier 100.0
252 DB Delaware Holdings (Europe) Limited Wilmington 100.0
253 DB Delaware Holdings (UK) Limited London 100.0
254 DB Depositor Inc. Wilmington 100.0
255 DB Elara LLC Wilmington 100.0
256 DB Energy Commodities Limited London 100.0
257 DB Energy Trading LLC Wilmington 100.0
258 DB Enfield Infrastructure Holdings Limited St. Helier 100.0
259 DB Enfield Infrastructure Investments Limited St. Helier 100.0
260 DB Enterprise GmbH Luetzen-Gostau 100.0
261 DB Enterprise GmbH & Co. Zweite Beteiligungs KG Luetzen-Gostau 6 100.0
262 DB Equipment Leasing, Inc. New York 100.0
263 DB Equity Limited London 100.0
264 DB Equity S.à r.l. Luxembourg 100.0
265 DB ESC Corporation Wilmington 100.0
266 DB Export-Leasing GmbH Frankfurt 100.0
267 DB Fillmore Lender Corp. Wilmington 100.0
268 DB Finance (Delaware), LLC Wilmington 100.0
269 DB Finance Holdings, Inc. Wilmington 100.0
270 DB Finance International GmbH Eschborn 100.0

Deutsche Bank 02 – Consolidated Financial Statements 362 Financial Report 2011 Additional Notes 44 – Shareholdings
Subsidiaries
Serial
No. Name of company Domicile of company Footnote
Share of
Capital
in %
271 DB Finanz-Holding GmbH Frankfurt 100.0
272 DB Funding Corporation # 1 Wilmington 100.0
273 DB Funding Corporation # 3 Wilmington 100.0
274 DB Funding LLC #4 Wilmington 100.0
275 DB Funding LLC #5 Wilmington 100.0
276 DB Funding LLC #6 Wilmington 100.0
277 DB Funding, L.P. Baltimore 100.0
278 DB Galil Finance, Inc. Wilmington 100.0
279 DB Ganymede 2006 L.P. George Town 100.0
280 DB Global Alternative Agribusiness Master Portfolio Ltd. George Town 100.0
281 DB Global Infrastructure Fund Luxembourg 5 0.1
282 DB Global Markets Multi-Strategy Fund I Limited George Town 100.0
283 DB Global Processing Services, Inc. Wilmington 100.0
284 DB Global Technology, Inc. Wilmington 100.0
285 DB Green Holdings Corp. Wilmington 100.0
286 DB Green, Inc. New York 100.0
287 DB Group Services (UK) Limited London 100.0
288 DB Hawks Nest, Inc. Wilmington 100.0
289 DB HedgeWorks, LLC Wilmington 100.0
290 DB Holdings (New York), Inc. New York 100.0
291 DB Holdings (South America) Limited Wilmington 100.0
292 db home lending holdings llc Wilmington 100.0
293 db home lending llc Lake Forest 100.0
294 DB Horizon, Inc. Wilmington 100.0
295 DB HR Solutions GmbH Eschborn 100.0
296 DB Hypernova LLC Wilmington 100.0
297 DB iCON Investments Limited London 100.0
298 DB Immobilienfonds 2 GmbH & Co. KG Frankfurt 71.4
299 DB Impact Investment Fund I, L.P. Edinburgh 100.0
300 DB Industrial Holdings Beteiligungs GmbH & Co. KG Luetzen-Gostau 6 100.0
301 DB Industrial Holdings GmbH Luetzen-Gostau 100.0
302 DB Infrastructure Holdings (UK) No.1 Limited London 100.0
303 DB Infrastructure Holdings (UK) No.2 Limited London 100.0
304 DB Infrastructure Holdings (UK) No.3 Limited London 100.0
305 DB International (Asia) Limited Singapore 100.0
306 DB International Investments Limited London 100.0
307 DB International Trust (Singapore) Limited Singapore 100.0
308 DB Invest Fundo de Investimento Multimercado Sao Paulo 100.0
309 DB Investment Management, Inc. Wilmington 100.0
310 DB Investment Managers, Inc. Wilmington 100.0
311 DB Investment Partners, Inc. Wilmington 100.0
312 DB Investment Resources (US) Corporation Wilmington 100.0
313 DB Investment Resources Holdings Corp. Wilmington 100.0
314 DB Investments (GB) Limited London 100.0
315 DB Io LP Wilmington 100.0
316 DB IROC Leasing Corp. New York 100.0
317 DB Jasmine (Cayman) Limited George Town 100.0
318 DB Kredit Service GmbH Berlin 100.0
319 DB Leasing Services GmbH Frankfurt 100.0
320 DB Lexington Investments Inc. Wilmington 100.0
321 DB Liberty, Inc. Wilmington 100.0
322 DB Like-Kind Exchange Services Corp. Wilmington 100.0
323 DB Litigation Fee LLC Wilmington 100.0
324 DB Maia LLC Wilmington 100.0
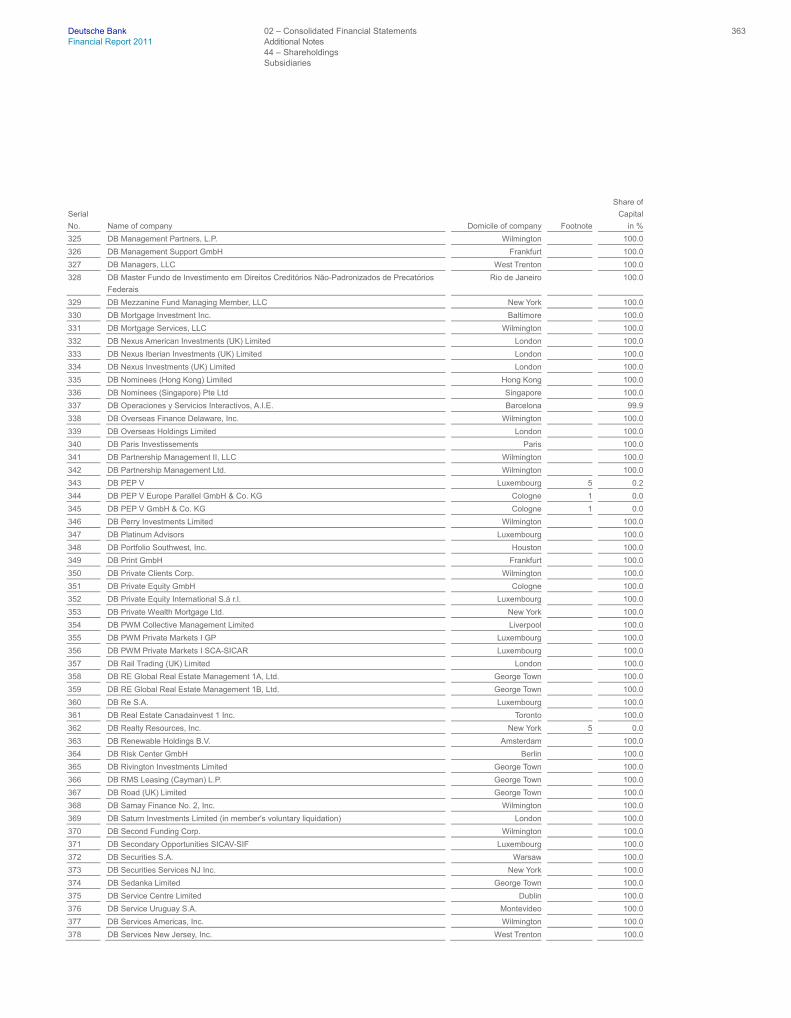
Deutsche Bank 02 – Consolidated Financial Statements 363 Financial Report 2011 Additional Notes 44 – Shareholdings
Subsidiaries
Serial
No. Name of company Domicile of company Footnote
Share of
Capital
in %
325 DB Management Partners, L.P. Wilmington 100.0
326 DB Management Support GmbH Frankfurt 100.0
327 DB Managers, LLC West Trenton 100.0
328 DB Master Fundo de Investimento em Direitos Creditórios Não-Padronizados de Precatórios
Federais
Rio de Janeiro 100.0
329 DB Mezzanine Fund Managing Member, LLC New York 100.0
330 DB Mortgage Investment Inc. Baltimore 100.0
331 DB Mortgage Services, LLC Wilmington 100.0
332 DB Nexus American Investments (UK) Limited London 100.0
333 DB Nexus Iberian Investments (UK) Limited London 100.0
334 DB Nexus Investments (UK) Limited London 100.0
335 DB Nominees (Hong Kong) Limited Hong Kong 100.0
336 DB Nominees (Singapore) Pte Ltd Singapore 100.0
337 DB Operaciones y Servicios Interactivos, A.I.E. Barcelona 99.9
338 DB Overseas Finance Delaware, Inc. Wilmington 100.0
339 DB Overseas Holdings Limited London 100.0
340 DB Paris Investissements Paris 100.0
341 DB Partnership Management II, LLC Wilmington 100.0
342 DB Partnership Management Ltd. Wilmington 100.0
343 DB PEP V Luxembourg 5 0.2
344 DB PEP V Europe Parallel GmbH & Co. KG Cologne 1 0.0
345 DB PEP V GmbH & Co. KG Cologne 1 0.0
346 DB Perry Investments Limited Wilmington 100.0
347 DB Platinum Advisors Luxembourg 100.0
348 DB Portfolio Southwest, Inc. Houston 100.0
349 DB Print GmbH Frankfurt 100.0
350 DB Private Clients Corp. Wilmington 100.0
351 DB Private Equity GmbH Cologne 100.0
352 DB Private Equity International S.à r.l. Luxembourg 100.0
353 DB Private Wealth Mortgage Ltd. New York 100.0
354 DB PWM Collective Management Limited Liverpool 100.0
355 DB PWM Private Markets I GP Luxembourg 100.0
356 DB PWM Private Markets I SCA-SICAR Luxembourg 100.0
357 DB Rail Trading (UK) Limited London 100.0
358 DB RE Global Real Estate Management 1A, Ltd. George Town 100.0
359 DB RE Global Real Estate Management 1B, Ltd. George Town 100.0
360 DB Re S.A. Luxembourg 100.0
361 DB Real Estate Canadainvest 1 Inc. Toronto 100.0
362 DB Realty Resources, Inc. New York 5 0.0
363 DB Renewable Holdings B.V. Amsterdam 100.0
364 DB Risk Center GmbH Berlin 100.0
365 DB Rivington Investments Limited George Town 100.0
366 DB RMS Leasing (Cayman) L.P. George Town 100.0
367 DB Road (UK) Limited George Town 100.0
368 DB Samay Finance No. 2, Inc. Wilmington 100.0
369 DB Saturn Investments Limited (in member's voluntary liquidation) London 100.0
370 DB Second Funding Corp. Wilmington 100.0
371 DB Secondary Opportunities SICAV-SIF Luxembourg 100.0
372 DB Securities S.A. Warsaw 100.0
373 DB Securities Services NJ Inc. New York 100.0
374 DB Sedanka Limited George Town 100.0
375 DB Service Centre Limited Dublin 100.0
376 DB Service Uruguay S.A. Montevideo 100.0
377 DB Services Americas, Inc. Wilmington 100.0
378 DB Services New Jersey, Inc. West Trenton 100.0
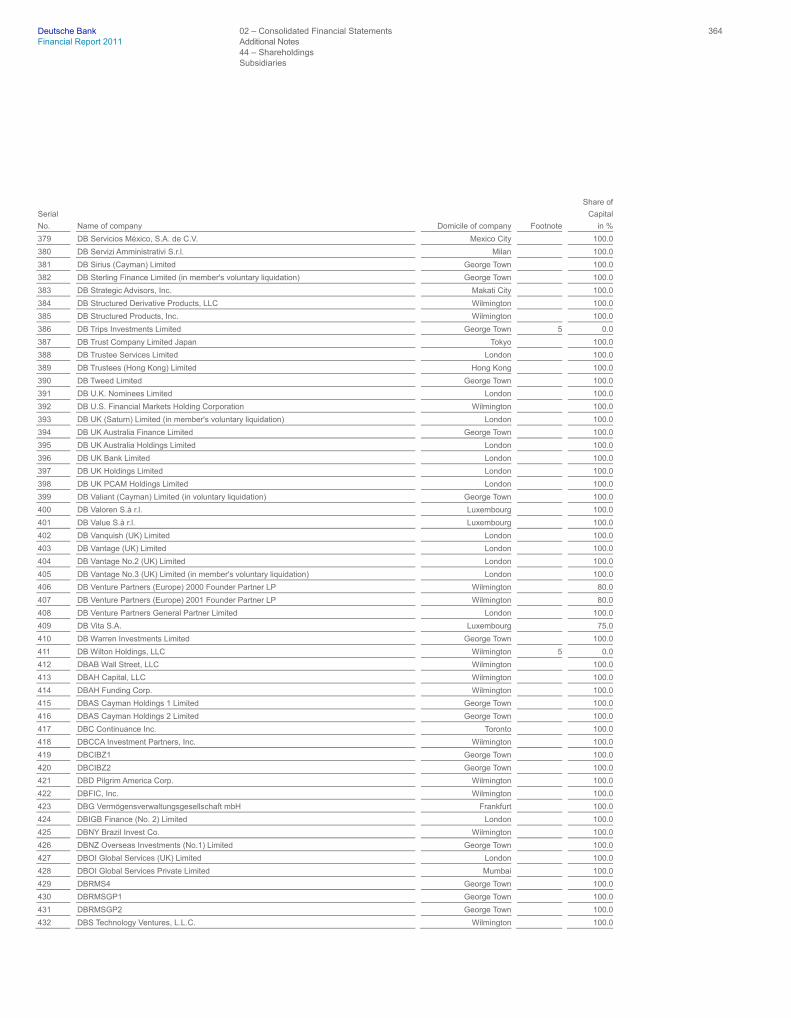
Deutsche Bank 02 – Consolidated Financial Statements 364 Financial Report 2011 Additional Notes 44 – Shareholdings
Subsidiaries
Serial
No. Name of company Domicile of company Footnote
Share of
Capital
in %
379 DB Servicios México, S.A. de C.V. Mexico City 100.0
380 DB Servizi Amministrativi S.r.l. Milan 100.0
381 DB Sirius (Cayman) Limited George Town 100.0
382 DB Sterling Finance Limited (in member's voluntary liquidation) George Town 100.0
383 DB Strategic Advisors, Inc. Makati City 100.0
384 DB Structured Derivative Products, LLC Wilmington 100.0
385 DB Structured Products, Inc. Wilmington 100.0
386 DB Trips Investments Limited George Town 5 0.0
387 DB Trust Company Limited Japan Tokyo 100.0
388 DB Trustee Services Limited London 100.0
389 DB Trustees (Hong Kong) Limited Hong Kong 100.0
390 DB Tweed Limited George Town 100.0
391 DB U.K. Nominees Limited London 100.0
392 DB U.S. Financial Markets Holding Corporation Wilmington 100.0
393 DB UK (Saturn) Limited (in member's voluntary liquidation) London 100.0
394 DB UK Australia Finance Limited George Town 100.0
395 DB UK Australia Holdings Limited London 100.0
396 DB UK Bank Limited London 100.0
397 DB UK Holdings Limited London 100.0
398 DB UK PCAM Holdings Limited London 100.0
399 DB Valiant (Cayman) Limited (in voluntary liquidation) George Town 100.0
400 DB Valoren S.à r.l. Luxembourg 100.0
401 DB Value S.à r.l. Luxembourg 100.0
402 DB Vanquish (UK) Limited London 100.0
403 DB Vantage (UK) Limited London 100.0
404 DB Vantage No.2 (UK) Limited London 100.0
405 DB Vantage No.3 (UK) Limited (in member's voluntary liquidation) London 100.0
406 DB Venture Partners (Europe) 2000 Founder Partner LP Wilmington 80.0
407 DB Venture Partners (Europe) 2001 Founder Partner LP Wilmington 80.0
408 DB Venture Partners General Partner Limited London 100.0
409 DB Vita S.A. Luxembourg 75.0
410 DB Warren Investments Limited George Town 100.0
411 DB Wilton Holdings, LLC Wilmington 5 0.0
412 DBAB Wall Street, LLC Wilmington 100.0
413 DBAH Capital, LLC Wilmington 100.0
414 DBAH Funding Corp. Wilmington 100.0
415 DBAS Cayman Holdings 1 Limited George Town 100.0
416 DBAS Cayman Holdings 2 Limited George Town 100.0
417 DBC Continuance Inc. Toronto 100.0
418 DBCCA Investment Partners, Inc. Wilmington 100.0
419 DBCIBZ1 George Town 100.0
420 DBCIBZ2 George Town 100.0
421 DBD Pilgrim America Corp. Wilmington 100.0
422 DBFIC, Inc. Wilmington 100.0
423 DBG Vermögensverwaltungsgesellschaft mbH Frankfurt 100.0
424 DBIGB Finance (No. 2) Limited London 100.0
425 DBNY Brazil Invest Co. Wilmington 100.0
426 DBNZ Overseas Investments (No.1) Limited George Town 100.0
427 DBOI Global Services (UK) Limited London 100.0
428 DBOI Global Services Private Limited Mumbai 100.0
429 DBRMS4 George Town 100.0
430 DBRMSGP1 George Town 100.0
431 DBRMSGP2 George Town 100.0
432 DBS Technology Ventures, L.L.C. Wilmington 100.0

Deutsche Bank 02 – Consolidated Financial Statements 365 Financial Report 2011 Additional Notes 44 – Shareholdings
Subsidiaries
Serial
No. Name of company Domicile of company Footnote
Share of
Capital
in %
433 DBUKH Finance Limited London 100.0
434 DBUSBZ1, LLC Wilmington 100.0
435 DBUSBZ2, LLC Wilmington 100.0
436 DBUSH Funding Corp. Wilmington 100.0
437 DBUSH Markets, Inc. Wilmington 100.0
438 DBVR Investments No. 3 Ltd. Wilmington 100.0
439 DBX Advisors LLC Wilmington 100.0
440 DBX Strategic Advisors LLC Wilmington 100.0
441 De Meng Innovative (Beijing) Consulting Company Limited Beijing 100.0
442 DeAM Infrastructure Limited London 100.0
443 DEBEKO Immobilien GmbH & Co Grundbesitz OHG Eschborn 100.0
444 DEE Deutsche Erneuerbare Energien GmbH Duesseldorf 100.0
445 Deer River, L.P. Wilmington 100.0
446 DEGRU Erste Beteiligungsgesellschaft mbH Eschborn 100.0
447 DeKon Service GmbH Eschborn 100.0
448 Delowrezham de México S. de R.L. de C.V. Mexico City 100.0
449 DEMOS Beteiligungs- und Verwaltungs GmbH Cologne 100.0
450 DEUFRAN Beteiligungs GmbH Frankfurt 100.0
451 DEUKONA Versicherungs-Vermittlungs-GmbH Frankfurt 100.0
452 Deutsche (Aotearoa) Capital Holdings New Zealand Auckland 100.0
453 Deutsche (Aotearoa) Foreign Investments New Zealand Auckland 100.0
454 Deutsche (New Munster) Holdings New Zealand Limited Auckland 100.0
455 Deutsche Aeolia Power Production S.A. Athens 80.0
456 Deutsche Alt-A Securities, Inc. Wilmington 100.0
457 Deutsche Alternative Asset Management (Global) Limited London 100.0
458 Deutsche Alternative Asset Management (UK) Limited London 100.0
459 Deutsche Asia Pacific Finance, Inc. Wilmington 100.0
460 Deutsche Asia Pacific Holdings Pte Ltd Singapore 100.0
461 Deutsche Asset Management (Asia) Limited Singapore 100.0
462 Deutsche Asset Management (Australia) Limited Sydney 100.0
463 Deutsche Asset Management (Hong Kong) Limited Hong Kong 100.0
464 Deutsche Asset Management (India) Private Limited Mumbai 100.0
465 Deutsche Asset Management (Japan) Limited Tokyo 100.0
466 Deutsche Asset Management (Korea) Company Limited Seoul 100.0
467 Deutsche Asset Management (UK) Limited London 100.0
468 Deutsche Asset Management Canada Limited Toronto 100.0
469 Deutsche Asset Management Group Limited London 100.0
470 Deutsche Asset Management International GmbH Frankfurt 100.0
471 Deutsche Asset Management Investmentgesellschaft mbH vormals DEGEF Deutsche
Gesellschaft für Fondsverwaltung mbH
Frankfurt 100.0
472 Deutsche Asset Management Schweiz Zurich 100.0
473 Deutsche Auskunftei Service GmbH Hamburg 100.0
474 Deutsche Australia Limited Sydney 100.0
475 Deutsche Aviation Leasing Limited (in member's voluntary liquidation) London 100.0
476 Deutsche Bank (Cayman) Limited George Town 100.0
477 DEUTSCHE BANK (CHILE) S.A. Santiago 100.0
478 Deutsche Bank (China) Co., Ltd. Beijing 100.0
479 Deutsche Bank (Malaysia) Berhad Kuala Lumpur 100.0
480 Deutsche Bank (Malta) Ltd St. Julians 100.0
481 Deutsche Bank (Mauritius) Limited Port Louis 100.0
482 Deutsche Bank (Perú) S.A. Lima 100.0
483 Deutsche Bank (Suisse) SA Geneva 100.0
484 Deutsche Bank (Uruguay) Sociedad Anónima Institución Financiera Externa Montevideo 100.0
485 DEUTSCHE BANK A.S. Istanbul 100.0
486 Deutsche Bank Americas Finance LLC Wilmington 100.0

Deutsche Bank 02 – Consolidated Financial Statements 366 Financial Report 2011 Additional Notes 44 – Shareholdings
Subsidiaries
Serial
No. Name of company Domicile of company Footnote
Share of
Capital
in %
487 Deutsche Bank Americas Holding Corp. Wilmington 100.0
488 Deutsche Bank Bauspar-Aktiengesellschaft Frankfurt 100.0
489 Deutsche Bank Berkshire Mortgage, Inc. Wilmington 100.0
490 Deutsche Bank Capital Markets S.r.l. Milan 100.0
491 Deutsche Bank Corretora de Valores S.A. Sao Paulo 100.0
492 Deutsche Bank Europe GmbH Frankfurt 100.0
493 Deutsche Bank Financial Inc. Wilmington 100.0
494 Deutsche Bank Financial LLC Wilmington 100.0
495 Deutsche Bank Holdings, Inc. Wilmington 100.0
496 Deutsche Bank Insurance Agency Incorporated Baltimore 100.0
497 Deutsche Bank Insurance Agency of Delaware Wilmington 100.0
498 Deutsche Bank Insurance Agency of Massachusetts Incorporated Boston 100.0
499 Deutsche Bank International Limited St. Helier 100.0
500 Deutsche Bank International Trust Co. (Cayman) Limited George Town 100.0
501 Deutsche Bank International Trust Co. (Jersey) Limited St. Helier 100.0
502 Deutsche Bank International Trust Co. Limited St. Peter Port 100.0
503 Deutsche Bank Investments (Guernsey) Limited St. Peter Port 100.0
504 Deutsche Bank Luxembourg S.A. Luxembourg 100.0
505 Deutsche Bank Mutui S.p.A. Milan 100.0
506 Deutsche Bank México, S.A., Institución de Banca Múltiple Mexico City 100.0
507 Deutsche Bank National Trust Company Los Angeles 100.0
508 Deutsche Bank Nederland N.V. Amsterdam 100.0
509 Deutsche Bank Nominees (Jersey) Limited St. Helier 100.0
510 Deutsche Bank PBC Spólka Akcyjna Warsaw 100.0
511 Deutsche Bank Polska Spólka Akcyjna Warsaw 100.0
512 Deutsche Bank Privat- und Geschäftskunden Aktiengesellschaft Frankfurt 100.0
513 Deutsche Bank Real Estate (Japan) Y.K. Tokyo 100.0
514 Deutsche Bank Realty Advisors, Inc. New York 100.0
515 Deutsche Bank S.A. Buenos Aires 100.0
516 Deutsche Bank S.A. - Banco Alemão Sao Paulo 100.0
517 Deutsche Bank Securities Inc. Wilmington 100.0
518 Deutsche Bank Securities Limited Toronto 100.0
519 Deutsche Bank Services (Jersey) Limited St. Helier 100.0
520 Deutsche Bank Società per Azioni Milan 99.8
521 Deutsche Bank Trust Company Americas New York 100.0
522 Deutsche Bank Trust Company Delaware Wilmington 100.0
523 Deutsche Bank Trust Company New Jersey Ltd. Jersey City 100.0
524 Deutsche Bank Trust Company, National Association New York 100.0
525 Deutsche Bank Trust Corporation New York 100.0
526 Deutsche Bank Trustee Services (Guernsey) Limited St. Peter Port 100.0
527 Deutsche Bank Österreich AG Vienna 100.0
528 Deutsche Bank, Sociedad Anónima Española Madrid 99.8
529 Deutsche Berri Paris 100.0
530 Deutsche Capital Finance (2000) Limited George Town 100.0
531 Deutsche Capital Financing (Singapore) Pte Ltd Singapore 100.0
532 Deutsche Capital Hong Kong Limited Hong Kong 100.0
533 Deutsche Capital Markets Algeria SPA Algiers 100.0
534 Deutsche Capital Markets Australia Limited Sydney 100.0
535 Deutsche Capital Partners China Limited George Town 100.0
536 Deutsche Capital Singapore Limited Singapore 100.0
537 Deutsche Card Services GmbH Frankfurt 100.0
538 Deutsche Cayman Ltd. George Town 100.0
539 Deutsche CIB Centre Private Limited Mumbai 100.0
540 Deutsche Climate Change Fixed Income QP Trust Salem 100.0

Deutsche Bank 02 – Consolidated Financial Statements 367 Financial Report 2011 Additional Notes 44 – Shareholdings
Subsidiaries
Serial
No. Name of company Domicile of company Footnote
Share of
Capital
in %
541 Deutsche Clubholding GmbH Frankfurt 95.0
542 Deutsche Commodities Trading Co., Ltd. Shanghai 100.0
543 Deutsche Courcelles Paris 100.0
544 Deutsche Custody Global B.V. Amsterdam 100.0
545 Deutsche Custody N.V. Amsterdam 100.0
546 Deutsche Custody Nederland B.V. Amsterdam 100.0
547 Deutsche Domus New Zealand Limited Auckland 100.0
548 Deutsche Emerging Markets Investments (Netherlands) B.V. Amsterdam 99.9
549 Deutsche Equities India Private Limited Mumbai 100.0
550 Deutsche Far Eastern Asset Management Company Limited Taipei 60.0
551 Deutsche Fiduciary Services (Suisse) SA Geneva 100.0
552 Deutsche Finance Co 1 Pty Limited Sydney 100.0
553 Deutsche Finance Co 2 Pty Limited Sydney 100.0
554 Deutsche Finance Co 3 Pty Limited Sydney 100.0
555 Deutsche Finance Co 4 Pty Limited Sydney 100.0
556 Deutsche Finance No. 1 Limited London 100.0
557 Deutsche Finance No. 2 (UK) Limited London 100.0
558 Deutsche Finance No. 2 Limited George Town 100.0
559 Deutsche Finance No. 3 (UK) Limited London 100.0
560 Deutsche Finance No. 4 (UK) Limited London 100.0
561 Deutsche Finance No. 6 (UK) Limited London 100.0
562 Deutsche Financial Services Puerto Rico Corporation San Juan 100.0
563 Deutsche Foras New Zealand Limited Auckland 100.0
564 Deutsche Friedland Paris 100.0
565 Deutsche Futures Singapore Pte Ltd Singapore 100.0
566 Deutsche Global Markets Limited Tel Aviv 100.0
567 Deutsche Group Holdings (SA) (Proprietary) Limited Johannesburg 100.0
568 Deutsche Group Services Pty Limited Sydney 100.0
569 Deutsche Grundbesitz Beteiligungsgesellschaft mbH Eschborn 100.0
570 Deutsche Grundbesitz-Anlagegesellschaft mbH & Co Löwenstein Palais Eschborn 100.0
571 Deutsche Grundbesitz-Anlagegesellschaft mit beschränkter Haftung Frankfurt 99.8
572 Deutsche Haussmann, S.à r.l. Luxembourg 100.0
573 Deutsche Holdings (BTI) Limited London 100.0
574 Deutsche Holdings (Chile) S.A. Santiago 100.0
575 Deutsche Holdings (Malta) Ltd. St. Julians 100.0
576 Deutsche Holdings (SA) (Proprietary) Limited Johannesburg 100.0
577 Deutsche Holdings Limited London 100.0
578 Deutsche Holdings No. 2 Limited London 100.0
579 Deutsche Holdings No. 3 Limited London 100.0
580 Deutsche Holdings No. 4 Limited London 100.0
581 Deutsche Hume Investments Pty Limited Sydney 100.0
582 Deutsche Immobilien Leasing GmbH Duesseldorf 100.0
583 Deutsche India Holdings Private Limited Mumbai 100.0
584 Deutsche International Corporate Services (Delaware) LLC Wilmington 100.0
585 Deutsche International Corporate Services (Ireland) Limited Dublin 100.0
586 Deutsche International Corporate Services Limited St. Helier 100.0
587 Deutsche International Custodial Services Limited St. Helier 100.0
588 Deutsche International Finance (Ireland) Limited Dublin 100.0
589 Deutsche International Holdings (UK) Limited London 100.0
590 Deutsche International Trust Company N.V. Amsterdam 100.0
591 Deutsche International Trust Corporation (Mauritius) Limited Port Louis 100.0
592 Deutsche Inversiones Dos S.A. Santiago 100.0
593 Deutsche Inversiones Limitada Santiago 100.0
594 Deutsche Investment Management Americas Inc. Wilmington 100.0

Deutsche Bank 02 – Consolidated Financial Statements 368 Financial Report 2011 Additional Notes 44 – Shareholdings
Subsidiaries
Serial
No. Name of company Domicile of company Footnote
Share of
Capital
in %
595 Deutsche Investments (Netherlands) N.V. Amsterdam 100.0
596 Deutsche Investments Australia Limited Sydney 100.0
597 Deutsche Investments India Private Limited Mumbai 100.0
598 Deutsche Investor Services Private Limited Mumbai 100.0
599 Deutsche IT License GmbH Eschborn 100.0
600 Deutsche Knowledge Services Pte. Ltd. Singapore 100.0
601 Deutsche Leasing New York Corp. New York 100.0
602 Deutsche Long Duration Government/Credit QP Trust Salem 100.0
603 Deutsche Managed Investments Limited Sydney 100.0
604 Deutsche Master Funding Corporation Wilmington 100.0
605 Deutsche Morgan Grenfell Group Public Limited Company London 100.0
606 Deutsche Morgan Grenfell Nominees Pte Ltd Singapore 100.0
607 Deutsche Mortgage & Asset Receiving Corporation Wilmington 100.0
608 Deutsche Mortgage Securities, Inc. Wilmington 100.0
609 Deutsche New Zealand Limited Auckland 100.0
610 Deutsche Nominees Limited London 100.0
611 Deutsche Overseas Issuance New Zealand Limited Auckland 100.0
612 Deutsche Postbank AG Bonn 53.1
613 Deutsche Postbank Finance Center Objekt GmbH Schuttrange 100.0
614 Deutsche Postbank Financial Services GmbH Frankfurt 100.0
615 Deutsche Postbank International S.A. Schuttrange 100.0
616 Deutsche Postbank Vermögens-Management S.A. Schuttrange 100.0
617 Deutsche Private Asset Management Limited London 100.0
618 Deutsche Representaciones y Mandatos S.A. Buenos Aires 100.0
619 Deutsche Securities (India) Private Limited New Delhi 75.0
620 Deutsche Securities (Perú) S.A. Lima 100.0
621 Deutsche Securities (Proprietary) Limited Johannesburg 95.7
622 Deutsche Securities (SA) (Proprietary) Limited Johannesburg 95.7
623 Deutsche Securities Algeria SPA Algiers 100.0
624 Deutsche Securities Asia Limited Hong Kong 100.0
625 Deutsche Securities Australia Limited Sydney 100.0
626 Deutsche Securities Corredores de Bolsa Ltda. Santiago 100.0
627 Deutsche Securities Inc. Tokyo 100.0
628 Deutsche Securities Israel Ltd. Tel Aviv 100.0
629 Deutsche Securities Korea Co. Seoul 100.0
630 Deutsche Securities Limited Hong Kong 100.0
631 Deutsche Securities Mauritius Limited Port Louis 100.0
632 Deutsche Securities Menkul Degerler A.S. Istanbul 100.0
633 Deutsche Securities New Zealand Limited Auckland 100.0
634 Deutsche Securities Nominees Hong Kong Limited Hong Kong 100.0
635 Deutsche Securities Saudi Arabia LLC Riyadh 100.0
636 Deutsche Securities Sociedad de Bolsa S.A. Buenos Aires 100.0
637 Deutsche Securities Venezuela S.A. Caracas 100.0
638 Deutsche Securities, S.A. de C.V., Casa de Bolsa Mexico City 100.0
639 Deutsche Securitisation Australia Pty Ltd Sydney 100.0
640 Deutsche StiftungsTrust GmbH Frankfurt 100.0
641 Deutsche Transaction France Paris 100.0
642 Deutsche Transnational Trustee Corporation Inc Charlottetown 100.0
643 Deutsche Trustee Company Limited London 100.0
644 Deutsche Trustee Services (India) Private Limited Mumbai 100.0
645 Deutsche Trustees Malaysia Berhad Kuala Lumpur 100.0
646 Deutsche Ultra Core Fixed Income QP Trust Salem 100.0
647 Deutsches Institut für Altersvorsorge GmbH Frankfurt 78.0
648 DFC Residual Corp. Reno 100.0

Deutsche Bank 02 – Consolidated Financial Statements 369 Financial Report 2011 Additional Notes 44 – Shareholdings
Subsidiaries
Serial
No. Name of company Domicile of company Footnote
Share of
Capital
in %
649 DI 2 Y.K. Tokyo 100.0
650 DI Deutsche Immobilien Baugesellschaft mbH Frankfurt 100.0
651 DI Deutsche Immobilien Baugesellschaft mbH & Co. Vermietungs KG Frankfurt 100.0
652 DI Deutsche Immobilien Treuhandgesellschaft mbH Frankfurt 100.0
653 DI Investments Corporation Y.K. Tokyo 100.0
654 DIB-Consult Deutsche Immobilien- und Beteiligungs-Beratungsgesellschaft mbH Duesseldorf 100.0
655 DIL Financial Services GmbH & Co. KG Duesseldorf 100.0
656 DISCA Beteiligungsgesellschaft mbH Duesseldorf 100.0
657 DIV Holding GmbH Luetzen-Gostau 100.0
658 DMG Technology Management, L.L.C. Wilmington 100.0
659 DMJV New York 5 0.0
660 DNU Nominees Pty Limited Sydney 100.0
661 DPB Regent's Park Estates (GP) Holding Limited London 100.0
662 DPB Regent's Park Estates (LP) Holding Limited London 100.0
663 DPBI Immobilien KGaA Schuttrange 100.0
664 Drolla GmbH Frankfurt 100.0
665 DRT Limited International SRL Bucharest 100.0
666 DSL Holding Aktiengesellschaft i.A. Bonn 100.0
667 DSL Portfolio GmbH & Co. KG Bonn 100.0
668 DSL Portfolio Verwaltungs GmbH Bonn 100.0
669 DTS Nominees Pty. Limited Sydney 100.0
670 DVCG Deutsche Venture Capital Gesellschaft mbH & Co. Fonds II KG i.L. Munich 1 69.2
671 DWS Finanz-Service GmbH Frankfurt 100.0
672 DWS Holding & Service GmbH Frankfurt 100.0
673 DWS Investment GmbH Frankfurt 100.0
674 DWS Investment S.A. Luxembourg 100.0
675 DWS Investments (Spain), S.G.I.I.C., S.A. Madrid 100.0
676 DWS Investments Distributors, Inc. Wilmington 100.0
677 DWS Investments Service Company Wilmington 100.0
678 DWS Schweiz GmbH Zurich 100.0
679 DWS Trust Company Salem 100.0
680 DWS Vermögensverwaltungs GmbH in Liqu. Vienna 100.0
681 easyhyp GmbH Hameln 100.0
682 EC EUROPA IMMOBILIEN FONDS NR. 3 GmbH & CO. KG Hamburg 65.2
683 Ecnarf Paris 100.0
684 ECT Holdings Corp. Wilmington 100.0
685 EDORA Funding GmbH Frankfurt 100.0
686 Elba Finance GmbH Eschborn 100.0
687 ELBI Funding GmbH Frankfurt 100.0
688 ELDO ACHTE Vermögensverwaltungs GmbH Eschborn 100.0
689 ELDO ERSTE Vermögensverwaltungs GmbH Eschborn 100.0
690 Elizabethan Holdings Limited George Town 100.0
691 Elizabethan Management Limited George Town 100.0
692 Enterprise Fleet Management Exchange, Inc. Wilmington 100.0
693 ERATO Beteiligungs- und Verwaltungs GmbH Cologne 100.0
694 Erda Funding GmbH Eschborn 100.0
695 Estate Holdings, Inc. St. Thomas 5 0.0
696 EUROKNIGHTS IV GmbH & Co. Beteiligungs KG Munich 1 0.0
697 European Asian Bank (Hong Kong) Nominees Limited Hong Kong 100.0
698 European Private Equity Portfolio S.A., SICAR Luxembourg 5 1.1
699 Evergreen Amsterdam Holdings B.V. Amsterdam 100.0
700 Evergreen International Holdings B.V. Amsterdam 100.0
701 Evergreen International Investments B.V. Amsterdam 100.0
702 Evergreen International Leasing B.V. Amsterdam 100.0

Deutsche Bank 02 – Consolidated Financial Statements 370 Financial Report 2011 Additional Notes 44 – Shareholdings
Subsidiaries
Serial
No. Name of company Domicile of company Footnote
Share of
Capital
in %
703 Exinor SA Malmedy 100.0
704 Exporterra GmbH Frankfurt 100.0
705 EXTOREL Private Equity Advisers GmbH Munich 100.0
706 FARAMIR Beteiligungs- und Verwaltungs GmbH Cologne 100.0
707 Farezco I, S. de R.L. de C.V. Zapopan 100.0
708 Farezco II, S. de R.L. de C.V. Zapopan 100.0
709 Fenix Administración de Activos S. de R.L. de C.V. Mexico City 100.0
710 Fiduciaria Sant' Andrea S.r.L. Milan 100.0
711 Filaine, Inc. Wilmington 5 0.0
712 Finanza & Futuro Banca SpA Milan 100.0
713 Firstee Investments LLC Wilmington 100.0
714 Fixed Income Plus Luxembourg 100.0
715 FJC Property Corp. Wilmington 100.0
716 Fondo de Inversión Privado NPL Fund Two Santiago 4 70.0
717 FRANKFURT CONSULT GmbH Frankfurt 100.0
718 Frankfurt Family Office GmbH Frankfurt 100.0
719 Frankfurt Finanz-Software GmbH Frankfurt 100.0
720 FRANKFURT-TRUST Invest Luxemburg AG Luxembourg 100.0
721 FRANKFURT-TRUST Investment-Gesellschaft mit beschränkter Haftung Frankfurt 100.0
722 Frankfurter Beteiligungs-Treuhand Gesellschaft mit beschränkter Haftung Frankfurt 100.0
723 Frankfurter Vermögens-Treuhand Gesellschaft mit beschränkter Haftung Frankfurt 100.0
724 Franz Urbig- und Oscar Schlitter-Stiftung Gesellschaft mit beschränkter Haftung Frankfurt 100.0
725 Fundo de Investimento em Direitos Creditórios Nao-Padronizados - Precatório Federal 4870-1 Rio de Janeiro 100.0
726 Fundo de Investimento em Direitos Creditórios Nao-Padronizados - Precatórios Federais DB I Rio de Janeiro 100.0
727 Fundo de Investimento em Direitos Creditórios Nao-Padronizados - Precatórios Federais DB II Rio de Janeiro 100.0
728 Fundo de Investimento em Quotas de Fundos de Investimento em Direitos Creditórios Nao-
Padronizados Global Markets
Rio de Janeiro 100.0
729 Funds Nominees Limited London 100.0
730 Fünfte SAB Treuhand und Verwaltung GmbH & Co. Suhl "Rimbachzentrum" KG Bad Homburg 74.0
731 G Finance Holding Corp. Wilmington 100.0
732 GACC Funding Corporation Wilmington 100.0
733 GAFCo Funding Corp. Wilmington 100.0
734 GAVDOS GmbH Wuppertal 100.0
735 GbR Goethestraße Cologne 94.0
736 Gemini Technology Services Inc. Wilmington 100.0
737 German American Capital Corporation Baltimore 100.0
738 German European VCPII GmbH & Co. KG Munich 1 0.0
739 Glacier Mountain, L.P. Wilmington 100.0
740 Global Alliance Finance Company, L.L.C. Wilmington 100.0
741 Global Commercial Real Estate Special Opportunities Limited St. Helier 100.0
742 Global Markets Fundo de Investimento Multimercado Rio de Janeiro 100.0
743 Global Markets III Fundo de Investimento Multimercado - Crédito Privado e Investimento No
Exterior
Rio de Janeiro 100.0
744 Greene Investments Limited George Town 100.0
745 Greenwood Properties Corp. New York 5 0.0
746 Grundstücksgesellschaft Frankfurt Bockenheimer Landstraße GbR Troisdorf 94.9
747 Grundstücksgesellschaft Köln-Ossendorf VI mbH Cologne 100.0
748 Grundstücksgesellschaft Wiesbaden Luisenstraße/Kirchgasse GbR Troisdorf 59.7
749 Gulara Pty Ltd Sydney 100.0
750 GUO Mao International Hotels B.V. Amsterdam 100.0
751 Gut Kaden Golf und Land Club GmbH Alveslohe 100.0
752 Hac Investments Ltd. Wilmington 100.0
753 HAC Investments Portugal - Servicos de Consultadoria e Gestao Ltda. Lisbon 100.0
754 HAH Limited London 100.0
755 Hakkeijima Godo Kaisha Tokyo 95.0
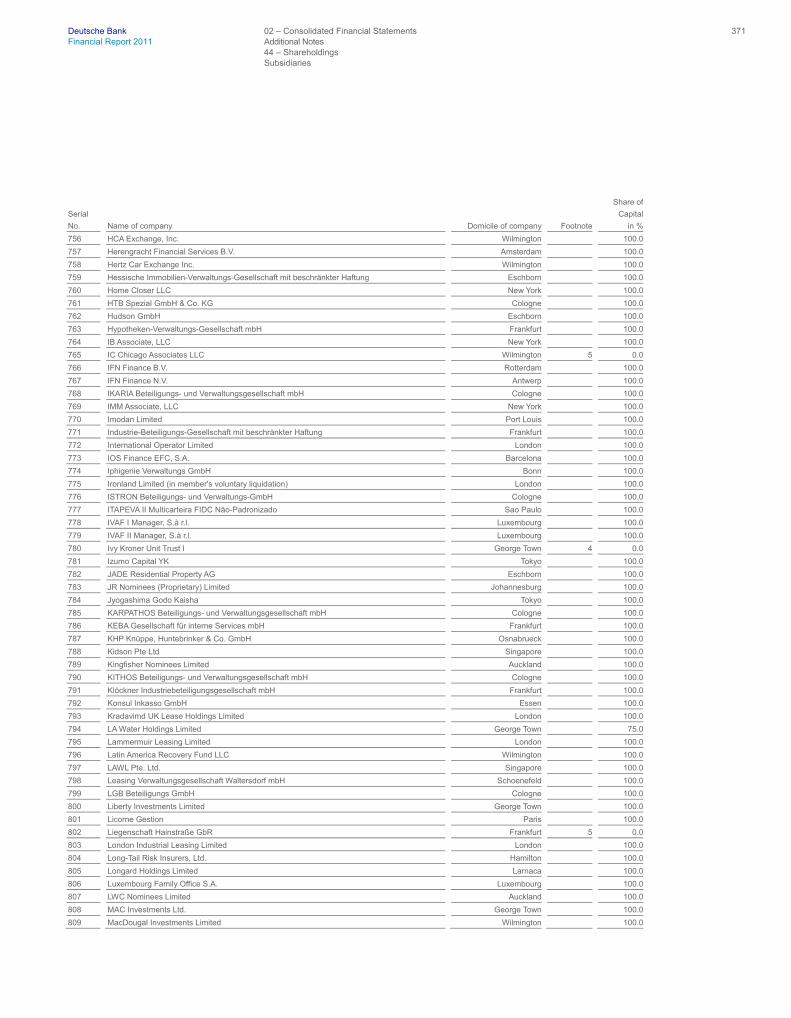
Deutsche Bank 02 – Consolidated Financial Statements 371 Financial Report 2011 Additional Notes 44 – Shareholdings
Subsidiaries
Serial
No. Name of company Domicile of company Footnote
Share of
Capital
in %
756 HCA Exchange, Inc. Wilmington 100.0
757 Herengracht Financial Services B.V. Amsterdam 100.0
758 Hertz Car Exchange Inc. Wilmington 100.0
759 Hessische Immobilien-Verwaltungs-Gesellschaft mit beschränkter Haftung Eschborn 100.0
760 Home Closer LLC New York 100.0
761 HTB Spezial GmbH & Co. KG Cologne 100.0
762 Hudson GmbH Eschborn 100.0
763 Hypotheken-Verwaltungs-Gesellschaft mbH Frankfurt 100.0
764 IB Associate, LLC New York 100.0
765 IC Chicago Associates LLC Wilmington 5 0.0
766 IFN Finance B.V. Rotterdam 100.0
767 IFN Finance N.V. Antwerp 100.0
768 IKARIA Beteiligungs- und Verwaltungsgesellschaft mbH Cologne 100.0
769 IMM Associate, LLC New York 100.0
770 Imodan Limited Port Louis 100.0
771 Industrie-Beteiligungs-Gesellschaft mit beschränkter Haftung Frankfurt 100.0
772 International Operator Limited London 100.0
773 IOS Finance EFC, S.A. Barcelona 100.0
774 Iphigenie Verwaltungs GmbH Bonn 100.0
775 Ironland Limited (in member's voluntary liquidation) London 100.0
776 ISTRON Beteiligungs- und Verwaltungs-GmbH Cologne 100.0
777 ITAPEVA II Multicarteira FIDC Não-Padronizado Sao Paulo 100.0
778 IVAF I Manager, S.à r.l. Luxembourg 100.0
779 IVAF II Manager, S.à r.l. Luxembourg 100.0
780 Ivy Kroner Unit Trust I George Town 4 0.0
781 Izumo Capital YK Tokyo 100.0
782 JADE Residential Property AG Eschborn 100.0
783 JR Nominees (Proprietary) Limited Johannesburg 100.0
784 Jyogashima Godo Kaisha Tokyo 100.0
785 KARPATHOS Beteiligungs- und Verwaltungsgesellschaft mbH Cologne 100.0
786 KEBA Gesellschaft für interne Services mbH Frankfurt 100.0
787 KHP Knüppe, Huntebrinker & Co. GmbH Osnabrueck 100.0
788 Kidson Pte Ltd Singapore 100.0
789 Kingfisher Nominees Limited Auckland 100.0
790 KITHOS Beteiligungs- und Verwaltungsgesellschaft mbH Cologne 100.0
791 Klöckner Industriebeteiligungsgesellschaft mbH Frankfurt 100.0
792 Konsul Inkasso GmbH Essen 100.0
793 Kradavimd UK Lease Holdings Limited London 100.0
794 LA Water Holdings Limited George Town 75.0
795 Lammermuir Leasing Limited London 100.0
796 Latin America Recovery Fund LLC Wilmington 100.0
797 LAWL Pte. Ltd. Singapore 100.0
798 Leasing Verwaltungsgesellschaft Waltersdorf mbH Schoenefeld 100.0
799 LGB Beteiligungs GmbH Cologne 100.0
800 Liberty Investments Limited George Town 100.0
801 Licorne Gestion Paris 100.0
802 Liegenschaft Hainstraße GbR Frankfurt 5 0.0
803 London Industrial Leasing Limited London 100.0
804 Long-Tail Risk Insurers, Ltd. Hamilton 100.0
805 Longard Holdings Limited Larnaca 100.0
806 Luxembourg Family Office S.A. Luxembourg 100.0
807 LWC Nominees Limited Auckland 100.0
808 MAC Investments Ltd. George Town 100.0
809 MacDougal Investments Limited Wilmington 100.0
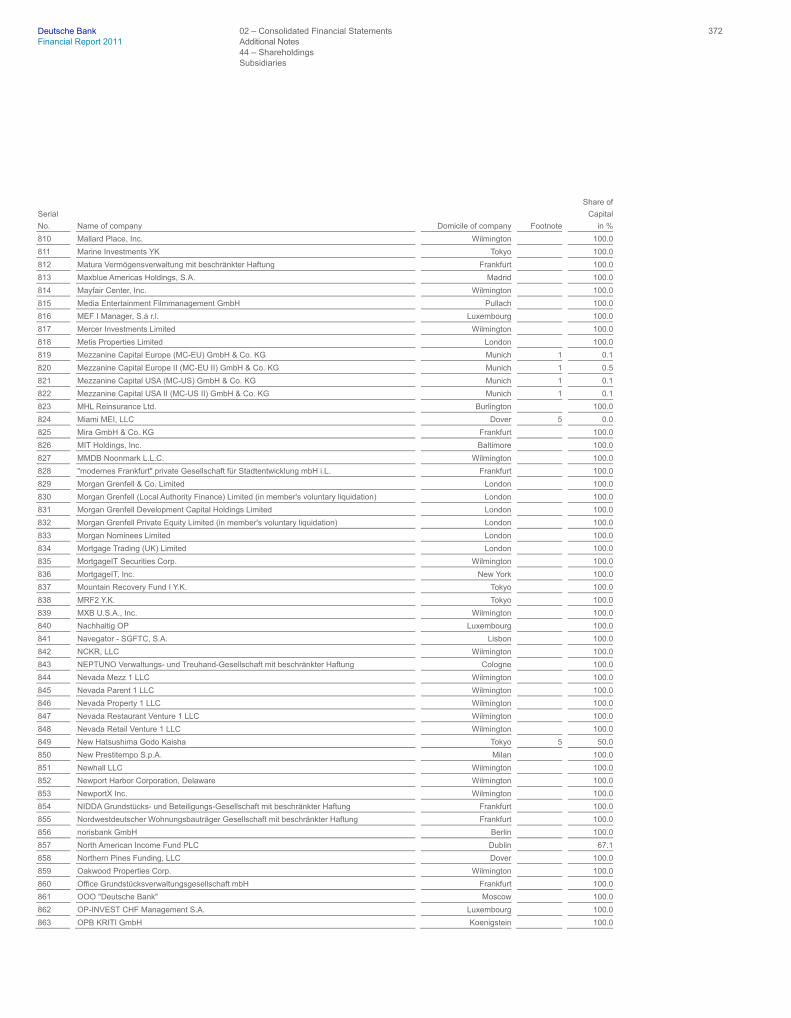
Deutsche Bank 02 – Consolidated Financial Statements 372 Financial Report 2011 Additional Notes 44 – Shareholdings
Subsidiaries
Serial
No. Name of company Domicile of company Footnote
Share of
Capital
in %
810 Mallard Place, Inc. Wilmington 100.0
811 Marine Investments YK Tokyo 100.0
812 Matura Vermögensverwaltung mit beschränkter Haftung Frankfurt 100.0
813 Maxblue Americas Holdings, S.A. Madrid 100.0
814 Mayfair Center, Inc. Wilmington 100.0
815 Media Entertainment Filmmanagement GmbH Pullach 100.0
816 MEF I Manager, S.à r.l. Luxembourg 100.0
817 Mercer Investments Limited Wilmington 100.0
818 Metis Properties Limited London 100.0
819 Mezzanine Capital Europe (MC-EU) GmbH & Co. KG Munich 1 0.1
820 Mezzanine Capital Europe II (MC-EU II) GmbH & Co. KG Munich 1 0.5
821 Mezzanine Capital USA (MC-US) GmbH & Co. KG Munich 1 0.1
822 Mezzanine Capital USA II (MC-US II) GmbH & Co. KG Munich 1 0.1
823 MHL Reinsurance Ltd. Burlington 100.0
824 Miami MEI, LLC Dover 5 0.0
825 Mira GmbH & Co. KG Frankfurt 100.0
826 MIT Holdings, Inc. Baltimore 100.0
827 MMDB Noonmark L.L.C. Wilmington 100.0
828 "modernes Frankfurt" private Gesellschaft für Stadtentwicklung mbH i.L. Frankfurt 100.0
829 Morgan Grenfell & Co. Limited London 100.0
830 Morgan Grenfell (Local Authority Finance) Limited (in member's voluntary liquidation) London 100.0
831 Morgan Grenfell Development Capital Holdings Limited London 100.0
832 Morgan Grenfell Private Equity Limited (in member's voluntary liquidation) London 100.0
833 Morgan Nominees Limited London 100.0
834 Mortgage Trading (UK) Limited London 100.0
835 MortgageIT Securities Corp. Wilmington 100.0
836 MortgageIT, Inc. New York 100.0
837 Mountain Recovery Fund I Y.K. Tokyo 100.0
838 MRF2 Y.K. Tokyo 100.0
839 MXB U.S.A., Inc. Wilmington 100.0
840 Nachhaltig OP Luxembourg 100.0
841 Navegator - SGFTC, S.A. Lisbon 100.0
842 NCKR, LLC Wilmington 100.0
843 NEPTUNO Verwaltungs- und Treuhand-Gesellschaft mit beschränkter Haftung Cologne 100.0
844 Nevada Mezz 1 LLC Wilmington 100.0
845 Nevada Parent 1 LLC Wilmington 100.0
846 Nevada Property 1 LLC Wilmington 100.0
847 Nevada Restaurant Venture 1 LLC Wilmington 100.0
848 Nevada Retail Venture 1 LLC Wilmington 100.0
849 New Hatsushima Godo Kaisha Tokyo 5 50.0
850 New Prestitempo S.p.A. Milan 100.0
851 Newhall LLC Wilmington 100.0
852 Newport Harbor Corporation, Delaware Wilmington 100.0
853 NewportX Inc. Wilmington 100.0
854 NIDDA Grundstücks- und Beteiligungs-Gesellschaft mit beschränkter Haftung Frankfurt 100.0
855 Nordwestdeutscher Wohnungsbauträger Gesellschaft mit beschränkter Haftung Frankfurt 100.0
856 norisbank GmbH Berlin 100.0
857 North American Income Fund PLC Dublin 67.1
858 Northern Pines Funding, LLC Dover 100.0
859 Oakwood Properties Corp. Wilmington 100.0
860 Office Grundstücksverwaltungsgesellschaft mbH Frankfurt 100.0
861 OOO "Deutsche Bank" Moscow 100.0
862 OP-INVEST CHF Management S.A. Luxembourg 100.0
863 OPB KRITI GmbH Koenigstein 100.0

Deutsche Bank 02 – Consolidated Financial Statements 373 Financial Report 2011 Additional Notes 44 – Shareholdings
Subsidiaries
Serial
No. Name of company Domicile of company Footnote
Share of
Capital
in %
864 OPB Verwaltungs- und Beteiligungs-GmbH Cologne 100.0
865 OPB Verwaltungs- und Treuhand GmbH Cologne 100.0
866 OPB-Decima GmbH Cologne 100.0
867 OPB-Holding GmbH Cologne 100.0
868 OPB-Mosel GmbH Cologne 100.0
869 OPB-Nona GmbH Frankfurt 100.0
870 OPB-Oktava GmbH Cologne 100.0
871 OPB-Quarta GmbH Cologne 100.0
872 OPB-Quinta GmbH Cologne 100.0
873 OPB-Rhein GmbH Cologne 100.0
874 OPB-Septima GmbH Cologne 100.0
875 OPB-Structuring GmbH Cologne 100.0
876 Oppenheim Asset Management GmbH Vienna 100.0
877 Oppenheim Asset Management Services S.à r.l. Luxembourg 100.0
878 Oppenheim Beteiligungs-AG Cologne 100.0
879 OPPENHEIM Beteiligungs-Treuhand GmbH Cologne 100.0
880 OPPENHEIM Capital Advisory GmbH Cologne 100.0
881 Oppenheim Eunomia GmbH Cologne 100.0
882 OPPENHEIM Flottenfonds IV GmbH & Co. KG Cologne 1 0.0
883 OPPENHEIM Flottenfonds V GmbH & Co. KG Cologne 83.3
884 Oppenheim Fonds Trust GmbH Cologne 100.0
885 OPPENHEIM Immobilien Dachfonds III GmbH & Co. KG Cologne 100.0
886 Oppenheim International Finance Dublin 100.0
887 OPPENHEIM Internet Fonds Manager GmbH i.L. Cologne 100.0
888 Oppenheim Kapitalanlagegesellschaft mbH Cologne 100.0
889 OPPENHEIM Mezzanine GmbH & Co. KG Frankfurt 1 3.1
890 OPPENHEIM PRIVATE EQUITY Manager GmbH Cologne 100.0
891 OPPENHEIM PRIVATE EQUITY Verwaltungsgesellschaft mbH Cologne 100.0
892 Oppenheim VAM Kapitalanlagegesellschaft mbH Cologne 100.0
893 Oppenheim Vermögenstreuhand GmbH Cologne 100.0
894 OPS Nominees Pty. Limited Sydney 100.0
895 OTM Capital GK Tokyo 100.0
896 OVT Trust 1 GmbH Cologne 100.0
897 OVV Beteiligungs GmbH Cologne 100.0
898 PADUS Grundstücks-Vermietungsgesellschaft mbH Duesseldorf 100.0
899 Pan Australian Nominees Pty. Limited Sydney 100.0
900 Paribus Köln I GmbH Cologne 100.0
901 PB (USA) Holdings, Inc. Wilmington 100.0
902 PB (USA) Realty Corporation New York 94.7
903 PB Capital Corporation Wilmington 100.0
904 PB Factoring GmbH Bonn 100.0
905 PB Finance (Delaware) Inc. Wilmington 100.0
906 PB Firmenkunden AG Bonn 100.0
907 PB Hollywood I Hollywood Station, LLC Dover 5 0.0
908 PB Hollywood II Lofts, LLC Dover 5 0.0
909 PB Kreditservice GmbH Hameln 100.0
910 PB Sechste Beteiligungen GmbH Bonn 100.0
911 PB Service GmbH Bonn 100.0
912 PB Spezial-Investmentaktiengesellschaft mit Teilgesellschaftsvermögen Frankfurt 99.5
913 PBC Carnegie, LLC Wilmington 5 0.0
914 PBC Services GmbH der Deutschen Bank Frankfurt 100.0
915 PE-US/ASIA Beteiligungsgesellschaft mbH Munich 100.0
916 PEIF II (Manager) Limited St. Helier 100.0
917 Pelleport Investors, Inc. New York 100.0

Deutsche Bank 02 – Consolidated Financial Statements 374 Financial Report 2011 Additional Notes 44 – Shareholdings
Subsidiaries
Serial
No. Name of company Domicile of company Footnote
Share of
Capital
in %
918 Pembol Nominees Limited London 100.0
919 Percy Limited Gibraltar 100.0
920 PHARMA/wHEALTH Management Company S.A. Luxembourg 99.9
921 Philippine Opportunities for Growth and Income (SPV-AMC), INC. Manila 95.0
922 Phoebus Investments LP Wilmington 100.0
923 Phoebus Leasing Limited George Town 100.0
924 Pilgrim Financial Services LLP Wilmington 100.0
925 PLAKIAS Beteiligungs- und Verwaltungs-GmbH Cologne 100.0
926 Plantation Bay, Inc. St. Thomas 100.0
927 Plinius Verwaltungs AG Zurich 100.0
928 PMG Collins, LLC Tallahassee 100.0
929 Pollus L.P. St. Helier 100.0
930 Polydeuce LLC Wilmington 100.0
931 POND VENTURES II GmbH & Co. KG Munich 99.9
932 POSEIDON Vermögensverwaltungsgesellschaft mbH Cologne 100.0
933 Postbank Akademie und Service GmbH Hameln 100.0
934 Postbank Beteiligungen GmbH Bonn 100.0
935 Postbank Direkt GmbH Bonn 100.0
936 Postbank Filial GmbH Bonn 100.0
937 Postbank Filialvertrieb AG Bonn 100.0
938 Postbank Finanzberatung AG Hameln 100.0
939 Postbank Immobilien und Baumanagement GmbH Bonn 100.0
940 Postbank Immobilien und Baumanagement GmbH & Co. Objekt Leipzig KG Bonn 90.0
941 Postbank Leasing GmbH Bonn 100.0
942 Postbank P.O.S. Transact GmbH Eschborn 100.0
943 Postbank Support GmbH Cologne 100.0
944 Postbank Systems AG Bonn 100.0
945 Postbank Versicherungsvermittlung GmbH Bonn 100.0
946 PPCenter, Inc. Wilmington 100.0
947 Primelux Insurance S.A. Luxembourg 100.0
948 Private Equity Asia Select Company III S.à r.l. Luxembourg 100.0
949 Private Equity Global Select Company IV S.à r.l. Luxembourg 100.0
950 Private Equity Global Select Company V S.à r.l. Luxembourg 100.0
951 Private Equity Select Company S.à r.l. Luxembourg 100.0
952 Private Financing Initiatives, S.L. Barcelona 51.0
953 PS plus Portfolio Software + Consulting GmbH Roedermark 80.2
954 PT. Deutsche Securities Indonesia Jakarta 99.0
955 Public joint-stock company "Deutsche Bank DBU" Kiev 100.0
956 Pyramid Ventures, Inc. Wilmington 100.0
957 Quantum 13 LLC Wilmington 5 49.0
958 RBM Nominees Pty. Limited Sydney 100.0
959 Reade, Inc. Wilmington 100.0
960 Red Lodge, L.P. Wilmington 100.0
961 registrar services GmbH Eschborn 100.0
962 Regula Limited Road Town 100.0
963 REIB Europe Investments Limited London 100.0
964 REIB International Holdings Limited London 100.0
965 RHODOS Beteiligungs- und Verwaltungsgesellschaft mbH Cologne 100.0
966 Rimvalley Limited Dublin 100.0
967 Ripple Creek, L.P. Wilmington 100.0
968 RMS Investments (Cayman) George Town 100.0
969 RoCal, L.L.C. Wilmington 100.0
970 RoCalwest, Inc. Wilmington 100.0
971 RoPro U.S. Holding, Inc. Wilmington 100.0
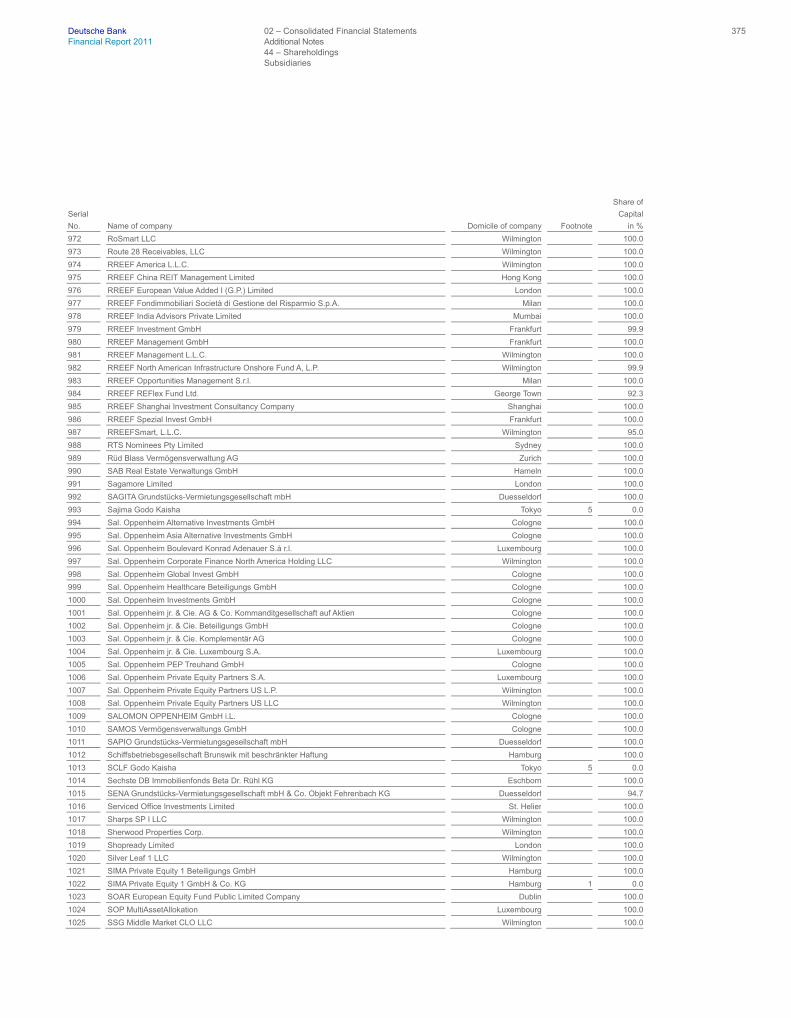
Deutsche Bank 02 – Consolidated Financial Statements 375 Financial Report 2011 Additional Notes 44 – Shareholdings
Subsidiaries
Serial
No. Name of company Domicile of company Footnote
Share of
Capital
in %
972 RoSmart LLC Wilmington 100.0
973 Route 28 Receivables, LLC Wilmington 100.0
974 RREEF America L.L.C. Wilmington 100.0
975 RREEF China REIT Management Limited Hong Kong 100.0
976 RREEF European Value Added I (G.P.) Limited London 100.0
977 RREEF Fondimmobiliari Società di Gestione del Risparmio S.p.A. Milan 100.0
978 RREEF India Advisors Private Limited Mumbai 100.0
979 RREEF Investment GmbH Frankfurt 99.9
980 RREEF Management GmbH Frankfurt 100.0
981 RREEF Management L.L.C. Wilmington 100.0
982 RREEF North American Infrastructure Onshore Fund A, L.P. Wilmington 99.9
983 RREEF Opportunities Management S.r.l. Milan 100.0
984 RREEF REFlex Fund Ltd. George Town 92.3
985 RREEF Shanghai Investment Consultancy Company Shanghai 100.0
986 RREEF Spezial Invest GmbH Frankfurt 100.0
987 RREEFSmart, L.L.C. Wilmington 95.0
988 RTS Nominees Pty Limited Sydney 100.0
989 Rüd Blass Vermögensverwaltung AG Zurich 100.0
990 SAB Real Estate Verwaltungs GmbH Hameln 100.0
991 Sagamore Limited London 100.0
992 SAGITA Grundstücks-Vermietungsgesellschaft mbH Duesseldorf 100.0
993 Sajima Godo Kaisha Tokyo 5 0.0
994 Sal. Oppenheim Alternative Investments GmbH Cologne 100.0
995 Sal. Oppenheim Asia Alternative Investments GmbH Cologne 100.0
996 Sal. Oppenheim Boulevard Konrad Adenauer S.à r.l. Luxembourg 100.0
997 Sal. Oppenheim Corporate Finance North America Holding LLC Wilmington 100.0
998 Sal. Oppenheim Global Invest GmbH Cologne 100.0
999 Sal. Oppenheim Healthcare Beteiligungs GmbH Cologne 100.0
1000 Sal. Oppenheim Investments GmbH Cologne 100.0
1001 Sal. Oppenheim jr. & Cie. AG & Co. Kommanditgesellschaft auf Aktien Cologne 100.0
1002 Sal. Oppenheim jr. & Cie. Beteiligungs GmbH Cologne 100.0
1003 Sal. Oppenheim jr. & Cie. Komplementär AG Cologne 100.0
1004 Sal. Oppenheim jr. & Cie. Luxembourg S.A. Luxembourg 100.0
1005 Sal. Oppenheim PEP Treuhand GmbH Cologne 100.0
1006 Sal. Oppenheim Private Equity Partners S.A. Luxembourg 100.0
1007 Sal. Oppenheim Private Equity Partners US L.P. Wilmington 100.0
1008 Sal. Oppenheim Private Equity Partners US LLC Wilmington 100.0
1009 SALOMON OPPENHEIM GmbH i.L. Cologne 100.0
1010 SAMOS Vermögensverwaltungs GmbH Cologne 100.0
1011 SAPIO Grundstücks-Vermietungsgesellschaft mbH Duesseldorf 100.0
1012 Schiffsbetriebsgesellschaft Brunswik mit beschränkter Haftung Hamburg 100.0
1013 SCLF Godo Kaisha Tokyo 5 0.0
1014 Sechste DB Immobilienfonds Beta Dr. Rühl KG Eschborn 100.0
1015 SENA Grundstücks-Vermietungsgesellschaft mbH & Co. Objekt Fehrenbach KG Duesseldorf 94.7
1016 Serviced Office Investments Limited St. Helier 100.0
1017 Sharps SP I LLC Wilmington 100.0
1018 Sherwood Properties Corp. Wilmington 100.0
1019 Shopready Limited London 100.0
1020 Silver Leaf 1 LLC Wilmington 100.0
1021 SIMA Private Equity 1 Beteiligungs GmbH Hamburg 100.0
1022 SIMA Private Equity 1 GmbH & Co. KG Hamburg 1 0.0
1023 SOAR European Equity Fund Public Limited Company Dublin 100.0
1024 SOP MultiAssetAllokation Luxembourg 100.0
1025 SSG Middle Market CLO LLC Wilmington 100.0

Deutsche Bank 02 – Consolidated Financial Statements 376 Financial Report 2011 Additional Notes 44 – Shareholdings
Subsidiaries
Serial
No. Name of company Domicile of company Footnote
Share of
Capital
in %
1026 STC Capital YK Tokyo 100.0
1027 Stoneridge Apartments, Inc. Wilmington 5 0.0
1028 Stores International Limited (in voluntary liquidation) George Town 100.0
1029 Structured Finance Americas, LLC Wilmington 100.0
1030 Sunbelt Rentals Exchange Inc. Wilmington 100.0
1031 Süddeutsche Vermögensverwaltung Gesellschaft mit beschränkter Haftung Frankfurt 100.0
1032 TAF 2 Y.K. Tokyo 100.0
1033 Tapeorder Limited London 100.0
1034 Taunus Corporation Wilmington 100.0
1035 Technology Ventures Five GmbH i.L. Bonn 100.0
1036 Telefon-Servicegesellschaft der Deutschen Bank mbH Frankfurt 100.0
1037 TELO Beteiligungsgesellschaft mbH Schoenefeld 100.0
1038 Tempurrite Leasing Limited London 100.0
1039 Tenedora de Valores S.A. Santiago 100.0
1040 TeraGate Beteiligungs-GmbH Frankfurt 100.0
1041 Tertia Büromaschinen Vermiet- und Leasing-Verwaltungsgesellschaft mbH Duesseldorf 100.0
1042 Thai Asset Enforcement and Recovery Asset Management Company Limited Bangkok 100.0
1043 The World Markets Company GmbH i.L. Frankfurt 74.8
1044 THEMIS Beteiligungs- und Verwaltungs GmbH Cologne 100.0
1045 Tilney (Ireland) Limited Dublin 100.0
1046 Tilney Acquisitions Limited (in member's voluntary liquidation) Liverpool 100.0
1047 Tilney Asset Management International Limited St. Peter Port 100.0
1048 Tilney Funding Limited (in member's voluntary liquidation) Liverpool 100.0
1049 Tilney Group Limited Liverpool 100.0
1050 Tilney Holdings Limited (in member's voluntary liquidation) Liverpool 100.0
1051 Tilney Investment Management Liverpool 100.0
1052 Tilney Management Limited (in member's voluntary liquidation) Liverpool 100.0
1053 TILOS Vermögensverwaltungs GmbH Cologne 100.0
1054 TIM (London) Limited Liverpool 100.0
1055 TOKOS GmbH Luetzen-Gostau 100.0
1056 TQI Exchange, LLC Wilmington 100.0
1057 Treuinvest Service GmbH Frankfurt 100.0
1058 Trevona Limited Road Town 100.0
1059 Triplereason Limited London 100.0
1060 Tsubasa Angel Fund Y.K. Tokyo 100.0
1061 U.F.G.I.S. Advisors Limited Larnaca 100.0
1062 U.F.G.I.S. Holdings (Cyprus) Limited Larnaca 100.0
1063 UDS Capital Y.K. Tokyo 100.0
1064 Unter Sachsenhausen Beteiligungs GmbH i.L. Cologne 100.0
1065 Urbistar Settlement Services, LLC Wilmington 100.0
1066 US Real Estate Beteiligungs GmbH Frankfurt 100.0
1067 Varick Investments Limited Wilmington 100.0
1068 VB Glas-Großhandelsgesellschaft mit beschränkter Haftung Cologne 100.0
1069 VCG Venture Capital Fonds III Verwaltungs GmbH Munich 100.0
1070 VCG Venture Capital Gesellschaft mbH Munich 100.0
1071 VCM Golding Mezzanine GmbH & Co. KG Munich 1 0.0
1072 VCM III Institutional Beteiligungsgesellschaft mbH Munich 100.0
1073 VCM III Institutional Equity Partners GmbH & Co. KG Munich 1 0.1
1074 VCM MIP 2001 GmbH & Co. KG Munich 1 0.0
1075 VCM MIP 2002 GmbH & Co. KG Munich 1 0.0
1076 VCM MIP II GmbH & Co. KG Munich 1 0.0
1077 VCM MIP III GmbH & Co. KG Munich 1 8.0
1078 VCM MIP IV GmbH & Co. KG Munich 1 0.0
1079 VCM PEP I Beteiligungsgesellschaft mbH Munich 100.0

Deutsche Bank 02 – Consolidated Financial Statements 377 Financial Report 2011 Additional Notes 44 – Shareholdings
Subsidiaries
Serial
No. Name of company Domicile of company Footnote
Share of
Capital
in %
1080 VCM PEP II Beteiligungsverwaltung GmbH Munich 100.0
1081 VCM Private Equity Portfolio GmbH & Co. Beteiligungs KG II Munich 1 4.7
1082 VCM Private Equity Portfolio GmbH & Co. KG Munich 1 0.0
1083 VCM Private Equity Portfolio GmbH & Co. KG IV Munich 1 2.1
1084 VCM REE Beteiligungstreuhand GmbH Cologne 100.0
1085 VCM Treuhand Beteiligungsverwaltung GmbH Cologne 100.0
1086 VCM VI Institutional Private Equity (B) GmbH & Co. KG Munich 1 0.0
1087 VCP Treuhand Beteiligungsgesellschaft mbH Cologne 100.0
1088 VCP Verwaltungsgesellschaft mbH Cologne 100.0
1089 VCPII Beteiligungsverwaltungsgesellschaft mbH Tutzing 100.0
1090 Vertriebsgesellschaft mbH der Deutschen Bank Privat- und Geschäftskunden Berlin 100.0
1091 VEXCO, LLC Wilmington 100.0
1092 VI Resort Holdings, Inc. New York 5 0.0
1093 VÖB-ZVD Bank für Zahlungsverkehrsdienstleistungen GmbH Bonn 75.0
1094 Wealthspur Investment Company Limited Labuan 100.0
1095 Welsh, Carson, Anderson & Stowe IX GmbH & Co. KG Munich 1 0.0
1096 WEPLA Beteiligungsgesellschaft mbH Frankfurt 100.0
1097 WERDA Beteiligungsgesellschaft mbH Frankfurt 100.0
1098 Whale Holdings S.à r.l. Luxembourg 100.0
1099 Whispering Woods LLC Wilmington 100.0
1100 Whistling Pines LLC Wilmington 100.0
1101 Wilhelm von Finck Deutsche Family Office AG Grasbrunn 100.0
1102 Wilmington Trust B6 Wilmington 100.0
1103 Wintercrest Inc. Wilmington 100.0
1104 WMH (No. 15) Limited (in member's voluntary liquidation) London 100.0
1105 WMH (No. 16) Limited (in member's voluntary liquidation) London 100.0
1106 Wohnimmobilien Portfolio Deutschland GmbH & Co. KG Frankfurt 60.0
1107 World Trading (Delaware) Inc. Wilmington 100.0
1108 5000 Yonge Street Toronto Inc. Toronto 100.0
1109 ZAO "Deutsche Securities" Moscow 100.0
1110 ZAO "UFG Invest" Moscow 100.0
1111 Zweite Industrie-Beteiligungs-Gesellschaft mbH Frankfurt 100.0
1112 Zürich - Swiss Value AG Zurich 50.1
1113 Zürich - Swiss Value Invest AG Steinhausen 100.0

Deutsche Bank 02 – Consolidated Financial Statement 378 Financial Report 2011 Additional Notes 44 – Shareholdings
Special Purpose Entities
Serial
No. Name of company Domicile of company Footnote
Share of
Capital
in %
1114 ABATE Grundstücks-Vermietungsgesellschaft mbH Duesseldorf 50.0
1115 ABATIS Beteiligungsgesellschaft mbH Duesseldorf 50.0
1116 ABRI Beteiligungsgesellschaft mbH Duesseldorf 50.0
1117 ACHAP Beteiligungsgesellschaft mbH i.L. Duesseldorf 50.0
1118 ACHTE PAXAS Treuhand- und Beteiligungsgesellschaft mbH Duesseldorf 50.0
1119 ACHTUNDZWANZIGSTE PAXAS Treuhand- und Beteiligungsgesellschaft mbH Duesseldorf 50.0
1120 ACHTZEHNTE PAXAS Treuhand- und Beteiligungsgesellschaft mbH Duesseldorf 50.0
1121 ACIS Beteiligungsgesellschaft mbH Duesseldorf 50.0
1122 ACTIO Grundstücks-Vermietungsgesellschaft mbH Duesseldorf 50.0
1123 ACTIUM Leasobjekt GmbH & Co. Objekt Bietigheim OHG Duesseldorf
1124 ADEO Beteiligungsgesellschaft mbH Duesseldorf 50.0
1125 ADLAT Beteiligungsgesellschaft mbH Duesseldorf 50.0
1126 ADMANU Beteiligungsgesellschaft mbH Duesseldorf 50.0
1127 AETAS Beteiligungsgesellschaft mbH i.L. Duesseldorf 50.0
1128 AGLOM Beteiligungsgesellschaft mbH Duesseldorf 50.0
1129 AGUM Beteiligungsgesellschaft mbH Duesseldorf 50.0
1130 AKRUN Beteiligungsgesellschaft mbH Duesseldorf 50.0
1131 ALANUM Beteiligungsgesellschaft mbH Duesseldorf 50.0
1132 ALMO Beteiligungsgesellschaft mbH Duesseldorf 50.0
1133 Almutkirk Limited Dublin
1134 ALTA Beteiligungsgesellschaft mbH Duesseldorf 50.0
1135 Alternative LN TR 2007-HY9 New York
1136 ANDOT Grundstücks-Vermietungsgesellschaft mbH Duesseldorf 50.0
1137 Andramad Limited Dublin
1138 Annapolis Funding Trust Toronto
1139 Apexel LLC Wilmington 100.0
1140 APUR Beteiligungsgesellschaft mbH Duesseldorf 50.0
1141 Asian Hybrid Investments LLP Singapore 5 0.0
1142 Aspen Funding Corp. Charlotte
1143 Asset Repackaging Trust B.V. Amsterdam 7
1144 Asset Repackaging Trust Five B.V. Amsterdam 7
1145 Asset Repackaging Trust Six B.V. Amsterdam 7
1146 ATAUT Beteiligungsgesellschaft mbH Duesseldorf 50.0
1147 Atlas Investment Company 1 S.à r.l. Luxembourg
1148 Atlas Investment Company 2 S.à r.l. Luxembourg
1149 Atlas Investment Company 3 S.à r.l. Luxembourg
1150 Atlas Investment Company 4 S.à r.l. Luxembourg
1151 Atlas Portfolio Select SPC George Town 0.0
1152 Atlas SICAV - FIS Luxembourg 7
1153 Avizandum Limited Dublin
1154 AVOC Beteiligungsgesellschaft mbH Duesseldorf 50.0
1155 Axia Insurance, Ltd. Hamilton 7
1156 Axiom Shelter Island LLC San Diego 100.0
1157 Azurix AGOSBA S.R.L. Buenos Aires 100.0
1158 Azurix Argentina Holding, Inc. Wilmington 100.0
1159 Azurix Buenos Aires S.A. (en liquidacion) Buenos Aires 100.0
1160 Azurix Cono Sur, Inc. Wilmington 100.0
1161 Azurix Corp. Wilmington 100.0
1162 Azurix Latin America, Inc. Wilmington 100.0
1163 BAKTU Beteiligungsgesellschaft mbH Schoenefeld 50.0
1164 BALIT Beteiligungsgesellschaft mbH Schoenefeld 50.0
1165 BAMAR Beteiligungsgesellschaft mbH Schoenefeld 50.0
1166 BARDA Beteiligungsgesellschaft mbH Schoenefeld 50.0
1167 BIMES Beteiligungsgesellschaft mbH Schoenefeld 50.0
Special Purpose Entities

Deutsche Bank 02 – Consolidated Financial Statement 379 Financial Report 2011 Additional Notes 44 – Shareholdings
Special Purpose Entities
Serial
No. Name of company Domicile of company Footnote
Share of
Capital
in %
1168 BLI Beteiligungsgesellschaft für Leasinginvestitionen mbH Duesseldorf 33.2
1169 Blue Ridge CLO 2009-1 Wilmington
1170 BNP Paribas Flexi III - Fortis Bond Taiwan Luxembourg
1171 BNP Paribas Flexi III - RMB Corporate Bonds Luxembourg
1172 Bolsena Holding GmbH & Co. KG Frankfurt 100.0
1173 Bozarche Limited George Town
1174 Bridge No.1 Pty Limited Sydney
1175 Canadian Asset Acquisition Trust 2 Toronto 7
1176 Canal New Orleans Holdings LLC Dover
1177 Canal New Orleans Hotel LLC Wilmington
1178 Canal New Orleans Mezz LLC Dover
1179 Castlebay Asia Flexible Fund SICAV-FIS - Taiwan Bond Fund Luxembourg
1180 Cathay Capital (Labuan) Company Limited Labuan
1181 Cathay Capital Company Limited Port Louis 9.5
1182 Cathay Strategic Investment Company Limited Hong Kong
1183 Cathay Strategic Investment Company No. 2 Limited George Town
1184 Cepangie Limited Dublin
1185 Charitable Luxembourg Four S.à r.l. Luxembourg
1186 Charitable Luxembourg Three S.à r.l. Luxembourg
1187 Charitable Luxembourg Two S.à r.l. Luxembourg
1188 CIBI Beteiligungsgesellschaft mbH Duesseldorf 50.0
1189 CIG (Jersey) Limited St. Helier
1190 CLASS Limited St. Helier 7
1191 Comprehensive Trust - IBP Osaka
1192 Comprehensive Trust - Wakachiku Construction Co., Ltd. Kita-Kyushu
1193 Concept Fund Solutions Public Limited Company Dublin 7
1194 Coriolanus Limited Dublin 7
1195 COUNTS Trust Series 2007 - 3 Newark 7
1196 Cranfield Aircraft Leasing Limited George Town
1197 Crystal CLO, Ltd. George Town
1198 DAGOBA Beteiligungsgesellschaft mbH Duesseldorf
1199 DAINA Beteiligungsgesellschaft mbH Duesseldorf
1200 Dariconic Limited Dublin
1201 DARKU Beteiligungsgesellschaft mbH Duesseldorf
1202 DARUS Beteiligungsgesellschaft mbH Duesseldorf
1203 Dawn-BV II LLC Wilmington 100.0
1204 Dawn-BV LLC Wilmington 100.0
1205 Dawn-BV-Helios LLC Wilmington 100.0
1206 Dawn-G II LLC Wilmington 100.0
1207 Dawn-G LLC Wilmington 100.0
1208 Dawn-G-Helios LLC Wilmington 100.0
1209 DB Aircraft Leasing Master Trust Wilmington 5 0.0
1210 DB Aircraft Leasing Master Trust II Wilmington 5 0.0
1211 DB Akela, S.à r.l. Luxembourg 100.0
1212 DB Alternative Strategies Limited George Town 100.0
1213 DB Artemis Investments GP Wilmington 100.0
1214 DB Asia Pacific Holdings Limited George Town 100.0
1215 DB Aster II, LLC Wilmington 100.0
1216 DB Aster, Inc. Wilmington 100.0
1217 DB Aster, LLC Wilmington 100.0
1218 DB Bagheera, S.à r.l. Luxembourg 100.0
1219 DB Capital Investments, L.P. Wilmington 100.0
1220 DB Clyde, LLC Wilmington 100.0
1221 DB CRE Empire Hawkeye HoldCo LLC Wilmington 100.0
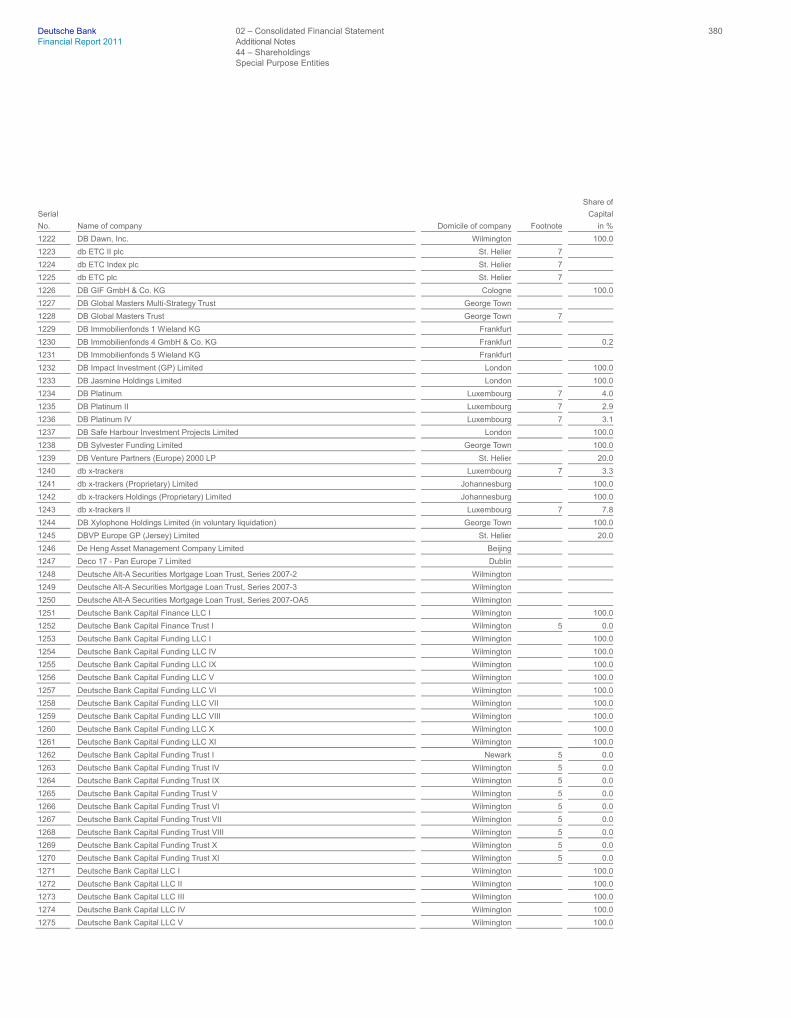
Deutsche Bank 02 – Consolidated Financial Statement 380 Financial Report 2011 Additional Notes 44 – Shareholdings
Special Purpose Entities
Serial
No. Name of company Domicile of company Footnote
Share of
Capital
in %
1222 DB Dawn, Inc. Wilmington 100.0
1223 db ETC II plc St. Helier 7
1224 db ETC Index plc St. Helier 7
1225 db ETC plc St. Helier 7
1226 DB GIF GmbH & Co. KG Cologne 100.0
1227 DB Global Masters Multi-Strategy Trust George Town
1228 DB Global Masters Trust George Town 7
1229 DB Immobilienfonds 1 Wieland KG Frankfurt
1230 DB Immobilienfonds 4 GmbH & Co. KG Frankfurt 0.2
1231 DB Immobilienfonds 5 Wieland KG Frankfurt
1232 DB Impact Investment (GP) Limited London 100.0
1233 DB Jasmine Holdings Limited London 100.0
1234 DB Platinum Luxembourg 7 4.0
1235 DB Platinum II Luxembourg 7 2.9
1236 DB Platinum IV Luxembourg 7 3.1
1237 DB Safe Harbour Investment Projects Limited London 100.0
1238 DB Sylvester Funding Limited George Town 100.0
1239 DB Venture Partners (Europe) 2000 LP St. Helier 20.0
1240 db x-trackers Luxembourg 7 3.3
1241 db x-trackers (Proprietary) Limited Johannesburg 100.0
1242 db x-trackers Holdings (Proprietary) Limited Johannesburg 100.0
1243 db x-trackers II Luxembourg 7 7.8
1244 DB Xylophone Holdings Limited (in voluntary liquidation) George Town 100.0
1245 DBVP Europe GP (Jersey) Limited St. Helier 20.0
1246 De Heng Asset Management Company Limited Beijing
1247 Deco 17 - Pan Europe 7 Limited Dublin
1248 Deutsche Alt-A Securities Mortgage Loan Trust, Series 2007-2 Wilmington
1249 Deutsche Alt-A Securities Mortgage Loan Trust, Series 2007-3 Wilmington
1250 Deutsche Alt-A Securities Mortgage Loan Trust, Series 2007-OA5 Wilmington
1251 Deutsche Bank Capital Finance LLC I Wilmington 100.0
1252 Deutsche Bank Capital Finance Trust I Wilmington 5 0.0
1253 Deutsche Bank Capital Funding LLC I Wilmington 100.0
1254 Deutsche Bank Capital Funding LLC IV Wilmington 100.0
1255 Deutsche Bank Capital Funding LLC IX Wilmington 100.0
1256 Deutsche Bank Capital Funding LLC V Wilmington 100.0
1257 Deutsche Bank Capital Funding LLC VI Wilmington 100.0
1258 Deutsche Bank Capital Funding LLC VII Wilmington 100.0
1259 Deutsche Bank Capital Funding LLC VIII Wilmington 100.0
1260 Deutsche Bank Capital Funding LLC X Wilmington 100.0
1261 Deutsche Bank Capital Funding LLC XI Wilmington 100.0
1262 Deutsche Bank Capital Funding Trust I Newark 5 0.0
1263 Deutsche Bank Capital Funding Trust IV Wilmington 5 0.0
1264 Deutsche Bank Capital Funding Trust IX Wilmington 5 0.0
1265 Deutsche Bank Capital Funding Trust V Wilmington 5 0.0
1266 Deutsche Bank Capital Funding Trust VI Wilmington 5 0.0
1267 Deutsche Bank Capital Funding Trust VII Wilmington 5 0.0
1268 Deutsche Bank Capital Funding Trust VIII Wilmington 5 0.0
1269 Deutsche Bank Capital Funding Trust X Wilmington 5 0.0
1270 Deutsche Bank Capital Funding Trust XI Wilmington 5 0.0
1271 Deutsche Bank Capital LLC I Wilmington 100.0
1272 Deutsche Bank Capital LLC II Wilmington 100.0
1273 Deutsche Bank Capital LLC III Wilmington 100.0
1274 Deutsche Bank Capital LLC IV Wilmington 100.0
1275 Deutsche Bank Capital LLC V Wilmington 100.0

Deutsche Bank 02 – Consolidated Financial Statement 381 Financial Report 2011 Additional Notes 44 – Shareholdings
Special Purpose Entities
Serial
No. Name of company Domicile of company Footnote
Share of
Capital
in %
1276 Deutsche Bank Capital Trust I Newark 5 0.0
1277 Deutsche Bank Capital Trust II Newark 5 0.0
1278 Deutsche Bank Capital Trust III Newark 5 0.0
1279 Deutsche Bank Capital Trust IV Newark 5 0.0
1280 Deutsche Bank Capital Trust V Newark 5 0.0
1281 Deutsche Bank Contingent Capital LLC I Wilmington 100.0
1282 Deutsche Bank Contingent Capital LLC II Wilmington 100.0
1283 Deutsche Bank Contingent Capital LLC III Wilmington 100.0
1284 Deutsche Bank Contingent Capital LLC IV Wilmington 100.0
1285 Deutsche Bank Contingent Capital LLC V Wilmington 100.0
1286 Deutsche Bank Contingent Capital Trust I Wilmington 5 0.0
1287 Deutsche Bank Contingent Capital Trust II Wilmington 5 0.0
1288 Deutsche Bank Contingent Capital Trust III Wilmington 5 0.0
1289 Deutsche Bank Contingent Capital Trust IV Wilmington 5 0.0
1290 Deutsche Bank Contingent Capital Trust V Wilmington 5 0.0
1291 Deutsche Bank SPEARs/LIFERs Trusts (DB Series) Wilmington 8
1292 Deutsche Beta Finance GmbH Frankfurt 100.0
1293 Deutsche Colombia S.A. Bogotá 100.0
1294 Deutsche Gesellschaft für Immobilien-Leasing mit beschränkter Haftung Duesseldorf 100.0
1295 Deutsche GUO Mao Investments (Netherlands) B.V. Amsterdam 100.0
1296 Deutsche Impact Investment (GP) Limited Edinburgh 100.0
1297 Deutsche Mortgage Securities, Inc. Series 2007-RS1 New York
1298 Deutsche Mortgage Securities, Inc. Series 2007-RS3 New York
1299 Deutsche Mortgage Securities, Inc. Series 2007-RS4 New York
1300 Deutsche Mortgage Securities, Inc. Series 2007-RS5 New York
1301 Deutsche Mortgage Securities, Inc. Series 2007-RS6 New York
1302 Deutsche Mortgage Securities, Inc. Series 2007-RS7 New York
1303 Deutsche Mortgage Securities, Inc. Series 2007-RS8 New York
1304 Deutsche Mortgage Securities, Inc. Series 2008-RS1 New York
1305 Deutsche Mortgage Securities, Inc. Series 2009-RS4 Santa Ana
1306 Deutsche OBU Pty Limited Sydney 100.0
1307 Deutsche Postbank Funding LLC I Wilmington 100.0
1308 Deutsche Postbank Funding LLC II Wilmington 100.0
1309 Deutsche Postbank Funding LLC III Wilmington 100.0
1310 Deutsche Postbank Funding LLC IV Wilmington 100.0
1311 Deutsche Postbank Funding Trust I Wilmington 100.0
1312 Deutsche Postbank Funding Trust II Wilmington 100.0
1313 Deutsche Postbank Funding Trust III Wilmington 100.0
1314 Deutsche Postbank Funding Trust IV Wilmington 100.0
1315 DIL Beteiligungs-Stiftung Duesseldorf
1316 DIL Europa-Beteiligungsgesellschaft mbH i.L. Duesseldorf 100.0
1317 DIL Fonds-Beteiligungsgesellschaft mbH Duesseldorf 100.0
1318 DJ Williston Swaps LLC Wilmington 100.0
1319 DONARUM Holding GmbH Duesseldorf 50.0
1320 DREIUNDZWANZIGSTE PAXAS Treuhand- und Beteiligungsgesellschaft mbH Duesseldorf 50.0
1321 DREIZEHNTE PAXAS Treuhand- und Beteiligungsgesellschaft mbH Duesseldorf 50.0
1322 DRITTE Fonds-Beteiligungsgesellschaft mbH Duesseldorf 50.0
1323 DRITTE PAXAS Treuhand- und Beteiligungsgesellschaft mbH Duesseldorf 50.0
1324 Dusk II, LLC Wilmington 100.0
1325 Dusk LLC Wilmington 100.0
1326 DWS Bond Flexible Luxembourg
1327 DWS Concept Luxembourg 7
1328 DWS Institutional Money plus Luxembourg
1329 DWS Institutional USD Money plus Luxembourg

Deutsche Bank 02 – Consolidated Financial Statement 382 Financial Report 2011 Additional Notes 44 – Shareholdings
Special Purpose Entities
Serial
No. Name of company Domicile of company Footnote
Share of
Capital
in %
1330 Dyna Holding GmbH Eschborn 100.0
1331 Earls Eight Limited George Town 7
1332 EARLS Trading Limited George Town
1333 1221 East Denny Owner, LLC Wilmington
1334 EBEMUS Beteiligungsgesellschaft mbH Schoenefeld
1335 Edomizaka Tokutei Mokuteki Kaisha Tokyo
1336 EGOM Beteiligungsgesellschaft mbH Schoenefeld
1337 EINATUS Beteiligungsgesellschaft mbH Schoenefeld 10.0
1338 EINUNDZWANZIGSTE PAXAS Treuhand- und Beteiligungsgesellschaft mbH Duesseldorf 50.0
1339 Eirles Three Limited Dublin 7
1340 Eirles Two Limited Dublin 7
1341 ELC Logistik-Centrum Verwaltungs-GmbH Erfurt 50.0
1342 ELFTE PAXAS Treuhand- und Beteiligungsgesellschaft mbH Duesseldorf 50.0
1343 Elmo Funding GmbH Eschborn 100.0
1344 Elmo Leasing Achte GmbH Eschborn 100.0
1345 Elmo Leasing Dreiundzwanzigste GmbH Eschborn 100.0
1346 Elmo Leasing Dreizehnte GmbH Eschborn 100.0
1347 Elmo Leasing Dritte GmbH Eschborn 100.0
1348 Elmo Leasing Elfte GmbH Eschborn 100.0
1349 Elmo Leasing Neunte GmbH Eschborn 100.0
1350 Elmo Leasing Sechste GmbH Eschborn 100.0
1351 Elmo Leasing Siebte GmbH Eschborn 100.0
1352 Elmo Leasing Vierzehnte GmbH Eschborn 100.0
1353 Elmo Leasing Zwölfte GmbH Eschborn 100.0
1354 Emerging Markets Capital Protected Investments Ltd George Town 7
1355 Emeris George Town
1356 EOP Manager, LLC Wilmington 100.0
1357 Equinox Credit Funding Public Limited Company Dublin 7
1358 Equipment Management Services LLC Wilmington 100.0
1359 Erste Frankfurter Hoist GmbH Frankfurt 100.0
1360 Escoyla Limited Dublin
1361 ETFS Industrial Metal Securities Limited St. Helier 7
1362 Eurohome (Italy) Mortgages S.r.l. Conegliano
1363 Fandaro Limited Dublin
1364 Farsala Investment SRL Bucharest
1365 Film Asset Securitization Trust 2009-1 New York
1366 Finaqua Limited London
1367 Fixed Income Flexible Luxembourg 100.0
1368 Fortis Flexi IV - Bond Medium Term RMB Luxembourg
1369 FÜNFTE Fonds-Beteiligungsgesellschaft mbH Duesseldorf 50.0
1370 FÜNFTE PAXAS Treuhand- und Beteiligungsgesellschaft mbH Duesseldorf 50.0
1371 FÜNFUNDZWANZIGSTE PAXAS Treuhand- und Beteiligungsgesellschaft mbH Duesseldorf 50.0
1372 FÜNFZEHNTE PAXAS Treuhand- und Beteiligungsgesellschaft mbH Duesseldorf 50.0
1373 G.O. III Luxembourg Oxford S.à r.l. Luxembourg
1374 GAC-HEL, Inc. Wilmington 100.0
1375 GC Re Hamilton 7
1376 GEM ERI Limited George Town
1377 Gemini Securitization Corp., LLC Boston
1378 GEWE-Falkenberg Beteiligungsgesellschaft mbH Duesseldorf 50.0
1379 Global Opportunities Co-Investment Feeder, LLC Wilmington
1380 Global Opportunities Co-Investment, LLC Wilmington
1381 GMS Global Investment Strategy II Fund Frankfurt
1382 Gottex ABI II Fund Limited George Town
1383 GWC-GAC Corp. Wilmington 100.0

Deutsche Bank 02 – Consolidated Financial Statement 383 Financial Report 2011 Additional Notes 44 – Shareholdings
Special Purpose Entities
Serial
No. Name of company Domicile of company Footnote
Share of
Capital
in %
1384 H21 Absolute Return Portfolios SPC - Class ARP-A00-10150 George Town
1385 Hamildak Limited Dublin
1386 Harbour Finance Limited Dublin
1387 Herodotus Limited George Town 5
1388 HESTA Grundstücks-Vermietungsgesellschaft mbH & Co. Objekt Frankfurt KG Duesseldorf
1389 Hotel Majestic LLC Wilmington 100.0
1390 HSBC Funding (Deutschland) GmbH Bad Soden am Taunus 14.4
1391 Immobilien-Vermietungsgesellschaft von Quistorp GmbH & Co. Objekt Altlandsberg KG Duesseldorf
1392 Infigate GmbH i.K. Essen 48.0
1393 Infrastructure Holdings (Cayman) SPC George Town
1394 Investors Cash Trust Boston 7
1395 IQ-Markets SA Luxembourg
1396 IRADO Holding Limited George Town 100.0
1397 IVAF (Jersey) Limited St. Helier
1398 Ixion Public Limited Company Dublin 7
1399 JWB Leasing Limited Partnership London 100.0
1400 Kasteel Roos Ghent 100.0
1401 Kelsey Street LLC Wilmington 100.0
1402 Kelvivo Limited Dublin
1403 Kingfisher (Ontario) LP Toronto 100.0
1404 Kingfisher Canada Holdings LLC Wilmington 100.0
1405 Kingfisher Holdings I (Nova Scotia) ULC Halifax 100.0
1406 Kingfisher Holdings II (Nova Scotia) ULC Halifax 100.0
1407 Kingfisher Holdings LLC Wilmington 100.0
1408 KOMPASS 3 Beteiligungsgesellschaft mbH Duesseldorf 50.0
1409 KOMPASS 3 Erste Beteiligungsgesellschaft mbH & Co. Euro KG Duesseldorf 0.0
1410 KOMPASS 3 Zweite Beteiligungsgesellschaft mbH & Co. USD KG Duesseldorf 0.0
1411 La Fayette Dedicated Basket Ltd. Road Town
1412 Labuan (Cranfield) Aircraft Leasing Limited Labuan
1413 Lambourn Spólka z ograniczona odpowiedzialnoscia Warsaw 100.0
1414 LARS Grundstücks-Vermietungsgesellschaft mbH & Co. Objekt Hagen KG Duesseldorf
1415 LECTIO Grundstücks-Vermietungsgesellschaft mbH & Co. Objekt Weimar KG Duesseldorf
1416 Legacy BCC Receivables, LLC Wilmington 100.0
1417 Leo Consumo 1 S.r.l. Conegliano
1418 Leo Consumo 2 S.r.l. Conegliano 70.0
1419 Leonardo Charitable 1 LLC Wilmington 9.9
1420 Linker Finance plc Dublin 7
1421 Luscina Limited Dublin
1422 Maestrale Projects (Holding) S.A. Luxembourg 49.7
1423 Maher 1210 Corbin LLC Wilmington 100.0
1424 Maher Chassis Management LLC Wilmington 100.0
1425 Maher Terminals Holding Corp. Toronto 100.0
1426 Maher Terminals LLC Wilmington 100.0
1427 Maher Terminals Logistics Systems LLC Wilmington 100.0
1428 Maher Terminals USA, LLC Wilmington 100.0
1429 MAN Investments SAC Limited Hamilton
1430 Manta Acquisition LLC Wilmington 100.0
1431 Manta Group LLC Wilmington 100.0
1432 Maritime Indemnity Insurance Co Hamilton 100.0
1433 Market Access III - CYD Market Neutral Plus Index Fund Luxembourg
1434 Mars Investment Trust II New York 100.0
1435 Mars Investment Trust III New York 100.0
1436 Master Aggregation Trust Wilmington
1437 Maxima Alpha Bomaral Limited St. Helier

Deutsche Bank 02 – Consolidated Financial Statement 384 Financial Report 2011 Additional Notes 44 – Shareholdings
Special Purpose Entities
Serial
No. Name of company Domicile of company Footnote
Share of
Capital
in %
1438 Mazuma Capital Funds Limited Hamilton 7
1439 MEFIS Beteiligungsgesellschaft mbH Frankfurt 43.0
1440 Mekabo B.V. Amsterdam
1441 Merlin I George Town
1442 Merlin II George Town
1443 Merlin XI George Town
1444 Micro-E Finance S.r.l. Rome
1445 Mikrofinanz Beteiligungsgesellschaft ZWEI GmbH i.L. Duesseldorf 50.0
1446 MIRABILIS Grundstücks-Vermietungsgesellschaft mbH & Co. Objekt Berching KG Duesseldorf 7
1447 MMCapS Funding XVIII Ltd. - Resecuritization Trust 2010-RS1 Wilmington
1448 Montage Funding LLC Dover
1449 Monterey Funding LLC Wilmington
1450 Moon Leasing Limited London 100.0
1451 MortgageIT Capital Trust I Newark 5 3.0
1452 MortgageIT Capital Trust III Wilmington 5 3.0
1453 MortgageIT Trust 2004-1 New York
1454 Motion Picture Productions One GmbH & Co. KG Frankfurt 100.0
1455 MPP Beteiligungsgesellschaft mbH Frankfurt 100.0
1456 NBG Grundstücks-Vermietungsgesellschaft mbH Duesseldorf 50.0
1457 NCW Holding Inc. Vancouver 100.0
1458 NeoAnemos S.r.l. Milan
1459 Netron Investment SRL Bucharest
1460 NEUNTE PAXAS Treuhand- und Beteiligungsgesellschaft mbH Duesseldorf 50.0
1461 NEUNZEHNTE PAXAS Treuhand- und Beteiligungsgesellschaft mbH Duesseldorf 50.0
1462 Newport Funding Corp. Charlotte
1463 Nexus Infrastruktur Beteiligungsgesellschaft mbH Duesseldorf 50.0
1464 Nineco Leasing Limited London 100.0
1465 NOFA Grundstücks-Vermietungsgesellschaft mbH Duesseldorf 50.0
1466 North Las Vegas Property LLC Wilmington 100.0
1467 Norvadano Limited Dublin
1468 Novelties Distribution LLC Wilmington 100.0
1469 Odin Mortgages Limited London
1470 Okanagan Funding Trust Toronto
1471 Oona Solutions, Fonds Commun de Placement Luxembourg 7
1472 OPAL Luxembourg 7
1473 Operadora de Buenos Aires S.R.L. Buenos Aires 100.0
1474 OPPENHEIM Portfolio Advisors VI GmbH & Co. KG Cologne 100.0
1475 Optima Emerging Markets Fund Limited Hamilton
1476 Opus One Private Real Estate Fund Seoul
1477 Oran Limited George Town
1478 Ornegin Investment SRL Bucharest
1479 Owner Trust MSN 199 Salt Lake City
1480 Owner Trust MSN 23336 Salt Lake City
1481 Owner Trust MSN 23337 Salt Lake City
1482 Owner Trust MSN 23338 Salt Lake City
1483 Owner Trust MSN 23344 Salt Lake City
1484 Owner Trust MSN 23887 Salt Lake City
1485 Owner Trust MSN 240 Salt Lake City
1486 Owner Trust MSN 241 Salt Lake City
1487 Owner Trust MSN 24452 Salt Lake City
1488 Owner Trust MSN 24453 Salt Lake City
1489 Owner Trust MSN 24788 Salt Lake City
1490 Owner Trust MSN 25120 Salt Lake City
1491 Owner Trust MSN 25259 Salt Lake City
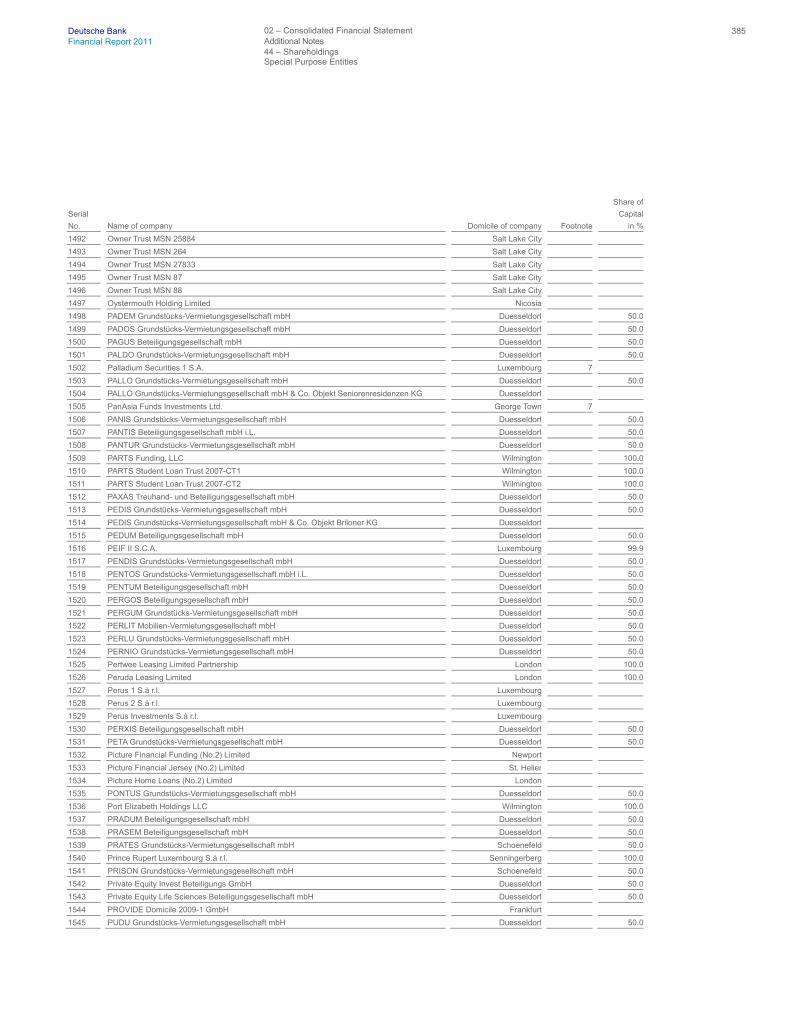
Deutsche Bank 02 – Consolidated Financial Statement 385 Financial Report 2011 Additional Notes 44 – Shareholdings
Special Purpose Entities
Serial
No. Name of company Domicile of company Footnote
Share of
Capital
in %
1492 Owner Trust MSN 25884 Salt Lake City
1493 Owner Trust MSN 264 Salt Lake City
1494 Owner Trust MSN 27833 Salt Lake City
1495 Owner Trust MSN 87 Salt Lake City
1496 Owner Trust MSN 88 Salt Lake City
1497 Oystermouth Holding Limited Nicosia
1498 PADEM Grundstücks-Vermietungsgesellschaft mbH Duesseldorf 50.0
1499 PADOS Grundstücks-Vermietungsgesellschaft mbH Duesseldorf 50.0
1500 PAGUS Beteiligungsgesellschaft mbH Duesseldorf 50.0
1501 PALDO Grundstücks-Vermietungsgesellschaft mbH Duesseldorf 50.0
1502 Palladium Securities 1 S.A. Luxembourg 7
1503 PALLO Grundstücks-Vermietungsgesellschaft mbH Duesseldorf 50.0
1504 PALLO Grundstücks-Vermietungsgesellschaft mbH & Co. Objekt Seniorenresidenzen KG Duesseldorf
1505 PanAsia Funds Investments Ltd. George Town 7
1506 PANIS Grundstücks-Vermietungsgesellschaft mbH Duesseldorf 50.0
1507 PANTIS Beteiligungsgesellschaft mbH i.L. Duesseldorf 50.0
1508 PANTUR Grundstücks-Vermietungsgesellschaft mbH Duesseldorf 50.0
1509 PARTS Funding, LLC Wilmington 100.0
1510 PARTS Student Loan Trust 2007-CT1 Wilmington 100.0
1511 PARTS Student Loan Trust 2007-CT2 Wilmington 100.0
1512 PAXAS Treuhand- und Beteiligungsgesellschaft mbH Duesseldorf 50.0
1513 PEDIS Grundstücks-Vermietungsgesellschaft mbH Duesseldorf 50.0
1514 PEDIS Grundstücks-Vermietungsgesellschaft mbH & Co. Objekt Briloner KG Duesseldorf
1515 PEDUM Beteiligungsgesellschaft mbH Duesseldorf 50.0
1516 PEIF II S.C.A. Luxembourg 99.9
1517 PENDIS Grundstücks-Vermietungsgesellschaft mbH Duesseldorf 50.0
1518 PENTOS Grundstücks-Vermietungsgesellschaft mbH i.L. Duesseldorf 50.0
1519 PENTUM Beteiligungsgesellschaft mbH Duesseldorf 50.0
1520 PERGOS Beteiligungsgesellschaft mbH Duesseldorf 50.0
1521 PERGUM Grundstücks-Vermietungsgesellschaft mbH Duesseldorf 50.0
1522 PERLIT Mobilien-Vermietungsgesellschaft mbH Duesseldorf 50.0
1523 PERLU Grundstücks-Vermietungsgesellschaft mbH Duesseldorf 50.0
1524 PERNIO Grundstücks-Vermietungsgesellschaft mbH Duesseldorf 50.0
1525 Pertwee Leasing Limited Partnership London 100.0
1526 Peruda Leasing Limited London 100.0
1527 Perus 1 S.à r.l. Luxembourg
1528 Perus 2 S.à r.l. Luxembourg
1529 Perus Investments S.à r.l. Luxembourg
1530 PERXIS Beteiligungsgesellschaft mbH Duesseldorf 50.0
1531 PETA Grundstücks-Vermietungsgesellschaft mbH Duesseldorf 50.0
1532 Picture Financial Funding (No.2) Limited Newport
1533 Picture Financial Jersey (No.2) Limited St. Helier
1534 Picture Home Loans (No.2) Limited London
1535 PONTUS Grundstücks-Vermietungsgesellschaft mbH Duesseldorf 50.0
1536 Port Elizabeth Holdings LLC Wilmington 100.0
1537 PRADUM Beteiligungsgesellschaft mbH Duesseldorf 50.0
1538 PRASEM Beteiligungsgesellschaft mbH Duesseldorf 50.0
1539 PRATES Grundstücks-Vermietungsgesellschaft mbH Schoenefeld 50.0
1540 Prince Rupert Luxembourg S.à r.l. Senningerberg 100.0
1541 PRISON Grundstücks-Vermietungsgesellschaft mbH Schoenefeld 50.0
1542 Private Equity Invest Beteiligungs GmbH Duesseldorf 50.0
1543 Private Equity Life Sciences Beteiligungsgesellschaft mbH Duesseldorf 50.0
1544 PROVIDE Domicile 2009-1 GmbH Frankfurt
1545 PUDU Grundstücks-Vermietungsgesellschaft mbH Duesseldorf 50.0

Deutsche Bank 02 – Consolidated Financial Statement 386 Financial Report 2011 Additional Notes 44 – Shareholdings
Special Purpose Entities
Serial
No. Name of company Domicile of company Footnote
Share of
Capital
in %
1546 PUKU Grundstücks-Vermietungsgesellschaft mbH Duesseldorf 50.0
1547 PURIM Grundstücks-Vermietungsgesellschaft mbH Duesseldorf 50.0
1548 PURIM Grundstücks-Vermietungsgesellschaft mbH & Co. Objekt Burscheid KG Duesseldorf
1549 QUANTIS Grundstücks-Vermietungsgesellschaft mbH Schoenefeld 50.0
1550 Quartz No. 1 S.A. Luxembourg 5
1551 QUELLUM Grundstücks-Vermietungsgesellschaft mbH Duesseldorf 50.0
1552 QUOTAS Grundstücks-Vermietungsgesellschaft mbH Duesseldorf 50.0
1553 R/H Hawthorne Plaza Associates, LLC Wilmington
1554 Reference Capital Investments Limited London 100.0
1555 Regal Limited George Town 7
1556 REO Properties Corporation Wilmington 100.0
1557 Residential Mortgage Funding Trust Toronto
1558 Rhein - Main Securitisation Limited St. Helier
1559 Rhein-Main No. 12 Limited St. Helier
1560 Rhein-Main No. 14 Limited St. Helier
1561 Rhein-Main No. 5 Mortgage Purchase Limited St. Helier
1562 Rheingold No.1 Limited St. Helier
1563 Rheingold No.10 Limited St. Helier
1564 Rheingold No.14 (Jersey) Limited St. Helier
1565 Rheingold No.9 Limited St. Helier
1566 Rheingold Securitisation Limited St. Helier
1567 RHOEN 2008-1 GmbH Frankfurt
1568 Riverside Funding LLC Dover
1569 RM Ayr Delaware LLC Dover
1570 RM Ayr Limited Dublin
1571 RM Chestnut Delaware LLC Dover
1572 RM Chestnut Limited Dublin
1573 RM Delaware Multi-Asset LLC Wilmington
1574 RM Delaware Triple-A LLC Dover
1575 RM Fife Delaware LLC Dover
1576 RM Fife Limited Dublin
1577 RM Multi-Asset Limited Dublin
1578 RM Sussex Delaware LLC Dover
1579 RM Sussex Limited Dublin
1580 RM Triple-A Limited Dublin
1581 Route 28 Titling Trust Wilmington
1582 RREEF G.O. III Luxembourg One S.à r.l. Luxembourg
1583 RREEF G.O. III Malta Limited Valletta
1584 RREEF Global Opportunities Fund III, LLC Wilmington
1585 RREEF GO III Mauritius One Limited Port Louis
1586 RREEF GO III Mauritius Two Limited Port Louis
1587 RREEF North American Infrastructure Fund A, L.P. Wilmington 99.9
1588 RREEF North American Infrastructure Fund B, L.P. Wilmington 99.9
1589 SABIS Grundstücks-Vermietungsgesellschaft mbH Duesseldorf 50.0
1590 SABRE Securitisation Limited Sydney
1591 SAITA Grundstücks-Vermietungsgesellschaft mbH i.L. Duesseldorf 60.0
1592 SALIX Grundstücks-Vermietungsgesellschaft mbH Duesseldorf 50.0
1593 SALUS Grundstücks-Vermietungsgesellschaft mbH Duesseldorf 50.0
1594 SALUS Grundstücks-Vermietungsgesellschaft mbH & Co. Objekt Brandenburg KG Duesseldorf
1595 SALUS Grundstücks-Vermietungsgesellschaft mbH & Co. Objekt Dresden KG Duesseldorf 58.5
1596 SALUS Grundstücks-Vermietungsgesellschaft mbH & Co. Objekt Schwarzheide KG Duesseldorf
1597 SANCTOR Grundstücks-Vermietungsgesellschaft mbH Duesseldorf 50.0
1598 SANCTOR Grundstücks-Vermietungsgesellschaft mbH & Co. Objekt Nürnberg KG Duesseldorf
1599 SANDIX Grundstücks-Vermietungsgesellschaft mbH Duesseldorf 50.0
Deutsche Bank 02 – Consolidated Financial Statement 387 Financial Report 2011 Additional Notes 44 – Shareholdings
Special Purpose Entities
Serial
No. Name of company Domicile of company Footnote
Share of
Capital
in %
1600 SANDIX Grundstücks-Vermietungsgesellschaft mbH & Co. Objekt Hafen KG Duesseldorf
1601 SANO Grundstücks-Vermietungsgesellschaft mbH Duesseldorf 50.0
1602 Saratoga Funding Corp., LLC Wilmington
1603 SARIO Grundstücks-Vermietungsgesellschaft mbH Duesseldorf 50.0
1604 SATINA Mobilien-Vermietungsgesellschaft mbH Duesseldorf 50.0
1605 SCANDO Grundstücks-Vermietungsgesellschaft mbH Duesseldorf 50.0
1606 SCANDO Grundstücks-Vermietungsgesellschaft mbH & Co. Objekt Datteln KG Duesseldorf
1607 SCANDO Grundstücks-Vermietungsgesellschaft mbH & Co. Objekt Eisenach KG Duesseldorf 7
1608 SCANDO Grundstücks-Vermietungsgesellschaft mbH & Co. Objekt Iserlohn KG i.L. Duesseldorf
1609 SCANDO Grundstücks-Vermietungsgesellschaft mbH & Co. Objekt Osnabrück KG Duesseldorf
1610 SCANDO Grundstücks-Vermietungsgesellschaft mbH & Co. Objekt Siekmann KG Duesseldorf
1611 SCHEDA Grundstücks-Vermietungsgesellschaft mbH Duesseldorf 50.0
1612 Schiffsbetriebsgesellschaft FINNA mbH Hamburg 100.0
1613 Schiffsbetriebsgesellschaft GRIMA mbH Hamburg 100.0
1614 SCITOR Grundstücks-Vermietungsgesellschaft mbH Duesseldorf 50.0
1615 SCUDO Grundstücks-Vermietungsgesellschaft mbH Duesseldorf 100.0
1616 SCUDO Grundstücks-Vermietungsgesellschaft mbH & Co. Objekt Kleine Alexanderstraße KG Duesseldorf 95.0
1617 SECHSTE Fonds-Beteiligungsgesellschaft mbH Duesseldorf 50.0
1618 SECHSTE PAXAS Treuhand- und Beteiligungsgesellschaft mbH Duesseldorf 50.0
1619 SECHSUNDZWANZIGSTE PAXAS Treuhand- und Beteiligungsgesellschaft mbH Duesseldorf
1620 SECHZEHNTE PAXAS Treuhand- und Beteiligungsgesellschaft mbH Duesseldorf 50.0
1621 SEDO Grundstücks-Vermietungsgesellschaft mbH Duesseldorf 100.0
1622 Sedona Capital Funding Corp., LLC Charlotte
1623 SEGES Grundstücks-Vermietungsgesellschaft mbH Duesseldorf 50.0
1624 SEGU Grundstücks-Vermietungsgesellschaft mbH Duesseldorf 50.0
1625 SELEKTA Grundstücksverwaltungsgesellschaft mbH Duesseldorf 50.0
1626 SENA Grundstücks-Vermietungsgesellschaft mbH Duesseldorf 50.0
1627 SENA Grundstücks-Vermietungsgesellschaft mbH & Co. Objekt Halle II KG Duesseldorf 100.0
1628 SERICA Grundstücks-Vermietungsgesellschaft mbH Duesseldorf 50.0
1629 SERICA Grundstücks-Vermietungsgesellschaft mbH & Co. Objekt Frankfurt KG Duesseldorf
1630 Sharps CDO II Ltd. George Town
1631 SIDA Grundstücks-Vermietungsgesellschaft mbH Duesseldorf 50.0
1632 SIEBENUNDZWANZIGSTE PAXAS Treuhand- und Beteiligungsgesellschaft mbH Duesseldorf
1633 SIEBTE PAXAS Treuhand- und Beteiligungsgesellschaft mbH Duesseldorf 50.0
1634 SIEBZEHNTE PAXAS Treuhand- und Beteiligungsgesellschaft mbH Duesseldorf 50.0
1635 SIFA Grundstücks-Vermietungsgesellschaft mbH Duesseldorf 100.0
1636 SILANUS Grundstücks-Vermietungsgesellschaft mbH Duesseldorf 50.0
1637 SILANUS Grundstücks-Vermietungsgesellschaft mbH & Co. Objekt Bonn KG Duesseldorf
1638 SILEX Grundstücks-Vermietungsgesellschaft mbH Duesseldorf 50.0
1639 SILEX Grundstücks-Vermietungsgesellschaft mbH & Co. Objekt Rostock und Leipzig KG Duesseldorf
1640 SILEX Grundstücks-Vermietungsgesellschaft mbH Objekt Eduard Dyckerhoff OHG Duesseldorf
1641 SILIGO Mobilien-Vermietungsgesellschaft mbH Duesseldorf 50.0
1642 SILUR Grundstücks-Vermietungsgesellschaft mbH Duesseldorf 50.0
1643 SILUR Grundstücks-Vermietungsgesellschaft mbH & Co. Objekt Markdorf KG Duesseldorf
1644 SILUR Grundstücks-Vermietungsgesellschaft mbH & Co. Objekt Tübingen KG Duesseldorf
1645 SILUR Grundstücks-Vermietungsgesellschaft mbH & Co. Objekt Uhingen KG Duesseldorf
1646 SIMILA Grundstücks-Vermietungsgesellschaft mbH Duesseldorf 50.0
1647 Singer Island Tower Suite LLC Wilmington 100.0
1648 SIRES-STAR Limited George Town 7
1649 Sixco Leasing Limited London 100.0
1650 SMART SME CLO 2006-1 Ltd George Town
1651 SOLATOR Grundstücks-Vermietungsgesellschaft mbH Duesseldorf 50.0
1652 SOLIDO Grundstücks-Vermietungsgesellschaft mbH Duesseldorf 100.0
1653 SOLON Grundstücks-Vermietungsgesellschaft mbH Schoenefeld 50.0

Deutsche Bank 02 – Consolidated Financial Statement 388 Financial Report 2011 Additional Notes 44 – Shareholdings
Special Purpose Entities
Serial
No. Name of company Domicile of company Footnote
Share of
Capital
in %
1654 SOLUM Grundstücks-Vermietungsgesellschaft mbH Duesseldorf 50.0
1655 SOMA Grundstücks-Vermietungsgesellschaft mbH Duesseldorf 50.0
1656 SOMA Grundstücks-Vermietungsgesellschaft mbH & Co. Objekt Heidelberg KG i.L. Duesseldorf
1657 Sonata Securities S.A. Luxembourg 7
1658 SOREX Grundstücks-Vermietungsgesellschaft mbH Duesseldorf 50.0
1659 SOREX Grundstücks-Vermietungsgesellschaft mbH & Co. Objekt Hutschenreuther KG Duesseldorf
1660 SOREX Grundstücks-Vermietungsgesellschaft mbH & Co. Objekt Lüdenscheid KG Duesseldorf
1661 SOREX Grundstücks-Vermietungsgesellschaft mbH & Co. Objekt Mainz KG Duesseldorf
1662 SOSPITA Grundstücks-Vermietungsgesellschaft mbH Duesseldorf 50.0
1663 SOSPITA Grundstücks-Vermietungsgesellschaft mbH & Co. Objekte Prima KG Duesseldorf 7
1664 SOSPITA Grundstücks-Vermietungsgesellschaft mbH & Co. Objekte Sekunda KG Duesseldorf 7
1665 SPAN No.5 Pty Limited Sydney
1666 SPESSART 2009-1 GmbH Frankfurt
1667 SPhinX Limited George Town 50.2
1668 SPINO Grundstücks-Vermietungsgesellschaft mbH Duesseldorf 100.0
1669 SPLENDOR Grundstücks-Vermietungsgesellschaft mbH Schoenefeld 50.0
1670 Spring Asset Funding LLC Wilmington
1671 Spring Asset Funding Ltd George Town
1672 SPV Optimal SUS Ltd. Nassau
1673 SS Aggregation Trust Wilmington
1674 STABLON Grundstücks-Vermietungsgesellschaft mbH Duesseldorf 100.0
1675 STAGIRA Grundstücks-Vermietungsgesellschaft mbH Duesseldorf 50.0
1676 STATOR Heizkraftwerk Frankfurt (Oder) Beteiligungsgesellschaft mbH Schoenefeld 100.0
1677 Stewart-Denny Holdings, LLC Wilmington
1678 Stichting Perus Investments Amsterdam
1679 Strategic Global Opportunities Ltd. - Class A Main USD Nassau
1680 STTN, Inc. Wilmington 100.0
1681 STUPA Heizwerk Frankfurt (Oder) Nord Beteiligungsgesellschaft mbH Schoenefeld 100.0
1682 SUBLICA Grundstücks-Vermietungsgesellschaft mbH Duesseldorf 50.0
1683 SUBU Mobilien-Vermietungsgesellschaft mbH Duesseldorf 50.0
1684 SULPUR Grundstücks-Vermietungsgesellschaft mbH Schoenefeld 50.0
1685 Sunflower Fund Luxembourg
1686 Sunrise Beteiligungsgesellschaft mbH Frankfurt 100.0
1687 SUPERA Grundstücks-Vermietungsgesellschaft mbH Duesseldorf 50.0
1688 SUPERA Grundstücks-Vermietungsgesellschaft mbH & Co. Objekt Speyer KG Duesseldorf
1689 SUPLION Beteiligungsgesellschaft mbH Duesseldorf 50.0
1690 Survey Solutions B.V. Amsterdam
1691 Survey Trust Wilmington
1692 SUSA Mobilien-Vermietungsgesellschaft mbH Duesseldorf 50.0
1693 SUSIK Grundstücks-Vermietungsgesellschaft mbH Duesseldorf 50.0
1694 SUSIK Grundstücks-Vermietungsgesellschaft mbH & Co. Objekt Cottbus KG Duesseldorf
1695 Swabia 1 Limited Dublin
1696 Swabia 1. Vermögensbesitz-GmbH Frankfurt 100.0
1697 Sylvester (2001) Limited George Town 100.0
1698 TABA Grundstücks-Vermietungsgesellschaft mbH Schoenefeld 50.0
1699 TACET Grundstücks-Vermietungsgesellschaft mbH Duesseldorf 50.0
1700 TACET Grundstücks-Vermietungsgesellschaft mbH & Co. Objekt Hameln KG Duesseldorf
1701 TACET Grundstücks-Vermietungsgesellschaft mbH & Co. Objekt Nordsternpark KG Duesseldorf
1702 TACET Grundstücks-Vermietungsgesellschaft mbH & Co. Objekt Osnabrück KG Duesseldorf
1703 TACET Grundstücks-Vermietungsgesellschaft mbH & Co. Objekt Ulm KG Duesseldorf
1704 TACET Grundstücks-Vermietungsgesellschaft mbH & Co. Objekt Wendelstein KG i.L Duesseldorf
1705 TAGO Grundstücks-Vermietungsgesellschaft mbH Duesseldorf 50.0
1706 Tagus - Sociedade de Titularização de Creditos, S.A. Lisbon 100.0
1707 TAGUS Beteiligungsgesellschaft mbH Duesseldorf 50.0

Deutsche Bank 02 – Consolidated Financial Statement 389 Financial Report 2011 Additional Notes 44 – Shareholdings
Special Purpose Entities
Serial
No. Name of company Domicile of company Footnote
Share of
Capital
in %
1708 TAKIR Grundstücks-Vermietungsgesellschaft mbH Duesseldorf 100.0
1709 TARES Beteiligungsgesellschaft mbH Duesseldorf 100.0
1710 Taunus 2008-1 GmbH Frankfurt
1711 Taunus 2009-1 GmbH Frankfurt
1712 TEBA Beteiligungsgesellschaft mbH i.L. Schoenefeld 100.0
1713 TEBOR Grundstücks-Vermietungsgesellschaft mbH Duesseldorf 50.0
1714 TEMATIS Grundstücks-Vermietungsgesellschaft mbH Duesseldorf 100.0
1715 TERGO Grundstücks-Vermietungsgesellschaft mbH Duesseldorf 100.0
1716 TERRUS Grundstücks-Vermietungsgesellschaft mbH Duesseldorf 100.0
1717 TERRUS Grundstücks-Vermietungsgesellschaft mbH & Co. Objekt Bernbach KG Duesseldorf 5 0.0
1718 TESATUR Beteiligungsgesellschaft mbH Duesseldorf 50.0
1719 TESATUR Beteiligungsgesellschaft mbH & Co. Objekt Halle I KG Duesseldorf 100.0
1720 TESATUR Beteiligungsgesellschaft mbH & Co. Objekt Nordhausen I KG Duesseldorf 100.0
1721 Thaumat Holdings Limited Nicosia
1722 The Admiral Charitable Trust St. Peter Port
1723 The CAP Accumulation Trust Wilmington
1724 The CIG Trust St. Helier
1725 The GIII Accumulation Trust Wilmington
1726 The Glanmore Property Euro Fund Limited St. Peter Port
1727 The GPR Accumulation Trust Wilmington
1728 The Life Accumulation Trust Wilmington
1729 The Life Accumulation Trust II Wilmington
1730 The Life Accumulation Trust III Wilmington
1731 The Life Accumulation Trust IV Wilmington
1732 The Life Accumulation Trust IX Wilmington
1733 The Life Accumulation Trust V Wilmington
1734 The Life Accumulation Trust VIII Wilmington
1735 The Life Accumulation Trust X Wilmington
1736 The Life Accumulation Trust XI Wilmington
1737 The Life Accumulation Trust XII Wilmington
1738 The PEB Accumulation Trust Wilmington
1739 The SLA Accumulation Trust Wilmington
1740 THRENI Grundstücks-Vermietungsgesellschaft mbH i.L. Duesseldorf 50.0
1741 Tilney Group Limited Employee Incentive Trust St. Peter Port
1742 Tintin II SPC George Town
1743 Tintin III SPC George Town
1744 Tokutei Mokuteki Kaisha CREP Investment V Tokyo 5
1745 TONGA Grundstücks-Vermietungsgesellschaft mbH i.L. Duesseldorf 50.0
1746 TOSSA Grundstücks-Vermietungsgesellschaft mbH Duesseldorf 100.0
1747 TRAGO Grundstücks-Vermietungsgesellschaft mbH Duesseldorf 50.0
1748 TREMA Grundstücks-Vermietungsgesellschaft mbH Berlin 50.0
1749 TRENTO Grundstücks-Vermietungsgesellschaft mbH Duesseldorf 50.0
1750 TRINTO Beteiligungsgesellschaft mbH Schoenefeld 50.0
1751 TRIPLA Grundstücks-Vermietungsgesellschaft mbH Duesseldorf 100.0
1752 TRS 1 LLC Wilmington 100.0
1753 TRS Aria LLC Wilmington 100.0
1754 TRS Babson I LLC Wilmington 100.0
1755 TRS Bluebay LLC Wilmington 100.0
1756 TRS Bruin LLC Wilmington 100.0
1757 TRS Callisto LLC Wilmington 100.0
1758 TRS Camulos LLC Wilmington 100.0
1759 TRS Cypress LLC Wilmington 100.0
1760 TRS DB OH CC Fund Financing LLC Wilmington 100.0
1761 TRS Eclipse LLC Wilmington 100.0

Deutsche Bank 02 – Consolidated Financial Statement 390 Financial Report 2011 Additional Notes 44 – Shareholdings
Special Purpose Entities
Serial
No. Name of company Domicile of company Footnote
Share of
Capital
in %
1762 TRS Elara LLC Wilmington 100.0
1763 TRS Elgin LLC Wilmington 100.0
1764 TRS Elm LLC Wilmington 100.0
1765 TRS Feingold O'Keeffe LLC Wilmington 100.0
1766 TRS Fore LLC Wilmington 100.0
1767 TRS Ganymede LLC Wilmington 100.0
1768 TRS GSC Credit Strategies LLC Wilmington 100.0
1769 TRS Haka LLC Wilmington 100.0
1770 TRS HY FNDS LLC Wilmington 100.0
1771 TRS Io LLC Wilmington 100.0
1772 TRS Landsbanki Islands LLC Wilmington 100.0
1773 TRS Leda LLC Wilmington 100.0
1774 TRS Metis LLC Wilmington 100.0
1775 TRS Plainfield LLC Wilmington 100.0
1776 TRS Poplar LLC Wilmington 100.0
1777 TRS Quogue LLC Wilmington 100.0
1778 TRS Scorpio LLC Wilmington 100.0
1779 TRS SeaCliff LLC Wilmington 100.0
1780 TRS Stag LLC Wilmington 100.0
1781 TRS Stark LLC Wilmington 100.0
1782 TRS SVCO LLC Wilmington 100.0
1783 TRS Sycamore LLC Wilmington 100.0
1784 TRS Thebe LLC Wilmington 100.0
1785 TRS Tupelo LLC Wilmington 100.0
1786 TRS Venor LLC Wilmington 100.0
1787 TRS Watermill LLC Wilmington 100.0
1788 TUDO Grundstücks-Vermietungsgesellschaft mbH Duesseldorf 50.0
1789 TUGA Grundstücks-Vermietungsgesellschaft mbH Duesseldorf 50.0
1790 TXH Trust Wilmington
1791 TYRAS Beteiligungsgesellschaft mbH Duesseldorf 50.0
1792 Varapradha Real Estates Private Limited Hyderabad
1793 VARIS Beteiligungsgesellschaft mbH Duesseldorf 50.0
1794 VIERTE Fonds-Beteiligungsgesellschaft mbH Duesseldorf 50.0
1795 VIERTE PAXAS Treuhand- und Beteiligungsgesellschaft mbH Duesseldorf 50.0
1796 VIERUNDZWANZIGSTE PAXAS Treuhand- und Beteiligungsgesellschaft mbH Duesseldorf 50.0
1797 VIERZEHNTE PAXAS Treuhand- und Beteiligungsgesellschaft mbH Duesseldorf 50.0
1798 Village Hospitality LLC Wilmington 100.0
1799 Volga Investments Limited Dublin
1800 Warwick Lane Investments B.V. London 25.0
1801 Wheatfield GmbH & Co. KG Frankfurt 100.0
1802 Winchester House Master Trust Hamilton 7
1803 Wohnungs-Verwaltungsgesellschaft Moers mbH Duesseldorf 50.0
1804 Wohnungsgesellschaft HEGEMAG GmbH Duesseldorf 50.0
1805 XARUS Grundstücks-Vermietungsgesellschaft mbH Schoenefeld 50.0
1806 XELLUM Grundstücks-Vermietungsgesellschaft mbH Duesseldorf 50.0
1807 XENTIS Grundstücks-Vermietungsgesellschaft mbH Duesseldorf 50.0
1808 XERA Grundstücks-Vermietungsgesellschaft mbH Duesseldorf 50.0
1809 XERIS Grundstücks-Vermietungsgesellschaft mbH Duesseldorf 50.0
1810 ZABATUS Grundstücks-Vermietungsgesellschaft mbH Duesseldorf 50.0
1811 ZAKATUR Grundstücks-Vermietungsgesellschaft mbH Duesseldorf 50.0
1812 ZALLUS Beteiligungsgesellschaft mbH Duesseldorf 50.0
1813 Zamalik Limited Dublin
1814 ZANTOS Grundstücks-Vermietungsgesellschaft mbH Duesseldorf 50.0
1815 ZARAT Beteiligungsgesellschaft mbH Duesseldorf 50.0

Deutsche Bank 02 – Consolidated Financial Statement 391 Financial Report 2011 Additional Notes 44 – Shareholdings
Special Purpose Entities
Serial
No. Name of company Domicile of company Footnote
Share of
Capital
in %
1816 ZARAT Beteiligungsgesellschaft mbH & Co. Objekt Leben II KG Duesseldorf 93.3
1817 ZARGUS Grundstücks-Vermietungsgesellschaft mbH Duesseldorf 50.0
1818 ZEA Beteiligungsgesellschaft mbH Schoenefeld 25.0
1819 ZEDORA 3 GmbH & Co. KG Munich
1820 ZEDORA 36 GmbH & Co. KG Munich
1821 ZEHNTE PAXAS Treuhand- und Beteiligungsgesellschaft mbH Duesseldorf 50.0
1822 ZELAS Beteiligungsgesellschaft mbH Duesseldorf 50.0
1823 ZELAS Beteiligungsgesellschaft mbH & Co. Leben I KG Duesseldorf 93.1
1824 ZENO Grundstücks-Vermietungsgesellschaft mbH Duesseldorf 50.0
1825 ZEPTOS Grundstücks-Vermietungsgesellschaft mbH Duesseldorf 50.0
1826 ZEREVIS Grundstücks-Vermietungsgesellschaft mbH Duesseldorf 50.0
1827 ZERGUM Grundstücks-Vermietungsgesellschaft mbH Duesseldorf 50.0
1828 ZIBE Grundstücks-Vermietungsgesellschaft mbH Duesseldorf 50.0
1829 ZIDES Grundstücks-Vermietungsgesellschaft mbH Schoenefeld 50.0
1830 ZIMBEL Grundstücks-Vermietungsgesellschaft mbH Schoenefeld 50.0
1831 ZINUS Grundstücks-Vermietungsgesellschaft mbH Schoenefeld 50.0
1832 ZIRAS Grundstücks-Vermietungsgesellschaft mbH Schoenefeld 50.0
1833 ZITON Grundstücks-Vermietungsgesellschaft mbH Duesseldorf 50.0
1834 ZITRAL Beteiligungsgesellschaft mbH i.L. Duesseldorf 50.0
1835 ZITUS Grundstücks-Vermietungsgesellschaft mbH Schoenefeld 50.0
1836 ZONTUM Grundstücks-Vermietungsgesellschaft mbH Duesseldorf 50.0
1837 ZORUS Grundstücks-Vermietungsgesellschaft mbH Duesseldorf 50.0
1838 Zugspitze 2008-1 GmbH Frankfurt
1839 Zumirez Drive LLC Wilmington 100.0
1840 ZURET Beteiligungsgesellschaft mbH Duesseldorf 50.0
1841 ZWANZIGSTE PAXAS Treuhand- und Beteiligungsgesellschaft mbH Duesseldorf 50.0
1842 ZWEITE Fonds-Beteiligungsgesellschaft mbH Duesseldorf 50.0
1843 ZWEITE PAXAS Treuhand- und Beteiligungsgesellschaft mbH Duesseldorf 50.0
1844 ZWEIUNDZWANZIGSTE PAXAS Treuhand- und Beteiligungsgesellschaft mbH Duesseldorf 50.0
1845 ZWÖLFTE PAXAS Treuhand- und Beteiligungsgesellschaft mbH Duesseldorf 50.0
1846 ZYLUM Beteiligungsgesellschaft mbH Schoenefeld 25.0
Deutsche Bank 02 – Consolidated Financial Statement 392 Financial Report 2011 Additional Notes 44 – Shareholdings
Companies accounted for at equity
Serial
No. Name of company Domicile of company Footnote
Share of
Capital
in %
1847 AcadiaSoft, Inc. Wilmington 8.7
1848 Actavis Equity S.à r.l. Munsbach 9 0.0
1849 Admiral Private Equity SL Madrid 45.0
1850 Afinia Capital Group Limited Hamilton 40.0
1851 AKA Ausfuhrkredit-Gesellschaft mit beschränkter Haftung Frankfurt 28.8
1852 Argantis GmbH Cologne 50.0
1853 Argantis Private Equity GmbH & Co. KG Cologne 25.1
1854 Argantis Private Equity Gründer GmbH & Co. KG Cologne 36.5
1855 Arvoredo Investments Limited George Town 47.1
1856 Asia Retail Group Limited Douglas 9.4
1857 Atriax Holdings Limited (in member's voluntary liquidation) Southend-on-Sea 25.0
1858 Baigo Capital Partners Fund 1 Parallel 1 GmbH & Co. KG Bad Soden am Taunus 49.8
1859 BANKPOWER GmbH Personaldienstleistungen Frankfurt 30.0
1860 BATS Global Markets, Inc. Wilmington 6.7
1861 Bestra Gesellschaft für Vermögensverwaltung mit beschränkter Haftung Duesseldorf 49.0
1862 BFDB Tax Credit Fund 2011, Limited Partnership New York 10 51.0
1863 BHS tabletop AG Selb 28.9
1864 Bocaina L.P. George Town 10 53.3
1865 BrisConnections Holding Trust Kedron 35.6
1866 BrisConnections Investment Trust Kedron 35.6
1867 BVT-CAM Private Equity Beteiligungs GmbH Gruenwald 50.0
1868 BVT-CAM Private Equity Management & Beteiligungs GmbH Gruenwald 50.0
1869 Caherciveen Partners, LLC Chicago 20.0
1870 Challenger Infrastructure Fund Sydney 12.0
1871 Coalition Development Limited London 9.7
1872 Comfund Consulting Limited Bangalore 30.0
1873 Craigs Investment Partners Limited Tauranga 49.9
1874 Danube Properties S.à r.l. Luxembourg 25.0
1875 DB Alpha Discovery Fund Limited George Town 9 0.0
1876 DB Development Holdings Limited Larnaca 49.0
1877 DB Funding (Gibraltar) Limited Gibraltar 10 100.0
1878 DB Real Estate Global Opportunities IB (Offshore), L.P. Camana Bay 34.6
1879 DBG Eastern Europe II Limited Partnership St. Helier 25.9
1880 DBG Osteuropa-Holding GmbH i.L. Frankfurt 50.0
1881 DD Konut Finansman A.S. Istanbul 49.0
1882 Deutsche Börse Commodities GmbH Eschborn 16.2
1883 Deutsche Financial Capital I Corp. Greensboro 50.0
1884 Deutsche Financial Capital Limited Liability Company Greensboro 50.0
1885 Deutsche Private Equity Fund Sydney 8.0
1886 Deutsche Regis Partners Inc Makati City 49.0
1887 Deutsche Zurich Pensiones Entidad Gestora de Fondos de Pensiones, S.A. Barcelona 50.0
1888 Deutscher Pensionsfonds Aktiengesellschaft Bonn 25.1
1889 DIL Internationale Leasinggesellschaft mbH Duesseldorf 50.0
1890 DMG & Partners Securities Pte Ltd Singapore 49.0
1891 Domus Beteiligungsgesellschaft der Privaten Bausparkassen mbH Berlin 21.1
1892 DPG Deutsche Performancemessungs-Gesellschaft für Wertpapierportfolios mbH Frankfurt 20.0
1893 Duxton Asset Management Pte. Ltd. Singapore 19.9
1894 DWS Global Agricultural Land & Opportunities Fund Limited George Town 1.1
1895 Edmonton Holding Limited George Town 9 0.0
1896 Elbe Properties S.à r.l. Luxembourg 25.0
1897 EOL2 Holding B.V. Amsterdam 45.0
1898 eolec Issy-les-Moulineaux 33.3
1899 equiNotes Management GmbH Duesseldorf 50.0
1900 Erica Società a Responsabilità Limitata Milan 40.0
Companies accounted for at equity

Deutsche Bank 02 – Consolidated Financial Statement 393 Financial Report 2011 Additional Notes 44 – Shareholdings
Companies accounted for at equity
Serial
No. Name of company Domicile of company Footnote
Share of
Capital
in %
1901 EVROENERGIAKI S.A. Alexandroupolis 40.0
1902 Financiere Scaprim Paris 35.0
1903 Fondo Immobiliare Chiuso Piramide Globale Milan 4 42.5
1904 FREUNDE DER EINTRACHT FRANKFURT Aktiengesellschaft Frankfurt 30.8
1905 Fünfte SAB Treuhand und Verwaltung GmbH & Co. "Leipzig-Magdeburg" KG Bad Homburg 40.7
1906 Fünfte SAB Treuhand und Verwaltung GmbH & Co. Dresden "Louisenstraße" KG Bad Homburg 30.6
1907 G.O. IB-SIV Feeder, L.L.C. Wilmington 15.7
1908 Gemeng International Energy Group Company Limited Taiyuan 9.0
1909 German Public Sector Finance B.V. Amsterdam 50.0
1910 Gesellschaft bürgerlichen Rechts Industrie- und Handelskammer/Rheinisch-Westfälische Börse Duesseldorf 10.0
1911 Gesellschaft für Kreditsicherung mit beschränkter Haftung Berlin 36.7
1912 GIPF-I Holding Corp. Calgary 2.0
1913 giropay GmbH Frankfurt 33.3
1914 Gordian Knot Limited London 32.4
1915 Graphite Resources Holdings Limited Newcastle upon Tyne 10 70.0
1916 Graphite Resources (Knightsbridge) Limited Newcastle upon Tyne 45.0
1917 Great Future International Limited Road Town 43.0
1918 Grundstücksgesellschaft Köln-Ossendorf VI GbR Troisdorf 44.9
1919 Grundstücksgesellschaft Leipzig Petersstraße GbR Troisdorf 33.2
1920 Grundstücksverwaltungsgesellschaft Tankstelle Troisdorf Spich GbR Troisdorf 33.0
1921 Gulf Home Finance Riyadh 40.0
1922 Hanoi Building Commercial Joint Stock Bank Hanoi 10.0
1923 Harvest Fund Management Company Limited Shanghai 30.0
1924 Hua Xia Bank Company Limited Beijing 19.9
1925 Huamao Property Holdings Ltd. George Town 9 0.0
1926 Hydro S.r.l. Rome 45.0
1927 I.B.T. Lighting S.p.A. Milan 34.0
1928 iCON Infrastructure Management Limited St. Peter Port 10 99.9
1929 iFast India Investments Pte. Ltd. Singapore 49.0
1930 IG BCE Mitglieder-Service GmbH Hanover 50.0
1931 ILV Immobilien-Leasing Verwaltungsgesellschaft Düsseldorf mbH Duesseldorf 50.0
1932 Immobilienfonds Büro-Center Erfurt Am Flughafen Bindersleben II GbR Troisdorf 50.0
1933 Inn Properties S.à r.l. Luxembourg 25.0
1934 Interessengemeinschaft Frankfurter Kreditinstitute GmbH Frankfurt 23.3
1935 Isar Properties S.à r.l. Luxembourg 25.0
1936 ISWAP Limited London 16.4
1937 Japan Value Added Fund One Limited Tokyo 9 0.0
1938 Jaya Holdings Limited Singapore 20.6
1939 K & N Kenanga Holdings Bhd Kuala Lumpur 16.6
1940 Kenanga Deutsche Futures Sdn Bhd Kuala Lumpur 27.0
1941 Kinneil Leasing Company London 35.0
1942 KölnArena Beteiligungsgesellschaft mbH Cologne 20.8
1943 Lion Indian Real Estate Fund L.P. George Town 9 0.0
1944 Lion Residential Holdings S.à r.l. Luxembourg 17.4
1945 London Dry Bulk Limited London 49.0
1946 Main Properties S.à r.l. Luxembourg 25.0
1947 Marblegate Special Opportunities Master Fund, L.P. George Town 39.6
1948 Markit Group Holdings Limited London 6.4
1949 MidOcean (Europe) 2000-A LP St. Helier 19.9
1950 MidOcean (Europe) 2000-B LP St. Helier 19.9
1951 MidOcean (Europe) 2002 LP St. Helier 15.9
1952 MidOcean (Europe) 2003 LP St. Helier 20.0
1953 MidOcean Partners, LP New York 20.0
1954 Millennium Marine Rail, L.L.C. Elizabeth 50.0

Deutsche Bank 02 – Consolidated Financial Statement 394 Financial Report 2011 Additional Notes 44 – Shareholdings
Companies accounted for at equity
Serial
No. Name of company Domicile of company Footnote
Share of
Capital
in %
1955 Miller Brothers Retail Limited (in member's voluntary liquidation) Doncaster 40.0
1956 Mittelstand Co-Investment Portfolio GmbH & Co. KG Frankfurt 0.7
1957 Nexus LLC Wilmington 11.9
1958 North Coast Wind Energy Corp. Vancouver 10 96.7
1959 Novacare Laval-sur-Vologne 23.7
1960 Oder Properties S.à r.l. Luxembourg 25.0
1961 Omnium Leasing Company London 7.1
1962 OP Cash Euro Plus Luxembourg 4 25.1
1963 OPPENHEIM PRIVATE EQUITY Holding GmbH & Co. KG Cologne 0.4
1964 Otto Lilienthal Fünfte GmbH & Co. KG Munich 19.6
1965 P.F.A.B. Passage Frankfurter Allee Betriebsgesellschaft mbH Berlin 22.2
1966 Pago e Transaction Services GmbH Cologne 50.0
1967 Parkhaus an der Börse GbR Cologne 37.7
1968 PERILLA Beteiligungsgesellschaft mbH Duesseldorf 50.0
1969 Pilgrim America High Income Investments Ltd. George Town 14.9
1970 Plenary Group (Canada) Limited Vancouver 20.0
1971 Plenary Group Unit Trust Melbourne 20.9
1972 Private Capital Portfolio L.P. London 38.2
1973 Private Partners AG Zurich 30.0
1974 PT. Deutsche Verdhana Indonesia Jakarta 40.0
1975 PX Holdings Limited Stockton on Tees 49.0
1976 QPL Lux, S.à r.l. Luxembourg 6.0
1977 QW Holdings, LLC Wilmington 12.2
1978 Rama Cylinders Private Limited Mumbai 26.8
1979 Regent's Park Estates (GP) Limited Douglas 50.0
1980 Regent's Park Estates Limited Partnership Douglas 50.0
1981 Relax Holding S.à r.l. Luxembourg 20.0
1982 REON - Park Wiatrowy I Sp. z o.o. Warsaw 50.0
1983 REON-Park Wiatrowy II Sp. z o.o. Warsaw 50.0
1984 REON-Park Wiatrowy IV Sp. z o.o. Warsaw 50.0
1985 Residential Real Estate Partners III, LLC Wilmington 10.0
1986 Rhine Properties S.à r.l. Luxembourg 25.0
1987 Roc Capital Group, LLC Wilmington 8.5
1988 Roc Capital Management, L.P. Wilmington 8.5
1989 Rongde Asset Management Company Limited Beijing 40.7
1990 Rosen Consulting Group, LLC Wilmington 40.0
1991 RPWire LLC Wilmington 33.3
1992 S/D Partnership Johannesburg 9 0.0
1993 Sakaras Holding Limited Birkirkara 9 0.0
1994 Satrix Managers (Pty) Ltd Johannesburg 50.0
1995 Schiffahrtsgesellschaft MS "Simon Braren" GmbH & Co KG Kollmar 25.5
1996 Shunfeng Catering & Hotel Management Co., Ltd. Beijing 6.4
1997 Spin Holdco Inc. Wilmington 35.0
1998 SRC Security Research & Consulting GmbH Bonn 22.5
1999 Starpool Finanz GmbH Berlin 50.0
2000 Station Holdco LLC Wilmington 25.0
2001 SunAmerica Affordable Housing Partners 47 Los Angeles 10.3
2002 Teesside Gas Processing Plant Limited London 31.3
2003 Teesside Gas Transportation Limited London 45.0
2004 The Glanmore Property Fund Limited St. Peter Port 5.3
2005 The Portal Alliance LLC Wilmington 10.0
2006 The Topiary Fund II Public Limited Company Dublin 3.7
2007 The Topiary Select Equity Trust George Town 10 59.1
2008 THG Beteiligungsverwaltung GmbH Hamburg 50.0

Deutsche Bank 02 – Consolidated Financial Statement 395 Financial Report 2011 Additional Notes 44 – Shareholdings
Companies accounted for at equity
Serial
No. Name of company Domicile of company Footnote
Share of
Capital
in %
2009 TLDB Partners Limited Tokyo 50.0
2010 Trave Properties S.à r.l. Luxembourg 25.0
2011 Triton Gesellschaft für Beteiligungen mbH Frankfurt 33.1
2012 Turquoise Global Holdings Limited London 7.1
2013 VCG Venture Capital Gesellschaft mbH & Co. Fonds III KG Munich 37.0
2014 VCG Venture Capital Gesellschaft mbH & Co. Fonds III Management KG Munich 26.7
2015 VCM / BHF Initiatoren GmbH & Co. Beteiligungs KG Munich 48.8
2016 VCM Shott Private Equity Advisors, LLC Wilmington 50.0
2017 VCM VII European Mid-Market Buyout GmbH & Co. KG Cologne 28.8
2018 Verwaltung ABL Immobilienbeteiligungsgesellschaft mbH Hamburg 50.0
2019 Volbroker.com Limited London 23.8
2020 WERSE Schiffahrts GmbH & Co. KG MS "DYCKBURG" Muenster 41.5
2021 Weser Properties S.à r.l. Luxembourg 25.0
2022 WestLB Venture Capital Management GmbH & Co. KG Munich 50.0
2023 Wilson HTM Investment Group Ltd Brisbane 19.5
2024 WohnBauEntwicklungsgesellschaft München-Haidhausen mbH & Co. KG i.L. Eschborn 33.3
2025 WohnBauEntwicklungsgesellschaft München-Haidhausen Verwaltungs-mbH i.L. Eschborn 33.3
2026 Xchanging etb GmbH Frankfurt 49.0
2027 zeitinvest-Service GmbH Frankfurt 25.0
2028 Zhong De Securities Co., Ltd Beijing 33.3
2029 ZINDUS Beteiligungsgesellschaft mbH Duesseldorf 50.0
2030 ZYRUS Beteiligungsgesellschaft mbH Schoenefeld 25.0
2031 ZYRUS Beteiligungsgesellschaft mbH & Co. Patente I KG Schoenefeld 20.4

Deutsche Bank 02 – Consolidated Financial Statement 396 Financial Report 2011 Additional Notes 44 – Shareholdings
Other companies, where the holding equals or exceeds 20%
Serial
No. Name of company Domicile of company Footnote
Share of
Capital
in %
2032 AFFIRMATUM Beteiligungsgesellschaft mbH i.L. Duesseldorf 11 50.0
2033 Alpha DB Lindsell Limited S.C.S. Luxembourg 12 100.0
2034 Belzen Pty. Limited Sydney 12 100.0
2035 Benefit Trust GmbH Luetzen-Gostau 12 100.0
2036 Beta DB Lindsell Limited S.C.S. Luxembourg 12 100.0
2037 BLI Internationale Beteiligungsgesellschaft mbH Duesseldorf 11 32.0
2038 Blue Ridge Trust Wilmington 11 26.7
2039 CANDOR Vermietungsgesellschaft mbH & Co. Kommanditgesellschaft i.L. Duesseldorf 13 34.4
2040 Crest Nicholson Holdings Limited Chertsey 14 20.3
2041 DB (Barbados) SRL Christ Church 12 100.0
2042 DB (Gibraltar) Holdings No. 2 Limited Gibraltar 12 100.0
2043 DB Advisors SICAV Luxembourg 12 100.0
2044 DB Lindsell Limited Gibraltar 12 100.0
2045 DB Petri LLC Wilmington 12 100.0
2046 DBR Investments Co. Limited George Town 12 100.0
2047 3-DD Digital Media AG i.L. Munich 15 27.1
2048 Deutsche River Investment Management Company S.à r.l. Luxembourg 11 49.0
2049 Deutz-Mülheim Grundstücksgesellschaft mbH Duesseldorf 11 40.2
2050 Dogan Gazetecilik A.S. Istanbul 16 22.0
2051 EQR-Woodland Park A Limited Partnership Wilmington 12 100.0
2052 EQR-Woodland Park A, LLC Wilmington 12 100.0
2053 EQR-Woodland Park B Limited Partnership Wilmington 12 100.0
2054 EQR-Woodland Park B, LLC Wilmington 12 100.0
2055 EQR-Woodland Park C Limited Partnership Wilmington 12 100.0
2056 EQR-Woodland Park C, LLC Wilmington 12 100.0
2057 European Private Equity Portfolio (PE-EU) GmbH & Co. KG Munich 15 20.4
2058 FRM Levered Diversified Fund LP Wilmington 14 49.2
2059 Global Salamina, S.L. Madrid 13 30.0
2060 Goldman Sachs Multi-Strategy Portfolio XI, LLC Wilmington 10 100.0
2061 Gottex ABI Master Fund Limited George Town 11 35.3
2062 Grundstücksvermietungsgesellschaft Wilhelmstr. mbH Duesseldorf 12 100.0
2063 HealthCap 1999 GbR Berlin 15 41.5
2064 HQ Limited Partnership Tokyo 11 37.5
2065 Immobilien-Vermietungsgesellschaft Schumacher GmbH & Co. Objekt Rolandufer KG Berlin 11 20.5
2066 IZI Düsseldorf Informations-Zentrum Immobilien Gesellschaft mit beschränkter Haftung Duesseldorf 17 21.6
2067 IZI Düsseldorf Informations-Zentrum Immobilien GmbH & Co. Kommanditgesellschaft Duesseldorf 17 21.6
2068 JG Japan Grundbesitzverwaltungsgesellschaft mbH i.L. Eschborn 12 100.0
2069 Key Capital Private Limited Dublin 17 50.0
2070 LEA Grundstücks-Vermietungsgesellschaft mbH & Co. Objekt Esslingen OHG Duesseldorf 11 48.4
2071 Lindsell Finance Limited Valletta 12 100.0
2072 Lion Global Infrastructure Fund Limited St. Peter Port 11 50.0
2073 M Cap Finance Mittelstandsfonds GmbH & Co. KG Frankfurt 15 99.7
2074 Manuseamento de Cargas - Manicargas, S.A. Matosinhos 13 38.3
2075 Memax Pty. Limited Sydney 12 100.0
2076 Merit Capital Advance, LLC Wilmington 15 20.0
2077 Metro plus Grundstücks-Vermietungsgesellschaft mbH Duesseldorf 11 40.0
2078 MFG Flughafen-Grundstücksverwaltungsgesellschaft mbH & Co. BETA KG Gruenwald 11 29.6
2079 Midsel Limited London 12 100.0
2080 Mount Hope Community Center Fund, LLC Wilmington 15 50.0
2081 Mountaintop Energy Holdings LLC Wilmington 11 49.9
2082 Nortfol Pty. Limited Sydney 12 100.0
2083 OPPENHEIM Buy Out GmbH & Co. KG Cologne 11 27.7
2084 PTL Fleet Sales, Inc. Wilmington 12 100.0
2085 Safron AMD Partners, LP George Town 15 22.0
Other companies, where the holding equals or exceeds 20%

Deutsche Bank 02 – Consolidated Financial Statement 397 Financial Report 2011 Additional Notes 44 – Shareholdings
Other companies, where the holding equals or exceeds 20%
Serial
No. Name of company Domicile of company Footnote
Share of
Capital
in %
2086 Safron NetOne Partners, L.P. George Town 15 21.7
2087 Schumacher Beteiligungsgesellschaft mbH Cologne 11 33.2
2088 SCITOR Grundstücks-Vermietungsgesellschaft mbH & Co. Objekt Heiligenstadt KG Duesseldorf 12 71.1
2089 SENA Grundstücks-Vermietungsgesellschaft mbH & Co. Objekt Kamenz KG Duesseldorf 12 100.0
2090 SOLON Grundstücks-Vermietungsgesellschaft mbH & Co. Objekt Heizkraftwerk Halle KG i.L. Halle/Saale 11 30.5
2091 STC Financing Ippan Shadan Hojin Tokyo 11 50.0
2092 SUBLICA Grundstücks-Vermietungsgesellschaft mbH & Co. Objekt Promohypermarkt
Gelsenkirchen KG
Duesseldorf 11 48.7
2093 Sundial Beteiligungsgesellschaft mbH Frankfurt 12 100.0
2094 TIEDO Grundstücks-Vermietungsgesellschaft mbH Duesseldorf 11 50.0
2095 TIEDO Grundstücks-Vermietungsgesellschaft mbH & Co. Objekt Lager Nord KG Duesseldorf 11 25.0
2096 Triton Fund III G L.P. St. Helier 10 62.5
2097 Willem S.A. Luxembourg 12 95.0
2098 Zenwix Pty. Limited Sydney 12 100.0
Deutsche Bank 02 – Consolidated Financial Statement 398 Financial Report 2011 Additional Notes 44 – Shareholdings
Holdings in large corporations, where the holding exceeds 5% of voting rights
Serial
No. Name of company Domicile of company Footnote
Share of
Capital
in %
2099 Abode Mortgage Holdings Corporation Vancouver 8.5
2100 Abraaj Capital Holdings Limited George Town 8.8
2101 Accunia A/S Copenhagen 9.9
2102 BBB Bürgschaftsbank zu Berlin-Brandenburg GmbH Berlin 5.6
2103 Bürgschaftsbank Brandenburg GmbH Potsdam 8.5
2104 Bürgschaftsbank Mecklenburg-Vorpommern GmbH Schwerin 8.4
2105 Bürgschaftsbank Sachsen GmbH Dresden 6.3
2106 Bürgschaftsbank Sachsen-Anhalt GmbH Magdeburg 8.2
2107 Bürgschaftsbank Schleswig-Holstein Gesellschaft mit beschränkter Haftung Kiel 5.7
2108 Bürgschaftsbank Thüringen GmbH Erfurt 8.7
2109 Bürgschaftsgemeinschaft Hamburg GmbH Hamburg 8.7
2110 ConCardis Gesellschaft mit beschränkter Haftung Frankfurt 16.8
2111 EFG Eurobank Properties S.A. Athens 5.8
2112 EURO Kartensysteme Gesellschaft mit beschränkter Haftung Frankfurt 16.8
2113 Focus Minerals Ltd Perth 5.5
2114 Hayes Lemmerz International, Inc. Wilmington 10.1
2115 HumanOptics AG Erlangen 11.2
2116 HYPOPORT AG Berlin 9.7
2117 Ingenious Media Active Capital Limited St. Peter Port 13.9
2118 IVG Institutional Funds GmbH Frankfurt 6.0
2119 KRON AS Bryne 9.8
2120 Liquiditäts-Konsortialbank Gesellschaft mit beschränkter Haftung Frankfurt 8.5
2121 NexPak Corporation Wilmington 6.5
2122 NÜRNBERGER Beteiligungs-Aktiengesellschaft Nuremberg 6.6
2123 OTCDeriv Limited London 7.1
2124 Philipp Holzmann Aktiengesellschaft i.I. Frankfurt 19.5
2125 Prader Bank S.p.A. Bolzano 9.0
2126 Private Export Funding Corporation Wilmington 7.5
2127 Reorganized RFS Corporation Wilmington 6.2
2128 Saarländische Investitionskreditbank Aktiengesellschaft Saarbruecken 11.8
2129 SearchMedia Holdings Limited George Town 9.8
2130 Società per il Mercato dei Titoli di Stato - Borsa Obbligazionaria Europea S.p.A. Rome 5.0
2131 The Clearing House Association L.L.C. Wilmington 9.1
2132 United Information Technology Co. Ltd George Town 12.2
2133 3W Power S.A. Luxembourg 9.2
2134 Yieldbroker Pty Limited Sydney 16.7
2135 Yukon-Nevada Gold Corp. Vancouver 12.2
Holdings in large corporations, where the holding exceeds 5% of voting rights

Confirmations
Independent Auditors’ Report – 400 Responsibility Statement by the Management Board – 402 Report of the Supervisory Board – 403

Deutsche Bank 03 – Confirmations 400 Financial Report 2011 Independent Auditors’ Report
To Deutsche Bank Aktiengesellschaft, Frankfurt am Main
Report on the consolidated financial statements
We have audited the accompanying consolidated financial statements of Deutsche Bank Aktiengesellschaft and its subsidiaries, which comprise the consolidated statement of income, the consolidated statement of comprehensive income, the consolidated balance sheet, the consolidated statement of changes in equity, the consolidated statement of cash flows, and notes to the consolidated financial statements for the business year from January 1 to December 31, 2011.
Management’s Responsibility for the Consolidated Financial Statements The management of Deutsche Bank Aktiengesellschaft is responsible for the preparation of these consolidated financial statements. This responsibility includes preparing these consolidated financial statements in accor-dance with International Financial Reporting Standards as adopted by the EU, the supplementary requirements of German law pursuant to § [Article] 315a Abs. [paragraph] 1 HGB [Handelsgesetzbuch: Geman Commercial Code] and full IFRS to give a true and fair view of the net assets, financial position and results of operations of the group in accordance with these requirements. The company’s management is also responsible for the internal controls that management determines are necessary to enable the preparation of consolidated finan-cial statements that are free from material misstatement, whether due to fraud or error.
Auditors’ Responsibility Our responsibility is to express an opinion on these consolidated financial statements based on our audit. We conducted our audit in accordance with § 317 HGB and German generally accepted standards for the audit of financial statements promulgated by the Institut der Wirtschaftsprüfer [Institute of Public Auditors in Germany] (IDW) as well as in supplementary compliance with the standards of the Public Company Accounting Oversight Board (United States). Accordingly, we are required to comply with ethical requirements and plan and perform the audit to obtain reasonable assurance about whether the consolidated financial statements are free from material misstatement.
An audit involves performing audit procedures to obtain audit evidence about the amounts and disclosures in the consolidated financial statements. The selection of audit procedures depends on the auditor’s professional judgment. This includes the assessment of the risks of material misstatement of the consolidated financial statements, whether due to fraud or error. In assessing those risks, the auditor considers the internal control system relevant to the entity’s preparation of the consolidated financial statements that give a true and fair view. The aim of this is to plan and perform audit procedures that are appropriate in the given circumstances, but not for the purpose of expressing an opinion on the effectiveness of the group’s internal control system. An audit also includes evaluating the appropriateness of accounting policies used and the reasonableness of account-ing estimates made by management, as well as evaluating the overall presentation of the consolidated finan-cial statements.
We believe that the audit evidence we have obtained is sufficient and appropriate to provide a basis for our audit opinion.
Independent Auditors’ Report

Deutsche Bank 03 – Confirmations 401 Financial Report 2011 Independent Auditors’ Report
Audit Opinion Pursuant to § 322 Abs.3 Satz 1 HGB, we state that our audit of the consolidated financial statements has not led to any reservations.
In our opinion, based on the findings of our audit, the consolidated financial statements comply in all material respects with IFRSs as adopted by the EU, the supplementary requirements of German commercial law pur-suant to § 315a Abs. 1 HGB and full IFRS and give a true and fair view of the net assets and financial position of the Group as at December 31, 2011 as well as the results of operations for the business year then ended, in accordance with these requirements.
Report on the Group Management Report
We have audited the accompanying group management report of Deutsche Bank Aktiengesellschaft for the business year from January 1 to December 31, 2011. The management of Deutsche Bank Aktiengesellschaft is responsible for the preparation of the group management report in compliance with the applicable require-ments of German commercial law pursuant to § [Article] 315a Abs. [paragraph] 1 HGB [Handelsgesetzbuch: German Commercial Code]. We are required to conduct our audit in accordance with § 317 Abs. 2 HGB and German generally accepted standards for the audit of the group management report promulgated by the Insti-tut der Wirtschaftsprüfer [Institute of Public Auditors in Germany] (IDW). Accordingly, we are required to plan and perform the audit of the group management report to obtain reasonable assurance about whether the group management report is consistent with the consolidated financial statements and the audit findings, and as a whole provides a suitable view of the Group’s position and suitably presents the opportunities and risks of future development.
Pursuant to § 322 Abs. 3 Satz 1 HGB, we state that our audit of the group management report has not led to any reservations.
In our opinion, based on the findings of our audit of the consolidated financial statements and group manage-ment report, the group management report is consistent with the consolidated financial statements, and as a whole provides a suitable view of the Group’s position and suitably presents the opportunities and risks of future development.
Frankfurt am Main, March 8, 2012
KPMG AG Wirtschaftsprüfungsgesellschaft
Dielehner Wirtschaftsprüfer
Bose Wirtschaftsprüfer

Deutsche Bank 03 – Confirmations 402 Financial Report 2011 Responsibility Statement by the Management Board
To the best of our knowledge, and in accordance with the applicable reporting principles, the consolidated financial statements give a true and fair view of the assets, liabilities, financial position and profit or loss of the Group, and the Group management report includes a fair review of the development and performance of the business and the position of the Group, together with a description of the principal opportunities and risks as-sociated with the expected development of the Group.
Frankfurt am Main, March 6, 2012
Responsibility Statement by the Management Board
Josef Ackermann Hugo Bänziger Jürgen Fitschen
Anshuman Jain Stefan Krause Hermann-Josef Lamberti
Rainer Neske

Deutsche Bank Report of the Supervisory Board 403 Financial Report 2011
The economic environment in 2011 was influenced by the sovereign debt crisis in the euro area. The tensions connected to this on the financial markets led to a clear slowing of the global economy during the second half of the year. In our home market Germany, economic activity was robust, although the German economy lost momentum due to the economic slowdown towards the end of the year.
In 2011, Deutsche Bank continued to focus on the implementation of its strategy. We expanded our Private and Business Clients, Private Wealth Management and Global Transaction Banking Business Divisions through the ongoing integration of Sal. Oppenheim and Postbank as well as parts of ABN AMRO Bank’s commercial bank-ing business in the Netherlands. As a result, we firmly strengthened our second revenues engine alongside investment banking. The recalibration of our investment banking business led to a clear improvement in Deutsche Bank’s risk profile.
Strengthening Deutsche Bank’s capital position continues to be a top priority for the Management Board and Supervisory Board. In a challenging market environment, Deutsche Bank raised its core Tier 1 capital ratio to 9.5 % and expanded its liquidity reserves. For this year’s dividend proposal, we took into account the higher capital requirements due to regulatory provisions, in particular, those arising in connection with Basel 2.5 and Basel 3 as well as the regulations of the European Banking Authority. Furthermore, the ongoing integration of Deutsche Bank’s acquisitions continued to pose big challenges. We would like to thank the Management Board and the bank’s employees for their great personal dedication.
As in previous years, we again addressed numerous statutory and regulatory changes in 2011. Last year, we extensively discussed the bank’s economic and financial development, its operating environment, risk man-agement system, planning and internal control system. We held in-depth discussions with the Management Board on the bank’s strategy and its implementation. The Management Board reported to us regularly, without delay and comprehensively on business policies and other fundamental issues relating to management and corporate planning, the bank’s financial development and earnings situation, the bank’s risk, liquidity and capi-tal management along with material lawsuits and transactions and events that were of significant importance to the bank. We advised the Management Board and monitored its management of business. We were involved in decisions of fundamental importance. Regular discussions were also held between the Chairman of the Management Board and the Chairman of the Supervisory Board dealing with important topics and upcoming decisions. Between meetings, the Management Board kept us informed in writing of important events. Resolu-tions were passed by circulation procedure when necessary between the meetings.
Meetings of the Supervisory Board
The Supervisory Board held six meetings in 2011.
At the first meeting of the year on February 2, 2011, we discussed the development of business in the fourth quarter of 2010 and the 2010 financial year, along with a comparison of the plan-actual figures. The dividend proposal for the year 2010 as well as the corporate planning for the years 2011 to 2013 were noted with ap-proval. Mr. Neske gave a progress report on the integration of Deutsche Postbank AG. Based on the Chair-man’s Committee’s proposal, we approved amendments to the Terms of Reference for the Management Board including the Business Allocation Plan. We gave our consent to Dr. Börsig and Dr. Eick being named in the Annual Report as financial experts in accordance with German and U.S. law and confirmed the continued independence of all of the members of the Audit Committee. Furthermore, we approved an alignment of the Management Board members’ service agreements to new regulatory requirements, discussed the basis for calculating the Management Board members’ variable compensation for 2010 and subsequently determined
Report of the Supervisory Board
Deutsche Bank Report of the Supervisory Board 404 Financial Report 2011
the Management Board’s compensation – with the involvement of an external, independent legal advisor and compensation consultant – while taking into account the recommendations of the Chairman’s Committee.
At the financial statements meeting on March 11, 2011, based on the Audit Committee’s recommendation and after a discussion with the auditor, we approved the Consolidated Financial Statements and Annual Financial Statements for 2010. Furthermore, the Compliance and Anti-Money Laundering Report was discussed, along with the Remuneration Report in accordance with the Regulation on Remuneration at Financial Institutions (InstitutsVergV) for the year 2010. We approved the sale of the Taunusanlage 12 property in Frankfurt am Main to a closed-end DWS real estate fund as well as the bank’s concurrent lease-back. Changes in the composi-tion of the Regional Advisory Boards and Advisory Councils in Germany were presented to us, and we ap-proved the resolution proposals for the Agenda of the General Meeting 2011.
At the meeting on the day before the General Meeting, we discussed the procedures for the General Meeting and the announced counterproposals as well as the status of litigation in connection with the General Meetings 2004 – 2010. As necessary, resolutions were approved.
At an extraordinary meeting on July 25, 2011, we extended the Management Board appointments of Mr. Fitschen, Mr. Jain and Mr. Neske and resolved to appoint Mr. Fitschen and Mr. Jain Co-Chairmen of the Management Board with effect from the end of the Ordinary General Meeting 2012. We agreed with Dr. Ackermann that his appointment would end with simultaneous effect. Dr. Börsig notified the Supervisory Board that he would be stepping down as member and Chairman of the Supervisory Board with effect from the end of the Ordinary General Meeting 2012.
At the meeting on July 26, 2011, we discussed the development of the bank’s business during the first six months of 2011 and the risk profile, and we examined the recalibration of the Corporate & Investment Bank (CIB) Group Division. Dr. Ackermann reported on the results of the stress tests of the European Banking Au-thority (EBA), and we received status reports on the integration of Postbank, material litigation cases and the bank’s capital and liquidity management. Based on the Chairman’s Committee’s proposal, we approved the payment of a pension award to Mr. Cohrs and elected Dr. Siegert member of the Audit Committee and Ms. Labarge member of the Risk Committee, each with effect from August 1, 2011. Furthermore, we reviewed the list of actions requiring the Supervisory Board’s approval in accordance with Section 13 of the Articles of Association.
At the last meeting of the year on October 25, 2011, the Management Board informed us of the development of business in the third quarter and the current status of developments relating to the bank’s IT infrastructure. Together with the Management Board, we discussed in detail the bank’s ongoing strategic development along with the corresponding targets and planned measures, the restructuring of the bank’s European subsidiaries and the Human Resources Report.
Deutsche Bank Report of the Supervisory Board 405 Financial Report 2011
The Committees of the Supervisory Board
The Chairman’s Committee met five times during the reporting period. Between the meetings, the Chairman of the Chairman’s Committee spoke with the Committee members regularly about issues of major importance. The Committee examined, in particular, the new statutory and regulatory requirements for Management Board compensation and the necessity arising from this to adjust the Management Board members’ service agree-ments, along with the preparations for determining the variable Management Board compensation for the 2010 financial year. The Committee also addressed issues of appointing members to the Supervisory Board’s com-mittees and extending the appointments to the Management Board of Mr. Fitschen, Mr. Jain and Mr. Neske. The Committee intensively addressed the succession of Dr. Ackermann and developed a corresponding pro-posal for the Supervisory Board. Amendments required to the Terms of Reference and to the Business Alloca-tion Plan for the Management Board were also discussed, in addition to the Compensation Report. When necessary, resolutions were passed or recommendations were issued for the Supervisory Board’s approval. The Chairman’s Committee gave its approval for the Management Board members’ ancillary activities and directorships at other companies, organizations and institutions.
At its six meetings, the Risk Committee addressed in particular credit, liquidity, refinancing, country, market and operational risks, as well as legal and reputational risks. In detail, the Committee discussed the bank’s risk position and provisions for credit losses, its capital funding, the risk management systems and the effects on the bank’s risk profile from the Postbank acquisition carried out last year. Another center of focus was placed on the general economic developments, the European sovereign debt crisis and the political changes in sev-eral countries in the Middle East and North Africa as well as their effects on the bank and its risk position. In addition to the development of the material legal risks in the individual business divisions and regions, discus-sions were held on minimizing the risks of fraud and on the effects on the bank and its risk position from changes in regulatory rules. Furthermore, the Committee focused on the development of the bank’s funding and liquidity positions, its risk absorption capacity, the stress test of the European Banking Authority and their new, sector-wide capital funding requirements. Also, global industry portfolios were presented according to a specified plan and discussed at length. The bank’s exposures subject to mandatory approval under German law and Articles of Association were discussed in detail. Where necessary, the Risk Committee gave its ap-proval.
The Audit Committee met six times in 2011. Representatives of the bank’s auditor attended all of these meet-ings. Subjects covered were the audit of the Annual Financial Statements and Consolidated Financial State-ments for 2010, the Interim Reports, as well as Forms 20 F and 6 K for the U.S. Securities and Exchange Commission (SEC). The Committee dealt with the proposal for the election of the auditor for the 2011 financial year, issued the audit mandate, resolved on the auditor’s remuneration and verified the auditor’s independence in accordance with the requirements of the German Corporate Governance Code and the rules of the U.S. Public Company Accounting Oversight Board (PCAOB). The Committee did not specify audit areas of focus as the Federal Financial Supervisory Authority (BaFin) made use of its right under Section 30 German Banking Act to specify extensive audit areas of focus. The Audit Committee is convinced that, as in the previous years, there are no conflicts of interest on the part of the bank’s auditor. The Committee assured itself of the effective-ness of the system of internal controls, risk management and internal audit and monitored the financial report-ing, accounting process and audit of the Annual Financial Statements. When necessary, resolutions were passed or recommendations were issued for the Supervisory Board’s approval. The Audit Committee had reports submitted to it regularly on the engagement of accounting firms, including the auditor, with non-audit-related services, on the work of internal audit, on issues relating to compliance, on legal and reputational risks as well on special investigations and significant findings of regulatory authorities. Internal Audit’s plan for the year was noted with approval. The Audit Committee did not receive any complaints in connection with account-
Deutsche Bank Report of the Supervisory Board 406 Financial Report 2011
ing, internal accounting controls and auditing matters. Furthermore, the Audit Committee regularly dealt with the processing of audit findings issued by the auditor for the Annual and Consolidated Financial Statements for 2010, the measures to resolve the audit findings, the requirements relating to monitoring tasks pursuant to Section 107 (3) Stock Corporation Act, the measures to prepare for the audit of the Annual Financial State-ments and the audit areas of focus specified by the Federal Financial Supervisory Authority in accordance with Section 30 of the German Banking Act.
The Nomination Committee met twice in 2011 and dealt with succession issues on the Supervisory Board.
Meetings of the Mediation Committee, established pursuant to the provisions of Germany’s Co-Determination Act (MitbestG), were not necessary in 2011.
The committee chairmen reported regularly to the Supervisory Board on the work of the committees.
In 2011, all Supervisory Board members participated in the meetings of the Supervisory Board and their re-spective committees with only few exceptions. On average, the attendance was over 95 %.
Corporate Governance
At their meetings on May 25, 2011, the Supervisory Board and Chairman’s Committee addressed the sugges-tions and recommendations of the German Corporate Governance Code and in each case noted that the Gov-ernment Commission’s German Corporate Governance Code did not make any changes to the Code at its plenary meeting on May 4, 2011.
In addition, the Chairman’s Committee and Supervisory Board addressed Management Board compensation at several meetings. For the review of the structure of the Management Board’s compensation system and of the appropriateness of the variable compensation for the 2011 financial year, the Supervisory Board resolved to engage an independent compensation consultant as well as an external legal advisor to examine the compli-ance with the statutory and regulatory requirements.
At the meeting on February 1, 2012, we determined that the Supervisory Board has what we consider to be an adequate number of independent members. We also determined that all members of the Audit Committee are independent as defined by the U.S. Securities and Exchange Commission (SEC) rules issued to implement Section 407 of the U.S. Sarbanes-Oxley Act of 2002. Dr. Börsig, Dr. Eick and Dr. Siegert, who has been an Audit Committee member since August 1, 2011, were determined to be audit committee financial experts in accordance with the regulations of the Securities and Exchange Commission as well as Sections 107 (4) and 100 (5) of the Stock Corporation Act.
The Declaration of Conformity pursuant to Section 161 of the Stock Corporation Act, last issued by the Super-visory Board and Management Board on October 27, 2010, was reissued at the meeting of the Supervisory Board on October 25, 2011. Deutsche Bank complies with the recommendations of the German Corporate Governance Code in the version dated May 26, 2010, with one exception. This was included in the Declaration as a precaution due to a non-final judgment of the Higher Regional Court (OLG) Frankfurt am Main of July 5, 2011, regarding the disclosure of conflicts of interest in the report of the Supervisory Board to the General Meeting. The text of the Declaration of Conformity issued on October 25, 2011, along with a comprehensive

Deutsche Bank Report of the Supervisory Board 407 Financial Report 2011
presentation of the bank’s corporate governance can be found on pages 411 ff. in the Financial Report 2011 and on our Internet website at http://www.deutsche-bank.de/ir/en/content/corporate_governance.htm. The terms of reference for the Supervisory Board and its committees as well as for the Management Board are also published there, each in their currently applicable versions.
Training and Further Education Measures
Members of the Supervisory Board completed the training and further education measures required for their tasks on their own responsibility. Deutsche Bank provided the appropriate support to them in this context. The new members joining the Supervisory Board in 2011, Ms. Garrett-Cox and Ms. Voigt, were given orientation individually tailored to their levels of knowledge as well as detailed documentation. In addition, members of the Supervisory Board participated in external training courses. All of the members of the Supervisory Board were informed of the legal basis of the Supervisory Board’s work as part of a workshop carried out by an external attorney in February 2011. The members of the Audit Committee discussed the new regulations on accounting and financial reporting with staff members of the Finance department and the auditor. They also discussed the Supervisory Board’s monitoring requirements pursuant to Section 107 (3) sentence 2 of the Stock Corporation Act with an external lawyer. In addition, members of the Supervisory Board were informed of new develop-ments in corporate governance. Furthermore, in April 2012, an internal seminar will be conducted by an exter-nal university lecturer on the topics annual financial statements and the analysis of annual accounts, risk management and functions as well as the responsibilities of members of supervisory boards.
Conflicts of Interest and Their Handling
In connection with the agreement announced on December 21, 2010, between Deutsche Bank and the U.S. Department of Justice on non-prosecution in connection with tax-oriented transactions for clients, the bank commissioned a legal report assessing the possibility of recourse claims against former Management Board members. This expert opinion was discussed at the meetings of the Chairman’s Committee and Supervisory Board on May 25, 2011, and concluded there were no claims against active and former members of the Man-agement Board. As the matter took place during his term of office as a member of the Management Board, Dr. Börsig did not participate in the discussion and voting on possible recourse claims.
Until the end of 2010, Ms. Ruck was a member of the Supervisory Board of Deutsche Bank Privat- und Geschäftskunden AG. She did not participate in taking the resolution of the Supervisory Board of Deutsche Bank AG required pursuant to Section 32 of the Co-Determination Act (MitbestG) on the ratification of the acts of management of the Management Board and Supervisory Board of Deutsche Bank Privat- und Geschäfts-kunden AG for the 2010 financial year.

Deutsche Bank Report of the Supervisory Board 408 Financial Report 2011
Litigation
As in the preceding years, we regularly obtained information on important lawsuits and discussed further courses of action. These included the actions for rescission and to obtain information filed in connection with the General Meetings in 2006, 2007, 2008, 2009, 2010 and 2011, as well as the lawsuits of Dr. Kirch/his legal successor and KGL Pool GmbH against Deutsche Bank and Dr. Breuer.
Furthermore, reports concerning important lawsuits were presented to the Supervisory Board on a regular basis and, in detail, to the Audit and Risk Committees.
Annual Financial Statements
KPMG Aktiengesellschaft Wirtschaftsprüfungsgesellschaft has audited the accounting, the Annual Financial Statements and the Management Report for 2011 as well as the Consolidated Financial Statements with the related Notes and Management Report for 2011. KPMG Aktiengesellschaft Wirtschaftsprüfungsgesellschaft was elected by the General Meeting as the auditor of the Annual Financial Statements and Consolidated Fi-nancial Statements. After the Frankfurt am Main Regional Court in the first instance had ruled this appointment null and void based on an action to rescind, the Frankfurt am Main District Court appointed, upon the bank’s application in consultation with the Audit Committee, KPMG Aktiengesellschaft Wirtschaftsprüfungsgesellschaft the auditor of the Annual Financial Statements and Consolidated Financial Statements by way of court order. The audits led in each case to an unqualified opinion. The Audit Committee examined the documents for the Annual Financial Statements and Consolidated Financial Statements, along with the auditor’s report, and dis-cussed these extensively with the auditor. The Chairman of the Audit Committee reported to us on this at to-day’s meeting of the Supervisory Board. Based on the recommendation of the Audit Committee and after inspecting the auditor’s reports, the Annual Financial Statements and Consolidated Financial Statements documents, we agreed with the results of the audits following an extensive discussion and determined that, also based on the results of our inspections, there were no objections to be raised.
Today, we approved the Annual Financial Statements and Consolidated Financial Statements prepared by the Management Board; the Annual Financial Statements are thus established. We agree to the Management Board’s proposal for the appropriation of profits.

Deutsche Bank Report of the Supervisory Board 409 Financial Report 2011
Personnel Issues
There were no personnel changes on the Management Board in 2011.
With the conclusion of the General Meeting on May 26, 2011, the term of office of Sir Peter Job as a member of the Supervisory Board came to an end. Ms. Katherine Garrett-Cox was elected member of the Supervisory Board to succeed him by the General Meeting on May 26, 2011.
Mr. Peter Kazmierczak resigned his mandate as member of the Supervisory Board with effect from October 25, 2011. Ms. Renate Voigt was appointed his successor as member of the Supervisory Board by court order on November 30, 2011, for the remainder of his term of office.
We thank the members who left last year for their dedicated work on the Supervisory Board and for their con-structive assistance to the company and the Management Board over the years.
At our meeting today, March 16, the Supervisory Board appointed Dr. Stephan Leithner, Mr. Stuart Wilson Lewis and Mr. Henry Ritchotte members of the Management Board, in each case for three years with effect from June 1, 2012. Dr. Leithner has been with Deutsche Bank since 2000 and has been Co-Head of Invest-ment Banking Coverage & Advisory since 2010. Mr. Lewis joined Deutsche Bank in 1996 and has been Deputy Chief Risk Officer since 2010. Mr. Ritchotte has been with Deutsche Bank since 1995 and has been the Chief Operating Officer of the Corporate & Investment Bank Group Division since 2010. Dr. Bänziger and Mr. Lamberti will leave the Management Board and Deutsche Bank effective at the end of May 31, 2012. Dr. Ackermann will be leaving the bank’s Management Board, which he has chaired since 2002, with effect from the end of the General Meeting on May 31, 2012.
Frankfurt am Main, March 16, 2012
The Supervisory Board
Dr. Clemens Börsig Chairman

Corporate Governance Statement/ Corporate Governance Report
Management Board and Supervisory Board – 411 Reporting and Transparency – 421 Related Party Transactions – 422 Auditing and Controlling – 422 Compliance with the German Corporate Governance Code – 424
Deutsche Bank 04 – Corporate Governance Statement/Corporate Governance Report 411 Financial Report 2011 Management Board and Supervisory Board
All information presented in this Corporate Governance Statement/Corporate Governance Report is shown as of February 17, 2012.
Management Board and Supervisory Board
Management Board The Management Board is responsible for managing the company. Its members are jointly accountable for the management of the company. The duties, responsibilities and procedures of our Management Board and the committees installed by it are specified in its Terms of Reference, which are available in the respectively current version on our Internet website (www.deutsche-bank.com/corporate-governance).
The following paragraphs show information on the current members of the Management Board. The informa-tion includes their ages, the year in which they were appointed and the year in which their term expires, their current positions and area of responsibility and their principal business activities outside our company. The members of our Management Board have generally undertaken not to assume chairmanships of supervisory boards of companies outside our consolidated group.
Dr. Josef Ackermann Age: 64 First appointed: 1996 Term expires: 2013
Dr. Josef Ackermann joined Deutsche Bank as a member of our Management Board in 1996, where he was responsible for the investment banking division. On May 22, 2002, Dr. Ackermann was appointed Spokesman of the Management Board. On February 1, 2006, he was appointed Chairman of the Management Board. Dr. Ackermann has agreed with the Supervisory Board that the end of his appointment will be at the end of the Annual General Meeting 2012.
After studying Economics and Social Sciences at the University of St. Gallen, he worked at the University’s Institute of Economics as research assistant and received a doctorate in Economics. Dr. Ackermann started his professional career in 1977 at Schweizerische Kreditanstalt (SKA) where he held a variety of positions in Corporate Banking, Foreign Exchange/Money Markets and Treasury, Investment Banking and Multinational Services. He worked in London and New York, as well as at several locations in Switzerland. Between 1993 and 1996, he served as President of SKA’s Executive Board, following his appointment to that board in 1990.
Dr. Ackermann is a member of the Supervisory Board of Siemens AG (Second Deputy Chairman), Vice-Chairman of the Board of Directors of Belenos Clean Power Holding Ltd., non-executive member of the Board of Direc-tors of Royal Dutch Shell Plc and Vice-Chairman of the Board of Directors of Zurich Financial Services Ltd.
Corporate Governance Statement/ Corporate Governance Report
Deutsche Bank 04 – Corporate Governance Statement/Corporate Governance Report 412 Financial Report 2011 Management Board and Supervisory Board
Dr. Hugo Bänziger Age: 56 First appointed: 2006 Term expires: 2014
Dr. Hugo Bänziger became a member of our Management Board on May 4, 2006. He is our Chief Risk Officer. He joined Deutsche Bank in London in 1996 as Head of Global Markets Credit. He was appointed Chief Credit Officer in 2000.
Dr. Bänziger’s banking career commenced in 1983 at the Swiss Federal Banking Commission in Berne. From 1985 to 1996, he worked at Schweizerische Kreditanstalt (n.k.a. Credit Suisse) in Zurich and London, first in Retail Banking and subsequently as Relationship Manager in Corporate Finance; in 1990 he was appointed Global Head of Credit for Credit Suisse Financial Products.
He studied modern history, constitutional law and economics at the University of Berne, earning his doctorate with a thesis on banking history.
Dr. Bänziger is a member of the Supervisory Board of EUREX Clearing AG, member of the Supervisory Board of EUREX Frankfurt AG and a member of the Supervisory Board of EUREX Zürich AG.
Jürgen Fitschen Age: 63 Appointed: 2009 Term expires: 2015
Jürgen Fitschen became a member of our Management Board on April 1, 2009. Mr. Fitschen has been with Deutsche Bank since 1987, was already a member of the Management Board from 2001 to the beginning of 2002 and has been a member of the Group Executive Committee since 2002 and Head of Regional Man-agement since 2005. As member of our Management Board, he is responsible for Regional Management. On July 25, 2011, the Supervisory Board appointed Mr. Fitschen together with Mr. Jain as Co-Chairman of the Management Board with effect from the end of the Annual General Meeting on May 31, 2012.
Mr. Fitschen studied Economics and Business Administration at the University of Hamburg and graduated in 1975 with a master’s degree in Business Administration.
From 1975 to 1987, he worked at Citibank in Hamburg and Frankfurt am Main in various positions. In 1983 he was appointed member of the Executive Committee Germany of Citibank.
Mr. Fitschen is a member of the Board of Directors of Kühne + Nagel International AG, member of the Supervi-sory Board of METRO AG and member of the Supervisory Board of Schott AG.

Deutsche Bank 04 – Corporate Governance Statement/Corporate Governance Report 413 Financial Report 2011 Management Board and Supervisory Board
Anshuman Jain Age: 49 First appointed: 2009 Term expires: 2017
Anshuman Jain became a member of our Management Board on April 1, 2009. Mr. Jain joined Deutsche Bank in 1995 and became Head of Global Markets in 2001 as well as a member of the Group Executive Committee in 2002. As member of our Management Board, he is responsible for the Corporate & Investment Bank Group Division. On July 25, 2011, the Supervisory Board appointed Mr. Jain together with Mr. Fitschen as Co-Chairman of the Management Board with effect from the end of the Annual General Meeting on May 31, 2012.
Mr. Jain studied Economics at Shri Ram College (Delhi University) and graduated in 1983, receiving a BA, and studied Business Administration at the University of Massachusetts and graduated in 1985 with a MBA Finance.
After his academic studies Mr. Jain worked until 1988 for Kidder Peabody, New York in Derivatives Research; from 1988 to 1995 he set up and ran the global hedge fund coverage group for Merrill Lynch, New York.
Mr. Jain does not have any external directorships subject to disclosure.
Stefan Krause Age: 49 First appointed: 2008 Term expires: 2013
Stefan Krause became a member of our Management Board on April 1, 2008. He is our Chief Financial Officer.
Previously, Mr. Krause spent over 20 years in the automotive industry, holding various senior management positions with a strong focus on Finance and Financial Services. Starting in 1987 at BMW’s Controlling de-partment in Munich, he transferred to the U.S. in 1993, building up and ultimately heading BMW’s Financial Services Division in the Americas. Relocating to Munich in 2001, he became Head of Sales Western Europe (excluding Germany). He was appointed member of the Management Board of BMW Group in May 2002, serving as Chief Financial Officer until September 2007 and subsequently as Chief of Sales & Marketing.
Mr. Krause studied Business Administration in Würzburg and graduated in 1986 with a master’s degree in Business Administration.
Mr. Krause does not have any external directorships subject to disclosure.

Deutsche Bank 04 – Corporate Governance Statement/Corporate Governance Report 414 Financial Report 2011 Management Board and Supervisory Board
Hermann-Josef Lamberti Age: 56 First appointed: 1999 Term expires: 2014
Hermann-Josef Lamberti became a member of our Management Board in 1999. He is our Chief Operating Officer. He joined Deutsche Bank in 1998 as an Executive Vice President, based in Frankfurt.
Mr. Lamberti began his professional career in 1982 with Touche Ross in Toronto and subsequently joined Chemical Bank in Frankfurt. From 1985 to 1998 he worked for IBM, initially in Germany in the areas Controlling, Internal Application Development and Sales Banks/Insurance Companies. In 1993, he was appointed General Manager of the Personal Software Division for Europe, the Middle East and Africa at IBM Europe in Paris. In 1995, he moved to IBM in the U.S., where he was Vice President for Marketing and Brand Management. He returned to Germany in 1997 to take up the position of Chairman of the Management of IBM Germany in Stuttgart.
Mr. Lamberti studied Business Administration at the Universities of Cologne and Dublin and graduated in 1982 with a master’s degree in Business Administration.
Mr. Lamberti is a member of the Supervisory Boards of BVV Versicherungsverein des Bankgewerbes a.G., BVV Versorgungskasse des Bankgewerbes e.V., BVV Pensionsfonds des Bankgewerbes AG, Deutsche Börse AG, member of the Board of Directors of European Aeronautic Defence and Space Company EADS N.V. and member of the Supervisory Board of Carl Zeiss AG.
Rainer Neske Age: 47 First Appointed: 2009 Term expires: 2017
Rainer Neske became a member of our Management Board on April 1, 2009. He joined Deutsche Bank in 1990 and in 2000 was appointed member of the Management Board of Deutsche Bank Privat- und Geschäfts-kunden AG. Since 2003 he has been a member of the Group Executive Committee. From 2003 to 2011 Mr. Neske was Spokesman of the Management Board of Deutsche Bank Privat- und Geschäftskunden AG. On our Management Board, he is responsible for our Private & Business Clients Corporate Division.
Mr. Neske studied Computer Science and Business Administration at the University of Karlsruhe and gradu-ated in 1990 with a master’s degree in Information Technology.
Mr. Neske does not have any external directorships subject to disclosure.

Deutsche Bank 04 – Corporate Governance Statement/Corporate Governance Report 415 Financial Report 2011 Management Board and Supervisory Board
Group Executive Committee The Group Executive Committee was established in 2002. It comprises the members of the Management Board and senior representatives from the business divisions within our client-facing group divisions and from the management of our regions appointed by the Management Board. Dr. Josef Ackermann, Chairman of the Management Board, is also the Chairman of the Group Executive Committee.
The Group Executive Committee serves as a tool to coordinate our businesses and regions through the follow-ing tasks and responsibilities:
— Provision of ongoing information to the Management Board on business developments and particular transactions;
— Regular review of our business segments; — Consultation with and furnishing advice to the Management Board on strategic decisions; — Preparation of decisions to be made by the Management Board.
Supervisory Board The Supervisory Board appoints, supervises and advises the Management Board and is directly involved in decisions of fundamental importance to the bank. The Management Board regularly informs the Supervisory Board of the intended business policies and other fundamental matters relating to the assets, liabilities, finan-cial and profit situation as well as its risk situation, risk management and risk controlling. A report is made to the Supervisory Board on corporate planning at least once a year. At the proposal of the Chairperson’s Committee, the Supervisory Board determines the compensation of the individual members of the Management Board including the main contract elements and reviews it regularly. The Chairman of the Supervisory Board coordi-nates work within the Supervisory Board. He maintains regular contact with the Management Board, especially with the Chairman of the Management Board, and consults with him on strategy, the development of business and risk management. The Supervisory Board Chairman is informed by the Chairman of the Management Board without delay of important events of substantial significance for the situation and development as well as for the management of Deutsche Bank Group. The types of business that require the approval of the Supervi-sory Board to be transacted are specified in Section 13 of our Articles of Association. The Supervisory Board meets if required without the Management Board. For the performance of its duties, the Supervisory Board may, at its professional discretion, use the services of auditors, legal advisors and other internal and external consultants.
The duties, procedures and committees of the Supervisory Board are specified in its Terms of Reference, which are available in the respectively current version on the Deutsche Bank Internet website (www.deutsche-bank.com/corporate-governance).
The following table shows information on the current members of our Supervisory Board. The members repre-senting our shareholders were elected at the Annual General Meeting on May 29, 2008, except for Dr. Siegert, who was elected at the Annual General Meeting 2007 until the end of the Annual General Meeting 2012 and Ms. Garrett-Cox, who was elected at the Annual General Meeting 2011 until the end of the Annual General Meeting 2016. The members elected by employees in Germany were elected on May 8, 2008. The information includes the members’ age, the years in which they were first elected or appointed, the years when their terms expire, their principal occupation and their membership on other companies’ supervisory boards, other non-executive directorships and other positions.

Deutsche Bank 04 – Corporate Governance Statement/Corporate Governance Report 416 Financial Report 2011 Management Board and Supervisory Board
Member Principal occupation Supervisory board memberships and other directorships
Wolfgang Böhr* Age: 49 First elected: 2008 Term expires: 2013
Chairman of the Combined Staff Council Dusseldorf of Deutsche Bank; Member of the General Staff Council of Deutsche Bank; Member of the Group Staff Council of Deutsche Bank
No memberships or directorships subject to disclosure
Dr. Clemens Börsig Age: 63 Appointed by the court: 2006 Term expires: 2013
Chairman of the Supervisory Board of Deutsche Bank AG, Frankfurt
Linde AG; Bayer AG; Daimler AG; Emerson Electric Company
Dr. Karl-Gerhard Eick Age: 58 Appointed by the court: 2004 Term expires: 2013
Management consultant, KGE Asset Management Consulting Ltd., London
CORPUS SIREO Holding GmbH & Co. KG (Chairman)
Katherine Garrett-Cox Age: 44 First elected: 2011 Term expires: 2016
Chief Executive Officer of Alliance Trust Plc, Dundee Alliance Trust Savings Ltd. (Non Executive Director); Alliance Trust Asset Management Ltd. (Chief Executive)
Alfred Herling* Age: 59 First elected: 2008 Term expires: 2013
Chairman of the Combined Staff Council Wuppertal/Sauerland of Deutsche Bank; Chairman of the General Staff Council; Chairman of the Group Staff Council of Deutsche Bank
No memberships or directorships subject to disclosure
Gerd Herzberg* Age: 61 Appointed by the court: 2006 Term expires: 2013
Deputy Chairman of ver.di Vereinte Dienstleistungsgewerkschaft, Berlin (until October 2011)
Franz Haniel & Cie GmbH (Deputy Chairman); BGAG – Beteiligungsgesellschaft der Gewerkschaften AG; Vattenfall Europe AG (Deputy Chairman)
Prof. Dr. Henning Kagermann Age: 64 First elected: 2000 Term expires: 2013
President of acatech – German Academy of Science and Engineering, Munich
Münchener Rückversicherungs-Gesellschaft Aktiengesellschaft; Nokia Corporation; Deutsche Post AG; Wipro Technologies; BMW Bayerische Motoren Werke AG
Martina Klee* Age: 49 First elected: 2008 Term expires: 2013
Chairperson of the Staff Council GTO Eschborn/Frankfurt of Deutsche Bank; Member of the Group and General Staff Council of Deutsche Bank; Member of the European Staff Council
Sterbekasse für die Angestellten der Deutschen Bank VVa.G.
Suzanne Labarge Age: 65 First elected: 2008 Term expires: 2013
Coca-Cola Enterprises Inc.; XL Group Plc (since October 2011)
Maurice Lévy Age: 69 First elected: 2006 Term expires: 2012
Chairman and Chief Executive Officer, Publicis Groupe S.A., Paris
Publicis Conseil S.A. (Chairman); Medias et Régies Europe S.A.; MMS USA Holdings, Inc.; Zenith Optimedia Group Ltd. (U.K.); Publicis Groupe U.S. Investments LLC; MMS USA Investments, Inc.; MMS USA LLC Investments, Inc.
Henriette Mark* Age: 54 First elected: 2003 Term expires: 2013
Chairperson of the Combined Staff Council Munich and Southern Bavaria of Deutsche Bank; Member of the Group and General Staff Councils of Deutsche Bank; Chairperson of the European Staff Council
No memberships or directorships subject to disclosure

Deutsche Bank 04 – Corporate Governance Statement/Corporate Governance Report 417 Financial Report 2011 Management Board and Supervisory Board
Member Principal occupation Supervisory board memberships and other directorships
Gabriele Platscher* Age: 54 First elected: 2003 Term expires: 2013
Chairperson of the Combined Staff Council Braunschweig/Hildesheim of Deutsche Bank
BVV Versicherungsverein des Bankgewerbes a.G. (Deputy Chairperson); BVV Versorgungskasse des Bankgewerbes e.V. (Deputy Chairperson); BVV Pensionsfonds des Bankgewerbes AG (Deputy Chairperson)
Karin Ruck* Age: 46 First elected: 2003 Term expires: 2013
Deputy Chairperson of the Supervisory Board of Deutsche Bank AG; Senior Sales Coach in the Region Frankfurt/Hesse-East; Member of the Combined Staff Council Frankfurt branch of Deutsche Bank
BVV Versicherungsverein des Bankgewerbes a.G.; BVV Versorgungskasse des Bankgewerbes e.V.; BVV Pensionsfonds des Bankgewerbes AG
Dr. Theo Siegert Age: 64 Appointed by the court: 2006 Term expires 2012
Managing Partner of de Haen Carstanjen & Söhne, Dusseldorf
E.ON AG; Merck KGaA; E. Merck OHG (Member of the Shareholders’ Committee); DKSH Holding Ltd. (Member of the Board of Administration); Henkel AG & Co. KGaA
Dr. Johannes Teyssen Age: 52 First elected: 2008 Term expires: 2013
Chairman of the Management Board of E.ON AG, Dusseldorf
E.ON Energie AG; E.ON Ruhrgas AG; Salzgitter AG
Marlehn Thieme* Age: 54 First elected: 2008 Term expires: 2013
Director Infrastructure/Regional Management Communications Corporate Citizenship Deutsche Bank AG, Frankfurt
No memberships or directorships subject to disclosure
Tilman Todenhöfer Age: 68 Appointed by the court: 2001 Term expires: 2013
Managing Partner of Robert Bosch Industrietreuhand KG, Stuttgart
Robert Bosch GmbH; Robert Bosch Internationale Beteiligungen AG (President of the Board of Administration); HOCHTIEF AG (until May 2011)
Stefan Viertel* Age. 47 First elected: 2008 Term expires: 2013
Senior Sales Manager CIB/GTB Cash Management Financial Institutions, Head of CMFI Austria and Hungary Deutsche Bank AG, Frankfurt
No memberships of directorships subject to disclosure
Renate Voigt* Age: 57 Appointed by the court: 2011 Term expires: 2013
Chairperson of the Combined Staff Council Stuttgart/Esslingen/Heilbronn of Deutsche Bank
No memberships of directorships subject to disclosure
Werner Wenning Age: 65 First elected: 2008 Term expires: 2013
Chairman of the Supervisory Board of E.ON AG, Dusseldorf (since May 2011)
E.ON AG; Henkel AG & Co. KGaA (Member of the Shareholders’ Committee); HDI VVa.G.; Talanx AG; Freudenberg & Co. KG (Member of the Shareholders’ Committee) (since June 2011)
* Elected by the employees in Germany; Renate Voigt appointed by the court as employee representative.
Sir Peter Job was a shareholder representative member of the Supervisory Board until the Annual General Meeting on May 26, 2011. He was replaced by Katherine Garrett-Cox. Peter Kazmierczak was an employee representative member of the Supervisory Board until October 25, 2011. After his departure from the bank, he was replaced by Renate Voigt, appointed by the court on November 30, 2011, for the remainder of his term of office.
Dr. Clemens Börsig was a member of the Management Board of Deutsche Bank AG until May 3, 2006. He has stated that he will abstain from voting and from participation in discussions in his function as member of the Supervisory Board and its committees on all questions that relate to his former membership of the Manage-ment Board and could create a conflict of interest. In the Supervisory Board meeting on July 25, 2011, Dr. Börsig declared that he will step down from the Supervisory Board with effect from the end of the Annual General Meeting on May 31, 2012.
Deutsche Bank 04 – Corporate Governance Statement/Corporate Governance Report 418 Financial Report 2011 Management Board and Supervisory Board
In accordance with the German Banking Act, members of the Supervisory Board must be reliable and have the expertise required to perform their control function and to assess and supervise the businesses the company operates. While taking these requirements into account in accordance with Section 5.4.1 of the German Corpo-rate Governance Code, on October 2010, the Supervisory Board established the following objectives for its composition, which have also been specified in Section 4 of the Terms of Reference for the Supervisory Board (see: http://www.deutsche-bank.de/ir/en/content/terms_of_references.htm).
The Supervisory Board of Deutsche Bank AG must be composed in such a way that its members as a group possess the knowledge, ability and expert experience to properly complete its tasks. In particular, the Supervi-sory Board members should have sufficient time to perform their mandates. The composition of the Supervi-sory Board should ensure the Supervisory Board’s qualified control of and advice for the Management Board of an internationally operating, broadly positioned bank and should preserve the reputation of Deutsche Bank Group among the public. In this regard, in particular, attention should be placed on the integrity, personality, willingness to perform, professionalism and independence of the individuals proposed for election. The objec-tive is for the Supervisory Board as a group to have all of the knowledge and experience considered to be essential in consideration of the activities of Deutsche Bank Group.
Furthermore, the Supervisory Board shall have an adequate number of independent members and shall not have more than two former members of the Management Board of Deutsche Bank AG. The members of the Supervisory Board may not exercise functions on a management body of or perform advisory duties at major competitors. Important and not just temporary conflicts of interests shall be avoided. Any member of the Su-pervisory Board who is a member of the management board of a listed stock corporation shall have no more than three supervisory board mandates outside the group of companies controlled by such stock corporation’s dependent companies or mandates in supervisory bodies of companies with similar requirements.
There is a regular maximum age limit of 70. In well-founded, individual cases, a Supervisory Board member may be elected or appointed for a period that extends at the latest until the end of the third Ordinary General Meeting that takes place after he or she has reached the age of 70. This age limit was taken into account in the election proposals to the recent General Meetings and shall also be taken into account for the next Supervisory Board elections or subsequent appointments for Supervisory Board positions that become vacant.
The Supervisory Board respects diversity when proposing members for appointment to the Supervisory Board. In light of the international operations of Deutsche Bank, care should be taken that the Supervisory Board has an appropriate number of members with international experience. Currently, the professional careers and pri-vate lives of five members of the Supervisory Board are centered outside Germany. Furthermore, all of the shareholder representatives on the Supervisory Board have several years of international experience from their current or former activities as management board members or CEOs of corporations with international operations. In these two ways, the Supervisory Board believes the international activities of the company are sufficiently taken into account. The objective is to retain the currently existing international profile.
For the election proposals to the General Meeting, the Supervisory Board takes care that there is an appropri-ate consideration of women. Special importance was already attached to this in the selection process for the last Supervisory Board elections in 2008. In reviewing potential candidates for a new election or subsequent appointments to Supervisory Board positions that have become vacant, qualified women shall be included in the selection process and shall be appropriately considered in the election proposals. On this basis and at the proposal of the Supervisory Board, the General Meeting elected Ms. Garrett-Cox to the Supervisory Board at the General Meeting on May 26, 2011. Since the Supervisory Board elections in 2003, between 25 % and 35 % of the Supervisory Board members have been women. Following the appointment of Ms. Renate Voigt to the

Deutsche Bank 04 – Corporate Governance Statement/Corporate Governance Report 419 Financial Report 2011 Management Board and Supervisory Board
Supervisory Board by the Register Court on November 30, 2011, the Supervisory Board now counts eight women among its members, which corresponds to 40 %. We shall strive to maintain this number and, as ap-propriate, to further increase the number of women among the shareholder representatives. It should be taken into account that the Supervisory Board can only influence the composition of the Supervisory Board through its election proposals to the General Meeting (for information on Deutsche Bank’s various diversity initiatives, please see page 163 of the Financial Report 2011.
According to Section 5.4.2 of the German Corporate Governance Code, the Supervisory Board determined that it has what it considers to be an adequate number of independent members.
Standing Committees The Supervisory Board has established the following five standing committees. The Report of the Supervisory Board provides information on the concrete work to the committees over the preceding year (see Report of the Supervisory Board on pages 403 – 409 of the Financial Report 2011).
Chairman’s Committee: The Chairman’s Committee is responsible for all Management Board and Supervisory Board matters. It prepares the decisions for the Supervisory Board on the appointment and dismissal of mem-bers of the Management Board, including long-term succession planning. It also submits a proposal to the Supervisory Board for the remuneration of the members of the Management Board. It is responsible for entering into, amending and terminating the service contracts and other agreements in consideration of the Supervisory Board’s sole authority to decide on the remuneration of the members of the Management Board and provides its approval for ancillary activities, honorary offices or special tasks outside of Deutsche Bank Group of Manage-ment Board members pursuant to Section 112 of the German Stock Corporation Act and for certain contracts with Supervisory Board members pursuant to Section 114 of the German Stock Corporation Act. Furthermore, it prepares the decisions of the Supervisory Board in the field of corporate governance. The Chairman’s Com-mittee held five meetings in 2011.
The current members of the Chairman’s Committee are Dr. Clemens Börsig (Chairman), Alfred Herling, Karin Ruck and Tilman Todenhöfer.
Nomination Committee: The Nomination Committee prepares the Supervisory Board’s proposals for the election or appointment of new shareholder representatives to the Supervisory Board. In this context, it orients itself on the criteria specified by the Supervisory Board for its composition. The Nomination Committee held two meet-ings in 2011.
The current members of the Nomination Committee are Dr. Clemens Börsig (Chairman), Tilman Todenhöfer and Werner Wenning.
Audit Committee: The Audit Committee handles in particular the monitoring of financial accounting, including the accounting process and the effectiveness of the system of internal controls, issues of risk management and especially the effectiveness of the risk management system, as well as the effectiveness of the internal audit system, compliance and the auditing of annual financial statements. It reviews the documentation relating to the annual and consolidated financial statements and discusses the audit reports with the auditor. It prepares the decisions of the Supervisory Board on the annual financial statements and the approval of the consolidated financial statements and discusses important changes to the audit and accounting methods. The Audit Com-mittee also discusses the quarterly financial statements and the report on the limited review of the quarterly financial statements with the Management Board and the auditor prior to their publication. In addition, the Audit Committee issues the audit mandate to the auditor elected by the General Meeting. It resolves on the compen-
Deutsche Bank 04 – Corporate Governance Statement/Corporate Governance Report 420 Financial Report 2011 Management Board and Supervisory Board
sation paid to the auditor and monitors the auditor’s independence, qualifications and efficiency. The Chairman of the Audit Committee, as well as the Chairman of the Supervisory Board, is entitled to obtain information directly from the Head of Compliance. The Audit Committee is responsible for acknowledging communications about significant reductions in the compliance budget and for taking receipt of and handling the report by the Head of Compliance on the appropriateness and effectiveness of the principles, methods and procedures in accordance with § 33 (1) sentence 2 No. 5 of the German Securities Trading Act (WpHG) (Compliance Report). The Compliance Report is issued at least once a year. The Head of Internal Audit regularly reports to the Audit Committee on its ongoing work. The Audit Committee is informed about special audits, substantial complaints and other exceptional measures on the part of bank regulatory authorities. It has functional responsibility for receiving and handling complaints concerning accounting, internal accounting controls and issues relating to the audit. Subject to its review, the Audit Committee grants its approval for mandates engaging the auditor for non-audit-related services. The Audit Committee held six meetings in 2011.
The current members of the Audit Committee are Dr. Karl-Gerhard Eick (Chairman), Dr. Clemens Börsig, Henriette Mark, Karin Ruck, Dr. Theo Siegert (since August 1, 2011), and Marlehn Thieme.
Risk Committee: The Risk Committee handles loans which require a resolution by the Supervisory Board pur-suant to law or our Articles of Association. Subject to its review, it grants its approval for the acquisition of shareholdings in other companies that amount to between 2 % and 3 % of our regulatory banking capital if it is likely that the shareholding will not remain in our full or partial possession for more than twelve months. At the meetings of the Risk Committee, the Management Board reports on credit, market, liquidity, operational, litiga-tion and reputational risks. The Management Board also reports on risk strategy, credit portfolios, loans requir-ing a Supervisory Board approval pursuant to law or our Articles of Association, questions of capital resources and matters of special importance due to the risks they entail. The Risk Committee held six meetings in 2011.
The current members of the Risk Committee are Dr. Clemens Börsig (Chairman), Professor Dr. Henning Kagermann and Suzanne Labarge (since August 1, 2011). Suzanne Labarge was a substitute member until July 31, 2011. Dr. Theo Siegert is a substitute member of the Risk Committee. He is invited to all meetings and regularly attends them.
In addition to these four committees, the Mediation Committee, which is required by German law, makes proposals to the Supervisory Board on the appointment or dismissal of members of the Management Board in those cases where the Supervisory Board is unable to reach a two-thirds majority decision with respect to the ap-pointment or dismissal. The Mediation Committee only meets if necessary and did not hold any meetings in 2011.
The current members of the Mediation Committee are Dr. Clemens Börsig (Chairman), Wolfgang Böhr, Karin Ruck, and Tilman Todenhöfer.

Deutsche Bank 04 – Corporate Governance Statement/Corporate Governance Report 421 Financial Report 2011 Reporting and Transparency
Further details regarding the Chairman’s Committee, the Risk Committee, the Audit Committee and the Nomination Committee are regulated in separate Terms of Reference, which are available in the respectively current version on our Internet website, along with the Terms of Reference of our Supervisory Board (see: http://www.deutsche-bank.de/ir/en/content/terms_of_references.htm).
Compensation For a description of the compensation for the Management Board and the Supervisory Board in 2011, please refer to our detailed Compensation Report on pages 140 – 156 of the Management Report, published in accordance with the provisions of the German Act on Disclosure of Management Board Compensation.
Share Plans For information on our employee share programs, please refer to Note 33 “Share-Based Compensation Plans” to the consolidated financial statements.
Reporting and Transparency
Directors’ Share Ownership Management Board. For the Directors’ Share Ownership of the Management Board, please refer to our de-tailed Compensation Report in the Management Report.
Supervisory Board. The current members of our Supervisory Board held the following numbers of our shares and share awards under our employee share plans.
Members of the Supervisory Board Number of shares
Number of share awards
Wolfgang Böhr 545 − Dr. Clemens Börsig
1 137,919 − Dr. Karl-Gerhard Eick − − Katherine Garrett-Cox − − Alfred Herling 1,042 10 Gerd Herzberg − − Prof. Dr. Henning Kagermann − − Martina Klee 874 − Suzanne Labarge − − Maurice Lévy − − Henriette Mark 584 10 Gabriele Platscher 864 6 Karin Ruck 165 − Dr. Theo Siegert − − Dr. Johannes Teyssen − − Marlehn Thieme 236 10 Tilman Todenhöfer 1,741 − Stefan Viertel 95 10 Renate Voigt 213 10 Werner Wenning − −
Total 144,278 56 1 This does not include 270 Deutsche Bank shares held by a family-owned partnership, a community of heirs, in which Dr. Clemens Börsig has a 25 % interest as
well as 16,018 Deutsche Bank shares attributable to a charitable foundation with separate legal capacity, the “Gerhild und Clemens Börsig Jugend- und Sozialstiftung”.

Deutsche Bank 04 – Corporate Governance Statement/Corporate Governance Report 422 Financial Report 2011 Auditing and Controlling
The members of the Supervisory Board held 144,278 shares, amounting to less than 0.02 % of our shares as of February 17, 2012.
As listed in the “Number of share awards” column in the table, the members who are employees of Deutsche Bank hold matching awards granted under the Global Share Purchase Plan, which are scheduled to be delivered to them on November 1, 2012.
Related Party Transactions
For information on related party transactions please refer to Note 38 “Related Party Transactions”.
Auditing and Controlling
Audit Committee Financial Expert Our Supervisory Board has determined that Dr. Clemens Börsig, Dr. Karl-Gerhard Eick and Dr. Theo Siegert, who are members of its Audit Committee, are “audit committee financial experts”, as such term is defined by the regulations of the Securities and Exchange Commission issued pursuant to Section 407 of the Sarbanes-Oxley Act of 2002. The audit committee financial experts mentioned above are “independent” of us, as defined in Rule 10A-3 under the U.S. Securities Exchange Act of 1934 and Section 100 (5) of the Stock Corporation Act (AktG). According to Sections 107 (4), 100 (5) of the Stock Corporation Act they are well grounded in the fields of accounting and auditing. Code of Business Conduct and Ethics Deutsche Bank’s Code of Business Conduct and Ethics describes the values and minimum standards for ethi-cal business conduct that we expect all of our employees to follow. These values and standards govern em-ployee interactions with our clients, competitors, business partners, government and regulatory authorities, and shareholders, as well as with each other. The Code contains a voluntary commitment from the Management Board and the Supervisory Board. It reflects our core values and our promise to our stakeholders. In addition, it forms the cornerstone of our policies, which provide guidance on compliance with applicable laws and regu-lations.
In accordance with Section 406 of the Sarbanes-Oxley Act of 2002, we also adopted a Code of Ethics that sets out special obligations for our Senior Financial Officers. Currently at Deutsche Bank these are the Chairman of the Management Board, the Chief Financial Officer, the Head of Group Accounting as well as members of the Group Finance Committee. In 2011, no complaints were reported to the Corporate Governance Officer regard-ing the Code of Ethics for Senior Financial Officers.
The current version of Deutsche Bank’s Code of Business Conduct and Ethics is available on our website at http://www.deutsche-bank.de/ir/de/content/ethikkodizes.
Deutsche Bank 04 – Corporate Governance Statement/Corporate Governance Report 423 Financial Report 2011 Auditing and Controlling
Principal Accountant Fees and Services In accordance with German law, our principal accountant is appointed at our Annual General Meeting based on a recommendation of our Supervisory Board. The Audit Committee of our Supervisory Board prepares such a recommendation. Subsequent to the principal accountant’s appointment, the Audit Committee awards the contract and in its sole authority approves the terms and scope of the audit and all audit engagement fees as well as monitors the principal accountant’s independence. KPMG AG Wirtschaftsprüfungsgesellschaft was our principal accountant for the 2010 and 2011 fiscal years, respectively.
The table set forth below contains the aggregate fees billed for each of the last two fiscal years by KPMG AG Wirtschaftprüfungsgesellschaft and the worldwide member firms of KPMG International in each of the following categories: (1) Audit Fees, which are fees for professional services for the audit of our annual financial state-ments or services that are normally provided by the accountant in connection with statutory and regulatory filings or engagements for those fiscal years, (2) Audit-Related Fees, which are fees for assurance and related services that are reasonably related to the performance of the audit or review of our financial statements and are not reported as Audit Fees, and (3) Tax-Related Fees, which are fees for professional services rendered for tax compliance, tax consulting and tax planning, and (4) All Other Fees, which are fees for products and services other than Audit Fees, Audit-Related Fees and Tax-Related Fees. These amounts include expenses and exclude Value Added Tax (VAT).
Fee category in € m. 2011 2010
Audit fees 54 53 Audit-related fees 12 9 Tax-related fees 7 7 All other fees 3 2
Total fees 76 71
Our Audit-Related Fees included fees for accounting advisory, due diligence relating to actual or contem-plated acquisitions and dispositions, attestation engagements and other agreed-upon procedure engage-ments. Our Tax-Related Fees included fees for services relating to the preparation and review of tax returns and related compliance assistance and advice, tax consultation and advice relating to Group tax planning strategies and initiatives and assistance with assessing compliance with tax regulations. Our Other Fees were incurred for project-related advisory services.
United States law and regulations, and our own policies, generally require all engagements of our principal accountant be pre-approved by our Audit Committee or pursuant to policies and procedures adopted by it. Our Audit Committee has adopted the following policies and procedures for consideration and approval of requests to engage our principal accountant to perform non-audit services. Engagement requests must in the first in-stance be submitted to the Accounting Engagement Team established and supervised by our Group Fi-nance Committee, whose members consist of our Chief Financial Officer and senior members of our Finance and Tax departments. If the request relates to services that would impair the independence of our principal accountant, the request must be rejected. Our Audit Committee has given its pre-approval for specified assur-ance, financial advisory and tax services, provided the expected fees for any such service do not exceed € 1 million. If the engagement request relates to such specified pre-approved services, it may be approved by the Group Finance Committee, which must thereafter report such approval to the Audit Committee. If the en-gagement request relates neither to prohibited non-audit services nor to pre-approved non-audit services, it must be forwarded by the Group Finance Committee to the Audit Committee for consideration. In addi-tion, to facilitate the consideration of engagement requests between its meetings, the Audit Committee has delegated approval authority to several of its members who are “independent” as defined by the Securities and

Deutsche Bank 04 – Corporate Governance Statement/Corporate Governance Report 424 Financial Report 2011 Compliance with the German Corporate Governance Code
Exchange Commission and the New York Stock Exchange. Such members are required to report any approv-als made by them to the Audit Committee at its next meeting.
Additionally, United States law and regulations permit the pre-approval requirement to be waived with respect to engagements for non-audit services aggregating no more than five percent of the total amount of revenues we paid to our principal accountant, if such engagements were not recognized by us at the time of engagement and were promptly brought to the attention of our Audit Committee or a designated member thereof and approved prior to the completion of the audit. In each of 2010 and 2011, the percentage of the total amount of revenue we paid to our principal accountant represented by non-audit services in each category that were subject to such a waiver was less than 5 %.
Compliance with the German Corporate Governance Code
Declaration pursuant to § 161 German Stock Corporation Act (AktG) (Declaration of Conformity 2011) The Management Board and Supervisory Board issued a new Declaration of Conformity in accordance with § 161 German Stock Corporation Act (AktG) on October 25, 2011. Deutsche Bank AG acted in conformity with the recommendations of the “Government Commission’s German Corporate Governance Code” as follows:
“The last Declaration of Conformity was issued on October 27, 2010. Since then, Deutsche Bank AG has com-plied with the recommendations of the “Government Commission’s German Corporate Governance Code” in the code version dated May 26, 2010, published in the Electronic Federal Gazette (Elektronischer Bundesan-zeiger) on July 2, 2010, and will comply with them in the future, although one exception is stated as a precau-tionary measure in each case regarding No. 5.5.3 sentence 1, which addresses the disclosure of conflicts of interest in the report of the Supervisory Board to the General Meeting.
In the future, we will continue to provide information on any conflict of interests which have occurred together with their treatment in the same scope as in the past in the report of the Supervisory Board to the General Meeting. A more detailed presentation would, according to our assessment, breach the corporate law confiden-tiality obligation pursuant to §§ 93, 116 of the Stock Corporation Act (AktG). We consider the requirements from No. 5.5.3 sentence 1 of the German Corporate Governance Code to be limited by this obligation pursuant to stock corporation law and, in departure from the Higher Regional Court (OLG) Frankfurt am Main, therefore see no basis for expanding the scope of the information. In a non-final judgement, the Court declared the ratifi-cation of the acts of management of the Management Board and of the Supervisory Board by the General Meeting 2009 null and void because, among other reasons, it had not been stated in the Declaration of Con-formity of October 29, 2008, that conflicts of interest and their treatment had not been disclosed in accordance with the requirements of No. 5.5.3 sentence 1 of the German Corporate Governance Code. As our approach, according to the ruling specified above, does not fulfil the recommendation in No. 5.5.3 sentence 1 of the Ger-man Corporate Governance Code, but we intend to maintain the practice that we consider to be the right one for us, we state this exception as a precautionary measure.”

Deutsche Bank 04 – Corporate Governance Statement/Corporate Governance Report 425 Financial Report 2011 Compliance with the German Corporate Governance Code
The Declaration of Conformity 2011 and all of the previous versions of the Declaration of Conformity are pub-lished on Deutsche Bank’s website at http://www.deutsche-bank.de/ir/en/content/declaration_of_conformity.htm, where a copy of the German Corporate Governance Code is also available.
No. 5.4.3 of the German Corporate Governance Code recommends that applications for judicial appointment of Supervisory Board members be limited in time until the next General Meeting. The “Government Commission of the German Corporate Governance Code” confirmed in writing that this recommendation applies only to shareholder representatives elected by the General Meeting. It is only these representatives whose appoint-ment can be confirmed by election at the General Meeting and who can be substituted by another member elected by the General Meeting. Hence, this point does not apply to employee representatives appointed to the Supervisory Board. Subsequently, the Register Court appointed Ms. Renate Voigt employee representative on November 30, 2011 till the end of the term of the Supervisory Board.
Statement on the Suggestions of the German Corporate Governance Code Deutsche Bank voluntarily complies with the suggestions of the Code in the version dated May 26, 2010 with the following exceptions:
— The representatives appointed by Deutsche Bank to exercise shareholders’ voting rights can be reached by those attending the General Meeting until just before voting commences. The representatives are reachable by those not attending until 12 noon on the day of the General Meeting using the instruction tool in the Internet (Code No. 2.3.3). In this manner, the risk of any technical disruptions directly before voting takes place can basically be excluded. The broadcast through the Internet also ends at the latest at this time, which means information useful for non-participants in forming an opinion can no longer be expected thereafter.
— Our broadcast of the General Meeting through the Internet (Code No. 2.3.4) covers the opening of the Gen-eral Meeting by the Chairman and the report of the Management Board. The shareholders are thus free to hold their discussions with management unencumbered by a public broadcast to a wide audience.

Supplementary Information
Management Board – 427 Supervisory Board – 428 Advisory Boards – 430 Group Five-Year Record – 435 Declaration of Backing – 436 Glossary – 437 Impressum – Publications – 445

Deutsche Bank 05 – Supplementary Information 427 Financial Report 2011 Management Board
Dr. Josef Ackermann Chairman
Dr. Hugo Bänziger Jürgen Fitschen Anshuman Jain Stefan Krause Hermann-Josef Lamberti Rainer Neske
Management Board

Deutsche Bank 05 – Supplementary Information 428 Financial Report 2011 Supervisory Board
Dr. Clemens Börsig – Chairman, Frankfurt am Main
Karin Ruck* – Deputy Chairperson Deutsche Bank AG, Bad Soden am Taunus
Wolfgang Böhr* Deutsche Bank AG, Dusseldorf
Dr. Karl-Gerhard Eick KGE Asset Management Consulting Ltd., London
Katherine Garrett-Cox since May 26, 2011 Chief Executive Officer of Alliance Trust Plc, Brechin, Angus
Alfred Herling* Deutsche Bank AG, Wuppertal
Gerd Herzberg* Deputy Chairman of ver.di Vereinte Dienstleistungsgewerkschaft until October 31, 2011, Hamburg
Sir Peter Job until May 26, 2011, London
Prof. Dr. Henning Kagermann President of acatech – German Academy of Science and Engineering, Königs Wusterhausen
Peter Kazmierczak* until October 25, 2011, Deutsche Bank AG, Herne
Martina Klee* Deutsche Bank AG, Frankfurt am Main
Suzanne Labarge Toronto
Maurice Lévy Chairman and Chief Executive Officer of Publicis Groupe S.A., Paris
Henriette Mark* Deutsche Bank AG, Munich
Gabriele Platscher* Deutsche Bank Privat- und Geschäftskunden AG, Braunschweig
Dr. Theo Siegert Managing Partner of de Haen Carstanjen & Söhne, Dusseldorf
Dr. Johannes Teyssen Chairman of the Management Board of E.ON AG, Oberding
Marlehn Thieme* Deutsche Bank AG, Bad Soden am Taunus
Tilman Todenhöfer Managing Partner of Robert Bosch Industrietreuhand KG, Madrid
Stefan Viertel* Deutsche Bank AG, Bad Soden am Taunus
Renate Voigt* since November 30, 2011 Deutsche Bank AG, Stuttgart
Werner Wenning Chairman of the Supervisory Board of E.ON AG since May 5, 2011, Leverkusen
* Elected by the employees in Germany; except for Renate Voigt who was appointed by the court as employee representative.
Supervisory Board

Deutsche Bank 05 – Supplementary Information 429 Financial Report 2011 Supervisory Board
Committees
Chairman’s Committee Dr. Clemens Börsig – Chairman
Alfred Herling*
Karin Ruck*
Tilman Todenhöfer
Mediation Committee Dr. Clemens Börsig – Chairman
Wolfgang Böhr*
Karin Ruck*
Tilman Todenhöfer
Audit Committee Dr. Karl-Gerhard Eick – Chairman
Dr. Clemens Börsig
Sir Peter Job until May 26, 2011
Henriette Mark*
Karin Ruck*
Dr. Theo Siegert since August 1, 2011
Marlehn Thieme*
Risk Committee Dr. Clemens Börsig – Chairman
Sir Peter Job until May 26, 2011
Prof. Dr. Henning Kagermann
Suzanne Labarge since August 1, 2011 (substitute member until July 31, 2011)
Dr. Theo Siegert – substitute member
Nomination Committee Dr. Clemens Börsig – Chairman
Tilman Todenhöfer
Werner Wenning
* Elected by the employees in Germany.

Deutsche Bank 05 – Supplementary Information 430 Financial Report 2011 Advisory Boards
European Advisory Board
Professor Dr.-Ing. Wolfgang Reitzle – Chairman Chairman of the Management Board of Linde AG, Munich
Professor Dr. h.c. Roland Berger Founder of Roland Berger Strategy Consultants GmbH, Munich
Dr. Kurt Bock Chairman of the Management Board of BASF SE since May 6, 2011, Ludwigshafen
Lord John Browne of Madingley Managing Director and Managing Partner (Europe) of Riverstone Holdings LLC; former Chief Executive Officer of BP, London
Michael Cohrs Former Member of the Management Board of Deutsche Bank AG, London
Dr. Karl-Ludwig Kley Chairman of the Executive Board and General Partner of Merck KGaA, Darmstadt
Peter Löscher Chairman of the Management Board of Siemens Aktiengesellschaft, Munich
Francis Mer Former French Minister of Economy, Finance and Industry, Bourg-la-Reine
Alexey A. Mordashov Chairman of the Board of Directors of Severstal; Director General of Severstal-Group, Cherepovets
Dr. h.c. August Oetker General Partner of Dr. August Oetker KG, Bielefeld
Eckhard Pfeiffer until March 17, 2011 Former President and Chief Executive Officer of Compaq Computer Corporation, Kitzbühel
Dr. Bernd Pischetsrieder Urfahrn
Antonio Puri Purini Former Ambassador of Italy to the Republic of Germany, Rome
Dr. rer. pol. Michael Rogowski Former Chairman of the Supervisory Board of J. M. Voith AG, Heidenheim
Maria-Elisabeth Schaeffler Partner of the Schaeffler Group and Deputy Chairperson of the Supervisory Board of Schaeffler AG, Herzogenaurach
Jürgen R. Thumann Chairman of the Shareholders’ Com-mittee of Heitkamp & Thumann KG, Dusseldorf
Dr. Dieter Zetsche Chairman of the Management Board of Daimler AG and Head of Mercedes-Benz Cars, Stuttgart
Advisory Boards

Deutsche Bank 05 – Supplementary Information 431 Financial Report 2011 Advisory Boards
Americas Advisory Board
Norman Augustine Former Chairman & Chief Executive Officer, Lockheed Martin
John E. Bryson until October 20, 2011 U.S. Secretary of Commerce; former Chairman & Chief Executive Officer, Edison International
Michael D. Capellas Chairman & Chief Executive Officer, Virtual Computing Environment (VCE); former Chairman & Chief Executive Officer, First Data Corp.
James Ireland Cash, Jr. PhD Emeritus Professor and Senior Associate Dean, Harvard Business School
Anthony W. Deering Chairman, Exeter Capital LLC; former Chairman & Chief Executive Officer, The Rouse Co.
Archie W. Dunham Former Chairman, ConocoPhillips
Benjamin H. Griswold Chairman, Brown Advisory; former Senior Chairman, Deutsche Bank Alex. Brown
The Honorable Chuck Hagel Distinguished Professor, Georgetown University and the University of Nebraska at Omaha; former U.S. Senator, (R-NE)
William R. Howell Former Chairman & Chief Executive Officer, J. C. Penney, Inc.
Robert L. Johnson, Emeritus Member Founder & Chairman, The RLJ Cos.; Founder and former Chairman, Black Entertainment Television (BET)
Edward A. Kangas Former Chairman & Chief Executive Officer, Deloitte
Ellen R. Marram President, The Barnegat Group LLC; former President & Chief Executive Officer, Tropicana and Nabisco Biscuit Cos.
The Honorable Lynn M. Martin Former U.S. Secretary of Labor
Robert P. May until April 2, 2011 Former Chief Executive Officer, Cal-pine Corp.; former Chairman & Chief Executive Officer, HealthSouth Corp.
George J. Mitchell since August 8, 2011 Former Special Envoy for Middle East Peace; former Chairman, Walt Disney; former U.S. Senator, (D-ME)
The Honorable John W. Snow Chairman, Cerberus Capital Management LP; former U.S. Secretary of the Treasury

Deutsche Bank 05 – Supplementary Information 432 Financial Report 2011 Advisory Boards
Latin American Advisory Board
Fernando Henrique Cardoso Former President of the Federative Republic of Brazil
Armando Garza Sada Chairman, Alfa
Enrique Iglesias Ibero-American Secretary-General; former Minister of Foreign Relations Uruguay
Pedro Pablo Kuczynski Partner & Senior Advisor, The Rohatyn Group; former Prime Minister of Peru
The Honorable Lynn M. Martin Former U.S. Secretary of Labor
Luis Alejandro Pagani President, Arcor Group
Horst Paulmann Founder & President, Cencosud S.A.
Jesús Reyes-Heroles Former Chairman & Chief Executive Officer, Petroleos Mexicanos (Pemex); former Ambassador of Mexico to the United States of America
Miguel Urrutia Montoya Professor, Universidad de los Andes; former Governor of the Central Bank Colombia

Deutsche Bank 05 – Supplementary Information 433 Financial Report 2011 Advisory Boards
Asia Pacific Advisory Board
Robert E. Fallon Adjunct Professor, Finance and Economics, Columbia Business School, International
Toru Hashimoto until June 23, 2011 President of Development Bank of Japan, Former President & Chief Executive Officer and former Chairman, The Fuji Bank Ltd.; former Chairman, Deutsche Securities Inc., Japan
Nobuyuki Idei Founder & Chief Executive Officer, Quantum Leaps Corporation; Chairman of the Advisory Board, Sony Corporation, Japan
Gang-Yon Lee Chairman, Korea Gas Corporation, Korea
Dr. David K.P. Li Chairman and Chief Executive Officer, The Bank of East Asia, Hong Kong
Dr. Li Qingyuan Director-General, Office of Strategy and Development Committee, China Securities Regulatory Commission, China
Subramanian Ramadorai Vice Chairman, Tata Consultancy Services Limited, India
Dr. Tony Tan Keng Yam until September 1, 2011 President of the Republic of Singa-pore; Deputy Chairman and Execu-tive Director, The Government of Singapore Investment Corp. Pte. Ltd., Singapore
Sofjan Wanandi Chairman, Santini Group; Chairman of Employers Association of Indonesia (APINDO), Indonesia
Professor Zhang Yunling Professor of International Economics and Academy Member, Chinese Academy of Social Science, China

Deutsche Bank 05 – Supplementary Information 434 Financial Report 2011 Advisory Boards
Climate Change Advisory Board
Lord John Browne of Madingley Managing Director and Managing Partner (Europe), Riverstone Holdings LLC; former Chief Executive Officer, BP
John Coomber Chief Executive Officer, the Pension Corporation; Chairman, ClimateWise; Chairman, The Climate Group (UK)
Fabio Feldmann Chief Executive Officer, Fabio Feldmann Consultores; former Executive Secretary, Brazilian Forum on Climate Change
Dr. Jamshed J. Irani since May 3, 2011 Former Director, Tata Sons Ltd. Amory B. Lovins Chairman & Chief Scientist, Rocky Mountain Institute
Lord Oxburgh Member of the Advisory Board, Climate Change Capital; former Chairman, Shell
Professor Hans Joachim Schellnhuber Founding Director, Potsdam Institute for Climate Impact Research (PIK)
Professor Robert Socolow Co-Director, The Carbon Mitigation Initiative; Professor, Princeton University
Professor Dr. Dr. h.c. mult. Klaus Töpfer Former Federal Minister for the Environment, Nature Conservation and Nuclear Safety as well as for Regional Planning, Construction and Urban Development; former Execu-tive Director of the United Nations Environment Programme (UNEP)
Deutsche Bank 05 – Supplementary Information 435 Financial Report 2011 Group Five-Year Record
Balance Sheet in € m. Dec 31, 2011 Dec 31, 2010 Dec 31, 2009 Dec 31, 2008 Dec 31, 2007
Total assets 2,164,103 1,905,630 1,500,664 2,202,423 1,925,003 Loans 412,514 407,729 258,105 269,281 198,892 Total liabilities
1 2,109,443 1,855,262 1,462,695 2,170,509 1,885,688 Total shareholders' equity
1 53,390 48,819 36,647 30,703 37,893 Noncontrolling interests 1,270 1,549 1,322 1,211 1,422 Tier 1 capital
2 49,047 42,565 34,406 31,094 28,320 Total regulatory capital
2 55,226 48,688 37,929 37,396 38,049 Income Statement in € m. 2011 2010 2009 2008 2007
Net interest income 17,445 15,583 12,459 12,453 8,849 Provision for credit losses 1,839 1,274 2,630 1,076 612 Commissions and fee income 11,544 10,669 8,911 9,741 12,282 Net gains (losses) on financial assets/liabilities at fair value through profit or loss 3,058 3,354 7,109 (9,992) 7,175 Other noninterest income (loss) 1,181 (1,039) (527) 1,411 2,523
Total noninterest income 15,783 12,984 15,493 1,160 21,980
Compensation and benefits 13,135 12,671 11,310 9,606 13,122 General and administrative expenses 12,657 10,133 8,402 8,339 8,038 Policyholder benefits and claims 207 485 542 (252) 193 Impairment of intangible assets − 29 (134) 585 128 Restructuring activities − − − − (13)
Total noninterest expenses 25,999 23,318 20,120 18,278 21,468
Income (loss) before income taxes 5,390 3,975 5,202 (5,741) 8,749
Income tax expense (benefit) 1,064 1,645 244 (1,845) 2,239
Net income (loss) 4,326 2,330 4,958 (3,896) 6,510
Net income (loss) attributable to noncontrolling interests 194 20 (15) (61) 36 Net income (loss) attributable to Deutsche Bank shareholders 4,132 2,310 4,973 (3,835) 6,474 Key figures 2011 2010 2009 2008 2007
Basic earnings per share
3 € 4.45 € 3.07 € 7.21 (€ 6.87) € 12.29 Diluted earnings per share
3 € 4.30 € 2.92 € 6.94 (€ 6.87) € 11.80 Dividends paid per share in period € 0.75 € 0.75 € 0.50 € 4.50 € 4.00 Return on average shareholders’ equity (post-tax) 8.2 % 5.5 % 14.6 % (11.1) % 17.9 % Pre-tax return on average shareholders' equity 10.2 % 9.5 % 15.3 % (16.5) % 24.1 % Cost/income ratio 78.2 % 81.6 % 72.0 % 134.3 % 69.6 % Core Tier 1 capital ratio
2 9.5 % 8.7 % 8.7 % 7.0 % 6.9 % Tier 1 capital ratio
2 12.9 % 12.3 % 12.6 % 10.1 % 8.6 % Total capital ratio
2 14.5 % 14.1 % 13.9 % 12.2 % 11.6 % Employees (full-time equivalent)
4 100,996 102,062 77,053 80,456 78,291 1 The initial acquisition accounting for ABN AMRO, which was finalized at March 31, 2011, resulted in a retrospective adjustment of retained earnings of € (24) million for
December 31, 2010. 2 Figures presented for 2011 are based on the amended capital requirements for trading book and securitization positions following the Capital Requirements Directive 3, also known as
“Basel 2.5”, as implemented in the German Banking Act and the Solvency Regulation (“Solvabilitätsverordnung”). Figures presented for 2010, 2009 and 2008 are pursuant to the revised capital framework presented by the Basel Committee in 2004 (“Basel 2”) as adopted into German law by the German Banking Act and the Solvency Regulation. Figures presented for 2007 are based on the Basel 1 framework. The capital ratios relate the respective capital to risk weighted assets for credit, market and operational risk. Excludes transitional items pursuant to Section 64h (3) of the German Banking Act.
3 The number of average basic and diluted shares outstanding has been adjusted for all periods before October 6, 2010 to reflect the effect of the bonus element of the subscription rights issue in connection with the capital increase.
4 Deutsche Postbank aligned its FTE definition to Deutsche Bank which reduced the Group number as of December 31, 2011 by 260 (prior periods not restated).
Group Five-Year Record

Deutsche Bank 05 – Supplementary Information 436 Financial Report 2011 Declaration of Backing
Deutsche Bank AG ensures, except in the case of political risk, that the following companies are able to meet their contractual liabilities:
DB Investments (GB) Limited, London
Deutsche Asset Management International GmbH, Frankfurt am Main
Deutsche Asset Management Investmentgesellschaft mbH vormals DEGEF Deutsche Gesellschaft für Fondsverwaltung mbH, Frankfurt am Main
Deutsche Australia Limited, Sydney
DEUTSCHE BANK A.Ş., Istanbul
Deutsche Bank Americas Holding Corp., Wilmington
Deutsche Bank (China) Co., Ltd., Beijing
Deutsche Bank Europe GmbH, Frankfurt am Main
Deutsche Bank Luxembourg S.A., Luxembourg
Deutsche Bank (Malaysia) Berhad, Kuala Lumpur
Deutsche Bank Polska Spólka Akcyjna, Warsaw
Deutsche Bank S.A., Buenos Aires
Deutsche Bank S.A. – Banco Alemão, Sao Paulo
Deutsche Bank, Sociedad Anónima Española, Madrid
Deutsche Bank Società per Azioni, Milan
Deutsche Bank (Suisse) S.A., Geneva
Deutsche Bank Trust Company Americas, New York
Deutsche Futures Singapore Pte Ltd, Singapore
Deutsche Holdings (Malta) Ltd., St. Julians
Deutsche Morgan Grenfell Group Public Limited Company, London
Deutsche Securities Asia Limited, Hong Kong
Deutsche Securities Limited, Hong Kong
DWS Holding & Service GmbH, Frankfurt am Main
DWS Investment GmbH, Frankfurt am Main
DWS Investment S.A., Luxembourg
IFN Finance B.V., Rotterdam
Public joint-stock company “Deutsche Bank DBU”, Kiev
OOO “Deutsche Bank”, Moscow
Declaration of Backing

Deutsche Bank 05 – Supplementary Information 437 Financial Report 2011 Glossary
A Alternative A (Alt-A) Used as a term to categorize U.S. mort-gages representing loans with a higher expectation of risk than prime but still lower than subprime. In order to deter-mine Alt-A industry standards including FICO scores and loan-to-value ratios are applied.
Alternative Assets/Investments Direct investments in private equity, venture capital, mezzanine capital, real estate capital investments and investments in leveraged buyout funds, venture capital funds and hedge funds.
Asset-backed Securities Particular type of securitized payment receivables in the form of tradable securi-ties. These securities are created by the repackaging of certain financial assets ( securitization).
Associate An entity in which the Group has significant influence, but not a controlling interest, over the operating and financial manage-ment policy decisions of the entity. The entity is neither a subsidiary nor a joint venture.
Auction Rate Securities Debt instrument with a long-term nominal maturity (usually 20 to 30 years) with a variable interest rate. The interest rate is regularly reset through an auction.
Average Active Equity The Group calculates active equity to make comparisons to its competitors easier and refers to active equity in several ratios. However, active equity is not a measure provided for in IFRS and therefore the Group’s ratios based on average active equity should not be compared to other companies’ ratios without considering the differences in the calculation. The items for which the Group adjusts average share-holders’ equity are average accumulated other comprehensive income (loss) exclud-ing foreign currency translation (all compo-nents net of applicable taxes), as well as average dividends, for which a proposal is accrued on a quarterly basis and which are paid after the approval by the Annual Gen-eral Meeting following each year.
B Backtesting A procedure used to verify the predictive power of the value-at-risk calculations involving the comparison of hypothetical daily profits and losses under the buy- and-hold assumption with the estimates from the value-at-risk model.
Basel 2 Recommendations for international capital adequacy standards adopted by the Basel Committee on Banking Supervision, widely referred to as Basel 2 capital framework, which aligns capital requirements more closely with the underlying risks.
Basel 2.5 Proposals of the Basel Committee on Banking Supervision originally dated July 2009 for the reform of the Basel framework in the wake of the financial crisis. The minimum capital requirements mainly comprise the introduction of new measures for market risk in addition to value-at-risk: Stressed value-at-risk, incre-mental risk charge, the comprehensive risk measure for the correlation trading portfolio consisting of specific securitization positions and the application of the mar-ket risk standardized approach for trading book securitizations and nth-to-default credit derivatives. Further requirements contain governance, risk management and compensation standards as well as disclo-sure requirements focusing on securitiza-tions. On the level of the European Union, Basel 2.5 has been implemented in the Capital Requirements Directives (CRD) 2 and 3.
Basel 3 Revision of the international capital ade-quacy standards adopted by the Basel Committee on Banking Supervision, which was endorsed by the G-20 summit in No-vember 2010. Aim of the revision is to strengthen global capital and liquidity rules promoting a more resiliant banking sector. During a transition period until 2019 the revised standards not only increase the minimum capital requirements for banks but also introduce an additional capital conservation buffer as well as a bank specific countercyclical capital buffer. Basel 3 will also introduce an internation-ally harmonized liquidity framework for the first time with strict short- and long-term ratios. The new rules will be adopted into German law by means of the German Solvency Regulation.
Glossary

Deutsche Bank 05 – Supplementary Information 438 Financial Report 2011 Glossary
Book Value per Basic Share Outstanding Book value per basic share outstanding is defined as shareholders’ equity divided by the number of basic shares outstanding (both at period end).
Broker/Brokerage Brokers accept orders to buy and sell securities from banks and private investors and execute them on behalf of the cus-tomer. For this activity, the broker usually receives a commission.
Business Combination A transaction in which an acquirer obtains control of a business. This includes the acquisition of stocks of a company or its net assets, and may also involve the ex-pansion of an existing equity interest ( step acquisitions). Often present in a business combination is the recognition of goodwill.
Business Risk Risk that arises from potential changes in general business conditions, such as mar-ket environment, client behavior and tech-nological progress, which can affect the Group’s earnings if the Group is unable to adjust quickly to them.
Buy-out Purchase (in full or in part) of a company or specific corporate activities.
C Cash Management Refers to the management of liquid assets in U.S. dollars, euro and other currencies for companies and financial institutions to optimize financial transactions.
Clearing The process of transmitting, reconciling and, in some cases, confirming payment orders.
Collateralized Debt Obligations (CDOs) Asset-backed securities based on a portfolio of assets that can include bonds, loans or derivatives.
Commercial Mortgage-backed Securities (CMBS) Mortgage-backed securities (MBS), which are backed by commercial mortgage loans.
Compensation Ratio Compensation and benefits as a percent-age of total net revenues, which is defined as net interest income before provision for credit losses plus noninterest income.
Comprehensive Risk Measure Measure of potential losses for nth-to-default credit derivatives and securitiza-tions within the correlation trading portfo-lio that will not be exceeded with a probability of 99.9 % during a 1-year port-folio holding period. The comprehensive risk measure is effective since 31 Decem-ber 2011 and may be used subject to supervisory approval. It is based on an internal model and must capture all price risk. The capital requirement resulting from the comprehensive risk measure is floored at 8 % of the capital requirement that would result from the market risk standardized approach for the respective portfolio.
Confidence Level In the framework of value-at-risk and economic capital the level of probability that the actual loss will not exceed the potential loss estimated by the value-at-risk or economic capital number.
Core Tier 1 Capital The Group defines core Tier 1 capital as Tier 1 capital without hybrid capital instruments. It consists of share capital and reserves adjusted by regulatory items.
Correlation Trading Portfolio The correlation trading portfolio comprises securitizations and corresponding hedges that fulfil strict eligibility criteria regarding the securitized portfolio and liquidity in the trading book. The correlation trading portfolio may be exempt from appli-cation of the market risk standardized approach. Capital requirements for the correlation trading portfolio are instead based on the comprehensive risk meas-ure.
Cost/Income Ratio A ratio expressing a company’s cost effec-tiveness which sets operating expenses in relation to operating income.
Country Risk The risk that the Group may suffer a loss, in any given country, due to deterioration in economic conditions, political and social unrest, nationalization and expropriation of assets, government repudiation of external indebtedness, exchange controls and currency depreciation or devaluation.

Deutsche Bank 05 – Supplementary Information 439 Financial Report 2011 Glossary
Credit Default Swap A credit derivative which hedges credit risks related to loans, bonds or other bor-rower related securities. The secured party usually makes a periodic payment of a fixed coupon over a specified term and only receives a compensation at the occurence of a credit event, as defined on the date of the agreement, e.g. default of repayment due to insolvency of the creditor.
Credit Derivatives Financial instruments which transfer credit risk connected with loans, bonds or other risk-weighted assets or market risk positions to parties providing protection. This does not alter or reestablish the un-derlying credit relationship of the original risk-takers (parties selling the credit risks).
Credit Risk Risk that customers may not be able to meet their contractual payment obligations. Credit risk includes default risk, country risk and settlement risk.
Credit Spread Yield spread for debt securities. The credit spead compensates the investor for the credit risk related to the investment in relation to the yield on a credit risk-free benchmark security. The lower the rating of the debt issuing company, the higher is the credit spread.
Custody Custody and administration of securities as well as additional securities services.
D Deferred Taxes Deferred tax assets and liabilities are recognized for future tax consequences attributable to temporary differences be-tween the financial statement carrying amounts of existing assets and liabilities and their respective tax bases, unused tax losses and unused tax credits.
Derivatives Financial instruments whose value derives largely from the price, price fluctuations and price expectations of an underlying instrument (e.g. share, bond, foreign ex-change or index). Derivatives include swaps, options and futures.
E Earnings per Share Key figure determined according to IFRS and expressing a company’s net income attributable to its shareholders in relation to the average number of common shares outstanding. Apart from basic earn-ings per share, diluted earnings per share must also be reported if the assumed conversion and exercise of outstanding share options, unvested deferred share awards and convertible debt and certain forward contracts could increase the num-ber of shares.
Economic Capital A figure which states with a high degree of certainty the amount of equity capital the Group needs at any given time to absorb unexpected losses arising from current exposures.
EMEA Abbreviation for the economic zone that comprises Europe, Middle East and Africa.
Emerging Markets Countries and their financial markets with fast growing economies that are on the verge of becoming developed countries.
Equity Method Valuation method for investments in com-panies over which significant influence can be exercised. The pro-rata share of the company’s net income (loss) increases (decreases) the carrying value of the in-vestment affecting net income. Distribu-tions decrease the carrying value of the investment without affecting net income.
Event Risk Scenarios Scenarios representing important events, e.g. large movements in interest or ex-change rates.
Expected Loss Measurement of loss that can be expected within a one-year period from credit risk and operational risk based on historical loss experience.
Exposure The amount which the bank may lose in case of losses incurred due to risks taken, e.g. in case of a borrower’s or counter-party’s default.
Exposure at Default (EAD) The expected amount of the credit expo-sure to a counterparty at the time of a default.

Deutsche Bank 05 – Supplementary Information 440 Financial Report 2011 Glossary
F Fair Value Amount at which assets or liabilities would be exchanged between knowledgeable, willing and independent counterparties, other than in a forced or liquidation sale.
FICO Scores FICO is an acronym for the Fair Isaac Corporation, the creators of the FICO score. Using mathematical models, the FICO score takes into account various factors in each of these five areas to determine credit risk: Payment history, current level of indebtedness, types of credit used, length of credit history, and new credit. A FICO score will range between 300 and 850. In general, a FICO score above 650 indicates that the individual has a very good credit history. For scores below 620 it will often be more difficult to obtain financing at a favor-able rate.
Futures Forward contracts standardized with re-spect to quantity, quality and delivery date, in which an instrument traded on the money, capital, precious metal or foreign exchange markets, is to be delivered or received at an agreed price at a certain future time. Cash settlement is often stipu-lated for such contracts (e.g. futures based on equity indices) to meet the obligation (instead of delivery or receipt of securities).
G German Solvency Regulation German regulation governing the capital adequacy of institutions, groups of institu-tions and financial holding groups which adopted the revised capital framework of the Basel Committee from 2004 with further amendments in 2009, widely referred to as Basel 2.5, into German law.
Goodwill An asset representing the future economic benefits from assets acquired in a busi-ness combination that are not individually identifiable. Goodwill is recognized as the positive excess amount between the fair values of the consideration transferred by the acquirer and the identifiable assets and liabilities of the acquired business.
H Hedge Accounting Financial reporting of agreements in a hedging relationship which is subject to certain conditions. The relationship be-tween the agreements is based on oppo-site terms which cause financial risks that can be compensated in whole or part due to the terms of these agreements. One agreement is usually referred to as underly-ing transaction – i.e. the contract that causes the risk – the other is referred to as hedging contract, which mitigates the risk.
Hedge Fund A fund whose investors are generally institutions and wealthy individuals. Hedge funds are part of alternative investments. They are subject to less stringent or no regulatory obligations and can therefore employ strategies which mutual funds are not permitted to use, e.g. strategies involv-ing short selling, leveraging and deriva-tives. Hedge funds offer chances for high profits but also bear the risk of losing in-vested capital, thus their returns are uncor-related with traditional investment returns.
High Yield Debt Fixed income securities where the issuer has a low credit rating. They offer a higher return than investment-grade securities but also entail greater risks.
I ICAAP ICAAP (Internal Capital Adequacy As-sessment Process) requires banks to identify and assess risks, maintain suffi-cient capital to face these risks and apply appropriate risk-management techniques to ensure capital adequacy on an ongoing basis, i.e internal capital supply to exceed internal capital demand. Internal capital adequacy is defined under a “gone concern” approach.
IFRS (International Financial Reporting Standards)/previously IAS (International Accounting Standards) Financial Reporting Rules of the Interna-tional Accounting Standards Board de-signed to ensure globally transparent and comparable accounting and disclosure. Main objective is to present information that is useful in making economic decisions, mainly for investors.
Incremental Risk Charge Measure of potential losses due to migra-tion and default risk that are not fully re-flected in value-at-risk and will not be exceeded with a probability of 99.9 % assuming a 1-year risk horizon. The incre-mental risk charge was introduced on 31 December 2011 and applies to non-securitization position subject to specific interest rate risk in the trading book.
Investment Banking Generic term for capital market-oriented business. This includes primarily the issu-ance and trading of securities and their derivatives, interest and currency man-agement, corporate finance, M&A advisory, structured finance and private equity.
IPO An IPO is the first offer and sale of a corpo-ration’s shares to investors on a public stock exchange.

Deutsche Bank 05 – Supplementary Information 441 Financial Report 2011 Glossary
J Joint Venture A jointly controlled entity exists when the Group has a contractual arrangement with one or more parties to undertake activities through entities which are subject to joint control.
L Leverage Ratio The ratio of total assets to equity.
Leveraged Financing Financing of an investment which typically includes a very high amount of external debt (leverage) in the purchase price fi-nancing.
Liquidity Risk The risk arising from the Group’s potential inability to meet all payment obligations when they come due or only being able to meet these obligations at excessive costs.
Loan-to-value (LTV) Ratios Ratio of amount of loan to value of property.
Loss Given Default (LGD) The likely loss intensity in case of a coun-terparty default. Its estimation represents, expressed as a percentage, the part of the exposure that cannot be recovered in a default event and therefore captures the severity of a loss.
M Market Risk The risk that arises from the uncertainty concerning changes in market prices and rates (including interest rates, equity prices, foreign exchange rates and commodity prices), the correlations among them and their levels of volatility.
Market Risk Standardized Approach The market risk standardized approach applies to nth-to-default credit derivatives and securitizations in the trading book. The only exemption from the use of the standardised approach applies to the correlation trading portfolio, for which an internal model, the comprehensive risk measure, may be used subject to supervi-sory approval.
Mark-to-market Valuation Valuation at current market prices. Applies, for instance, to trading activities.
Mezzanine Flexible, mixed form of financing compris-ing equity and debt capital. Here: long-term subordinated financing instrument used to finance growth while at the same time strengthening the borrower’s economic equity capital base.
Monoline Insurers Insurers, which provide credit insurance to debt issuers and other market participants.
Monte Carlo Simulation Monte Carlo methods are used to value and analyze (complex) instruments, portfo-lios and investments by simulating the various sources of uncertainty affecting their value, and then determining their average value over the range of resultant outcomes.
Mortgage-backed Securities (MBS) Asset-backed securities, which are backed by mortgage loans. Subcategories are residential mortgage-backed securi-ties (RMBS) and commercial mortgage-backed securities (CMBS).
N Negative Goodwill Recognized in a business combination as a credit to the income statement for the excess of the acquirer’s interest in the net fair value of the acquiree’s identifiable assets and liabilities over the consideration transferred for the acquired interest.
Netting Agreements Bilateral agreements between the Group and its counterparties with regard to the included transactions which ensure that, if solvency or bankruptcy proceedings are initiated, only a single net amount is owed by one party to the other from the netting of all claims and liabilities.
Non-compensation Ratio Non-compensation noninterest expenses, which are defined as total noninterest expenses less compensation and benefits, as a percentage of total net revenues, which is defined as net interest income before provision for credit losses plus noninterest income.
Noncontrolling Interest Represents the equity in a subsidiary not attributable, directly or indirectly, to a par-ent.
Nth-to-default credit derivatives Financial derivatives whose payoffs are linked to the number (N) of defaults in a pool of securities or reference entities. Once the specified number of defaults is reached, the contract terminates and po-tential claims under the contract are settled.

Deutsche Bank 05 – Supplementary Information 442 Financial Report 2011 Glossary
O Operational Risk Potential for incurring losses in relation to employees, contractual specifications and documentation, technology, infrastructure failure and disasters, external influences and customer relationships. This definition includes legal and regulatory risk, but excludes business and reputational risk.
Option Right to purchase (call option) or sell (put option) a specific underlying (e.g. security or foreign exchange) from or to a counter-party (option seller) at a predetermined price on or before a specific future date.
OTC Derivatives Nonstandardized financial instruments ( derivatives) not traded on a stock ex-change, but directly between market par-ticipants (over-the-counter).
P Portfolio In general: part or all of one or all catego-ries of assets (e.g. securities, loans, equity investments or real estate). Portfolios are formed primarily to diversify risk. Here: combination of similar transactions, espe-cially in securities and/or derivatives, under price risk considerations.
Pre-tax Return on Average Active Equity Income before income tax expense attrib-utable to Deutsche Bank shareholders, which is defined as income before income taxes less noncontrolling interests, as a percentage of average active equity.
Prime Used as a term to categorize U.S. mort-gages representing high quality loans.
Prime Brokerage Suite of products including clearing and settlement, custody, reporting, and fi-nancing of positions for institutional inves-tors.
Private Banking Business with investment-oriented and high-net-worth clients.
Private Equity Equity investment in non-listed companies. Examples are venture capital and buyout funds.
Probability of Default (PD) The likelihood or probability of default (PD) of a counterparty is assessed over the next twelve months time horizon and expressed as a percentage. The Group does not rate through the cycle. PD is the primary meas-ure of creditworthiness of a counterparty. The numerical probabilities of default are mapped into a 26-grade rating scale that is similar to rating scales widely used by international rating agencies.
Projected Unit Credit Method The actuarial method, prescribed by IAS 19, used to determine the actuarial present value of an entity’s defined benefit obliga-tions and the related service cost. This method takes into account benefits accrued for employee service up to the reporting date and allows for expected rates of salary and pension increases.
R Rating The result of the objective assessment of the future economic situation – namely the default probability – of counterparties based on present characteristics and as-sumptions. The methodology for the rating assignment strongly depends on the cus-tomer type and the available data. A broad range of methodologies for the assessment of the credit risk is applied, such as expert systems and econometric ap-proaches.
Recoverable Amount The recoverable amount of an asset or a cash-generating unit is the higher of its fair value less costs to sell and its value in use.
Regulatory Capital Capital for banks recognized for regulatory purposes according to the Basel Capital Adequacy Accord of 2004 with further amendments in 2009. Capital according to Basel 2.5 consists of:
– Tier 1 capital: primarily share capital, reserves and certain trust preferred securities,
– Tier 2 capital: primarily participatory capital, cumulative preference shares, long-term subordinated debt and unreal-ized gains on listed securities,
– Tier 3 capital: mainly short-term subordi-nated debt and excess Tier 2 capital.
Tier 2 capital is limited to 100 % of Tier 1 capital and the amount of long-term subor-dinated debt that can be recognized as Tier 2 capital is limited to 50 % of Tier 1 capital.

Deutsche Bank 05 – Supplementary Information 443 Financial Report 2011 Glossary
Regulatory Capital Ratio Key figure for banks expressed as a per-centage ratio of regulatory capital to the overall regulatory risk position, comprised of credit, market and operational risks according to Basel 2.5. The minimum capital ratio to be complied with is 8 %.
Regulatory Trading Book and Banking Book The regulatory trading book is defined in Section 1a of the German Banking Act. It consists of financial instruments and com-modities held with trading intent or held for the purpose of hedging the market risk of other trading book positions; repurchase transactions, lending transactions and simi-lar transactions which relate to trading book positions; name-to-follow transactions; and receivables directly related to trading book positions. Financial instruments and com-modities assigned to the trading book must be tradable or able to be hedged. The regu-latory banking book comprises all positions that are not assigned to the trading book.
Repo (Repurchase Agreement) An agreement to repurchase securities sold (genuine repurchase agreement where the asset remains the seller’s property). From the buyer’s viewpoint, the transaction is a reverse repo.
Reputational Risk Risk that publicity concerning a transaction, counterparty or business practice involving a client will negatively impact the public’s trust in the Group.
Residential Mortgage-backed Securities (RMBS) Mortgage-backed securities (MBS), which are backed by residential mortgage loans.
Return on Average Total Shareholders’ Equity (RoE) In general: ratio showing the income situa-tion of a company, setting profit (net in-come) in relation to capital employed. Here: net income as a percentage of average capital employed over the year.
Risk-weighted Assets (RWA) Risk-weighted assets are positions that carry credit, market and/or opera-tional risk, weighted according to regulatory requirements. RWAs are regulatory capital requirements multiplied by 12.5, or in other words, capital requirements equal 8 % of RWA.
S Sarbanes-Oxley Act (SOx) U.S. capital market law passed in 2002 to strengthen corporate governance and restore investor confidence in response to a number of major corporate and account-ing scandals. Legislation establishes new or enhanced standards ranging from addi-tional Corporate Board responsibilities to criminal penalties for all companies that have listed their shares on a U.S. stock exchange.
Securitization Creation of tradable securities from loan claims, deposit positions (i.e. future cash flows) and ownership rights in the wider sense. Examples of securitized rights are asset-backed securities and mortgage-backed securities (MBS). Rights are often evidenced through so-called SPEs (special purpose entities), companies whose sole purpose is to issue these securities and whose assets are the ownership interests in the company.
Segment Information Disclosure of a company’s assets, income and other information, broken down by activity (division) and geographical area (region).
Shareholder Value Management concept that focuses strateg-ic and operational decision-making on the steady growth of a company’s value. The guiding principle is that only returns above the cost of capital add value for sharehold-ers.
Sovereign Credit Risk Exposure Credit risk towards sovereigns and sub-sovereigns. Includes sovereign, regional (incl. federal states, autonomic regions, etc.) and local governments, as well as certain bodies owned by central, regional or local governments.
Step Acquisition In a step acquisition, an acquirer obtains control of an acquiree in which it held an equity interest immediately before the acquisition date (also known as business combination achieved in stages). In these transactions, the acquirer remeasures its previously held equity interest at fair value and recognizes the resulting gain or loss, if any, in the income statement.
Stressed Value-at-Risk Measure of potential losses due to mar-ket risk under stressed market conditions that will not be exceeded with a probability of 99 % within a portfolio holding period of 10 days. Stressed value-at-risk must be calculated by banks using internal models for the determination of market risk and is effective since 31 December 2011. The measure is calculated using the value-at-risk model. In contrast to value-at-risk that uses model parameters based on current market conditions, stressed value-at-risk uses parameters that reflect a con-tinuous one-year stress period relating to significant losses for the bank.
Deutsche Bank 05 – Supplementary Information 444 Financial Report 2011 Glossary
Subprime Used as a term to categorize U.S. mort-gages representing loans with a higher expectation of risk. In order to determine subprime industry standards including FICO scores and loan-to-value ratios are applied.
Subsidiary The Group’s subsidiaries are those entities which it controls.
Swaps In general: exchange of one payment flow for another. Interest rate swap: exchange of interest payment flows in the same currency with different terms and conditions (e.g. fixed or floating). Currency swap: exchange of interest payment flows and principal amounts in different currencies.
T Target Definitions The target definition that relates to earnings excludes certain significant gains (such as gains from the sale of industrial holdings, businesses or premises) and certain sig-nificant charges (such as charges from restructuring, impairments of intangible assets or litigation) if they are not indicative of the future performance of Deutsche Bank core businesses.
Trust Preferred Securities Hybrid capital instruments characterized by profit-related interest payments. Under banking supervisory regulations they are part of Tier 1 capital if interest payments are not accumulated in case of losses (non-cumulative trust preferred securities) and if the instruments do not have a stated maturity date or if they are not redeemable at the option of the holder. Otherwise they are included in Tier 2 capital (for example cumulative trust preferred securities).
V Value in Use Value in use is the present value of the future cash flows expected to be derived from an asset or cash-generating unit.
Value-at-risk For a given portfolio, the value-at-risk is an estimate of the potential future loss (in terms of market value) that, under normal market conditions, will not be exceeded in a defined period of time and with a defined confidence level.
W Wrapped Bond Term for debt security insured or guaran-teed by a third party.
Deutsche Bank 05 – Supplementary Information 445 Financial Report 2011 Impressum – Publications
Deutsche Bank Aktiengesellschaft Taunusanlage 12 60262 Frankfurt am Main Germany Telephone: +49 69 9 10 00 [email protected]
Investor Relations: +49 69 9 10-3 80 80 [email protected]
Publications relating to our financial reporting Please note that Deutsche Bank Group’s annual report consists of two separate sections: Annual Review 2011 and Financial Report 2011.
— Annual Review 2011
(German and English)
— Financial Report 2011
(German and English)
— Annual Report 2011 on Form 20-F
(English)
— Annual Financial Statements and
Management Report of
Deutsche Bank AG 2011
(German and English)
— List of Advisory Council Members
(German)
— Corporate Social Responsibility –
Report 2011
(German and English) How to order: E-Mail – Internet [email protected] www.deutsche-bank.com/11 Fax +49 18 05 0 70 808 Phone +49 18 05 802 200 Mail arvato logistics services Bestellservice Deutsche Bank Gottlieb-Daimler-Straße 1 D-33428 Harsewinkel Germany Online Annual Review 2011 and Financial Report 2011 on the Internet: www.deutsche-bank.com/11
Cautionary statement regarding forward-looking statements This report contains forward-looking statements. Forward-looking statements are statements that are not historical facts; they include statements about our beliefs and expectations and the assumptions underlying them. These statements are based on plans, estimates and projections as they are currently available to the management of Deutsche Bank. Forward-looking statements therefore speak only as of the date they are made, and we undertake no obligation to update publicly any of them in light of new information or future events.
By their very nature, forward-looking statements involve risks and uncertainties. A number of important factors could therefore cause actual results to differ materially from those contained in any forward-looking statement. Such factors include the conditions in the financial markets in Germany, in Europe, in the United States and elsewhere from which we derive a substan-tial portion of our trading revenues, potential defaults of borrowers or trading counterparties, the implemen-tation of our management agenda, the reliability of our risk management policies, procedures and methods, and other risks referenced in our filings with the U.S. Securities and Exchange Commission. Such factors are described in detail in our SEC Form 20-F of March 20, 2012 in the section “Risk Factors”. Copies of this document are available upon request or can be down-loaded from www.deutsche-bank.com/ir
Impressum – Publications

Deutsche Bank
Deu
tsch
e B
ank
Fin
anci
al R
eport
201
1
2012April 26, 2012Interim Report as of March 31, 2011
May 31, 2012Annual General Meeting in the FesthalleFrankfurt am Main (Exhibition Center)
June 1, 2012Dividend payment
July 31, 2012Interim Report as of June 30, 2012
October 30, 2012Interim Report as of September 30, 2012
2013January 31, 2013�Preliminary�results�for�the�2012�financial�year
March 21, 2013Annual Report 2012 and Form 20-F
April 30, 2013Interim Report as of March 31, 2013
May 23, 2013 Annual General Meeting in the FesthalleFrankfurt am Main (Exhibition Center)
May 24, 2013Dividend payment
July 30, 2013Interim Report as of June 30, 2013
October 29, 2013Interim Report as of September 30, 2013
Financial Report 2011

![financial statements - Deutsche Bahn IR...64 deutSche Bahn ag 2014 management RepoRt and financial statements fixed aSSetS Schedule Jan 1, [€ million] acquisition and manufacturing](https://static.documents.pub/doc/80x56/5fb014bfa85b5f71af2696a9/financial-statements-deutsche-bahn-ir-64-deutsche-bahn-ag-2014-management.jpg)


