Financial Report. Summary Financial Report for the General Operating Funds of the Brunswick City School District Year Ended June 30, 2012 Presented by: Patrick K. East, Treasurer/CFO. Cash Balances. June 30, 2012 General Fund Ending Cash Balance $7,902,525 - PowerPoint PPT Presentation
1 Year End Summary Financial Year End Summary Financial Presentation Presentation Financial Report Financial Report Summary Financial Report for the Summary Financial Report for the General Operating Funds of the General Operating Funds of the Brunswick City School District Brunswick City School District Year Ended June 30, 2012 Year Ended June 30, 2012 Presented by: Presented by: Patrick K. East, Treasurer/CFO Patrick K. East, Treasurer/CFO
Transcript
11Year End Summary Financial Year End Summary Financial
PresentationPresentation
Financial ReportFinancial Report
Summary Financial Report for the General Summary Financial Report for the General Operating Funds of the Brunswick City Operating Funds of the Brunswick City
School District Year Ended June 30, 2012School District Year Ended June 30, 2012
Presented by:Presented by:
Patrick K. East, Treasurer/CFOPatrick K. East, Treasurer/CFO
22Year End Summary Financial Year End Summary Financial
PresentationPresentation
Cash BalancesCash Balances
June 30, 2012June 30, 2012
General Fund Ending Cash Balance General Fund Ending Cash Balance $7,902,525$7,902,525
33Year End Summary Financial Year End Summary Financial
PresentationPresentation
Days of Operating CashDays of Operating Cash
Based on a 240 day Operating Year, our Based on a 240 day Operating Year, our ending General Fun Cash Balance had an ending General Fun Cash Balance had an
equivalent reserve to cover:equivalent reserve to cover:
26 Days26 Days
44Year End Summary Financial Year End Summary Financial
PresentationPresentation
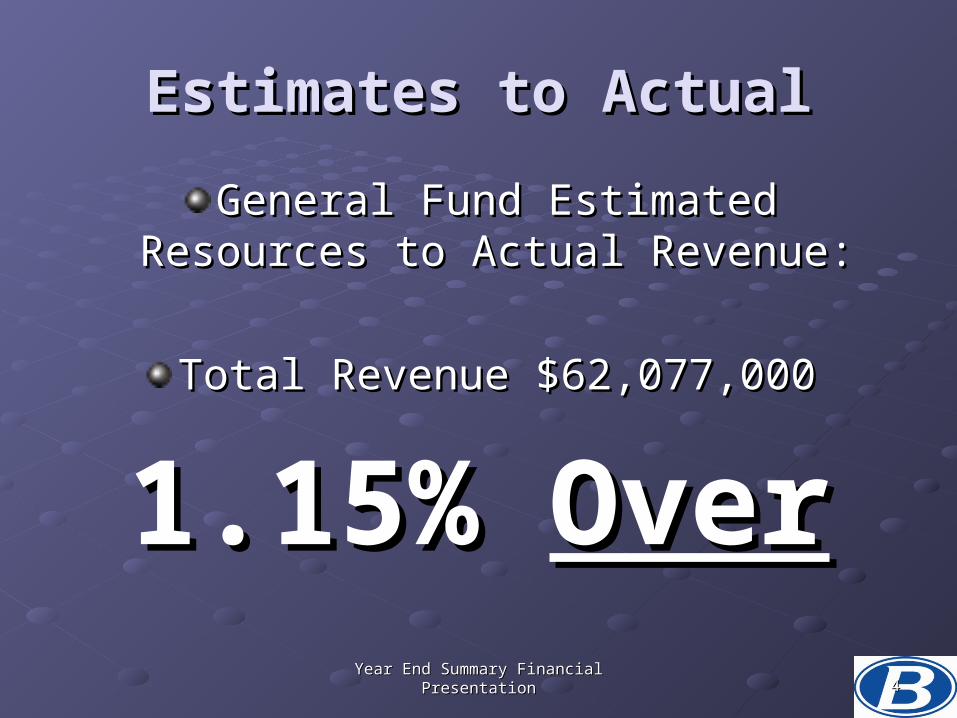
Estimates to ActualEstimates to Actual
General Fund Estimated Resources to General Fund Estimated Resources to Actual Revenue:Actual Revenue:
Total Revenue $62,077,000Total Revenue $62,077,000
1.15% 1.15% OverOver
55Year End Summary Financial Year End Summary Financial
PresentationPresentation
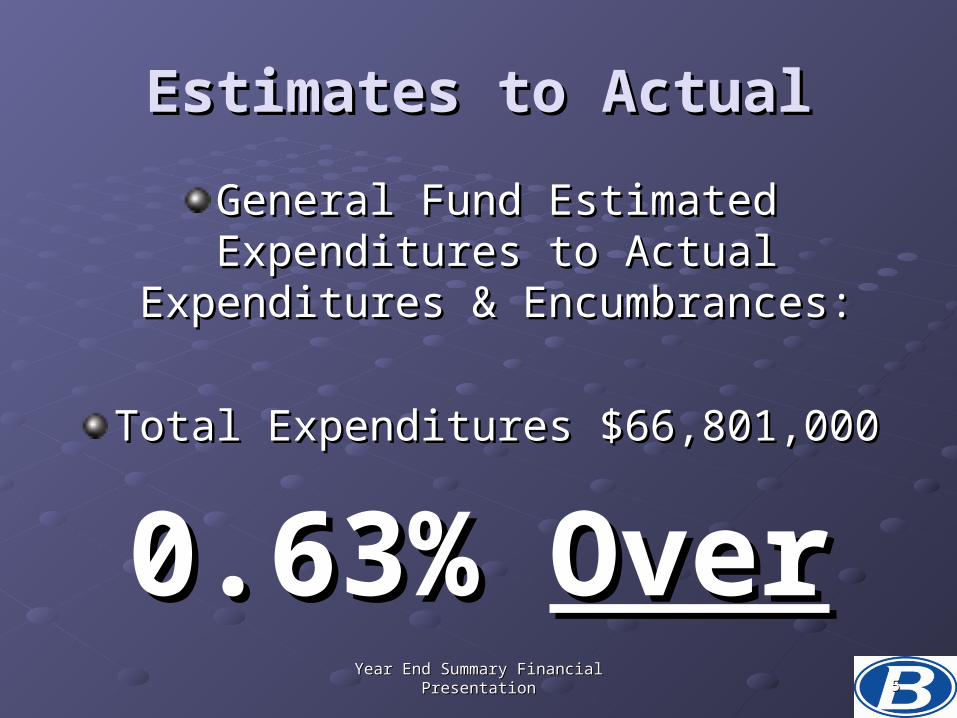
Estimates to ActualEstimates to Actual
General Fund Estimated Expenditures to General Fund Estimated Expenditures to Actual Expenditures & Encumbrances:Actual Expenditures & Encumbrances:
Total Expenditures $66,801,000Total Expenditures $66,801,000
0.63% 0.63% OverOver
Unencumbered CashUnencumbered Cash
FY 2013FY 2013 $1,129,000 est$1,129,000 est
FY 2012FY 2012 $7,333,000$7,333,000
FY 2011FY 2011 $11,137,000$11,137,000
FY 2010FY 2010 $11,693,000$11,693,000
FY 2009FY 2009 $9,889,000$9,889,000
FY 2008FY 2008 $5,948,000$5,948,000
FY 2007FY 2007 $1,961,000$1,961,000
FY 2006FY 2006 $1,547,000$1,547,00066
Year End Summary Financial Year End Summary Financial PresentationPresentation
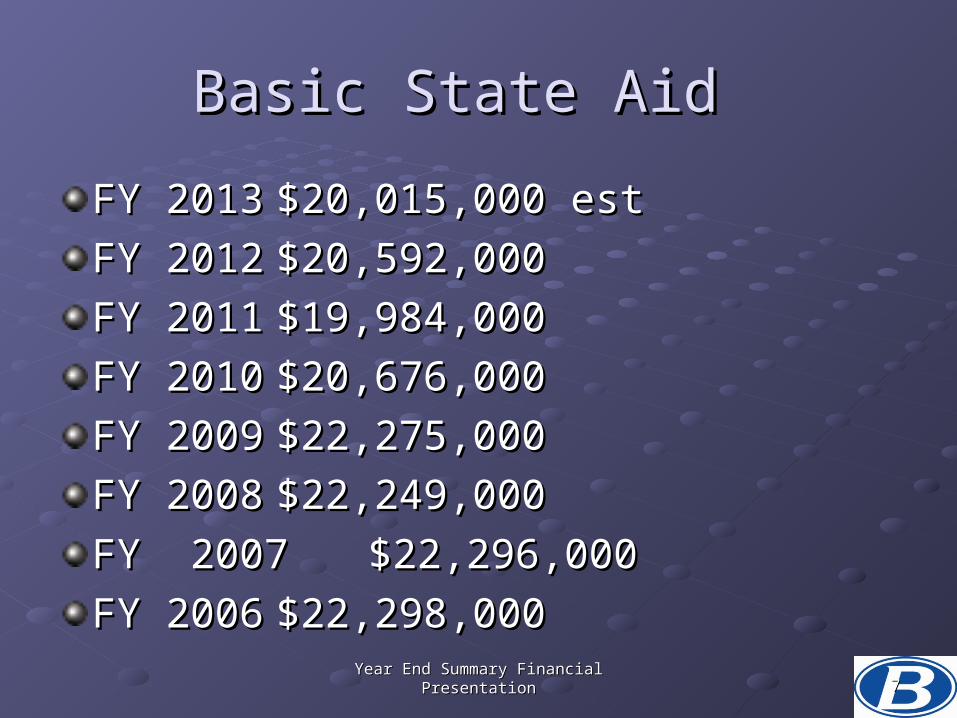
Basic State Aid Basic State Aid
FY 2013FY 2013 $20,015,000 est$20,015,000 est
FY 2012FY 2012 $20,592,000$20,592,000
FY 2011FY 2011 $19,984,000$19,984,000
FY 2010FY 2010 $20,676,000$20,676,000
FY 2009FY 2009 $22,275,000$22,275,000
FY 2008FY 2008 $22,249,000$22,249,000
FY 2007FY 2007 $22,296,000$22,296,000
FY 2006FY 2006 $22,298,000$22,298,00077
Year End Summary Financial Year End Summary Financial PresentationPresentation
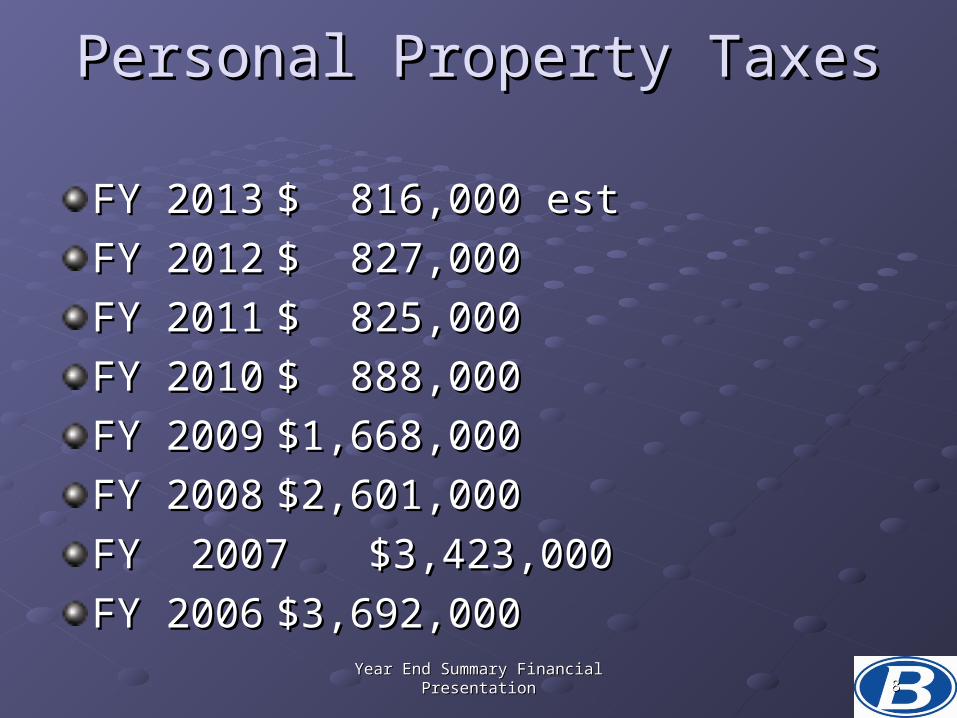
Personal Property TaxesPersonal Property Taxes
FY 2013FY 2013 $ 816,000 est$ 816,000 est
FY 2012FY 2012 $ 827,000$ 827,000
FY 2011FY 2011 $ 825,000$ 825,000
FY 2010FY 2010 $ 888,000$ 888,000
FY 2009FY 2009 $1,668,000$1,668,000
FY 2008FY 2008 $2,601,000$2,601,000
FY 2007FY 2007 $3,423,000$3,423,000
FY 2006FY 2006 $3,692,000$3,692,00088
Year End Summary Financial Year End Summary Financial PresentationPresentation
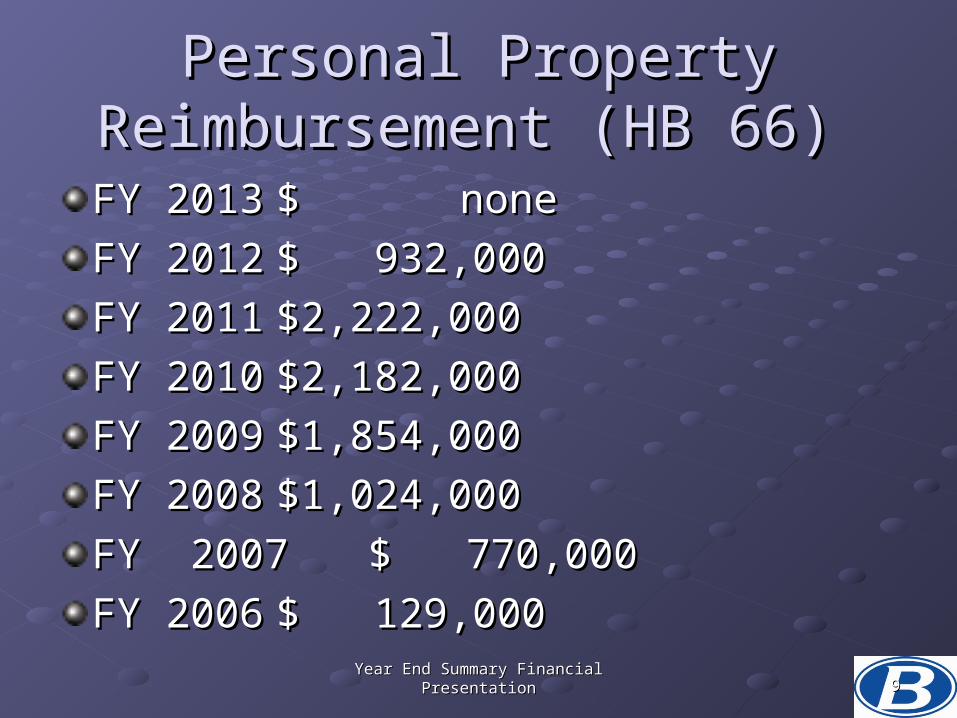
Personal Property Personal Property Reimbursement (HB 66)Reimbursement (HB 66)
FY 2013FY 2013 $ $ nonenone
FY 2012FY 2012 $ 932,000$ 932,000
FY 2011FY 2011 $2,222,000 $2,222,000
FY 2010FY 2010 $2,182,000$2,182,000
FY 2009FY 2009 $1,854,000$1,854,000
FY 2008FY 2008 $1,024,000$1,024,000
FY 2007FY 2007 $ 770,000$ 770,000
FY 2006FY 2006 $ 129,000$ 129,00099
Year End Summary Financial Year End Summary Financial PresentationPresentation
General Fund – General Fund – Federal Stimulus MoneyFederal Stimulus Money
FY 2013FY 2013 $ $ none none
FY 2012FY 2012 $ 1,186,000$ 1,186,000
FY 2011FY 2011 $ 1,698,000 $ 1,698,000
FY 2010FY 2010 $ 1,398,000$ 1,398,000
FY 2009FY 2009 $$ nonenone
FY 2008FY 2008 $$ nonenone
FY 2007FY 2007 $ $ nonenone
FY 2006FY 2006 $$ nonenone1010
Year End Summary Financial Year End Summary Financial PresentationPresentation
1111Year End Summary Financial Year End Summary Financial
PresentationPresentation
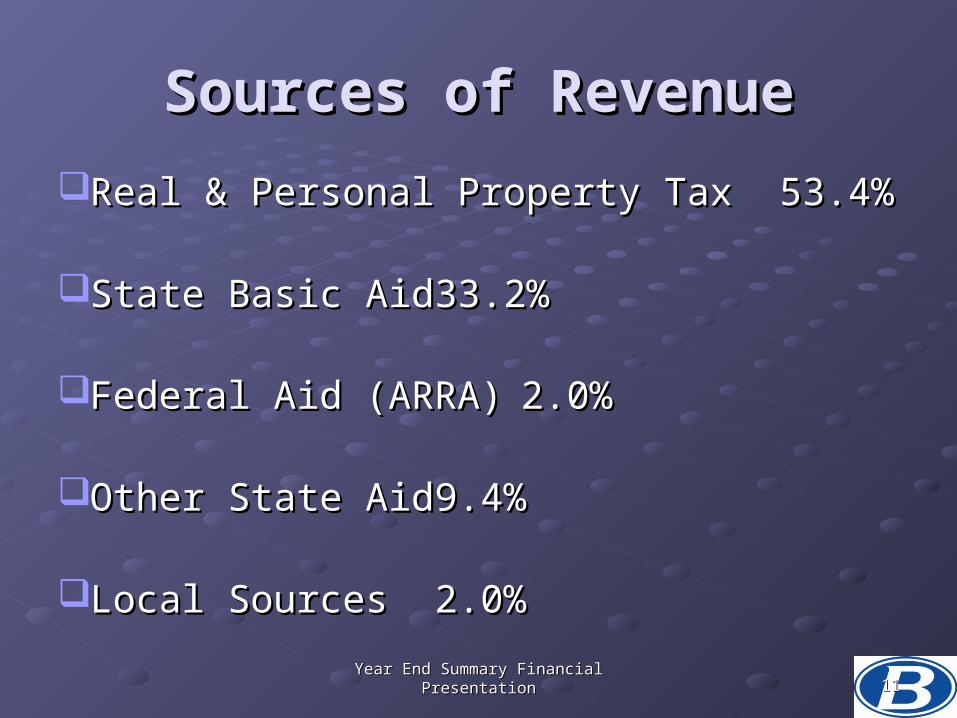
Sources of RevenueSources of Revenue
Real & Personal Property Tax Real & Personal Property Tax 53.4%53.4%
State Basic AidState Basic Aid 33.2%33.2%
Federal Aid (ARRA)Federal Aid (ARRA) 2.0%2.0%
Other State AidOther State Aid 9.4%9.4%
Local SourcesLocal Sources 2.0%2.0%
1212Year End Summary Financial Year End Summary Financial
PresentationPresentation
ExpendituresExpenditures
Salaries & BenefitsSalaries & Benefits 85.5%85.5%
Purchased ServicesPurchased Services 7.6%7.6%
Supplies & EquipmentSupplies & Equipment 4.3%4.3%
Other ExpendituresOther Expenditures 2.6%2.6%
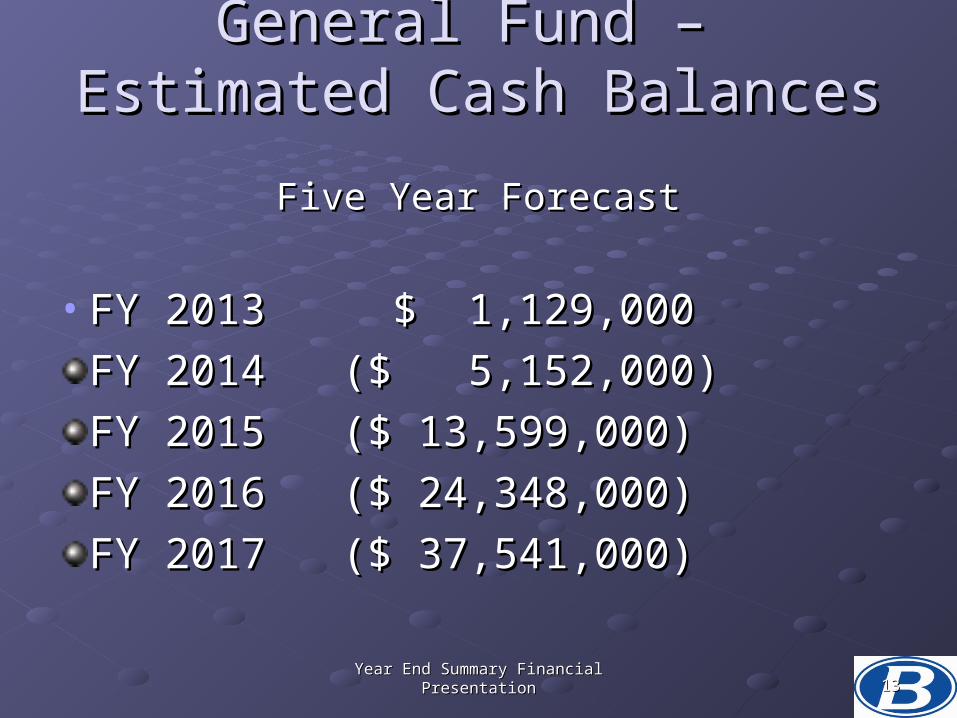
General Fund – General Fund – Estimated Cash BalancesEstimated Cash Balances
Five Year ForecastFive Year Forecast
• FY 2013FY 2013 $ 1,129,000 $ 1,129,000
FY 2014FY 2014 ($ 5,152,000)($ 5,152,000)
FY 2015FY 2015 ($ 13,599,000) ($ 13,599,000)
FY 2016FY 2016 ($ 24,348,000)($ 24,348,000)
FY 2017FY 2017 ($ 37,541,000) ($ 37,541,000)
1313Year End Summary Financial Year End Summary Financial