88
FINANCIAL REPORT JULY 1, 2017, TO JUNE 30, 2018
FINANCIAL REPORTJ U L Y 1 , 2 0 1 7 , T O J U N E 3 0 , 2 0 1 8

BOARD OF REGENTS, STATE OF IOWADr. Michael Richards, West Des Moines, President
Patricia Cownie, Des Moines, President Pro Tem
Sherry Bates, Scranton
Nancy Boettger, Harlan
Milt J. Dakovich, Waterloo
Nancy Dunkel, Dyersville
Rachael Johnson, Sioux City
Dr. Jim Lindenmayer, Ottumwa
Larry E. McKibben, Marshalltown
PRESIDENT AND CABINETBruce Harreld, President
Gary Barta, Athletic Director
Sue Curry, Interim Executive Vice President and Provost
J. Brooks Jackson, Vice President for Medical Affairs and Dean of the Carver College of Medicine
Terry L. Johnson, Chief Financial Officer and Treasurer
John Keller, Interim Vice President for Research and Economic Development
Rod Lehnertz, Senior Vice President for Finance and Operations
Lynette Marshall, UI Center for Advancement, President and CEO
Peter Matthes, Senior Advisor to the President and Vice President for External Relations
Laura McLeran, Senior Advisor to the President and Associate Vice President for External Relations
Carroll Reasoner, Vice President for Legal Affairs and General Counsel
Melissa Shivers, Vice President for Student Life and Interim Chief Diversity Officer

1 FY18 Management’s Discussion and Analysis 1
2 Introduction and Highlights
4 Independent Auditor’s Report
6 Management’s Discussion and Analysis
18 Statement of Net Position
20 Statement of Revenues, Expenses and Changes in Net Position
21 Statement of Cash Flows
23 The University of Iowa Center for Advancement and Affiliate Consolidated Statement of Financial Position
24 The University of Iowa Center for Advancement and Affiliate Consolidated Statement of Activities
25 Notes to Financial Statements
76 Segment Reporting
80 Required Supplementary Information
TABLE OF CONTENTS

2
FOR IOWA AND THE WORLDThe University of Iowa is a comprehensive research university with particular distinction in
the arts, humanities, and sciences; a world-class academic health center; and a wide array of
exceptional professional programs. While serving as the state’s most comprehensive institution
of higher learning, the university also enjoys a national and international reputation for
excellence, and competes at that level for the best faculty and the most talented graduate and
professional students.
UNIVERSITY OF IOWA MISSIONIn pursuing its missions of teaching, research, and service, the university seeks to advance
scholarly and creative endeavor through leading-edge research and artistic production; to use this
research and creativity to enhance undergraduate, graduate, and professional education, health
care, and other services provided to the people of Iowa, the nation, and the world; and to educate
students for success and personal fulfillment.
THE UNIVERSITY IN 2018University of Iowa achievements during 2018 include:
• Enrolling the highest-achieving class of incoming freshman in UI history
(Class of 2022: 4,806 students, mean GPA: 3.71)
• Conferring 5,093 baccalaureate degrees, 1,734 higher degrees, and
481 professional degrees
• Appointing Dr. Melissa S. Shivers as Interim Chief Diversity Officer
• Beginning construction of the new Psychological and Brain Sciences Building
(to be completed January 2020) and continuing construction of new College of
Pharmacy building (to be completed fall 2019).
ENROLLMENTFall 2018 Fall 2017
Group
Total students 32,948 33,564
Undergraduates 23,989 24,503
Graduate and professional 8,959 9,061
Iowa residents 59.8% 57.2%
Total non-residents 40.2% 42.8%
International students 9.3% 10.2%
Minority enrollment 18.4% 17.8%
EMPLOYMENTFall 2018 Fall 2017
Group (by FTEs)
Total faculty and staff 24,717 24,918
Tenure-track faculty 1,490 1,506
Clinical-track faculty 811 777
Postdoctoral and other faculty 799 761
Institutional officers 19 20
Professional and scientific staff 10,355 10,154
Merit staff 4,392 4,490
Residents 831 838
Graduate assistants 2,215 2,282
Temporary 3,805 4,090

3 FY18 Management’s Discussion and Analysis
Donald Letendre, dean of the College of Pharmacy, tours construction of the college’s new facility to be completed in early 2020.
3
EXTERNAL SUPPORT AND GIVINGThe university reported strong external support during FY2018.
• Fiscal year 2018 total external funding: $554 million
The university and the UI Center for Advancement concluded the For Iowa. Forever More. campaign, the most successful fundraising campaign in UI history:
• Number of individual campaign donors: 272,543
• Number of students that have received scholarship support from
campaign: 3,455
RECENT RANKINGSSnapshot of the University’s standing in recent national surveys:
• U.S. News & World Report rank among 132 national, public universities: 38
• U.S. News & World Report rank among best
global universities: 153
• Number of graduate programs ranked among the
top 10 in their field by U.S. News & World Report: 13
• U.S. News & World Report rank among Iowa hospitals: 1
• Number of adult medical specialties among the top 50 in
their fields by U.S News & World Report: 7
• Number of pediatric specialties ranked among the top 50 in
their fields by U.S News & World Report: 4
U.S. News & World Report places the University of Iowa among the top 15% of the 1,250 “Best Global Universities”.
4
OFFICE OF AUDITOR OF STATESTATE OF IOWA
State Capitol BuildingDes Moines, Iowa 50319-0004
Telephone (515) 281-5834 Facsimile (515) 242-6134
Mary Mosiman, CPAAuditor of State
Independent Auditor’s Report
To the Members of the Board of Regents, State of Iowa:
Report on the Financial Statements
We have audited the accompanying Statement of Net Position, and the related Statements of Revenues, Expenses and Changes in Net Position and Cash Flows, of the State University of Iowa, Iowa City, Iowa, (University of Iowa) and its aggregate discretely presented component units as of and for the years ended June 30, 2018 and 2017, and the related Notes to Financial Statements, which collectively comprise the University of Iowa’s basic financial statements listed in the table of contents.
Management’s Responsibility for the Financial Statements
Management is responsible for the preparation and fair presentation of these financial statements in accordance with U.S. generally accepted accounting principles. This includes the design, implementation and maintenance of internal control relevant to the preparation and fair presentation of financial statements that are free from material misstatement, whether due to fraud or error.
Auditor’s Responsibility
Our responsibility is to express an opinion on these financial statements based on our audit. We did not audit the financial statements of the University of Iowa Center for Advancement and Affiliate, the University of Iowa Research Foundation, and the University of Iowa Health System discussed in Note 1, which represent 100% of the assets, net position and revenues of the discretely presented component units. Those financial statements were audited by other auditors whose reports have been furnished to us, and our opinion, insofar as it relates to those financial statements, is based solely on the reports of the other auditors. We conducted our audit in accordance with U.S. generally accepted auditing standards and the standards applicable to financial audits contained in Government Auditing Standards, issued by the Comptroller General of the United States. Those standards require that we plan and perform the audit to obtain reasonable assurance about whether the financial statements are free from material misstatement. The financial statements of the University of Iowa Center for Advancement and Affiliate were not audited in accordance with Government Auditing Standards.
An audit involves performing procedures to obtain audit evidence about the amounts and disclosures in the financial statements. The procedures selected depend on the auditor’s judgment, including the assessment of the risks of material misstatement of the financial statements, whether due to fraud or error. In making those risk assessments, the auditor considers internal control relevant to the University of Iowa’s preparation and fair presentation of the financial statements in order to design audit procedures that are appropriate in the circumstances, but not for the purpose of expressing an opinion on the effectiveness of the University of Iowa’s internal control. Accordingly, we express no such opinion. An audit also includes evaluating the appropriateness of accounting policies used and the reasonableness of significant accounting estimates made by management, as well as evaluating the overall presentation of the financial statements.
We believe the audit evidence we have obtained is sufficient and appropriate to provide a basis for our audit opinion.
Opinion
In our opinion, based on our audit and the reports of the other auditors, the financial statements referred to above present fairly, in all material respects, the respective financial position of the University of Iowa and its aggregate discretely presented component units as of June 30, 2018 and 2017, and the respective changes in financial position and, where applicable, cash flows thereof for the years ended June 30, 2018 and 2017 in accordance with U.S. generally accepted accounting principles.

5
Emphasis of Matters
As discussed in Note 1, the financial statements of the University of Iowa are intended to present the financial position, and the changes in financial position and cash flows, of only that portion of the financial reporting entity of the State of Iowa that is attributable to the transactions of the University of Iowa. They do not purport to, and do not, present fairly the financial position of the State of Iowa as of June 30, 2018 and 2017 and the changes in its financial position and its cash flows for the years ended June 30, 2018 and 2017 in conformity with U.S. generally accepted accounting principles.
As discussed in Note 8 to the financial statements, the University of Iowa adopted new accounting guidance related to Governmental Accounting Standards Board (GASB) Statement No. 75, Accounting and Financial Reporting for Postemployment Benefits Other than Pensions. Our opinion is not modified with respect to this matter.
Other Matters
Required Supplementary Information
U.S. generally accepted accounting principles require Management’s Discussion and Analysis, the Schedule of the University’s Proportionate Share of Net Pension Liability, Schedule of University Contributions and the Schedule of Changes in the University’s Total OPEB Liability, Related Ratios and Notes on pages 6 through 17 and 80 through 83 be presented to supplement the basic financial statements. Such information, although not a part of the basic financial statements, is required by the Governmental Accounting Standards Board which considers it to be an essential part of financial reporting for placing the basic financial statements in an appropriate operational, economic or historical context. We and the other auditors have applied certain limited procedures to the required supplementary information in accordance with U.S. generally accepted auditing standards, which consisted of inquiries of management about the methods of preparing the information and comparing the information for consistency with management’s responses to our inquiries, the financial statements and other knowledge we obtained during our audit of the financial statements. We do not express an opinion or provide any assurance on the information because the limited procedures do not provide us with sufficient evidence to express an opinion or provide any assurance.
The Introduction and Highlights Section has not been subjected to the auditing procedures applied in the audit of the basic financial statements and, accordingly, we do not express an opinion or provide assurance on them.
Other Reporting Required by Government Auditing Standards
Our report on the University of Iowa’s internal control over financial reporting and other tests of its compliance with certain provisions of laws, regulations, contracts and grant agreements and other matters required by Government Auditing Standards will be issued under separate cover. The purpose of that report is to describe the scope of our testing of internal control over financial reporting and compliance and the results of that testing and not to provide an opinion on the internal control over financial reporting or on compliance. That report is an integral part of an audit performed in accordance with Government Auditing Standards and should be considered in assessing the results of our audits.
MARY MOSIMAN, CPA Auditor of State
December 13, 2018

6 FY18 Management’s Discussion and Analysis
INTRODUCTIONThe following discussion and analysis of the University of Iowa’s financial statements presents
an overview of the University’s financial activities for the years ended June 30, 2018 and 2017.
This discussion has been prepared by management and should be read in conjunction with the
financial statements and related footnotes that follow.
FINANCIAL HIGHLIGHTSThe University’s financial position remained strong at June 30, 2018, with assets of $6,732
million and liabilities of $2,434 million as compared to June 30, 2017 assets of $6,464 million
and liabilities of $2,319 million. Net position, the difference between total assets and deferred
outflows of resources, and total liabilities and deferred inflows of resources, increased by $132.3
million (3.2%) from July 1, 2017 to June 30, 2018 before restatement. The increase from June 30,
2016 to June 30, 2017 was $144.1 million (3.6%).
The change in net position reports the financial results during the fiscal year by measuring the
relationship between revenues and expenses. It is important to note that public universities such
as the University of Iowa generally report an operating loss, as the financial reporting model
classifies state appropriations, investment income and gifts as nonoperating revenues. Operating
revenues are received for providing goods and services to the various students, customers and
constituencies of the University. Operating expenses are those expenses incurred to acquire or
produce the goods and services provided in return for the operating revenues and to carry out
the mission of the University. Nonoperating revenues are revenues received for which goods and
services are not provided.
Management’s Discussion and Analysis
The new South Annex of the Seaman’s Center—home of the College of Engineering—opened to the public in February 2018, adding 65,000 sq. ft. of state-of-the-art classroom and research space.

7 FY18 Management’s Discussion and Analysis FY18 Management’s Discussion and Analysis 7
GASB Statement No. 75 Accounting and Financial Reporting for Postemployment Benefits
Other Than Pensions was implemented during fiscal year 2018. The beginning net position was
restated by $455.96 million to retroactively report the increase in the OPEB liability as of July
1, 2017. OPEB expense for fiscal year 2017 and deferred outflows of resources at June 30, 2017
were not restated because the information needed to restate those amounts was not available. In
order to minimize the OPEB liability for FY18 and in the future, the University implemented a
cap on the University’s contribution for retiree health at the current $288 per month for current
and future retirees. The University sent letters to retirees by the June 30, 2017 measurement
date in order to be incorporated into the FY18 GASB 75 valuation. See Note 15–Restatement for
additional information.
The following charts compare Total Assets and Deferred Outflows of Resources, Total Liabilities and Deferred Inflows of Resources, and Total Net Position at June 30, 2018, 2017, and 2016 and the components of changes in Net Position at June 30, 2018, 2017 and 2016.
STATEMENT OF NET POSITION
0 1,000 2,000 3,000 4,000 5,000 6,000 7,000
Total Net Position
Total Liabilities and Deferred Inflows
of Resources
Total Assets and Deferred Outflows
of Resources
Millions
$6,853.5
$6,521.0
$6,316.8
$2,524.5
$2,324.3
$2,264.2
$4,329.0
$4,196.7
$4,052.6
2018
2017
2016
$

8 FY18 Management’s Discussion and Analysis
STATEMENT OF REVENUES, EXPENSES AND CHANGES IN NET POSITION
USING THIS ANNUAL REPORTThe University’s annual report consists of three financial statements: the Statement of Net
Position, the Statement of Revenues, Expenses and Changes in Net Position, and the Statement
of Cash Flows. These statements provide information on the University as a whole and present
a long-term and short-term view of the University’s activities.
THE STATEMENT OF NET POSITION AND THE STATEMENT OF REVENUES, EXPENSES AND CHANGES IN NET POSITION The Statement of Net Position and the Statement of Revenues, Expenses and Changes in Net
Position present the financial position of the University at the end of the fiscal year and report
the University’s net position and changes in them during the current fiscal year, respectively.
Net position, the difference between total assets and deferred outflows of resources, and total
liabilities and deferred inflows of resources, is one indicator of the current financial condition
of the University, while the change in net position over time determines whether the financial
health of the University is improving. To assess the overall health of the University, non-financial
factors are relevant as well. Such factors include student enrollment, patient volumes, the
University’s ability to attract and retain qualified faculty and staff and the overall condition of
the University’s buildings and infrastructure. These statements are reported under the accrual
basis of accounting. Revenues are recognized when earned and expenses are recognized when
incurred, regardless of when cash is received or paid.
2018
2017
2016
0 500 1,000 1,500 2,000 2,500 3,000 3,500
Increase in Net Position
Other Revenues
Nonoperating Revenues, Net
Operating Expenses
Operating Revenues
Millions
$3,485.6
$3,304.9
$3,075.2
$3,176.7
$2,950.4
$2,859.6
$366.9
$442.3
$360.3
$530.3
$56.3
$109.2
$588.3
$144.1
$253.9
$
9 FY18 Management’s Discussion and Analysis FY18 Management’s Discussion and Analysis 9
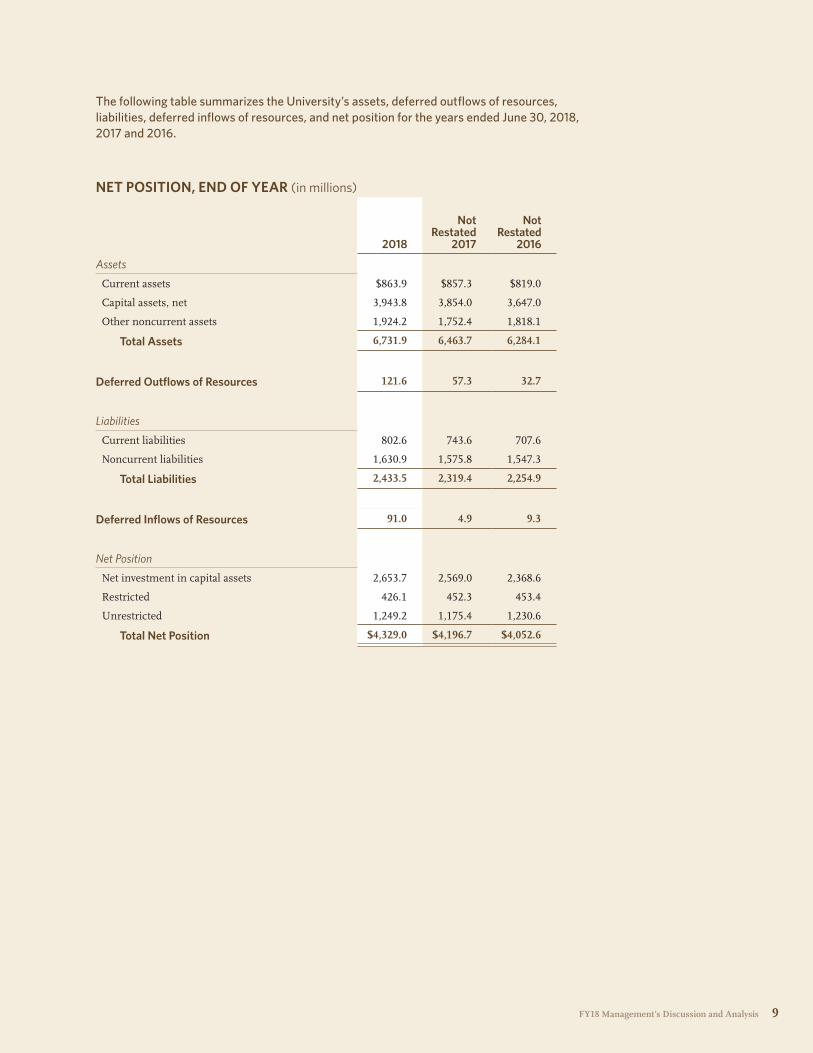
The following table summarizes the University’s assets, deferred outflows of resources, liabilities, deferred inflows of resources, and net position for the years ended June 30, 2018, 2017 and 2016.
NET POSITION, END OF YEAR (in millions)
2018
NotRestated
2017
Not
Restated2016
Assets
Current assets $863.9 $857.3 $819.0
Capital assets, net 3,943.8 3,854.0 3,647.0
Other noncurrent assets 1,924.2 1,752.4 1,818.1
Total Assets 6,731.9 6,463.7 6,284.1
Deferred Outflows of Resources 121.6 57.3 32.7
Liabilities
Current liabilities 802.6 743.6 707.6
Noncurrent liabilities 1,630.9 1,575.8 1,547.3
Total Liabilities 2,433.5 2,319.4 2,254.9
Deferred Inflows of Resources 91.0 4.9 9.3
Net Position
Net investment in capital assets 2,653.7 2,569.0 2,368.6
Restricted 426.1 452.3 453.4
Unrestricted 1,249.2 1,175.4 1,230.6
Total Net Position $4,329.0 $4,196.7 $4,052.6

10 FY18 Management’s Discussion and Analysis
The following table summarizes the University’s revenues, expenses and changes in net position for the years ended June 30, 2018, 2017 and 2016.
REVENUES, EXPENSES AND CHANGES IN NET POSITION (in millions)
2018
Not Restated
2017
Not Restated
2016
Operating Revenues:
Tuition and fees, net of scholarship allowances $430.5 $399.1 $379.1
Grants and contracts 345.7 345.0 343.7
Patient services, net of allowances 2,040.2 1,846.5 1,789.4
Sales and services of educational departments 104.9 108.5 108.4
Auxiliary enterprises, net of scholarship allowances 222.0 216.3 197.0
Other operating revenue 33.4 35.0 42.0
Total Operating Revenues 3,176.7 2,950.4 2,859.6
Operating Expenses:
Instruction 349.7 341.8 337.3
Research 334.7 330.3 332.2
Academic support 153.0 226.4 181.4
Patient services 1,848.9 1,621.7 1,508.9
Depreciation and amortization 247.3 226.7 196.9
Auxiliary enterprises 203.3 203.2 182.1
Other operating expenses 348.7 354.8 336.4
Total Operating Expenses 3,485.6 3,304.9 3,075.2
Operating (Loss) (308.9) (354.5) (215.6)
Nonoperating Revenues (Expenses):
State appropriations 227.3 239.3 247.3
Grants and contracts 20.2 18.2 17.3
Investment income, net of investment expenses 65.2 113.4 43.7
Gifts 97.2 109.2 89.0
Interest expense (37.8) (32.5) (31.4)
Loss on disposal of capital assets (5.2) (5.3) (5.6)
Net Nonoperating Revenues (Expenses) 366.9 442.3 360.3
Income Before Other Revenues 58.0 87.8 144.7
Other Revenues:
Capital appropriations, State 53.0 20.6 19.4
Capital contributions and grants 10.5 33.6 15.7
FEMA reimbursement for capital costs, net of expenses 1.8 2.1 74.1
Other—OPEB benefit change 465.0 0.0 0.0
Net Other Revenues 530.3 56.3 109.2
Increase in Net Position 588.3 144.1 253.9
Net position, beginning of year, as restated 3,740.7 4,052.6 3,798.7
Net position, end of year $4,329.0 $4,196.7 $4,052.6

11 FY18 Management’s Discussion and Analysis FY18 Management’s Discussion and Analysis 11
The Statement of Revenues, Expenses and Changes in Net Position reflects a positive year
with an increase in net position for the fiscal year ended June 30, 2018 of $132.3 million (3.2%).
This calculation does not include the restatement of net position as of July 1, 2017 required
by the implementation of GASB Statement No. 75 Accounting and Financial Reporting for
Postemployment Benefits Other Than Pensions during fiscal year 2018. The beginning net
position was restated by $456.0 million to retroactively report the increase in the OPEB liability
as of July 1, 2017, referenced in Note 15—Restatement. Net position increased $465.0 million
during fiscal year 2018 due to the University’s implementation of a change in OPEB benefit
terms during fiscal year 2018. When these items are included, net position increased $588.3
million for the fiscal year ended June 30, 2018. During the fiscal year ended June 30, 2018, the
University increased operating revenues and operating expenses by 7.7% and 5.5%, respectively.
The net result from operating revenues and expenses is an operating loss of 9.7% compared
to 12.0% last year. However, after factoring in state appropriations, investment income, gifts
and other net non-operating revenues (expenses), the University increased net position by
$58.0 million for the year ended June 30, 2018. During the fiscal year ended June 30, 2018, net
nonoperating revenues (expenses) decreased by 17.0%. Other revenues of state appropriations
for capital projects, contributions and grants for capital projects, and FEMA reimbursement for
capital costs, net of expenses increased $9.0 million (16.0%). The other revenue for the change in
OPEB benefit terms is $465.0 million, as referenced above.
OPERATING REVENUES For the fiscal years (FY) ended June 30, 2018, 2017 and 2016, operating revenues totaled $3,176.7
million, $2,950.4 million and $2,859.6 million, respectively. Operating revenues increased
$226.3 million (7.7%) over FY 2017 revenues. The increase is primarily from patient services and
student tuition and fees. The following is a graphic illustration of revenues by source which are
used to fund the University’s operating activities for the year ended June 30, 2018.
FY 2018 OPERATING REVENUES $3,176.7 million
Patient Services, net of allowances
��������64%
Sales and Services of Educational Departments ������3%
Auxiliary Enterprises, net of scholarship allowances ������7%Other Operating Revenue �����1%
Tuition and Fees ������14%
Grants and Contracts ������11%

12 FY18 Management’s Discussion and Analysis
In the most recent National Science Foundation, Higher Education Research and Development
survey (2016), the University of Iowa ranked 48th among public and private universities
combined in terms of federally financed expenditures for research and development. Grants,
contracts and other sponsored agreements operating revenue exceeded $345 million in FY 2018,
$344 million in FY 2017 and $343 million in FY 2016.
OPERATING EXPENSESFor the fiscal years ended June 30, 2018, 2017 and 2016, operating expenses totaled $3,485.6
million, $3,304.9 million and $3,075.2 million, respectively. Operating expenses increased
$180.7 million (5.5%) over FY 2017 expenses. The increase is primarily from patient services and
depreciation. The following is a graphic illustration of the University’s operating expenses for the
year ended June 30, 2018.
FY 2018 OPERATING EXPENSES $3,485.6 million
Other operating expenses include Public Service (2018, $90 million; 2017, $92 million),
Student Services (2018, $37 million; 2017, $41 million), Institutional Support (2018, $56 million;
2017, $64 million), Operation and Maintenance of Plant (2018, $84 million; 2017, $85 million),
Scholarships and Fellowships (2018, $32 million; 2017, $31 million), and Other (2018, $49 million;
2017, $42 million).
Patient Services ��������
53%
Academic Support ������
4% Research ������
10%
Depreciation and Amortization ������7%
Auxiliary Enterprises ������6%
Other Operating Expenses ������10%
Instruction ������10%

13 FY18 Management’s Discussion and Analysis FY18 Management’s Discussion and Analysis 13
NONOPERATING REVENUES AND EXPENSESNonoperating revenues and expenses netted a positive $366.9 million for the fiscal year ended
June 30, 2018 and $442.3 million for the fiscal year ended June 30, 2017.
The following table summarizes the University’s nonoperating revenues and expenses for the years ended June 30, 2018, 2017 and 2016.
State appropriations decreased by $12.0 million (5.0%) in the fiscal year ended June 30, 2018.
Grants and contracts revenue increased by $2.0 million (11.0%), investment income, net of
investment expenses decreased by $48.2 million (42.5%) and gifts decreased by $12.0 million
(11.0%) in the fiscal year ended June 30, 2018.
OTHER REVENUES AND EXPENSESNot included, by definition, as nonoperating revenues and expenses are state appropriations for
capital projects, contributions and grants for capital projects and reimbursement from FEMA
for capital costs, net of expenses. Other revenues increased from $56.3 million for the fiscal
year ended June 30, 2017 to $530.3 million for the fiscal year ended June 30, 2018, an increase of
$474.0 million, or 841.9%. Other revenues included an increase of $465.0 million during fiscal
year 2018 due to the University’s implementation of a change in OPEB benefit terms during
fiscal year 2018; see Note 15-Restatement for additional information. Capital appropriations,
contributions, and grants increased from $54.2 million for the fiscal year ended June 30, 2017 to
$63.5 million for the fiscal year ended June 30, 2018, an increase of $9.3 million, or 17.2%. For
the fiscal years ended June 30, 2018 and 2017, $1.8 million and $2.1 million, respectively, was
recognized in FEMA reimbursement for capital costs, net of expenses, a decrease of $0.3 million,
or 14.3%. The net revenue is intended to fund flood-related expenses.
After insurance recoveries, FEMA has agreed to reimburse the University at 90% of actual cost of
approved project work orders. All FEMA related activity is reported in Other Revenues. In fiscal
year 2018, the University received $1.8 million in FEMA reimbursements towards flood-related
costs expended ($2.2 million for capital costs and $0.4 million for expenses).
NONOPERATING REVENUES (EXPENSES) (in millions)
2018 2017 2016
Nonoperating Revenues (Expenses)
State appropriations $227.3 $239.3 $247.3
Grants and contracts 20.2 18.2 17.3
Investment income, net of investment expenses 65.2 113.4 43.7
Gifts 97.2 109.2 89.0
Interest expense (37.8) (32.5) (31.4)
Loss on disposal of capital assets (5.2) (5.3) (5.6)
Net Nonoperating Revenues (Expenses) $366.9 $442.3 $360.3

14 FY18 Management’s Discussion and Analysis
STATEMENT OF CASH FLOWSThe Statement of Cash Flows provides information regarding the University’s cash receipts and
disbursements during the fiscal year. This provides an assessment of the University’s ability to
generate net cash flows and meet obligations as they come due.
The following table summarizes the University’s cash flow for the fiscal years ended June 30, 2018, 2017 and 2016.
The University’s overall liquidity increased during the year, with a net increase in cash and cash
equivalents of $63.8 million. The net increase is primarily due to receipts for patient services.
CAPITAL ASSETS AND DEBT ADMINISTRATION Capital AssetsThe following table summarizes the University’s capital assets, net of depreciation and amortization, as of June 30, 2018, 2017 and 2016.
CASH FLOWS FOR THE YEAR (in millions)
2018 2017 2016
Cash provided (used) by:
Operating activities $9.9 ($123.7) $78.8
Noncapital financing activities 367.7 390.7 343.9
Capital and related financing activities (264.3) (420.9) (498.3)
Investing activities (49.5) 143.8 81.2
Net change in cash and cash equivalents 63.8 (10.1) 5.6
Cash and cash equivalents, beginning of year 207.3 217.4 211.8
Cash and cash equivalents, end of year $271.1 $207.3 $217.4
CAPITAL ASSETS, NET OF DEPRECIATION AND AMORTIZATION (in millions)
2018 2017 2016
Nondepreciable/nonamortizable
Land $68.7 $66.6 $64.5
Construction in progress 261.1 293.5 695.3
Intangibles in development 0.3 1.8 7.8
Art & historical collections 28.8 28.2 26.3
Library materials 358.2 345.8 328.1
Depreciable/amortizable
Land improvements, net 10.0 7.4 4.7
Infrastructure, net 296.3 285.1 267.4
Buildings, net 2,602.1 2,490.9 1,973.6
Equipment, net 274.9 284.8 230.4
Intangibles, net 43.4 49.9 48.9
Total Capital Assets, Net $3,943.8 $3,854.0 $3,647.0

15 FY18 Management’s Discussion and Analysis FY18 Management’s Discussion and Analysis 15
The University of Iowa wrapped up construction of several important projects this year including
the new south annex addition to the Seamans Center for the Engineering Arts and Sciences
($37.1 million), the Fit-out of the Central Vivarium Space in the John and Mary Pappajohn
Biomedical Discovery Building ($24.0 million) and the UIHC Heart and Vascular Center
($13.3 million). Other important milestones were reached with the substantial completion and
occupancy of the Gerdin Athletic Learning Center – Renovation and Build Out of 3rd Floor
($6.3 million), the University of Iowa Center for Advancement Services Building – Remodel
Space ($5.8 million) and the John Colloton Pavilion – Material Services, Processed Stores
Relocation project that supports the Central Sterilization Services Expansion ($5.0 million).
Work continued with ongoing construction for many prominent projects including the Kinnick
Stadium North End Zone ($89.9 million), a three-year project that is well into its second year; the
UIHC Pediatric Specialty Clinic Expansion and Conference Center Development ($39.0 million),
the Modernization of Building Systems in Bowen Science Building ($18.5 million), the
renovation of Lab Floors 1 – 5 within the John W. Eckstein Medical Research Building
($9.1 million), two College of Pharmacy projects (the new College of Pharmacy Building
($96.3 million) and the UIP Fit Out and Manufacturing Equipment ($28.4 million) project
progresses with building envelope and equipment procurement, and several utility projects.
The utility projects include the Power Plant – Capacity Expansion ($49.5 million) which will
add a new boiler and replace turbine generators at the main plant, the Steam Utility Enterprise
systems – Replace Riverside Drive/Grand Avenue Steam Distribution System final phase
($18.0 million), and the Water Plant – Install Reverse Osmosis System ($5.9 million).
Several projects were bid and awarded for construction this year including construction of a new
Psychological and Brain Sciences Building Facility ($33.5 million), replacement of L3 Air
Handling Units serving John W. Colloton Pavilion ($6.2 million), relocation of Acute Leukemia
and Bone Marrow Transplant Unit on Level 3 of John W. Colloton Pavilion ($15.3 million),
installation of a MRI Linear Accelerator in Pomerantz Family Pavilion ($10.5 million),
Modifications to the College of Nursing Building ($11.8 million), increasing the Cooling Tower
Capacity at the Chilled Water Plant 2 (West) – ($5.2 million) and finally updating of Student
Living Spaces in Burge Residence Hall which is a four year project ($8.4 million).
Additionally, projects currently under design include a new Museum of Art to replace the flood-
damaged facility ($50.0 million), a UIHC Central Sterilization Services facility that consolidates
sterilization services for the hospital into one facility and will be located on the Oakdale Campus
($31.5 million) and the Roy J. Carver Pavilion – Inpatient Psychiatry Expansion and Renovation
project ($8.3 million), a new Finkbine Golf Club House and Support Facility ($9.95 million),
renovation of Pathology Core Lab at Roy Carver Pavilion ($20.1 million), the expansion and
renovation of an MRI and Pet/MRI Suite in John W. Colloton Pavilion ($5.4 million) and the
relocation of Respiratory Specialty and Comprehensive Care Unit/Palliative Care within UIHC
($15.3 million).

16 FY18 Management’s Discussion and Analysis
DebtAs of June 30, 2018, the University had $1,365.7 million in outstanding bonds, notes and capital
leases, an increase of $51.3 million from the prior year. Debt principal payments of $69.3 million
and interest payments of $41.6 million were made during the fiscal year ended June 30, 2018.
The following table summarizes outstanding debt by type as of June 30, 2018, 2017 and 2016.
During the fiscal year ended June 30, 2018, $122.3 million of new revenue bonds were issued.
The revenue bond proceeds were $64.6 million for Athletic Facilities, $32.7 million for Hospital,
and $25.0 million for Utility System. The University carries an Aa1 institutional bond rating
from Moody’s and an AA rating from Standard & Poor’s. UIHC carries a rating of AA2 and AA.
Additional information related to the University’s noncurrent liabilities is presented in Note 5 to
the financial statements.
ECONOMIC FACTORS THAT WILL AFFECT THE FUTUREThe University of Iowa continues to have significant appeal to prospective students. This
is attributable, in large part, to the University’s high academic standards and its national
reputation as a best buy in undergraduate education. The University continues to draw a
high percentage of students from outside the state of Iowa, most notably from the state of
Illinois. The Class of 2022 is comprised of 4,806 students, making it the fourth-largest, most
academically gifted class in the University’s 171-year history. Total enrollment for fall 2018 is
32,948, the third highest enrollment in the University’s history. It is forecasted these trends will
continue with strong enrollment demand at the University of Iowa, despite overall high school
graduation demographics remaining flat within the state of Iowa.
The state reduced its general fund appropriation to the University by $17.4 million since the
beginning of fiscal year 2017. This loss in state support was offset by increasing tuition rates
for resident undergraduate students 5% in FY 2018 and 3.8% in FY2019, and, for all other
students 6.35% in FY 2018 and 2.1% in FY 2019. Even considering these significant tuition rate
increases, the University of Iowa continues to charge one of the lowest tuition rates amongst
peer institutions. The state economy continues to report revenue growth over the prior year.
In fact, the October 2018 projection from the state’s revenue estimating committee estimates
fiscal year 2019 state tax receipts will be $355.8 million above fiscal year 2018 actual net receipts,
representing a year-over-year increase of 4.9%.
BONDS, NOTES AND CAPITAL LEASES (in millions)
2018 2017 2016
Revenue bonds $1,321.0 $1,259.7 $1,252.9
Notes 27.3 36.3 40.7
Capital leases 17.4 18.4 19.5
Total Debt Outstanding $1,365.7 $1,314.4 $1,313.1

17 FY18 Management’s Discussion and Analysis FY18 Management’s Discussion and Analysis 17
The University continues to be one of the nation’s top research-intensive universities with grant
and contract research awards to the University exceeding $400 million per year for the past
ten years. The continuation of hiring highly productive faculty within focused clusters, and
infrastructure improvements will enable the University’s researchers to be more productive
and better positioned to compete for external grants and contracts as new sponsored research
opportunities emerge. Federally sponsored research increased 16% in FY 2018 while the
University realized a significant decrease in state & local government research support.
Particular emphasis is on developing stronger partnerships with industry leading to improved
marketability of intellectual capital generated by UI faculty and staff.
Despite the increasing volatility in the investment markets over the last several years, investment
income continues to be an important component of UI’s ongoing revenue diversification with
the University generating an 8.4% return on its endowment, placing it near the upper quartile
of educational endowment returns across the U.S. The University achieved benchmark or
better returns in its operating and intermediate investment pools over the 1-year, 3-year and
5-year return periods. The University will continue to employ its long-term investment strategy
to maximize total returns, at an appropriate level of risk. The Board of Regents investment
advisor is a partner in this process to ensure prudently managed and well diversified investment
portfolios.
The University of Iowa Hospitals & Clinics (UIHC) continues to be recognized as one of the
nation’s best, and has achieved successful operating results for fiscal year 2018 with an operating
margin of 3.7% (unaudited). According to U.S. News & World Report, UIHC has been included
again as one of the top hospitals in the United States in its annual “best hospitals” rankings.
Eleven programs are ranked in the top 50 in the country. Of the eleven programs, seven are in
adult specialties and four are in pediatric specialty areas. The University of Iowa Health Care
is rated by U.S. News & World Report as the #1 hospital in the state of Iowa and it continues
to report robust patient census data with over 1 million clinic visits in fiscal year 2018. Iowa’s
future doctors and other health care professional students are in a great learning environment
attributable to outstanding faculty and exposure to a high complexity case mix at UIHC.

18 FY18 Statement of Net Position
ASSETS2018
Not Restated2017
Current Assets:
Cash and cash equivalents $145,976 $169,284 Deposits with trustees 1 -Investments 217,992 187,215 Accounts receivable, net 364,630 354,976 Notes receivable, net 2,234 2,270 Interest receivable 1,308 1,113 Due from government agencies 65,028 75,900 Inventories 45,212 42,350 Prepaid expenses and other current assets 21,492 24,180
Total current assets 863,873 857,288
Noncurrent Assets:
Cash and cash equivalents 125,109 38,017 Deposits with trustees 14,725 14,650 Investments 1,741,971 1,658,683 Notes receivable, net 26,922 25,939 Investment in wholly owned subsidiary 15,500 15,106 Capital assets, net 3,943,809 3,854,049
Total noncurrent assets 5,868,036 5,606,444
Total Assets 6,731,909 6,463,732
DEFERRED OUTFLOWS OF RESOURCES
OPEB related deferred outflow 54,448 - Pension related deferred outflows 49,227 39,125 Debt refunding loss 17,089 17,015 Other deferred outflow 879 1,116
Total Deferred Outflows of Resources 121,643 57,256
Total Assets and Deferred Outflows of Resources $6,853,552 $6,520,988
Statement of Net Position June 30, 2018 (in thousands)With comparative statement as of June 30, 2017

FY18 Statement of Net Position 19
Statement of Net Position, continued June 30, 2018 (in thousands)With comparative statement as of June 30, 2017
LIABILITIES2018
Not Restated2017
Current Liabilities:
Accounts payable $99,826 $98,616 Salaries and wages payable 198,306 191,102 Unpaid claims 37,658 26,001 Unearned revenue 44,989 45,276 Interest payable 16,293 16,123 Long-term debt, current portion 74,204 70,741 Other long-term liabilities, current portion 122,246 107,855 Deposits held in custody for others 209,122 187,912
Total current liabilities 802,644 743,626
Noncurrent Liabilities:
Accounts payable 35,074 22,561 Long-term debt, noncurrent portion 1,291,443 1,243,691 Other long-term liabilities, noncurrent portion 304,359 309,495
Total noncurrent liabilities 1,630,876 1,575,747
Total Liabilities 2,433,520 2,319,373
DEFERRED INFLOWS OF RESOURCES
OPEB related deferred inflow 85,859 - Debt refunding gain 2,803 3,601 Pension related deferred inflows 1,923 959 Contract and grant deferred inflows 371 385
Total Deferred Inflows of Resources 90,956 4,945
NET POSITION
Net investment in capital assets 2,653,746 2,568,966 Restricted:
Nonexpendable:Permanent endowment 47,798 46,883
Expendable:Research and gifts 65,408 77,421 Student loans 15,901 22,131 Quasi endowments 82,245 81,155 Debt service and capital projects 214,729 224,758
Unrestricted 1,249,249 1,175,356
Total Net Position 4,329,076 4,196,670
Total Liabilities, Deferred Inflows of Resources and Net Position $6,853,552 $6,520,988
The accompanying notes are an integral part of these financial statements.
20 FY18 Statement of Revenues, Expenses, and Changes in Net Position
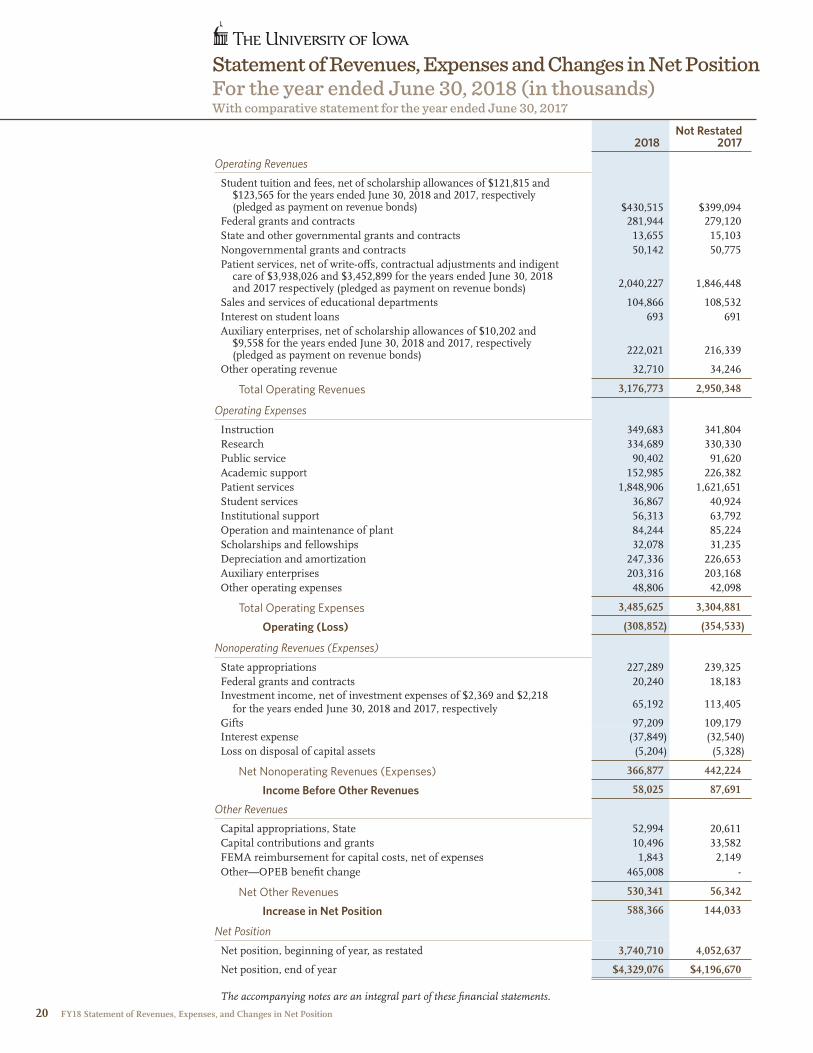
Statement of Revenues, Expenses and Changes in Net Position For the year ended June 30, 2018 (in thousands) With comparative statement for the year ended June 30, 2017
2018Not Restated
2017
Operating Revenues
Student tuition and fees, net of scholarship allowances of $121,815 and $123,565 for the years ended June 30, 2018 and 2017, respectively (pledged as payment on revenue bonds) $430,515 $399,094
Federal grants and contracts 281,944 279,120State and other governmental grants and contracts 13,655 15,103 Nongovernmental grants and contracts 50,142 50,775Patient services, net of write-offs, contractual adjustments and indigent
care of $3,938,026 and $3,452,899 for the years ended June 30, 2018 and 2017 respectively (pledged as payment on revenue bonds) 2,040,227 1,846,448
Sales and services of educational departments 104,866 108,532 Interest on student loans 693 691Auxiliary enterprises, net of scholarship allowances of $10,202 and
$9,558 for the years ended June 30, 2018 and 2017, respectively (pledged as payment on revenue bonds) 222,021 216,339
Other operating revenue 32,710 34,246
Total Operating Revenues 3,176,773 2,950,348
Operating Expenses
Instruction 349,683 341,804 Research 334,689 330,330 Public service 90,402 91,620 Academic support 152,985 226,382 Patient services 1,848,906 1,621,651 Student services 36,867 40,924 Institutional support 56,313 63,792 Operation and maintenance of plant 84,244 85,224 Scholarships and fellowships 32,078 31,235 Depreciation and amortization 247,336 226,653 Auxiliary enterprises 203,316 203,168 Other operating expenses 48,806 42,098
Total Operating Expenses 3,485,625 3,304,881
Operating (Loss) (308,852) (354,533)
Nonoperating Revenues (Expenses)
State appropriations 227,289 239,325 Federal grants and contracts 20,240 18,183 Investment income, net of investment expenses of $2,369 and $2,218
for the years ended June 30, 2018 and 2017, respectively 65,192 113,405
Gifts 97,209 109,179 Interest expense (37,849) (32,540)Loss on disposal of capital assets (5,204) (5,328)
Net Nonoperating Revenues (Expenses) 366,877 442,224
Income Before Other Revenues 58,025 87,691
Other Revenues
Capital appropriations, State 52,994 20,611 Capital contributions and grants 10,496 33,582 FEMA reimbursement for capital costs, net of expenses 1,843 2,149Other—OPEB benefit change 465,008 -
Net Other Revenues 530,341 56,342
Increase in Net Position 588,366 144,033
Net Position
Net position, beginning of year, as restated 3,740,710 4,052,637
Net position, end of year $4,329,076 $4,196,670
The accompanying notes are an integral part of these financial statements.

FY18 Statement of Cash Flows 21
2018 2017
Cash Flows From Operating Activities
Tuition and fees $425,784 $398,611 Patient receipts 2,038,262 1,837,269 Grants and contracts 354,793 349,407 Payments for salaries and benefits (1,868,422) (1,794,848)Payments for goods and services (1,068,122) (1,037,436)Scholarships (32,078) (31,235)Loans issued to students (6,545) (5,066)Collections of loans from students 6,413 7,885 Sales of educational activities 101,285 105,803 Other receipts 41,383 34,645 Auxiliary enterprise receipts 220,496 214,386 Auxiliary enterprise payments (203,316) (203,168)
Net Cash Provided (Used) by Operating Activities 9,933 (123,747)
Cash Flows From Noncapital Financing Activities
State appropriations 227,289 239,325 Grants and contracts 20,240 18,183 Proceeds from noncapital gifts 97,209 109,179 Funds held for others receipts 235,441 300,481 Funds held for others payments (212,488) (276,436)William D. Ford Direct Lending & Plus Loans receipts 173,396 165,676 William D. Ford Direct Lending & Plus Loans made (173,487) (164,990)Other noncapital activities 91 (686)
Net Cash Provided by Noncapital Financing Activities 367,691 390,732
Cash Flows From Capital and Related Financing Activities
Acquisition and construction of capital assets (340,128) (436,512)Interest paid on capital debt and leases (41,646) (37,214)Proceeds from sale of capital assets 915 1,110 Capital appropriations 52,963 19,940 Capital gifts and grants received 8,374 28,649 Deposits with trustee (74) 121 Principal paid on capital debt and leases (69,301) (61,631)Proceeds from capital debt and leases 125,253 69,027 Defeased debt payments (44,400) (87,100)Other capital and related financing receipts 43,725 82,730
Net Cash (Used) by Capital and Related Financing Activities (264,319) (420,880)
Cash Flows From Investing Activities
Interest and dividends on investments 25,986 28,928 Proceeds from sale and maturities of investments 1,171,280 736,727 Purchase of investments (1,246,787) (621,870)
Net Cash (Used) Provided by Investing Activities (49,521) 143,785
Net Increase (Decrease) in Cash and Cash Equivalents 63,784 (10,110)
Cash and Cash Equivalents, beginning of year 207,301 217,411
Cash and Cash Equivalents, end of year $271,085 $207,301
Statement of Cash Flows For the Year ended June 30, 2018 (in thousands)With comparative statement for the year ended June 30, 2017

22 FY18 Statement of Cash Flows
2018 2017
Reconciliation of Cash and Cash Equivalents to the Statement of Net Position:
Cash and cash equivalents in current assets $145,976 $169,284 Noncurrent cash and cash equivalents 125,109 38,017
Total Cash and Cash Equivalents $271,085 $207,301
Reconciliation of Operating (Loss) to Net Cash (Used) Provided by Operating Activities:
Operating (loss) ($308,852) ($354,533)Adjustments to reconcile operating (loss) to net cash (used) provided by operating activities: Depreciation and amortization expense 247,336 226,653
Changes in operating assets and liabilities:Accounts receivable, net (11,974) (11,460)Interest receivable 56 1,149 Inventories (2,862) (4,951)Prepaid expenses and other current assets 2,688 (4,913)Due from government agencies, net of receivable from
State for capital appropriations
10,903 10,183Notes receivable, net (947) 57 Accounts payable 14,587 (23,799)Salaries and wages payable 7,205 9,247 Unpaid claims liability 11,657 (4,928)Other long-term liabilities (375) 398 Unearned revenue (487) (3,487)Contract and grant deferred inflows (14) 13 Pension liability 18,390 26,906 Pension related deferred outflows (10,102) (19,253)Pension related deferred inflows 964 (3,490)Other postemployment benefits other than pension liability (11,883) 28,917 OPEB related deferred outflows (54,448) - OPEB related deferred inflows 85,859 - Other expenses—OPEB change benefit 9,048 - Compensated absences 5,179 5,547 Early retirement benefits (1,995) (2,003)
Net Cash Provided (Used) by Operating Activities $9,933 ($123,747)
Significant Noncash Transactions:
Receivable from State for capital appropriations $1,865 $1,834 Assets acquired by gift $2,121 $4,933 Net unrealized (loss) gain on investment ($30,890) $35,395
The accompanying notes are an integral part of these financial statements.
Statement of Cash Flows For the year ended June 30, 2018 (in thousands)With comparative statement for the year ended June 30, 2017

FY18 Consolidated Statement of Financial Position 23
ASSETS 2018 2017
Cash and cash equivalents $66,865 $21,567
Receivables:
Pledges, at net present value, less allowance for losses 156,141 147,358 Other receivables and prepaids 268 242
156,409 147,600
Investments:
Carried at fair valueU.S. Government and governmental agency securities 3,736 3,773 Corporation stocks, primarily common stocks 8,735 7,951 Managed separate investment accounts, primarily equity securities 1,210,930 1,166,442 Assets in living trusts, testamentary trusts and gift annuities 56,931 59,550 Beneficial interest in perpetual trusts 17,076 16,481
1,297,408 1,254,197
Other:
Real estate 4,548 6,010 Cash value of life insurance 6,741 7,037 Other 864 936
12,153 13,983
Property leasehold interest and equipment, net 17,096 17,837
Total Assets $1,549,931 $1,455,184
LIABILITIES AND NET ASSETSLiabilities:
Accounts payable and accrued expenses $2,046 $2,142 Annuity and life income obligations 22,618 24,408 Capital lease obligation 825 1,605 Amounts held on behalf of others 92,507 97,839
117,996 125,994
Net Assets:
Unrestricted 33,651 29,599 Temporarily restricted 665,981 605,024 Permanently restricted 732,303 694,567
1,431,935 1,329,190
Total Liabilities and Net Assets $1,549,931 $1,455,184
The accompanying notes are an integral part of these financial statements.
Consolidated Statement of Financial Position June 30, 2018 (in thousands)With comparative statement as of June 30, 2017
THE UNIVERSITY OF IOWA CENTER FOR ADVANCEMENT AND AFFILIATE

24 FY18 Consolidated Statement of Actvities
UnrestrictedTemporarily
RestrictedPermanently
Restricted 2018 Total 2017 Total
Support and revenue:
Total contributions raised $62 $97,506 $36,699 $134,267 $159,577 Change in value of life income gifts - 3,437 1,181 4,618 4,128
Subtotal 62 100,943 37,880 138,885 163,705
Less amounts attributed to others - (1,063) (699) (1,762) (5,496)
Total contributions and change in value of life income gifts 62 99,880 37,181 137,123 158,209
Investment income (expense):Interest and dividends 3,569 1,550 - 5,119 5,277 Asset based management and service fees 13,004 (12,797) - 207 199
Change in fair value of investments 117 93,401 - 93,518 97,118
Subtotal 16,690 82,154 - 98,844 102,594
Less amounts attributed to others - (6,892) - (6,892) (7,597)
Total investment income 16,690 75,262 - 91,952 94,997
Other revenue:Other, primarily fundraising service revenue 10,689 3,767 - 14,456 17,422 Less amounts attributed to others - (193) - (193) (262)
Total other revenue 10,689 3,574 - 14,263 17,160
Net assets released from restrictions and changes in donor restrictions 123,565 (123,806) 241 - -
Total support and revenue 151,006 54,910 37,422 243,338 270,366
Transfers to and Expenses of The State University of Iowa
Student support 28,640 - - 28,640 27,250 Faculty support 19,394 - - 19,394 16,987 Research 26,564 - - 26,564 22,774 Facilities and equipment 23,204 - - 23,204 44,936 Program support 16,322 - - 16,322 19,873 Fundraising 7,633 - - 7,633 7,577 Management and service fees 3,637 - - 3,637 3,015
Subtotal 125,394 - - 125,394 142,412
Less amounts attributed to others (7,818) - - (7,818) (9,727)
Total 117,576 - - 117,576 132,685
Expenses of The University of Iowa Center for Advancement and Affiliate
Operating Expenses 29,819 - - 29,819 28,713
Total expenses 147,395 - - 147,395 161,398
Change in net assets, prior to contribution of UIAA 3,611 54,910 37,422 95,943 108,968
Contribution of UIAA 441 6,047 314 6,802 -
Change in net assets 4,052 60,957 37,736 102,745 108,968
Net assets, beginning 29,599 605,024 694,567 1,329,190 1,220,222
Net assets, ending $33,651 $665,981 $732,303 1,431,935 1,329,190
The accompanying notes are an integral part of these financial statements.
Consolidated Statement of Activites For the year ended June 30, 2018 (in thousands)With comparative statement for the year ended June 30, 2017
THE UNIVERSITY OF IOWA CENTER FOR ADVANCEMENT AND AFFILIATE

25 FY18 Notes to Financial Statements FY18 Notes to Financial Statements 25
Notes to Financial Statements
Note 1—Organization and Summary of Significant Accounting Policies
ORGANIZATIONThe State University of Iowa (University), located in Iowa City, Iowa, is a coeducational university
owned and operated by the State of Iowa (State) under the supervision of the Board of Regents,
State of Iowa (Board of Regents). The University was established by the First General Assembly on
February 25, 1847, and has been in continuous operation since classes began in 1855.
The University is classified as a state instrumentality under Internal Revenue Code Section 115
and its income is exempt from federal income taxes. Certain activities of the University may be
subject to taxation as unrelated business income under Internal Revenue Code Sections 511 to 514.
BASIS OF PRESENTATIONThe financial statements have been prepared in accordance with accounting principles generally
accepted in the United States of America, as prescribed by the Governmental Accounting
Standards Board (GASB). These statements present the University as a whole. These GASB
Statements establish standards for external financial reporting for public colleges and universities
and require that resources be classified for accounting and reporting purposes into four net
position categories:
• Net investment in capital assets—Capital assets, net of accumulated depreciation and
amortization and reduced by outstanding debt attributable to the acquisition, construction,
or improvement of those assets.
The University of Iowa leads the world in hydroscience research, leveraging top-tier facilities to support unmatched academic programs, experimentation, and outreach to communities across Iowa.

26 FY18 Notes to Financial Statements
• Restricted, nonexpendable—Net position subject to externally imposed constraints
in which the donors or other outside sources have stipulated as a condition that the
principal is to be retained in perpetuity. Such assets include the University’s permanent
endowments.
• Restricted, expendable—Net position whose use by the University is subject to externally
imposed constraints that can be fulfilled by actions of the University pursuant to those
constraints or that expire by the passage of time.
• Unrestricted—Net position not subject to externally imposed constraints which may be
used by the governing board to meet current obligations for any purpose. Unrestricted
net position is derived from student tuition and fees, state appropriations, and sales and
services of auxiliary enterprises and are generally designated for academic, research and
capital programs or to meet contractual obligations of the University.
When an expense is incurred in which both unrestricted and restricted net position are available,
the University’s policy is to first apply the expense against the restricted, and then toward the
unrestricted net position.
FINANCIAL REPORTING ENTITYThe University’s financial statements include schools, colleges and departments, the University
of Iowa Hospitals & Clinics (UIHC), the Iowa Medical Mutual Insurance Company (IMMIC,
a captive insurance company) and certain affiliated operations determined to be a part of
the University’s financial reporting entity. The University has also considered all potential
component units for which it is financially accountable, and other organizations for which the
nature and significance of their relationship with the University are such that exclusion would
cause the University’s financial statements to be misleading or incomplete. GASB has set forth
criteria to be considered in determining financial accountability. The GASB classification of
these entities for the University’s financial reporting purposes does not affect their respective
legal or organizational relationships with the University. As required by United States generally
accepted accounting principles as prescribed by the GASB, these financial statements present
the University and its component units. These component units are included in the University’s
reporting entity because of the significance of their operational or financial relationships with
the University. These component units are separate legal entities from the University, but are so
intertwined with the University they are, in substance, the same as the University.
Blended Component UnitsThe Iowa Measurement Research Foundation, Miller Endowment, Incorporated and University
of Iowa Research Park Corporation are included in the reporting entity as blended component
units. These legally separate entities are included in the University’s financial reporting entity
because of the nature of their relationship to the University.
The Iowa Measurement Research Foundation (IMRF) was formed in 1970 under the provisions
of the Iowa Nonprofit Corporation Act. The primary purpose of the Foundation is to advance
and extend knowledge in the field of educational measurement by providing financial assistance
to the University of Iowa and its College of Education for promising research and educational
projects in furtherance of this purpose.

27 FY18 Notes to Financial Statements FY18 Notes to Financial Statements 27
Miller Endowment, Incorporated was established December 18, 1995 pursuant to the will
and codicil of F. Wendell Miller. The will and codicil appointed the presidents of Iowa State
University and the State University of Iowa as coexecutors of the Miller Estate and co-trustees of
the Miller Endowment Trust, a charitable trust, and further directed that the two universities be
equal beneficiaries of the income from said trust. The will and codicil also directed the
trustees to have the right and discretion to create a charitable corporation, to be “Miller
Endowment, Incorporated”, to own, administer and control the affairs and property of the trust.
This corporation has been organized under Chapter 504A of the Code of Iowa and Section
501(C)(3) of the Internal Revenue Code. During fiscal year 1998, the assets of the trust were
officially transferred to Miller Endowment, Incorporated. Since the net revenues and assets of
the corporation are solely for the equal benefit of the two universities, one half of the value of the
corporation’s transactions has been blended into the University’s operations.
The University of Iowa Research Park Corporation (Corporation) is a not-for-profit corporation
and a component unit of the University of Iowa (University). The Corporation leases from the
State of Iowa approximately 185 acres of land located in the University of Iowa Research Park.
The land subject to this lease is designated as the University of Iowa Research Park and is platted
as a subdivision of Coralville, Iowa. Under terms of its master lease with the State of Iowa, the
Corporation subleases parcels of the University of Iowa Research Park to businesses (or to private
developers working on behalf of businesses) wishing to locate close to the University and its
research assets.
The Corporation’s revenues derive primarily from the proceeds of its leases to tenant companies
or developers and from an annual special purpose appropriation from the State of Iowa.
Discretely Presented Component UnitsThe University of Iowa Center for Advancement and Affiliate, the University of Iowa Research
Foundation, and the University of Iowa Health System are included in the reporting entity
as discretely presented component units. These legally separate entities are included in
the University’s financial reporting entity because of the nature of their relationship to the
University.
The purpose of The University of Iowa Center for Advancement (UICA), formerly known as The
State University of Iowa Foundation (UIF), is to solicit, receive and manage gifts for the benefit of
research and education at The State University of Iowa (University of Iowa). The UICA is legally a
not-for-profit corporation that is organizationally and operationally independent of the University
of Iowa, but is generally subject to restrictions imposed by donors and holds investments
primarily for temporary and permanently restricted uses of the University of Iowa.

28 FY18 Notes to Financial Statements
During the year ending June 30, 2018, UIF and the University of Iowa Alumni Association (UIAA) merged to create one new, unified organization. This transaction was treated as an acquisition in accordance with accounting principles generally accepted in the United States of America. The effective date of the transaction was end of day December 31, 2017 with UIF acquiring all assets and assuming all liabilities of the UIAA on this date, which has been reflected in the financial statements as of and for the year ended June 30, 2018 as follows (in thousands):
(A) Prior to December 31, 2017, UIAA’s investments were recorded by UICA with a corresponding liability, amounts held on behalf of others. Upon merger the amounts held on behalf of others is included in the contribution of UIAA in the consolidated statement of activities.
During the years ended June 30, 2018 and 2017 the UICA distributed to the University or
expended on behalf of the University $125,394,000 and $142,412,000, respectively, for both
restricted and unrestricted purposes.
The UICA is a nonprofit organization that reports under FASB standards, including FASB
Statement No. 117, Financial Statements for Not-for-Profit Organizations. As such, certain
revenue recognition criteria and presentation features are different from GASB revenue
recognition criteria and presentation features. No modifications have been made to the UICA’s
financial information in the University’s financial reporting entity for these differences.
The UICA acts as a financial agent for other organizations benefiting the University of Iowa.
Since the UICA is not considered to be financially interrelated to these organizations, the total
amount of funds held on behalf of these organizations has been reflected as a liability on the
consolidated statement of financial position. The UICA does not have variance power to re-direct
the assets held for others and the funds are generally payable quarterly with a 15 day notification
period. On the consolidated statement of activities, the UICA reports the gross amounts
of support, revenue and expenses with the amount raised and expended on behalf of these
organizations shown as a reduction in the gross amounts of support, revenue and expenses.
Assets held on behalf of these organizations include remainder interests in trusts, pledges and
investments, which are for the benefit of the University. The following table identifies these
legally separate, tax-exempt organizations.
2018
Cash $178
Other receivables and prepaids 322
Investments (A) 6,128
Property and equipment, net 192
Total $6,820
2018
Accounts payable and other accrued expenses $18
Contribution of UIAA 6,802
Total $6,820

29 FY18 Notes to Financial Statements FY18 Notes to Financial Statements 29
Complete financial statements for the UICA can be obtained from The University of Iowa Center
for Advancement, One West Park Road, P.O. Box 4550, Iowa City, Iowa 52244-4550, Attn: CFO &
Treasurer.
The University of Iowa Research Foundation (UIRF)—a 501(c)(3) corporation—commercializes
University of Iowa (University) developed technologies and inventions through licensing and new
venture formation, and manages the subsequent revenue stream. UIRF’s primary functions are:
• Licensing: finding suitable partners for commercialization of University technologies and
inventions;
• New Ventures: identifying and helping develop new high growth companies based on
University technologies that may be suitable for venture capital financing;
• Intellectual Property (IP) Management: protecting University inventions through patents
and copyrights, advising on IP terms for Clinical Trials and Sponsored Research, and
executing out-going material transfer agreements.
The UIRF is a private nonprofit corporation tied to the University and was created in 1975 as
the designated manager for these inventions and selected University intellectual properties.
UIRF aspires to maximize the public benefit of University research through commercial use
of University technologies. The intention of the UIRF is to effectively manage University
intellectual property to successful outcomes including: champion the commercialization
of selected University inventions for public benefit, catalyze economic development and an
entrepreneurial culture in Iowa, build the vitality and sustainability of the University and
the community through technology commercialization, and serve the research mission for
continued innovation.
The University owns inventions made by faculty, staff, or students during the course of the
inventor’s employment by or in association with the University, or if the invention was enabled
by significant use of University resources, and as a consequence of federal law, the Bayh-Dole
Act. The UIRF may take an ownership stake in any intellectual property or materials owned by
the University. All inventions arising from federal research support must be disclosed to the
UIRF and must be reported to the associated funding agencies.
The UIRF takes ownership of selected inventions through assignment from the inventor(s) based
on University Intellectual Property Policy. For these inventions, the UIRF exercises the right and
the obligation to manage the intellectual property, with activities and authorities that include:
performing market and intellectual property opportunity analysis; filing patent applications and
managing the patent portfolio; seeking licensees for technologies; receiving and distributing
earnings derived from the license(s); monitoring licensee performance; and enforcing
intellectual property rights. Note that the UIRF retains ownership of intellectual property (i.e.,
patents are not “sold”), and instead licenses the use there-of.
Amounts Held on Behalf of Others (in thousands) 2018 2017
Iowa Law School Foundation $85,210 $82,060
Iowa Scholarship Fund 6,396 7,933
University of Iowa Alumni Association - 6,871
Student Publications Incorporated 901 975
Total $92,507 $97,839
30 FY18 Notes to Financial Statements
University of Iowa Health System (UIHS or the System) was incorporated under the provisions
of the Iowa Nonprofit Corporation Act on December 2, 1994. UIHS was formed to support the
clinical, academic, and research programs of the University of Iowa Carver College of Medicine
(UICCOM) and the University of Iowa Hospitals and Clinics (UIHC).
UIHS does not have members with voting rights. Upon dissolution, any remaining assets will
be transferred to the University of Iowa, or its successor, if in existence. Otherwise the assets
may be transferred by the board of directors to various entities exclusively for public purposes in
accordance with the articles of incorporation for UIHS.
UIHS has considered all potential component units for which it is financially accountable and
other organizations for which the nature and significance of their relationship with UIHS are
such that exclusion would cause UIHS’ financial statements to be misleading or incomplete.
Government Accounting Standards Board (GASB) has set forth the criteria to be considered
in determining financial accountability. The GASB classification of these entities for UIHS
financial reporting purposes does not affect their respective legal or organizational relationship
with UIHS.
These financial statements present UIHS and its component units. These component units
are included in the UIHS reporting entity because of the significance of their operational or
financial relationship with UIHS. These component units are separate legal entities from UIHS,
but are so intertwined with UIHS, they are, in substance, the same as UIHS. Below are the
blended component units of UIHS:
• University of Iowa Community Medical Services, LLC (UICMS) is a for-profit wholly
owned subsidiary, which was formed in 1995 and began operations in 1996. UICMS
provides a full spectrum of practice management, consulting services, ehealth,
Community Connect, Homecare and Occupational Health.
• Pediatric Associates of the University of Iowa Children’s Hospital, LLC (PAUICH) is a
wholly owned subsidiary, which was purchased and formed in 2014. PAUICH has been
organized as a physician specialty practice providing pediatric services to communities
served by UIHS.
• Iowa City Cancer Treatment Center, LLC (ICCTC) – a wholly owned subsidiary, which was
purchased and formed in May 2015. ICCTC is organized as a physician specialty practice
providing radiation oncology services in the Iowa City area.
BASIS OF ACCOUNTINGFor financial reporting purposes, the University is considered a special-purpose government
engaged only in Business Type Activity as defined in GASB Statement No. 35 Basic Financial
Statements-and Management’s Discussion and Analysis-for Public Colleges and Universities.
Accordingly, the financial statements of the University have been prepared using the economic
resources measurement focus and the accrual basis of accounting. As a result, revenues
are recognized when earned, expenses are recorded when an obligation is incurred and all
significant intra-agency transactions have been eliminated.

31 FY18 Notes to Financial Statements FY18 Notes to Financial Statements 31
CASH AND CASH EQUIVALENTSFor purposes of the Statement of Net Position and Statement of Cash Flows, cash and cash
equivalents are reported in accordance with Board of Regents, State of Iowa policy Chapter 2.2,
section 4.C.ix (http://www.iowaregents.edu/plans-and-policies/board-policy-manual/22-business-
procedures/%23Investment%20Policy), which states in part: to appropriately reflect the Board’s
overall investment strategy and as outlined in the GASB Statement No. 9 Reporting Cash Flows
of Proprietary and Nonexpendable Trust Funds and Governmental Entities That Use Proprietary
Fund Accounting, paragraph 11 that all funds held by external investment managers, as defined
in section 2.2.4.C.iv of the Board’s investment policy, shall be reported on the audited financial
statements of the Regent institutions as investments. Investments purchased by the institutions
through Board authorized brokerage firms that meet the definition of cash equivalents,
investments with original purchase dates to maturity of three months or less shall be reported
on the audited financial statements of the Regent institutions as cash equivalents.
INVESTMENTS (UNIVERSITY)Investments are reported at fair value in accordance with GASB Statement No. 31 Accounting
and Financial Reporting for Certain Investments and for External Investment Pools, GASB
Statement No. 34 Basic Financial Statements-and Management’s Discussion and Analysis-for
State and Local Governments, and GASB Statement No. 72 Fair Value Measurement and
Application. Changes in unrealized gain (loss) on the carrying value of the investments are
reported as a component of investment income in the Statement of Revenues, Expenses and
Changes in Net Position. Please see Note 2 for further discussion.
INVESTMENTS (UI CENTER FOR ADVANCEMENT (UICA))Investments are carried at fair value. Fair value is the price that would be received to sell an
asset or paid to transfer a liability in an orderly transaction between market participants at
the measurement date. The UICA elected to report the fair value of alternative investments,
comprised of hedge funds and private capital funds, included in managed separate investment
accounts using the practical expedient. The practical expedient allows for the use of net asset
value (NAV), either as reported by the investee fund or as adjusted by the UICA management
based on various factors including considering contributions and withdrawals to the fund and
monitoring unaudited interim reporting provided by the fund related to investment returns
to calculate NAV as of June 30. Realized and unrealized gains and losses on investments are
included in the change in fair value of investments in the consolidated statements of activities
and absent donor restrictions, are reported in unrestricted net assets.
PLEDGES RECEIVABLE (UI CENTER FOR ADVANCEMENT (UICA))Pledges receivable are recorded at the net present value of estimated cash flows based on
appropriate rates commensurate with the risks involved, 5 percent for pledges held at
June 30, 2018, less an allowance for doubtful pledges. Conditional promises to give are not
included as support until the conditions are substantially met. The provision for losses on
doubtful pledges is an adjustment to contributions at quarter-end equal to 2.5 percent of gross
pledges and totaled $219,611 for the year ended June 30, 2018. Pledges written off totaled
$2,975,000 and $1,660,000 for the years ended June 30, 2018 and 2017, respectively.

32 FY18 Notes to Financial Statements
INVENTORIESInventories, primarily expendable materials and supplies held for consumption, are valued
using the lower of cost or market, with cost determined on the first-in, first-out or weighted
average basis.
CAPITAL ASSETSPurchased capital assets. Purchased capital assets with a useful life greater than one year are
stated at cost at the acquisition date.
Donated capital assets. Donated capital assets acquired prior to FY 2016, are reported at
estimated fair value at the time of acquisition. In accordance with GASB Statement No. 72
Fair Value Measurement and Application, donated capital assets acquired after FY 2015 are
reported at their acquisition value at the date of acquisition. Acquisition value is defined as
the price that would be paid to acquire an asset with equivalent service potential in an orderly
market transaction at the acquisition date.
Library collections. Library materials exist in the Law Library and the Main Library (includes
Hardin and other library branches). The University capitalizes library materials as a collection
(including perpetual electronic subscriptions). Additions to the collection are catalogued in the
library where detailed records of the inventory are maintained. The library does not routinely
digitize their physical collection. However, for items that are digitized, the cost incurred is
typically internal staff time and is not capitalized. The Main Library and Law Library prepare
annual reports which include the annual expenditures for collection additions, the amount
of in-kind gifts, the number of volumes added and the number of volumes withdrawn. This
information is used to adjust the capitalized amount for additions and withdrawals. Since the
University deems the library materials as a collection and adjusts the capitalized balance for
additions and withdrawals, the University considers the collection to be inexhaustible and,
therefore, does not depreciate the capitalized balance.
Interest costs. Interest costs are capitalized on University construction projects when the interest
cost during the construction period exceeds the interest earned on the investment of debt
proceeds.
Depreciation and amortization. Depreciation and amortization of capital assets is calculated
using the straight-line method over the estimated useful lives (five to fifty years) of the respective
assets.
Capitalization thresholds.
• Purchased equipment $5,000
• Leased capital equipment $50,000
• Intangible assets, non-UIHC $500,000
• Intangible assets, UIHC $5,000
• Art assets $5,000
33 FY18 Notes to Financial Statements FY18 Notes to Financial Statements 33
WHOLLY OWNED SUBSIDIARY (UNIVERSITY)Musser-Davis Land Company (the Company) is a wholly-owned subsidiary of the State
University of Iowa (the University). It is a separate legal entity governed by a Board of Directors.
The Company’s directors consist of eight members, including representatives of the Office
of the Senior Vice President for Finance and Operations and the Office of the Dean of the
Roy J. and Lucille A. Carver College of Medicine (CCOM). The other directors are appointed
by the University. Based on this relationship, the Company is a wholly-owned subsidiary of
the University and its financial statements are reported using the Governmental Accounting
Standards framework.
The Company was formed in 1916, and its stock was gifted to the University of Iowa over a
number of years for the benefit of the CCOM. The University became the sole stockholder
in 1977, and in 1981 the Company was granted tax-exempt status as a nonprofit organization
under Section 501(c)(3) of the Internal Revenue Code. It is authorized to make distributions;
for the benefit of the CCOM. The Articles of Incorporation bar any transfer or assignment of
common stock.
The Company owns land in Louisiana subject to a number of agreements that produce royalties
from oil production and timber rights. The Company owns a total of 14,499 acres of land.
The Company’s fiscal year ends December 31 and its financial statements are presented on a
modified cash basis of accounting. As of December 31, 2017, assets (including investments of
$16,052,000) totaled $17,900,000, liabilities were $0 and net assets were $17,900,000. As of
December 31, 2016 assets (including investments of $30,088,000) totaled $31,856,000, liabilities
were $0 and net assets were $31,856,000. During fiscal year 2018, Musser-Davis Land Company
distributed $2,400,000 to the Roy J. and Lucille A. Carver College of Medicine for support of
capital projects. Consequently, as of June 30, 2018, assets (including investments of $13,652,000)
totaled $15,500,000, liabilities were $0 and net assets were $15,500,000. During fiscal year 2017,
Musser-Davis Land Company distributed $16,750,000 to the Roy J. and Lucille A. Carver College
of Medicine for support of capital projects. Consequently, as of June 30, 2017, assets (including
investments of $13,338,000) totaled $15,106,000, liabilities were $0 and net assets were $15,106,000.
INVESTMENT IN SUBSIDIARY (UICA)The University of Iowa Facilities Corporation (Corporation) is an affiliate of the UICA because
the UICA elects the Corporation’s Board of Directors. The Corporation is organized to assist the
UICA in its programs which support the University. The Corporation accomplishes this objective
by acquiring and holding property for the benefit and use of the University. The Corporation may
incur debt obligations, either through the issuance of bonds or incurring commercial mortgages,
for the purchase of properties. Simultaneously, the Corporation leases these buildings to the
University. The lease agreements provide for the University to service the debt and pay for expenses
related to the facilities. The leases also provide for the Corporation to convey title of the facilities to
the University at the end of each lease term when the debt agreements are fully amortized.
Since the Corporation has not and will not have an economic interest in the outstanding bonds,
the asset and the related debt and revenue and expenses related to the asset are not recorded
on the financial statements of the Corporation. The asset and the related debt and revenue and
expenses related to the asset are recorded as a segment of the University and included within the
University’s financial statements.
34 FY18 Notes to Financial Statements
The Corporation also acquires and holds real estate, which will ultimately be deeded to the
University after a period of time. These assets are recorded on the Corporation’s books.
The assets and net income (loss) of the subsidiary described above is not material to the financial
statements and the UICA uses the equity method of accounting for its investment in the
controlled corporation.
BOND ISSUANCE COSTS, DISCOUNTS, AND PREMIUMSBond issuance costs are expensed in the year the bonds are sold. Bond discounts and premiums
are deferred and amortized over the life of the bonds using the effective interest rate method.
UNEARNED REVENUEUnearned revenue includes advance tickets sales, student tuition related to next fiscal year and
amounts received from leases, grants and contracts that have not yet been earned.
COMPENSATED ABSENCES PAYABLEUniversity employees accumulate vacation and sick leave under the provisions of Chapters 70A
and 262 of the Code of Iowa. It is the policy of the State to liquidate these accrued benefits under
specific circumstances. The State pays for accrued vacation at 100% of the employee’s hourly
rate upon retirement, death, or termination and, with certain exceptions, for accrued sick leave
at 100% of the hourly rate to a maximum of $2,000 upon retirement. The liability for accrued
compensated absences as reported in the Statement of Net Position is based on the current
rates of pay.
REFUNDABLE ALLOWANCES ON STUDENT LOANSRefundable allowances on student loans consist of federal capital contributions to the University
from the Perkins or Health Profession student loan programs. The federal capital contribution
amounts are refundable to the United States government if the loan programs are discontinued
or the University closes an associated degree program.
NONCURRENT DEBT AND OTHER NONCURRENT LIABILITIESNoncurrent debt includes principal amounts of revenue bonds, notes and capital leases payable
with contractual maturities greater than one year. Noncurrent debt also includes unamortized
discounts and premiums, resulting from bond issuances. Other noncurrent liabilities include
estimated amounts for accrued early retirement, other postemployment and pension benefits,
compensated absences payable, refundable allowances on student loans, and unearned revenue
that will not be earned within the next fiscal year. For purposes of measuring the net pension
liability, deferred outflows of resources and deferred inflows of resources related to pensions,
and pension expense, information about the fiduciary net position of the Iowa Public Employees’
Retirement System (IPERS) and additions to/deductions from IPERS’ fiduciary net position have
been determined on the same basis as they are reported by IPERS. For this purpose, benefit
payments (including refunds of employee contributions) are recognized when due and payable
in accordance with the benefit terms. Investments are reported at fair value. For purposes of
measuring the total OPEB liability, deferred outflows of resources related to OPEB and OPEB
expense, information has been determined based on the university’s actuary report. For this
purpose, benefit payments are recognized when due and payable when in accordance with the
benefit terms.
35 FY18 Notes to Financial Statements FY18 Notes to Financial Statements 35
DEFERRED OUTFLOWS AND INFLOWS OF RESOURCESDeferred outflows of resources include unamortized bond refunding losses, University
Hospital acquisition of clinics, pension related amounts derived from the differences between
expected and actual experience, change in assumptions, difference between projected and
actual earnings on pension plan investments, change in proportion and difference between the
University contributions and proportionate share of contributions and University contributions
subsequent to the measurement date, and OPEB related amounts derived from the differences
between expected and actual experience and University contributions subsequent to the
measurement date. Deferred inflows include unamortized bond refunding gains, qualifying
receipts for sponsored programs, pension amounts derived from the differences between
expected and actual experience and the net difference between the pension plan’s projected and
actual investment earnings on pension plan investments, and OPEB related amounts derived
from assumption changes. Bond refunding losses and gains are the difference between the
reacquisition price of the new debt and the net carrying amount of the debt being refunded. The
receipts for sponsored programs represent resources received before time requirements are met,
but after all other eligibility requirements have been met.
FRINGE BENEFITSThe University utilizes the fringe benefits pool method to account for fringe benefits. Under
the fringe benefits pool method, fringe benefits are expensed as a percentage of actual salary or
wage costs. The use of fringe benefits rates rather than actual fringe benefits costs is accepted
by the Federal Government and widely used by universities. Rates are reviewed annually prior
to the beginning of the fiscal year and adjusted to reflect differences between the rates charged
and actual benefits costs as well as future benefits projections. The Federal Government must
approve the annual rate study.
DEFINITION OF OPERATING ACTIVITIESOperating activities reported on the Statement of Revenues, Expenses and Changes in Net
Position are those that generally result from exchange transactions, such as payments received
for providing services and payments made for services or goods received. Nearly all of the
University’s expenses are from exchange transactions. Certain significant revenue streams relied
upon for operations are recorded as nonoperating revenues, as defined by GASB Statement No.
35, including state appropriations, gifts and investment income.
NON-VESTED EQUIPMENTCapital assets purchased with restricted contract and grant proceeds have been excluded from
the Statement of Net Position.
USE OF ESTIMATESThe preparation of financial statements in conformity with United States generally accepted
accounting principles requires management to make estimates and assumptions that affect
certain reported amounts and disclosures. Actual results could differ from those estimates.

36 FY18 Notes to Financial Statements
Note 2—Cash, Cash Equivalents, Investments, and Deposits with Trustees
CASH AND CASH EQUIVALENTSA summary of the book and bank balances for cash and cash equivalents at June 30, 2018 and 2017 is as follows (in thousands):
The University’s balances for current cash and cash equivalents represent amounts that
are reasonably expected to be consumed within a year and are comprised of deposit and
disbursement bank accounts, money market funds, demand deposit accounts, savings accounts,
and government securities for the debt service and construction fund balances for bonded
enterprises. The liquidity pool shall be managed to ensure funds are available to support
operations for the current budget year.
Cash and cash equivalents are used to fund obligations such as controlled disbursements for
accounts payable, salaries and wages payable, bond principal and interest payments, and federal
and state withholding taxes.
DEPOSITS WITH TRUSTEESInvestments on deposit with trustees, paying and copaying agents for the purpose(s) of paying
current obligations of bond principal and interest, for holding Bond Reserve Funds or for
holding Construction Funds as specified by bond resolutions at June 30, 2018 and 2017, totaled
$14,726,000 and $14,650,000, respectively. At June 30, 2018, $13,780,000 of the $14,725,000 was
invested in U.S. Government Agency securities with a credit quality rating of AAA and an
effective duration of 1.37 years.
INVESTMENTSInvestments are made in accordance with Chapter 12B.10, of the Code of Iowa, and Board of
Regents, State of Iowa policy. (http://www.iowaregents.edu/plans-and-policies/board-policy-
manual/22-business-procedures/#Investment Policy). In order to achieve economies of scale, the
University of Northern Iowa’s endowments and a portion of its operating portfolio are pooled
with the University’s investments. The University’s endowment portfolio included $10,462,000
and $9,625,000 at June 30, 2018 and 2017, respectively, held for the University of Northern
Iowa. The University’s operating portfolio included $46,639,000 and $45,722,000 at June 30,
2018 and 2017, respectively, as well as $21,830,000 and $21,134,000 invested in the University’s
intermediate term portfolio at June 30, 2018 and 2017, respectively, held for the University of
Northern Iowa. The University of Northern Iowa investments are recorded as Deposits Held in
Custody for Others.
2018 2017
Book Balance $271,085 $207,301
Bank Balance 294,986 224,542
Covered by FDIC insurance or State Sinking Fund 33,043 36,095
Invested in money market funds as cash equivalents 261,943 188,447

37 FY18 Notes to Financial Statements FY18 Notes to Financial Statements 37
For donor restricted endowments, Chapter 540A of the Code of Iowa permits the University to
spend the net appreciation of realized and unrealized earnings as the University determines to
be prudent. The University’s spending policy adjusts dollar payouts by the trailing calendar year
Consumer Price Index (inflation rate). Total payout is banded at no less than 4% and no greater
than 6% of calendar year end market values.
Net appreciation of permanent endowment funds, which totaled $13,893,000 and $12,978,000
at June 30, 2018 and 2017, respectively, is available to meet spending rate distributions and is
recorded in restricted nonexpendable net position.
INTEREST RATE RISKInterest rate risk is the risk changes in interest rates will adversely affect the fair value of an
investment. This risk is measured using effective duration. At the time of purchase, the effective
maturity of direct investment purchases by the University in the operating portfolio cannot
exceed sixty-three months. There is no explicit limit on the average maturity of fixed income
securities in the endowment portfolios. Each fixed income portfolio is managed to an appropriate
benchmark.
CREDIT RISKCredit risk is the risk an issuer or other counterparty to an investment will not fulfill its obligation
to the University. Each fixed income portfolio is managed to an appropriate benchmark.
CONCENTRATION OF CREDIT RISKConcentration of credit risk is the risk of loss attributed to the magnitude of investments in a
single issuer. Except for Treasury or Agency debentures, no more than 5% of University direct
investments are invested in securities of a single issuer at time of purchase. All direct investment
purchases by the University in the operating portfolio are U.S. Treasury and Agency securities.

38 FY18 Notes to Financial Statements
The University’s investments are recorded at fair value. As of June 30, 2018 and 2017, the University had the following investments and quality credit ratings (in thousands):
INVESTMENT TYPE
Effective Duration
(Years)TSY/AGY/
AAA AA A BBB BB BTotal
Fair Value
Fixed Income:
Corporate Notes and Bonds 0.00 $ - $ - $ - $ - $ - $ - $ -
U.S. Government Agencies 1.33 - 68,848 - - - - 68,848
U.S. Government Treasuries 1.29 - 43,109 - - - - 43,109
Mutual Funds 4.53 - 599,513 151,141 51,200 97,211 85,381 984,446
Total $ - $711,470 $151,141 $51,200 $97,211 $85,381 1,096,403
Equity and Other:
Common Stock 14,465
Mutual Funds 436,155
Real Assets 155,144
Private Equity 71,379
Bank Investments 64,892
Money Market/Cash Equivalents 121,525
Total Investments June 30, 2018 $1,959,963
INVESTMENT TYPE
Effective Duration
(Years)TSY/AGY/
AAA AA A BBB BB BTotal
Fair Value
Fixed Income:
Corporate Notes and Bonds 2.08 $2,538 $1,895 $5,927 $7,266 $82 $46 $17,754
U.S. Government Agencies 2.38 200 71,172 - - - - 71,372
U.S. Government Treasuries 1.96 - 64,208 - - - - 64,208
Mutual Funds 4.26 - 251,896 47,340 158,184 106,092 104,018 667,530
Total $2,738 $389,171 $53,267 $165,450 $106,174 $104,064 820,864
Equity and Other:
Common Stock 17,577
Mutual Funds 362,740
Real Assets 269,253
Private Equity 52,784
Bank Investments 162,539
Money Market/Cash Equivalents 160,141
Total Investments June 30, 2017 $1,845,898

39 FY18 Notes to Financial Statements FY18 Notes to Financial Statements 39
FAIR VALUE MEASUREMENTSFair value is defined as the price that would be received to sell an asset or paid to transfer
a liability in an orderly transaction between market participants at the measurement date.
Generally accepted accounting principles provide a hierarchy that prioritizes the inputs to fair
value measurements based on the extent inputs to valuation techniques are observable in the
marketplace. The hierarchy assigns a higher priority to observable inputs that would reflect
the University’s assumptions about how market participants would value an asset or liability
based on the best information available. Fair value measurements should maximize the use of
observable inputs and minimize the use of the unobservable inputs. The three levels of the fair
value hierarchy are as follows:
• Level 1 – Unadjusted quoted prices in active markets for identical assets or liabilities that
are available at the measurement date.
• Level 2 – Inputs other than quoted prices included within Level 1 that are observable for
the asset or liability, either directly or indirectly.
• Level 3 – Unobservable inputs for the asset or liability that are used to measure fair value
when observable inputs are not available. These inputs are developed based upon the best
information available in such circumstances.
The categorization of fair value measurements by level of the hierarchy is based upon the lowest
level input that is significant to the overall fair value measurement for a given asset or liability.
In the event that changes in the inputs used in the fair value measurement of an asset or
liability result in a transfer into a different level, such transfers are recognized at the end
of the reporting period.
University investments that do not have a readily determinable fair value, such as ownership
interest in partners’ capital, are reported using Net Asset Value per share (NAV). Used as a
practical expedient for the estimated fair value, NAV per share or its equivalent is provided by the
fund manager and reviewed by the University. Investment holdings using the NAV as a practical
expedient consist of University interests in funds investing in nonmarketable private equity and
real assets, as well as indirect holdings of publicly traded assets in fixed income and international
equity commingled funds.
Due to the nature of the investments held by the funds, changes in market conditions, economic
environment, regulatory environment, currency exchange rates, interest rates, and commodity
price fluctuations may significantly impact the NAV of the funds and, consequently, the fair
value of the University’s interest in the funds and could materially affect the amounts reported
in the consolidated financial statements. The University attempts to manage these risks through
diversification, ongoing due diligence of fund managers, maintaining adequate liquidity, and
continuously monitoring economic and market conditions.

40 FY18 Notes to Financial Statements
The following tables reflect fair value measurements of investment assets at June 30, 2018 and 2017, respectively, as categorized by level of the fair value hierarchy according to the lowest level of inputs significant to each measurement or NAV (in thousands):
INVESTMENT TYPE Level 1 Level 2 Level 3 NAVTotal
Fair Value
Fixed Income:
Corporate Notes and Bonds $ - $ - $ - $ - $ -
U.S. Government Agencies - 68,848 - - 68,848
U.S. Government Treasuries 43,109 - - - 43,109
Mutual Funds 490,103 - - 494,343 984,446
Equity and Other:
Common Stock 13,860 605 - - 14,465
Mutual Funds 224,890 - - 211,265 436,155
Real Assets - - - 155,144 155,144
Private Equity - - - 71,379 71,379
Subtotal 771,962 69,453 - 932,131 1,773,546
Bank Investments 64,892
Money Market/Cash Equivalents 121,525
Total Investments June 30, 2018 $1,959,963
INVESTMENT TYPE Level 1 Level 2 Level 3 NAVTotal
Fair Value
Fixed Income:
Corporate Notes and Bonds $ - $17,651 $103 $ - $17,754
U.S. Government Agencies - 71,372 - - 71,372
U.S. Government Treasuries 64,208 - - - 64,208
Mutual Funds 447,997 - - 219,533 667,530
Equity and Other:
Common Stock 16,757 820 - - 17,577
Mutual Funds 217,500 - - 145,240 362,740
Real Assets 209,459 - - 59,794 269,253
Private Equity - - - 52,784 52,784
Subtotal $955,921 $89,843 $103 $477,351 1,523,218
Bank Investments 162,539
Money Market/Cash Equivalents 160,141
Total Investments June 30, 2017 $1,845,898

41 FY18 Notes to Financial Statements FY18 Notes to Financial Statements 41
The following tables summarize the University’s investments at June 30, 2018 and 2017, respectively, for which NAV was used as a practical expedient to estimate fair value (in thousands):
INVESTMENT TYPE
Fair Value determined using NAV
Unfunded Commitments
Redemption Frequency
Redemption Notice Period
Fixed Income Mutual Funds $494,343 $ - daily-monthly 5-60 days
Equity Mutual Funds 211,265 - daily-thrice-monthly 2-30 days
Real Assets:
Redeemable 116,825 - quarterly 60-90 days
Nonredeemable 38,319 58,693 N/A N/A
Private Equity:
Redeemable - - N/A N/A
Nonredeemable 71,379 26,343 N/A N/A
Investments measured at NAV at June 30, 2018 $932,131 $85,036
INVESTMENT TYPE
Fair Value determined using NAV
Unfunded Commitments
Redemption Frequency
Redemption Notice Period
Fixed Income Mutual Funds $219,533 $ - daily-monthly 5-30 days
Equity Mutual Funds 145,240 - monthly-semi-monthly 2-30 days
Real Assets:
Redeemable 25,019 - quarterly 90 days
Nonredeemable 34,775 65,072 N/A N/A
Private Equity:
Redeemable - - N/A N/A
Nonredeemable 52,784 18,375 N/A N/A
Investments measured at NAV at June 30, 2017 $477,351 $83,447
The following information is provided for investments that are valued using the net asset value
per share as a practical expedient:
• Fixed Income Mutual Funds—This category includes investments in mutual funds
holding assets that provide stability, generate income, and diversify market risk.
• Equity Mutual Funds—This category includes investments in global equities including
both developed and emerging markets.

42 FY18 Notes to Financial Statements
• Real Assets—This category includes investments in private real estate and natural
resource equities funds. Capital is committed during the course of the investment
period, typically four years, of each fund, after which point capital commitments stop.
The University’s interest in the nonredeemable funds is considered to be illiquid in that
distributions from liquidation of the underlying asset of the fund are at the discretion
of the general partner per the terms of the limited partnership agreement. Funds are
typically liquidated over a period of five to ten years, and include a mechanism to extend
the length of the partnership with approval from the limited partners.
• Private Equity—This category includes funds that invest in strategies such as venture
capital, leveraged buyouts and mezzanine debt. Capital is committed during the course
of the investment period, typically four years, of each fund, after which point capital
commitments stop. The University’s interest in the nonredeemable funds is considered to
be illiquid in that distributions from liquidation of the underlying asset of the fund are at
the discretion of the general partner per the terms of the limited partnership agreement.
Funds are typically liquidated over a period of five to ten years, and include a mechanism
to extend the length of the partnership with approval from the limited partners.
Note 3—Accounts Receivable, Pledges Receivable, Due From Government Agencies and Notes Receivable
ACCOUNTS RECEIVABLE A summary of the accounts receivable at June 30, 2018 and 2017 is as follows (in thousands):
PLEDGES RECEIVABLE (UICA)A summary of the pledges receivable (unconditional promises to give) at June 30, 2018 and 2017 is as follows (in thousands):
University and Blended Component
Units
UIHC, Affiliates
and UI Physicians Total
Accounts Receivable $95,293 $942,184 $1,037,477
Allowance for Uncollectible Accounts, Indigent Patients and Contractual Adjustments (6,886) (665,961) (672,847)
Accounts Receivable, Net, June 30, 2018 $88,407 $276,223 $364,630
Accounts Receivable $101,789 $870,717 $972,506
Allowance for Uncollectible Accounts, Indigent Patients and Contractual Adjustments (6,645) (610,885) (617,530)
Accounts Receivable, Net, June 30, 2017 $95,144 $259,832 $354,976
2018 2017
Gross pledges receivable $191,057 $182,273
Less present value discount of $30,140 for 2018 and $30,358 for 2017 and allowance for doubtful pledges of $4,776 for 2018 and $4,557 for 2017 (34,916) (34,915)
Total $156,141 $147,358

43 FY18 Notes to Financial Statements FY18 Notes to Financial Statements 43
Gross pledges receivable at June 30, 2018 and 2017, respectively, are expected to be collected as follows (in thousands):
DUE FROM GOVERNMENT AGENCIESDue from government agencies at June 30, 2018 and 2017 are comprised of $11,434,000
and $10,789,000, respectively, due from the State of Iowa and $53,594,000 and $65,111,000,
respectively, due from United States government agencies.
NOTES RECEIVABLECurrent notes receivable at June 30, 2018 and 2017 are $2,234,000, net of an allowance of
$148,000, and $2,270,000, net of an allowance of $154,000, respectively. Noncurrent notes
receivable at June 30, 2018 and 2017 are $26,922,000, net of an allowance of $1,787,000, and
$25,939,000, net of an allowance of $1,758,000, respectively.
2018 2017
In one year or less $47,012 $45,679
Between one year and five years 101,172 90,674
More than five years 42,873 45,920
Total $191,057 $182,273

44 FY18 Notes to Financial Statements
Note 4—Capital Assets
A summary of capital assets activity for the year ended June 30, 2018 is as follows (in thousands):
Beginning Balance Additions Transfers Retirements
Ending Balance
Nondepreciable/Nonamortizable
Land $66,646 2,083 - - $68,729
Construction in Progress 293,545 260,940 (292,470) (930) 261,085
Intangibles in Development 1,814 133 (1,680) - 267
Art and Historical Collections 28,182 777 - (165) 28,794
Library Materials 345,784 13,896 - (1,486) 358,194
Capital Assets, Nondepreciable/ Nonamortizable 735,971 277,829 (294,150) (2,581) 717,069
Depreciable/Amortizable
Land Improvements 27,599 - 3,938 - 31,537
Infrastructure 656,485 - 32,713 - 689,198
Buildings 4,148,878 - 255,819 (5,773) 4,398,924
Equipment 819,791 64,926 - (54,440) 830,277
Intangibles 114,296 1,171 1,680 (1,533) 115,614
Capital Assets, Depreciable/Amortizable
5,767,049 66,097 294,150 (61,746) 6,065,550
Less Accumulated Depreciation/Amortization (2,648,971) (247,336) - 57,497 (2,838,810)
Depreciable/Amortizable Capital Assets, Net 3,118,078 (181,239) 294,150 (4,249) 3,226,740
Capital Assets, Net June 30, 2018 $3,854,049 96,590 - (6,830) $3,943,809

45 FY18 Notes to Financial Statements FY18 Notes to Financial Statements 45
A summary of capital assets activity for the year ended June 30, 2017 is as follows (in thousands):
Beginning Balance Additions Transfers Retirements
Ending Balance
Nondepreciable/Nonamortizable
Land $64,474 2,172 - - $66,646
Construction in Progress 695,327 290,210 (691,992) - 293,545
Intangibles in Development 7,777 232 (6,195) - 1,814
Art and Historical Collections 26,296 1,897 - (11) 28,182
Library Materials 328,141 19,068 - (1,425) 345,784
Capital Assets, Nondepreciable/ Nonamortizable 1,122,015 313,579 (698,187) (1,436) 735,971
Depreciable/Amortizable
Land Improvements 23,798 - 3,801 - 27,599
Infrastructure 618,954 - 37,531 - 656,485
Buildings 3,507,548 - 650,660 (9,330) 4,148,878
Equipment 730,987 124,253 - (35,449) 819,791
Intangibles 107,777 2,428 6,195 (2,104) 114,296
Capital Assets, Depreciable/Amortizable
4,989,064 126,681 698,187 (46,883) 5,767,049
Less Accumulated Depreciation/Amortization (2,464,069) (226,653) - 41,751 (2,648,971)
Depreciable/Amortizable Capital Assets, Net 2,524,995 (99,972) 698,187 (5,132) 3,118,078
Capital Assets, NetJune 30, 2017 $3,647,010 213,607 - (6,568) $3,854,049
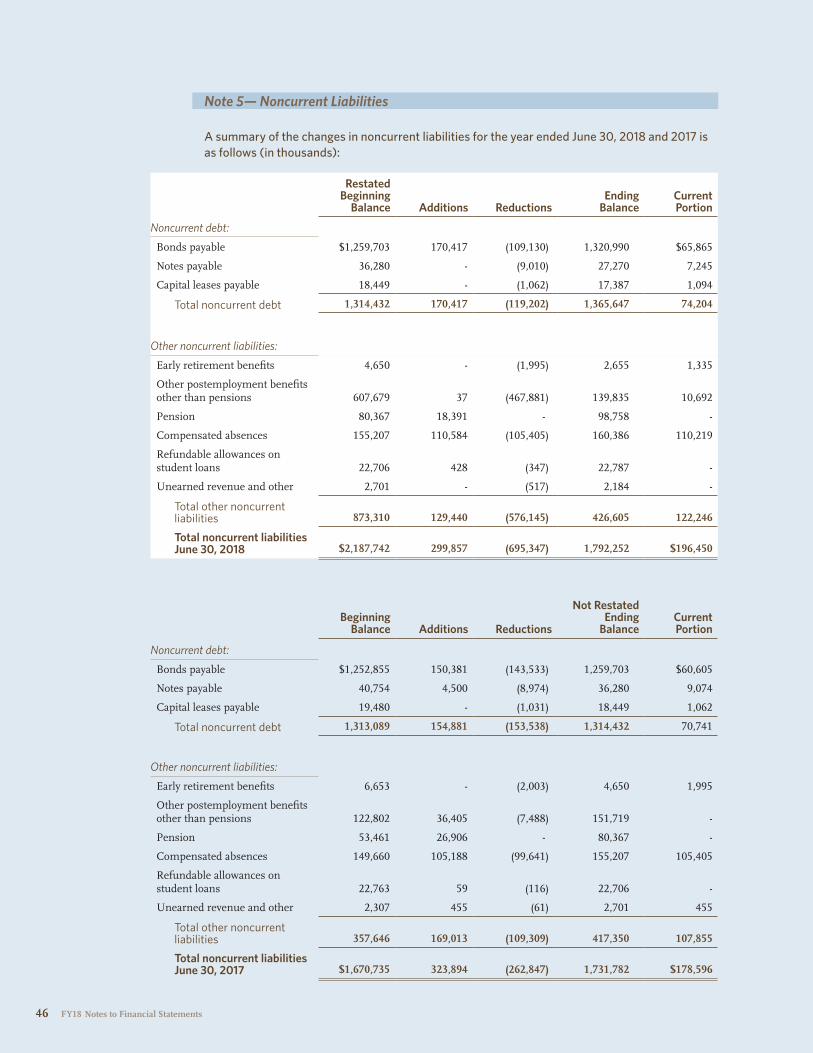
46 FY18 Notes to Financial Statements
Note 5— Noncurrent Liabilities
A summary of the changes in noncurrent liabilities for the year ended June 30, 2018 and 2017 is as follows (in thousands):
RestatedBeginning
Balance Additions ReductionsEnding
BalanceCurrent Portion
Noncurrent debt:
Bonds payable $1,259,703 170,417 (109,130) 1,320,990 $65,865
Notes payable 36,280 - (9,010) 27,270 7,245
Capital leases payable 18,449 - (1,062) 17,387 1,094
Total noncurrent debt 1,314,432 170,417 (119,202) 1,365,647 74,204
Other noncurrent liabilities:
Early retirement benefits 4,650 - (1,995) 2,655 1,335
Other postemployment benefits other than pensions 607,679 37 (467,881) 139,835 10,692
Pension 80,367 18,391 - 98,758 -
Compensated absences 155,207 110,584 (105,405) 160,386 110,219
Refundable allowances on student loans 22,706 428 (347) 22,787 -
Unearned revenue and other 2,701 - (517) 2,184 -
Total other noncurrent liabilities 873,310 129,440 (576,145) 426,605 122,246
Total noncurrent liabilitiesJune 30, 2018 $2,187,742 299,857 (695,347) 1,792,252 $196,450
Beginning Balance Additions Reductions
Not Restated Ending
BalanceCurrent Portion
Noncurrent debt:
Bonds payable $1,252,855 150,381 (143,533) 1,259,703 $60,605
Notes payable 40,754 4,500 (8,974) 36,280 9,074
Capital leases payable 19,480 - (1,031) 18,449 1,062
Total noncurrent debt 1,313,089 154,881 (153,538) 1,314,432 70,741
Other noncurrent liabilities:
Early retirement benefits 6,653 - (2,003) 4,650 1,995
Other postemployment benefits other than pensions 122,802 36,405 (7,488) 151,719 -
Pension 53,461 26,906 - 80,367 -
Compensated absences 149,660 105,188 (99,641) 155,207 105,405
Refundable allowances on student loans 22,763 59 (116) 22,706 -
Unearned revenue and other 2,307 455 (61) 2,701 455
Total other noncurrent liabilities 357,646 169,013 (109,309) 417,350 107,855
Total noncurrent liabilitiesJune 30, 2017 $1,670,735 323,894 (262,847) 1,731,782 $178,596

47 FY18 Notes to Financial Statements FY18 Notes to Financial Statements 47
BONDS PAYABLEBonds have been sold to finance certain capital projects and are outstanding at June 30, 2018, as follows (in thousands):
Interest Rates
(Percent)
Fiscal Year Maturity
Date Range Amount
Bond Issues
Academic Buildings 2.00 - 5.00 2019 - 2037 179,880
Add: Unamortized Premium 6,437
Athletic Facilities 2.00 - 4.00 2019 - 2039 187,680
Add: Unamortized Premium 3,061
Center for University Advancement 4.75 2019 - 2020 1,605
Hospital 1.25 - 5.00 2019 - 2044 312,185
Add: Unamortized Premium 14,621
Iowa Memorial Union 2.00 - 5.00 2019 - 2026 4,920
Add: Unamortized Premium 471
Parking System 2.00 - 4.00 2019 - 2041 52,270
Add: Unamortized Premium 583
Recreational Facilities 2.00 - 5.00 2019 - 2035 59,265
Add: Unamortized Premium 5,154
Residence Services 2.00 - 4.00 2019 - 2043 166,685
Less: Unamortized Discount (97)
Add: Unamortized Premium 1,736
Telecommunications 3.00 - 4.50 2019 - 2037 30,470
Add: Unamortized Premium 130
University of Iowa Facility Corporation 2.00 - 5.00 2019 - 2038 120,865
Add: Unamortized Premium 1,496
Utility System 2.00 - 5.00 2019 - 2043 165,475
Add: Unamortized Premium 6,098
Total $1,320,990
As of June 30, 2018, unspent bond proceeds totaled $61,298,000. Unspent bond proceeds by
segment are: Athletic Facilities Revenue Bonds $27,821,000; Hospital Revenue Bonds $9,077,000;
Residence Services Revenue Bonds $8,000,000; Utility Systems Revenue Bonds $16,400,000.

48 FY18 Notes to Financial Statements
The bonds will mature as follows (in thousands):
Principal Interest Total
Year Ending June 30
2019 $65,865 43,001 $108,866
2020 69,535 41,165 110,700
2021 66,975 38,979 105,954
2022 68,525 36,846 105,371
2023 70,830 34,572 105,402
2024-2028 359,080 135,744 494,824
2029-2033 298,150 77,270 375,420
2034-2038 214,170 30,258 244,428
2039-2043 66,220 4,406 70,626
2044 1,950 34 1,984
Less: Unamortized Discount (97) - (97)
Add: Unamortized Premium 39,787 - 39,787
Total $1,320,990 442,275 $1,763,265
As provided in the various bond resolutions, the University has the right to redeem certain bonds
prior to the above maturity dates, under stated conditions.
NOTES PAYABLEThe University has the following notes payable outstanding at June 30, 2018 (in thousands):
Interest Rates(Percent)
Maturity Dates Amount
Purpose
Athletic Facility 2.48 2019-2024 $16,213
Fleet Services 2 1.69 2019 43
Fleet Services 3 2.00 2019-2020 929
Kinnick Scoreboard 2.41 2019 140
Market Street Property 2.50 2019-2025 1,969
Oakdale Research Park 2.42 2019-2021 2,058
Parking Access and Revenue 2.24 2019 950
Athletics Recreation Building Banked Track 2.55 2019-2022 2,022
Athletics Carver Audio and Video System 3.60 2019-2022 2,946
Total $27,270
Assets acquired under these notes had a net book value of $48,327,000 as of June 30, 2018.
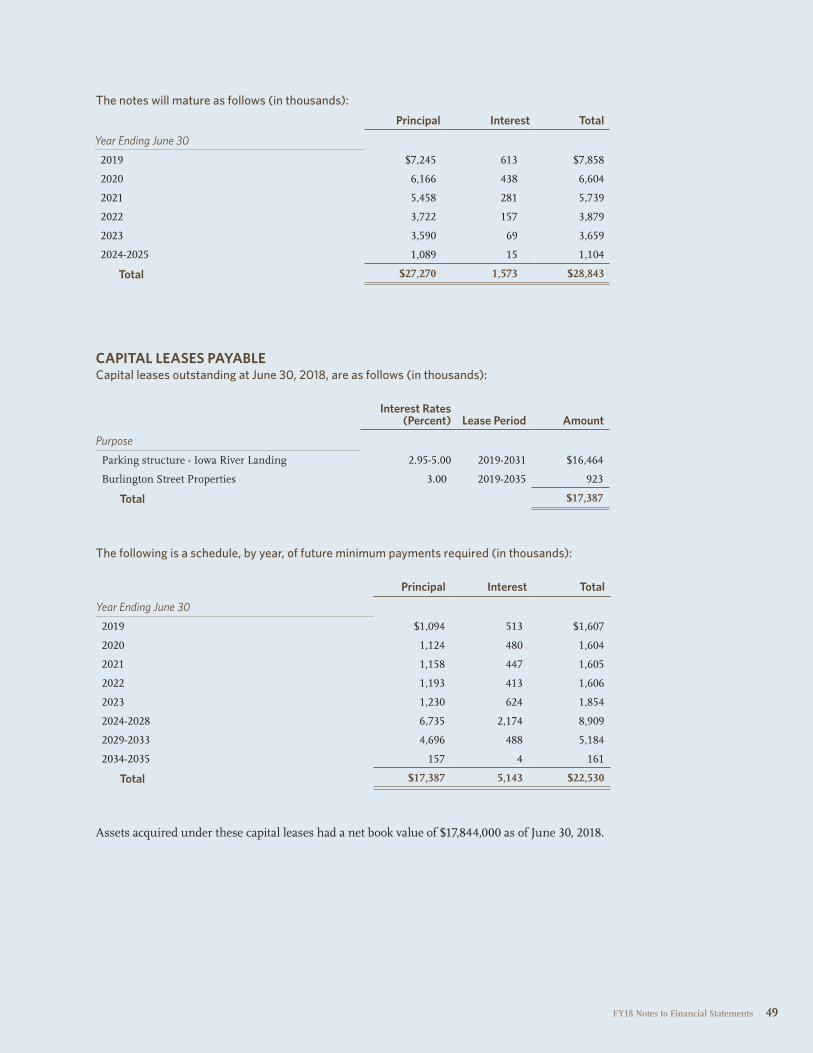
49 FY18 Notes to Financial Statements FY18 Notes to Financial Statements 49
The notes will mature as follows (in thousands):
CAPITAL LEASES PAYABLECapital leases outstanding at June 30, 2018, are as follows (in thousands):
The following is a schedule, by year, of future minimum payments required (in thousands):
Assets acquired under these capital leases had a net book value of $17,844,000 as of June 30, 2018.
Principal Interest Total
Year Ending June 30
2019 $7,245 613 $7,858
2020 6,166 438 6,604
2021 5,458 281 5,739
2022 3,722 157 3,879
2023 3,590 69 3,659
2024-2025 1,089 15 1,104
Total $27,270 1,573 $28,843
Interest Rates(Percent) Lease Period Amount
Purpose
Parking structure - Iowa River Landing 2.95-5.00 2019-2031 $16,464
Burlington Street Properties 3.00 2019-2035 923
Total $17,387
Principal Interest Total
Year Ending June 30
2019 $1,094 513 $1,607
2020 1,124 480 1,604
2021 1,158 447 1,605
2022 1,193 413 1,606
2023 1,230 624 1,854
2024-2028 6,735 2,174 8,909
2029-2033 4,696 488 5,184
2034-2035 157 4 161
Total $17,387 5,143 $22,530

50 FY18 Notes to Financial Statements
Note 6—Operating Leases
The University has leased various buildings to house several departments of the University.
These leases have been classified as operating leases. Accordingly, all rents are charged to
expense as incurred. These leases expire from fiscal year 2019 to fiscal year 2038, and require
various minimum annual rentals. Certain leases are renewable for additional periods. Some of
the leases require the payment of normal maintenance and insurance on the properties. In most
cases, management expects that the leases will be renewed or replaced by other leases.
The following is an annual schedule of future minimum rental payments required under operating leases which have initial or remaining non-cancellable lease terms in excess of one year as of June 30, 2018 (in thousands).
All leases contain non-appropriation clauses indicating that continuation of the lease is subject to
funding by the Iowa State Legislature.
Rental expense for the year ended June 30, 2018, for all operating leases, except those with terms
of a month or less that were not renewed, totaled $16,788,000.
Note 7—Retirement Programs
TEACHERS INSURANCE AND ANNUITY ASSOCIATIONThe University contributes to the University Funded Retirement Plan through the Teachers
Insurance and Annuity Association (TIAA), which is a defined contribution plan. TIAA
administers the retirement plan for the University. The defined contribution retirement plan
provides individual annuities for each plan participant. The Board of Regents establishes and
amends the plan’s provisions and contribution requirements. As required by the Board of
Regents policy and the Code of Iowa, all eligible University employees must participate in a
retirement plan from the date they are employed.
Contributions made by both employer and employee vest immediately. As specified by the
contract with TIAA, each employee through the fifth year of employment contributes 3 1/3% of
the first $4,800 of earnings and 5% on the balance of earnings. The University, through the fifth
year of employment, is required to contribute 6 2/3% of the first $4,800 of earnings and 10% on
Amount
Year Ending June 30
2019 $16,057
2020 15,307
2021 14,246
2022 9,960
2023 9,409
2024-2028 42,804
2029-2033 24,370
2034-2038 8,220
Total $140,373

51 FY18 Notes to Financial Statements FY18 Notes to Financial Statements 51
earnings above the $4,800. Upon completion of five years of service, the participant contributes
5% and the University 10% on all earnings. During fiscal years 2018 and 2017, the University’s
required and actual contribution amounted to $121,054,000 and $116,957,000, respectively.
During fiscal years 2018 and 2017, the employees’ required and actual contribution amounted to
$60,527,000 and $58,479,000, respectively.
At June 30, 2018 and 2017, the University reported payables to the defined contribution pension
plan of $10,622,000 and $10,414,000, respectively, for legally required employer contributions and
$5,236,000 and $5,103,000, respectively, for legally required employee contributions which had
been withheld from employee wages but not yet remitted to TIAA.
IOWA PUBLIC EMPLOYEES RETIREMENT SYSTEM (IPERS)Plan Description—IPERS membership is mandatory for employees of the University except
for those covered by another retirement system. Employees of the University are provided with
pensions through a cost-sharing multiple employer defined benefit pension plan administered
by IPERS. IPERS issues a stand-alone financial report which is available to the public by e-mail
at [email protected], by phone at 515-281-0020 or 1-800-622-3849, by mail at Iowa Public Employees’
Retirement System, P.O. Box 9117, Des Moines, Iowa 50306-9117 or at www.ipers.org.
IPERS benefits are established under Iowa Code chapter 97B and the administrative rules
thereunder. Chapter 97B and the administrative rules are the official plan documents. The
following brief description is provided for general informational purposes only. Refer to the plan
documents for more information.
Pension Benefits —A regular member may retire at normal retirement age and receive monthly
benefits without an early-retirement reduction. Normal retirement age is age 65, anytime after
reaching age 62 with 20 or more years of covered employment, or when the member’s years of
service plus the member’s age at the last birthday equals or exceeds 88, whichever comes first.
(These qualifications must be met on the member’s first month of entitlement to benefits.)
Members cannot begin receiving retirement benefits before age 55. The formula used to
calculate a Regular member’s monthly IPERS benefit includes:
• A multiplier (based on years of service).
• The member’s highest five-year average salary. (For members with service before June 30,
2012, the highest three-year average salary as of that date will be used if it is greater than
the highest five-year average salary.)
If a member retires before normal retirement age, the member’s monthly retirement benefit
will be permanently reduced by an early-retirement reduction. The early-retirement reduction is
calculated differently for service earned before and after July 1, 2012. For service earned before
July 1, 2012, a reduction of 3 percent a year is applied for each year the benefit is paid before
normal retirement age. For service earned after July 1, 2012, the reduction is 6 percent for each
year of retirement before age 65.
Generally, once a member selects a benefit option, a monthly benefit is calculated and remains
the same for the rest of the member’s lifetime. However, to combat the effects of inflation,
retirees who began receiving benefits prior to July 1990 receive a guaranteed dividend with their
regular November benefit payments.

52 FY18 Notes to Financial Statements
Disability and Death Benefits—Vested members who are awarded federal Social Security
disability or Railroad Retirement disability benefits are eligible for IPERS disability benefits.
Disability benefits are not reduced for early retirement. If a member dies before retirement, the
member’s beneficiary will receive a lifetime annuity or a lump-sum payment equal to the present
actuarial value of the member’s accrued benefit or calculated with a set formula, whichever is
greater. When a member dies after retirement, death benefits depend on the benefit option the
member selected at retirement.
Contributions—Effective July 1, 2012, as a result of a 2010 law change, the contribution rates
are established by IPERS following the annual actuarial valuation, which applies IPERS’
Contribution Rate Funding Policy and Actuarial Amortization Method. Statute limits the
amount rates can vary each year to 1 percentage point for Regular members. IPERS Contribution
Rate Funding Policy requires the actuarial contribution rate be determined using the “entry
age normal” actuarial cost method and the actuarial assumptions and methods approved by the
IPERS Investment Board. The actuarial contribution rate covers normal cost plus the unfunded
actuarial liability payment. The payment to amortize the unfunded actuarial liability is
determined as a level percentage of payroll, based on the Actuarial Amortization Method adopted
by the Investment Board.
In fiscal years 2018 and 2017, pursuant to the required rate, Regular members contributed 5.95%
of pay and the University contributed 8.93% for a total rate of 14.88%. Protection Occupation
members contributed 6.56% of pay and the University contributed 9.84% for a total rate of
16.40%. Protection Occupation members are the group of public safety positions defined in Iowa
Code 97B.49B.
The University’s contributions to IPERS for the years ended June 30, 2018 and 2017 were
$10,993,000 and $9,931,000, respectively.
Net Pension Liability, Pension Expense, Deferred Outflows of Resources and Deferred Inflows of Resources Related to Pensions—At June 30, 2018 and 2017, the University reported a liability of
$98,758,000 and $80,367,000, respectively, for its proportionate share of the net pension liability.
The net pension liability was measured as of June 30, 2017 and 2016, respectively, and the total
pension liability used to calculate the net pension liability was determined by an actuarial
valuation as of those dates. The University’s proportion of the net pension liability was based
on the University’s share of contributions to IPERS relative to the contributions of all IPERS
participating employers. At June 30, 2017 and 2016, the University’s proportion was 1.4825633%
and 1.2770236%, respectively.
For the year ended June 30, 2018 and 2017, the University recognized pension expense of
$20,246,000 and $14,093,000, respectively.

53 FY18 Notes to Financial Statements FY18 Notes to Financial Statements 53
At June 30, 2018 and 2017, the University reported deferred outflows of resources and deferred inflows of resources related to pensions from the following sources (in thousands):
The $10,993,000 reported as deferred outflows of resources related to pensions resulting from the
University contributions subsequent to the measurement date will be recognized as a reduction
of the net pension liability in the year ending June 30, 2019. Other amounts reported as deferred
outflows of resources and deferred inflows of resources related to pensions will be recognized in
pension expense as follows (in thousands):
Amount
Year Ending June 30
2019 $9,011
2020 13,335
2021 8,951
2022 3,225
2023 1,789
Total $36,311
There are no non-employer contributing entities to IPERS.
Actuarial Assumptions—The total pension liability in the June 30, 2017 actuarial valuation was
determined using the following actuarial assumptions, applied to all periods included in the
measurement:
Rate of Inflation (effective June 30, 2017) 2.60% per annum
Salary increase (effective June 30, 2017) 3.25 to 16.25% average, including inflation. Rates vary by membership group.
Investment rate of return (effective June 30, 2017)
7.00% per annum, componded annually, net of pension plan investment expense, including inflation
Deferred Outflows of
Recources(2018)
Deferred Inflows of Resouces
(2018)
Deferred Outflows of
Recources(2017)
Deferred Inflows of Resouces
(2017)
Differences between expected and actual experience
$908 $862 $710 $959
Changes of assumptions 17,224 - 1,226 -
Difference between projected and actual earnings on pension
plan investments - 1,037 11,450 -
Change in proportion and differences between University contributions and
proportionate share of contributions 20,102 24 15,808 -
University contributions subsequent to the measurement date 10,993 - 9,931 -
Total $49,227 $1,923 $39,125 $959

54 FY18 Notes to Financial Statements
The actuarial assumptions used in the June 30, 2017 valuation were based on the results of
actuarial experience studies with dates corresponding to those listed above.
Mortality rates were based on the RP-2000 Mortality Table for Males or Females, as appropriate,
with adjustments for mortality improvements based on Scale AA.
The long-term expected rate of return on pension plan investments was determined using a
building-block method in which best-estimate ranges of expected future real rates (expected
returns, net of pension plan investment expense and inflation) are developed for each major
asset class. These ranges are combined to produce the long-term expected rate of return by
weighting the expected future real rates of return by the target asset allocation percentage and
by adding expected inflation. The target allocation and best estimates of arithmetic real rates of
return for each major asset class are summarized in the following table:
Asset Allocation (Percent)
Long-Term Expected Real Rate of Return
(Percent)
Asset Class
Domestic equity 24.0 6.25
International equity 16.0 6.71
Core-plus fixed income 27.0 2.25
Public credit 3.5 3.46
Public real assets 7.0 3.27
Cash 1.0 (0.31)
Private equity 11.0 11.15
Private real assets 7.5 4.18
Private credit 3.0 4.25
Total 100.0
Discount Rate—The discount rate used to measure the total pension liability was 7.00%. The
projection of cash flows used to determine the discount rate assumed employee contributions
will be made at the contractually required rate and contributions from the University will be
made at contractually required rates, actuarially determined. Based on those assumptions,
IPERS’ fiduciary net position was projected to be available to make all projected future benefit
payments of current active and inactive employees. Therefore, the long-term expected rate
of return on IPERS’ investments was applied to all periods of projected benefit payments to
determine the total pension liability.
Sensitivity of the University’s Proportionate Share of the Net Pension Liability to Changes in the Discount Rate—The following presents the University’s proportionate share of the net pension
liability calculated using the discount rate of 7.00%, as well as what the University’s proportionate
share of the net pension liability would be if it were calculated using a discount rate that is
1-percentage-point lower (6.00%) or 1-percentage-point higher (8.00%) than the current rate
(in thousands).

55 FY18 Notes to Financial Statements FY18 Notes to Financial Statements 55
1% Decrease
(6%)
Discount Rate
(7%)
1% Increase
(8%)
University’s proportionate share of the net pension liability
$162,994 $98,758 $44,786
Pension Plan Fiduciary Net Position—Detailed information about IPERS’ fiduciary net position
is available in the separately issued IPERS financial report which is available on IPERS’ website
at www.ipers.org.
Payables to the Pension Plan—At June 30, 2018 and 2017, the University reported payables to
IPERS of $1,848,000 and $1,691,000, respectively, for legally required employer contributions and
$1,232,000 and $1,126,000, respectively, for legally required employee contributions which had
been withheld from employee wages but not yet remitted to IPERS.
Note 8—Post-Employment Benefits
EARLY RETIREMENTThe early retirement program was approved by the Board of Regents in February, 2015. Eligible
for participation in the 2015 program were non-UI Health Care faculty, P&S, and merit
employees and institutional officials, who had attained age 57 and at least 10 years of continuous
benefit eligible employment by January 31, 2015. The employee’s department head and the
appropriate administrative officers approved the employee’s participation. The following benefits
are applicable during participation in the Early Retirement Program:
1. Health and Dental Insurance—The University will pay the full cost of the single employee
premium for health and dental insurance or its standard share of any coverage other
than single for a period of five years. This contribution shall be equal to the amount
contributed for an active employee in the same plan.
2. TIAA Contributions—During the first three years, the University will pay both the
employer and employee retirement contributions. During the next two years in the
program, the university will pay only the employer contribution.
The University has recognized an early retirement benefit liability of $2,655,000 and $4,650,000
as of June 30, 2018 and 2017, respectively. The early retirement liability for health and dental
insurance has been rolled into GASB Statement No. 75, Accounting and Financial Reporting
for Postemployment Benefits Other Than Pensions (OPEB). During fiscal year 2018, retirement
expenditures for the one hundred eighty-three (183) participants in the early retirement incentive
program totaled $1,995,000.

56 FY18 Notes to Financial Statements
PHASED RETIREMENTThis phased retirement program was approved by the Board of Regents and was effective
July 1, 2017.
Eligibility. Faculty, professional and scientific staff, and merit system staff members employed
by the Board of Regents for a period of at least 15 years and who have attained the age of 57, are
eligible to negotiate with their department a schedule for phasing into retirement. All requests
for admission to the institution’s Phased Retirement Program must receive approval from the
appropriate administrative offices of the institution by which they are employed. The program
does not create a right for the employee and the request to enter the program may not be
approved if it is not in the best interest of the institution.
Schedule of Phasing. A staff member may reduce from full-time to no less than a half-time
appointment either directly or via a stepped schedule. The maximum phasing period will be
two years with full retirement required at the end of the specified phasing period. If a two year
phasing period is agreed upon an employee may not hold greater than a 65 percent appointment
in the first year. For phasing periods of one year or less, or after the completion of the first year of
a two year phasing period, the appointment cannot exceed 50%. The phasing period will be set
by agreement between the institution and the individual with full retirement required at the end
of the specified phasing period. Once phased retirement is initiated, employees may not return
to full-time.
Phased Retirement Period. The phasing period is limited to two years.
The following benefits are applicable during participation in the phased retirement program:
• Compensation—In the first year of a two year phasing period, the salary received will
reflect the reduced responsibilities plus, at the discretion of the institution, up to an
additional 10 percent of the budgeted salary, had the person worked full time. In the only
or last year following the initiation of phased retirement, the staff member’s appointment
will be no greater than fifty percent, and the salary will be proportional to the budgeted
salary had the person worked full-time.
• Benefits—During the phased retirement period, institution and staff member
contributions will continue for life insurance, health and dental insurance, and
disability insurance at the same levels which would have prevailed had the staff member
continued a regular appointment. University retirement contributions to TIAA will be
based on the salary which would have been obtained had the individual continued a
regular appointment. As mandated by law, FICA contributions will be based on the staff
member’s actual salary during the partial or pre-retirement period. The same is true for
retirement contributions for those participating in the Iowa Public Employee Retirement
System or Federal Civil Service System. Accrual of vacation and sick leave will be based
on percentage of appointment. An individual participating in this program will be
allowed access to their retirement funds to assist in supplementing the loss of income that
occurs when the person reduces their appointment down to 50% through 65% time, the
maximum percentage permitted by the program.
Duration of Program. Subject to annual review, the program will expire on June 30, 2022, unless
renewed by the Board prior to expiration.

57 FY18 Notes to Financial Statements FY18 Notes to Financial Statements 57
REGULAR RETIREMENTGASB Statement No. 75, which amended GASB Statement No. 45, requires the University to
record and disclose an actuarially determined liability for the present value of projected future
benefits for retired and active employees.
FUNDING POLICYThe contribution requirements of plan members are established and may be amended by the
University. Benefits are financed centrally by the University on a pay-as-you-go basis. Health
insurance total expenditures for fiscal year 2018 and 2017 were $5,987,000 and $6,175,000,
respectively, with 1,865 and 1,903 eligible participants as of June 30, 2018 and 2017, respectively.
Life insurance total expenditures for fiscal year 2018 and 2017 were $46,000 and $47,000,
respectively, with 2,666 and 2,763 eligible participants as of June 30, 2018 and 2017, respectively.
FUNDED STATUS AND FUNDING PROGRESSThe University of Iowa evaluated options to minimize its liability and has made the decision
to cap the University’s contribution for retiree health at the current $288 per month for both
current and future retirees. This decision passed through the appropriate approval channels
and communication process (Staff Council Leadership, Funded Retirement and Insurance
Committee Co-chairs, Faculty Senate leadership, Retiree Association Leadership). The University
sent letters to retirees by the June 30, 2017 measurement date in order to be incorporated into the
FY18 GASB 75 valuation.
TERMINATIONThe University continues faculty, P&S, and merit exempt terminated employees’ benefits for
health, dental, liveWELL the University’s comprehensive health and wellness program and the
Employee Assistance Program (EAP) under the Consolidated Omnibus Budget Reconciliation
Act of 1985, modified by the Tax Reform Act and the Budget Reconciliation Act of 1986.
Four hundred fifty-six (456) terminated employees continued their benefits by assuming total
financial responsibility. No University costs are associated with the premiums, but claims are the
responsibility of the University since the insurance plans are self-insured.
OTHER POSTEMPLOYMENT BENEFITSThe University recognized a net OPEB liability of $120.4 and $123.3 million for its retiree benefit
plan and a liability of $19.4 and $28.4 million for its Merit employees, for a total net OPEB liability
of $139.8 and $151.7 million, respectively, for fiscal year 2018 and 2017.
Plan Description—The University operates a single-employer health benefit plan which provides
medical/prescription drug benefits for employees, retirees and their spouses. Group insurance
benefits are established under Iowa Code Chapter 509A.13. No assets are accumulated in a trust
that meets the criteria in paragraph 4 of GASB Statement 75.

58 FY18 Notes to Financial Statements
OPEB Benefits—Individuals who are employed by the University and are eligible to participate
in the group health plan are eligible to continue healthcare benefits upon retirement. Retirees
under age 65 pay the same premium for the medical, prescription drug and dental benefits as
active employees, which results in an implicit rate subsidy and an OPEB liability. For post-
employment benefits of retirees, the University contributes toward the cost of University of
Iowa health insurance and, for those who qualified for the benefit and retired prior to July 1,
2013, the entire cost to purchase a paid-up life insurance policy, which varies in amounts from
$2,000 to $4,000, depending upon length of service.
Retired participants must be age 55 or older at retirement. At June 30, 2018, the following employees were covered by the benefit terms:
Professional, Scientific,
and Faculty Merit Total
Inactive employees or beneficiaries currently receiving benefit payments
3,346 149 3,495
Active employees 12,970 4,173 17,143
Total 16,316 4,322 20,638
Total OPEB Liability – The University’s total OPEB liability of $139.8 million was measured as
of June 30, 2017 and was determined by an actuarial valuation as of that date. The University’s
actuary produced OPEB calculations for the Professional, Scientific, and Faculty (PSF)
positions and for the Merit positions. The University’s merit employees were participants in
the State of Iowa postretirement medical plan (OPEB Plan) until 12/31/17. Beginning 1/1/18,
Merit employees are included in the University’s OPEB plan.
Actuarial assumptions —The total OPEB liability in the June 30, 2017 actuarial valuation was
determined using the following actuarial assumptions and the entry age normal actuarial
cost method, applied to all periods included in the measurements. With the exception of the
termination and retirement assumptions, the Merit calculations were based on all actuarial
assumptions and methods used in the development of the University’s fiscal 2018 PSF GASB
75 calculations (including a 3.58% discount rate at the June 30, 2017 measurement date). These
calculations reflect the IPERS termination and retirement assumptions for state employees in
effect at the June 30, 2017 measurement date.
Rate of inflation (effective June 30, 2017) 2.50%
Rates of salary increase (effective June 30, 2017) 3.00%
Discount rate (effective June 30, 2017) 3.58%
Healthcare cost trend rate Pre-65 7.55% initial rate decreasing to an ultimate rate of 4.50%
Healthcare cost trend rate Post-65 (effective June 30, 2017) 9.17% initial rate decreasing to an ultimate rate of 4.50%

59 FY18 Notes to Financial Statements FY18 Notes to Financial Statements 59
Discount rate —The discount rate used to measure the total OPEB liability was 3.58% which reflects
the index rate for S&P Municipal Bond 20-Year High Grade index as of the measurement date.
Mortality rates are from the RP-2014 aggregate mortality table projected using Scale MP-2016.
Annual retirement probabilities are based on varying rates by age and turnover probabilities
mirror those used for IPERS.
The actuarial assumptions used in the June 30, 2017 valuation were based on the results of
actuarial experience studies with dates corresponding to those listed above.
CHANGES IN THE TOTAL OPEB LIABILITY (in thousands)
Professional,Scientific,
and Faculty Merit Total
Total OPEB liability beginning of year, as restated $588,306 $19,373 $607,679
Changes for the year:
Service cost 32,244 1,489 33,733
Interest 17,588 580 18,168
Changes in benefit terms (465,008) - (465,008)
Differences between expected and actual experiences 48,567 - 48,567
Changes of assumptions (94,293) (1,010) (95,303)
Benefit payments (6,952) - (6,952)
Contributions from the employer - (1,049) (1,049)
Net changes (467,854) 10 (467,844)
Total OPEB liability end of year $120,452 $19,383 $139,835
The financial accounting valuation reflects the following assumption changes:
• A change in the discount rate to 3.58% as of June 30, 2017.
• A change in the withdrawal rates for staff to better anticipate future experience.
• A change in the mortality assumption from the RP-2014 Aggregate Mortality Table
projected using Scale MP-2014 to the RP-2014 Aggregate Mortality Table projected using
Scale MP-2016.
• The health care trend rate assumption was updated to a schedule of rates beginning at
7.55% in 2017, grading down to 4.50% in 2026 and beyond for pre-65 participants and
9.17% in 2017 grading down to 4.50% in 2026 and beyond for post-65 participants.
• The marginal cost adjustment factors were changed from 59.4% to 60.1% for pre-65
participants and from 86.8% to 87.6% for post-65 participants.
• The impact of the Excise Tax on high cost plans due to healthcare reform was updated,
based on current claims and medical trend assumptions.

60 FY18 Notes to Financial Statements
Sensitivity of the total OPEB liability to changes in the discount rate —The following presents
the total OPEB liability of the University, as well as what the University’s total OPEB liability
would be if it were calculated using a discount rate that is 1% lower (2.58%) or 1% higher (4.58%)
than the current discount rate.
1%Decrease(2.58%)
Discount Rate
(3.58%)
1%Increase(4.58%)
Professional, Scientific, and Faculty OPEB Liability $126,704 $120,452 $107,808
Merit OPEB Liability 20,777 19,383 18,075
Total OPEB liability $147,481 $139,835 $125,883
Sensitivity of the total OPEB liability to changes in the healthcare cost trend rates —The
following presents the total OPEB liability of the University, as well as what the University’s
total OPEB liability would be if it were calculated using a healthcare cost trend that is 1% lower
(6.55%) or 1% higher (8.55%) than the current healthcare cost trend rate for pre-65 participants,
and 1% lower (8.17%) or 1% higher (10.17%) higher than the current healthcare cost trend rate
for post-65 participants.
1%Decrease
HealthcareCost Trend
Rate1%
Increase
Pre-65 participants (6.55%) (7.55%) (8.55%)
Post-65 participants (8.17%) (9.17%) (10.17%)
Professional, Scientific, and Faculty OPEB Liability $118,396 $120,452 $119,834
Merit OPEB Liability 17,419 19,383 21,706
Total OPEB liability $135,815 $139,835 $141,540
OPEB Expense and Deferred Outflows and Inflows of Resources Related to OPEB—For the year
ended June 30, 2018, the University recognized OPEB expense of ($419,681,000) for its retiree
benefit plan, and $1,941,000 for its Merit employees. At June 30, 2018 the University reported
deferred outflows and inflows of resources related to OPEB from the following sources:
PROFESSIONAL, SCIENTIFIC,
AND FACULTYMERIT TOTAL
Deferred Outflows of
Resources
Deferred Inflows of Resources
Deferred Outflows of
Resources
Deferred Inflows of Resources
Deferred Outflows of
Resources
Deferred Inflows of Resources
Differences between expected and actual experience $43,756 - - - $43,756 -
Assumption changes - (84,977) - (882) - (85,859)
Contributions made in fiscal year ending June 30, 2018 after measurement date 9,346 - 1,346 - 10,692 -
Total $53,102 ($84,977) $1,346 ($882) $54,448 ($85,859)

61 FY18 Notes to Financial Statements FY18 Notes to Financial Statements 61
The amount reported as deferred outflows and inflows of resources related to OPEB will be
recognized as OPEB expense as follows:
Professional, Scientific,
and Faculty Merit Total
Year ending June 30
2019 ($4,505) ($ 128) ($ 4,633)
2020 (4,505) (128) (4,633)
2021 (4,505) (128) (4,633)
2022 (4,505) (128) (4,633)
2023 (4,505) (128) (4,633)
Total Thereafter (18,696) (242) (18,938)
Total ($41,221) ($ 882) ($ 42,103)
Note 9—Other Commitments and Risk Management
COMMITMENTSAt June 30, 2018 and 2017, the University had outstanding construction contract commitments of
$249,707,000 and $331,651,000, respectively.
RISK MANAGEMENTFollowing are risk financing and insurance related issues as defined by GASB Statement
No. 10 Accounting and Financial Reporting for Risk Financing and Related Insurance Issues.
Property Loss—The University purchases catastrophic property insurance for academic/general
fund facilities with a single incident deductible of $2 million for all facilities with the exception
of a $5 million deductible for the Power Plant, Bowen Science Building and the Main Library.
The University may seek reimbursement for property losses in excess of $5,000 from the State
of Iowa pursuant to Iowa Code Chapter 29C.20. Money from the state contingent fund may be
requested for repairing, rebuilding, or restoring state property injured, destroyed, or lost by fire,
storm, theft, or unavoidable causes. The University maintains conventional property insurance
on self-supporting, revenue-producing, and auxiliary facilities which are an integral part of the
operations of the University. Insured facilities include the Residence Halls, the Utility System,
Telecommunications, Iowa Memorial Union, Athletic Facilities, University of Iowa Hospitals and
Clinics, and other auxiliary operations. The University’s annual limit is $2 billion, the maximum
available on the November 1, 2017 renewal.

62 FY18 Notes to Financial Statements
The properties of the Utility and Telecommunications Systems are appraised annually and specific coverage and valuation data are as follows (in thousands):
2018 2017
Utility System specific coverage is as follows:
Utility System Operations Building & Contents $820,976 $805,072
Power Plant Building & Contents $226,976 $221,009
Telecommunications Facilities premium is based on the following values:
Building $31,771 $31,771
Contents $9,580 $9,720
Income $5,878 $5,878
Tort Liability—The University of Iowa is an agency of the State of Iowa and is covered by the
State’s self-insurance for tort liability. Tort claims against the State are handled as provided in the
Iowa Tort Claims Act (Iowa Code, Chapter 669) which also sets forth the procedures by which
tort claims may be brought. Claims under Chapter 669 may be filed against the State on account
of wrongful death, personal injury or property damage incurred by reason of the negligence of
the University or its employees while acting within the scope of employment. By inter-agency
agreement, tort liability claims under $5,000 may be administered by the University subject to a
maximum expenditure of $100,000 per year. All other tort claims may be paid from the State’s
general fund.
Motor Vehicle Liability—The University of Iowa and other Board of Regents’ institutions
are self-insured for automobile liability up to $250,000. Claims over $250,000 are paid by the
State of Iowa, as provided in Chapter 669 of the Code of Iowa. Coverage for physical damage
(comprehensive and collision) to University vehicles is included in the Board of Regents’ self-
insurance program. Each loss is subject to a $500 deductible.
Fidelity/Crime Coverage—The State maintains an employee fidelity bond where the first
$200,000 in losses is the responsibility of the University. Under the State coverage, losses in
excess of the $200,000 deductible are insured up to $2,000,000. The University maintains
separate fidelity and crime coverage, which extends to all employees, and includes coverage for
robbery and theft. The University’s crime policy provides an additional $8,000,000 in coverage
over the state bond.
Insurance Settlements—For those risks that the University has purchased commercial
insurance, only the property insurance has claims in excess of the commercial coverage due
to the 2008 flood. All other settled claims have not exceeded commercial coverage in the past
three years.
Workers’ Compensation—The University participates in a State self-funded program. The
University pays a monthly premium for this coverage.

63 FY18 Notes to Financial Statements FY18 Notes to Financial Statements 63
Unemployment Compensation—The University self-funds unemployment compensation claims
received from Iowa Workforce Development on a reimbursement basis.
Employee Medical and Dental Claims—The University purchases life, health, dental and
disability insurance for eligible permanent employees. Based on actuarial analysis of employee
medical and dental claims, the University has incurred but not reported claims of $18,419,000
and $12,841,000 as of June 30, 2018 and 2017, respectively.
College of Medicine Faculty Malpractice Claims—Iowa Medical Mutual Insurance Company
(the Company) was incorporated on May 19, 2004, and was established to provide medical
malpractice coverage on a claims-made basis to physicians at the University of Iowa Carver
School of Medicine. The Company is owned 100% by the University of Iowa Carver College of
Medicine University of Iowa Physicians (UIP).
Pursuant to a 28E Agreement with the State of Iowa, the UIP self-funds the professional medical
liability exposures of its members with a self-insurance pool for all claims up to $3 million per
claim. On any claim exceeding $3 million, the Company provides coverage on a claims-made
basis limited to $2 million per claim and subject to a $2 million annual aggregate per named
insured. All claims which exceed $5 million per claim or a $9 million aggregate limit per fiscal
year are covered by the State of Iowa. Based on actuarial analysis, the College of Medicine has
incurred an unpaid loss and allocated loss adjustment expense estimate of $19,239,000 and
$13,160,000 as of 12/31/17 and 12/31/16, respectively.
Reconciliation of Loss Contingencies (in thousands):
In accordance with GASB Statement No. 10 Accounting and Financial Reporting for Risk
Financing and Related Insurance Issues, the University has identified a potential risk of loss.
A description of the nature of the potential risk of loss is described below.
In connection with two large construction projects on the University of Iowa campus, a prime
contractor filed claims against the Board of Regents, State of Iowa, on behalf of The University of
Iowa, for additional compensation. Arbitration proceedings were held in September 2017 which
awarded $17.3 million to the contractor. The District Court affirmed the arbitration award in
August 2018. The Iowa Attorney General’s Office filed an appeal with the Iowa Supreme Court
on August 31, 2018. No accruals related to this issue have been included in the accompanying
financial statements and any amount ultimately awarded would be capitalized to the original
building construction projects.
2018 2017
Claims and contingent liabilities accrued at July 1 $26,001 $30,929
Claims incurred and contingent liabilities accrued for the current year 266,683 209,332
Payments on claims during the fiscal year (255,026) (214,260)
Claims and contingent liabilities at June 30 $37,658 $26,001

64 FY18 Notes to Financial Statements
Note 10—Debt Defeasance
In July of 2017, the University issued $20,685,000 of Recreational Facilities Revenue Refunding
Bonds, Series S.U.I. 2017B, with an average interest rate of 4.00% and accrued interest of $11,000
to advance refund $21,950,000 of outstanding Recreational Facilities Revenue Refunding Bonds,
Series S.U.I. 2009, with interest rates ranging between 4.00 and 4.875%.
Net bond proceeds of $23,255,000 were placed in an irrevocable escrow account with the
University as trustee. The escrow account is sufficient to fully service all remaining principal and
interest due on the bonds. The Recreational Facilities Revenue Refunding Bonds, Series S.U.I.
2009 will be called on July 1, 2019.
The refunding permitted the University to realize an economic gain (difference between present
values of the old and new debt service payments) of $2,671,000; and reduced the aggregate debt
service payments by $3,181,000 over the next seventeen years.
In November of 2017, the University issued $22,075,000 of Athletics Facilities Revenue
Refunding Bonds, Series S.U.I. 2017A, with an average interest rate of 3.01% and accrued interest
of $28,000 to advance refund $21,075,000 of outstanding Athletics Facilities Revenue Refunding
Bonds, Series S.U.I. 2009, with interest rates ranging between 3.60 and 4.35%.
Net bond proceeds of $22,714,000 were placed in an irrevocable escrow account with the
University as trustee. The escrow account is sufficient to fully service all remaining principal and
interest due on the bonds. The Athletics Facilities Revenue Refunding Bonds, Series S.U.I. 2009
will be called on July 1, 2020.
The refunding permitted the University to realize an economic gain (difference between present
values of the old and new debt service payments) of $1,448,000; and reduced the aggregate debt
service payments by $1,731,000 over the next eighteen years.
The amount of defeased debt outstanding but removed from the Statement of Net Position at June 30, 2018 and 2017, is as follows (in thousands):
2018 2017
Academic $22,375 $44,150
Athletics 21,075 -
Hospital 22,250 56,850
Recreational Facilities 61,450 41,225
Utility 17,375 35,875
Total $144,525 $178,100

65 FY18 Notes to Financial Statements FY18 Notes to Financial Statements 65
Note 11—Operating Expenses By Function
A summary of operating expenses by functional classification for the year ended June 30, 2018 and 2017 follows (in thousands):
Compensation & Benefits Supplies Other
Depreciation & Amortization Total
Instruction $305,147 10,794 33,742 - $349,683
Research 230,100 41,136 63,453 - 334,689
Public service 57,359 10,687 22,356 - 90,402
Academic support 113,171 13,428 26,386 - 152,985
Patient services 1,091,881 434,828 322,197 - 1,848,906
Student services 25,905 2,449 8,513 - 36,867
Institutional support 60,003 5,556 (9,246) - 56,313
Operations and maintenance of plant - 4,017 80,227 - 84,244
Scholarships and fellowships 13,116 - 18,962 - 32,078
Depreciation and amortization - - - 247,336 247,336
Auxiliary enterprises 102,665 17,062 83,589 - 203,316
Other operating expenses 29,602 2,150 17,054 - 48,806
Total June 30, 2018 $2,028,949 542,107 667,233 247,336 $3,485,625
Compensation & Benefits Supplies Other
Depreciation & Amortization Total
Instruction $300,557 11,014 30,233 - $341,804
Research 224,100 40,078 66,152 - 330,330
Public service 58,208 10,728 22,684 - 91,620
Academic support 187,073 11,408 27,901 - 226,382
Patient services 949,812 368,493 303,346 - 1,621,651
Student services 25,770 2,515 12,639 - 40,924
Institutional support 62,234 7,721 (6,163) - 63,792
Operations and maintenance of plant 565 4,561 80,098 - 85,224
Scholarships and fellowships 12,696 - 18,539 - 31,235
Depreciation and amortization - - - 226,653 226,653
Auxiliary enterprises 98,071 18,853 86,244 - 203,168
Other operating expenses 27,473 4,044 10,581 - 42,098
Total June 30, 2017 $1,946,559 479,415 652,254 226,653 $3,304,881

66 FY18 Notes to Financial Statements
Note 12—Restricted Net Position
The UI Center for Advancement’s temporarily restricted net assets at June 30, 2018 and 2017 were restricted for the following (in thousands):
The UI Center for Advancement’s permanently restricted net assets at June 30, 2018 and 2017 were restricted for the following (in thousands):
Note 13— Component Units
Discretely Presented Component Units
GASB Statement No. 61, The Financial Reporting Entity: Omnibus, an amendment of GASB
Statements No. 14 and No. 34, provides guidance in determining whether organizations are to be
included as part of a reporting entity. The University of Iowa has determined that, in accordance
with the provisions of these statements, the financial activity of the University of Iowa Research
Foundation (UIRF) and University of Iowa Health System (UIHS) should be reported as
discretely presented component units.
June 30, 2018 June 30, 2017
Program support $199,436 $179,900
Student support 110,481 99,475
Faculty support 123,497 112,291
Facilities and equipment 91,067 75,628
Research 121,137 116,023
Remainder interest in trusts 20,363 21,707
Total $665,981 $605,024
June 30, 2018 June 30, 2017
Undesignated $7,762 $7,315
Program support 132,355 125,793
Student support 222,100 213,369
Faculty support 252,641 238,807
Facilities and equipment 9,797 9,277
Research 86,374 79,873
Perpetual trusts 8,268 8,035
Remainder interest in trusts 13,006 12,098
Total $732,303 $694,567
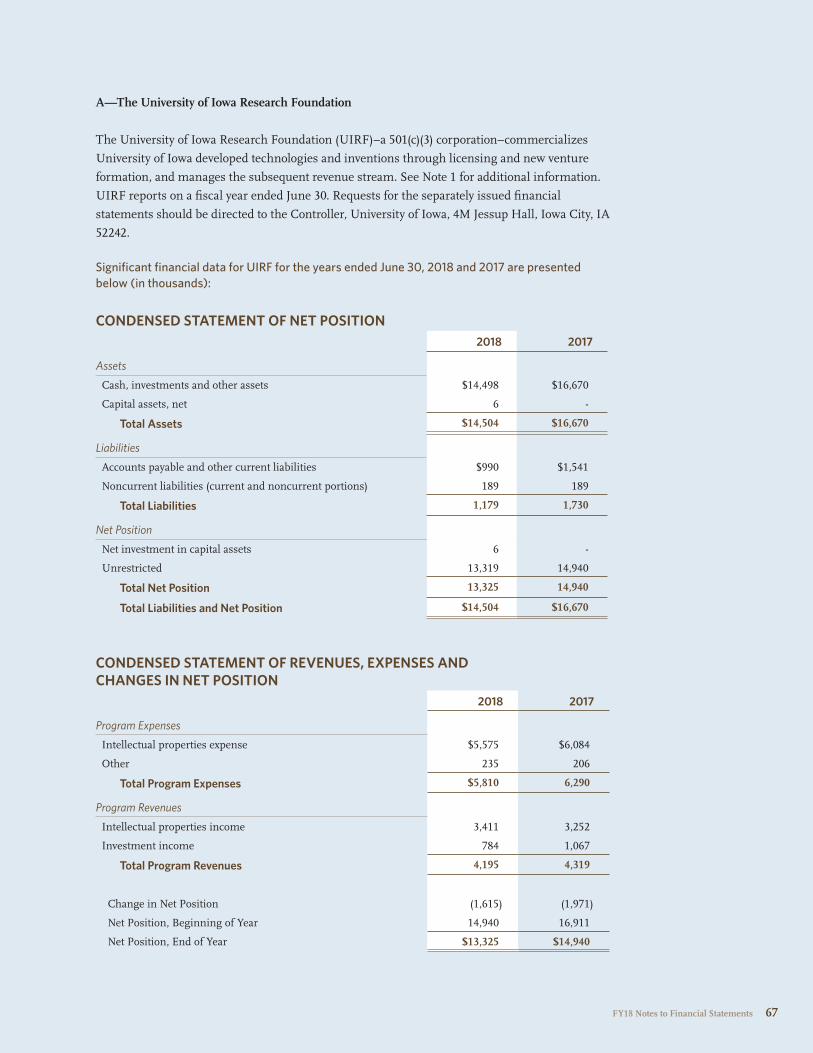
67 FY18 Notes to Financial Statements FY18 Notes to Financial Statements 67
A—The University of Iowa Research Foundation
The University of Iowa Research Foundation (UIRF)–a 501(c)(3) corporation–commercializes
University of Iowa developed technologies and inventions through licensing and new venture
formation, and manages the subsequent revenue stream. See Note 1 for additional information.
UIRF reports on a fiscal year ended June 30. Requests for the separately issued financial
statements should be directed to the Controller, University of Iowa, 4M Jessup Hall, Iowa City, IA
52242.
Significant financial data for UIRF for the years ended June 30, 2018 and 2017 are presented below (in thousands):
CONDENSED STATEMENT OF NET POSITION2018 2017
Assets
Cash, investments and other assets $14,498 $16,670
Capital assets, net 6 -
Total Assets $14,504 $16,670
Liabilities
Accounts payable and other current liabilities $990 $1,541
Noncurrent liabilities (current and noncurrent portions) 189 189
Total Liabilities 1,179 1,730
Net Position
Net investment in capital assets 6 -
Unrestricted 13,319 14,940
Total Net Position 13,325 14,940
Total Liabilities and Net Position $14,504 $16,670
CONDENSED STATEMENT OF REVENUES, EXPENSES AND CHANGES IN NET POSITION
2018 2017
Program Expenses
Intellectual properties expense $5,575 $6,084
Other 235 206
Total Program Expenses $5,810 6,290
Program Revenues
Intellectual properties income 3,411 3,252
Investment income 784 1,067
Total Program Revenues 4,195 4,319
Change in Net Position (1,615) (1,971)
Net Position, Beginning of Year 14,940 16,911
Net Position, End of Year $13,325 $14,940

68 FY18 Notes to Financial Statements
B—University of Iowa Health System
University of Iowa Health System (UIHS or the System) was incorporated under the provisions
of the Iowa Nonprofit Corporations Act on December 2, 1994. UIHS was formed to support the
clinical, academic, and research programs of the University of Iowa Carver College of Medicine
and the University of Iowa Hospitals and Clinics. See Note 1 for additional information. UIHS
reports on a fiscal year ended December 31. Requests for the separately issued financial statements
should be directed to the Controller, University of Iowa, 4M Jessup Hall, Iowa City, IA 52242.
Significant financial data for UIHS for the years ended December 31, 2017 and 2016 are presented below (in thousands):
CONDENSED STATEMENT OF NET POSITION2017 2016
Assets
Cash, investments and other assets $34,994 $37,121
Capital assets, net 635 1,139
Total Assets 35,629 38,260
Deferred Outflows of Resources
Acquisition deferred outflow 4,260 4,853
Total Assets and Deferred Outflows of Resources $39,889 $43,113
Liabilities
Accounts payable and other current liabilities $6,255 $6,117
Accounts held for other component units 13,474 9,940
Total Liabilities 19,729 16,057
Net Position
Net investment in capital assets 635 1,139
Unrestricted 19,525 25,917
Total Net Position 20,160 27,056
Total Liabilities and Net Position $39,889 $43,113

69 FY18 Notes to Financial Statements FY18 Notes to Financial Statements 69
CONDENSED STATEMENT OF REVENUES, EXPENSES AND CHANGES IN NET POSITION
2017 2016
Program Expenses
Patient and Management Services $52,973 $54,165
Depreciation 966 1,045
Total Program Expenses 53,939 55,210
Program Revenues
Patient Services 18,862 18,306
Management services 24,795 22,304
Investment income 443 374
Other 2,943 19,285
Total Program Revenues 47,043 60,269
Change in Net Position (6,896) 5,059
Net Position, Beginning of Year 27,056 21,997
Net Position, End of Year $20,160 $27,056
Blended Component Units
GASB Statement No. 85, Omnibus 2017, provides guidance for blending a component unit
in circumstances in which the primary government is a business-type activity that reports
in a single column for financial presentation. The University of Iowa has determined that, in
accordance with the provisions of this statement, the financial activity of the Iowa Measurement
Research Foundation (IMRF), Miller Endowment, Incorporated, and the University of Iowa
Research Park Corporation (UIRPC) should be reported as blended component units.
C—Iowa Measurement Research Foundation
The Iowa Measurement Research Foundation (IMRF) was formed in 1970 under the provisions
of the Iowa Nonprofit Corporation Act. The primary purpose of the Foundation is to advance
and extend knowledge in the field of educational measurement by providing financial assistance
to the University of Iowa and its College of Education for promising research and educational
projects in furtherance of this purpose.

70 FY18 Notes to Financial Statements
Significant financial data for IMRF for the years ended June 30, 2018 and 2017 are presented below (in thousands):
CONDENSED STATEMENT OF NET POSITION2018 2017
Assets
Cash and investments $24,623 $23,632
Total Assets $24,623 $23,632
Liabilities
Current and noncurrent liabilities $ - $ -
Total Liabilities - -
Net Position
Restricted expendable 24,088 23,217
Unrestricted 535 415
Total Liabilities and Net Position $24,623 $23,632
CONDENSED STATEMENT OF REVENUES, EXPENSES, AND CHANGES IN NET POSITION
2018 2017
Program Expenses
Distributions $1,032 $1,212
Total Program Expenses 1,032 1,212
Program Revenues
Investment Income 2,023 2,867
Total Program Revenues 2,023 2,867
Change in net position 991 1,655
Net Position, Beginning of Year 23,632 21,977
Net Position, End of Year $24,623 $23,632
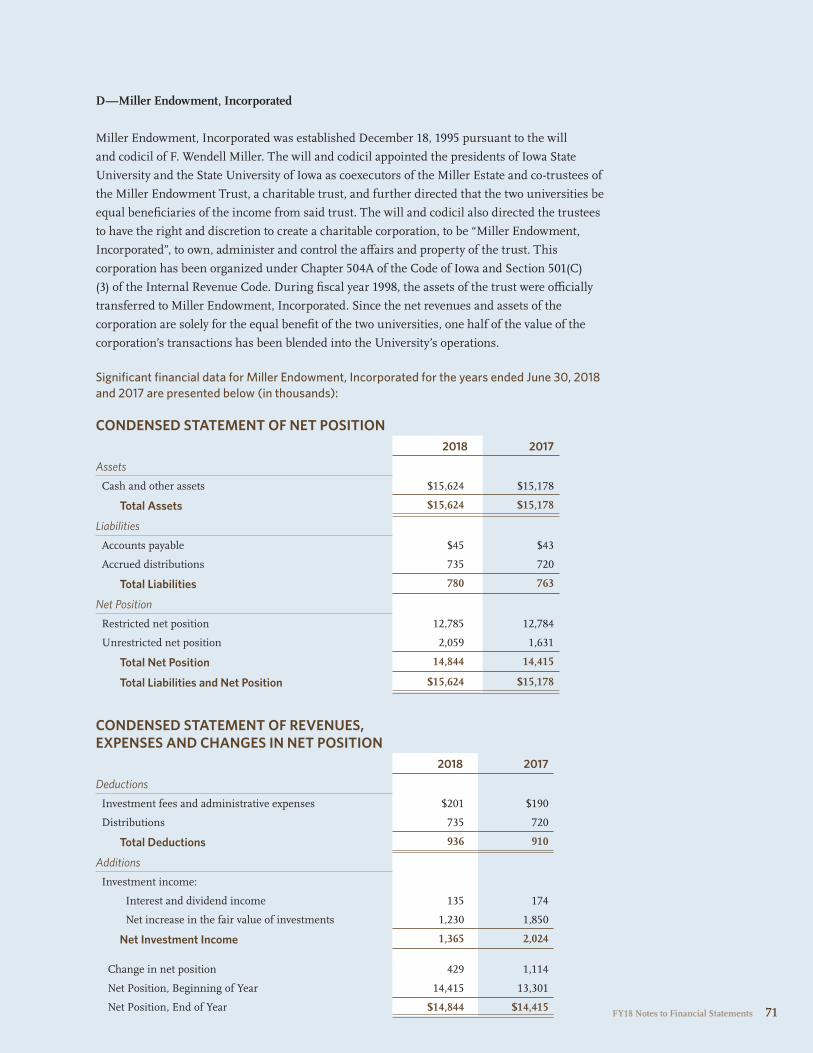
71 FY18 Notes to Financial Statements FY18 Notes to Financial Statements 71
D—Miller Endowment, Incorporated
Miller Endowment, Incorporated was established December 18, 1995 pursuant to the will
and codicil of F. Wendell Miller. The will and codicil appointed the presidents of Iowa State
University and the State University of Iowa as coexecutors of the Miller Estate and co-trustees of
the Miller Endowment Trust, a charitable trust, and further directed that the two universities be
equal beneficiaries of the income from said trust. The will and codicil also directed the trustees
to have the right and discretion to create a charitable corporation, to be “Miller Endowment,
Incorporated”, to own, administer and control the affairs and property of the trust. This
corporation has been organized under Chapter 504A of the Code of Iowa and Section 501(C)
(3) of the Internal Revenue Code. During fiscal year 1998, the assets of the trust were officially
transferred to Miller Endowment, Incorporated. Since the net revenues and assets of the
corporation are solely for the equal benefit of the two universities, one half of the value of the
corporation’s transactions has been blended into the University’s operations.
Significant financial data for Miller Endowment, Incorporated for the years ended June 30, 2018 and 2017 are presented below (in thousands):
CONDENSED STATEMENT OF NET POSITION2018 2017
Assets
Cash and other assets $15,624 $15,178
Total Assets $15,624 $15,178
Liabilities
Accounts payable $45 $43
Accrued distributions 735 720
Total Liabilities 780 763
Net Position
Restricted net position 12,785 12,784
Unrestricted net position 2,059 1,631
Total Net Position 14,844 14,415
Total Liabilities and Net Position $15,624 $15,178
CONDENSED STATEMENT OF REVENUES, EXPENSES AND CHANGES IN NET POSITION
2018 2017
Deductions
Investment fees and administrative expenses $201 $190
Distributions 735 720
Total Deductions 936 910
Additions
Investment income:
Interest and dividend income 135 174
Net increase in the fair value of investments 1,230 1,850
Net Investment Income 1,365 2,024
Change in net position 429 1,114
Net Position, Beginning of Year 14,415 13,301
Net Position, End of Year $14,844 $14,415

72 FY18 Notes to Financial Statements
E—University of Iowa Research Park Corporation
The University of Iowa Research Park Corporation (Corporation) is a not-for-profit corporation
and a component unit of the University of Iowa (University). The Corporation leases from the
State of Iowa approximately 185 acres of land located in the University of Iowa Research Park.
The land subject to this lease is designated as the University of Iowa Research Park and is platted
as a subdivision of Coralville, Iowa. Under terms of its master lease with the State of Iowa, the
Corporation subleases parcels of the University of Iowa Research Park to businesses (or to private
developers working on behalf of businesses) wishing to locate close to the University and its
research assets.
Significant financial data for UIRPC for the years ended June 30, 2018 and 2017 are presented below (in thousands):
CONDENSED STATEMENT OF REVENUES, EXPENSES AND CHANGES IN NET POSITION
2018 2017
Program Expenses
Maintenance and other expenses $117 $128
Depreciation 77 66
Total Program Expenses 194 194
Program Revenues
Land leases 212 212
State appropriation 79 79
Other income 46 38
Total Program Revenues 337 329
Change in net position 143 135
Net Position, Beginning of Year 2,005 1,870
Net Position, End of Year $2,148 $2,005
CONDENSED STATEMENT OF NET POSITION2018 2017
Assets
Cash and other assets $1,897 $1,786
Capital assets, net 2,521 2,534
Total Assets $4,418 $4,320
Liabilities
Accounts payable and other current liabilities $86 $69
Noncurrent liabilities 2,184 2,246
Total Liabilities 2,270 2,315
Net Position
Net investment in capital assets 2,521 2,535
Unrestricted (373) (530)
Total Net Position 2,148 2,005
Total Liabilities and Net Position $4,418 $4,320

73 FY18 Notes to Financial Statements FY18 Notes to Financial Statements 73
Note 14—Subsequent Events
In November 2018, the State Board of Regents authorized the University to issue Athletic
Facilities Revenue Bonds, Series S.U.I. 2018A for $28,965,000. The proceeds of the Bonds will be
used to (i) pay a portion of the costs of improving, remodeling, repairing, furnishing, equipping
and building additions to Kinnick Stadium; (ii) fund a reserve fund; and (iii) pay the cost of
issuing said Bonds.
Note 15—Restatement As a result of adopting GASB Statement No. 75 Accounting and Financial Reporting for Postemployment Benefits Other Than Pensions in fiscal year 2018, the beginning net position was restated to retroactively report the beginning increase in the OPEB liability as follows:
(in thousands)
Net position at June 30, 2017, as previously reported $4,196,670
Net OPEB liability at June 30, 2017 151,719
Total OPEB liability at June 30, 2017, per GASB 75 (607,679)
Net position at June 30, 2017, as restated $3,740,710
GASB Statement No. 75, Accounting and Financial Reporting for Postemployment Benefits
Other Than Pensions changes the accounting and reporting requirements for post-employment
benefits and potentially results in significant increases in liability and expense. The standard
requires the use of a more aggressive actuarial costing method, a lower discount rate, a
shortened amortization period and other changes in assumptions which has the potential of
drastically increasing the OPEB liability. OPEB expense for fiscal year 2017 and deferred outflows
of resources at June 30, 2017 were not restated because the information needed to restate those
amounts was not available. In order to minimize the OPEB liability for FY18 and in the future,
the University implemented a cap on the University’s contribution for retiree health at the
current $288 per month for current and future retirees. The University sent letters to retirees
by the June 30, 2017 measurement date in order to be incorporated into the FY18 GASB 75
valuation.
Note 16—Segment Information
A segment represents identifiable activities for which one or more revenue bonds or other
revenue-backed debt is outstanding. Investors in Academic Building Revenue Bonds rely on
pledged tuition and fees revenues generated by the University for repayment. Investors in bonds
of all other bond enterprises rely solely on the revenue generated by the individual activities for
repayment. The University’s segments are described as follows:

74 FY18 Notes to Financial Statements
ACADEMIC BUILDING REVENUE BONDSThe Academic Building Revenue Bond Funds were created to defray the costs of constructing
and renovating academic buildings of the University.
ATHLETIC FACILITIES REVENUE BONDSThe Athletic Facilities Revenue Bond Funds were created to defray the costs of constructing
and equipping certain athletic and recreational buildings and facilities at the University. The
revenues pledged to these bonds are generated by Big Ten Conference revenue distributions,
student fees and tickets sold, concessions, and contract revenues for athletic events.
HOSPITAL REVENUE BONDSThe Hospital Revenue Bond Funds were created to defray the costs of various construction and
renovation projects at the University of Iowa Hospitals & Clinics. The revenues pledged to these
bonds consist of charges to patients for medical services.
IOWA MEMORIAL UNION (IMU) REVENUE BONDSThe Iowa Memorial Union (IMU) Revenue Bond Funds were created to defray the cost of
alterations and improvements to the IMU at the University. The revenues pledged to these bonds
are generated by fees paid by users of the IMU and from student fees.
PARKING SYSTEM REVENUE BONDSThe Parking System Revenue Bond Funds were created to defray additional costs of constructing,
improving, and equipping various parking facilities at the University. The revenues pledged to
these bonds are generated by fees paid by users of the parking facilities.
RECREATIONAL FACILITIES REVENUE BONDSThe Recreational Facilities Revenue Bonds were created to defray the costs of building,
furnishing, and equipping the Campus Recreation and Wellness Center and constructing
improvements to the University Field House at the University. The revenues pledged to these
bonds consist of student fees and charges.
RESIDENCE SERVICES REVENUE BONDSThe Residence Services Revenue Bond Funds were created to defray additional costs of
constructing, improving and maintaining various residence halls and related facilities at the
University. The revenues pledged to these bonds are generated by fees paid by users of the
residence halls’ services.
TELECOMMUNICATIONS FACILITIES REVENUE BONDSThe Telecommunications Facilities Revenue Bond Funds were created to defray the costs of
constructing, equipping, furnishing, and improving the telecommunications facilities of the
University. The revenues pledged to these bonds come from charges assessed to the users of the
telecommunications facilities.

75 FY18 Notes to Financial Statements FY18 Notes to Financial Statements 75
UNIVERSITY OF IOWA CENTER FOR ADVANCEMENT REVENUE BONDSThe University of Iowa Center for Advancement Revenue Bond Funds were created to defray
the costs of constructing, furnishing, and equipping a building to be used as the Center for
University Advancement at the University. The revenues pledged to these bonds are rental
payments received from the University of Iowa Center for Advancement for the use of the
building.
UNIVERSITY OF IOWA FACILITIES CORPORATION REVENUE BONDSThe University of Iowa Facilities Corporation Revenue Bond Funds were created to provide
financial assistance to the University of Iowa for the acquisition and construction of facilities
for the benefit of the University of Iowa. The bonds are payable solely from the lease payments
paid by the University of Iowa for the facilities. Upon repayment of the bonds, ownership of the
acquired facilities transfers to the University of Iowa.
UTILITY SYSTEM REVENUE BONDSThe Utility System Revenue Bond Funds were created to defray additional costs to construct,
equip and furnish the utility system of the University. The revenues pledged to these bonds
come from charges assessed to the users of the utility system.
FUND ACCOUNTINGIn order to ensure the observance of limitations and restrictions placed on the use of available
resources, the accounts are maintained in accordance with the principles of fund accounting.
Each fund provides a separate set of self-balancing accounts which comprises its assets,
liabilities, reserves, net position, revenues and expenses. Fund accounting is the procedure by
which resources for various purposes are classified, for accounting and reporting purposes,
into funds according to the activities or objectives specified. The University has set up accounts
which are consistent with the flow of funds per requirements of the bond covenants.
TRANSFERS IN (OUT)After meeting certain requirements specified in the bond agreements, the balance of net
receipts may be transferred to the University for its general operations. However, all such
monies that have been transferred shall be returned by the University, if necessary, to satisfy
the requirements of the bond indentures.

76 FY18 Segment Reporting
Academic Building Revenue
Bonds
Athletic Facilities Revenue
Bonds
Hospital Revenue
Bonds
IMU Revenue
Bonds
Parking System
Revenue Bonds
Recreational Facilities Revenue
Bonds
Residence Services Revenue
Bonds
Telecomm. Facilities Revenue
Bonds
UI Center for Advancement
Revenue Bonds
UI Facility Corporation
Bonds
Utility System
Revenue Bonds
CONDENSED STATEMENT OF NET POSITIONAssets:
Current assets $23,598 $29,166 $375,981 $4,857 $4,813 $3,971 $10,581 $5,211 $820 $49 $14,343 Capital assets 863,343 161,456 1,102,002 44,232 109,633 89,772 234,483 28,724 3,028 196,603 311,533 Other noncurrent assets 15,393 43,008 738,210 641 27,215 10,363 44,733 14,776 863 14,725 35,766
Total assets 902,334 233,630 2,216,193 49,730 141,661 104,106 289,797 48,711 4,711 211,377 361,642
Deferred outflows of resources 1,974 3,320 45,705 - - 3,669 17 - - 1,399 2,895
Liabilities:
Current liabilities 23,237 26,058 240,775 3,931 4,507 3,971 12,096 3,424 818 10,927 15,009 Noncurrent liabilities 176,351 183,031 454,001 4,856 54,699 62,163 163,974 29,385 825 111,771 162,593
Total liabilities 199,588 209,089 694,776 8,787 59,206 66,134 176,070 32,809 1,643 122,698 177,602
Deferred inflows of resources 600 - 28,460 381 249 - 470 - 181 923
Net Position:
Net investment in capital assets 678,401 1,856 750,890 38,460 56,531 29,023 73,706 (1,876) 1,423 75,460 158,332 Restricted - expendable 25,719 22,800 8,314 1,176 2,687 9,177 29,663 3,796 1,645 14,437 16,549 Unrestricted - 3,205 779,458 926 22,988 3,441 9,905 13,982 - - 11,131
Total net position $704,120 $27,861 $1,538,662 $40,562 $82,206 $41,641 $113,274 $15,902 $3,068 $89,897 $186,012
CONDENSED STATEMENT OF REVENUES, EXPENSES AND CHANGES IN NET POSITION
Operating revenues $406,805 $94,297 $1,666,437 $14,670 $22,290 $5,781 $78,809 $23,483 - - $94,077 Depreciation expense (40,817) (7,670) (101,324) (2,557) (5,857) (3,602) (12,912) (871) (901) (9,993) (17,559)Other operating expenses - (16,485) (1,364,479) (17,697) (12,712) (8,293) (64,737) (17,255) - - (60,706)
Net operating income (loss) 365,988 70,142 200,634 (5,584) 3,721 (6,114) 1,160 5,357 (901) (9,993) 15,812
Nonoperating revenues (expenses) (4,990) (2,926) 15,033 597 (1,213) (1,973) (3,619) (796) (64) (4,104) (1,936)Transfers from/(to) University funds (322,262) (61,460) 80,744 5,908 967 7,328 (966) (2,199) 773 16,591 (1,595)
Change in net position 38,736 5,756 296,411 921 3,475 (759) (3,425) 2,362 (192) 2,494 12,281
Net position, beginning of year (Hospital restated) 665,384 22,105 1,242,251 39,641 78,731 42,400 116,699 13,540 3,260 87,403 173,731
Net position, end of year $704,120 $27,861 $1,538,662 $40,562 $82,206 $41,641 $113,274 $15,902 $3,068 $89,897 $186,012
CONDENSED STATEMENT OF CASH FLOWSNet cash provided (used) by operating activities $407,366 $77,233 $ 164,303 ($3,974) $13,847 ($2,391) $13,726 $5,275 - - $35,283
Net cash provided (used) by noncapital financing activities (391,220) (95,750) 80,745 471 85 (3,209) (533) (2,199) 773 14,556 (20,997)
Net cash provided (used) by capital and related financing activities (16,349) 54,009 (98,676) 3,528 (11,915) 5,873 (25,400) (2,391) (834) (14,594) (4,726)
Net cash provided (used) by investing activities 2,408 1,428 (149,806) (20) (1,967) (2,267) (224) 2,592 639 38 3,485
Net increase (decrease) in cash 2,205 36,920 (3,434) 5 50 (1,994) (12,431) 3,277 578 - 13,045
Cash and cash equivalents, beginning of year 15,649 22,894 24,058 686 13,705 12,026 51,691 11,459 844 - 25,267
Cash and cash equivalents, end of year $17,854 $59,814 $20,624 $691 $13,755 $10,032 $39,260 $14,736 $1,422 - $38,312
Segment Reporting (in thousands) As of and for the year ended June 30, 2018

77 FY18 Notes to Financial Statements FY18 Segment Reporting 77
Academic Building Revenue
Bonds
Athletic Facilities Revenue
Bonds
Hospital Revenue
Bonds
IMU Revenue
Bonds
Parking System
Revenue Bonds
Recreational Facilities Revenue
Bonds
Residence Services Revenue
Bonds
Telecomm. Facilities Revenue
Bonds
UI Center for Advancement
Revenue Bonds
UI Facility Corporation
Bonds
Utility System
Revenue Bonds
CONDENSED STATEMENT OF NET POSITIONAssets:
Current assets $23,598 $29,166 $375,981 $4,857 $4,813 $3,971 $10,581 $5,211 $820 $49 $14,343 Capital assets 863,343 161,456 1,102,002 44,232 109,633 89,772 234,483 28,724 3,028 196,603 311,533 Other noncurrent assets 15,393 43,008 738,210 641 27,215 10,363 44,733 14,776 863 14,725 35,766
Total assets 902,334 233,630 2,216,193 49,730 141,661 104,106 289,797 48,711 4,711 211,377 361,642
Deferred outflows of resources 1,974 3,320 45,705 - - 3,669 17 - - 1,399 2,895
Liabilities:
Current liabilities 23,237 26,058 240,775 3,931 4,507 3,971 12,096 3,424 818 10,927 15,009 Noncurrent liabilities 176,351 183,031 454,001 4,856 54,699 62,163 163,974 29,385 825 111,771 162,593
Total liabilities 199,588 209,089 694,776 8,787 59,206 66,134 176,070 32,809 1,643 122,698 177,602
Deferred inflows of resources 600 - 28,460 381 249 - 470 - 181 923
Net Position:
Net investment in capital assets 678,401 1,856 750,890 38,460 56,531 29,023 73,706 (1,876) 1,423 75,460 158,332 Restricted - expendable 25,719 22,800 8,314 1,176 2,687 9,177 29,663 3,796 1,645 14,437 16,549 Unrestricted - 3,205 779,458 926 22,988 3,441 9,905 13,982 - - 11,131
Total net position $704,120 $27,861 $1,538,662 $40,562 $82,206 $41,641 $113,274 $15,902 $3,068 $89,897 $186,012
CONDENSED STATEMENT OF REVENUES, EXPENSES AND CHANGES IN NET POSITION
Operating revenues $406,805 $94,297 $1,666,437 $14,670 $22,290 $5,781 $78,809 $23,483 - - $94,077 Depreciation expense (40,817) (7,670) (101,324) (2,557) (5,857) (3,602) (12,912) (871) (901) (9,993) (17,559)Other operating expenses - (16,485) (1,364,479) (17,697) (12,712) (8,293) (64,737) (17,255) - - (60,706)
Net operating income (loss) 365,988 70,142 200,634 (5,584) 3,721 (6,114) 1,160 5,357 (901) (9,993) 15,812
Nonoperating revenues (expenses) (4,990) (2,926) 15,033 597 (1,213) (1,973) (3,619) (796) (64) (4,104) (1,936)Transfers from/(to) University funds (322,262) (61,460) 80,744 5,908 967 7,328 (966) (2,199) 773 16,591 (1,595)
Change in net position 38,736 5,756 296,411 921 3,475 (759) (3,425) 2,362 (192) 2,494 12,281
Net position, beginning of year (Hospital restated) 665,384 22,105 1,242,251 39,641 78,731 42,400 116,699 13,540 3,260 87,403 173,731
Net position, end of year $704,120 $27,861 $1,538,662 $40,562 $82,206 $41,641 $113,274 $15,902 $3,068 $89,897 $186,012
CONDENSED STATEMENT OF CASH FLOWSNet cash provided (used) by operating activities $407,366 $77,233 $ 164,303 ($3,974) $13,847 ($2,391) $13,726 $5,275 - - $35,283
Net cash provided (used) by noncapital financing activities (391,220) (95,750) 80,745 471 85 (3,209) (533) (2,199) 773 14,556 (20,997)
Net cash provided (used) by capital and related financing activities (16,349) 54,009 (98,676) 3,528 (11,915) 5,873 (25,400) (2,391) (834) (14,594) (4,726)
Net cash provided (used) by investing activities 2,408 1,428 (149,806) (20) (1,967) (2,267) (224) 2,592 639 38 3,485
Net increase (decrease) in cash 2,205 36,920 (3,434) 5 50 (1,994) (12,431) 3,277 578 - 13,045
Cash and cash equivalents, beginning of year 15,649 22,894 24,058 686 13,705 12,026 51,691 11,459 844 - 25,267
Cash and cash equivalents, end of year $17,854 $59,814 $20,624 $691 $13,755 $10,032 $39,260 $14,736 $1,422 - $38,312

78 FY18 Segment Reporting
Academic Building Revenue
Bonds
Athletic Facilities Revenue
Bonds
Hospital Revenue
Bonds
IMU Revenue
Bonds
Parking System
Revenue Bonds
Recreational Facilities Revenue
Bonds
Residence Services Revenue
Bonds
Telecomm. Facilities Revenue
Bonds
UI Center for Advancement
Revenue Bonds
UI Facilities Corporation
Revenue Bonds
Utility System
Revenue Bonds
DEBT SERVICE COVERAGEDebt service coverage % - Required N/A 125% 130% 120% 120% 125% 135% 110% 100% N/A 120%
Debt service coverage % - Actual N/A 680% 1316% 283% 230% 275% 155% 275% 100% N/A 235%
PORTION OF REVENUE PLEDGEDAnnual debt service (principal & interest) $16,087 $11,883 $22,939 $743 $4,556 $4,730 $11,712 $2,398 $856 $14,594 $15,028
Net pledged revenue N/A 80,832 301,956 2,102 10,479 13,019 18,096 6,602 856 N/A 35,351
Annual debt service/Net operating revenues (%) N/A 15% 8% 35% 43% 36% 65% 36% 100% N/A 43%
REVENUE BONDS PAYABLEA summary of revenue bonds payable activity, by segment, for the year ended June 30, 2018, is as follows: Beginning Balance $197,194 $129,372 $307,208 $6,017 $55,849 $64,803 $174,649 $31,803 $2,345 $132,874 $157,589
Additions - 88,780 33,202 - - 23,334 - - - - 25,101
Reductions (10,877) (27,411) (13,604) (626) (2,996) (23,718) (6,325) (1,203) (740) (10,513) (11,117)
Ending Balance $186,317 $190,741 $326,806 $5,391 $52,853 $64,419 $168,324 $30,600 $1,605 $122,361 $171,573
DEBT SERVICE REQUIREMENTSA summary of revenue bond debt service for payment of principal and interest is shown below. As of June 30, 2018, the amount shown for debt service payments due on July 1 were on hand.Semi-annual maturity Jan & Jul 1st Jan & Jul 1st Mar & Sep 1st Jan & Jul 1st Jan & Jul 1st Jan & Jul 1st Jan & Jul 1st Jan & Jul 1st Jan & Jul 1st Dec & Jun 1st May & Nov 1st
2019 $15,926 $13,286 $24,284 $737 $4,514 $4,504 $11,306 $2,380 $838 $14,634 $16,457
2020 15,888 14,322 24,802 734 4,466 4,883 11,689 2,383 844 14,207 16,482
2021 16,034 14,575 25,259 742 3,748 4,978 11,870 2,392 - 10,912 15,444
2022 15,797 14,596 25,173 739 3,750 5,079 11,481 2,395 - 10,927 15,434
2023 15,795 14,760 25,058 739 3,760 5,095 11,385 2,399 - 10,961 15,450
2024-2028 72,110 73,870 124,389 2,218 16,656 24,445 53,771 12,103 - 50,006 65,256
2029-2033 55,716 64,678 91,893 - 13,185 22,957 51,807 12,327 - 27,975 34,882
2034-2038 25,967 31,481 77,262 - 13,291 9,101 38,661 6,558 - 15,297 26,810
2039-2043 - 2,205 22,163 - 8,042 - 26,131 - - - 12,085
2044 - - 1,984 - - - - - - -
Unamortized Discount and Premium 6,437 3,061 14,621 471 583 5,154 1,639 130 - 1,496 6,098
Total $239,670 $246,834 $456,888 $6,380 $71,995 $86,196 $229,740 $43,067 $1,682 $156,415 $224,398
COMMITMENTSAs of June 30, 2018, the University has entered into contract commitments for construction projects as follows:
Contract Commitments $100,349 $46,747 $60,970 $57 $1,727 $49 $15,912 $14 - $1,358 $17,764
Segment Reporting (in thousands) As of and for the year ended June 30, 2018

79 FY18 Notes to Financial Statements FY18 Segment Reporting 79
Academic Building Revenue
Bonds
Athletic Facilities Revenue
Bonds
Hospital Revenue
Bonds
IMU Revenue
Bonds
Parking System
Revenue Bonds
Recreational Facilities Revenue
Bonds
Residence Services Revenue
Bonds
Telecomm. Facilities Revenue
Bonds
UI Center for Advancement
Revenue Bonds
UI Facilities Corporation
Revenue Bonds
Utility System
Revenue Bonds
DEBT SERVICE COVERAGEDebt service coverage % - Required N/A 125% 130% 120% 120% 125% 135% 110% 100% N/A 120%
Debt service coverage % - Actual N/A 680% 1316% 283% 230% 275% 155% 275% 100% N/A 235%
PORTION OF REVENUE PLEDGEDAnnual debt service (principal & interest) $16,087 $11,883 $22,939 $743 $4,556 $4,730 $11,712 $2,398 $856 $14,594 $15,028
Net pledged revenue N/A 80,832 301,956 2,102 10,479 13,019 18,096 6,602 856 N/A 35,351
Annual debt service/Net operating revenues (%) N/A 15% 8% 35% 43% 36% 65% 36% 100% N/A 43%
REVENUE BONDS PAYABLEA summary of revenue bonds payable activity, by segment, for the year ended June 30, 2018, is as follows: Beginning Balance $197,194 $129,372 $307,208 $6,017 $55,849 $64,803 $174,649 $31,803 $2,345 $132,874 $157,589
Additions - 88,780 33,202 - - 23,334 - - - - 25,101
Reductions (10,877) (27,411) (13,604) (626) (2,996) (23,718) (6,325) (1,203) (740) (10,513) (11,117)
Ending Balance $186,317 $190,741 $326,806 $5,391 $52,853 $64,419 $168,324 $30,600 $1,605 $122,361 $171,573
DEBT SERVICE REQUIREMENTSA summary of revenue bond debt service for payment of principal and interest is shown below. As of June 30, 2018, the amount shown for debt service payments due on July 1 were on hand.Semi-annual maturity Jan & Jul 1st Jan & Jul 1st Mar & Sep 1st Jan & Jul 1st Jan & Jul 1st Jan & Jul 1st Jan & Jul 1st Jan & Jul 1st Jan & Jul 1st Dec & Jun 1st May & Nov 1st
2019 $15,926 $13,286 $24,284 737 $4,514 $4,504 $11,306 $2,380 $838 $14,634 $16,457
2020 15,888 14,322 24,802 734 4,466 4,883 11,689 2,383 844 14,207 16,482
2021 16,034 14,575 25,259 742 3,748 4,978 11,870 2,392 - 10,912 15,444
2022 15,797 14,596 25,173 739 3,750 5,079 11,481 2,395 - 10,927 15,434
2023 15,795 14,760 25,058 739 3,760 5,095 11,385 2,399 - 10,961 15,450
2024-2028 72,110 73,870 124,389 2,218 16,656 24,445 53,771 12,103 - 50,006 65,256
2029-2033 55,716 64,678 91,893 - 13,185 22,957 51,807 12,327 - 27,975 34,882
2034-2038 25,967 31,481 77,262 - 13,291 9,101 38,661 6,558 - 15,297 26,810
2039-2043 - 2,205 22,163 - 8,042 - 26,131 - - - 12,085
2044 - - 1,984 - - - - - - -
Unamortized Discount and Premium 6,437 3,061 14,621 471 583 5,154 1,639 130 - 1,496 6,098
Total $239,670 $246,834 $456,888 $6,380 $71,995 $86,196 $229,740 $43,067 $1,682 $156,415 $224,398
COMMITMENTSAs of June 30, 2018, the University has entered into contract commitments for construction projects as follows:
Contract Commitments $100,349 $46,747 $60,970 $57 $1,727 $49 $15,912 $14 - $1,358 $17,764

80 FY18 Required Supplementary Information
Required Supplementary Information June 30, 2018 SCHEDULE OF THE UNIVERSITY’S PROPORTIONATE SHARE OF NET PENSION LIABILITYIowa Public Employees’ Retirement System Last Fiscal Year* (in thousands):
Note: GASB Statement No. 68 requires ten years of information to be presented in this table. However, until a full 10 year trend is compiled, the University will present information for those years for which information is available.
SCHEDULE OF UNIVERSITY CONTRIBUTIONSIowa Public Employees’ Retirement System Last 10 Fiscal Years (in thousands):
See accompanying independent auditor’s report.
For the Year Ended
Proportion of the
Net Pension Liability
Proportionate Share of the Net Pension
Liability
University’s Covered-
Employee Payroll
Net Pension Liability as a
Percentage of Covered-
Employee Payroll
IPERS’ Net Position as a Percentage
of the Total Pension Liability
6/30/18 1.4825633% $98,758 $111,914 88.24% 82.21%
6/30/17 1.2770236% 80,367 92,356 87.02% 81.82%
6/30/16 1.0820964% 53,461 74,409 71.85% 85.19%
6/30/15 0.9747910% 38,659 63,967 60.44% 87.61%
*In accordance with GASB Statement No. 68, the amounts presented for each fiscal year were determined as of June 30 of the preceding fiscal year.
For the Year Ended
Statutorily Required
ContributionsActual Employer
Contribution
Contribution/ Deficiency
(Excess)
University's Covered-Employee
Payroll
Contributions as a Percentage of
Covered-Employee Payroll
6/30/18 $10,993 $(10,993) $ - $124,673 8.80%
6/30/17 9,931 (9,931) - 111,914 8.90%
6/30/16 8,184 (8,184) - 92,356 8.90%
6/30/15 6,620 (6,620) - 74,409 8.90%
6/30/14 5,696 (5,696) - 63,967 8.90%
6/30/13 4,718 (4,718) - 54,658 8.60%
6/30/12 3,802 (3,802) - 46,653 8.10%
6/30/11 2,428 (2,428) - 33,646 7.20%
6/30/10 1,654 (1,654) - 24,521 6.70%
6/30/09 1,460 (1,460) - 22,792 6.40%
Notes to Required Supplementary Information– June 30, 2018
PENSION LIABILITY
Changes of benefit terms: Legislation passed in 2010 modified benefit terms for current Regular members. The definition
of final average salary changed from the highest three to the highest five years of covered wages.
The vesting requirement changed from four years of service to seven years. The early retirement
reduction increased from 3 percent per year measured from the member’s first unreduced
retirement age to a 6 percent reduction for each year of retirement before age 65.
Changes of assumptions:The 2017 valuation implemented the following refinements as a result of a quadrennial
experience study:
• Decreased the inflation assumption from 3.00% to 2.60% per year.
• Decreased the assumed rate of interest on member accounts from 3.75% to 3.50% per year.
• Decreased the long-term rate of return assumption from 7.50% to 7.00% per year.
• Decreased the wage growth and payroll growth assumption from 4.00% to 3.25% per year.
• Decreased the salary increase assumption by 0.75%.
The 2014 valuation implemented the following refinements as a result of a quadrennial
experience study:
• Decreased the inflation assumption from 3.25% to 3.00%.
• Decreased the assumed rate of interest on member accounts from 4.00% to 3.75% per year.
• Adjusted male mortality rates for retirees in the Regular membership group.
• Moved from an open 30 year amortization period to a closed 30 year amortization period
for the UAL beginning June 30, 2014. Each year thereafter, changes in the UAL from plan
experience will be amortized on a separate closed 20 year period.
The 2010 valuation implemented the following refinements as a result of a quadrennial
experience study:
• Adjusted retiree mortality assumptions.
• Modified retirement rates to reflect fewer retirements.
• Lowered disability rates at most ages.
• Lowered employment termination rates.
• Generally increased the probability of terminating members
receiving a deferred retirement benefit.
• Modified salary increase assumptions based on various service duration.
FY18 Required Supplementary Information 81

82 FY18 Required Supplementary Information
SCHEDULE OF CHANGES IN THE UNIVERSITY’S TOTAL OPEB LIABILITY AND RELATED RATIOS For the year ended June 30, 2018 (in thousands)
Professional,Scientific,
and Faculty Merit Total
Service cost $32,244 $1,489 $33,733
Interest 17,588 580 18,168
Changes in benefit terms (465,008) - (465,008)
Differences between expected and actual experiences 48,567
-
48,567
Changes of assumptions (94,293) (1,010) (95,303)
Benefits payments (6,952) - (6,952)
Contributions from the employer - (1,049) (1,049)
Net change in total OPEB liability ($467,854) $10 ($467,844)
Total OPEB liability beginning of year, as restated 588,306 19,373
607,679
Net OPEB liability end of year 120,452 19,383 139,835
Covered-employee payroll $1,112,619 $179,139 $1,291,758
Total OPEB Liability as a percentage of covered-employee payroll 10.83% 10.82% 10.83%

Notes to Required Supplementary Information– June 30, 2018
OPEB LIABILITY
Changes in the University’s Total OPEB Liability and Related Ratios
The financial accounting valuation reflects the following method changes:
• A change in the actuarial cost method from Projected Unit Credit to Entry Age Normal.
The financial accounting valuation reflects the following assumption changes:
• A change in the discount rate to 3.58% as of June 30, 2017. The discount rate was 6.75%
as of June 30, 2016.
• A change in the withdrawal rates for staff to better anticipate future experience.
• A change in the mortality assumption from the RP-2014 Aggregate Mortality Table
projected using Scale MP-2014 to the RP-2014 Aggregate Mortality Table projected using
Scale MP-2016.
• The health care trend rate assumption was updated to a schedule of rates beginning at
7.55% in 2017, grading down to 4.50% in 2026 and beyond for pre-65 participants and
9.17% in 2017 grading down to 4.50% in 2026 and beyond for post-65 participants.
• The marginal cost adjustment factors were changed from 59.4% to 60.1% for pre-65
participants and from 86.8% to 87.6% for post-65 participants.
• The impact of the Excise Tax on high cost plans due to healthcare reform was updated,
based on current claims and medical trend assumptions.
See accompanying independent auditor’s report.
FY18 Required Supplementary Information 83

84 FY18 Notes to Financial Statements

85 FY18 Notes to Financial Statements
OFFICE OF THE CHIEF FINANCIAL OFFICER ACCOUNTING AND FINANCIAL REPORTING
Terry L. Johnson Chief Financial Officer and Treasurer
Selina J. Martin University Controller
Steve Romont Director, Accounting and Financial Reporting
Yan Huang Assistant Director, Accounting and Financial Reporting
Shelly Michel Assistant Director, Accounting and Financial Reporting
Design and Photography by the Office of Strategic CommunicationPrinted by UI Printing Services
r Printed on recycled paper
This financial report is designed to provide users with a general overview of the University of Iowa’s finances and to demonstrate the university’s accountability for the funds received. Questions regarding this report, or requests for additional financial information, should be directed to the Controller, University of Iowa, 4M Jessup Hall, Iowa City, IA 52242 or email [email protected]. An electronic version can be found at afr.fo.uiowa.edu/annual-reports.
The University of Iowa prohibits discrimination in employment, educational programs, and activities on the basis of race, creed, color, religion, national origin, age, sex, pregnancy, disability, genetic information, status as a U.S. veteran, service in the U.S. military, sexual orientation, gender identity, associational preferences, or any other classification that deprives the person of consideration as an individual. The university also affirms its commitment to providing equal opportunities and equal access to university facilities. For additional information on nondiscrimination policies, contact the Director, Office of Equal Opportunity and Diversity, the University of Iowa, 202 Jessup Hall, Iowa City, IA 52242-1316, 319-335-0705 (voice), 319-335-0697 (TDD), [email protected]. W36062 12/18


