56
The University of Mississippi Medical Center • Jackson Financial Report June 30, 2016

The University of MississippiMedical Center • Jackson
Financial ReportJune 30, 2016
TABLE OF CONTENTS
Management’s Discussion and Analysis ............................................................................. 1
Basic Financial Statements
Statement of Net Position ........................................................................................... 11
Statement of Revenues, Expenses, and Changes in Net Position ............................... 13
Statement of Cash Flows ............................................................................................ 15
Notes to the Financial Statements ....................................................................................... 19
Required Supplementary Information .............................................................................. 52

MANAGEMENT’S DISCUSSION AND ANALYSIS
The University of Mississippi Medical Center (“the Medical Center”) presents its financial statements for fiscal year 2016 with fiscal years 2015 and 2014 presented for comparative purposes. Management’s discussion and analysis provides an overview of the Medical Center’s financial activities. The Medical Center Educational Building Corporation (the Corporation) is a nonprofit corporation and was incorporated in the State of Mississippi with the approval of the Board of Trustees of the State Institutions of Higher Learning (the Board) for the State of Mississippi on June 26, 1991. The purpose of the Corporation is for the acquisition, construction, and equipping of facilities and land for the Medical Center. The Corporation operates on a June 30 fiscal year-end for financial and tax reporting purposes. The Corporation is a blended component unit of the Medical Center in accordance with Governmental Accounting Standards Board Statement Number 39. The financial statements of the Medical Center include the Corporation due to the composition of the Corporation’s Board of Directors and the purpose of the Corporation. The Medical Center’s financial statements consist of three basic financial statements that provide information on the Medical Center as a whole: the Statement of Net Position, the Statement of Revenues, Expenses and Changes in Net Position, and the Statement of Cash Flows. Each one of these statements will be discussed. The Medical Center The Medical Center is five health profession schools, including medicine, and a graduate school in the health sciences. Our graduates make up the backbone - and include many of the leaders – of Mississippi’s health-care workforce. The Medical Center is an integrated health system that trains doctors, nurses, and allied health professionals, offers some of the state’s most advanced medical services and serves as a safety net for our most vulnerable citizens. The Medical Center is also a biomedical and clinical research center, seeking new treatments and cures for diseases and conditions that affect Mississippians and sharing that new knowledge with our trainees. These three missions – education, research, and healthcare – are intertwined to provide the best possible education for the state’s brightest students and cutting-edge health services for our patients.
1

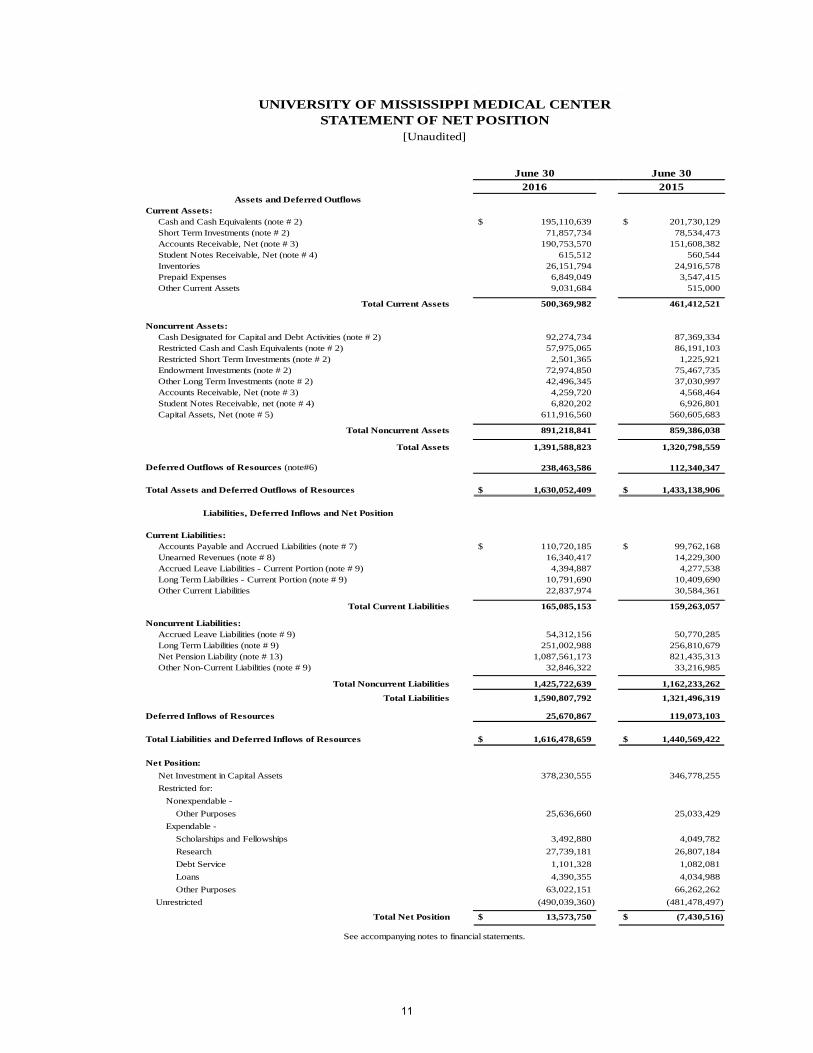
Statement of Net Position The Statement of Net Position presents the assets, liabilities, and the net position components of the Medical Center using the accrual basis of accounting. The Statement of Net Position is a point in time financial statement. The Statement of Net Position presents end-of-year data concerning Assets (current and noncurrent), Deferred Outflows, Liabilities (current and noncurrent), Deferred Inflows and the components of Net Position (Assets and Deferred Outflows minus Liabilities and Deferred Inflows). From the data presented, readers of the Statement of Net Position are able to determine the assets available to continue the operations of the Medical Center. They also are able to determine how much the institution owes vendors and other lending institutions. Finally, the Statement of Net Position provides a picture of the components of net position (assets and deferred outflows minus liabilities and deferred inflows) and their availability for expenditure by the institution. The components of Net Position are divided into three major categories. The first category, net investment in capital assets, provides the Medical Center’s equity in capital assets owned by the institution. The next category is restricted, which is divided into two categories, nonexpendable and expendable. The corpus of nonexpendable restricted resources is available only for investment purposes. Expendable restricted resources are available for expenditure by the institution but must be spent for purposes as determined by donors and/or external entities that have placed time or purpose restrictions on the use of the assets. The final category is unrestricted. Unrestricted assets are available to the institution for any lawful purpose of the institution. The following graph illustrates the comparative change in net position by category for fiscal years 2016, 2015 and 2014:
347
127
(481)
336
122
(548)
378
126
(490)-800
-600
-400
-200
0
200
400
600
800
Net Investment in CapitalAssets
Restricted Unrestricted
(in
mil
lion
s)
Components of Net Position[Unaudited]
2016 2015 2014
2

Statement of Net Position (continued)
Statement of Net Position (in thousands)
2016 2015 2014
Assets and Deferred OutflowsCurrent Assets 500,370$ 461,412$ 431,261$ Capital Assets, Net 611,917 560,606 544,364
Other Assets 279,302 298,780 253,635
Deferred Outflows of Resources 238,463 112,340 69,884
Total Assets and Deferred Outflows 1,630,052 1,433,138 1,299,144
Liabilities and Deferred InflowsCurrent Liabilities 165,085 159,263 144,069 Noncurrent Liabilities 1,425,723 1,162,233 1,245,094 Deferred Inflows of Resources 25,671 119,073 -
Total Liabilities 1,616,479 1,440,569 1,389,163
Net PositionNet Investment in Capital Assets 378,230 346,778 335,512 Restricted - Expendable 99,746 102,237 97,754 Restricted - Nonexpendable 25,636 25,033 24,719 Unrestricted (490,039) (481,479) (548,004)
Total Net Position 13,573$ (7,431)$ (90,019)$
[Unaudited]
At June 30, 2016 current assets totaled $500.4 million and consisted primarily of cash and cash equivalents, short term investments and net receivables. Current assets increased 8.4% ($39.0 million) from 2015. Cash, cash equivalents, and short-term investments constituted approximately 53.4% of current assets as of June 30, 2016 while accounts receivables constituted approximately 38.1% of current assets. Approximately 76.7% of these receivables were related to patient care receivables. At June 30, 2015 current assets totaled $461.4 million and consisted primarily of cash and cash equivalents, short term investments and net receivables. Current assets increased 7.0% ($30.2 million) from 2014. Cash, cash equivalents, and short-term investments constituted approximately 60.7% of current assets as of June 30, 2015 while accounts receivables constituted approximately 32.9% of current assets. Approximately 78.2% of these net receivables were related to patient care receivables. Capital assets, net of accumulated depreciation, increased by $51.3 million from 2015 and $16.2 million from 2014. Additional detail on capital assets can be found in Note 5 of the Notes to the Financial Statements.
3

Statement of Net Position (continued) At June 30, 2016 current liabilities equaled $165.1 million and consisted primarily of accounts payable and accrued liabilities, and other current liabilities. Other current liabilities include amounts due to third party payors. Current liabilities increased 3.7% ($5.8 million) from 2015. Accounts payable and accrued liabilities increased $11.0 million and other current liabilities decreased $7.7 million. At June 30, 2015 current liabilities equaled $159.3 million and consisted primarily of accounts payable and accrued liabilities, and other current liabilities. Other current liabilities include amounts due to Medicaid and other third party payors. Current liabilities increased 10.5% ($15.2 million) from 2014. Significant increases were incurred in the areas of accounts payable and accrued liabilities ($6.8 million) and other current liabilities ($6.7 million).
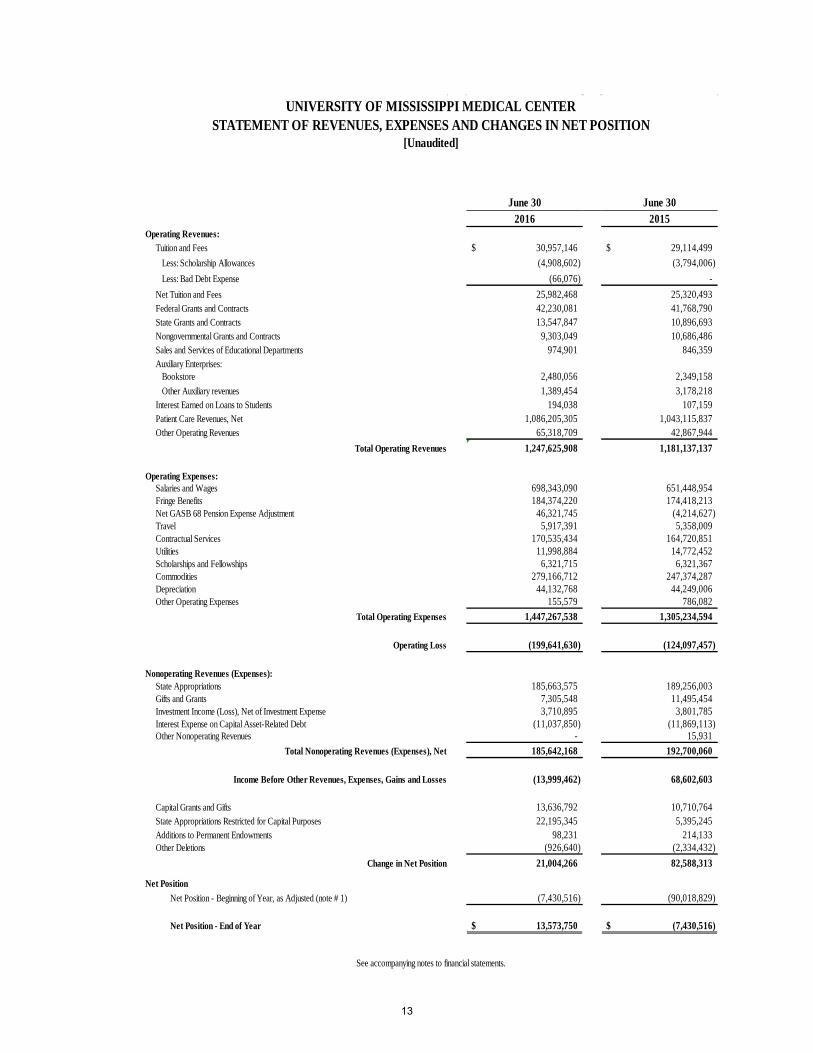
The Medical Center implemented GASB Statement No. 68, Accounting and Financial Reporting for Pensions, during fiscal year 2015. As a result, deferred outflows of resources of $234.0 million, $107.6 million and $65.1 million has been recorded for 2016, 2015 and 2014. Deferred inflows of resources of $25.7 million and $119.1 million has been recorded for 2016 and 2015. Net pension liability (classified as a noncurrent liability) of $1.088 billion, $821.4 million and $902.2 million has been recorded for 2016, 2015 and 2014. Noncurrent liabilities are those liabilities due and payable more than twelve months from year-end (June 30th). At June 30, 2016 noncurrent liabilities increased 22.7% ($263.5 million) from 2015. The principal reason for the increase was due to the increase in the net pension liability ($266.1 million). At June 30, 2015 noncurrent liabilities decreased 6.7% ($82.9 million) from 2014. The principal reason for the decrease was due to the reduction in the net pension liability ($80.8 million). The consumption of assets follows the Medical Center’s policy to use available resources to meet the goals of the institution in the areas of instruction, research, patient care and public service. At June 30, 2016, the total assets of the Medical Center increased $70.8 million from 2015 and $91.5 million from 2014. Total liabilities increased $269.3 million from 2015 and decreased $67.7 million from 2014. Unrestricted net position decreased $8.6 million from 2015 and increased $66.5 million from 2014. Statement of Revenues, Expenses and Changes in Net Position Changes in total net position as presented on the Statement of Net Position are based on the activity presented in the Statement of Revenues, Expenses, and Changes in Net Position. The purpose of the Statement of Revenues, Expenses, and Changes in Net Position is to present the revenues received, both operating and nonoperating, and the expenses paid, operating and nonoperating, and any other revenues, expenses, gains and losses received or disbursed by the Medical Center. Generally speaking, operating revenues are received for providing goods and services to the various customers and constituencies of the Medical Center. Operating expenses are those expenses paid to acquire or produce the goods and services provided in return for the operating revenues, and to carry out the mission of the Medical Center. The net result of operating activities is presented as operating income or loss. The Medical Center has historically reported an operating loss due to type and nature of revenues classified as nonoperating. For example, state appropriations, a material source of revenue, are classified as nonoperating. Therefore, “change in net position” is more indicative of overall financial results for the fiscal year. Nonoperating revenues are revenues received for which goods and services are not provided.
4

Statement of Revenues, Expenses and Changes in Net Position (continued)
2016 2015 2014
Operating Revenues 1,247,626$ 1,181,137$ 1,042,567$
Operating Expenses 1,447,268 1,305,235 1,209,323
Operating Loss (199,642) (124,098) (166,756)
Net Nonoperating Revenues and Expenses 185,642 192,700 189,224
Income Before Other Revenues, Expenses, Gains or Losses (14,000) 68,602 22,468
Other Revenues, Expenses, Gains or Losses 35,004 13,986 7,786
Change in Net Position 21,004 82,588 30,254
Net Position, beginning of year, as originally reported (7,431) (90,019) 716,822
Cumulative Effect of Changes in Accounting Principle - - (902,224)
Net Position, beginning of year, restated (7,431) (90,019) (185,402)
Impact of GASB No. 68 Implementation - - 65,129
Net Position, end of year 13,573$ (7,431)$ (90,019)$
Statement of Revenues, Expenses and Changes in Net Position (in thousands)
[Unaudited]
The largest sources of operating revenues were from patient care, and grants and contracts. Net patient care revenues totaled $1.086 billion, $1.043 billion and $911.1 million, an increase of 4.1% and 14.5% from 2015 to 2016 and 2014 to 2015, respectively. While a portion of the increase in patient revenues is from the Grenada hospital lease acquisition on January 1, 2014, the Medical Center has also experienced revenue growth due to increasing outpatient volumes and higher acuity inpatient cases. The Medical Center receives grant and contract revenue from federal, state, and private agencies. Grant and contract revenue totaled $65.1 million, 63.4 million and $63.5 million, an increase of 2.7% from 2015 to 2016 and a decrease of 0.2% from 2014 to 2015. Tuition and fees, net of scholarship allowances, totaled $26.0 million, $25.3 million and $24.5 million, an increase of 2.6% and 3.1% from 2015 to 2016 and 2014 to 2015. This increase was due to tuition increases. The largest category of operating expenses is salaries, wages and fringe benefits, representing 64.2%, 63.0% and 64.2% for the years ending June 30, 2016, 2015 and 2014. Salaries, wages and fringe benefits totaled $929.0 million, $821.6 million and $776.9 million, an increase of 13.1% and 5.8 % from 2015 to 2016 and 2014 to 2015. Significant increases were from the Grenada hospital lease acquisition on January 1, 2014, volume increases and service mix changes, and the implementation of GASB No. 68 Accounting and Financial Reporting for Pensions.
5

Statement of Revenues, Expenses and Changes in Net Position (continued)
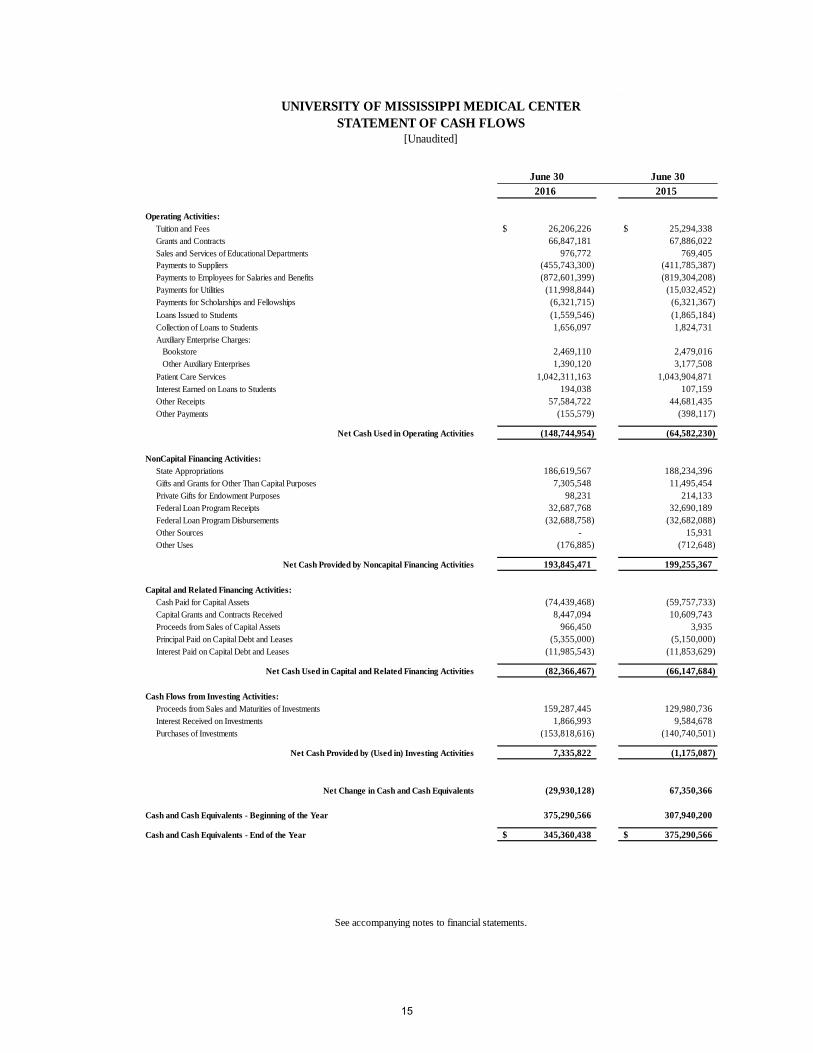
The Medical Center relies on funding from state appropriations. The Medical Center recognized state educational appropriations from the State of Mississippi totaling $185.7 million, $189.3 million and $185.5 million, which is included as nonoperating revenue in 2016, 2015 and 2014. The Medical Center also recognized capital appropriations from the State of Mississippi totaling $22.2 million, $5.4 million and $4.6 million, which is included as a component of other revenues, expenses, gains, or losses in 2016, 2015 and 2014. Statement of Cash Flows The Statement of Cash Flows presents detailed information about the cash activity of the Medical Center during the year. The statement is divided into five parts. The first part deals with operating cash flows and shows the net cash used by the operating activities of the Medical Center. The second section reflects cash flows from noncapital financing activities. This section reflects the cash received and spent for non-operating, non-investing, and noncapital financing purposes. The third section deals with cash flows from capital and related financing activities. This section deals with the cash used for the acquisition and construction of capital and related items. The fourth section reflects the cash flows from investing activities. The fifth section reconciles the net cash used to the operating income or loss reflected on the Statement of Revenues, Expenses, and Changes in Net Position.
Cash Flows for the Years ended June 30, (in thousands)
2016 2015 2014
Cash provided (used) by:
Operating Activities (148,745)$ (64,582)$ (92,035)$
Noncapital financing activites 193,845 199,255 189,541
Capital and related financing activites (82,367) (66,147) (54,661)
Investing activities 7,336 (1,175) (35,231)
Net Change in Cash (29,931) 67,351 7,614
Cash and cash equivalents, beginning of the year 375,291 307,940 300,326
Cash and cash equivalents, end of the year 345,360$ 375,291$ 307,940$
[Unaudited]
The condensed statements illustrate the composition of cash sources and uses of funds for fiscal years 2016, 2015 and 2014. The Medical Center used $148.7 million, $64.6 million and $92.0 million of cash for operating activities, offset by $193.8 million, $199.3 million and $189.5 million of cash provided by noncapital financing activities in 2016, 2015 and 2014, respectively. Noncapital financing activities include state educational appropriations and gifts received for other than capital purposes that are used to support operating expenses. Cash of $82.4 million, $66.1 million and $54.7 million in 2016, 2015 and 2014, respectively, was used for capital and related financing activities, primarily purchases of capital assets and principal and interest payments on long-term debt, partially offset by sources that included grants and contracts for capital purposes. Cash provided by (used) in investing activities totaled $7.3 million, $(1.2) million and $(35.2) million in 2016, 2015 and 2014, respectively.
6
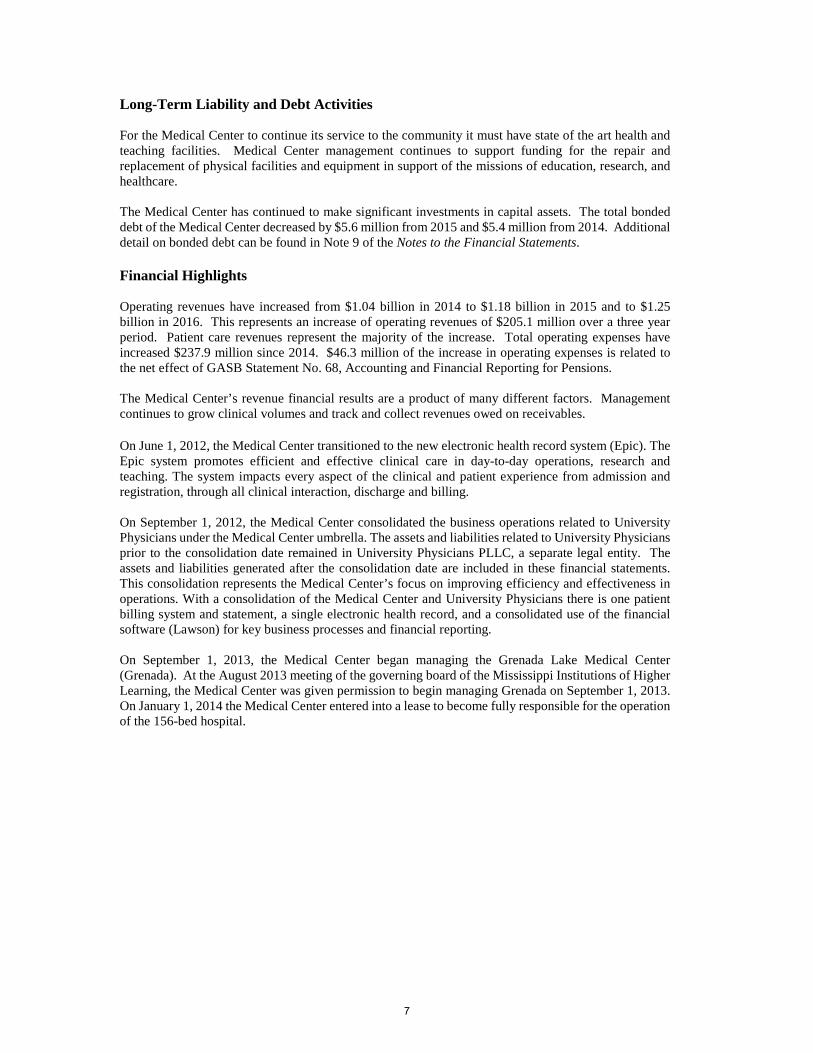
Long-Term Liability and Debt Activities For the Medical Center to continue its service to the community it must have state of the art health and teaching facilities. Medical Center management continues to support funding for the repair and replacement of physical facilities and equipment in support of the missions of education, research, and healthcare. The Medical Center has continued to make significant investments in capital assets. The total bonded debt of the Medical Center decreased by $5.6 million from 2015 and $5.4 million from 2014. Additional detail on bonded debt can be found in Note 9 of the Notes to the Financial Statements. Financial Highlights Operating revenues have increased from $1.04 billion in 2014 to $1.18 billion in 2015 and to $1.25 billion in 2016. This represents an increase of operating revenues of $205.1 million over a three year period. Patient care revenues represent the majority of the increase. Total operating expenses have increased $237.9 million since 2014. $46.3 million of the increase in operating expenses is related to the net effect of GASB Statement No. 68, Accounting and Financial Reporting for Pensions. The Medical Center’s revenue financial results are a product of many different factors. Management continues to grow clinical volumes and track and collect revenues owed on receivables. On June 1, 2012, the Medical Center transitioned to the new electronic health record system (Epic). The Epic system promotes efficient and effective clinical care in day-to-day operations, research and teaching. The system impacts every aspect of the clinical and patient experience from admission and registration, through all clinical interaction, discharge and billing. On September 1, 2012, the Medical Center consolidated the business operations related to University Physicians under the Medical Center umbrella. The assets and liabilities related to University Physicians prior to the consolidation date remained in University Physicians PLLC, a separate legal entity. The assets and liabilities generated after the consolidation date are included in these financial statements. This consolidation represents the Medical Center’s focus on improving efficiency and effectiveness in operations. With a consolidation of the Medical Center and University Physicians there is one patient billing system and statement, a single electronic health record, and a consolidated use of the financial software (Lawson) for key business processes and financial reporting. On September 1, 2013, the Medical Center began managing the Grenada Lake Medical Center (Grenada). At the August 2013 meeting of the governing board of the Mississippi Institutions of Higher Learning, the Medical Center was given permission to begin managing Grenada on September 1, 2013. On January 1, 2014 the Medical Center entered into a lease to become fully responsible for the operation of the 156-bed hospital.
7
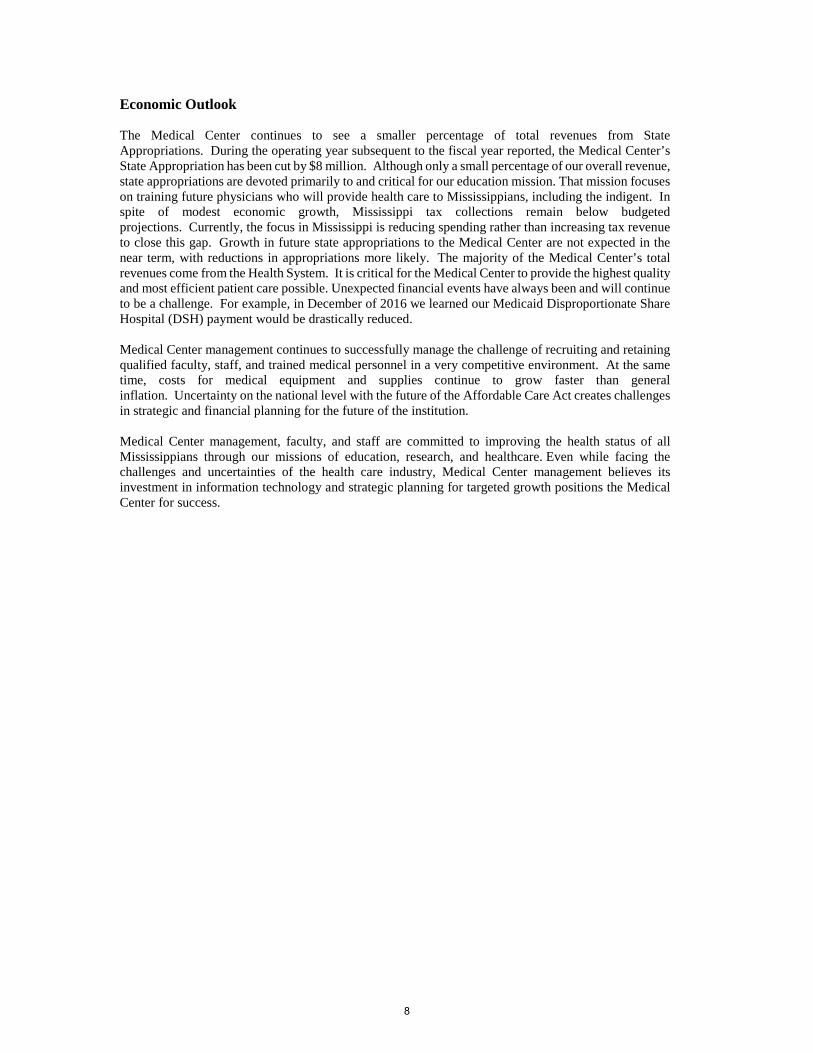
Economic Outlook The Medical Center continues to see a smaller percentage of total revenues from State Appropriations. During the operating year subsequent to the fiscal year reported, the Medical Center’s State Appropriation has been cut by $8 million. Although only a small percentage of our overall revenue, state appropriations are devoted primarily to and critical for our education mission. That mission focuses on training future physicians who will provide health care to Mississippians, including the indigent. In spite of modest economic growth, Mississippi tax collections remain below budgeted projections. Currently, the focus in Mississippi is reducing spending rather than increasing tax revenue to close this gap. Growth in future state appropriations to the Medical Center are not expected in the near term, with reductions in appropriations more likely. The majority of the Medical Center’s total revenues come from the Health System. It is critical for the Medical Center to provide the highest quality and most efficient patient care possible. Unexpected financial events have always been and will continue to be a challenge. For example, in December of 2016 we learned our Medicaid Disproportionate Share Hospital (DSH) payment would be drastically reduced. Medical Center management continues to successfully manage the challenge of recruiting and retaining qualified faculty, staff, and trained medical personnel in a very competitive environment. At the same time, costs for medical equipment and supplies continue to grow faster than general inflation. Uncertainty on the national level with the future of the Affordable Care Act creates challenges in strategic and financial planning for the future of the institution. Medical Center management, faculty, and staff are committed to improving the health status of all Mississippians through our missions of education, research, and healthcare. Even while facing the challenges and uncertainties of the health care industry, Medical Center management believes its investment in information technology and strategic planning for targeted growth positions the Medical Center for success.
8

9

10
June 30 June 302016 2015
Assets and Deferred OutflowsCurrent Assets: Cash and Cash Equivalents (note # 2) 195,110,639$ 201,730,129$ Short Term Investments (note # 2) 71,857,734 78,534,473 Accounts Receivable, Net (note # 3) 190,753,570 151,608,382 Student Notes Receivable, Net (note # 4) 615,512 560,544 Inventories 26,151,794 24,916,578 Prepaid Expenses 6,849,049 3,547,415 Other Current Assets 9,031,684 515,000
Total Current Assets 500,369,982 461,412,521
Noncurrent Assets: Cash Designated for Capital and Debt Activities (note # 2) 92,274,734 87,369,334 Restricted Cash and Cash Equivalents (note # 2) 57,975,065 86,191,103 Restricted Short Term Investments (note # 2) 2,501,365 1,225,921 Endowment Investments (note # 2) 72,974,850 75,467,735 Other Long Term Investments (note # 2) 42,496,345 37,030,997 Accounts Receivable, Net (note # 3) 4,259,720 4,568,464 Student Notes Receivable, net (note # 4) 6,820,202 6,926,801 Capital Assets, Net (note # 5) 611,916,560 560,605,683
Total Noncurrent Assets 891,218,841 859,386,038
Total Assets 1,391,588,823 1,320,798,559
Deferred Outflows of Resources (note#6) 238,463,586 112,340,347
Total Assets and Deferred Outflows of Resources 1,630,052,409$ 1,433,138,906$
Liabilities, Deferred Inflows and Net Position
Current Liabilities: Accounts Payable and Accrued Liabilities (note # 7) 110,720,185$ 99,762,168$ Unearned Revenues (note # 8) 16,340,417 14,229,300 Accrued Leave Liabilities - Current Portion (note # 9) 4,394,887 4,277,538 Long Term Liabilities - Current Portion (note # 9) 10,791,690 10,409,690 Other Current Liabilities 22,837,974 30,584,361
Total Current Liabilities 165,085,153 159,263,057
Noncurrent Liabilities: Accrued Leave Liabilities (note # 9) 54,312,156 50,770,285 Long Term Liabilities (note # 9) 251,002,988 256,810,679 Net Pension Liability (note # 13) 1,087,561,173 821,435,313 Other Non-Current Liabilities (note # 9) 32,846,322 33,216,985
Total Noncurrent Liabilities 1,425,722,639 1,162,233,262
Total Liabilities 1,590,807,792 1,321,496,319
Deferred Inflows of Resources 25,670,867 119,073,103
Total Liabilities and Deferred Inflows of Resources 1,616,478,659$ 1,440,569,422$
Net Position:
Net Investment in Capital Assets 378,230,555 346,778,255
Restricted for:
Nonexpendable -
Other Purposes 25,636,660 25,033,429
Expendable -
Scholarships and Fellowships 3,492,880 4,049,782
Research 27,739,181 26,807,184
Debt Service 1,101,328 1,082,081
Loans 4,390,355 4,034,988
Other Purposes 63,022,151 66,262,262
Unrestricted (490,039,360) (481,478,497)
Total Net Position 13,573,750$ (7,430,516)$
[Unaudited]
UNIVERSITY OF MISSISSIPPI MEDICAL CENTERSTATEMENT OF NET POSITION
See accompanying notes to financial statements.
11

12
June 30 June 302016 2015
Operating Revenues: Tuition and Fees 30,957,146$ 29,114,499$
Less: Scholarship Allowances (4,908,602) (3,794,006)
Less: Bad Debt Expense (66,076) -
Net Tuition and Fees 25,982,468 25,320,493 Federal Grants and Contracts 42,230,081 41,768,790 State Grants and Contracts 13,547,847 10,896,693 Nongovernmental Grants and Contracts 9,303,049 10,686,486 Sales and Services of Educational Departments 974,901 846,359 Auxiliary Enterprises: Bookstore 2,480,056 2,349,158 Other Auxiliary revenues 1,389,454 3,178,218 Interest Earned on Loans to Students 194,038 107,159 Patient Care Revenues, Net 1,086,205,305 1,043,115,837 Other Operating Revenues 65,318,709 42,867,944
Total Operating Revenues 1,247,625,908 1,181,137,137
Operating Expenses: Salaries and Wages 698,343,090 651,448,954 Fringe Benefits 184,374,220 174,418,213 Net GASB 68 Pension Expense Adjustment 46,321,745 (4,214,627) Travel 5,917,391 5,358,009 Contractual Services 170,535,434 164,720,851 Utilities 11,998,884 14,772,452 Scholarships and Fellowships 6,321,715 6,321,367 Commodities 279,166,712 247,374,287 Depreciation 44,132,768 44,249,006 Other Operating Expenses 155,579 786,082
Total Operating Expenses 1,447,267,538 1,305,234,594
Operating Loss (199,641,630) (124,097,457)
Nonoperating Revenues (Expenses): State Appropriations 185,663,575 189,256,003 Gifts and Grants 7,305,548 11,495,454 Investment Income (Loss), Net of Investment Expense 3,710,895 3,801,785 Interest Expense on Capital Asset-Related Debt (11,037,850) (11,869,113) Other Nonoperating Revenues - 15,931
Total Nonoperating Revenues (Expenses), Net 185,642,168 192,700,060
Income Before Other Revenues, Expenses, Gains and Losses (13,999,462) 68,602,603
Capital Grants and Gifts 13,636,792 10,710,764 State Appropriations Restricted for Capital Purposes 22,195,345 5,395,245 Additions to Permanent Endowments 98,231 214,133 Other Deletions (926,640) (2,334,432)
Change in Net Position 21,004,266 82,588,313
Net Position
Net Position - Beginning of Year, as Adjusted (note # 1) (7,430,516) (90,018,829)
Net Position - End of Year 13,573,750$ (7,430,516)$
See accompanying notes to financial statements.
[Unaudited]
UNIVERSITY OF MISSISSIPPI MEDICAL CENTERSTATEMENT OF REVENUES, EXPENSES AND CHANGES IN NET POSITION
13

14
June 30 June 302016 2015
Operating Activities: Tuition and Fees 26,206,226$ 25,294,338$ Grants and Contracts 66,847,181 67,886,022 Sales and Services of Educational Departments 976,772 769,405 Payments to Suppliers (455,743,300) (411,785,387) Payments to Employees for Salaries and Benefits (872,601,399) (819,304,208) Payments for Utilities (11,998,844) (15,032,452) Payments for Scholarships and Fellowships (6,321,715) (6,321,367) Loans Issued to Students (1,559,546) (1,865,184) Collection of Loans to Students 1,656,097 1,824,731 Auxiliary Enterprise Charges: Bookstore 2,469,110 2,479,016 Other Auxiliary Enterprises 1,390,120 3,177,508 Patient Care Services 1,042,311,163 1,043,904,871 Interest Earned on Loans to Students 194,038 107,159 Other Receipts 57,584,722 44,681,435 Other Payments (155,579) (398,117)
Net Cash Used in Operating Activities (148,744,954) (64,582,230)
NonCapital Financing Activities: State Appropriations 186,619,567 188,234,396 Gifts and Grants for Other Than Capital Purposes 7,305,548 11,495,454 Private Gifts for Endowment Purposes 98,231 214,133 Federal Loan Program Receipts 32,687,768 32,690,189 Federal Loan Program Disbursements (32,688,758) (32,682,088) Other Sources - 15,931 Other Uses (176,885) (712,648)
Net Cash Provided by Noncapital Financing Activities 193,845,471 199,255,367
Capital and Related Financing Activities: Cash Paid for Capital Assets (74,439,468) (59,757,733) Capital Grants and Contracts Received 8,447,094 10,609,743 Proceeds from Sales of Capital Assets 966,450 3,935 Principal Paid on Capital Debt and Leases (5,355,000) (5,150,000) Interest Paid on Capital Debt and Leases (11,985,543) (11,853,629)
Net Cash Used in Capital and Related Financing Activities (82,366,467) (66,147,684)
Cash Flows from Investing Activities: Proceeds from Sales and Maturities of Investments 159,287,445 129,980,736 Interest Received on Investments 1,866,993 9,584,678 Purchases of Investments (153,818,616) (140,740,501)
Net Cash Provided by (Used in) Investing Activities 7,335,822 (1,175,087)
Net Change in Cash and Cash Equivalents (29,930,128) 67,350,366
Cash and Cash Equivalents - Beginning of the Year 375,290,566 307,940,200
Cash and Cash Equivalents - End of the Year 345,360,438$ 375,290,566$
UNIVERSITY OF MISSISSIPPI MEDICAL CENTERSTATEMENT OF CASH FLOWS
[Unaudited]
See accompanying notes to financial statements.
15

16

June 30 June 30
2016 2015
RECONCILIATION OF OPERATING LOSS TO NET CASH USED IN OPERATING ACTIVITIES
Operating Loss (199,641,630) (124,097,457)
Adjustments to Reconcile Operating Loss to Net Cash Used in Operating Activities: Depreciation Expense 44,132,768 44,249,006 Self-insured Claims Expense 5,533,396 3,864,484 Bad Debt Expense 151,111,702 112,810,256 Changes in Assets and Liabilities: (Increase) Decrease in Assets: Receivables, Net (186,639,218) (114,757,627) Loans to Students 529,984 475,587 Inventories (1,235,216) (1,260,179) Prepaid Expenses (3,548,337) 355,832 Other Assets (8,516,684) 824,652 Increase (Decrease) in Liabilities: Accounts Payable and Accrued Liabilities 10,717,010 9,522,481 Unearned Revenues 2,111,117 1,621,092 Accrued Leave Liabilitiy 3,659,220 3,121,156 Net Pension Liability 46,321,745 (4,214,627) Other Liabilities (13,280,811) 2,903,114
Total Adjustments 50,896,676 59,515,227
Net Cash Used in Operating Activities (148,744,954) (64,582,230)
RECONCILIATION OF CASH AND CASH EQUIVALENTS TO THE STATEMENT OF NET POSITION
Cash and Cash Equivalents Classified as Current Assets 195,110,639 201,730,129 Cash and Cash Equivalents Classified as Noncurrent Assets 150,249,799 173,560,437
345,360,438 375,290,566
NON-CASH TRANSACTIONS 1.) Unrealized gain/(loss) on fair value of investments 1,714,080$ (5,761,625)$ 2.) Bureau of Buildings and Grounds - construction in progress and buildings 22,195,345 5,395,245 3.) Donation of capital assets 159,984 101,021
See accompanying notes to financial statements.
[Unaudited]
UNIVERSITY OF MISSISSIPPI MEDICAL CENTERSTATEMENT OF CASH FLOWS
17

18

NOTES TO THE FINANCIAL STATEMENTS
Note 1 – Summary of Significant Accounting Policies
Nature of Operations – As the only academic health center in the State of Mississippi, the University of Mississippi Medical Center (Medical Center) is dedicated to the education and training of health care professionals, research, patient care, and public service.
Reporting Entity – The Mississippi Constitution was amended in 1943 to create a Board of Trustees of State Institutions of Higher Learning (Board). This constitutional Board provides management and control of Mississippi’s system of universities. The Medical Center is a member of the State of Mississippi of Institutions of Higher Learning.
The current twelve Board members were appointed by the Governor and approved by the Senate for twelve year terms as follows: one from each of the seven congressional districts, one from each of the three Supreme Court Districts, and two appointed from the state-at-large. The Mississippi Constitution was amended in 2003 to change the length of terms and appointment districts for Board members. New appointments will occur from three current Supreme Court districts for terms of nine years.
The Medical Center’s financial statements include the accounts of the University of Mississippi Medical Center Educational Building Corporation (MCEBC), an educational building corporation and a nonprofit corporation incorporated in the State of Mississippi established in accordance with Section 37-101-61 of the Mississippi Code Annotated of 1972. The purpose of this corporation is for the acquisition, construction, and equipping of facilities and land for the Medical Center. In accordance with Governmental Accounting Standards Board Statement (GASB) No. 61, The Financial Reporting Entity: Omnibus, this educational building corporation is deemed to be a material component unit of the Medical Center and is reported as a blended component unit. See Note 14 for detailed MCEBC activities.
The State of Mississippi Institutions of Higher Learning is considered a component unit of the State of Mississippi reporting entity.
Basis of Presentation – The financial statements have been prepared in accordance with U.S. generally accepted accounting principles as prescribed by the GASB. The Medical Center’s financial statements follow the “business-type activities” reporting which provides a comprehensive one-look at the Medical Center’s financial activities.
Basis of Accounting – The financial statements of the Medical Center have been prepared on the accrual basis whereby all revenues are recorded when earned and all expenses are recorded when an obligation has been incurred. All significant intra-agency transactions have been eliminated.
Grant and contract revenues, which are received or receivable from external sources, are recognized as revenues to the extent of related expenses or satisfaction of eligibility requirements. State appropriations are recognized as nonoperating revenues when eligibility requirements are satisfied.
19

Note 1 – Summary of Significant Accounting Policies (continued)
Use of Estimates – The preparation of financial statements in conformity with U.S. generally accepted accounting principles requires management to make estimates and assumptions that affect the reported amounts of assets and liabilities and disclosure of contingent assets and liabilities at the date of the financial statements and the reported amounts of revenues and expenses during the reporting period. Actual results could differ from those estimates.
Significant estimates also include the determination of allowances for uncollectible accounts and contractual adjustments and estimated third-party payor settlements, included as other current assets and as other current liabilities, relating to the Medical Center’s patient services. In addition, laws and regulations governing the Medicare and Medicaid programs are extremely complex and subject to interpretation. As a result, there is at least a reasonable possibility that recorded estimates associated with these programs could change by a material amount in the near term.
Included in other non-current liabilities are unpaid claim liabilities relating to the Medical Center’s tort claim fund. The liabilities for these unpaid claims are determined using both evaluations of each claim and statistical analyses and represent the estimated ultimate net cost of all claims and expenses incurred through the end of the reporting period. The determinations of claims payable include estimates that are particularly susceptible to change in the near term. Management believes that liabilities established for these unpaid claims at June 30, 2016 and 2015 are adequate to cover the ultimate net cost of claims, but these liabilities are necessarily based upon estimates and, accordingly, the amount ultimately paid will be more or less than such estimates. The methods for making such estimates and for establishing the resulting liabilities are continually reviewed, and any adjustments are reflected in operations currently.
The Medical Center’s investments are invested in various types of investment securities and in various companies within various markets. Investment securities are exposed to several risks, such as interest rate, market and credit risks. Due to the level of risk associated with certain investment securities, it is at least reasonably possible that changes in the values of investment securities will occur in the near term and that such changes could materially affect the amounts reported in the Medical Center’s financial statements.
Cash Equivalents – The Medical Center considers all highly liquid investments with an original maturity of three months or less to be cash equivalents.
Short-term Investments – Short-term investments are investments that are not cash equivalents but mature within the next fiscal year.
Accounts Receivable, Net – Accounts receivable consist of patient fees and tuition and fee charges to students. Accounts receivable also include amounts due from federal and state governments, and non-governmental sources, in connection with reimbursement of allowable expenses made pursuant to the Medical Center’s grants and contracts. Accounts receivable are recorded net of an allowance for doubtful accounts.
20

Note 1 – Summary of Significant Accounting Policies (continued)
Student Notes Receivable, Net – Student notes receivable consist of federal, state, and institutional loans made to students for the purpose of paying tuition and fee charges. Loan balances expected to be paid during the next fiscal year are presented on the statement of net position as current assets. Those balances that are either in deferment status or expected to be paid back beyond the next fiscal year are presented as noncurrent assets on the statement of net position.
Inventories – Inventories consist of various hospital inventories, dental school gold, central supply inventories, auxiliary inventories, printing, and storeroom inventories. These inventories are generally valued at the lower of cost or market, on either the first-in, first-out (FIFO) basis or the average cost basis.
Prepaid Expenses – Recorded items consist of expenditures that are related to projects, programs, activities, or revenues of future fiscal periods.
Restricted Cash and Cash Equivalents, and Restricted Short-term Investments – Cash and cash equivalents, and short-term investments that are externally restricted to make debt service payments, maintain sinking or reserve funds, or to purchase or construct capital or other noncurrent assets, are classified as noncurrent assets in the statement of net position.
Endowment Investments – Endowment investments are generally subject to the restrictions of donor gift instruments. They include donor restricted endowments, which are funds received from a donor with the restrictions that only the income is to be utilized or for which the donor has stipulated that the principal may be expended only after a stated period or upon occurrence of a certain event, and funds functioning as endowments, which are funds established by the governing board to function like an endowment fund but may be fully expended at any time at the discretion of the governing board.
Investments – Substantially all investments are reported at fair value. Unrealized gains (losses) on the carrying value of investments are reported as a component of investment income in the statements of revenues, expenses and changes in net position. Investments in partnerships for which there are no quoted market prices are valued at net asset value.
Capital Assets – Capital assets are recorded at cost at the date of acquisition, or, if donated, at fair market value at the date of donation. For movable property, the Medical Center’s capitalization policy includes all items with a unit cost of $5,000 or more and an estimated useful life greater than one year. Renovations to buildings and improvements other than buildings that significantly increase the value or extend the useful life of the structure are capitalized. Routine repairs and maintenance are charged to operating expense in the year in which the expense was incurred. Depreciation is computed using the straight-line method over the estimated useful life of the asset and is not allocated to the functional expenditure categories. The Medical Center uses the composite method for library book depreciation if the books are considered to have a useful life of greater than one year.
21
Note 1 – Summary of Significant Accounting Policies (continued)
Capital Assets (continued) – The Medical Center is subject to federal cost reporting requirements, and uses capitalization and depreciation policies of the Centers for Medicare and Medicaid Services (CMS) to ensure compliance with federal regulations. These capitalization policies include recognizing one-half year of depreciation in the year of acquisition and in the final year of useful life. See Note 5 for additional details concerning useful life, salvage values, and capitalization thresholds. Expenditures for construction in progress are capitalized as incurred. Interest expense relating to construction is capitalized net of interest income earned on resources set aside for this purpose if material.
Deferred Inflows and Outflows – The Medical Center has deferred inflows of resources. The deferred inflows or resources are an acquisition of net assets by the Medical Center that are applicable to a future reporting period and include pension related deferred inflows.
The Medical Center has deferred outflows of resources. The deferred outflows of resources are consumption of net assets by the Medical Center that are applicable to a future reporting period and in the unamortized amounts for losses on the refunding of bond debt and pension related deferred outflows.
Deferred inflows and outflows related to pensions are related to the implementation of GASB 68, which was effective at the beginning of fiscal year 2015. See Note 13.
Net Pension Liability – For purposes of measuring the net pension liability, deferred outflows of resources and deferred inflows of resources related to pensions, and pension expense, information about the fiduciary net position of the Public Employees’ Retirement System of Mississippi (PERS) and additions to/deductions from PERS’s fiduciary net position have been determined on the same basis as they are reported by PERS. For this purpose, benefit payments (including refunds of employee contributions) are recognized when due and payable in accordance with the benefit terms. Investments are reported at fair value.
Accounts Payable and Accrued Liabilities – Recorded items consist of amounts owed to vendors, contractors, or accrued amounts such as interest, wages, and salaries.
Compensated Absences/Accrued Leave – Twelve-month employees earn and accrue annual personal leave at a rate of 12 hours per month for zero to three years of service; 14 hours per month for three to eight years of service; 16 hours per month for eight to fifteen years of service; and 18 hours per month for fifteen years of service or more. There is no requirement that annual leave be taken, and there is no maximum accumulation. At termination, employees are paid for up to 240 hours of accumulated annual leave.
Unearned Revenues – Unearned revenues include amounts received for tuition and fees and certain auxiliary activities prior to the end of the fiscal year but related to the subsequent accounting period. Unearned revenues also include amounts received from grant and contract sponsors that have not yet been earned.
Noncurrent Liabilities – Noncurrent liabilities include: (1) principal amounts of revenue bonds payable and notes payable; (2) estimated amounts for accrued compensated absences and other liabilities that will not be paid within the next fiscal year; (3) net pension liability and (4) other liabilities, that, although payable within one year, are to be paid from funds that are classified as noncurrent assets.
22
Note 1 – Summary of Significant Accounting Policies (continued)
Income Taxes – As a state institution of higher learning, the income of the Medical Center is generally exempt from federal and state income taxes under Section 115(1) of the Internal Revenue Code; however, income generated from activities unrelated to the Medical Center’s exempt purpose is subject to income taxes under Internal Revenue Code Section 511 (a)(2)(B).
Classification of Revenues and Expenditures – The Medical Center has classified its revenues and expenditures as either operating or non-operating according to the following criteria:
Operating revenues and expenses – Operating revenues and expenses have the characteristics of exchange transactions, such as (1) student tuition and fees, net of scholarship discounts and allowances; (2) sales and services of auxiliary enterprises; (3) most federal, state, and local grants and contracts; (4) patient care services; and (5) interest on institutional student loans. Examples of operating expenses include (1) employee compensation, benefits, and related expense; (2) scholarships and fellowships, net of scholarship discounts and allowances; (3) utilities, commodities (supplies), and contractual services; (4) professional fees; and (5) depreciation expense related to certain capital assets.
Non-operating revenues and expenses – Non-operating revenues and expenses have the characteristics of non-exchange transactions. Examples of non-operating revenues include state appropriations, gifts, investment income, and other revenue sources that are defined as nonoperating revenues by GASB Statement No. 9, Reporting Cash Flows of Proprietary and Non-expendable Trust Funds and Governmental Entities That Use Proprietary Fund Accounting, and GASB Statement No. 34. Examples of non-operating expenses include interest on capital asset related debt and bond expenses.
Auxiliary Enterprise Activities – Auxiliary enterprises typically exist to furnish goods or services to students, faculty, or staff, and that charge a fee directly related to, although not necessarily equal to, the cost of the goods or services. One distinguishing characteristic of auxiliary enterprises is that they are managed as essentially self-supporting activities.
Auxiliary enterprises include bookstore, student union, and vending operations. The general public may be served incidentally by auxiliary enterprises.
Patient Care Revenues – The Medical Center’s hospital and clinical service revenues are reported at the estimated net realizable amounts from patients, third-party payors, and others for services rendered, including contractual allowances and estimated retroactive adjustments under reimbursement programs with third-party payors, less an allowance for doubtful accounts. Retroactive adjustments are accrued in future periods, as final settlements are determined.
Inpatient acute care services and substantially all outpatient services rendered to Medicare and Medicaid program beneficiaries are paid at prospectively determined rates per discharge. These rates vary according to a patient classification system that is based on clinical, diagnostic, and other factors. The Medical Center is reimbursed for certain services at tentative rates with final settlement determined after submission of annual cost reports and audits thereof by the Medicare and Medicaid intermediaries.
23

Note 1 – Summary of Significant Accounting Policies (continued)
Patient Care Revenues (continued) – Revenue from the Medicare and Medicaid programs accounted for approximately 28.5% and 31.2 %, respectively, of the Medical Center’s net patient service revenues for the year ended June 30, 2016, and approximately 27.2% and 31.7%, respectively, for the year ended June 30, 2015. Laws and regulations governing the Medicare and Medicaid programs are extremely complex and subject to interpretation. As a result, there is at least a reasonable possibility that recorded estimates will change by a material amount in the near term.
The Medical Center also entered into payment agreements with certain commercial insurance carriers, health maintenance organizations and preferred provider organizations. The basis for payment to the Medical Center under these agreements includes prospectively determined rates per discharge, discounts from established charges, and prospectively determined daily rates.
Electronic Health Record Incentive Program – The Centers for Medicare & Medicaid Services (CMS) have implemented provisions of the American Recovery and Reinvestment Act of 2009 that provide incentive payments for the meaningful use of certified electronic health record (EHR) technology. CMS has defined meaningful use as meeting certain objectives and clinical quality measures based on current and updated technology capabilities over predetermined reporting periods as established by CMS. The Medicare EHR incentive program provides annual incentive payments to eligible professionals, eligible hospitals, and critical access hospitals, as defined, that are meaningful users of certified EHR technology. The Medicaid EHR incentive program provides annual incentive payments to eligible professionals and hospitals for efforts to adopt, implement, and meaningfully use certified EHR technology. The Medical Center utilizes a grant accounting model to recognize EHR incentive revenues. The Medical Center records EHR incentive revenue ratably throughout the incentive reporting period when it is reasonably assured that it will meet the meaningful use objectives for the required reporting period and that the grants will be received. The EHR reporting period is based on the federal fiscal year, which runs from October 1 through September 30. The Medical Center received and recorded $4,793,693 and $1,570,796 for EHR incentive revenue for the fiscal year ending June 30, 2016 and 2015. This amount has been included in other operating revenues.
Hospital Reimbursement – The University Hospitals and Health System (UHHS) Medicare cost reports have been audited and settled by the fiscal intermediary through the cost reports filed for the year ended June 30, 2012 for the Jackson Campus and June 30, 2013 for Holmes County Hospital. No cost reports for UMMC Grenada have been audited.
During FY 2009, UHHS received notification that Medicare had designated the Recovery Audit Contractor (RAC) for the region that includes the State of Mississippi. The RAC program is intended to identify and recover improper Medicare payments made to health care providers as far back as three years from the current date. While UHHS believe all claims submitted to Medicare are supported by the services provided, the RAC could make adjustments based on differing interpretation of the regulations. Audits of Medicare claims began in FY 2010 and are expected to continue in the future. Based on recent audit experiences and reviews of planned audit activities, the reserve balance at the end of fiscal year 2016 was $2.25 million.
24
Note 1 – Summary of Significant Accounting Policies (continued)
Hospital Reimbursement (continued) – Over seven years ago, the Division of Medicaid (DOM) notified all providers in the State of Mississippi of a change in the methodology used to reimburse outpatient services. DOM had adopted a payment methodology for outpatient services at a fixed cost to charge ratio that was increased each year by an inflationary index. At that time, DOM issued letters to all providers of an updated reimbursement percentage based on more current cost data. They also stated they intend to apply the revised methodology back to October 1, 2005. As a result of this change, UHHS recorded a reserve in the amount of $12.7 million as of June 30, 2008, as an estimate of potential outpatient claims adjustments to be made by DOM. Other reserves have been established each fiscal year for anticipated adjustments to estimated verses final payment rates for both inpatient and outpatient services. Since that time UHHS has repaid approximately $21.8 million through FY 2015 and repaid $3.4 million in FY 2016 to DOM for these and other claims adjustments. At June 30, 2016, UHHS maintains a reserve of approximately $12.8 million for Medicaid rate recalculations and other adjustments for prior fiscal years.
Scholarship Discounts and Allowances – Financial aid to students is reported in the financial statements under the alternative method as prescribed by the National Association of College and University Business Officers (NACUBO). Certain aid, such as loans, funds provided to students as awarded by third parties and Federal Direct Lending, is accounted for as a third party payment (credited to the student’s account as if the student made the payment). All other aid is reflected in the financial statements as scholarship allowances, which reduce operating revenues. The amount reported as operating expenses represents the portion of aid that was provided to the student in the form of cash.
Scholarship allowances represent the portion of aid provided to the student in the form of reduced tuition. Under the alternative method, these amounts are computed by allocating the cash payments to students, excluding payments for services, on the ratio of total aid to the aid not considered to be third party aid.
Net Position – The IHL System adopted GASB Statement No. 63, Financial Reporting for Deferred Outflows of Resources, Deferred Inflows of Resources, and Net Position in fiscal year 2013, and, as a result, began reporting equity balances (previously referred to as Net Assets) as “Net Position”. Net Position represents the difference between assets and liabilities in a statement of financial position and is displayed in three components – net investment in capital assets, restricted (distinguishing between major categories of restrictions), and unrestricted.
Net Investment in Capital Assets reflect the Medical Center’s total investment in capital assets, net of outstanding debt obligations related to those capital assets. To the extent debt has been incurred but not yet expended for capital assets, such debt is excluded from the calculation of net investment in capital assets.
Restricted, nonexpendable net position consists of endowment and similar type funds which donors or other outside sources have stipulated, as a condition of the gift instrument, the principal is to be maintained inviolate and in perpetuity, and invested for the purpose of producing present and future income, which may either be expended or added to principal.
25

Note 1 – Summary of Significant Accounting Policies (continued)
Net Position (continued) – Restricted, expendable net position includes resources that the Medical Center is legally or contractually obligated to spend in accordance with restrictions imposed by external parties.
Unrestricted net position represents resources derived from student tuition and fees, state appropriations, net patient service revenue, and sales and services of educational activities and auxiliary enterprises. Auxiliary enterprises are substantially self-supporting activities that provide services for students, faculty, and staff. While unrestricted net position may be designated for specific purposes by action of management or the Board, they are available for use at the discretion of the governing board to meet current expenses for any purpose. Substantially all unrestricted net position is designated for academic and research programs and initiatives, and capital programs.
When an expense is incurred that can be paid using either restricted or unrestricted resources, the Medical Center addresses each situation of a case-by-case basis prior to determining the resources to be used to satisfy the obligation.
New Accounting Standards – The Medical Center adopted GASB Statement No. 68, Accounting and Financial Reporting for Pensions, for the year ended June 30, 2015. The Statement established standards for measuring and recognizing liabilities, deferred outflows of resources, deferred inflows of resources, and expenses. For defined benefit pensions, this Statement identifies the methods and assumptions that should be used to project benefit payments, discount projected benefit payments to their actuarial present value, and attribute that present value to periods of employee service. As a result, costs related to the pension plan previously expensed were adjusted through an adjustment to net position as of July 1, 2013.
The implementation of this standard resulted in a net pension liability and the effect of adoption is a reduction of beginning net position. The following schedule summarizes the impact on net position for fiscal year 2014.
Net position - beginning of period, as previously reported 716,821,918$ Less: proportionate share of net pension liability (902,224,103)
Beginning of period, as adjusted (185,402,185) Changes in net position, as previously reported 30,253,709
Impact of GASB No. 68 implementation 65,129,647
Change in net position, as adjusted 95,383,356
Net position - end of period, as adjusted (90,018,829)$
During fiscal year 2015, the Medical Center adopted GASB Statement No. 69, Government Combinations and Disposals of Government Operations. The objective of this Statement is to improve financial reporting by addressing accounting and financial reporting for government combinations and disposals of government operations. The term government combinations is used in this Statement to refer to a variety of arrangements including mergers and acquisitions.
26

Note 2 – Cash and Investments
Policies
Cash, Cash Equivalents and Short-term Investments – Investment policies as set forth by the IHL Board of Trustees policy and state statute authorize the Medical Center to invest in demand deposits and interest-bearing time deposits such as savings accounts, certificates of deposit, money market funds, U.S. Treasury bills and notes, and repurchase agreements.
The collateral for public entities’ deposits in financial institutions is held in the name of the State Treasurer under a program established by the Mississippi State Legislature and is governed by State statute (Section 27-105-5, MS Code Ann. 1972). Under this program, the Medical Center’s funds are protected through a collateral pool administered by the State Treasurer. Financial institutions holding deposits of public funds must pledge securities as collateral against these deposits. In the event of failure of a financial institution, securities pledged by that institution would be liquidated by the State Treasurer to replace the public deposits not covered by the Federal Deposit Insurance Corporation.
Investments – Investment policies at the Medical Center are governed by State statute (Section 27-105-33, Mississippi Code Annotated, 1972) and the Uniform Prudent Management of Institutional Funds Act (UPMIFA) as adopted by the State of Mississippi in 2012. Under UPMIFA, the Medical Center may appropriate for spending as much of the endowment as the institution deems prudent for the uses, benefits, purposes and duration for which the particular endowment fund was established, subject to evaluation of several specific factors including general economic conditions and the fund’s purpose. The Medical Center has adopted investment and spending policies for endowments as recommended by the University’s Joint Committee on Investments. Substantially all investments are reported at fair value.
27
Note 2 – Cash and Investments (continued)
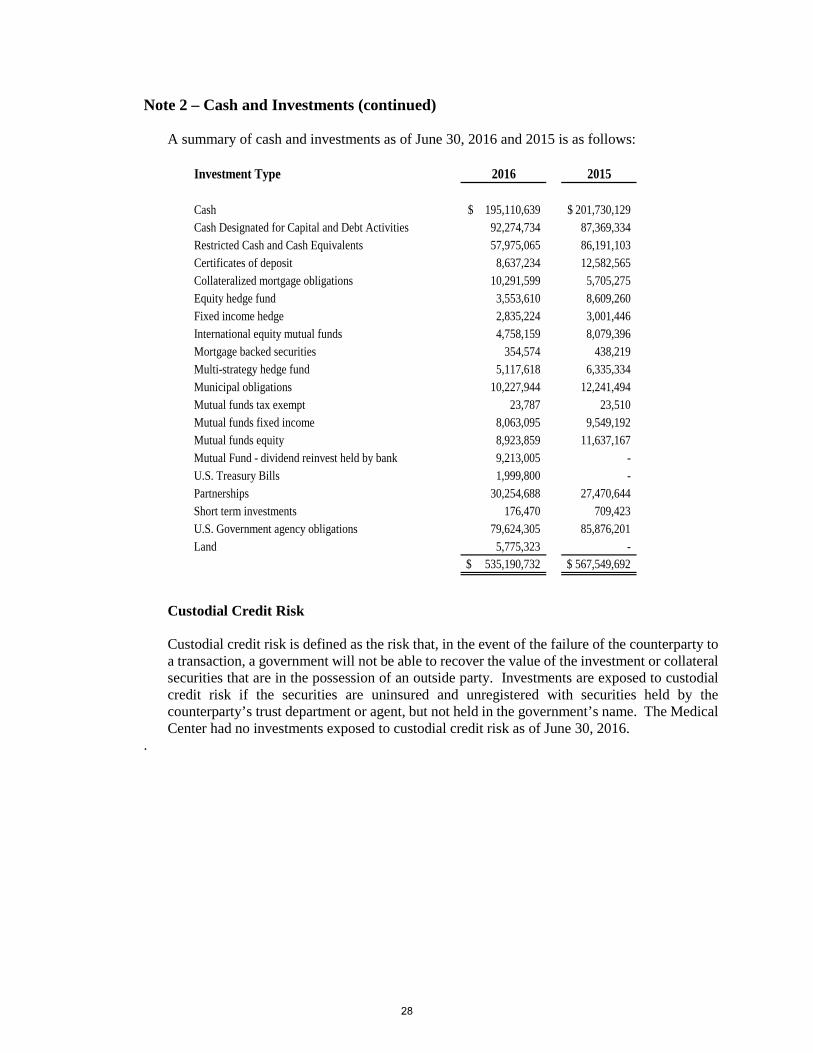
A summary of cash and investments as of June 30, 2016 and 2015 is as follows:
Investment Type 2016 2015
Cash 195,110,639$ 201,730,129$ Cash Designated for Capital and Debt Activities 92,274,734 87,369,334 Restricted Cash and Cash Equivalents 57,975,065 86,191,103 Certificates of deposit 8,637,234 12,582,565 Collateralized mortgage obligations 10,291,599 5,705,275 Equity hedge fund 3,553,610 8,609,260 Fixed income hedge 2,835,224 3,001,446 International equity mutual funds 4,758,159 8,079,396 Mortgage backed securities 354,574 438,219 Multi-strategy hedge fund 5,117,618 6,335,334 Municipal obligations 10,227,944 12,241,494 Mutual funds tax exempt 23,787 23,510 Mutual funds fixed income 8,063,095 9,549,192 Mutual funds equity 8,923,859 11,637,167 Mutual Fund - dividend reinvest held by bank 9,213,005 -U.S. Treasury Bills 1,999,800 -Partnerships 30,254,688 27,470,644 Short term investments 176,470 709,423 U.S. Government agency obligations 79,624,305 85,876,201 Land 5,775,323 -
535,190,732$ 567,549,692$
Custodial Credit Risk
Custodial credit risk is defined as the risk that, in the event of the failure of the counterparty to a transaction, a government will not be able to recover the value of the investment or collateral securities that are in the possession of an outside party. Investments are exposed to custodial credit risk if the securities are uninsured and unregistered with securities held by the counterparty’s trust department or agent, but not held in the government’s name. The Medical Center had no investments exposed to custodial credit risk as of June 30, 2016.
.
28

Note 2 – Cash and Investments (continued)
Interest Rate Risk
Interest rate risk is defined as the risk a government may face should interest rate variances adversely affect the fair value of investments. As of June 30, 2016 and 2015, the Medical Center had the following investments subject to interest rate risk:
Investment Type Fair Value Less than 1 1 - 5 6 - 10 More than 10
Collateralized mortgage obligations 10,291,599$ -$ -$ -$ 10,291,599$ Mortgage backed securities 354,574 - - - 354,574 Municipal obligations 10,227,944 501,565 6,200,999 1,580,740 1,944,640 Mutual funds - fixed income 8,063,095 - 8,047,225 7,896 7,974 U. S. Government agency obligations 79,624,305 63,220,500 3,768,199 12,635,606 -
Total 108,561,517$ 63,722,065$ 18,016,423$ 14,224,242$ 12,598,787$
Investment Type Fair Value Less than 1 1 - 5 6 - 10 More than 10
Collateralized mortgage obligations 5,705,275$ -$ -$ -$ 5,705,275$ Mortgage backed securities 438,219 - - - 438,219 Municipal obligations 12,241,494 1,225,920 5,283,986 3,940,898 1,790,690 Mutual funds - fixed income 9,549,192 - 3,377,426 6,171,766 - U. S. Government agency obligations 85,876,201 58,508,025 10,841,427 10,697,978 5,828,771
Total 113,810,381$ 59,733,945$ 19,502,839$ 20,810,642$ 13,762,955$
2016Years to Maturity
2015Years to Maturity
29
Note 2 – Cash and Investments (continued)
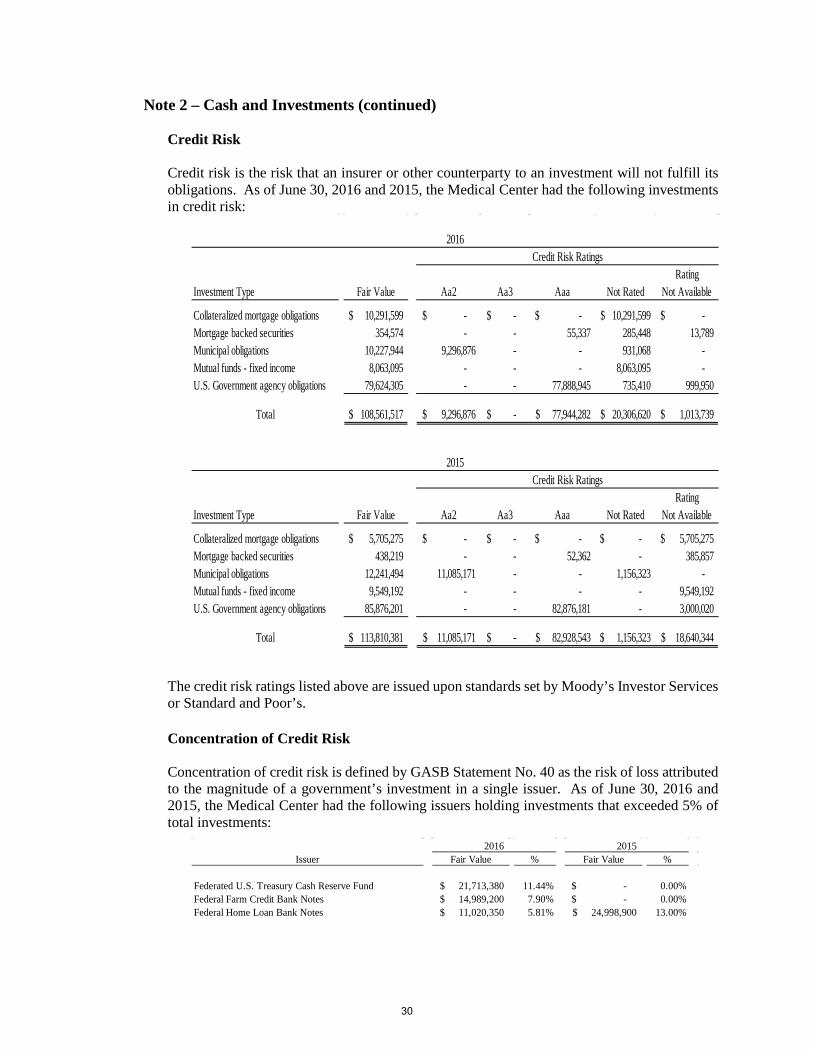
Credit Risk
Credit risk is the risk that an insurer or other counterparty to an investment will not fulfill its obligations. As of June 30, 2016 and 2015, the Medical Center had the following investments in credit risk:
Investment Type Fair Value Aa2 Aa3 Aaa Not RatedRating
Not Available
Collateralized mortgage obligations 10,291,599$ -$ -$ -$ 10,291,599$ -$ Mortgage backed securities 354,574 - - 55,337 285,448 13,789 Municipal obligations 10,227,944 9,296,876 - - 931,068 - Mutual funds - fixed income 8,063,095 - - - 8,063,095 - U.S. Government agency obligations 79,624,305 - - 77,888,945 735,410 999,950
Total 108,561,517$ 9,296,876$ -$ 77,944,282$ 20,306,620$ 1,013,739$
Investment Type Fair Value Aa2 Aa3 Aaa Not RatedRating
Not Available
Collateralized mortgage obligations 5,705,275$ -$ -$ -$ -$ 5,705,275$ Mortgage backed securities 438,219 - - 52,362 - 385,857 Municipal obligations 12,241,494 11,085,171 - - 1,156,323 - Mutual funds - fixed income 9,549,192 - - - - 9,549,192 U.S. Government agency obligations 85,876,201 - - 82,876,181 - 3,000,020
Total 113,810,381$ 11,085,171$ -$ 82,928,543$ 1,156,323$ 18,640,344$
2016Credit Risk Ratings
2015Credit Risk Ratings
The credit risk ratings listed above are issued upon standards set by Moody’s Investor Services or Standard and Poor’s.
Concentration of Credit Risk
Concentration of credit risk is defined by GASB Statement No. 40 as the risk of loss attributed to the magnitude of a government’s investment in a single issuer. As of June 30, 2016 and 2015, the Medical Center had the following issuers holding investments that exceeded 5% of total investments:
Issuer Fair Value % Fair Value %
Federated U.S. Treasury Cash Reserve Fund 21,713,380$ 11.44% -$ 0.00%Federal Farm Credit Bank Notes 14,989,200$ 7.90% -$ 0.00%Federal Home Loan Bank Notes 11,020,350$ 5.81% 24,998,900$ 13.00%
2016 2015
30

Note 2 – Cash and Investments (continued)
Foreign Currency Risk
Foreign currency risk is defined by GASB Statement No. 40 as the risk that changes in exchange rates will adversely affect the fair value of an investment. The Medical Center investment policy requires diversification with respect to currency and country exposure. As of June 30, 2016 and 2015, the Medical Center had the following exposure to foreign currency risk summarized and categorized by currency:
2016 2015
European Euro 256,941$ 1,424,914$
United Kingdom Pounds 568,600 1,098,333
Japan Yen 540,051 1,260,218
Switzerland Francs - 140,559
Canada Dollars - 320,535
Hong Kong Dollars 199,846 199,163
Australia Dollars - 182,618
India Rupee 563,842 654,743
China Renminbi - 179,741
Sweden Krona - 118,271
Singapore Dollars - 49,609
South Africa Rand - 89,691
Denmark Kroner - 58,596
All other currency 623,319 894,132
2,752,599$ 6,671,123$
International Equity Mutual Funds
Fair Value Measurement
GASB No. 72, Fair Value Measurement and Application, enhances comparability of governmental financial statements by requiring fair value measurement for certain assets and liabilities using a consistent definition and accepted valuation techniques. The standard establishes a hierarchy of inputs used to measure fair value that prioritizes the inputs into three categories—Level 1, Level 2, and Level 3 inputs—considering the relative reliability of the inputs. The hierarchy gives the highest priority to unadjusted quoted prices in active markets for identical assets or liabilities (Level 1 measurements) and the lowest priority to measurements involving significant unobservable inputs (Level 3 measurements). The three levels of the fair value hierarchy are as follows:
• Level 1 inputs are quoted (unadjusted) prices in active markets for identical financialassets or liabilities that the Medical Center has the ability to access at the measurementdate;
• Level 2 inputs are inputs other than quoted prices included within Level 1 that areobservable for the financial asset or liability, either directly or indirectly; and
• Level 3 inputs are unobservable inputs for the financial asset or liability.
The level in the fair value hierarchy within which a fair value measurement falls is based on the lowest level input that is significant to the fair value measurement in its entirety. The categorization of investments within the hierarchy is based upon the pricing transparency of the instrument and should not be perceived as the particular investment risk.
31

Note 2 – Cash and Investments (continued)
a Va ue easu e e t
The following tables present the financial assets carried at fair value by level within the valuation hierarchy as of June 30, 2016
and 2015:
2016
Level 1 Level 2 Level 3 Total
Investment strategy:
Fixed income:
U.S. Government securities 81,978,679$ 81,978,679$
Certificates of deposit 8,637,234 8,637,234
Municipal Obligations 10,227,944 10,227,944
Other fixed income securities 10,291,599 10,291,599
Total fixed income - 111,135,456 - 111,135,456
Equities:
Mutual funds 26,223,746 26,223,746
International Equity 4,758,159 4,758,159
Partnerships 30,254,688 30,254,688
Total equities 30,981,905 - 30,254,688 61,236,593
Hedge funds
Equity Hedge Fund 3,553,610 3,553,610
Multi-strategy Hedge fund 5,117,618 5,117,618
Fixed Income Hedge 2,835,224 2,835,224
Land 5,775,323 5,775,323
Other short-term investments 176,470 176,470
Total investments 30,981,905$ 111,311,926$ 47,536,463$ 189,830,294$
2015
Level 1 Level 2 Level 3 Total
Investment strategy:
Fixed income:
U.S. Government securities 86,314,420$ 86,314,420$
Certificates of deposit 12,582,565 12,582,565
Municipal Obligations 12,241,494 12,241,494
Other fixed income securities 5,705,275 5,705,275
Total fixed income - 116,843,754 - 116,843,754
Equities:
Mutual funds 21,209,869 21,209,869
International Equity 8,079,396 8,079,396
Partnerships 27,470,644 27,470,644
Total equities 29,289,265 - 27,470,644 56,759,909
Hedge funds
Equity Hedge Fund 8,609,260 8,609,260
Multi-strategy Hedge fund 6,335,334 6,335,334
Fixed Income Hedge 3,001,446 3,001,446
Land - -
Other short-term investments 709,423 709,423
Total investments 29,289,265$ 117,553,177$ 45,416,684$ 192,259,126$
32
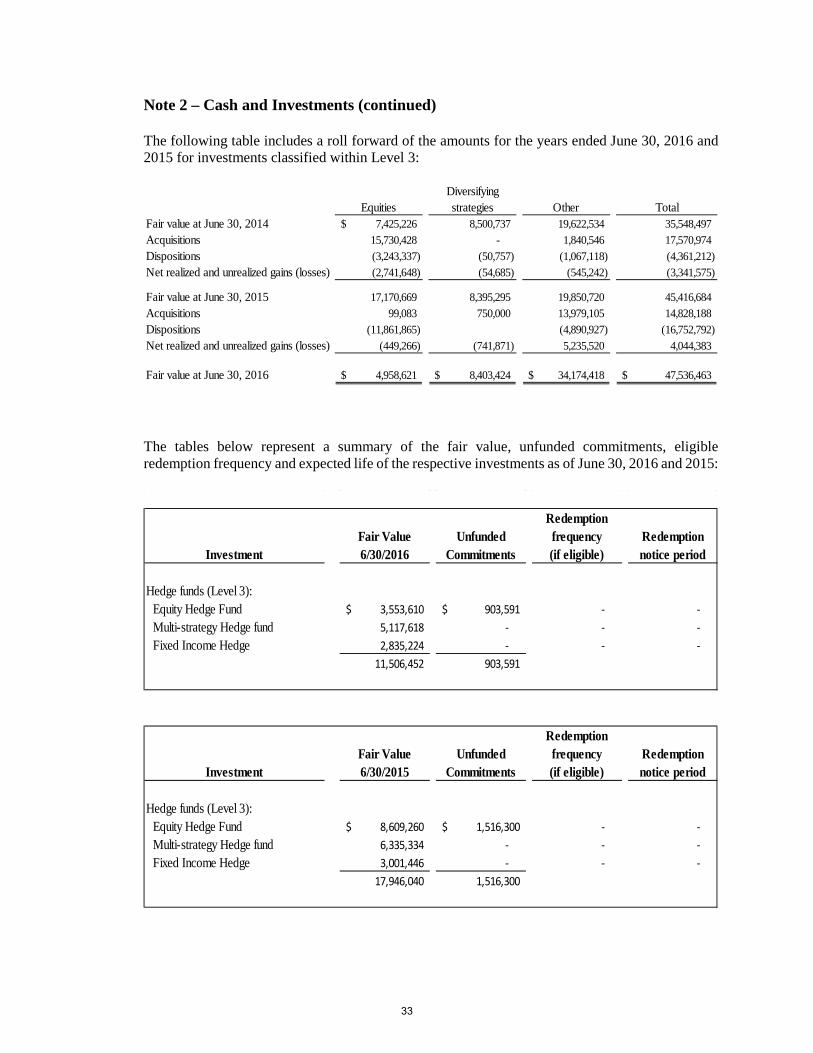
Note 2 – Cash and Investments (continued) The following table includes a roll forward of the amounts for the years ended June 30, 2016 and 2015 for investments classified within Level 3: within Level 3:
EquitiesDiversifying strategies Other Total
Fair value at June 30, 2014 7,425,226$ 8,500,737 19,622,534 35,548,497
Acquisitions 15,730,428 - 1,840,546 17,570,974
Dispositions (3,243,337) (50,757) (1,067,118) (4,361,212)
Net realized and unrealized gains (losses) (2,741,648) (54,685) (545,242) (3,341,575)
Fair value at June 30, 2015 17,170,669 8,395,295 19,850,720 45,416,684
Acquisitions 99,083 750,000 13,979,105 14,828,188
Dispositions (11,861,865) (4,890,927) (16,752,792)
Net realized and unrealized gains (losses) (449,266) (741,871) 5,235,520 4,044,383
Fair value at June 30, 2016 4,958,621$ 8,403,424$ 34,174,418$ 47,536,463$
The tables below represent a summary of the fair value, unfunded commitments, eligible redemption frequency and expected life of the respective investments as of June 30, 2016 and 2015:
InvestmentFair Value6/30/2016
Unfunded Commitments
Redemption frequency(if eligible)
Redemption notice period
Hedge funds (Level 3):Equity Hedge Fund 3,553,610$ 903,591$ - - Multi-strategy Hedge fund 5,117,618 - - - Fixed Income Hedge 2,835,224 - - -
11,506,452 903,591
InvestmentFair Value6/30/2015
Unfunded Commitments
Redemption frequency(if eligible)
Redemption notice period
Hedge funds (Level 3):Equity Hedge Fund 8,609,260$ 1,516,300$ - - Multi-strategy Hedge fund 6,335,334 - - - Fixed Income Hedge 3,001,446 - - -
17,946,040 1,516,300
33
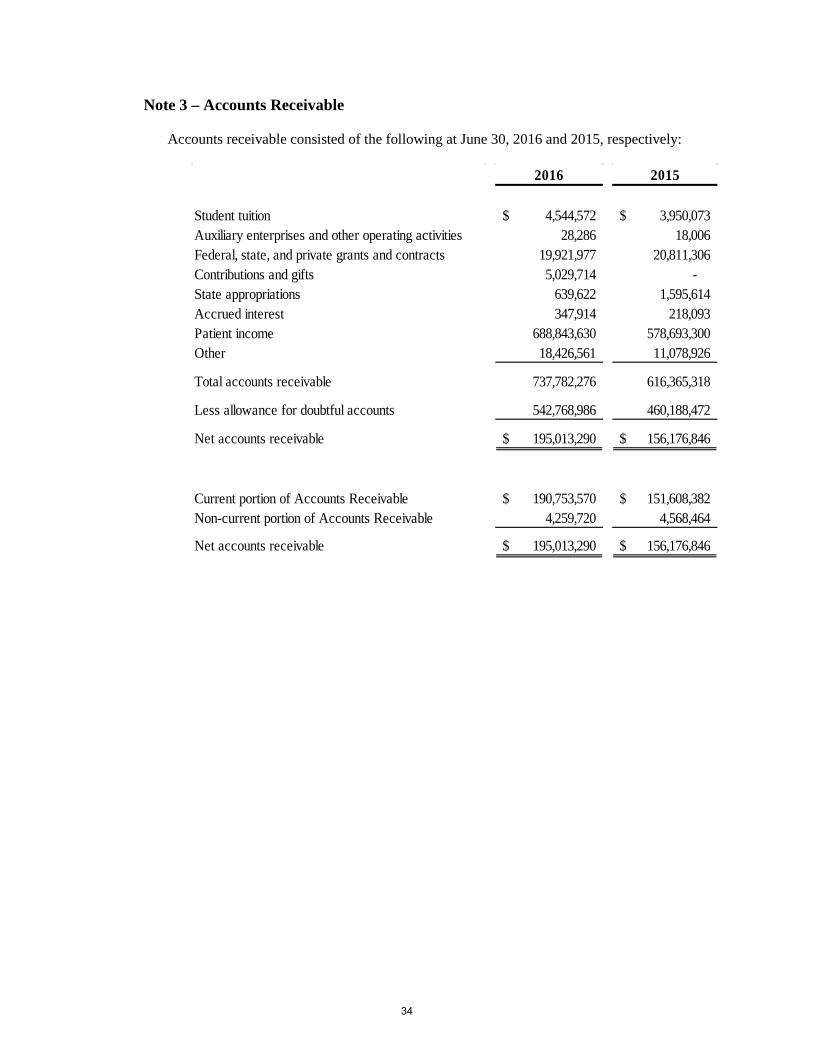
Note 3 – Accounts Receivable
Accounts receivable consisted of the following at June 30, 2016 and 2015, respectively:
2016 2015
Student tuition 4,544,572$ 3,950,073$ Auxiliary enterprises and other operating activities 28,286 18,006 Federal, state, and private grants and contracts 19,921,977 20,811,306 Contributions and gifts 5,029,714 - State appropriations 639,622 1,595,614 Accrued interest 347,914 218,093 Patient income 688,843,630 578,693,300 Other 18,426,561 11,078,926
Total accounts receivable 737,782,276 616,365,318
Less allowance for doubtful accounts 542,768,986 460,188,472
Net accounts receivable 195,013,290$ 156,176,846$
Current portion of Accounts Receivable 190,753,570$ 151,608,382$ Non-current portion of Accounts Receivable 4,259,720 4,568,464
Net accounts receivable 195,013,290$ 156,176,846$
34

Note 4 – Notes Receivable from Students
Notes receivable from students are payable in installments over a period of up to ten years, commencing three to twelve months from the date of separation from the Medical Center. The following is a schedule of interest rates and unpaid balances for the different types of notes receivable held by the Medical Center at June 30, 2016 and 2015, respectively:
Interest Current Non-CurrentRates 2016 Portion Portion
Perkins student loans 3% to 5% 5,842,045$ 270,885$ 5,571,160$ Nursing student loans 3% to 5% 679,498 90,361 589,137 Medical student loans 3% to 5% 169,517 12,772 156,745 Dental student loans 3% to 5% 460,519 39,665 420,854 Institutional loans 0% to 10% 2,253,979 270,219 1,983,760 Total notes receivable 9,405,558 683,902 8,721,656
Less allowance for doubtful accounts 1,969,844 68,390 1,901,454
Net notes receivable 7,435,714$ 615,512$ 6,820,202$
Interest Current Non-CurrentRates 2015 Portion Portion
Perkins student loans 3% to 5% 6,170,985$ 273,334$ 5,897,651$ Nursing student loans 3% to 5% 730,393 84,800 645,593 Medical student loans 3% to 5% 184,033 6,964 177,069 Dental student loans 3% to 5% 449,560 28,572 420,988 Institutional loans 0% to 10% 2,400,571 229,157 2,171,414 Total notes receivable 9,935,542 622,827 9,312,715
Less allowance for doubtful accounts 2,448,197 62,283 2,385,914
Net notes receivable 7,487,345$ 560,544$ 6,926,801$
35
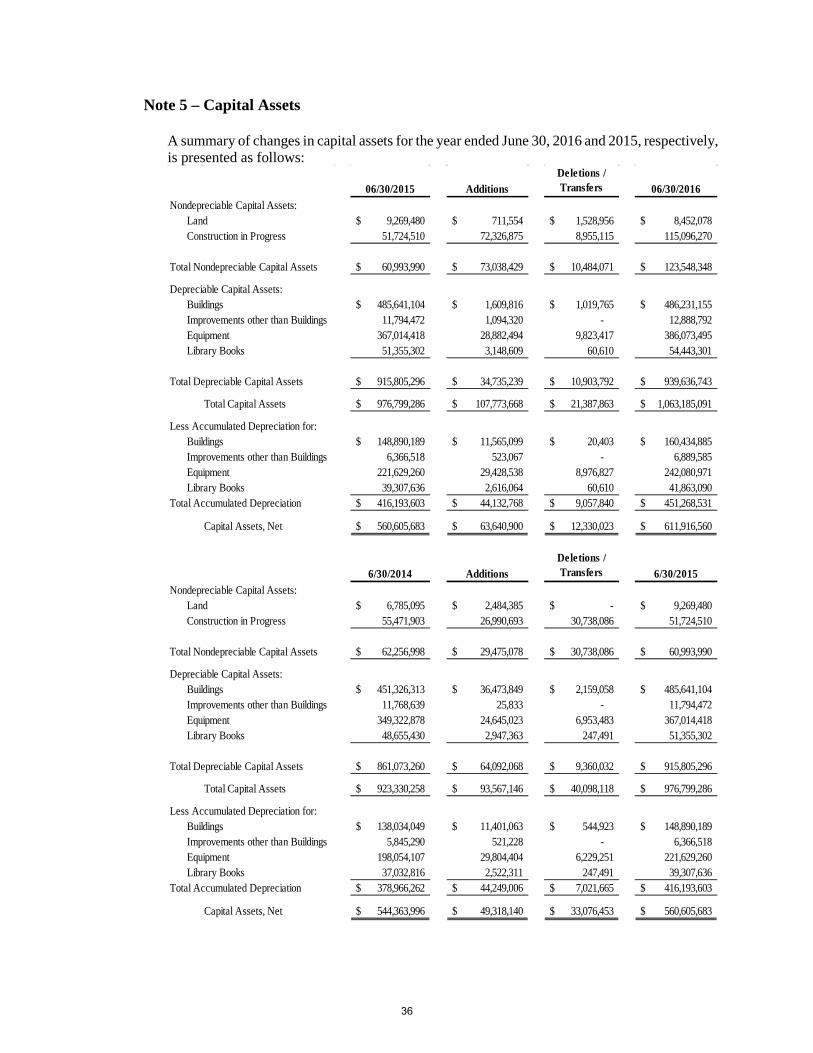
Note 5 – Capital Assets
A summary of changes in capital assets for the year ended June 30, 2016 and 2015, respectively, is presented as follows:
06/30/2015 Additions
Deletions / Transfers 06/30/2016
Nondepreciable Capital Assets:Land 9,269,480$ 711,554$ 1,528,956$ 8,452,078$ Construction in Progress 51,724,510 72,326,875 8,955,115 115,096,270
Total Nondepreciable Capital Assets 60,993,990$ 73,038,429$ 10,484,071$ 123,548,348$
Depreciable Capital Assets:Buildings 485,641,104$ 1,609,816$ 1,019,765$ 486,231,155$ Improvements other than Buildings 11,794,472 1,094,320 - 12,888,792 Equipment 367,014,418 28,882,494 9,823,417 386,073,495Library Books 51,355,302 3,148,609 60,610 54,443,301
Total Depreciable Capital Assets 915,805,296$ 34,735,239$ 10,903,792$ 939,636,743$
Total Capital Assets 976,799,286$ 107,773,668$ 21,387,863$ 1,063,185,091$
Less Accumulated Depreciation for:Buildings 148,890,189$ 11,565,099$ 20,403$ 160,434,885$ Improvements other than Buildings 6,366,518 523,067 - 6,889,585 Equipment 221,629,260 29,428,538 8,976,827 242,080,971Library Books 39,307,636 2,616,064 60,610 41,863,090
Total Accumulated Depreciation 416,193,603$ 44,132,768$ 9,057,840$ 451,268,531$
Capital Assets, Net 560,605,683$ 63,640,900$ 12,330,023$ 611,916,560$
6/30/2014 Additions
Deletions / Transfers 6/30/2015
Nondepreciable Capital Assets:Land 6,785,095$ 2,484,385$ -$ 9,269,480$ Construction in Progress 55,471,903 26,990,693 30,738,086 51,724,510
Total Nondepreciable Capital Assets 62,256,998$ 29,475,078$ 30,738,086$ 60,993,990$
Depreciable Capital Assets:Buildings 451,326,313$ 36,473,849$ 2,159,058$ 485,641,104$ Improvements other than Buildings 11,768,639 25,833 - 11,794,472 Equipment 349,322,878 24,645,023 6,953,483 367,014,418Library Books 48,655,430 2,947,363 247,491 51,355,302
Total Depreciable Capital Assets 861,073,260$ 64,092,068$ 9,360,032$ 915,805,296$
Total Capital Assets 923,330,258$ 93,567,146$ 40,098,118$ 976,799,286$
Less Accumulated Depreciation for:Buildings 138,034,049$ 11,401,063$ 544,923$ 148,890,189$ Improvements other than Buildings 5,845,290 521,228 - 6,366,518 Equipment 198,054,107 29,804,404 6,229,251 221,629,260Library Books 37,032,816 2,522,311 247,491 39,307,636
Total Accumulated Depreciation 378,966,262$ 44,249,006$ 7,021,665$ 416,193,603$
Capital Assets, Net 544,363,996$ 49,318,140$ 33,076,453$ 560,605,683$
36
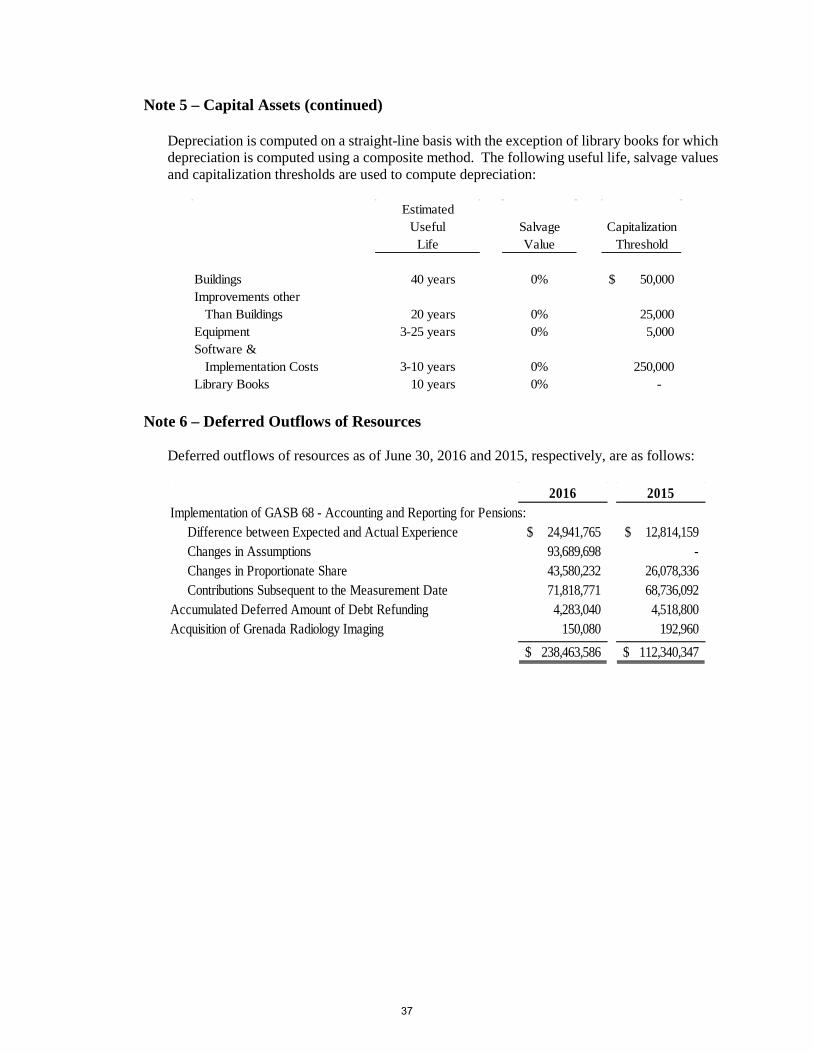
Note 5 – Capital Assets (continued)
Depreciation is computed on a straight-line basis with the exception of library books for which depreciation is computed using a composite method. The following useful life, salvage values and capitalization thresholds are used to compute depreciation:
EstimatedUseful Salvage Capitalization
Life Value Threshold
Buildings 40 years 0% 50,000$ Improvements other Than Buildings 20 years 0% 25,000 Equipment 3-25 years 0% 5,000 Software & Implementation Costs 3-10 years 0% 250,000 Library Books 10 years 0% -
Note 6 – Deferred Outflows of Resources
Deferred outflows of resources as of June 30, 2016 and 2015, respectively, are as follows:
2016 2015Implementation of GASB 68 - Accounting and Reporting for Pensions: Difference between Expected and Actual Experience 24,941,765$ 12,814,159$ Changes in Assumptions 93,689,698 - Changes in Proportionate Share 43,580,232 26,078,336 Contributions Subsequent to the Measurement Date 71,818,771 68,736,092 Accumulated Deferred Amount of Debt Refunding 4,283,040 4,518,800 Acquisition of Grenada Radiology Imaging 150,080 192,960
238,463,586$ 112,340,347$
37
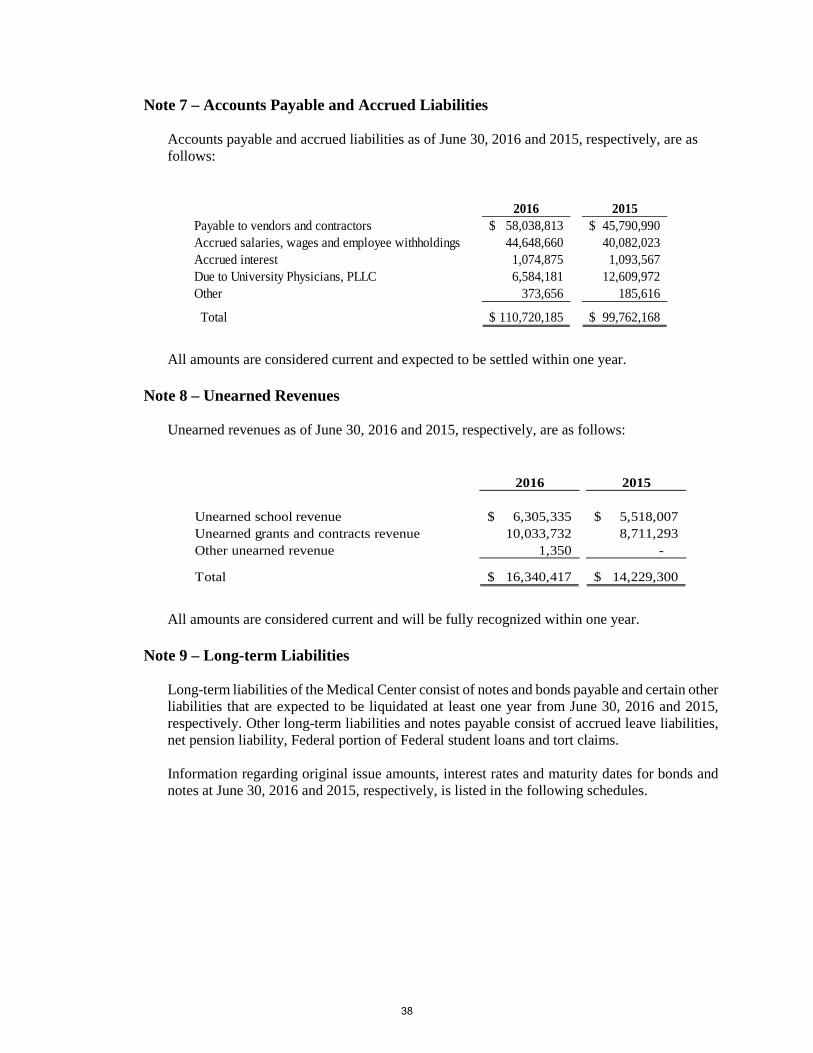
Note 7 – Accounts Payable and Accrued Liabilities
Accounts payable and accrued liabilities as of June 30, 2016 and 2015, respectively, are as follows:
2016 2015Payable to vendors and contractors 58,038,813$ 45,790,990$ Accrued salaries, wages and employee withholdings 44,648,660 40,082,023 Accrued interest 1,074,875 1,093,567 Due to University Physicians, PLLC 6,584,181 12,609,972 Other 373,656 185,616
Total 110,720,185$ 99,762,168$
All amounts are considered current and expected to be settled within one year.
Note 8 – Unearned Revenues
Unearned revenues as of June 30, 2016 and 2015, respectively, are as follows:
2016 2015
Unearned school revenue 6,305,335$ 5,518,007$ Unearned grants and contracts revenue 10,033,732 8,711,293 Other unearned revenue 1,350 -
Total 16,340,417$ 14,229,300$
All amounts are considered current and will be fully recognized within one year.
Note 9 – Long-term Liabilities
Long-term liabilities of the Medical Center consist of notes and bonds payable and certain other liabilities that are expected to be liquidated at least one year from June 30, 2016 and 2015, respectively. Other long-term liabilities and notes payable consist of accrued leave liabilities, net pension liability, Federal portion of Federal student loans and tort claims. Information regarding original issue amounts, interest rates and maturity dates for bonds and notes at June 30, 2016 and 2015, respectively, is listed in the following schedules.
38

Note 9 – Long-term Liabilities (continued)
Original Issue
Annual Interest Rate Maturity June 30, 2015 Additions Deletions June 30, 2016
Due Within One Year
Bonded Debt
Series 1998B 41,075,000$ 3.88% to 5.90% 2024 23,670,000$ -$ -$ 23,670,000$ -$
Series 2009 105,605,000$ 2.00% to 5.00% 2034 84,548,689 - 5,004,405 79,544,284 5,199,405
Series 2010A 24,870,000$ 5.92% to 6.69% 2032 24,870,000 - - 24,870,000 -
Series 2010B 20,000,000$ 6.840% 2035 20,000,000 - - 20,000,000 -
Series 2010C 5,130,000$ 2.50% to 5.00% 2020 2,905,416 - 534,083 2,371,333 564,083
Series 2012A 51,860,000$ 4.00% to 5.00% 2041 53,009,264 - 44,203 52,965,061 44,202
Series 2012B 53,390,000$ 4.064% to 4.822% 2038 53,390,000 - - 53,390,000 -
Total Bonded Debt 262,393,369 - 5,582,691 256,810,678 5,807,690
Other Long-term Liabilities
Accrued leave liabilities 55,047,823 8,371,322 4,712,102 58,707,043 4,394,887
Federal portion of Federal student loans 5,043,985 117,892 331,555 4,830,322 -
Tort claim liability 33,000,000 - - 33,000,000 4,984,000
Net pension liability 821,435,313 339,073,151 72,947,291 1,087,561,173 -
Total Other Long-term Liabilities 914,527,121 347,562,365 77,990,948 1,184,098,538 9,378,887
Total 1,176,920,490$ 347,562,365$ 83,573,639$ 1,440,909,216$ 15,186,577$
Due within one year 15,186,577
Total long-term liabilities 1,425,722,639$
Original Issue
Annual Interest Rate Maturity June 30, 2014 Additions Deletions June 30, 2015
Due Within One Year
Bonded Debt
Series 1998B 41,075,000$ 3.88% to 5.90% 2024 23,670,000$ -$ -$ 23,670,000$ -$
Series 2009 105,605,000$ 2.00% to 5.00% 2034 89,363,094 - 4,814,405 84,548,689 5,004,405
Series 2010A 24,870,000$ 5.92% to 6.69% 2032 24,870,000 - - 24,870,000 -
Series 2010B 20,000,000$ 6.840% 2035 20,000,000 - - 20,000,000 -
Series 2010C 5,130,000$ 2.50% to 5.00% 2020 3,424,499 - 519,083 2,905,416 534,083
Series 2012A 51,860,000$ 4.00% to 5.00% 2041 53,053,466 - 44,202 53,009,264 44,202
Series 2012B 53,390,000$ 4.064% to 4.822% 2038 53,390,000 - - 53,390,000 -
Total Bonded Debt 267,771,059 - 5,377,690 262,393,369 5,582,690
Other Long-term Liabilities
Accrued leave liabilities 51,948,891 7,514,760 4,415,828 55,047,823 4,277,538
Federal portion of Federal student loans 5,498,769 96,610 551,394 5,043,985 -
Tort claim liability 32,265,000 735,000 - 33,000,000 4,827,000
Net pension liability 937,683,135 - 116,247,822 821,435,313 -
Total Other Long-term Liabilities 1,027,395,795 8,346,370 121,215,044 914,527,121 9,104,538
Total 1,295,166,854$ 8,346,370$ 126,592,734$ 1,176,920,490$ 14,687,228$
Due within one year 14,687,228
Total long-term liabilities 1,162,233,262$
39

Note 9 – Long-term Liabilities (continued)
Revenue Bonds Payable
The Corporation issued $60,000,000 of revenue bonds, series 1993, dated December 15, 1993. The purpose of these revenue bonds was for the construction and equipping of a student union facility and various hospital facilities to be located on the campus of the Medical Center. On April 1, 1998, $40,455,000 of the series 1993 bonds was advanced refunded through the issuance of the series 1998B revenue refunding bonds. As part of the 2009 refunding issue, a portion of the 1998B bonds were refunded and the debt service schedule of the remaining balance of $23,670,000 was revised. The remaining bonds bear an interest rate of 5.50% with semi-annual interest payments due on June 1 and December 1, beginning June 2010. Principal matures from December 1, 2017 through December 1, 2023.
On October 22, 2009, the Corporation advance refunded the Series 2008A, 2008B, 1998A, and a portion of the 1998B bonds through the issuance of Series 2009 $105,605,000 revenue refunding bonds. Principal matures from June 1, 2010 through 2034, with interest due semiannually on June 1 and December 1 of each year beginning December 1, 2009. Repayment of the revenue bonds is secured by a pledge of rental payments per a lease agreement between the Corporation and the Medical Center.
Associated with the refunding is an amount related to the 2008A and 2008B bonds for the termination of an interest swap agreement. The termination payment is being amortized over 25 years, because at the date of refunding, the 2008A and 2008B bonds had a life remaining of less than the 2009 refunding bonds. The unamortized balance is being reported on the Statement of Net Position as a deferred amount of debt refunding, a deferred outflow of resources. The unamortized balance of the interest rate swap termination payment was $4,283,040 and $4,518,800 at June 30, 2016 and 2015, respectively.
On June 22, 2010, the Corporation issued $24,870,000, $20,000,000 and $5,130,000 of Series 2010A, 2010B and 2010C bonds, respectively. The purpose of these revenue bonds is to finance capital expenditures related to the expansion, renovation, furnishing and equipping of existing facilities located on the campus of the Medical Center.
The Series 2010A bond issue has been designated as “Build America Bonds” under the Recovery Act. The Recovery Act authorizes the Corporation to issue taxable bonds to finance capital expenditures for which it could issue tax-exempt bonds and elect to receive a payment contemporaneously with each interest payment, currently equal to thirty-five percent of the interest payable. Principal matures June 1, 2021 through 2032, with interest due semiannually on June 1 and December 1 of each year beginning December 1, 2010. Repayment of the revenue bonds is secured by a pledge of rental payments per a lease agreement dated May 1, 2010, between the Corporation and the Medical Center.
The Series 2010B bond issue has been designated as “Recovery Zone Economic Development Bonds” under the Recovery Act. The Recovery Act authorizes the Corporation to issue taxable bonds to finance capital expenditures for which it could issue tax-exempt bonds and elect to receive a payment contemporaneously with each interest payment, currently equal to forty-five percent of the interest payable. Principal matures June 1, 2032 through 2035 with interest due semiannually on June 1 and December 1 and of each year beginning December 1, 2010.
40

Note 9 – Long-term Liabilities (continued)
The Series 2010C bonds are tax-exempt revenue bonds. Principal matures from June 1, 2011 through 2020, with interest due semiannually on June 1 and December 1 of each year beginning December 1, 2010. Repayment of the Series 2010A, 2010B, and 2010C bonds is secured by a pledge of rental payments per a lease agreement dated May 1, 2010, between the Corporation and the Medical Center.
On April 11, 2012, the Corporation issued $51,860,000 and $53,390,000 of Series 2012A revenue bonds and 2012B taxable revenue bonds, respectively. The purpose of these revenue bonds is to finance capital expenditures related to the expansion, renovation, furnishing, and equipping of existing and new health care, education and research facilities for the Medical Center.
The Series 2012A revenue bonds bear interest rates of 4.0% to 5.0% with interest due semi-annually on June 1 and December 1 of each year beginning June 1, 2012. Principal matures June 1, 2038 through 2041. Repayment of the revenue bonds is secured by a pledge of rental payments per a lease agreement dated March 1, 2012, between the Corporation and the Medical Center. A portion of the bond proceeds was set aside to pay interest expense through June 1, 2013, in the amount of $2,668,417.
The Series 2012B taxable revenue bonds bear interest rates of 4.064% to 4.822% with interest due semi-annually on June 1 and December 1 of each year beginning June 1, 2012. Principal matures June 1, 2025 through 2038. Repayment of the revenue bonds is secured by a pledge of rental payments per a lease agreement dated March 1, 2012, between the Corporation and the Medical Center. A portion of the bond proceeds was set aside to pay interest expense through June 1, 2013 in the amount of $2,895,192.
Scheduled maturities of bonded debt at June 30, 2016 are as follows:
Fiscal Year Ended: Principal Interest Total
2017 5,807,690 12,639,163 18,446,853 2018 6,092,690 12,352,975 18,445,665 2019 6,372,690 12,071,138 18,443,828 2020 6,672,690 11,769,750 18,442,440 2021 6,983,607 11,460,646 18,444,253 2022-2026 38,808,036 51,694,631 90,502,667 2027-2031 47,088,036 41,072,983 88,161,019 2032-2036 60,659,226 27,532,961 88,192,187 2037-2041 78,326,013 10,823,689 89,149,702
Totals 256,810,678$ 191,417,936$ 448,228,614$
41

Note 10 – Operating Leases
Operating leases have been issued to cover rental of floor space at the Jackson Medical Mall, Grenada and various other locations in the state of Mississippi. The spaces are used as patient care facilities and administrative offices. The following is a schedule by years of the future minimum rental payments required under those operating leases:
Year Ending June 30: Amount
2017 13,419,037$ 2018 13,038,335 2019 12,371,594 2020 11,520,516 2021 10,873,463 2022-2026 49,393,231 2027-2031 44,518,320 2032-2034 5,850,000 Total Minimum Payments Required 160,984,496$
The total rental expense for all operating leases, except those renewed with terms of a month or less that were renewed, for the fiscal years ending June 30, 2016 and 2015 was $14,514,259 and $13,004,373, respectively.
42

Not
e 11
– N
atu
ral C
lass
ific
atio
ns
wit
h F
un
ctio
nal C
lass
ific
atio
ns
The
Med
ical
Cen
ter’
s op
erat
ing
expe
nses
by
func
tion
al c
lass
ific
atio
n w
ere
as f
ollo
ws
for
the
year
end
ed J
une
30, 2
016:
Func
tion
al
Cla
ssif
icat
ion
Sala
ries
& W
ages
Frin
ge B
enef
its
Trav
elC
ontr
actu
al
Serv
ices
Uti
liti
esSc
hola
rshi
ps &
Fe
llow
ship
sC
omm
odit
ies
Dep
reci
atio
n Ex
pens
eO
ther
Tota
l
Inst
ruct
ion
98,4
30,8
98$
30,1
93,4
29$
573,
811
$
4,
863,
253
$
-
$
-$
4,
259,
819
$
-
$
-$
13
8,32
1,21
0$
Hos
pita
l Ins
truc
tion
26,8
59,1
98
10,5
78,1
58
- 5,
277,
550
-
- 17
5,67
7
-
- 42
,890
,583
Rese
arch
15,8
02,6
95
5,31
8,87
5
715,
751
5,
504,
370
-
- 5,
092,
651
-
- 32
,434
,342
Publ
ic S
ervi
ce6,
202,
912
2,
137,
743
42
7,33
7
2,83
4,35
7
17,6
17
-
805,
774
- -
12,4
25,7
40
Aca
dem
ic S
uppo
rt9,
281,
013
3,
175,
531
42
4,92
6
1,71
8,14
7
- -
1,13
8,16
0
- -
15,7
37,7
77
Stud
ent S
ervi
ces
901,
639
333,
306
11,2
50
58,1
29
- -
128,
571
- -
1,43
2,89
5
Inst
itutio
nal S
uppo
rt60
,738
,089
20
,840
,884
69
1,75
5
43,1
63,6
42
- -
4,45
3,54
0
- -
129,
887,
910
Ope
ratio
n of
Pla
nt10
,272
,451
4,
267,
223
4,
801
11,1
59,3
41
10,7
92,6
20
-
2,22
0,70
0
- -
38,7
17,1
36
Stud
ent A
id-
- -
- -
6,32
1,71
5
-
- -
6,32
1,71
5
Aux
iliar
y En
terp
rises
695,
262
280,
480
1,31
9
69
7,09
9
22
0,19
9
-
1,84
5,55
1
- -
3,73
9,91
0
Dep
reci
atio
n-
- -
- -
- -
44,1
32,7
68
-
44,1
32,7
68
Hos
pita
l46
9,15
8,93
3
15
3,57
0,33
6
3,
066,
441
95,2
59,5
46
968,
448
- 25
9,04
6,26
9
-
- 98
1,06
9,97
3
Loan
Fun
d-
- -
- -
- -
- 15
5,57
9
15
5,57
9
Tot
al O
pera
ting
Expe
nses
69
8,34
3,09
0
23
0,69
5,96
5
5,
917,
391
170,
535,
434
11,9
98,8
84
6,
321,
715
279,
166,
712
44,1
32,7
68
15
5,57
9
1,
447,
267,
538
43
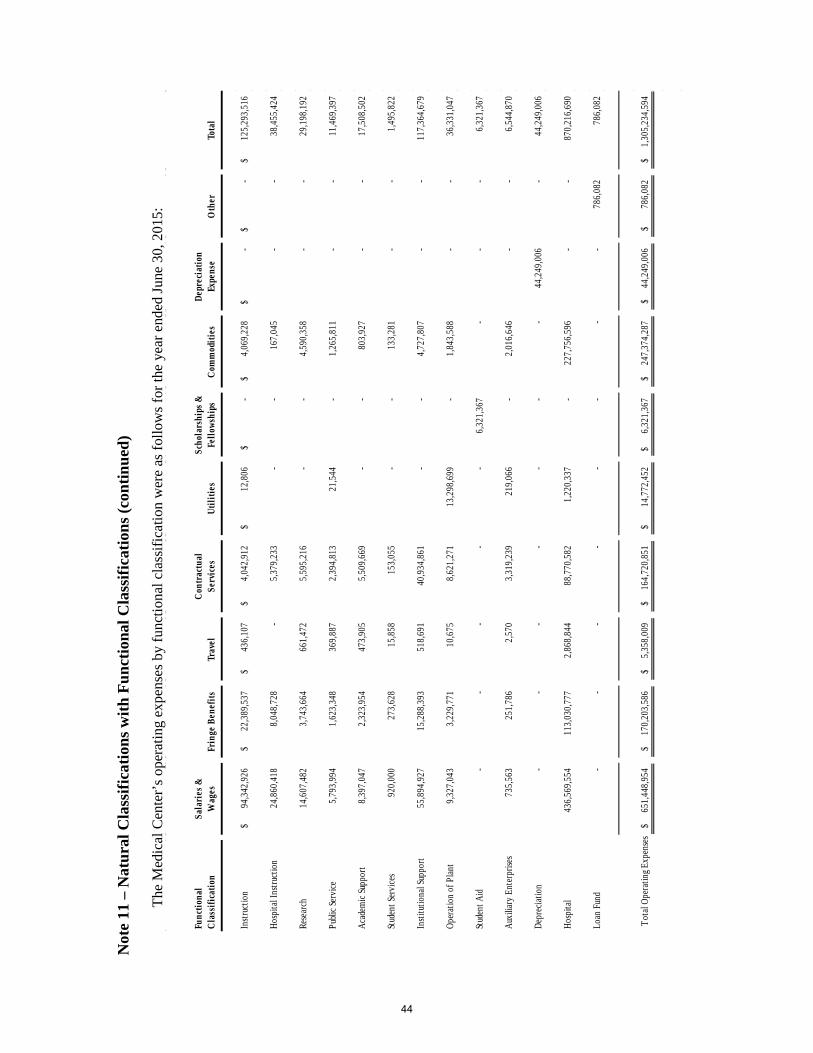
Not
e 11
– N
atu
ral C
lass
ific
atio
ns
wit
h F
un
ctio
nal C
lass
ific
atio
ns
(con
tin
ued
)
The
Med
ical
Cen
ter’
s op
erat
ing
expe
nses
by
func
tion
al c
lass
ific
atio
n w
ere
as f
ollo
ws
for
the
year
end
ed J
une
30, 2
015:
Func
tion
al
Cla
ssif
icat
ion
Sala
ries
&
Wag
esFr
inge
Ben
efit
sTr
avel
Con
trac
tual
Se
rvic
esU
tili
ties
Scho
lars
hips
&
Fell
owsh
ips
Com
mod
itie
sD
epre
ciat
ion
Expe
nse
Oth
erTo
tal
Inst
ruct
ion
94,3
42,9
26$
22
,389
,537
$
436,
107
$
4,04
2,91
2$
12
,806
$
-$
4,
069,
228
$
-$
-
$
125,
293,
516
$
Hos
pita
l Ins
truc
tion
24,8
60,4
18
8,
048,
728
- 5,
379,
233
- -
167,
045
-
- 38
,455
,424
Rese
arch
14,6
07,4
82
3,
743,
664
661,
472
5,59
5,21
6
-
- 4,
590,
358
- -
29,1
98,1
92
Publ
ic S
ervi
ce5,
793,
994
1,62
3,34
8
36
9,88
7
2,
394,
813
21,5
44
-
1,26
5,81
1
-
- 11
,469
,397
Aca
dem
ic S
uppo
rt8,
397,
047
2,32
3,95
4
47
3,90
5
5,
509,
669
- -
803,
927
-
- 17
,508
,502
Stud
ent S
ervi
ces
920,
000
27
3,62
8
15,8
58
153,
055
-
- 13
3,28
1
- -
1,49
5,82
2
Inst
itutio
nal S
uppo
rt55
,894
,927
15,2
88,3
93
51
8,69
1
40
,934
,861
- -
4,72
7,80
7
-
- 11
7,36
4,67
9
Ope
ratio
n of
Pla
nt9,
327,
043
3,22
9,77
1
10
,675
8,
621,
271
13,2
98,6
99
-
1,84
3,58
8
-
- 36
,331
,047
Stud
ent A
id-
- -
- -
6,32
1,36
7
- -
- 6,
321,
367
Aux
iliar
y En
terp
rises
735,
563
25
1,78
6
2,57
0
3,31
9,23
9
21
9,06
6
-
2,01
6,64
6
-
- 6,
544,
870
Dep
reci
atio
n-
- -
- -
- -
44,2
49,0
06
- 44
,249
,006
Hos
pita
l43
6,56
9,55
4
113,
030,
777
2,
868,
844
88
,770
,582
1,22
0,33
7
- 22
7,75
6,59
6
- -
870,
216,
690
Loan
Fun
d-
- -
- -
- -
- 78
6,08
2
78
6,08
2
Tot
al O
pera
ting
Expe
nses
65
1,44
8,95
4$
170,
203,
586
$
5,
358,
009
$
16
4,72
0,85
1$
14,7
72,4
52$
6,
321,
367
$
24
7,37
4,28
7$
44,2
49,0
06$
786,
082
$
1,30
5,23
4,59
4$
44

Note 12 – Construction Commitments and Financing
The Medical Center has contracted for various construction projects as of June 30, 2016. Estimated costs to complete the various projects and the sources of anticipated funding are presented below:
TotalCosts Federal State Institutional
to Complete Sources Sources Funds Other
Renovations Adult Emergency 64,275$ -$ 64,275$ -$ -$ School of Medicine 37,982,685 - 37,982,685 - -ECM Lighting Upgrades 105,775 - 105,775 - -Replace Generators 12, 13 & 14 318,656 - - - 318,656 Renovate Lexington Hospital Emergency Dept 1,071,746 - - 820,284 251,462 Cancer & Biomedical Research Center 19,097,020 6,687,634 - 10,595,828 1,813,558 School of Medicine Utilities Project 400,851 400,851 - - -Parking Garage C 4,842,026 - - - 4,842,026 Surface Parking, Roadways & Infrastructure 2,821,177 485,781 - - 2,335,396 Renovate SOD Restrooms 163,180 - - 163,180 -Install Modular Building Lexington Hospital 393,500 - - 393,500 -Renovate Women's Urgent Care 687,426 - - 687,426 -Renovate Pediatric Dialysis 8,551 - - 8,551 -Recoat Pavilion Building Roof 66,157 - - 66,157 -Renovate Rooms C656 & C657 11,060 - - 11,060 -Renovate Interventional Radiology Waiting Area 35,663 - - 35,663 -Renovate W001-00 & M004-02 118,247 - - 118,247 -Renovate CV003 Radiology 3,684,204 - - 3,684,204 -Replace Morgue Cooler 58,116 - - 58,116 -Renovate Gross Anatomy Lab N720 126,087 - - 126,087 -Ticket Dispenser Replacement Lots 17 & 21 132,674 - - 132,674 -Renovate SOM Exterior Entrance 498,529 - - 498,529 -Renovate Main Pharmacy 2,795,848 - - 2,795,848 -Renovate X505 Pharmacy 16,059 - - 16,059 -Renovate W259 83,080 - - 83,080 -Renovate for Linear Accelerator 621,604 - - 621,604 -Construct Contractor's Parking Lot 39,000 - - 39,000 -Renovate 3 West Chief Medical Officer Suite 187,247 - - 187,247 -Install Sterilization Equipment in WC002 514,542 - - 514,542 -Construct EDH Funded Project 147,650 - - 147,650 -Renovate Pavilion Coffee Shop 217,492 - - 217,492 -Reroof URC Building 178,208 - - 178,208 -Construct Accounting Office-JMM 217,557 - - 217,557 -Renovate MRI Grenada 557,839 - - 557,839 -Renovate Radiology Building 699,305 - - 699,305 -SOM Infrastructure Contract II 1,674,361 1,674,361 - - -Renovate 2 West 280,000 - - 280,000 -Renovate E008-A 506,670 - - 506,670 -NE Wellness Repairs 493,840 - - 493,840 -Lakeland Wellness Repairs 943,840 - - 943,840 -
Total 82,861,747$ 9,248,627$ 38,152,735$ 25,899,287$ 9,561,098$
Funded by
45

Note 13 – Pension Plan
PERS Defined Benefit Plan
Plan Description – The IHL System participates in either the Public Employees’ Retirement System of Mississippi (PERS), a cost-sharing multiple-employer defined benefit pension plan or the Optional Retirement Plan (ORP), a multiple-employer defined contribution plan established in 1990. PERS provides retirement and disability benefits, annual cost-of-living adjustments, and death benefits to plan members and beneficiaries. Benefit provisions are established by state law and may be amended only by the State of Mississippi Legislature. PERS issued a publicly available financial report that includes financial statements and required supplementary information. That information may be obtained by writing to the Public Employees’ Retirement IHL System, PERS Building, 429 Mississippi Street, Jackson, MS 39201-1005 or by calling (601) 359-3589 or 1-800-444-PERS.
Vesting Period – In 2007, the Mississippi Legislature amended the PERS Plan to change the vesting period from four to eight years for members who entered the IHL System after July 1, 2007. A member who entered the IHL System prior to July 1, 2007 is still subject to the four year vesting period provided that the member does not subsequently refund their account balance.
Funding Policy – PERS members are required to contribute 9.0% of their annual salary and the institution is required to contribute at an actuarially determined rate. The actuarially determined rate was 15.75% of annual covered payroll at June 30, 2016 and 2015. The contribution requirements of PERS members are established and may be amended only by the State of Mississippi Legislature. The Medical Center‘s contributions to PERS for the years ended June 30, 2016, 2015, and 2014, were $72,698,781, $69,227,945, and $65,129,647, respectively. Such contributions equaled the required contributions for each respective year.
Pension Liabilities, Pension Expense, and Deferred Outflows of Resources and Deferred Inflows of Resources Related to Pensions – At June 30, 2016 and 2015, the Medical Center reported a liability of $1.1 billion and $821.4 million, respectively, for its proportionate share of the net pension liability. The net pension liability for June 30, 2016 was measured as of June 30, 2015, and the total pension liability used to calculate the net pension liability was determined by an actuarial valuation as of that date. The Medical Center’s proportion of the net pension liability was based on a projection of the Medical Center’s long-term share of contributions to the pension plan relative to the projected contributions of all participating employers, actuarially determined. The Medical Center’s proportionate share of the net pension liability as of June 30, 2015 and 2014 was 7.04 and 6.76, respectively.
For the years ended June 30, 2016 and 2015, the Medical Center recognized pension expense of $119.0 million and $65.0 million, respectively. At June 30, 2016, the Medical Center reported deferred outflows of resources and deferred inflows of resources related to pensions from the following sources:
46

Note 13 – Pension Plan (continued)
Differences between expected
and actual experience
Changes of assumptions
Changes in proportion and
differences between Employer contributions and
proportionate share of
contributions
Contributions subsequent to the measurement date
Total deferred outflows of resources
Differences between
expected and actual
experience
Net difference between projected
and actual investment earnings on pension plan investments
Changes of assumptions
Total deferred inflows of resources
24,941,765 93,689,698 43,580,232 71,818,771 234,030,466 - 25,670,867 - 25,670,867
Deferred outflows of resources Deferred inflows of resources
Pension Liabilities, Pension Expense, and Deferred Outflows of Resources and Deferred Inflows of Resources Related to Pensions (continued) – $71.8 million reported as deferred outflows of resources related to contributions subsequent to the measurement date will be recognized as a reduction of the net pension liability in the year ended June 30, 2017. Other amounts reported as deferred outflows of resources and deferred inflows of resources related to pensions will be recognized as pension expense as follows:
2017 2018 2019 2020 Total43,605,294 43,605,294 43,605,294 31,395,813 162,211,695
2017 2018 2019 2020 2021 Total5,134,173 5,134,173 5,134,173 5,134,173 5,134,175 25,670,867
Deferred inflow of resources year ended June 30
Deferred outflow of resources year ended June 30
Actuarial assumptions – The total pension liability in the June 30, 2015 actuarial valuation was determined using the following actuarial assumptions, applied to all periods included in the measurement:
Valuation date June 30, 2015 Measurement date June 30, 2015 Actuarial cost method Entry age Actuarial assumptions:
Discount rate 7.75%
Inflation 3.00%
Payroll growth 3.75% Projected salary increase 3.75-19.00% (1) Investment rate of return 7.75% (2)
(1) Depending on age, service, and type of employment, including inflation (2) Net of pension plan investment expense, including inflation
Mortality rates were based on the RP-2014 Healthy Annuitant Blue Collar Table projected with Scale BB to 2016 with male rates set forward one year.
The actuarial assumptions used in the June 30, 2015 valuation were based on the results of an actuarial experience study for the period July 1, 2010 to June 30, 2014. The experience report is dated May 4, 2015.
47
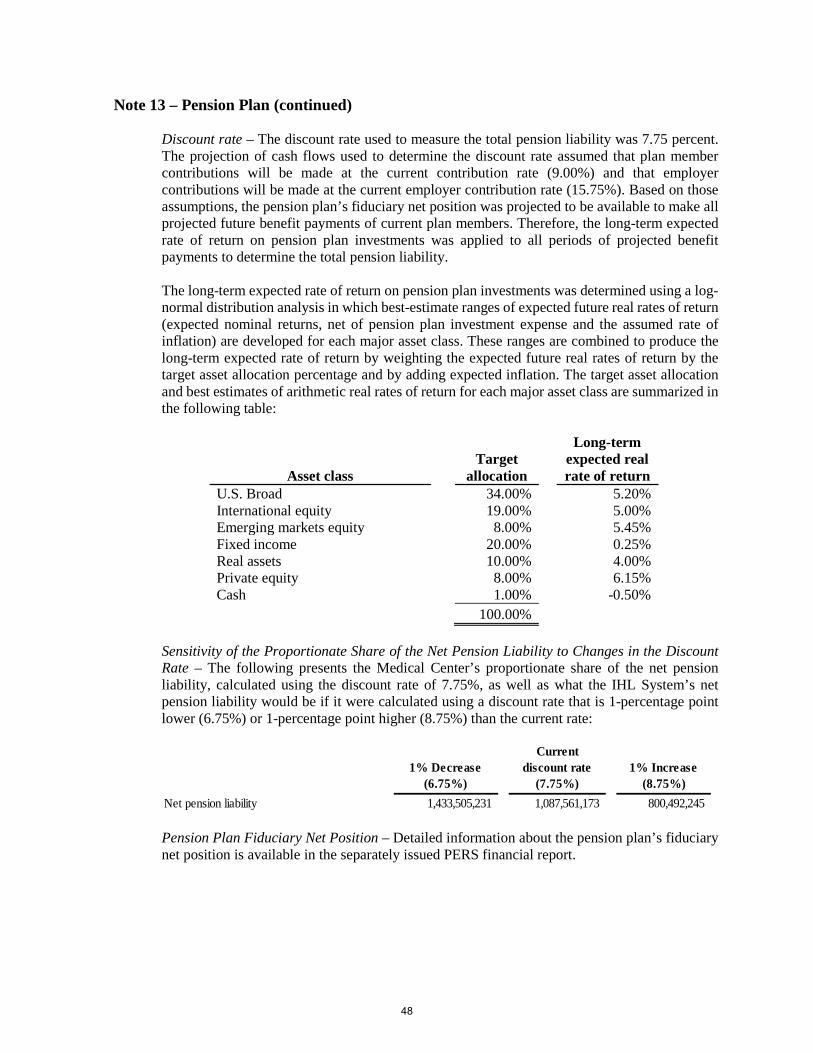
Note 13 – Pension Plan (continued)
Discount rate – The discount rate used to measure the total pension liability was 7.75 percent. The projection of cash flows used to determine the discount rate assumed that plan member contributions will be made at the current contribution rate (9.00%) and that employer contributions will be made at the current employer contribution rate (15.75%). Based on those assumptions, the pension plan’s fiduciary net position was projected to be available to make all projected future benefit payments of current plan members. Therefore, the long-term expected rate of return on pension plan investments was applied to all periods of projected benefit payments to determine the total pension liability.
The long-term expected rate of return on pension plan investments was determined using a log-normal distribution analysis in which best-estimate ranges of expected future real rates of return (expected nominal returns, net of pension plan investment expense and the assumed rate of inflation) are developed for each major asset class. These ranges are combined to produce the long-term expected rate of return by weighting the expected future real rates of return by the target asset allocation percentage and by adding expected inflation. The target asset allocation and best estimates of arithmetic real rates of return for each major asset class are summarized in the following table:
Asset class Target
allocation
Long-term expected real rate of return
U.S. Broad 34.00% 5.20% International equity 19.00% 5.00% Emerging markets equity 8.00% 5.45% Fixed income 20.00% 0.25% Real assets 10.00% 4.00% Private equity 8.00% 6.15% Cash 1.00% -0.50%
100.00%
Sensitivity of the Proportionate Share of the Net Pension Liability to Changes in the Discount Rate – The following presents the Medical Center’s proportionate share of the net pension liability, calculated using the discount rate of 7.75%, as well as what the IHL System’s net pension liability would be if it were calculated using a discount rate that is 1-percentage point lower (6.75%) or 1-percentage point higher (8.75%) than the current rate:
1% Decrease(6.75%)
Currentdiscount rate
(7.75%)1% Increase
(8.75%)
Net pension liability 1,433,505,231 1,087,561,173 800,492,245
Pension Plan Fiduciary Net Position – Detailed information about the pension plan’s fiduciary net position is available in the separately issued PERS financial report.
48

Note 13 – Pension Plan (continued)
ORP Defined Contribution Plan
The Optional Retirement Plan (ORP) was established by the Mississippi Legislature in 1990 to help attract qualified and talented institutions of higher learning faculty. The membership of the ORP is composed of teachers and administrators appointed or employed on or after July 1, 1990, who elect to participate in ORP and reject membership in PERS. The ORP provides funds at retirement for employees and in the event of death, provides funds for their beneficiaries, through an arrangement by which contributions are made to this plan. The current contribution rate of both the employee and the Medical Center are identical to that of the PERS defined benefit plan.
The ORP uses the accrual basis of accounting. Investments are reported at fair value, based on quoted market prices. Employees immediately vest in plan contributions upon entering the plan. The Medical Center’s contributions to the ORP for the years ended June 30, 2016, 2015, and 2014 were $25,099,961, $22,626,639, and $21,411,984 respectively, which equaled its required contribution for each respective year.
49

Note 14 – Material Component Unit of the Medical Center
In accordance with Governmental Accounting Standards Board (GASB) Statement No. 61, The Financial Reporting Entity: Omnibus, the Medical Center Educational Building Corporation is deemed to be a material component unit of the Medical Center but is presented on a blended basis in the accompanying financial statements due to the significance of its activities to the Medical Center's operations. Condensed financial information as of June 30, 2016 and 2015 is listed in the following schedule:
2016 2015Current assets 6,654,876 6,448,568 Noncurrent asset 246,801,871 251,445,749
Total assets 253,456,747 257,894,317
Deferred Outflows of Resources 4,283,040 4,518,800
Current liabilities 6,654,875 6,451,427 Noncurrent liabilities 251,230,679 257,038,369
Total liabilities 257,885,554 263,489,796
Total net position (145,767) (1,076,679)
Operating revenues 12,001,672 12,225,929 Operating expenses 11,070,760 11,896,523 Total operating income (loss) 930,912 329,406
Nonoperating revenues - - Nonoperating expenses - - Total nonoperating revenues (expenses) - -
Change in net position 930,912 329,406
Note 15 – Donor Restricted Endowments
The net appreciation on investments of donor restricted endowments that is available for authorization for expenditure was $14,204,245 and $13,570,324 as of June 30, 2016 and 2015, respectively. These amounts are included on the Statement of Net Position in “Net Position - Expendable for Other Purposes”.
Most endowments operate on the total-return concept as permitted by the Uniform Management of Institutional Funds Act (Sections 79-11-601 through 79-11-617, MS Code, Ann. 1972) as enacted in 1998. The annual spending rate for these endowments is 5% of the three-year moving average market value.
50

Note 16 – Federal Loan Program Disbursements
The Medical Center distributed federal loan funds for the year ended June 30, 2016 and 2015 as follows:
2016 2015William D. Ford Direct Loan Program 31,571,765$ 31,210,392$ Federal Perkins Loan Program 952,695 1,178,461 Health and Human Services Loan Program 164,298 293,235
Total 32,688,758$ 32,682,088$
These distributions and their related funding sources are included as “Noncapital Financing” distributions in the Statement of Cash Flows.
Note 17 – University of Mississippi Medical Center Tort Claims Fund
The Medical Center participates in the University of Mississippi Medical Center Tort Claims Fund (UMMC Tort Claims Fund). In accordance with Section 11-46-1, et seq., Mississippi Code Annotated (1972), the Mississippi Tort Claims Board has authorized the Board of Trustees of the State Institutions of Higher Learning to establish a fund in order to self-insure a certain portion of its liability under the Mississippi Tort Claims Act.
Effective July 1, 1993, Mississippi statute permitted tort claims to be filed against the State Institutions of Higher Learning. A maximum limit liability of $500,000 per occurrence is currently permissible.
The Board of Trustees of State Institutions of Higher Learning has established a Medical Center Tort Claims fund to pay claims up to the maximum liability limits described above. Losses from professional and tort liability claims of the Medical Center are the responsibility of the Medical Center Tort Claims Fund.
51
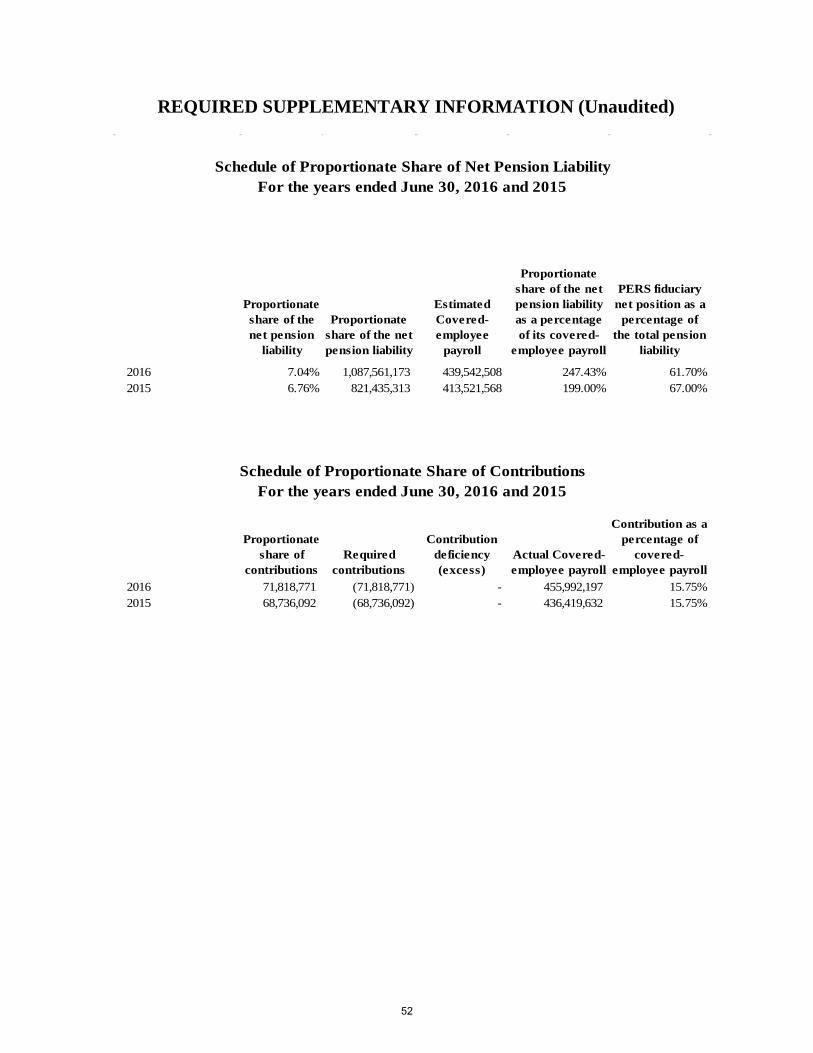
REQUIRED SUPPLEMENTARY INFORMATION (Unaudited)
Proportionate share of the net pension
liability
Proportionate share of the net pension liability
Estimated Covered-employee
payroll
Proportionate share of the net pension liability as a percentage of its covered-
employee payroll
PERS fiduciary net position as a
percentage of the total pension
liability
2016 7.04% 1,087,561,173 439,542,508 247.43% 61.70%2015 6.76% 821,435,313 413,521,568 199.00% 67.00%
Proportionate share of
contributionsRequired
contributions
Contribution deficiency (excess)
Actual Covered-employee payroll
Contribution as a percentage of
covered-employee payroll
2016 71,818,771 (71,818,771) - 455,992,197 15.75%2015 68,736,092 (68,736,092) - 436,419,632 15.75%
Schedule of Proportionate Share of ContributionsFor the years ended June 30, 2016 and 2015
Schedule of Proportionate Share of Net Pension LiabilityFor the years ended June 30, 2016 and 2015
52
Notes to Required Supplementary Information June 30, 2016
(1) Schedule of Proportionate Share of Net Pension Liability
This schedule presents historical trend information about the Medical Center’s proportionate share of the net pension liability for its employees who participate in the PERS. The net pension liability is measured as the total pension liability(TPL) less the amount of the fiduciary net position of the plan. Information related to years prior to 2015 is not available, therefore, trend information will be accumulated to display a ten-year presentation.
(2) Schedule of Proportionate Share of the Medical Center’s Contributions
The required contributions and percentage of those contributions actually made are presented in the schedule. Information related to years prior to 2015 is not available, therefore, trend information will be accumulated to display a ten-year presentation.
(3) Changes in Assumptions and Benefit Terms
Changes of assumptions: In 2015, the expectation of retired life mortality was changed to the RP-2014 Healthy Annuitant Blue Collar Table projected to 2016 using Scale BB, rather than the RP-2000 Mortality Table that was used prior to 2015. In 2015, the expectation of disabled mortality was changed to the RP-2014 Disabled Retiree Table, rather than the RP-2000 Disabled Mortality Table that was used prior to 2015. Withdrawal rates, pre-retirement mortality rates, disability rates, and service retirement rates were also adjusted to more closely reflect actual experience. In 2015, assumed rates of salary increase were adjusted to more closely reflect actual and anticipated experience. Finally, in 2016 the price inflation and investment rate of return assumptions were changed from 3.50% to 3.00% and 8.00% to 7.75%, respectively.
Change of benefit terms: Amounts reported for fiscal year 2016 and 2015 reflect no changes in benefit terms.
53


