82
Financial report for the four months ended 31 October 2011 eServGlobal Limited ABN 59 052 947 743 v

Financial report for the four monthsended 31 October 2011
eServGlobal LimitedABN 59 052 947 743
v

e S e r v G l o b a l L i m i t e d
Company Update
Financial Highlights
Restructuring complete and yielding OpEx improvements in the 4 month Financial Year from 1 July to 31
October 2011
o Improvement of Gross Margin percentage against both the H1 FY2011 run rate and the comparable
four month northern hemisphere summer period and Ramadan period from FY2011 (July 1 to October
31 2010)
o OpEx significantly reduced against both H1 FY2011 run rate and the comparable four month period
o EBITDA loss of A$5.9M shows improvement over prior year’s comparable four month period yielding
significantly reduced EBITDA losses for the core Mobile Money and Value-Added Services business
o Interest income of A$0.8M
o Cash and cash equivalents at 31 October 2011 of A$10.1M (excluding USP Asset proceeds held in
escrow of $A23.6M) after returning A$57M in cash to shareholders
o Full receipt of the first tranche of escrow excluding accrued interest totalling A$11.8M post period end,
with the second tranche also expected to arrive in FY2012B
Operational Highlights
Growing the customer base and building on our key references in mobile money and recharge
Key operational metrics at the time of publishing (February 2012)
o 80+ customers, including twenty new customers added (+33% since February 2011)
o 40+ recharge, mobile money, and HomeSend references (+40% since February 2011)
o 358 million HomeSend subscribers covered (+616% since February 2011)
During Ramadan, which is typically a high traffic period for operators in the Middle East and Northern
Africa, the recharge side of the business successfully managed a strong peak in activity, measuring over half
a million recharges per hour at a single mobile operator. Each year as prepaid subscriber numbers grow,
operators see the increased need for scalable, secure, and flexible solutions that can manage end-to-end
recharge and value-added services for their subscribers.
During the Northern Hemisphere summer and Ramadan period, eServGlobal focused on completing its
transition to the high-growth markets of Mobile Money and Value-Added Services. In this four month
period, management returned A$57M to shareholders based on successful M&A activity via a capital return
and a special dividend. The Company also successfully negotiated an escrow release agreement with Oracle
whose details were released shortly after the end of the accounting period.
Change in Financial Year End
Following the divestiture of the USP business and assets and the ensuing shift in core customers and
markets, eServGlobal has moved from a 30 June year end to a 31 October year end. As a result, the
Company is releasing four month audited results for the 1 July 2011 to 31 October 2011 accounting period
between these two financial years, or Financial Year 2012A.
After this accounting period the normal financial calendar will apply and the period from 1 November 2011
to 31 October 2012 will represent FY2012B.
Audited four month comparable figures for the 1 July - 31 October 2010 are not available; as such this
annual report provides full year comparables versus the four month accounting period that was required as
a part of changing the financial year. The Company was pleased to record an improved EBITDA in the July to
October period over the prior year. When looking at the core Mobile Money and Value-Added Services
business EBITDA was significantly improved.

e S e r v G l o b a l L i m i t e d
About eServGlobal
eServGlobal specializes in Mobile Money solutions and Value-Added Services (VAS) that help Mobile and
Financial Service Providers increase their revenue and gain and maintain customer ownership. eServGlobal
invests heavily in product development, using carrier-grade, next-generation technology and aligning with
the requirements of more than 80 customers in over 55 countries.
As emerging markets move into the global economy it is becoming increasingly important for these
economies to shift away from cash and towards the use of electronically stored and transferred funds.
However, in many of these regions the banking infrastructure does not exist in a manner that is accessible
and financially viable for the majority of the population. Our proven experience as providers of mobile
recharge and value-added services helps us to take advantage of existing mobile infrastructure to deliver
mobile money services that are faster, cheaper and easier to use than the current alternatives.
The Company’s Mobile Money suite manages approximately €3.5 Billion in transactions per year on behalf
of mobile operators and financial service providers in over 40 reference sites. The Mobile Money suite
adapts to the differing needs of companies in emerging markets, where we help operators to leverage their
airtime sales team and distribution network in order to provide mobile money services for the unbanked. In
developed markets, we play a mobilizing role for the existing financial structure, creating mobile accounts
linked to prepaid debit cards. We bridge the two worlds via our market-leading offering, HomeSend, which
is the only mobile-centric international remittance hub endorsed by the GSM Association. As person-to-
person remittances are forecast to exceed international foreign aid and to continue to grow every year this
is expected to be an extraordinarily interesting, competitive, and lucrative market: HomeSend has the
partners, the technology, and the foothold to build a leading position in mobile international remittances.
eServGlobal’s highly adaptable Mobile Money suite manages mobile airtime recharge services for over 20
mobile operators around the world. These operators cover a quarter of a billion subscribers and represent
a growing demographic. As cheap handsets and the availability of prepaid accounts have increased the
affordability of mobile technology, billions of subscribers in emerging markets now have access to mobile
telephony for the first time. Prepaid is the fastest growing sector in the mobile industry and eServGlobal
helps operators to provide services ranging from physical voucher-based top-up solutions to highly
sophisticated airtime sales programs delivering convergent voucher-based and electronic recharge with
multi-tiered sales and distribution management facilities. Our recharge services make sure that operators
are armed with a well-incented sales team, a cost-efficient top-up mechanism, and an easy-to-use
subscriber interface which are the key tools required to build market growth for years to come.
Mobile Money and Recharge Services are being delivered to over 20 customers worldwide, and gaining
global market access via partners such as Nokia Siemens Networks (NSN)
o We continue to have success in upselling our existing customer base and are working with 9 customers
to upgrade them from voucher-based recharge to electronic recharge to domestic mobile money
o In addition to our success in bringing customers up the path toward integrated voucher and electronic
recharge, we have been selected to provide domestic mobile money services in five countries in the
Middle East and Asia and continue to grow our presence
o The launch of domestic mobile money services with mCoin Asia in Indonesia solidifies our presence in a
key market with an innovative customer. We are targeting over 1 million users of the mobile money
service in Indonesia by 2013
o Development of new partnerships extending both our product capabilities, our service capabilities, and
our global sales reach
o Extension of our NFC integration capabilities, ensuring a competitive edge in developed markets

e S e r v G l o b a l L i m i t e d
HomeSend, the innovative mobile to mobile multilateral remittance hub, is building momentum with
global coverage and 6 multinational agreements.
o With over 358 million subscribers covered under contracts signed at the time of publishing (February
2012), HomeSend is exceeding business plans for subscriber coverage metrics and has established itself
as the premier provider of international mobile remittance
o With top-tier clients and partners such as MTN, Qtel Group, MFIC, and EastNets, HomeSend is building
a truly global footprint and is securing a strategic foothold in what will be a very important market in
the coming years
o HomeSend continued to increase its coverage with remittance corridors between the United Kingdom,
Belgium, Morocco, the Philippines, Vietnam, Nepal, China, Ghana, Australia, Pakistan, and Qatar
o New hub-to-hub peering agreement with Tranglo, a multinational prepaid hub based in Malaysia
o We have successfully launched live operations on the Qatar-Pakistan corridor
o New agreement with Lycamoney improves reach in Europe with key immigrant communities
o Three multinational operator groups have signed group-level contracts to roll out to their affiliates
o Three global PSP’s have signed hub-to-hub peering agreements

1
Annual financial report For the four months ended
31 October 2011
Contents
Page
Directors’ report 2
Auditor’s independence declaration 15
Corporate governance statement 16
Independent audit report 24
Directors’ declaration 26
Consolidated statement of comprehensive income 27
Consolidated statement of financial position 28
Consolidated statement of changes in equity 29
Consolidated statement of cash flows 30
Notes to the financial statements 31
Additional securities exchange information 77

e S e r v G l o b a l L i m i t e d
2
Directors’ report The directors of eServGlobal Limited submit herewith the financial report for the four months ended 31 October 2011. The names and particulars of the directors of the company during or since the end of the financial period are: Name Particulars Richard Mathews Non-executive Chairman.
Richard is the Non-Executive Chairman and former Chief Executive Officer of eServGlobal. He has over 20 years’ management experience in telecommunications, software and investment. He is a founding partner of MHB Holdings. Previously, Mr. Mathews was CEO of Mincom, Australia’s largest enterprise software company, increasing the share price from $2.50 to $8.77 in a two-year period. He has also held the role of Senior Vice President, International at J.D. Edwards and is currently a Director of TransLink Transport Authority. He holds a Bachelor of Commerce and a Bachelor of Science and is an Associate Chartered Accountant. Richard was appointed as a director in July 2009.
David Smart
Non-executive Director and Chairman of the Audit Committee. David held senior executive positions in large scale manufacturing and merchandising businesses for more than 20 years. This includes 13 years as Chief Financial Officer of Tubemakers of Australia Limited and Metal Manufactures Limited. He is a non-executive director of a listed company Saunders International Limited. David holds a Bachelor of Commerce and MBA from the University of New South Wales and is a Fellow of the Australian Society of Certified Practicing Accountants. David has been a member of the Board since July 2000.
François Barrault Non-executive Director and Chairman of the Remuneration and Nomination Committee. François is the founder and chairman of FDB Partners, an investment and consulting firm that specializes in technology, renewable energy and publishing. He has previously served as CEO of BT Global services, President of BT International, and as a member of the board and the operating committee of BT Group PLC. His extensive experience includes key roles within Lucent Technologies such as President, Mobility International and President and CEO for the EMEA region. Prior to Lucent, he worked at Ascend Communications, where he held the position of Senior Vice President, International. He has also held executive positions within IBM, Computervision/Prime and Stratus and was co-founder and Chairman of the Board of Astria, an e-commerce software supplier. He holds a Master of Science (D.E.A) in Robotics/AI and an E.D.P in Engineering from the Ecole Centrale de Nantes. François has been a member of the Board since March 2003.

e S e r v G l o b a l L i m i t e d
3
Directors’ report Anthony Eisen Non-executive Director.
Anthony Eisen resigned as a Director on 24 October 2011.
James Brooke Non-executive Director. James is a Chartered Accountant with experience in strategic consulting, finance and investment. He is currently a fund manager at Henderson in the Henderson Volantis Small Cap Team with responsibility for active corporate engagement. He previously worked in the private equity industry for ten years, initially with 3i in the London buyout team and more recently as a venture capitalist with Quester where he specialized in IT services and telecommunications investments. Prior to this, he was with Deloitte’s strategic consultancy business after having trained with them as a Chartered Accountant. He is a non-executive Director of Lochard Energy Group PLC and Renovo PLC. He holds a BA in Mathematics from Oxford University and an MSc in Telecommunications from University College London.
Michael Jefferies Alternate non-executive Director for Anthony Eisen. Michael ceased as an alternate Director on 24 October 2011.
Craig Halliday Executive Director. Craig is the Chief Executive Officer and Managing Director. Prior to eServGlobal, Craig served as Executive President of Field Operations (COO) at Mincom, where he achieved record-breaking growth in both revenues and profitability. He has worked in the high-tech industry as an executive and investor since 1996 and has held senior roles including President of PeopleSoft Japan and various management positions within J.D. Edwards. Craig holds a Bachelor of Science from Edinburgh University and is a member of the Institute of Chartered Accountants in England and Wales.
Stephen Baldwin Non-executive Director Stephen is a qualified chartered accountant with over 25 years of business experience. He commenced his career with Price Waterhouse and had a total of 10 years with the firm in three different countries. He was subsequently employed in the funds management industry for 12 years, initially with Hambro-Grantham and then with Colonial First State (where he was that group’s Head of Private Equity from 2000 to 2006). He has extensive Board experience, primarily with unlisted companies but was also the sole executive director of a listed investment vehicle for a number of years. Other current roles include advising one of Australia’s larger superannuation funds on their global private equity program.
Stephen holds a Bachelor of Commerce (Honours) from the University of Cape Town and is a member of the Institute of Chartered Accountants of Australia. Stephen was appointed a director and a member of the Audit and Remuneration and Nomination Committee on 25 November 2011.
e S e r v G l o b a l L i m i t e d
4
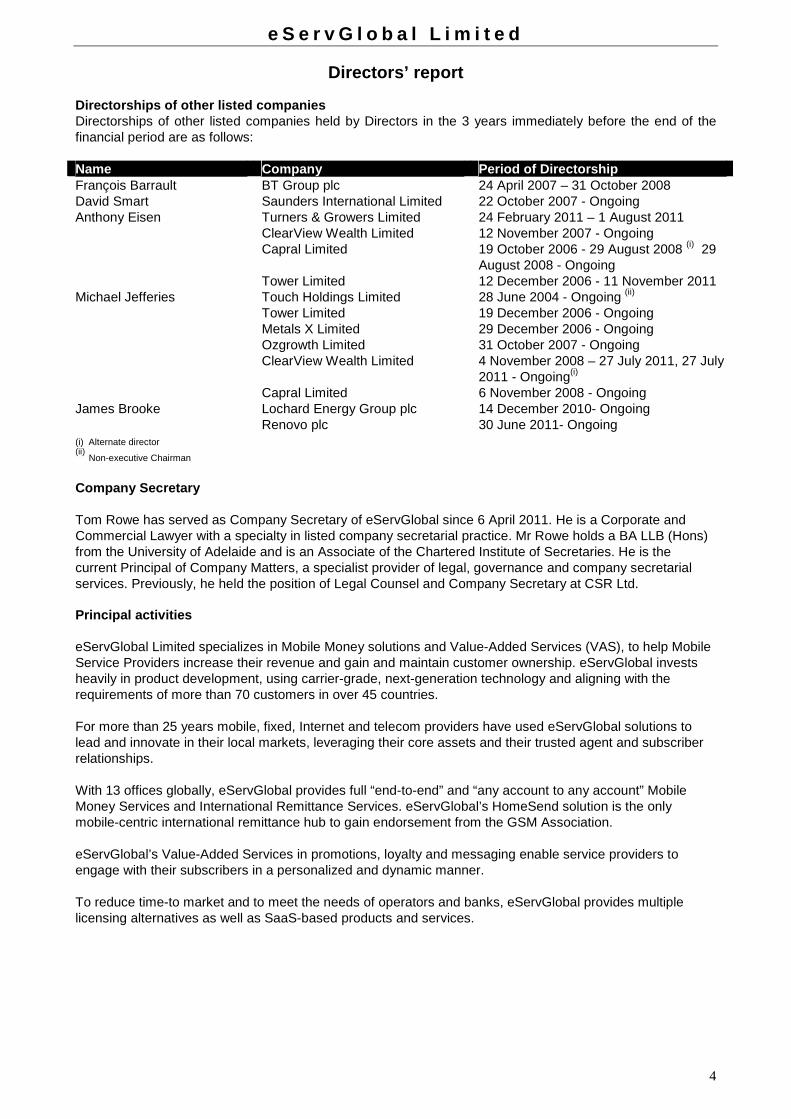
Directors’ report Directorships of other listed companies Directorships of other listed companies held by Directors in the 3 years immediately before the end of the financial period are as follows: Name Company Period of Directorship François Barrault BT Group plc 24 April 2007 – 31 October 2008 David Smart Saunders International Limited 22 October 2007 - Ongoing Anthony Eisen Turners & Growers Limited
ClearView Wealth Limited Capral Limited Tower Limited
24 February 2011 – 1 August 2011 12 November 2007 - Ongoing 19 October 2006 - 29 August 2008 (i) 29 August 2008 - Ongoing 12 December 2006 - 11 November 2011
Michael Jefferies Touch Holdings Limited 28 June 2004 - Ongoing (ii) Tower Limited 19 December 2006 - Ongoing Metals X Limited 29 December 2006 - Ongoing Ozgrowth Limited 31 October 2007 - Ongoing ClearView Wealth Limited 4 November 2008 – 27 July 2011, 27 July
2011 - Ongoing(i) Capral Limited 6 November 2008 - Ongoing James Brooke Lochard Energy Group plc
Renovo plc 14 December 2010- Ongoing 30 June 2011- Ongoing
(i) Alternate director (ii) Non-executive Chairman
Company Secretary Tom Rowe has served as Company Secretary of eServGlobal since 6 April 2011. He is a Corporate and Commercial Lawyer with a specialty in listed company secretarial practice. Mr Rowe holds a BA LLB (Hons) from the University of Adelaide and is an Associate of the Chartered Institute of Secretaries. He is the current Principal of Company Matters, a specialist provider of legal, governance and company secretarial services. Previously, he held the position of Legal Counsel and Company Secretary at CSR Ltd. Principal activities eServGlobal Limited specializes in Mobile Money solutions and Value-Added Services (VAS), to help Mobile Service Providers increase their revenue and gain and maintain customer ownership. eServGlobal invests heavily in product development, using carrier-grade, next-generation technology and aligning with the requirements of more than 70 customers in over 45 countries. For more than 25 years mobile, fixed, Internet and telecom providers have used eServGlobal solutions to lead and innovate in their local markets, leveraging their core assets and their trusted agent and subscriber relationships. With 13 offices globally, eServGlobal provides full “end-to-end” and “any account to any account” Mobile Money Services and International Remittance Services. eServGlobal’s HomeSend solution is the only mobile-centric international remittance hub to gain endorsement from the GSM Association. eServGlobal’s Value-Added Services in promotions, loyalty and messaging enable service providers to engage with their subscribers in a personalized and dynamic manner. To reduce time-to market and to meet the needs of operators and banks, eServGlobal provides multiple licensing alternatives as well as SaaS-based products and services.

e S e r v G l o b a l L i m i t e d
5
Directors’ report Review of operations This report is to be read in conjunction with other reports issued contemporaneously. eServGlobal announced on 22 November 2011 that it had changed its financial year end from 30 June to 31 October. The change of year-end is intended to better align the company's reporting period with the budgeting cycles of its customer base given the shift in customers and operations since the divestiture of the USP business and assets to Oracle Australia Pty Limited. The consolidated entity achieved sales revenue for the four month period of $7.0M (year to 30 June 2011 $42.8M). The four month period from 1 July to 31 October is traditionally a slow period for eServGlobal, incorporating Ramadan and the Northern hemisphere summer. The EBITDA loss was $6.2M (year to 30 June 2011 EBITDA profit $52.2M). The net result of the consolidated entity for the four months to 31 October 2011 was a loss after tax and minority interest for the period of $9.3M (year to 30 June 2011 profit after tax and minority interest $39.2M). Loss per share was 4.7 cents (year to 30 June 2011: profit per share: 19.8 cents). The operating cash flow for the period was a net outflow of $8.8M. Total cash flow for the period was a net outflow of $50.6M as a result of a dividend and capital distribution to shareholders in August 2011 ($57.1M). Cash at 31 October 2011 was $10.1M. Changes in state of affairs
There were no significant changes in the state of affairs of the Group during the financial period. Subsequent Events
On 30 July 2011 eServGlobal received notification from Oracle claiming that it had or anticipated incurring losses in connection with three alleged joint customer billing issues and was entitled to be indemnified by eServGlobal pursuant to the transaction agreements in connection with these losses. Oracle had claimed against the escrow fund in connection with these losses for the amount of $11.5 million. The claim on the escrow amount was resolved in November 2011. In accordance with the resolution, Oracle released the full $11.5M escrow amount to eServGlobal and eServGlobal paid for services delivered by Oracle which were incurred and fully provided in the prior financial year. Future developments Disclosure of information regarding likely developments in the operations of the Group in future financial years and the expected results of those operations is likely to result in unreasonable prejudice to the Group. Accordingly, this information has not been disclosed in this report. Share options Share options granted to directors and executives During the financial period and up to the date of this report the company granted nil options to executives and employees of the entity (year to 2011: 7,300,000).

e S e r v G l o b a l L i m i t e d
6
Directors’ report eServGlobal Employee Share Option Plan The company has an ownership-based remuneration scheme for directors, executives and employees. In accordance with the provisions of the scheme, directors and employees may be granted options to acquire ordinary shares in the company. The Board believes that the options scheme has a significant role to play in motivating employees to help ensure the continued performance of the company. The exercise of any share options is not dependant on any performance criteria, however, is dependent on a period of service relative to the vesting dates. The company issued nil (year to June 2011: 7,300,000) options during the financial period. At the date of this report directors, executives and employees are entitled to purchase 6,710,000 (June 2011: 7,760,000) ordinary shares of the entity at issue prices ranging from $0.48146 to $0.80146 per ordinary share. At 31 October 2011, 410,000 (30 June 2011: 460,000) of these options had vested. The options may be exercised at various times up until 10 February 2016. The holders of such options do not have the right, by virtue of the option to participate in any share issue or interest issue of any other body corporate or scheme, and do not participate in any dividends declared. During the financial period 50,000 options lapsed/ expired. From the financial period end and up to the date of this report nil options expired and 1,000,000 options held by the Managing Director were cancelled in November 2011. Further details of the executive and employee share option plan are disclosed in Note 6 to the financial statements. Details of unissued shares under option as at the date of this report are:
Issuing Entity Number of shares
under option Class of shares Exercise price of
option (i) Expiry date of options
eServGlobal Limited 6,300,000 Ordinary $0.48146 10 February 2016
eServGlobal Limited 300,000 Ordinary $0.52146 6 March 2012
eServGlobal Limited 110,000 Ordinary $0.80146 3 October 2012 (i) In accordance with the terms of the employee share option plan, the exercise price of the options have been reduced by the capital
return of $0.16854 per share declared on 8 August 2011.
During the financial period and up to the date of this report, there were no options exercised. Indemnification of officers and auditors During the financial period, the company paid a premium in respect of a contract insuring the directors of the company (as named above), the company secretary, and all executive officers of the company and of any related body corporate against any liability incurred as a director, secretary or executive officer to the extent permitted by the Corporations Act 2001. The contract of insurance prohibits disclosure of the nature of the liability cover and the amount of the premium. The company has not otherwise, during or since the financial period, indemnified or agreed to indemnify an officer or auditor of the company or of any related body corporate, against any liability incurred by such an officer or auditor. Directors’ attendance at Board and Committee meetin gs held during the financial period
Board of Directors Audit Committee Remuneration and Nomination Committee
Directors Held * Attended Held * Attended Held * Attended
David Smart 9 9 3 3 - - François Barrault 9 6 - - 5 5 Anthony Eisen 9 6 3 2 5 5 Richard Mathews 9 9 - - - - James Brooke 9 6 - - - - Stephen Baldwin - - - - - - Craig Halliday 9 7 - - - - *Held during term of director’s appointment to Board, Audit or Remuneration and Nomination Committees. Stephen Baldwin was not a director during the financial period.

e S e r v G l o b a l L i m i t e d
7
Directors’ report Non-audit services The directors are satisfied that the provision of non-audit services, during the financial period, by the auditor (or by another person or firm on the auditor’s behalf) is compatible with the general standard of independence for auditors imposed by the Corporations Act 2001. The audit committee, in conjunction with the Chief Financial Officer, assesses the provision of non-audit services by the auditors to ensure that the auditor independence requirements of the Corporations Act 2001 in relation to the audit are met. Details of amounts paid or payable to the auditor for non-audit services provided during the financial period by the auditor are outlined in note 7 to the financial statements. Auditor’s independence declaration The auditor’s independence declaration is included on page 15 of the financial report. Rounding off of amounts The company is a company of the kind referred to in ASIC Class Order 98/0100, dated 10 July 1998, and in accordance with that Class Order, amounts in the directors’ report and the financial report are rounded off to the nearest thousand dollars unless otherwise indicated.

e S e r v G l o b a l L i m i t e d
8
Directors’ report Remuneration Report Determining remuneration policy for directors and e xecutives, and its relationship to eServGlobal’s performance The Company is listed on both the Australian Securities Exchange and the London Stock Exchange (AIM). It is an international group which is faced with all of the market pressures that flow in such circumstances. It must compete successfully with other international organisations that are substantially larger and which have the ability to draw on enormous resources. Our employees are based in diverse parts of the globe and regularly must travel to work in remote locations. The remuneration policies must be appropriate to these circumstances. In determining the appropriate remuneration policies for the Group, the Board believes that the salary packages must be sufficient, in the international marketplace in which the Group operates, to attract, retain and motivate high calibre, hard working, dedicated employees, who have the knowledge and skills appropriate for the business. In this regard, a component of the salary package for employees is paid after the results of a financial year are completed, and the entitlement is based primarily on the results achieved by the Group. The Board’s broad policy is implemented through its Remuneration and Nominations Committee. Director and group executive details The following persons acted as directors of the Company and the Group during or since the end of the financial period:
• Richard Mathews (Non-executive Chairman) • David Smart (Non-executive director) • François Barrault (Non-executive director) • Anthony Eisen (Non-executive director, resigned 24 October 2011) • Michael Jefferies (Alternate for Anthony Eisen, resigned 24 October 2011) • James Brooke (Non-executive director) • Craig Halliday (Chief Executive Officer and Executive Director) • Stephen Baldwin (Non-executive director, appointed 25 November 2011)
The executives of the Group for the financial period to 31 October 2011 were:
• Craig Halliday (Chief Executive Officer) • Stephen Blundell (Chief Financial Officer) • Remi Arame (Vice President Sales)

e S e r v G l o b a l L i m i t e d
9
Directors’ report
Elements of director and executive remuneration Non-executive directors are paid directors’ fees and, in the case of those who are Australian based, compulsory superannuation fund contributions are made on their behalf. The Board reviews the level of fees from time to time, and sets individual non-executive directors fees based on the levels of fees for comparable listed companies in the appropriate parts of the world. The non-executive directors are appointed by either the Board or shareholder vote and any appointment is subject to re-election on retirement required at Annual General Meetings. The Chief Executive Officer (CEO) is remunerated on a salary package that includes a base salary, and health plan contributions and a substantial portion that is a variable component, which is dependent on agreed performance objectives. The variable component comprises elements relating to achievement of financial plan and specific business objectives. The CEO is a permanent employee with no fixed employment term and a notice period of six months required by either party. The Chief Financial Officer (CFO) is remunerated on a salary package basis that includes a base salary, pension contributions and a portion that is a variable component which is dependent on agreed performance objectives. The variable component comprises elements relating to achievement of financial plan and specific business objectives. The CFO is a permanent employee with no fixed employment term and a notice period of six months required by either party. The Vice President Sales is remunerated on a salary package that includes a base salary, a portion that is a variable component (which is dependent on agreed performance objectives relating to sales), pension contributions and various allowances such as housing and education. The Vice President Sales is a permanent employee with no fixed employment term and a notice period of three months required by either party.

e S e r v G l o b a l L i m i t e d
10
Directors’ report
Elements of remuneration which are dependent on com pany performance The Board believes that it is critical that the specified employees are driven by the financial performance of eServGlobal and, as detailed below, has structured executive packages so that a substantial portion of the variable component of their packages is directly linked to financial outcomes of eServGlobal. The targets are established annually and are approved by the Board at the same time as approval of the Group’s business plan. The two key measures of this are: annual revenue and earnings before interest, tax, depreciation and amortisation components. This component is confirmed in conjunction with the completion of the financial statements. These targets are selected to ensure alignment of shareholders’ interests with executive remuneration. The tables below set out summary information about Group’s earnings and movements in shareholder wealth for the four years to June 2011 and the four month period to October 2011:
31 October 2011 $'000
30 June 2011 $'000
30 June 2010 $'000
30 June 2009 $'000
30 June 2008 $'000
Revenue 7,017 42,808 78,015 147,246 177,934
EBITDA (6,186) 52,173 (20,574) (5,261) 24,162
31 October
2011 30 June
2011 30 June
2010 30 June
2009 30 June
2008
Share price at start of year $0.730 $0.600 $0.455 $0.820 $0.960
Share price at end of year $0.520 $0.730 $0.600 $0.455 $0.820
Interim dividend - - - -
Final dividend 1, 2 12.1 cps - - - 3.0 cps
Capital distribution 16.9 cps - - - -
Basic earnings per share (4.7) 19.8 (16.5) (20.1) 6.1
Diluted earnings per share (4.7) 19.8 (16.5) (20.1) 6.0 1 Final dividend declared for the financial year ended June 2008 was unfranked. 2 Declared after the balance date and not reflected as a liability in the financial statements.

e S e r v G l o b a l L i m i t e d
11
Directors’ report The directors and the group’s key executives received, or will receive, the following amounts as compensation for their services as directors and executives of the Group during the financial period:
Non-executive Directors
R Mathews 46,667 - - 4,200 - - 50,867 -
F Barrault 28,477 - - - - - 28,477 -
J Brooke (i) - - - - - - - -
A Eisen (i) (vi) - - - - - - - -
M Jeffries (i) (vi) - - - - - - - -
D Smart 29,583 - - 2,663 - - 32,246 -
Key Group Executives
R Arame (ii) (iii) 124,217 95,278 13,775 11,686 35,830 280,786 47%
S Blundell (ii) (iv) 82,313 31,088 - 4,607 35,830 - 153,838 43%
C Halliday (ii) (v) 160,250 54,799 6,147 - 35,830 - 257,026 35%
Total 471,507 181,165 19,922 23,156 107,490 - 803,240 -
(i) A Eisen, M Jeffries and J Brooke have agreed that they will receive no benefit for their services.
(ii) Key management personnel are remunerated on a salary package basis that includes an appropriate portion that is a variable component which is dependent on company performance. Key management personnel had their variable pay
components confirmed in conjunction with the completion of the financial statements. The variable components for key management personnel were confirmed on the achievement of customer orders or earnings before interest, tax,
depreciation and amortisation targets established during the financial period.
(iii) Paid in Euros and subject to foreign exchange fluctuations at Group level.
(iv) Paid in GBP and subject to foreign exchange fluctuations at Group level.
(v) Paid in USD and subject to foreign exchange fluctuations at Group level.
(vi) Resigned on 24 October 2011.
Short-term employee benefits
Post Employment
benefits Share based
payments
Four months to 31 October 2011 Salary & fees
Bonus (incl. variable pay component)
Non-monetary
Superannuation Options Termination
Benefits Total
Percentage of remuneration
related to performance
$ $ $ $ $ $ $ %

e S e r v G l o b a l L i m i t e d
12
Directors’ report The directors and the group’s key executives received the following amounts as compensation for their services as directors and executives of the Group during the previous financial year:
Non-executive Directors
R Mathews (vi) 331,867 575,000 - 13,996 - 238,324 1,159,187 50%
F Barrault 83,894 - - - - - 83,894 -
J Brooke (i) (viii) - - - - - - - -
I Buddery (ix) 5,833 - - 525 - - 6,358 -
A Eisen (i) - - - - - - - -
M Jeffries (i) - - - - - - - -
D Smart 107,708 9,694 - - 117,402 -
Key Group Executives
R Arame (ii) (iii) 270,309 193,549 7,901 36,893 33,500 - 542,152 42%
S Blundell (ii) (iv) 237,984 143,792 - 14,480 33,500 - 429,756 41% J C Bouillon (ii) (iii) (vii) 183,957 41,408 10,942 - - - 236,307 18% C Halliday (ii) (v) 459,873 739,242 18,763 - 33,500 - 1,251,378 62%
J Lilienstein (ii) (vii) 165,124 125,000 - 3,615 - - 293,739 43%
Total 1,846,549 1,817,991 37,606 79,203 100,500 238,324 4,120,173 -
(i) A Eisen, M Jeffries and J Brooke have agreed that they will receive no benefit for their services.
(ii) Key management personnel are remunerated on a salary package basis that includes an appropriate portion that is a variable component which is dependent on company performance. Key management personnel had their variable
pay components confirmed in conjunction with the completion of the financial statements. The variable components for key management personnel were confirmed on the achievement of customer orders or earnings before interest,
tax, depreciation and amortisation targets established during the year.
(iii) Paid in Euros and subject to foreign exchange fluctuations at Group level.
(iv) Paid in GBP and subject to foreign exchange fluctuations at Group level.
(v) Paid in USD and subject to foreign exchange fluctuations at Group level.
(vi) Termination benefits paid of $238,324 in relation to resignation of R Mathews as Chief Executive Officer on 26 November 2010.
(vii) J C Bouillon and J Lilienstein resigned on 17 March 2011 and 6 April 2011 respectively.
(viii) Appointed on 26 July 2010.
(ix) I Buddery resigned on 26 July 2010
Short-term employee benefits
Post Employment
benefits Share based
payments
2011 Salary & fees
Bonus (incl. variable pay component)
Non-monetary
Superannuation Options Termination
Benefits Total
Percentage of remuneration
related to performance
$ $ $ $ $ $ $ %

e S e r v G l o b a l L i m i t e d
13
Directors’ report
Directors’ shareholdings The following table sets out each director’s relevant interest in shares and options in shares of the company or a related body corporate during the financial period and as at the date of this report.
Directors
Fully paid ordinary shares
Executive share options
David Smart 40,000 -
Craig Halliday
62,005 3 7,272,727 5
16,110,592 2 - François Barrault 500,000 - Anthony Eisen 1 38,316,296 -
Richard Mathews 16,110,592 2
206,683 3 - James Brooke4 35,153,419 - Michael Jefferies 1 38,316,296 - Stephen Baldwin 932,600 1 Shares held or beneficially owned by Guinness Peat Group of which Anthony Eisen and Michael Jefferies are both executives. 2 Relevant interest in shares held by MHB Holdings Pty Ltd. 3 Relevant interest in shares held by Paua Pty Ltd. 4 Shares held by Henderson Global Investors Limited of which James Brooke is an executive. 5 Shares held by National Nominees Limited
Value of options issued to directors and executives Nil options were granted to or vested in directors and executives in the current financial period. Executives receiving options are entitled to the beneficial interest under the option only if they continue to be employed with the Group at the time the option vests. Any exposure in relation to the risk associated with the movement in the underlying share price rests with the executive. During the financial period no options were forfeited as a result of a condition required for vesting not being satisfied. 1,000,000 options held by the Managing Director were cancelled in November 2011. The following table discloses the options granted, exercised or expired/cancelled during the financial period: Name Value of options
granted at the grant date (i)
$
Value of options exercised at the
exercise date $
Value of options expired
$ R Arame - - - S Blundell - - - C Halliday - - -
(i) The value of options granted, exercised and lapsed is calculated based on the following:
• Value at grant date represents fair value of the option at grant date multiplied by the number of options granted during
the financial period.
• Value at exercise date represents fair value of the ordinary share received upon exercise of the option, less the option
exercise price multiplied by the number of options exercised during the financial period.
• Value at expiry/cancellation date represents fair value of the ordinary shares expired/cancelled multiplied by the
number of options expired/cancelled during the financial period.

e S e r v G l o b a l L i m i t e d
14
Directors’ report
During the financial period, the following share-based payment arrangements were in existence.
Options series Grant date Expiry date Exercise price Grant date fair
value
Issued 7 March 2007 07-Mar-07 2012 $0.52146 $0.33
Issued 4 October 2007 04-Oct-07 2012 $0.80146 $0.44
Issued 11 February 2011 07-Mar-11 2016 $0.48146 $0.16 (i) In accordance with the terms of the Employee Share Option Plan the options issued vest as to one-third on each of the first, second and third
anniversary dates from the date of issue and expire five years from date of issue.
Signed in accordance with a resolution of the directors made pursuant to s.298 (2) of the Corporations Act 2001. On behalf of the Board
Richard Mathews Chairman 31 January 2012

Liability limited by a scheme approved under Professional Standards Legislation. Member of Deloitte Touche Tohmatsu Limited 15
31 January 2012 The Board of Directors eServGlobal Limited Suite 5 30 Florence Street Teneriffe QLD 4006 Dear Board Members
eServGlobal Limited In accordance with section 307C of the Corporations Act 2001, I am pleased to provide the following declaration of independence to the directors of eServGlobal Limited. As lead audit partner for the audit of the financial statements of eServGlobal Limited for the financial period ended 31 October 2011, I declare that to the best of my knowledge and belief, there have been no contraventions of:
(i) the auditor independence requirements of the Corporations Act 2001 in relation to the audit; and
(ii) any applicable code of professional conduct in relation to the audit. Yours faithfully DELOITTE TOUCHE TOHMATSU Weng W Ching Partner Chartered Accountants
Deloitte Touche Tohmatsu ABN 74 490 121 060 Grosvenor Place 225 George Street Sydney NSW 2000 PO Box N250 Grosvenor Place Sydney NSW 1217 Australia DX 10307SSE Tel: +61 (0) 2 9322 7000 Fax: +61 (0) 2 9322 7001 www.deloitte.com.au

e S e r v G l o b a l L i m i t e d
16
Corporate governance statement
The eServGlobal Limited board is responsible for establishing the corporate governance framework of the group having regard to the ASX Corporate Governance Council (CGC) published guidelines as well as its corporate governance principles and recommendations. eServGlobal is also required to comply with, inter alia, the Corporations Act 2001 (Cwth), the ASX Listing Rules and the London Stock Exchange AIM Rules for Companies. The table below and accompanying statement outlines the main corporate governance practices of eServGlobal during the financial period and the extent of eServGlobal’s compliance with the CGC’s recommendations as at the date of this report.
Recommendation Comply
Principle 1 – Lay solid foundations for management a nd oversight
1.1 Companies should establish the functions reserved to the board and those delegated to senior executives and disclose those functions.
√
1.2 Companies should disclose the process for evaluating the performance of senior executives.
√
1.3 Companies should provide the information indicated in the Guide to reporting on Principle 1. √*
Recommendation Comply
Principle 2 - Structure the board to add value
2.1 A majority of the board should be independent directors. x 2.2 The chair should be an independent director.
x
2.3 The roles of chair and chief executive officer (CEO) should not be exercised by the same individual.
√
2.4 The board should establish a nomination committee. √ 2.5 Companies should disclose the process for evaluating the performance of the board, its
committees and individual directors. √
2.6 Companies should provide the information indicated in the Guide to reporting on Principle 2. √
Recommendation Comply
Principle 3 - Promote ethical and responsible decisio n-making
3.1 Companies should establish a code of conduct and disclose the code or a summary of the code as to: • The practices necessary to maintain confidence in the company’s integrity; • The practices necessary to take into account their legal obligations and the reasonable
expectations of their stakeholders; and • The responsibility and accountability of individuals for reporting and investigating
reports of unethical practices.
√
3.2 Companies should establish a policy concerning diversity and disclose the policy or a summary of that policy. The policy should include requirements for the board to establish measurable objectives for achieving gender diversity for the board to assess annually both the objectives and the progress in achieving them.
x
3.3 Companies should disclose in each annual report the measurable objectives for achieving gender diversity set by the board in accordance with the diversity policy and progress towards achieving them.
x
3.4 Companies should disclose in each annual report the proportion of women employees in the whole organisation, women in senior executive positions and women on the board.
√
3.5 Companies should provide the information indicated in the Guide to reporting on Principle 3. √
e S e r v G l o b a l L i m i t e d
17
Corporate governance statement
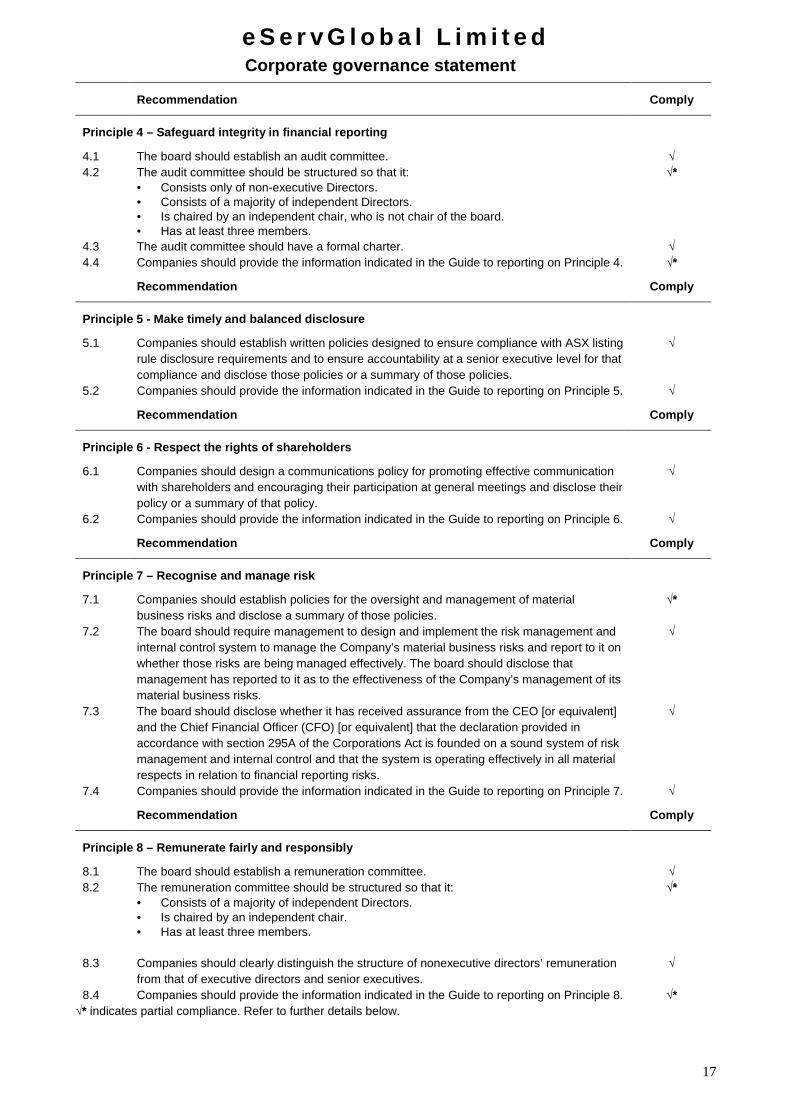
Recommendation Comply
Principle 4 – Safeguard integrity in financial repor ting
4.1 The board should establish an audit committee. √ 4.2 The audit committee should be structured so that it:
• Consists only of non-executive Directors. • Consists of a majority of independent Directors. • Is chaired by an independent chair, who is not chair of the board. • Has at least three members.
√*
4.3 The audit committee should have a formal charter. √ 4.4 Companies should provide the information indicated in the Guide to reporting on Principle 4. √*
Recommendation Comply
Principle 5 - Make timely and balanced disclosure
5.1 Companies should establish written policies designed to ensure compliance with ASX listing rule disclosure requirements and to ensure accountability at a senior executive level for that compliance and disclose those policies or a summary of those policies.
√
5.2 Companies should provide the information indicated in the Guide to reporting on Principle 5. √
Recommendation Comply
Principle 6 - Respect the rights of shareholders
6.1 Companies should design a communications policy for promoting effective communication with shareholders and encouraging their participation at general meetings and disclose their policy or a summary of that policy.
√
6.2 Companies should provide the information indicated in the Guide to reporting on Principle 6. √
Recommendation Comply
Principle 7 – Recognise and manage risk
7.1 Companies should establish policies for the oversight and management of material business risks and disclose a summary of those policies.
√*
7.2 The board should require management to design and implement the risk management and internal control system to manage the Company’s material business risks and report to it on whether those risks are being managed effectively. The board should disclose that management has reported to it as to the effectiveness of the Company’s management of its material business risks.
√
7.3 The board should disclose whether it has received assurance from the CEO [or equivalent] and the Chief Financial Officer (CFO) [or equivalent] that the declaration provided in accordance with section 295A of the Corporations Act is founded on a sound system of risk management and internal control and that the system is operating effectively in all material respects in relation to financial reporting risks.
√
7.4 Companies should provide the information indicated in the Guide to reporting on Principle 7. √
Recommendation Comply
Principle 8 – Remunerate fairly and responsibly
8.1 The board should establish a remuneration committee. √ 8.2 The remuneration committee should be structured so that it:
• Consists of a majority of independent Directors. • Is chaired by an independent chair. • Has at least three members.
√*
8.3 Companies should clearly distinguish the structure of nonexecutive directors’ remuneration from that of executive directors and senior executives.
√
8.4 Companies should provide the information indicated in the Guide to reporting on Principle 8. √* √* indicates partial compliance. Refer to further details below.
e S e r v G l o b a l L i m i t e d
18
Corporate governance statement
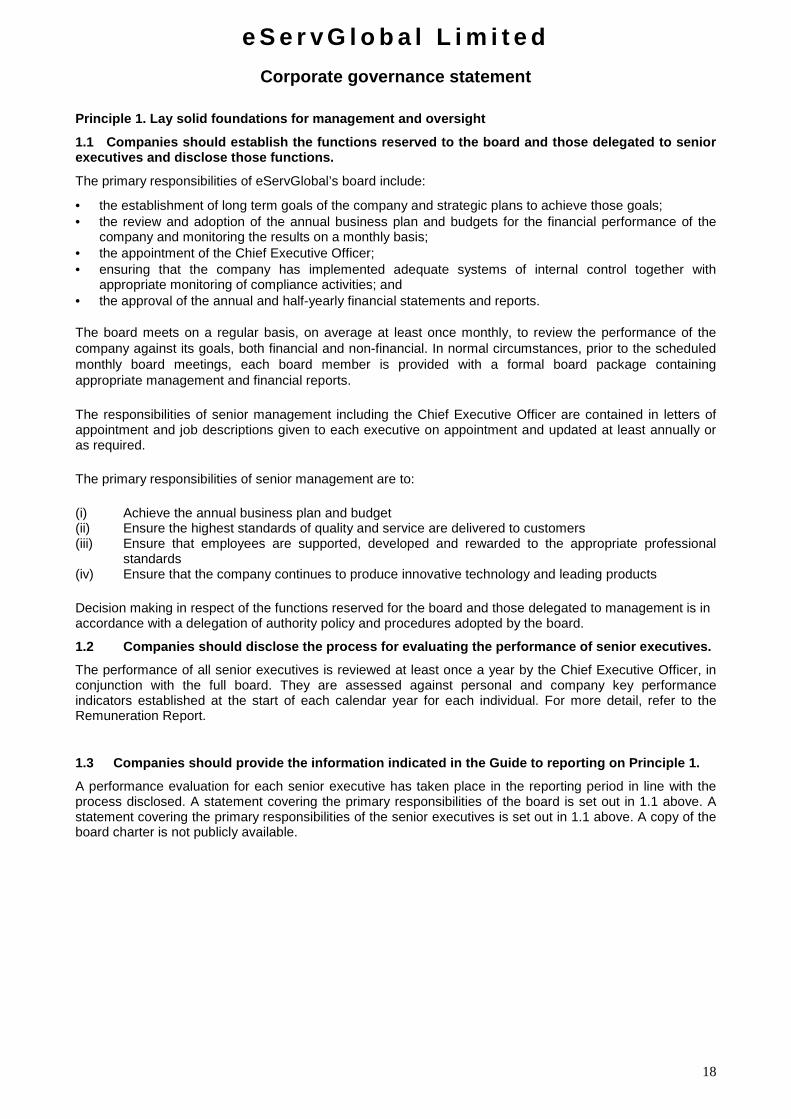
Principle 1. Lay solid foundations for management a nd oversight
1.1 Companies should establish the functions rese rved to the board and those delegated to senior executives and disclose those functions.
The primary responsibilities of eServGlobal’s board include:
• the establishment of long term goals of the company and strategic plans to achieve those goals; • the review and adoption of the annual business plan and budgets for the financial performance of the
company and monitoring the results on a monthly basis; • the appointment of the Chief Executive Officer; • ensuring that the company has implemented adequate systems of internal control together with
appropriate monitoring of compliance activities; and • the approval of the annual and half-yearly financial statements and reports.
The board meets on a regular basis, on average at least once monthly, to review the performance of the company against its goals, both financial and non-financial. In normal circumstances, prior to the scheduled monthly board meetings, each board member is provided with a formal board package containing appropriate management and financial reports.
The responsibilities of senior management including the Chief Executive Officer are contained in letters of appointment and job descriptions given to each executive on appointment and updated at least annually or as required.
The primary responsibilities of senior management are to:
(i) Achieve the annual business plan and budget (ii) Ensure the highest standards of quality and service are delivered to customers (iii) Ensure that employees are supported, developed and rewarded to the appropriate professional
standards (iv) Ensure that the company continues to produce innovative technology and leading products
Decision making in respect of the functions reserved for the board and those delegated to management is in accordance with a delegation of authority policy and procedures adopted by the board.
1.2 Companies should disclose the process for evalu ating the performance of senior executives.
The performance of all senior executives is reviewed at least once a year by the Chief Executive Officer, in conjunction with the full board. They are assessed against personal and company key performance indicators established at the start of each calendar year for each individual. For more detail, refer to the Remuneration Report. 1.3 Companies should provide the information indica ted in the Guide to reporting on Principle 1.
A performance evaluation for each senior executive has taken place in the reporting period in line with the process disclosed. A statement covering the primary responsibilities of the board is set out in 1.1 above. A statement covering the primary responsibilities of the senior executives is set out in 1.1 above. A copy of the board charter is not publicly available.

e S e r v G l o b a l L i m i t e d
19
Corporate governance statement
Principle 2. Structure the board to add value
2.1 A majority of the board should be independent d irectors.
The eServGlobal board consists of five non-executive directors and one executive director. David Smart, Stephen Baldwin and Francois Barrault are considered to be independent directors. Richard Mathews and James Brooke are not, and Anthony Eisen was not, considered to be independent by virtue of being associated with substantial shareholders of the company. Craig Halliday is not considered independent as he is the Chief Executive Officer of the company. As such, a majority of the board are not independent directors. Even though four directors during the financial period are not considered to be independent by virtue of the various indicia, the board believes that the composition was appropriate for the business during the financial period. Since the end of the financial period, the appointment of Stephen Baldwin has seen the board composed equally of independent and non-independent directors. The board believes the composition is appropriate at the present stage and will continue to review this on an ongoing basis.
2.2 The chair should be an independent director.
Richard Mathews is the former Chief Executive Officer of the Company and stepped into the position of Chairman of the Board in 2010. While this movement resulted in a chairman who is not independent, the company believes that a chairman with a strong knowledge of the company’s operations is in the best interests of the company at this stage.
2.3 The roles of chair and chief executive officer should not be exercised by the same individual.
Richard Mathews is the company’s Chairman and Craig Halliday is the Chief Executive Officer.
2.4 A nomination committee should be established.
The Company has established a Remuneration and Nomination Committee. The members of this Committee were Anthony Eisen and Francois Barrault during the period and is now Francois Barrault and Stephen Baldwin and, due to the size of the Committee, it functions informally. Many of the functions of the Remuneration and Nomination Committee were also carried out in conjunction with the full board.
2.5 Companies should disclose the process for evalu ating the performance of the board, its committees and individual directors.
The eServGlobal chairman undertakes an annual informal evaluation process in reviewing the performance of directors and the board.
2.6 Companies should provide the information indicated in the Guide to reporting on Principle 2
A description of the skills and experience of each director is contained in the Directors’ Report.
The names of the directors considered to be independent are specified in 2.1 above. Directors are able to take independent professional advice at the expense of the company, with the prior agreement of the chairman. The period of office held by each director is specified in the Directors’ Report. An informal evaluation of the board of directors did take place during the reporting period as described at 2.5 above. New directors are selected by and voted on by the board. The board does not have a formal policy for the nomination and appointment of directors but considers the position on merit on a case by case basis. Any director appointed by the board must retire at the next Annual General Meeting of the company but may submit himself/herself for re-election. Further, each year, a third of directors retire by rotation and are subject to re-election by shareholders at the Annual General Meeting.
A copy of the Remuneration and Nomination Committee charter is not publicly available.
e S e r v G l o b a l L i m i t e d
20
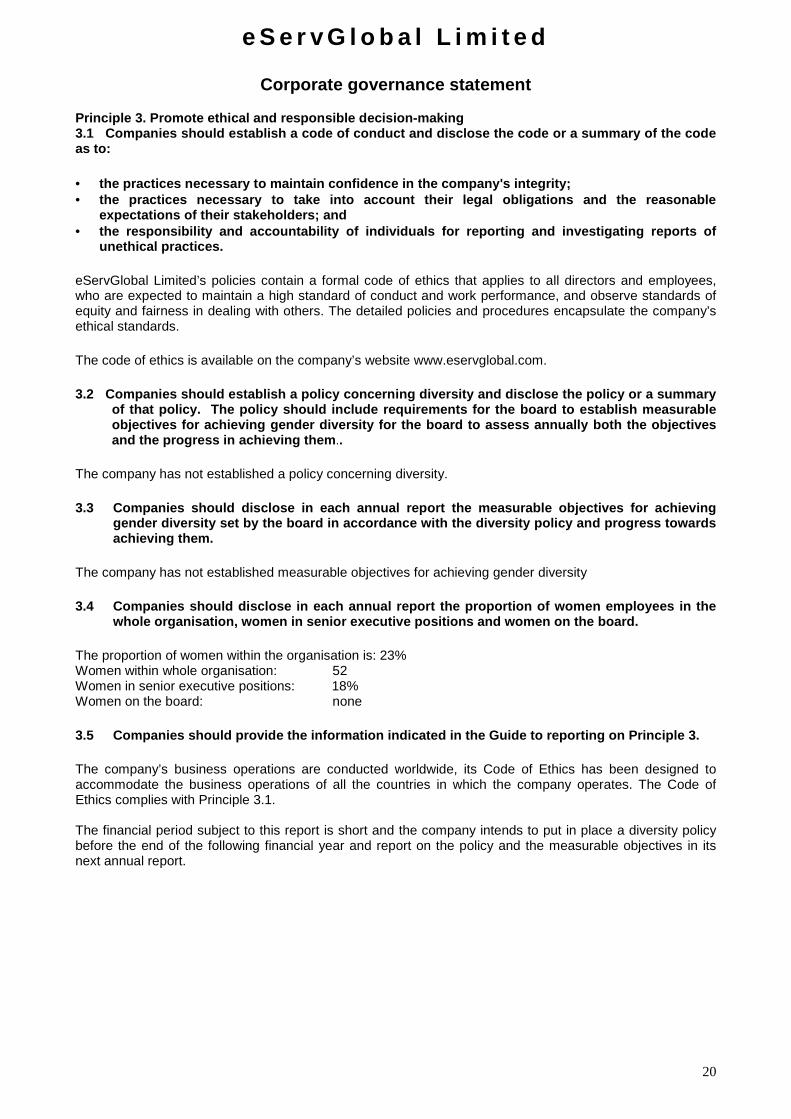
Corporate governance statement Principle 3. Promote ethical and responsible decisi on-making 3.1 Companies should establish a code of conduct and di sclose the code or a summary of the code as to:
• the practices necessary to maintain confidence in t he company's integrity; • the practices necessary to take into account their legal obligations and the reasonable
expectations of their stakeholders; and • the responsibility and accountability of individual s for reporting and investigating reports of
unethical practices.
eServGlobal Limited’s policies contain a formal code of ethics that applies to all directors and employees, who are expected to maintain a high standard of conduct and work performance, and observe standards of equity and fairness in dealing with others. The detailed policies and procedures encapsulate the company’s ethical standards.
The code of ethics is available on the company’s website www.eservglobal.com.
3.2 Companies should establish a policy concernin g diversity and disclose the policy or a summary of that policy. The policy should include requirem ents for the board to establish measurable objectives for achieving gender diversity for the b oard to assess annually both the objectives and the progress in achieving them ..
The company has not established a policy concerning diversity.
3.3 Companies should disclose in each annual report the measurable objectives for achieving gender diversity set by the board in accordance wit h the diversity policy and progress towards achieving them.
The company has not established measurable objectives for achieving gender diversity
3.4 Companies should disclose in each annual report the proportion of women employees in the whole organisation, women in senior executive posit ions and women on the board.
The proportion of women within the organisation is: 23% Women within whole organisation: 52 Women in senior executive positions: 18% Women on the board: none
3.5 Companies should provide the information indica ted in the Guide to reporting on Principle 3.
The company’s business operations are conducted worldwide, its Code of Ethics has been designed to accommodate the business operations of all the countries in which the company operates. The Code of Ethics complies with Principle 3.1. The financial period subject to this report is short and the company intends to put in place a diversity policy before the end of the following financial year and report on the policy and the measurable objectives in its next annual report.

e S e r v G l o b a l L i m i t e d
21
Corporate governance statement Principle 4. Safeguard integrity in financial repor ting
4.1 The board should establish an audit committee. The company has established an Audit Committee.
4.2 The audit committee should be structured so tha t it:
• consists only of non-executive directors. • consists of a majority of independent directors. • is chaired by an independent chair, who is not chai r of the board. • has at least three members. The Audit Committee comprised David Smart and Anthony Eisen during the financial period and now includes Stephen Baldwin following Anthony Eisen’s resignation. All members of the Audit Committee are qualified and experienced accountants. Of the Committee members, David Smart and Stephen Baldwin are considered to be independent directors. Despite this and despite not having at least three members, the board believes that the Audit Committee has the required independence and competence and is of an appropriate size for the company. 4.3 The audit committee should have a formal charte r. The company has adopted an Audit Committee charter. 4.4 Companies should provide the information indica ted in the Guide to reporting on Principle 4
The names and qualifications of the audit committee members and the number of meetings of the audit committee are contained in the Directors’ Report. The Audit Committee charter is not publicly available on the company’s website. The Audit Committee meets with and receives regular reports from the external auditors concerning any matters that arise in connection with the performance of their role, including the adequacy of internal controls. In conjunction with the auditors, the Audit Committee monitors the term of the external audit engagement partner and ensures that the regulatory limit for such term is not exceeded. At the completion of the term, or earlier in some circumstances, the auditor nominates a replacement engagement partner. The Audit Committee interviews the nominee to assess relevant prior experience, potential conflicts of interest and general suitability for the role. If the nominee is deemed suitable, the Audit Committee reports to the board on its recommendation. Principle 5. Make timely and balanced disclosure
5.1 Companies should establish written policies des igned to ensure compliance with ASX listing rule disclosure requirements and to ensure accounta bility at a senior executive level for that compliance and disclose those policies or a summary of those policies.
The eServGlobal board, Company Secretary and senior management are aware of the ASX Listing Rules, AIM Rules and Corporations Act disclosure requirements, and take steps to actively monitor and ensure ongoing compliance. At each board meeting, there is a separate agenda item on this topic where directors review the disclosures made by the company over the past month and consider any existing issues that may give rise to further required disclosure. The Chairman and Chief Executive Officer continually monitor developments in the company and its business and in conjunction with the Company Secretary report any developments immediately to the board for consideration. All announcements are reviewed by the Company Secretary and/or other external legal advisers before release to the ASX or AIM.
5.2 Companies should provide the information indica ted in the Guide to reporting on Principle 5.
The company’s continuous disclosure policy is described above.

e S e r v G l o b a l L i m i t e d
22
Corporate governance statement Principle 6. Respect the rights of shareholders
6.1 Companies should design a communications policy for promoting effective communication with shareholders and encouraging their participati on at general meetings and disclose their policy or a summary of that policy.
eServGlobal provides information to its shareholders through the formal communications processes (eg ASX & AIM announcements, annual general meeting, annual report, and shareholder letters). This material is also available on the eServGlobal website (www.eservglobal.com) and on the ASX and AIM websites. Shareholders are encouraged to participate in the AGMs and time is set aside for formal and informal questioning of the board and senior management. The company requests that its external auditor attend the annual general meeting and be available to answer any shareholder questions about the conduct of the audit and the preparation and content of the audit report. 6.2 Companies should provide the information indica ted in the Guide to reporting on Principle 6. The company’s communications policy is described in 6.1 above. Principle 7. Recognise and manage risk 7.1 Companies should establish policies for the ove rsight and management of material business
risks and disclose a summary of those policies. The board monitors the risks and internal controls of eServGlobal in conjunction with the Audit Committee. The Audit Committee looks to the Chief Executive Officer and Chief Financial Officer to ensure that an adequate system is in place to identify and, where possible, appropriately manage and mitigate risks inherent in the business, and to implement appropriate internal controls. Categories of risks managed cover all major aspects of a global technology company. The details are not disclosed as this may disadvantage the company in regard to its competitors. 7.2 The board should require management to design a nd implement the risk management and
internal control system to manage the Company’s mat erial business risks and report to it on whether those risks are being managed effectively. The board should disclose that management has reported to it as to the effectivene ss of the Company’s management of its material business risks.
The board has required management to design and implement the risk management and internal control system to manage the company's material business risks and report to it on whether those risks are being managed effectively. Management has reported to the board as to the effectiveness of the company's management of its material business risks. 7.3 The board should disclose whether it has receiv ed assurance from the CEO [or equivalent]
and the Chief Financial Officer (CFO) [or equivalen t] that the declaration provided in accordance with section 295A of the Corporations Ac t is founded on a sound system of risk management and internal control and that the system is operating effectively in all material respects in relation to financial reporting risks.
The board has received assurance from the Chief Executive Officer and the Chief Financial Officer that the declaration provided in accordance with section 295A of the Corporations Act 2001 is founded on a sound system of risk management and internal control and that the system is operating effectively in all material respects in relation to financial reporting risks. 7.4 Companies should provide the information indica ted in the guide to reporting on Principle 7. The board has received the report from management under recommendation 7.2; the board has received assurance from the Chief Executive Officer and the Chief Financial Officer under recommendation 7.3; the company’s policies on risk oversight and management of material business risks are not publicly available for the reason specified above.

e S e r v G l o b a l L i m i t e d
23
Corporate governance statement Principle 8. Remunerate fairly and responsibly 8.1 The board should establish a remuneration commi ttee. The Company has established a Remuneration and Nomination Committee. The members of that Committee during the period were Anthony Eisen, until his resignation as a director, and Francois Barrault. Stephen Baldwin was appointed as a member of the Remuneration and Nomination Committee in November 2011. 8.2 The remuneration committee should be str uctured so that it: • Consists of a majority of independent directors • Is chaired by an independent chair • Has at least three members. The members of that Committee during the period were Anthony Eisen, until his resignation as a director, and Francois Barrault. Stephen Baldwin was appointed as a member of the Remuneration and Nomination Committee in November 2011 and since his appointment the committee has consisted of a majority of independent directors.
The committee is chaired by Francois Barrault and despite not having three members and not having a majority of independent directors during the period, the board believes the size and membership of the committee is appropriate to discharge its mandate.
8.3 Companies should clearly distinguish th e structure of non-executive directors' remuneratio n from that of executive directors and senior executi ves.
Non-executive directors are paid a fixed directors fee as set out in the Directors’ Report. Senior executives remuneration packages, which consist of base salary, fringe benefits, incentive schemes (including performance related bonuses), superannuation and pension payments and entitlements upon retirement or termination, are reviewed annually with due regard to performance. 8.4 Companies should provide the information indicated in the guide to reporting on Principle 8. The members of the Remuneration and Nomination Committee and its operation are described above. There are no schemes for retirement benefits, other than superannuation, for non-executive directors. Non-executive directors do not receive options or bonus payments. A copy of the Remuneration and Nomination committee charter is not publicly available.

Liability limited by a scheme approved under Professional Standards Legislation. Member of Deloitte Touche Tohmatsu Limited. 24
Independent Auditor’s Report to the Members of eServGlobal Limited
Report on the Financial Report We have audited the accompanying financial report of eServGlobal Limited, which comprises the statement of financial position as at 31 October 2011, the statement of comprehensive income, the statement of cash flows and the statement of changes in equity for the period ended on that date, notes comprising a summary of significant accounting policies and other explanatory information, and the directors’ declaration of the consolidated entity comprising the company and the entities it controlled at the period’s end or from time to time during the financial period as set out on pages 26 to 76. Directors’ Responsibility for the Financial Report The directors of the company are responsible for the preparation of the financial report that gives a true and fair view in accordance with Australian Accounting Standards and the Corporations Act 2001. The directors are also responsible for such internal control as the directors determine is necessary to enable the preparation of the financial report that is free from material misstatement, whether due to fraud or error. In Note 1, the directors also state, in accordance with Accounting Standard AASB 101 Presentation of Financial Statements, that the financial statements comply with International Financial Reporting Standards. Auditor’s Responsibility Our responsibility is to express an opinion on the financial report based on our audit. We conducted our audit in accordance with Australian Auditing Standards. Those standards require that we comply with relevant ethical requirements relating to audit engagements and plan and perform the audit to obtain reasonable assurance that the financial report is free from material misstatement. An audit involves performing procedures to obtain audit evidence about the amounts and disclosures in the financial report. The procedures selected depend on the auditor’s judgement, including the assessment of the risks of material misstatement of the financial report, whether due to fraud or error. In making those risk assessments, the auditor considers internal control, relevant to the entity’s preparation of the financial report that gives a true and fair view, in order to design audit procedures that are appropriate in the circumstances, but not for the purpose of expressing an opinion on the effectiveness of the entity’s internal control. An audit also includes evaluating the appropriateness of accounting policies used and the reasonableness of accounting estimates made by the directors, as well as evaluating the overall presentation of the financial report. We believe that the audit evidence we have obtained is sufficient and appropriate to provide a basis for our audit opinion.
Deloitte Touche Tohmatsu A.B.N. 74 490 121 060 Grosvenor Place 225 George Street Sydney NSW 2000 PO Box N250 Grosvenor Place Sydney NSW 1220 Australia DX 10307SSE Tel: +61 (0) 2 9322 7000 Fax: +61 (0) 2 9322 7001 www.deloitte.com.au

25
Auditor’s Independence Declaration In conducting our audit, we have complied with the independence requirements of the Corporations Act 2001. We confirm that the independence declaration required by the Corporations Act 2001, which has been given to the directors of eServGlobal Limited, would be in the same terms if given to the directors as at the time of this auditor’s report. Opinion In our opinion: (a) the financial report of eServGlobal Limited is in accordance with the Corporations Act 2001,
including:
(i) giving a true and fair view of the consolidated entity’s financial position as at 31 October 2011 and of its performance for the period ended on that date; and
(ii) complying with Australian Accounting Standards and the Corporations Regulations 2001;
(b) the consolidated financial statements also comply with International Financial Reporting
Standards as disclosed in Note 1. Report on the Remuneration Report We have audited the Remuneration Report included in pages 8 to 14 of the directors’ report for the period ended 31 October 2011. The directors of the company are responsible for the preparation and presentation of the Remuneration Report in accordance with section 300A of the Corporations Act 2001. Our responsibility is to express an opinion on the Remuneration Report, based on our audit conducted in accordance with Australian Auditing Standards. Auditor’s Opinion In our opinion the Remuneration Report of eServGlobal Limited for the period ended 31 October 2011, complies with section 300A of the Corporations Act 2001. DELOITTE TOUCHE TOHMATSU Weng W Ching Partner Chartered Accountants Sydney, 31 January 2012

e S e r v G l o b a l L i m i t e d
26
Directors declaration
The directors declare that: (a) in the directors’ opinion, there are reasonable grounds to believe that the company will be able to pay
its debts as and when they become due and payable;
(b) the attached financial statements are in compliance with International Financial Reporting Standards, as stated in note 1 to the financial statements;
(c) in the director’s opinion, the attached financial statements and notes thereto are in accordance with the Corporations Act 2001, including compliance with accounting standards and giving a true and fair view of the financial position and performance of the consolidated entity; and
(d) the directors have been given the declarations required by section 295A of the Corporations Act 2001. Signed in accordance with a resolution of the directors made pursuant to section 295(5) of the Corporations Act 2001. On behalf of the directors
Richard Mathews Chairman
Brisbane, 31 January 2012

e S e r v G l o b a l L i m i t e d
27
Consolidated statement of comprehensive income for period ended 31 October 2011
Note
Period Ended 31 October
2011 $’000
Year Ended 30 June 2011
$’000 Revenue 2 7,017 42,808 Cost of sales (4,234) (19,452) Gross profit 2,783 23,356
Other income 2 769 73,315 Research and development expenses (547) (5,311) Sales and marketing expenses (2,782) (8,755) Administration expenses (6,409) (30,432) (Loss)/Earnings before interest expense, tax, depreciation and amortisation
(6,186) 52,173
Amortisation expense 3 (1,581) (5,493) Depreciation expense 3 (326) (1,377) (Loss)/Earnings before interest expense and tax (8,093) 45,303 Finance costs 3 (605) (162) (Loss)/Profit before tax 3 (8,698) 45,141 Income tax expense 4 (560) (5,982) (Loss)/Profit for the period (9,258) 39,159 Other comprehensive income/(loss) Exchange differences arising on the translation of foreign operations
146 (1,070)
Total comprehensive income/(loss) for the period (9,112) 38,089 (Loss)/Earnings attributable to: Equity holders of the parent (9,304) 39,011 Non controlling interest 46 148 (9,258) 39,159 Total comprehensive (loss)/ income attributable to:
Equity holders of the parent (9,158) 37,952 Non controlling interest 46 137 (9,112) 38,089 (Loss)/Earnings per share: Basic (cents per share) 21 (4.7) 19.8 Diluted (cents per share) 21 (4.7) 19.8
Notes to the financial statements are included on pages 31 to 76

e S e r v G l o b a l L i m i t e d
28
Consolidated statement of financial position as at 31 October 2011
Note
31 October 2011 $’000
30 June 2011 $’000
Current Assets Cash and cash equivalents 27(a) 10,129 60,820 Trade and other receivables 8 40,425 33,722 Inventories 10 170 279 Current tax assets 4 90 90 Total Current Assets 50,814 94,911 Non-Current Assets Property, plant and equipment 11 1,541 1,841 Deferred tax assets 4 5,359 4,937 Goodwill 12 6,382 6,499 Other receivables 29(c) - 12,208 Other intangible assets 13 6,808 8,012 Total Non-Current Assets 20,090 33,497 Total Assets 70,904 128,408 Current Liabilities Trade and other payables 14 15,247 16,195 Borrowings 15 14,000 - Current tax payables 4 6,904 6,741 Provisions 16 2,515 7,024 Other 17 2,190 2,122 Total Current Liabilities 40,856 32,082 Non-Current Liabilities Deferred tax liabilities 4 790 1,068 Provisions 16 385 448 Total Non-Current Liabilities 1,175 1,516 Total Liabilities 42,031 33,598 Net Assets 28,873 94,810
Equity Issued capital 18 90,770 123,946 Reserves 19 (1,983) (2,390) Accumulated Losses 20 (59,984) (26,770) Parent entity interest 28,803 94,786 Non controlling interest 70 24 Total Equity 28,873 94,810
Notes to the financial statements are included on pages 31 to 76

e S e r v G l o b a l L i m i t e d
29
Consolidated statement of changes in equity for the period ended 31 October 2011
Issued Capital $’000
Foreign Currency
Translation Reserve
$’000
Employee equity-settled
benefits Reserve
$’000
Retained Earnings (Accumu-
lated Losses)
$’000
Attributable to owners of
the parent $’000
Non controlling
Interest
$’000 Total $’000
Consolidated Balance at 1 July 2011 123,946 (3,522) 1,132 (26,770) 94,786 24 94,810 Profit/(Loss) for the period - - - (9,304) (9,304) 46 (9,258) Other comprehensive income (loss) for the period
Exchange differences arising on translation of foreign operations
- 146 - - 146 - 146
Total comprehensive income (loss) for the period
- 146 - (9,304) (9,158) 46 (9,112)
Capital distribution (note 18) (33,176) - - - (33,176) - (33,176) Payment of dividends (note 22) - - - (23,910) (23,910) - (23,910) Equity settled payments - - 261 - 261 - 261 Balance at 31 October 2011 90,770 (3,376) 1,393 (59,984) 28,803 70 28,873
Balance at 1 July 2010 123,946 (2,463) 897 (65,781) 56,599 165 56,764 Profit/(Loss) for the year - - - 39,011 39,011 148 39,159 Other comprehensive income (loss) for the year
Exchange differences arising on translation of foreign operations
- (1,059) - - (1,059) (11) (1,070)
Total comprehensive income (loss) for the year
- (1,059) - 39,011 37,952 137 38,089
Distribution to non-controlling interest
- - - - - (278) (278)
Equity settled payments - - 235 - 235 - 235 Balance at 30 June 2011 123,946 (3,522) 1,132 (26,770) 94,786 24 94,810
Notes to the financial statements are included on pages 31 to 76

e S e r v G l o b a l L i m i t e d
30
Consolidated statement of cash flows for the period ended 31 October 2011
Note
Period Ended 31 October
2011 $’000
Year Ended 30 June 2011
$’000 Cash Flows from Operating Activities Receipts from customers 11,007 49,739 Payments to suppliers and employees (19,067) (60,164) Interest and other finance cost paid (331) (162) Net income tax (paid)/ refunded (448) 1,022 Net cash used in operating activities 27(c) (8,839) (9,565) Cash Flows From Investing Activities Proceeds from disposal of assets, net of transaction costs - 73,335 Interest received 1,817 2,947 Payment for property, plant and equipment (29) (580) Software development costs (500) (1,364) Net cash provided by/(used in) investing activities 1,288 74,338 Cash Flows From Financing Activities Dividends paid 22 (23,910) (278) Capital distribution 18 (33,176) - Proceeds from borrowings 15 14,000 - Net cash (used in) financing activities (43,086) (278) Net (decrease)/ increase In Cash and Cash Equivalents (50,637) 64,495 Cash At The Beginning Of The Period 60,820 (3,569) Effects of exchange rate changes on the balance of cash held in foreign currencies (54) (106) Cash and Cash Equivalents At The End Of The Period 27(a) 10,129 60,820
Notes to the financial statements are included on pages 31 to 76

e S e r v G l o b a l L i m i t e d
31
Notes to the Financial Statements for the financial period ended 31 October 2011
1. SUMMARY OF ACCOUNTING POLICIES Statement of compliance The financial statements are general purpose financial statements which have been prepared in accordance with the Corporations Act 2001, Accounting Standards and Interpretations, and comply with other requirements of the law. The financial statements include the consolidated financial statements of the Group. Accounting Standards include Australian equivalents to International Financial Reporting Standards (‘A-IFRS’). Compliance with A-IFRS ensures that the financial statements and notes of the Group comply with International Financial Reporting Standards (‘IFRS’). The financial statements were authorised for issue by the directors on 30th January 2012. Reporting period During the period, the Group changed its financial year from 30 June to 31 October. Accordingly, the current financial period is for the four months ended 31 October 2011. The comparative period is for the twelve months ended 30 June 2011. Basis of preparation The financial statements have been prepared on the basis of historical cost. Cost is based on the fair values of the consideration given in exchange for assets. All amounts are presented in Australian dollars, unless otherwise noted. The company is a company of the kind referred to in ASIC Class Order 98/100, dated 10 July 1998, and in accordance with that Class Order amounts in the financial statements are rounded off to the nearest thousand dollars, unless otherwise indicated. The following significant accounting policies have been adopted in the preparation and presentation of the financial statements : (a) Cash and cash equivalents Cash and cash equivalents include cash on hand and in banks, deposits held at call with banks and financial institutions, investments in money market instruments with maturities of three months or less from the date of acquisition, and bank overdrafts. Bank overdrafts are shown within short-term borrowings in current liabilities on the statement of financial position. (b) Employee benefits Provision is made for benefits accruing to employees in respect of wages and salaries, annual leave and long service leave when it is probable that settlement will be required and they are capable of being measured reliably. Provisions made in respect of employee benefits expected to be settled within 12 months, are measured at their nominal values using the remuneration rate expected to apply at the time of settlement. Provisions made in respect of employee benefits which are not expected to be settled within 12 months are measured as the present value of the estimated future cash outflows to be made by the Group in respect of services provided by employees up to reporting date. Defined contribution plans Contributions to defined contribution superannuation plans are expensed when employees have rendered service entitling them to the contributions.

e S e r v G l o b a l L i m i t e d
32
Notes to the Financial Statements for the financial period ended 31 October
2011
1. SUMMARY OF ACCOUNTING POLICIES (continued) (c) Financial assets Investments Financial assets are classified into the following specified category: ‘loans and receivables’. The classification depends on the nature and purpose of the financial assets and is determined at the time of initial recognition. Loans and receivables Trade and other receivables that have fixed or determinable payments that are not quoted in an active market are classified as ‘loans and receivables’. Loans and receivables are measured at amortised cost using the effective interest method less impairment. Interest income is recognised by applying the effective interest rate. Appropriate allowances for estimated irrecoverable amounts are recognised in profit or loss when there is objective evidence that the asset is impaired. The allowance recognised is measured as the difference between the asset’s carrying amount and the present value of estimated future cash flows discounted at the effective interest rate computed on initial recognition. The carrying amount of loans and receivables is reduced by the impairment loss through the use of an allowance account. Subsequent recoveries of amounts previously written off are credited against the allowance account. Changes in the carrying value of the allowance account are recognised in profit and loss. (d) Financial instruments issued by the Group Debt and equity instruments Debt and equity instruments are classified as either liabilities or as equity in accordance with the substance of the contractual arrangement. An equity instrument is any contract that evidences a residual interest in the assets of an entity after deducting all of its liabilities. Equity instruments issued by the Group are recorded at the proceeds received, net of direct issue costs. Transaction costs on the issue of equity instrument s Transaction costs arising on the issue of equity instruments are recognised directly in equity as a reduction of the proceeds of the equity instruments to which the costs relate. Transaction costs are the costs that are incurred directly in connection with the issue of those equity instruments and which would not have been incurred had those instruments not been issued.

e S e r v G l o b a l L i m i t e d
33
Notes to the Financial Statements for the financial period ended 31 October 2011
1. SUMMARY OF ACCOUNTING POLICIES (continued) (d) Financial instruments issued by the Group (cont inued) Other financial liabilities Other financial liabilities, including borrowings, are initially measured at fair value, net of transaction costs and are subsequently measured at amortised cost using the effective interest method, with the interest expense recognised on an effective yield basis. The effective interest method is a method of calculating the amortised cost of a financial liability and of allocating interest expense over the relevant period. The effective interest rate is the rate that exactly discounts estimated future cash payments through the expected life of the financial liability, or, where appropriate, a shorter period. Trade payables Trade payables are initially measured at fair value, and are subsequently measured at amortised cost. (e) Foreign currency Foreign currency transactions All foreign currency transactions arising during the financial period are brought to account using the exchange rate in effect at the date of the transaction. Foreign currency monetary items at reporting date are translated at the exchange rate existing at reporting date. Non-monetary assets and liabilities carried at fair value that are denominated in foreign currencies are translated at the rates prevailing at the date when the fair value was determined. Non-monetary items that are measured at historical cost in a foreign currency are not re-translated. Exchange differences are recognised in profit or loss in the period in which they arise.
Foreign operations All overseas subsidiaries, other than those that are part of the eServGlobal Holdings SAS group, report in their functional currency of AUD, in accordance with the requirements of AASB 121 “The Effects of Changes in Foreign Currency Exchange Rates” and as a consequence all exchange rate translation differences are taken to profit or loss. The eServGlobal Holdings SAS group reports in its functional currency of EUR and on consolidation, the assets and liabilities of the eServGlobal Holdings SAS group are translated at exchange rates prevailing at the reporting date. Income and expense items are translated at the average exchange rates for the period unless exchange rates fluctuate significantly. Exchange differences arising, if any, are recognised in the foreign currency translation reserve, and recognised in profit or loss on disposal of the foreign operation. Goodwill and fair value adjustments arising on the acquisition of a foreign entity on or after the date of transition to A-IFRS are treated as assets and liabilities of the foreign entity and translated at exchange rates prevailing at the reporting date.

e S e r v G l o b a l L i m i t e d
34
Notes to the Financial Statements for the financial period ended 31 October 2011
1. SUMMARY OF ACCOUNTING POLICIES (continued) (f) Goods and services tax Revenues, expenses and assets are recognised net of the amount of goods and services tax (GST), except:
i. where the amount of GST incurred is not recoverable from the taxation authority, it is recognised as part of the cost of acquisition of an asset or as part of an item of expense; or
ii. for receivables and payables which are recognised inclusive of GST.
The net amount of GST recoverable from, or payable to, the taxation authority is included as part of receivables or payables. Cash flows are included in the statement of cash flows on a gross basis. The GST component of cash flows arising from investing and financing activities which is recoverable from, or payable to, the taxation authority is classified as operating cash flows. (g) Goodwill Goodwill, representing the excess of the cost of acquisition over the fair value of the identifiable assets, liabilities and contingent liabilities acquired, is recognised as an asset and not amortised, but tested for impairment annually and whenever there is an indication that the goodwill may be impaired. Any impairment is recognised immediately in profit or loss and is not subsequently reversed. Refer also to Note 1(h). (h) Impairment of assets At each reporting date, the Group reviews the carrying amounts of its tangible and intangible assets to determine whether there is any indication that those assets have suffered an impairment loss. If any such indication exists, the recoverable amount of the asset is estimated in order to determine the extent of the impairment loss (if any). Where the asset does not generate cash flows that are independent from other assets, the Group estimates the recoverable amount of the cash-generating unit to which the asset belongs. For the purpose of impairment testing, goodwill is allocated to the cash-generating units expected to benefit from the synergies of the business combination. Recoverable amount is the higher of fair value less costs to sell and value in use. In assessing value in use, the estimated future cash flows are discounted to their present value using a pre-tax discount rate that reflects current market assessments of the time value of money and the risks specific to the asset for which the estimates of future cash flows have not been adjusted. If the recoverable amount of an asset (or cash-generating unit) is estimated to be less than its carrying amount, the carrying amount of the asset (cash-generating unit) is reduced to its recoverable amount. An impairment loss is recognised in profit or loss immediately. Where an impairment loss subsequently reverses, the carrying amount of the asset (cash-generating unit) is increased to the revised estimate of its recoverable amount, but only to the extent that the increased carrying amount does not exceed the carrying amount that would have been determined had no impairment loss been recognised for the asset (cash-generating unit) in prior years. A reversal of an impairment loss is recognised in profit or loss immediately.

e S e r v G l o b a l L i m i t e d
35
Notes to the Financial Statements for the financial period ended 31 October 2011
1. SUMMARY OF ACCOUNTING POLICIES (continued) (i) Income tax Current tax Current tax is calculated by reference to the amount of income taxes payable or recoverable in respect of the taxable profit or tax loss for the period. It is calculated using tax rates and tax laws that have been enacted or substantively enacted by reporting date. Current tax for current and prior periods is recognised as a liability (or asset) to the extent that it is unpaid (or refundable). Deferred tax Deferred tax is accounted for in respect of temporary differences arising from differences between the carrying amount of assets and liabilities in the financial statements and the corresponding tax base of those items. In principle, deferred tax liabilities are recognised for all taxable temporary differences. Deferred tax assets are recognised to the extent that it is probable that sufficient taxable amounts will be available against which deductible temporary differences or unused tax losses and tax offsets can be utilised. However, deferred tax assets and liabilities are not recognised if the temporary differences giving rise to them arise from the initial recognition of assets and liabilities (other than as a result of a business combination) which affects neither taxable income nor accounting profit. Furthermore, a deferred tax liability is not recognised in relation to taxable temporary differences arising from goodwill. Deferred tax assets and liabilities are measured at the tax rates that are expected to apply to the period(s) when the asset and liability giving rise to them are realised or settled, based on tax rates (and tax laws) that have been enacted or substantively enacted by reporting date. The measurement of deferred tax liabilities and assets reflects the tax consequences that would follow from the manner in which the Group expects, at the reporting date, to recover or settle the carrying amount of its assets and liabilities. Deferred tax assets and liabilities are offset when they relate to income taxes levied by the same taxation authority and the Group intends to settle its current tax assets and liabilities on a net basis. Current and deferred tax for the period Current and deferred tax is recognised as an expense or income in profit or loss, except when it relates to items credited or debited directly to equity, in which case the deferred tax is also recognised directly in equity, or where it arises from the initial accounting for a business combination, in which case it is taken into account in the determination of goodwill or excess.

e S e r v G l o b a l L i m i t e d
36
Notes to the Financial Statements for the financial period ended 31 October 2011
1. SUMMARY OF ACCOUNTING POLICIES (continued) (j) Intangible assets All intangible assets acquired in a business combination are identified and recognised separately from goodwill where they satisfy the definition of an intangible asset and their fair value can be measured reliably. Software and Documentation Software and Documentation are recorded initially at fair value and have an estimated useful life. Amortisation is charged on a straight line basis over their useful lives. Customer Relationships Customer Relationships are recorded initially at fair value and have an estimated useful life. Amortisation is charged on a straight line basis over their useful lives. (k) Inventories Inventories are valued at the lower of cost and net realisable value. Costs are assigned to inventory on hand by the method most appropriate to each particular class of inventory, with the majority being valued on a first in first out basis. Net realisable value represents the estimated selling price less all estimated costs to be incurred in marketing, selling and distribution. (l) Leases Operating lease payments, where substantially all of the risks and benefits remain with the lessor, are recognised as an expense on a straight-line basis over the lease term, except where another systematic basis is more representative of the time pattern in which economic benefits from the leased asset are consumed. Contingent rentals are recognised as an expense in the period in which they are incurred. Lease incentives In the event that lease incentives are received to enter into operating leases, such incentives are recognised as a liability. The aggregate benefits of incentives are recognised as a reduction of rental expense on a straight-line basis. (m) Basis of consolidation The consolidated financial statements incorporate the financial statements of the Company and entities controlled by the Company (its subsidiaries) (referred to as ‘the Group’ in these financial statements). Control is achieved where the Company has the power to govern the financial and operating policies of an entity so as to obtain benefits from its activities. The results of subsidiaries acquired or disposed of during the period are included in consolidated profit or loss from the effective date of acquisition or up to the effective date of disposal, as appropriate. Where necessary, adjustments are made to the financial statements of subsidiaries to bring their accounting policies into line with those used by other members of the Group. All intra-group transactions, balances, income and expenses are eliminated in full on consolidation.

e S e r v G l o b a l L i m i t e d
37
Notes to the Financial Statements for the financial period ended 31 October 2011
1. SUMMARY OF ACCOUNTING POLICIES (continued) (m) Basis of consolidation (continued) Non-controlling interest in the net assets (excluding goodwill) of consolidated subsidiaries are identified separately from the Group’s equity therein. Non-controlling interests consist of the amount of those interests at the date of the original business combination and the non-controlling interest’s share of changes in equity since the date of the combination. Total comprehensive income is attributed to non-controlling interests even if this results in the non-controlling interests having a deficit balance. Acquisitions of subsidiaries and businesses are accounted for using the purchase method. The cost of the business combination is measured as the aggregate of the fair values (at the date of exchange) of the assets given, liabilities incurred or assumed, and equity instruments issued by the group in exchange for control of the acquiree. The acquiree’s identifiable assets, liabilities and contingent liabilities that meet the conditions for recognition under AASB 3 “Business Combinations” are recognised at their fair values at the acquisition date, except for non-current assets (or disposal groups) that are classified as held for sale in accordance with AASB 5 “Non-current Assets Held for Sale and Discontinued Operations”, which are recognised and measured at fair value less costs to sell. Acquisition related costs are recognised in profit or loss as incurred. Goodwill arising on acquisition is recognised as an asset and initially measured at cost, being the excess of the cost of the business combination over the groups interest in the net fair value of the identifiable assets, liabilities and contingent liabilities recognised. If after reassessment, the group’s interest in the net fair value of the acquiree’s identifiable assets, liabilities and contingent liabilities exceeds the cost of the business combination, the excess is recognised immediately in profit or loss. The interest of minority shareholders in the acquiree is initially measured at the minority’s proportion of the net fair value of the assets, liabilities and contingent liabilities recognised. (n) Property, plant and equipment Plant and equipment, office furniture and fittings and leasehold improvements are stated at cost less accumulated depreciation and impairment. Cost includes expenditure that is directly attributable to the acquisition of the item. In the event that settlement of all or part of the purchase consideration is deferred, cost is determined by discounting the amounts payable in the future to their present value as at the date of acquisition. Depreciation is provided on property, plant and equipment. Depreciation is calculated on a straight line basis so as to write off the net cost of each asset over its expected useful life to its estimated residual value. Leasehold improvements are depreciated over the period of the lease or estimated useful life, whichever is the shorter, using the straight line method. The estimated useful lives, residual values and depreciation method are reviewed at the end of each annual reporting period. The following estimated useful lives are used in the calculation of depreciation: Office furniture and fittings 5 years Plant and equipment 3 years Leasehold improvements over the period of the lease

e S e r v G l o b a l L i m i t e d
38
Notes to the Financial Statements for the financial period ended 31 October 2011
1. SUMMARY OF ACCOUNTING POLICIES (continued) (o) Provisions Provisions are recognised when the Group has a present obligation, the future sacrifice of economic benefits is probable, and the amount of the provision can be measured reliably. The amount recognised as a provision is the best estimate of the consideration required to settle the present obligation at reporting date, taking into account the risks and uncertainties surrounding the obligation. Where a provision is measured using the cash flows estimated to settle the present obligation, its carrying amount is the present value of those cash flows. When some or all of the economic benefits required to settle a provision are expected to be recovered from a third party, the receivable is recognised as an asset if it is virtually certain that recovery will be received and the amount of the receivable can be measured reliably. Onerous Contracts An onerous contract is considered to exist where the Group has a contract under which the unavoidable cost of meeting the contractual obligations exceeds the economic benefits expected to be received. Present obligations arising under onerous contracts are recognised as a provision to the extent that the present obligation exceeds the economic benefits expected to be received. (p) Research and development costs Internally-generated intangible assets – research a nd development expenditure Expenditure on research activities is recognised as an expense in the period in which it is incurred. Where no internally-generated intangible asset can be recognised, development expenditure is recognised as an expense in the period as incurred.
An intangible asset arising from development (or from the development phase of an internal project) is recognised if, and only if, all of the following have been demonstrated:
• the technical feasibility of completing the intangible asset so that it will be available for use or sale;
• the intention to complete the intangible asset and use or sell it; • the ability to use or sell the intangible asset; • how the intangible asset will generate probable future economic benefits; • the availability of adequate technical, financial and other resources to complete the
development and to use or sell the intangible asset; and • the ability to measure reliably the expenditure attributable to the intangible asset during
its development.
The amount initially recognised for internally-generated intangible assets is the sum of the expenditure incurred from the date when the intangible asset first meets the recognition criteria listed above. The expenditure capitalised includes cost of materials, direct labour and a proportion of overheads. Other development expenditure is recognised in profit or loss as an expense as and when incurred. Subsequent to initial recognition, internally-generated intangible assets are reported at cost less accumulated amortisation and accumulated impairment losses, on the same basis as intangible assets acquired separately.

e S e r v G l o b a l L i m i t e d
39
Notes to the Financial Statements for the financial period ended 31 October 2011
1. SUMMARY OF ACCOUNTING POLICIES (continued) (q) Revenue recognition Sale of Goods and Licences Revenue from the sale of goods and licences is recognised when the Group has passed control of the goods or other assets to the buyer, except in the case of projects involving significant customisation where revenue is recognised by reference to the stage of completion of the project. Rendering of Services Revenue from services to supply custom designed and developed software or solutions is recognised by reference to the stage of completion of the project. The stage of completion is determined by assessing, at the reporting date, the level of actual services performed as a percentage of total services to be performed in relation to the project. Revenue recognised in advance of the corresponding bill being raised is recorded as ‘work in progress’, whilst bills raised in advance of the services being performed is recorded as ‘deferred income’. Where a loss is expected to occur it is recognised immediately and a provision is made in relation to any future work on the contract. Revenue from Support, Maintenance and Facilities Ma nagement Agreements Revenue from support and maintenance contracts is recognised over time as it is earned. Work in Progress Work in progress is stated at the aggregate of contract costs incurred to date plus recognised profits less recognised losses and progress billings. If there are contracts where progress billings exceed the aggregate costs incurred plus profits less losses, the net amounts are presented in other liabilities. Contracts costs include all costs directly related to specific contracts and costs that are specifically chargeable to the customers under the terms of the contract. (r) Share-based payments Equity-settled share-based payments are measured at fair value at the date of grant. Fair value is measured by use of either a Black Scholes or binomial model. The expected life used in the model has been adjusted, based on management’s best estimate, for the effects of non-transferability, exercise restrictions, and behavioural considerations. The fair value determined at the grant date of the equity-settled share-based payments is expensed on a straight-line basis over the vesting period, based on the Group’s estimate of shares that will eventually vest. (s) Derivative financial instruments and hedge acco unting The Group uses derivative financial instruments (primarily foreign currency forward contracts) to hedge its risks associated with foreign currency fluctuations relating to transactions arising from specific customer orders. Derivatives are initially recognised at fair value at the date a derivative contract is entered into and are subsequently remeasured to their fair value at each reporting date. The resulting gain or loss is recognised in profit or loss immediately unless the derivative is designated and effective as a hedging instrument, in which event, the timing of the recognition in profit or loss depends on the nature of the hedge relationship.

e S e r v G l o b a l L i m i t e d
40
Notes to the Financial Statements for the financial period ended 31 October 2011
1. SUMMARY OF ACCOUNTING POLICIES (continued) (s) Derivative financial instruments and hedge acco unting (continued) The fair value of all derivative financial instruments outstanding at the reporting date are recognised in the statement of financial position as either financial assets or financial liabilities. Changes in the fair value of derivative financial instruments that are designated and effective as hedges of future cash flows are recognised directly in equity, with any ineffective portion being recognised in profit or loss. Amounts deferred in equity are recycled in profit or loss in the periods when the hedged item is recognised in profit or loss in the same line of the income statement as the recognised hedged item. Changes in the fair value of derivative financial instruments that do not qualify for hedge accounting are recognised in profit or loss as they arise. Derivatives embedded in other financial instruments, or other non financial host contracts, are treated as separate derivatives when their risks and characteristics are not closely related to those of the host contract, and the host contract is not carried at fair value with unrealised gains or losses reported in profit or loss. (t) Non-current assets held for sale Non-current assets and disposal groups are classified as held for sale if their carrying amount will be recovered principally through a sale transaction rather than through continuing use. This condition is regarded as met only when the sale is highly probable and the asset is available for immediate sale in its present condition. Management must be committed to the sale, which should be expected to qualify for recognition as a completed sale within one year from the date of classification. Non-current assets classified as held for sale are measured at the lower of their previous carrying amount and fair value less costs to sell. (u) Critical accounting judgments and key sources o f estimation uncertainty The directors evaluate estimates and judgments incorporated into the financial statements based on historical knowledge and best available current information. Estimates assume a reasonable expectation of future events and based on current trends and economic data, obtained both externally and within the Group. The following are the key assumptions concerning the future, and other key sources of estimation uncertainty at the reporting date, that have a significant risk of causing a material adjustment to the carrying amounts of assets and liabilities within the next financial year: Impairment of goodwill The Group assesses impairment at each reporting date by evaluating conditions specific to the Group that may lead to impairment of goodwill. Where an impairment trigger exists, the recoverable amount of the asset is determined. Value-in-use calculations performed in assessing recoverable amounts incorporate a number of key estimates described in Note 12. Revenue recognition Revenue in relation to the supply of custom designed and developed software or solutions is recognised on each project by reference to the stage of completion of the project. The method of calculating the percentage completion of the project involves an element of judgement based on future project costs and profitability of each project. The information used to forecast these costs is based on historical events and current economic data on a customer by customer basis.

e S e r v G l o b a l L i m i t e d
41
Notes to the Financial Statements for the financial period ended 31 October
2011
1. SUMMARY OF ACCOUNTING POLICIES (continued) Unused tax losses The recognition of unused tax losses as a deferred tax asset requires estimation and judgement of the availability of future taxable profits and is subject to compliance with the relevant tax legislations. At the date of this report, the directors have assessed the degree of probability of recovering the remaining unused tax losses. Accordingly, a deferred tax asset has been recognised to the extent that the probability criteria has been met. (v) Adoption of new and revised Accounting Standard s In the current period, the Group has adopted all of the new and revised Standards and Interpretations issued by the Australian Accounting Standards Board (the AASB) that are relevant to its operations and effective for the current annual reporting period. Details of the impact of the adoption of these new accounting standards are set out in the individual accounting policy notes set out below. Standards and Interpretations adopted with no effec t on financial statements The following new and revised Standards and Interpretations have also been adopted in these financial statements. Their adoption has not had any significant impact on the amounts reported in these financial statements but may affect the accounting for future transactions or arrangements.
• AASB 124 ‘Related Party Disclosures’ (revised December 2009), AASB 2009-12 ‘Amendments to Australian Accounting Standards’
• AASB 2009-14 ‘Amendments to Australian Interpretation – Prepayments of a Minimum Funding Requirement’
• AASB 2010-5 ‘Amendments to Australian Accounting Standards’
• AASB 2010-6 ‘Amendments to Australian Accounting Standards – Disclosures on
Transfers of Financial Assets’
• AASB 1054 ‘Australian Additional Disclosures’
• AASB 2011-1 ‘Amendments to Australian Accounting Standards arising from the Trans-Tasman Convergence Project’
Standards and Interpretations affecting the reporte d results or financial position There are no new and revised Standards and Interpretations adopted in these financial statements affecting the reporting results or financial position.

e S e r v G l o b a l L i m i t e d
42
Notes to the Financial Statements for the financial period ended 31 October
2011 1. SUMMARY OF ACCOUNTING POLICIES (continued) Standards and Interpretations in issue not yet adop ted At the date of authorisation of the financial statements, the Standards and Interpretations listed below were in issue but not yet effective.
Effective for annual
reporting periods
beginning on or after
Expected to be initially
applied in the financial
year ending
AASB 9 ‘Financial Instruments’, AASB 2009- 11 ‘Amendments to Australian Accounting Standards arising from AASB 9’ and AASB 2010-7 ‘Amendments to Australian Accounting Standards arising from AASB 9 (December 2010)’
1 January 2013 31 October 2014*
AASB 10 ‘Consolidated Financial Statements’ 1 January 2013 31 October 2014
AASB 11 ‘Joint Arrangements’ 1 January 2013 31 October 2014
AASB12 ‘Disclosure of Involvement with Other Entities’ 1 January 2013 31 October 2014
AASB13 ‘Fair Value Measurement’ 1 January 2013 31 October 2014
AASB 127 ‘Separate Financial Statements (2011)’ 1 January 2013 31 October 2014
AASB 128 ‘Investments in Associates and Joint Ventures’ 1 January 2013 31 October 2014
AASB 119 ‘Employee Benefits’ 1 January 2013 31 October 2014
AASB 2011-7 ‘Amendments to Australian Accounting
Standards arising from the Consolidation and Joint
Arrangements Standards’
1 January 2013 31 October 2014
AASB 2010-8 ‘Amendments to Australian Accounting Standards – Deferred Tax: Recovery of Underlying Assets’
1 January 2012 31 October 2013
AASB 2011-8 ‘Amendments to Australian Accounting Standards arising from AASB 13’
1 January 2013 31 October 2014
AASB 2011-9 ‘Amendments to Australian Accounting Standards – Presentation of Items of Other Comprehensive Income’
1 July 2012 31 October 2013
AASB 2011-10 ‘Amendments to Australian Accounting Standards arising from the Trans-Tasman Convergence Project’
1 January 2013
31 October 2014
AASB 2011-13 ‘Amendments to Australian Accounting Standards – Improvements to AASB 1049’
1 July 2012
31 October 2013
* The IASB has amended IFRS 9 to defer the mandatory effective date to annual periods beginning on or after 1 January 2015. It is expected that the AASB will issue similar amendments shortly.
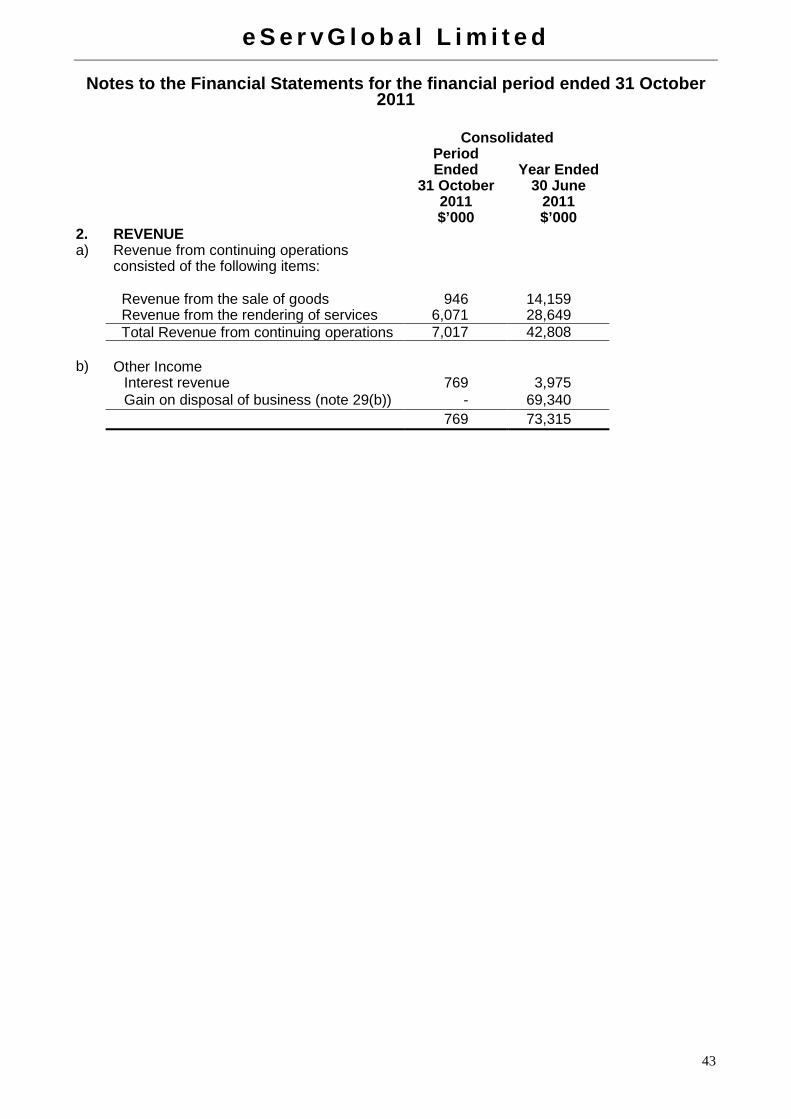
e S e r v G l o b a l L i m i t e d
43
Notes to the Financial Statements for the financial period ended 31 October
2011
Consolidated Period
Ended 31 October
2011 $’000
Year Ended 30 June
2011 $’000
2. REVENUE a) Revenue from continuing operations
consisted of the following items:
Revenue from the sale of goods 946 14,159 Revenue from the rendering of services 6,071 28,649 Total Revenue from continuing operations 7,017 42,808 b) Other Income Interest revenue 769 3,975 Gain on disposal of business (note 29(b)) - 69,340 769 73,315

e S e r v G l o b a l L i m i t e d
44
Notes to the Financial Statements for the financial period ended 31 October 2011
3. (LOSS)/PROFIT BEFORE TAX Consolidated
Period Ended
31 October
2011 $’000
Year Ended
30 June 2011 $’000
(Loss)/Profit before tax has been arrived at after charging (crediting) the following:
Net foreign exchange loss 566 1,517 Finance costs: Interest - other entities 605 162 Depreciation of non-current assets: Office furniture and fittings 51 245 Leasehold improvements 4 12 Plant and equipment 271 1,120 Total depreciation of non-current assets 326 1,377 Amortisation of intangible assets: Customer relationships, software and documentation 1,581 5,493 Operating lease rental expenses: Minimum lease payments 843 3,459 Net loss on disposal of non-current assets Plant and equipment 31 533
Impairment loss/(reduction) recognised on trade receivables (Note 8) 92 (208)
Employee benefit expense: Contributions to defined contribution plans 11 76 Other employee benefits 6,769 41,149 Total employee benefits expense 6,780 41,225 Share-based payments: Equity settled share-based payments 261 235 Total share-based payments 261 235

e S e r v G l o b a l L i m i t e d
45
Notes to the Financial Statements for the financial period ended 31 October
2011
4. INCOME TAXES Period Ended
31 October
2011 $’000
Year Ended
30 June 2011 $’000
(a) Income tax recognised in profit/(loss) Tax expense comprises: Current tax expense 1,212 10,805 Adjustments recognised in the current period in relation
to the current tax of prior years 48 (19)
Deferred tax (income)/expense relating to the origination and reversal of temporary differences (700) (4,804)
Total tax expense 560 5,982 The prima facie income tax expense on pre-tax
accounting profit/ (loss) from operations reconciles to the income tax expense in the financial statements as follows:
(Loss)/profit from operations (8,698) 45,141 Income tax expense/ (benefit) calculated at 30% (2,610) 13,542 Non-deductible expenses 225 383 Foreign withholding tax credits not utilised 367 1,245 Deferred tax assets not recognised 2,441 3,743 Non-assessable item – research tax credits - (476) Non-assessable income (67) (12,729) Effect of different tax rate in foreign operations 156 293 Under/(over) provision of income tax in previous year 48 (19) 560 5,982 The tax rate used in the above reconciliation is the corporate tax rate of 30% payable by Australian corporate entities on taxable profits under Australian tax law. There has been no change in the corporate tax rate when compared with the previous reporting period. Consolidated
31 October
2011 $’000
30 June
2011 $’000
(b) Current tax assets and liabilities Current tax assets: Tax refund receivables 90 90 Current tax payables: Income tax payables 6,904 6,741

e S e r v G l o b a l L i m i t e d
46
Notes to the Financial Statements for the financial period ended 31 October 2011
4. INCOME TAXES (continued)
Deferred tax balances Deferred tax assets and liabilities arise from the following:
Consolidated Opening balance
Reclassified
Credited to income
Closing balance
Four months to October 2011 $’000 $’000 $’000 $’000
Deferred tax liabilities: Exchange difference on foreign subsidiary - - (15) (15) Intangible assets 1,068 - (263) 805 1,068 - (278) 790 Deferred tax assets: Tax losses – revenue 1,099 - (233) 866 Research & development tax credits 3,294 - 619 3,913 Foreign tax credits 88 - 36 124 Doubtful debts 319 - - 319 Accrued costs 103 - - 103 Other 34 - - 34 4,937 - 422 5,359
Consolidated Opening balance
Reclassified
Credited to income
Closing balance
Year to June 2011 $’000 $’000 $’000 $’000
Deferred tax liabilities:
Accrued income 170 - (170) - Exchange difference on foreign subsidiary - -
- -
Intangible assets 3,913 - (2,845) 1,068 4,083 - (3,015) 1,068 Deferred tax assets: Tax losses – revenue 1,633 - (534) 1,099 Research & development tax credits - 1,241 2,053 3,294 Foreign tax credits - - 88 88 Doubtful debts - - 319 319 Property, plant and equipment 27 - (27) - Deferred income 52 - (52) - Accrued costs 142 - (39) 103 Other 53 - (19) 34 1,907 1,241 1,789 4,937

e S e r v G l o b a l L i m i t e d
47
Notes to the Financial Statements for the financial period ended 31 October 2011
4. INCOME TAXES (continued)
Tax consolidation
Relevance of tax consolidation to the consolidated entity The company and its wholly-owned Australian resident entities have formed a tax-consolidated group and are therefore taxed as a single entity. The head entity within the tax-consolidated group is eServGlobal Limited. The members of the tax-consolidated group are identified at Note 24. Nature of tax funding arrangements and tax sharing agreements Entities within the tax-consolidated group have entered into a tax funding arrangement and a tax-sharing agreement with the head entity. Under the terms of the tax funding arrangement, eServGlobal Limited and each of the entities in the tax-consolidated group has agreed to pay a tax equivalent payment to or from the head entity, based on the current tax liability or current tax asset of the entity. Such amounts are reflected in amounts receivable from or payable to other entities in the tax-consolidated group. The tax sharing agreement entered into between members of the tax-consolidated group provides for the determination of the allocation of income tax liabilities between the entities should the head entity default on its tax payment obligations. No amounts have been recognized in the financial statements in respect of this agreement as payment of any amounts under the tax sharing agreement is considered remote. 5. KEY MANAGEMENT PERSONNEL COMPENSATION
Key management personnel compensation policy The Remuneration and Nominations Committee reviews the remuneration packages of all key management on an annual basis and makes recommendations to the Board. The Boards approach on Remuneration Policies is set out in the Remuneration Report which forms part of the Directors’ Report.
The aggregate compensation made to key management personnel of the Group is set out as follows:
Consolidated Period
Ended 31 October
2011 $
Year Ended
30 June 2011
$ Short-term employee benefits 672,594 3,412,023 Post-employment benefits 23,156 75,587 Termination benefits - 238,324 Share-based payment 107,490 100,500 803,240 3,826,434

e S e r v G l o b a l L i m i t e d
48
Notes to the Financial Statements for the financial period ended 31 October 2011
6. EXECUTIVE AND EMPLOYEE SHARE OPTIONS The Group has ownership-based remuneration schemes for directors, executives and employees of the Group. In accordance with the provisions of the scheme, directors and employees may be granted options to acquire ordinary shares in the company. The board believes that the options scheme has a significant role to play in motivating employees to help ensure the continued performance of the Group, although the obligations under A-IFRS to expense the notional benefit of options issued has impacted the attractiveness of issuing options. The vesting of any share options is not dependent on any performance criteria, however, is dependent on a period of service relative to the vesting dates. During the financial period, the company issued no options (year to June 2011: 7,300,000). Under the eServGlobal Employee Share Option Plan, established 4 August 2000 to assist in the attraction, retention and motivation of employees and Directors of the company and its related bodies corporate, at 31 October 2011, executives and employees are entitled to purchase an aggregate of 7,710,000 (30 June 2011: 7,760,000) ordinary shares of the entity at an exercise price ranging from $0.48 to $0.80 (30 June 2011: $0.65 to $0.97) per ordinary share. At 31 October 2011, 410,000 (30 June 2011: 460,000) of these options had vested. The options may be exercised at various times up until 10 February 2016. The holders of such options do not have the right, by virtue of the option to participate in any share issue or interest issue of any other body corporate or scheme, and do not participate in any dividends declared. The following share-based payment arrangements were in existence during the period:
Option Series Number Grant Date
Expiry Date
Exercise Price
$
Fair value at grant
date Issued 7 March 2007 (i) 350,000 07-Mar-07 2012 0.52146 115,500 Issued 4 October 2007(i) 110,000 04-Oct-07 2012 0.80146 48,583 Issued 11 February 2011(i) 7,300,000 07-Mar-11 2016 0.48146 1,203,040
In accordance with the terms of the Employee Share Option Plan:
(i) options issued in these series vest as to one-third on each of the first, second and third anniversary dates from the date of issue
and expire five years from date of issue.
In accordance with the terms of the Employee Share Option Plan, options may be exercised at any time from the date on which they vest to the date of their expiry.

e S e r v G l o b a l L i m i t e d
49
Notes to the Financial Statements for the financial period ended 31 October 2011
6. EXECUTIVE AND EMPLOYEE SHARE OPTIONS (continued) Options issued since June 2004 Options were priced by an appropriately qualified expert who chose to use the binomial pricing model. Where relevant, the expected life used in the model has been adjusted based on a best estimate for the effects of non-transferability, exercise restrictions and behavioural considerations. Expected volatility is based on the historical share price volatility over the past 5 years. The risk-free rate is sourced from the Reserve Bank of Australia. To allow for effects of early exercise, it was assumed that employees would exercise the options after vesting date when the share price was two times the exercise price. Inputs into the models for the series of options issued post June 2004:
Issue Date
Share price at
grant date
Risk free rate of return to expiry (p.a.)
Years to expiration/exercise
Dividend yield (p.a.) Volatility
Sub optimal early exercise
factor 29-May-06 0.66 5.62% 5 0.0% 50.00% - 60.00% 2.00
7-Mar-07 0.77 5.80% 5 1.5% 45.00% - 55.00% 2.00 4-Oct-07 1.07 6.42% 5 1.5% 45.00% - 50.00% 2.00
26-Oct-07 1.05 6.41% 5 1.5% 45.00% - 50.00% 2.00 07-Mar-11 0.47 5.30% 4.93 0.0% 45.00% none assumed
The following reconciles the outstanding share options granted under the executive share option plan at the beginning and the end of the financial period:
October 2011 June 2011
Number of
Options
Weighted average
exercise price $
Number of Options
Weighted average
exercise price $
Balance at the beginning of the period 7,760,000 0.656 1,052,854 0.697 Granted during the period - - 7,300,000 0.650 Expired/ lapsed during the period (50,000) 0.690 (592,854) 0.741 Balance at the end of the period 7,710,000 0.656 7,760,000 0.656 Exercisable at the end of the financial period 410,000 0.765 460,000 0.757

e S e r v G l o b a l L i m i t e d
50
Notes to the Financial Statements for the financial period ended 31 October 2011
6. EXECUTIVE AND EMPLOYEE SHARE OPTIONS (continued) Exercised during the financial period No options were exercised during the financial period, nor during the previous financial year. Balance at the end of the financial period The share options outstanding at the end of the financial period are as follows:
Vested Unvested Expiry Exercise Contractual
No. No. Date Price Life
Issued No $ (days)
Issued 7 March 2007 300,000 300,000 - 2012 $0.52 127 Issued 4 October 2007 110,000 110,000 - 2012 $0.80 338 Issued 11 February 2011 (i) 7,300,000 - 7,300,000 2016 $0.48 1,563 7,710,000 410,000 7,300,000
(i) Since the financial period end 1,000,000 options held by the Managing Director were cancelled in November 2011.

e S e r v G l o b a l L i m i t e d
51
Notes to the Financial Statements for the financial period ended 31 October 2011
Consolidated Period
Ended 31
October 2011
$
Year Ended
30 June 2011
$ 7. REMUNERATION OF AUDITORS Auditor of the Parent Entity Auditing of the financial report 82,500 185,000 82,500 185,000 Other Auditors Auditing the financial report 51,374 157,489 Other services – Taxation - 18,469 51,374 175,958 133,874 360,958
The auditor of eServGlobal is Deloitte Touche Tohmatsu in Australia and the Other Auditors are all affiliated firms of Deloitte Touche Tohmatsu. Fees paid to other auditors are charged in respective foreign currencies and are subject to exchange rate fluctuations.

e S e r v G l o b a l L i m i t e d
52
Notes to the Financial Statements for the financial period ended 31 October 2011
31 October
2011 $’000
30 June 2011 $’000
8. CURRENT TRADE AND OTHER RECEIVABLES
Trade receivables (i) 10,608 13,503 Less : Allowance for doubtful debts (1,092) (1,000) 9,516 12,503 Prepayments 1,046 1,043 Goods and services tax receivable 868 1,055 Work in progress (Note 9) 4,910 5,802 Deferred sales proceeds (Note 29 (d)) 23,534 12,208 Deposits and accrued interest 551 1,111 40,425 33,722
(i) The average credit period on sales of goods and rendering of services is 60 days (June 2011: 60 days). Historically, the Group has had no requirement to charge interest on overdue receivables, although customer contractual terms include the ability to do this. Objective evidence is determined by reference to knowledge of disputes at balance date, where applicable. The Group also considers any change in the quality of the trade receivable from the date credit was initially granted up to the reporting date.
Before accepting any new customers, the Group obtains, where considered necessary, third party references to assess the potential customer’s credit worthiness. The majority of the Group’s outstanding trade receivables consist of large Telecommunication companies and are considered high quality creditworthy customers.
Included in the Group’s trade receivable balance are debtors with a carrying amount of $4.9 million (June 2011: $7.6 million) which are past due at the reporting date for which the Group has not provided as there has not been a significant change in credit quality and the amounts are still considered recoverable. The Group does not hold any collateral over these balances. The average days overdue for these receivables is 133 days (June 2011: 89 days).
Consolidated 31 October
2011 $’000
30 June 2011 $’000
Ageing of past due but not impaired By up to 30 days 466 2,789 30 - 90 days 1,116 1,258 90 - 120 days 248 1,065 120 + days 3,047 2,444 4,877 7,556 Movement in allowance for doubtful debts Balance at the beginning of the period 1,000 1,208 Impairment (reduction)/losses recognised on receivables 92 (208) Amounts written off as unrecoverable - - Balance at the end of the period 1,092 1,000

e S e r v G l o b a l L i m i t e d
53
Notes to the Financial Statements for the financial period ended 31 October 2011
9. WORK IN PROGRESS
31 October 2011 $’000
30 June 2011 $’000
Contract work in progress 17,064 18,572 Progress billings and advances received (14,344) (14,892) 2,720 3,680
Recognised and included in the financial statements as amounts due:
From customers: Current (Note 8) 4,910 5,802 To customers as deferred income: Current (Note 17) (2,190) (2,122) 2,720 3,680
31 October
2011 $’000
30 June 2011 $’000
10. CURRENT INVENTORIES Finished goods 170 279

e S e r v G l o b a l L i m i t e d
54
Notes to the Financial Statements for the financial period ended 31 October 2011
11. PROPERTY, PLANT AND EQUIPMENT
Consolidated
Office furniture
and fittings
Leasehold improvements
Plant and equipment Total
$’000 $’000 $’000 $’000 Gross carrying amount – at cost Balance at 30 June 2010 1,889 20 10,852 12,761 Additions 52 - 528 580 Disposals (1,066) (9) (1,184) (2,259) Net foreign currency (160) 0 (1,869) (2,029) Balance at 30 June 2011 715 11 8,327 9,053 Additions 22 - 7 29 Disposals (86) - - (86) Net foreign currency (3) - (67) (70)
Balance at 31 October 2011 648 11 8,267 8,926
Accumulated depreciation Balance at 30 June 2010 1,518 4 8,168 9,690 Depreciation expense 245 12 1,120 1,377 Disposal (1,025) (12) (689) (1,726) Net foreign currency (154) - (1,975) (2,129) Balance at 30 June 2011 584 4 6,624 7,212 Depreciation expense 51 4 271 326 Disposal (55) - - (55) Net foreign currency (4) - (94) (98)
Balance at 31 October 2011 576 8 6,801 7,385 Net book value As at 30 June 2011 131 7 1,703 1,841
As at 31 October 2011 72 3 1,466 1,541

e S e r v G l o b a l L i m i t e d
55
Notes to the Financial Statements for the financial period ended 31 October 2011
Consolidated 31 October
2011 $’000
30 June 2011 $’000
12. GOODWILL Gross carrying amount and net book value Balance at the beginning of the financial period 15,637 19,403
Translation effects of foreign currency exchange movements (246) (3,766)
Balance at end of financial period 15,391 15,637 Accumulated impairment losses Balance at the beginning of the financial period (9,138) (12,583)
Translation effects of foreign currency exchange movements 129 3,445
Balance at end of financial period (9,009) (9,138) Net book value At the beginning of the financial period 6,499 6,820 At the end of the financial period 6,382 6,499
During the financial period, the Group assessed the recoverable amount of goodwill based on the methodology below, and determined that no further impairment was required (year to June 2011: $ nil). The recoverable amount was assessed by reference to the cash-generating unit’s value in use. A discount factor of 23% per annum (year to June 2011: 23% per annum) was applied in the value in use model. No write-down of the carrying amounts of other assets in the cash- generating unit was necessary.
Allocation of goodwill to cash-generating units
Goodwill has been allocated for impairment testing purposes to a single cash generating unit, being the entire business. This is because substantially the entire product list of the combined entity is available for sale to, and being sold to, substantially the entire customer base of the combined entity.
The recoverable amount of the cash-generating unit is determined based on a value-in-use calculation which uses cash flow projections based on financial budgets approved by management covering a 5 year period, and a terminal value based upon an extrapolation of cash flows beyond the 5 year period using an estimated growth rate of 3% per annum. The key assumptions used in the value-in-use calculation for the cash generating unit are as follows:
• Sales are expected to grow over the forecast period by 10%. • A gross margin of 60% over the forecast period: this is based upon average gross
margins achieved in the period immediately before the forecast period. • In performing the value-in-use calculations, the company has applied post-tax
discount rates to discount the forecast future attributable post tax cash flows. The equivalent pre-tax discount rate is 23% per annum.
• Operating expenses are expected to increase steadily over the forecast period, but at a rate lower than the sales growth.
Management believes that any reasonably possible change in the key assumptions on which recoverable amount is based would not cause the aggregate carrying amount to exceed the aggregate recoverable amount of the cash-generating unit.

e S e r v G l o b a l L i m i t e d
56
Notes to the Financial Statements for the financial period ended 31 October 2011
13. INTANGIBLES Consolidated
Software & documentation
acquired $’000
Customer relationships
acquired $’000
Software
development $’000
Total $’000
Gross carrying amount Balance at 30 June 2010 17,612 21,328 5,312 44,252
Internally developed - - 1,364 1,364 Effects of foreign currency exchange movements (67) (373) (285) (725) Balance at 30 June 2011 17,545 20,955 6,391 44,891
Internally developed - - 500 500 Effects of foreign currency exchange movements - (58) (92) (150)
Balance at 31 October 2011 17,545 20,897 6,799 45,241 Accumulated Amortisation and impairment
Balance at 30 June 2010 (16,547) (14,725) (253) (31,525) Amortisation expense (1,024) (2,735) (1,734) (5,493) Effects of foreign currency exchange movements 26 69 44 139 Balance at 30 June 2011 (17,545) (17,391) (1,943) (36,879) Amortisation expense - (891) (690) (1,581) Effects of foreign currency exchange movements - 15 12 27 Balance at 31 October 2011 (17,545) (18,267) (2,621) (38,433) Net Book Value As at 30 June 2011 - 3,564 4,448 8,012 As at 31 October 2011 - 2,630 4,178 6,808
Significant intangible assets The carrying amount of ‘Customer relationships acquired’ of $2.630 million (June 2011: $3.564 million) will be fully amortised in 1 year (June 2011: 2 years). ‘Software development’ costs of $6.799 million is amortised over three years.
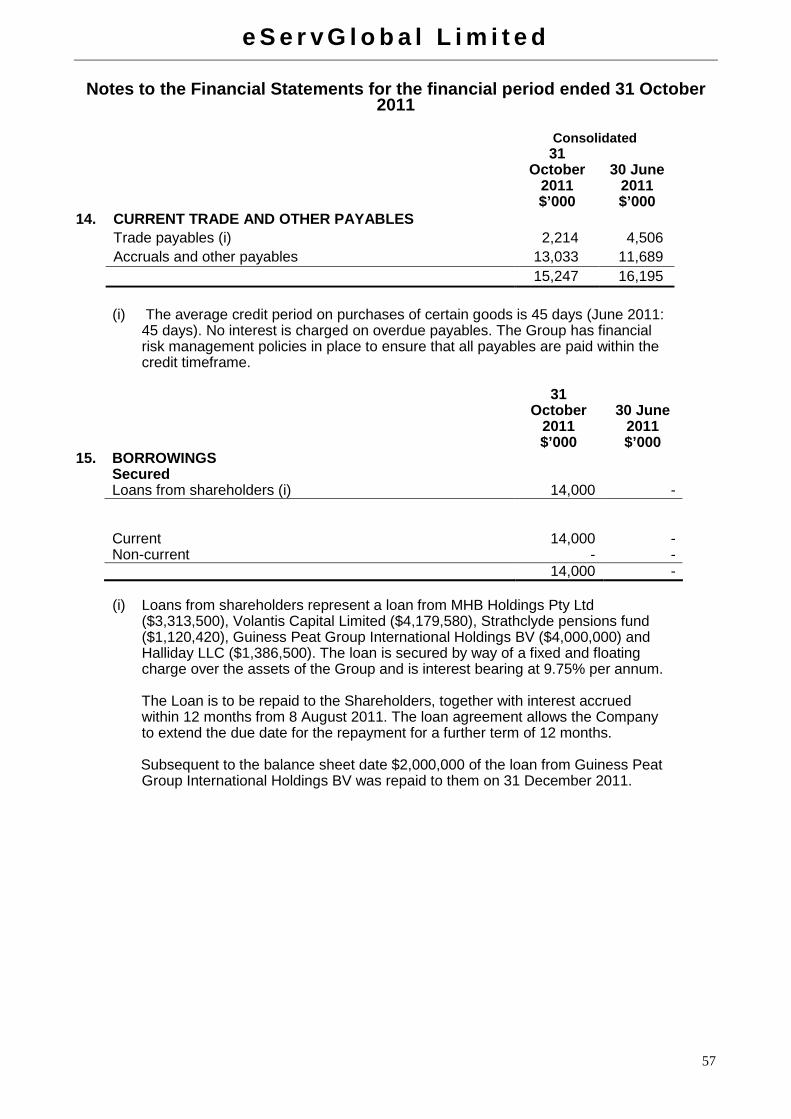
e S e r v G l o b a l L i m i t e d
57
Notes to the Financial Statements for the financial period ended 31 October
2011
Consolidated 31
October 2011 $’000
30 June 2011 $’000
14. CURRENT TRADE AND OTHER PAYABLES Trade payables (i) 2,214 4,506 Accruals and other payables 13,033 11,689 15,247 16,195
(i) The average credit period on purchases of certain goods is 45 days (June 2011: 45 days). No interest is charged on overdue payables. The Group has financial risk management policies in place to ensure that all payables are paid within the credit timeframe.
31
October 2011 $’000
30 June 2011 $’000
15. BORROWINGS Secured Loans from shareholders (i) 14,000 -
Current 14,000 - Non-current - - 14,000 -
(i) Loans from shareholders represent a loan from MHB Holdings Pty Ltd ($3,313,500), Volantis Capital Limited ($4,179,580), Strathclyde pensions fund ($1,120,420), Guiness Peat Group International Holdings BV ($4,000,000) and Halliday LLC ($1,386,500). The loan is secured by way of a fixed and floating charge over the assets of the Group and is interest bearing at 9.75% per annum.
The Loan is to be repaid to the Shareholders, together with interest accrued within 12 months from 8 August 2011. The loan agreement allows the Company to extend the due date for the repayment for a further term of 12 months.
Subsequent to the balance sheet date $2,000,000 of the loan from Guiness Peat Group International Holdings BV was repaid to them on 31 December 2011.

e S e r v G l o b a l L i m i t e d
58
Notes to the Financial Statements for the financial period ended 31 October 2011
16. PROVISIONS
Employee provisions
Retirement contribution plans
(i) Total $'000 $'000 $'000
Consolidated
Balance as at 30 June 2011 7,024 448 7,472 Additional provisions recognised - 17 17 Utilised during the period (4,509) (80) (4,589)
Balance as at 31 October 2011 2,515 385 2,900
Current 2,515 - 2,515 Non-current - 385 385 2,515 385 2,900
(i) The retirement contribution plan is the statutory termination payment due to eligible employees in France.
Consolidated 31
October 2011 $’000
30 June 2011 $’000
17. OTHER CURRENT LIABILITIES Deferred income (Note 9) 2,190 2,122

e S e r v G l o b a l L i m i t e d
59
Notes to the Financial Statements for the financial period ended 31 October 2011
18. ISSUED CAPITAL
31
October 2011 $’000
30 June
2011 $’000
196,847,706 fully paid ordinary shares (June 2011: 196,847,706)
90,770
123,946
31 October 2011 30 June 2011
No. ‘000
$ ‘000
No. ‘000
$ ‘000
Fully Paid Ordinary Shares Balance at the beginning of financial period 196,848 123,946 196,848 123,946 Balance at the end of financial period 196,848 90,770 196,848 123,946
On 8th August 2011, based on the Company’s shareholders approval, the directors declared a capital return of $0.16854 per share and paid to shareholders on 23rd August 2011. Total amount paid was $33,176,000. Fully paid ordinary shares carry one vote per share and carry the right to dividends.
Changes to the then Corporations Law abolished the authorised capital and par value concept in relation to share capital from 1 July 1998. Therefore, the company does not have a limited amount of authorised capital and issued shares do not have a par value.
Share Options
In accordance with the terms of the executive and employee share option plan as at 31 October 2011, employees are entitled to exercise options granted and thus acquire shares in the company. Details of the executive and employee share option plan are contained in Note 6 to the financial statements.

e S e r v G l o b a l L i m i t e d
60
Notes to the Financial Statements for the financial period ended 31 October
2011
Consolidated 31
October 2011 $’000
30 June
2011 $’000
19. RESERVES Foreign currency translation (3,376) (3,522) Employee equity-settled benefits 1,393 1,132 (1,983) (2,390) Foreign currency translation reserve Balance at beginning of financial period (3,522) (2,463) Translation of foreign operations 146 (1,059)
Balance at the end of the financial period (3,376) (3,522)
Exchange differences relating to the translation from Euros, being the functional currency of the eServGlobal SAS and its controlled entities, into Australian dollars are brought to account by entries made directly to the foreign currency translation reserve.
Employee equity-settled benefits reserve Balance at beginning of financial period 1,132 897 Share based payments 261 235 Balance at the end of the financial period 1,393 1,132
The employee equity-settled benefits reserve arises on the grant of share options to executives and employees under the executive and employee share option plan. Amounts are transferred out of the reserve and into issued capital when options are exercised. Further information about share-based payments to executives and employees is contained in Note 6 to the financial statements.
20. ACCUMULATED LOSSES
31 October
2011 $’000
30 June 2011 $’000
Balance at beginning of the financial period (26,770) (65,781)
(Loss)/Profit for the period attributable to equity holders of the parent (9,304) 39,011
Payment of dividends (note 22) (23,910) - Balance at end of financial period (59,984) (26,770)

e S e r v G l o b a l L i m i t e d
61
Notes to the Financial Statements for the financial period ended 31 October 2011
Consolidated Period
Ended 31 October
2011 Cents Per
Share
Year Ended 30 June
2011 Cents Per
Share
21. (LOSS)/EARNINGS PER SHARE Basic (loss)/earnings per share (4.7) 19.8 Diluted (loss)/earnings per share (4.7) 19.8 Basic earnings/(loss) per share
The (loss)/earnings and weighted average number of ordinary shares used in the calculation of basic (loss)/earnings per share are as follows:
Period Ended 31
October 2011
$’000
Year Ended 30 June
2011 $’000
Earnings – being the (loss)/profit for the period attributable to equity holders of the parent (9,304) 39,011
31 October
2011 No ‘000
30 June
2011 No ‘000
Weighted average number of ordinary shares 196,848 196,848 Diluted (loss)/earnings per share
The (loss)/earnings and weighted average number of ordinary and potential ordinary shares used in the calculation of diluted (loss)/earnings per share are as follows:
Period Ended 31
October 2011
$’000
Year Ended 30 June
2011 $’000
Earnings – being the (loss)/profit for the period attributable to equity holders of the parent (9,304) 39,011
31 October
2011 No ‘000
30 June
2011 No ’000
Weighted average number of ordinary shares and potential ordinary shares (a) 196,848 196,848
(a) Weighted average numbers of ordinary shares and potential ordinary shares used in the calculation of diluted (loss)/earnings per share reconciles to the weighted average number of ordinary shares used in the calculation of basic (loss)/earnings per share as follows:
Weighted average number of ordinary shares and potential ordinary shares used in the calculation of diluted (loss)/earnings per share
196,848 196,848

e S e r v G l o b a l L i m i t e d
62
Notes to the Financial Statements for the financial period ended 31 October 2011
Consolidated 31 October 2011 30 June 2011 Cents
Per Share Total $‘000
Cents Per Share
Total $‘000
22. DIVIDENDS Recognised Amounts Final dividend Fully Paid Ordinary Shares unfranked - - - - Special dividend recognised and paid Fully Paid Ordinary Shares partly franked 0.12146 23,910 - - Unrecognised Amounts Special dividend Fully Paid Ordinary Shares partly franked - - 0.12146 23,910
On 8th August 2011, based on the Company’s shareholders approval, the directors declared a special dividend of $0.12146 per share (franked amount at $0.083 per share) and paid to shareholders on 23rd August 2011. Total dividend paid was $23,910,000.
23. LEASES Operating Leases
Leasing arrangements Operating leases relate to office facilities with lease terms of up to five years. The Group does not have an option to purchase the leased asset at the expiry of the lease period.
Consolidated Period
Ended 31
October 2011 $’000
Year Ended
30 June 2011 $’000
Non-cancellable operating leases Not longer than 1 year 1,892 2,108 Longer than 1 year and not longer than 5 years 3,806 4,415 Longer than 5 years - - 5,698 6,523

e S e r v G l o b a l L i m i t e d
63
Notes to the Financial Statements for the financial period ended 31 October
2011
Ownership Interest
COUNTRY OF INCORPORATION
October
2011 %
June 2011
% 24. SUBSIDIARIES Parent Entity eServGlobal Limited Australia (vi) (vii) Subsidiary eServGlobal Holdings SAS France (i) 100 100 eServGlobal SAS France (i) (iii)(viii) 100 100 PT eServGlobal Indonesia Indonesia (i) (ix) 100 100
eServGlobal (Beijing) Telecommunication Technical Services, Co Ltd China (i) (ix) 100 100
eServGlobal Telecom Romania Srl Romania (i)(ix) 50 50
eServGlobal Telecom Serviços do Brasil Ltda Brazil (i) (ix) 100 100
eServGlobal (NZ) Pty Limited Australia (ii) (v) (vi) 100 100 eServGlobal (HK) Limited Hong Kong (i) 100 100 eServGlobal NVSA Belgium (i) 100 100 eServGlobal UK Limited United Kingdom (x) 100 100 eServ UK Limited United Kingdom(iv) 100 100 eServGlobal Singapore Pte. Ltd. Singapore (i) 100 100
eServGlobal Inc United States of America (iv) 100 100
eServGlobal Aust Pty Limited (formerly Integrator Pty Limited) Australia (iv) (v) (vi) 100 100
(i) These subsidiaries carry on business in their country of incorporation; France, Indonesia, China, Romania, Brazil, Hong Kong, Belgium and Singapore.
(ii) eServGlobal (NZ) Pty Ltd carries on business in Australia and has a branch which carries on business in New Zealand.
(iii) eServGlobal SAS carries on business in France and has branches or representative office which carry on business in Egypt, Poland, India and the United Arab Emirates.
(iv) These subsidiaries did not trade in the period ended 31 October 2011.
(v) These subsidiaries are classified as small proprietary companies and, in accordance
with the Corporations Act 2001, are relieved from the requirement to prepare, audit and lodge a financial report.
(vi) These companies are members of the Australian tax consolidated group. (vii) eServGlobal Limited is the head entity within the tax consolidated group.
(viii) This company is a subsidiary of eServGlobal Holdings SAS. Management have
determined that the group has the power to govern the financial and operating policies eServ Global Telecom Romania Srl.
(ix) These companies are subsidiaries of eServGlobal SAS.
(x) eServGlobal UK Limited carries on business in the United Kingdom and has a branch which carries on business in the Netherlands.

e S e r v G l o b a l L i m i t e d
64
Notes to the Financial Statements for the financial period ended 31 October
2011 25. SEGMENT INFORMATION The Group operates in a single segment being the telecommunications software solutions business. Information reported to the chief operating decision maker for the purposes of resource allocation and assessment of segment performance focuses on telecommunication software solution business. Revenue from major products and services The following is an analysis of the Group’s revenue from continuing operations from its major products and services.
Period Ended 31 October
2011 $’000
Year Ended 30
June 2011 $’000
Hardware 129 1,411 Licences 817 12,748 Services 1,398 8,671 Support 4,437 19,978 Software as a Service 236 - Total revenue from continuing operations 7,017 42,808 Geographical information The Group’s revenue from continuing operations from external customers are detailed below based on the external customers’ domiciles.
Period Ended 31 October
2011 $’000
Year Ended 30
June 2011 $’000
Middle East 1,970 11,299 Asia Pacific 1,538 8,475 Europe 1,383 7,728 Africa 1,955 12,500 Central and South America 171 2,806 Total revenue from continuing operations 7,017 42,808 Information about major customers Included in the Group’s revenue from continuing operations from external customers are revenues of approximately $4.1 million (Year ended 30 June 2011 : $18.3 million) which arose from sales to the Group’s largest customers.

e S e r v G l o b a l L i m i t e d
65
Notes to the Financial Statements for the financial period ended 31 October
2011 26. RELATED PARTY DISCLOSURES a) Equity Interests in Related Parties Equity Interests in Controlled Entities
Details of the percentage of ordinary shares held in subsidiaries are disclosed in Note 24 to the financial statements.
b) Key management personnel compensation Details of key management personnel compensation are disclosed in Note 5 to the financial
statements. c) Key management personnel equity holdings Fully paid ordinary shares issued by eServGlobal Limited.
Balance at 1
July Received on exercise of
options
Net other change
Balance at 31 October
No. No. No. No. Four months to
October 2011
D Smart 40,000 - - 40,000 R Mathews(i) 16,317,275 - - 16,317,275 C Halliday(ii) 23,445,324 - - 23,445,324 F Barrault 500,000 - - 500,000 A Eisen (iii) 38,316,296 - (38,316,296) - M Jefferies (iii) 38,316,296 - (38,316,296) -
James Brooke(iv)
36,363,462
-
(1,210,043)
35,153,419 Stephen Baldwin (v) - - 932,600 932,600 Year to June 2011 D Smart 40,000 - - 40,000 R Mathews(i) 17,529,396 - (1,212,121) 16,317,275 C Halliday(ii) 24,595,440 - (1,150,116) 23,445,324 F Barrault 500,000 - - 500,000 A Eisen (iii) 38,316,296 - - 38,316,296 M Jefferies (iii) 38,316,296 - - 38,316,296 James Brooke(iv) - - 36,363,462 36,363,462
(i) Has the power to exercise, control the exercise of, or influence the exercise of, the voting powers or disposal of the
securities to which the relevant interest relates of the 16,110,592 ordinary shares held by MHB Holdings Pty Ltd and
206,683 shares held by Paua Pty Ltd.
(ii) Has the power to exercise, control the exercise of, or influence the exercise of, the voting powers or disposal of the
securities to which the relevant interest relates of the 16,110,592 ordinary shares held by MHB Holdings Pty Ltd, 62,005
held by Paua Pty Ltd, and 7,272,727 shares held by National Nominees Limited
(iii) Shares held by Guinness Peat Group of which Anthony Eisen and Michael Jefferies are both executives. Both directors
resigned on 24 October 2011.
(iv) J Brooke was appointed a Director on 26 July 2010; he has a relevant interest in shares held by Gartmore Investment
Limited.
(v) Stephen Baldwin appointed a Director on 25 November 2011.

e S e r v G l o b a l L i m i t e d
66
Notes to the Financial Statements for the financial period ended 31 October
2011 26. RELATED PARTY DISCLOSURES (continued)
c) Key management personnel equity holdings (contin ued) Options issued by eServGlobal Limited to Executives
Balance at
1 July
Granted as
compen-
sation
Exercised Net other
change
Balance at
31 October
Balance
vested at 31
October
Vested but
not
exercisable
Vested and
exercisable
Vested
during the
year
No. No. No. No. No. No. No. No. No.
Four months to October 2011
Craig Halliday 1,000,000 - - - 1,000,000 - - - -
R Arame 1,000,000 - - - 1,000,000 - - - -
S Blundell 1,000,000 - - - 1,000,000 - - - -
JC Bouillon(i) 50,000 - - (50,000) - - - - -
Balance at
1 July
Granted as
compen-
sation
Exercised Net other
change
Balance at
30 June
Balance
vested at
30 June
Vested but
not
exercisable
Vested and
exercisable
Vested
during the
year
No. No. No. No. No. No. No. No. No.
Year to June 2011
Craig Halliday - 1,000,000 - - 1,000,000 - - - -
R Arame - 1,000,000 - - 1,000,000 - - - -
S Blundell - 1,000,000 - - 1,000,000 - - - -
JC Bouillon(i) 50,000 - - - 50,000 50,000 - 50,000 -
(i) J C Bouillon resigned on 17 March 2011
Each executive share plan option converts into one ordinary share of eServGlobal Limited when the option is exercised and the exercise price paid. When options are issued, no amounts are paid or payable by the recipient of the option (Refer Note 6). d) Non executive directors option holdings There were no options in issue to non executive directors during the financial period or in the prior financial year.

e S e r v G l o b a l L i m i t e d
67
Notes to the Financial Statements for the financial period ended 31 October
2011 26. RELATED PARTY DISCLOSURES (continued)
Consolidated Period
Ended 31 October
2011 $
Year Ended 30 June
2011 $
e) Loans from related parties Loans from shareholders 14,000,000 -
During the period, the Group received a secured loan from shareholders (refer Note 15).
f) Other related party transactions - Francois Barrault (a non-executive
director) received fees for strategic consulting services on normal commercial terms
- Interest on shareholder loans
-
525,963
67,861
-
g) Parent Entities The parent and ultimate parent entity in the Group is eServGlobal Limited.

e S e r v G l o b a l L i m i t e d
68
Notes to the Financial Statements for the financial period ended 31 October 2011
27. NOTES TO THE STATEMENT OF CASH FLOWS
Consolidated Period
Ended 31 October
2011 $’000
Year Ended 30
June 2011
$’000 a) Reconciliation of cash For the purposes of the statement of cash flows, cash and cash
equivalents includes cash on hand and in banks and investments in money market instruments, net of outstanding bank overdrafts. Cash at the end of the financial period as shown in the statement of cash flows is reconciled to the related items in the statement of financial position as follows:
Cash and cash equivalents 10,129 60,820 Bank overdraft - - 10,129 60,820 b) Financing facilities Secured shareholder loan facility issued on 19 August 2011 � amount used 14,000 - � amount unused - - Total Secured loan facilities 14,000 - Secured bank facilities � amount used - - � amount unused - 5,000 Total Secured bank facilities - 5,000 In January 2012 the Company secured a $2,500,000 bank bill
facility to August 2012. The facility is subject to a range of covenants and provisions.
c) Reconciliation of (loss)/ profit for the period to net cash
flows from operating activities
(Loss)/ profit for the period (9,258) 39,159 Interest income (769) (3,975) Depreciation of non-current assets 326 1,377 Amortisation of non-current assets 1,581 5,493 Loss on disposal of non-current assets 31 533 Equity settled share-based payments 261 235 Gain on disposal of business - (69,340) Increase/(decrease) in current income tax balances 163 11,013 Increase/(decrease) in deferred tax balances (700) (6,045) Changes in net assets and liabilities, net of effects from
acquisition of businesses:
- (Increase)/decrease in assets: - Receivables 4,457 8,889 - Inventories 109 574 Increase/(decrease) in liabilities: - Trade payables (536) 2,791 - Provisions (4,572) 2,914 - Other liabilities 68 (3,183) Net cash used in operating activities (8,839) (9,565)

e S e r v G l o b a l L i m i t e d
69
Notes to the Financial Statements for the financial period ended 31 October
2011 27. NOTES TO THE STATEMENT OF CASH FLOWS (continued )
Consolidated
31 October
2011 $’000
30 June 2011
$’000 d) Cash balance not available for use 420 418
The above cash balance which is not available for use is held as security by the financial institutions in relation to a financial guarantee that has been issued on behalf of the company. The cash balance is held in interest yielding account.
28. FINANCIAL INSTRUMENTS
a) Significant Accounting Policies Details of the significant accounting policies and methods adopted, including the criteria for
recognition, the basis of measurement and the basis on which revenues and expenses are recognised, in respect of each class of financial asset, financial liability and equity instrument are disclosed in Note 1 to the financial statements.
b) Capital Risk Management The Group manages its capital to ensure that entities in the Group will be able to continue as
a going concern while maximising the return to stakeholders through the optimisation of the debt and equity balance. The Group’s overall strategy remains unchanged from the year ended 30 June 2011. The capital structure of the Group includes cash and cash equivalents and equity attributable to equity holders of the parent, comprising issued capital, reserves and retained earnings. At 31 October 2011 the Group had no borrowings against formalised available facilities disclosed in Note 27 (June 2011: $ nil). The Group has borrowings of $ 14.0m which are secured (June 2011: $ nil). Operating cash flows are used to maintain and expand the Group’s assets as well as to pay for operating expenses, tax liabilities and development activities.
c) Financial Risk Management Objectives The Group’s activities expose it to a variety of financial risks: market risk (including currency
and interest rate risk), credit risk and liquidity risk. The Group’s overall risk management program focuses on the unpredictability of financial and exchange rate markets and seeks to minimise potential adverse effects on the Group’s performance. The Group seeks to minimise the effect of foreign currency risks using derivative financial instruments detailed at 28 (e). A risk management framework, including the policy on use of financial derivatives is governed by the Board of Directors. The Group does not enter into or trade financial instruments, including derivative financial instruments, for speculative purposes.
d) Market Risk The Group’s activities expose it primarily to the financial risks of changes in foreign currency
exchange rates. The Group has entered into forward foreign exchange contracts to cover foreign currency receipts arising from specific customer orders. There has been no change to the Group’s exposure to market risks or the manner in which it manages and measures the risk from the previous period.

e S e r v G l o b a l L i m i t e d
70
Notes to the Financial Statements for the financial period ended 31 October 2011
28. FINANCIAL INSTRUMENTS (continued)
e) Foreign Currency Risk Management The Group undertakes certain transactions denominated in foreign currencies that are different to
the functional currency of the respective entities undertaking the transactions, hence exposures to exchange rate fluctuations arise. Exchange rate exposures arising from specific customer orders are managed within approved policy parameters utilising forward foreign exchange contracts. The carrying amount of the Group’s foreign currency denominated monetary assets and monetary liabilities at the reporting date that are denominated in a currency that is different to the functional currency of the respective entities holding the monetary assets and liabilities are as follows:
Assets Liabilities 31 October
2011 30 June
2011 31 October
2011 30 June
2011 $’000 $’000 $’000 $’000 US dollars 3,346 3,469 55 189 Euro 253 166 99 - Forward foreign exchange contracts It is the policy of the Group to enter into forward foreign exchange contracts to cover foreign
currency receipts arising from specific customer orders. The Group has entered into fixed price contracts to supply Software and Services and as a consequence has, in certain cases, entered into forward foreign exchange contracts (for terms not exceeding 12 months) to hedge the exchange risk arising from these transactions. The following table details the forward foreign currency contract outstanding as at the reporting date:
Average Exchange
Rate Foreign Currency Contract Value Fair Value
Outstanding Contacts
October 2011
June 2011
October 2011
USD’000
June 2011
USD’000
October 2011 $’000
June 2011 $’000
October 2011 $’000
June 2011 $’000
Sell US Dollars Less than 3 months 1.0846 1.0671 394 79 363 74 (12) - 3 to 6 months n/a n/a - - - - - - 7 to 9 months n/a n/a - - - - - - 394 79 363 74 (12) - Consolidated 31 October
2011 30 June
2011 Categories of financial instruments $’000 $’000 Financial Assets : Cash and cash equivalents 10,129 60,820 Loans and receivables Receivables 9,516 12,503 Deferred sales proceeds 23,534 24,416 Deposits and accrued interest 551 1,111 Financial Liabilities: Trade payables (at amortised cost) 2,214 4,506 Loans from shareholders 14,000 -

e S e r v G l o b a l L i m i t e d
71
Notes to the Financial Statements for the financial period ended 31 October 2011
28. FINANCIAL INSTRUMENTS (continued) Foreign currency sensitivity analysis The following table details the Group’s sensitivity to a 10% increase and decrease in the
Australian dollar against the relevant foreign currencies, which represents management’s assessment of the possible change in foreign exchange rates. The sensitivity analysis includes only outstanding foreign currency denominated monetary items (arising from monetary assets and liabilities held at balance date in a currency different to the functional currency of the respective entities holding the assets or liabilities) and adjusts their translation at a period end for a 10% change in foreign currency rates.
USD Impact Consolidated 31 October
2011 30 June
2011 $’000 $’000 Profit or loss 378 406 Euro Impact Consolidated 31 October
2011 30 June
2011 $’000 $’000 Profit or loss 37 16 A positive number indicates an increase in profit or loss with the Australian Dollar
strengthening against the respective currency. For a weakening of the Australian Dollar against the respective currency there would be an equal and opposite impact on the profit, and the amounts above would be negative.
In management’s opinion, the above sensitivity analysis is not fully representative of the
inherent foreign exchange risk as the year end exposure does not necessarily reflect the exposure during the course of the year. In addition, the Group includes certain subsidiaries whose functional currencies are different to the Group’s presentation currency. The main operating entity outside of Australia is based in France. This entity transacts primarily in its functional currency, the Euro, and does not have significant foreign currency exposures, because of the hedging policies outlined above. As stated in the Group’s Accounting Policies Note 1(e), on consolidation the assets and liabilities of these entities are translated into Australian dollars at exchange rates prevailing on the balance date. The income and expenses of these entities is translated at the average exchange rates for the period. Exchange differences arising are classified as equity and are transferred to a foreign exchange translation reserve. The Group’s future reported profits could therefore be impacted by changes in rates of exchange between the Australian Dollar and the Euro.
f) Interest Rate Risk Management The Group’s exposure to interest rate risk at 31 October 2011 is limited to the interest
generated on deposits balances invested during the course of the year which attract a variable interest rate and yielded a 4.6% (Year Ended 30 June 2011: 5.2%) weighted average interest rate for the financial period.
Interest rate sensitivity analysis The Group’s sensitivity to interest rates is restricted only to surplus cash placed on short-term
deposit or short-term drawings on facilities utilised to manage operational cash requirements across the entities within the group.

e S e r v G l o b a l L i m i t e d
72
Notes to the Financial Statements for the financial period ended 31 October 2011
28. FINANCIAL INSTRUMENTS (continued) g) Credit Risk Management Credit risk refers to the risk that a counterparty will default on its contractual obligations
resulting in financial loss to the Group. The Group has adopted the policy of only dealing with creditworthy counterparties, as a means of mitigating the risk of financial loss from defaults. Trade receivables consist of a relatively small number of closely managed customers, spread across diverse geographical areas. Ongoing credit evaluation is performed on the financial condition of accounts receivable as part of the overall client management process. The carrying amount of the financial assets recorded in the financial statements, net of any allowance for losses, represents the Group’s maximum exposure to credit risk.
h) Liquidity Risk Management Ultimate responsibility for liquidity risk management rests with the board of directors, who
have built an appropriate liquidity risk management framework for the management of the Group’s short, medium and long-term funding and liquidity management requirements. The Group manages liquidity risk by maintaining adequate reserves, banking facilities and reserve borrowing facilities by continuously monitoring forecast and actual cash flows and matching the maturity profiles of financial assets and liabilities.
Liquidity and interest risk tables The following tables detail the Group’s remaining contractual maturity for its non-derivative
financial liabilities. The tables have been drawn up based on the undiscounted cash flows of financial liabilities based on the earliest date on which the Group can be required to pay. The table includes both interest and principal cash flows.
Weighted
average effective
interest rate %
Less than 1 month
$’000
1-3 months
$’000
3 months – 1 year $’000
1-5 years $’000
Consolidated 31 October 2011 Trade payables - Non-interest bearing - 1,476 738 - - Borrowings from shareholders 9.75% - - 14,000 - 30 June 2011 Trade payables - Non-interest bearing
- 3,003 1,503 - -
Bank borrowings - - - - -

e S e r v G l o b a l L i m i t e d
73
Notes to the Financial Statements for the financial period ended 31 October 2011
28. FINANCIAL INSTRUMENTS (continued) The following tables detail the Group’s expected maturity for its non-derivative financial assets. The tables have been drawn up based on the undiscounted contractual maturities of the financial assets including interest that will be earned on those assets except where the Group anticipates that the cash flow will occur in a different period based on the earliest date on which the Group can expect to receive payment. The table includes both interest and principal cash flows. Weighted
average effective interest
rate %
Less than 1 month $’000
1-3 months $’000
3 months – 1 year
$’000 1-5 years
$’000
5+ years $’000
Consolidated 31 October 2011 Cash and cash equivalents 3.93% 10,129 - - - - Deposits – interest bearing 3.50% 6,400 6,014 11,230 - - Deposits - Non-interest bearing - - - 551 - - Trade receivables - Non-interest bearing
- 5,234 2,617 1,665 - -
21,763 8,631 13,446 - - 30 June 2011 Cash and cash equivalents 4.78% 61,060 - - - - Deposits – interest bearing 3.80% - 12,208 - 12,208 Deposits - Non-interest bearing - - - 871 -
-
Trade receivables - Non-interest bearing
- 6,877 3,438 2,188 - -
67,937 15,646 3,059 12,208 -
i) Fair Value of Financial Instruments The fair values of financial assets and financial liabilities are determined as follows:
• The fair value of other financial assets and financial liabilities are determined in accordance with generally accepted pricing models based on discounted cash flow analysis using prices from observable current market transactions;
• Foreign currency forward contracts are measured using quoted forward exchange rates and yield curves derived from quoted interest rates matching maturities of the contracts.
The directors consider that the carrying amount of financial assets and financial liabilities recorded at amortised cost in the financial statements approximates their fair values.

e S e r v G l o b a l L i m i t e d
74
Notes to the Financial Statements for the financial period ended 31 October
2011 29. DISPOSAL OF BUSINESS On 3 August 2010, the Group disposed of its USP assets and undertakings.
Period Ended
31 October
2011 $’000
Year Ended
30 June 2011 $’000
(a) Consideration received Cash consideration received - 79,439 Deferred sales proceeds (c) - 23,616 Total consideration received - 103,055 (b) Gain on disposal of business Consideration received (a) - 103,055 Net assets disposed - (27,620) Disposal related costs - (6,095) - 69,340 Net assets disposed comprise of:
Goodwill - 26,794 Work in Progress - 585 Prepayments - 105 Property Plant and Equipment - 447 Employee Provisions - (311) - 27,620 (c) Deferred sales proceeds disclosed as : Current - 12,208 Non current - 12,208 - 24,416 Less: accrued interest - (800) - 23,616 (d) Deferred sales proceeds comprise of : (i) The first escrow balance of $11.5 million excluding accrued interest was due to be received
on 3 August 2011 but was subject to a claim from Oracle which was resolved in November 2011 (refer Note 31).
(ii) The second and final escrow payment of $11.8 million excluding interest is due to be
released by the escrow agent in August 2012. This balance is also subject to indemnification provisions within the transaction agreements. However, at the date of this report, the Directors are not aware of any other matter or circumstance that has arisen since the end of the financial period that would affect the full receipt of the second and final escrow payment.

e S e r v G l o b a l L i m i t e d
75
Notes to the Financial Statements for the financial period ended 31 October
2011 30. PARENT ENTITY INFORMATION 30.1 Financial position 31 October
2011 30 June 2011
$’000 $’000 Assets Current assets 11,465 42,779 Non-current assets 32,772 53,349 Total assets 44,237 96,128 Liabilities Current liabilities 15,365 1,318 Non-current liabilities - - Total liabilities 15,365 1,318 Equity Issued capital (i) 90,770 123,946 Accumulated losses (ii) (63,291) (30,268) Reserves Employee equity-settled benefits 1,393 1,132 Total equity 28,872 94,810 30.2 Financial performance Period
Ended 31 October
2011 $’000
Year Ended 30 June
2011 $’000
(Loss)/ profit for the period (9,113) 37,811 Other comprehensive income - - Total comprehensive (loss)/ income (9,113) 37,811 (i) On 8th August 2011, based on the Company’s shareholders approval, the directors declared a capital
return of $0.16854 per share and paid to shareholders on 23rd August 2011. Total amount paid was
$33,176,000.
(ii) On 8th August 2011, based on the Company’s shareholders approval, the directors declared a special
dividend of $0.12146 per share (franked amount at $0.083 per share) and paid to shareholders on 23rd
August 2011. Total dividend paid was $23,910,000.

e S e r v G l o b a l L i m i t e d
76
Notes to the Financial Statements for the financial period ended 31 October
2011 31. SUBSEQUENT EVENTS
Claim from Oracle Australia Pty Limited On 30 July 2011 eServGlobal received notification from Oracle claiming that it had or anticipated incurring losses in connection with three alleged joint customer billing issues and was entitled to be indemnified by eServGlobal pursuant to the transaction agreements in connection with these losses. Oracle had claimed against the escrow fund in connection with these losses for the amount of $11.5 million. The claim on the escrow amount was resolved in November 2011. In accordance with the resolution, Oracle released the full $11.5M escrow amount to eServGlobal and eServGlobal paid for services delivered by Oracle which were incurred and fully provided in the prior financial year.
32. ADDITIONAL COMPANY INFORMATION eServGlobal Limited is a listed public company, incorporated in Australia and operating in
Australia, Europe, the Middle East, North Africa, Asia/Pacific and the Americas.
Registered Office Suite 5, 30 Florence Street
Newstead QLD 4006 Australia Tel: +61 7 3302 0194

e S e r v G l o b a l L i m i t e d
77
Additional Securities Exchange Information as at 12 January 2012
Ordinary share capital 196,847,706 fully paid ordinary shares are held by 1,052 individual shareholders on the Australian Securities Exchange and 104 individual depository interest holders on the London Stock Exchange (AIM). All issued ordinary shares carry one vote per share.
Options 34 individual option holders hold 6,710,000 options Options do not carry a right to vote.
Distribution of holders of equity securities Fully Paid Ordinary
Shares Listed on ASX
Depository Interests Listed on LSE (AIM)
Options- not listed
1-1,000 125 7 - 1,001-5,000 393 12 - 5,001-10,000 210 12 7 10,001-100,000 270 34 11 100,001-Over 54 39 16 Total 1,052 104 34 Holding less than a marketable parcel
169
Substantial shareholders Number Percentage Guinness Peat Group plc and its subsidiaries 38,316,296 19.46% Henderson Global Investors Ltd 36,363,462 18.47% Legal and General Investment Management Plc 22,949,900 11.66% MHB Holdings Pty Ltd 16,110,592 8.18%
Twenty largest holders of quoted equity securities
Australian Securities Exchange Computershare Clearing Pty Ltd holds 91,958,893 ordinary
fully paid shares on behalf of the Depositary Interest Holders.
London Stock Exchange (AIM)
Ordinary Shareholders Number % of
capital Depository Interest Holders Number
% of
capital
GPG NOMINEES PTY LIMITED 37,316,296 18.96 VIDACOS NOMINEES LIMITED 27,723,343 14.08
MHB HOLDINGS PTY LTD 16,110,592 8.18 NORTRUST NOMINEES LIMITED 15,423,628 7.78
NATIONAL NOMINEES LIMITED 11,117,939 5.65 NORTRUST NOMINEES LIMITED 7,430,076 3.77
J P MORGAN NOMINEES AUSTRALIA LIMITED 3,745,075 1.90 HSBC GLOBAL CUSTODY NOMINEE (UK) LIMITED 4,767,342 2.42
LINK 405 PTY LTD 3,161,189 1.61 NUTRACO NOMINEES LIMITED 3,934,172 1.99
BT PORTFOLIO SERVICES LIMITED 2,906,272 1.48 THE BANK OF NEW YORK (NOMINEES) LIMITED 3,195,273 1.62
PATRICK MCGRORY 1,730,426 0.88 HSBC GLOBAL CUSTODY NOMINEE (UK) LIMITED 2,577,654 1.31
MR IAN FRASER MCMANAMEY 1,591,382 0.81 PERSHING NOMINEES LIMITED 2,392,614 1.22
HSBC CUSTODY NOMINEES 1,247,647 0.63 CHASE (GA GROUP) NOMINEES LIMITED 2,391,175 1.22
RBC DEXIA INVESTOR SERVICES 1,060,401 0.54 PERSHING NOMINEES LIMITED 2,077,070 1.01
SANDHURST TRUSTEES LTD 914,654 0.46 HSBC GLOBAL CUSTODY NOMINEE (UK) LIMITED 1,967,279 0.99
MR STEPHEN JOHN BALDWIN SUPERANNUATION
FUND
850,000 0.43 MORSTAN NOMINEES LIMITED 1,852,000 0.94
TOBERMORY HOLDINGS PTY LTD 679,147 0.35 TD WEALTH INSTITUTIONAL NOMINEES (UK)
LIMITED
1,778,966 0.90
MR WALTER FREDERICK HOLLAND 600,000 0.30 L R NOMINEES LIMITED 1,685,849 0.86
JANVIN PTY LTD 600,000 0.30 BNY (OCS) NOMINEES LIMITED 1,450,000 0.74
EQUITY TRUSTEES LIMITED 542,250 0.28 HSBC GLOBAL CUSTODY NOMINEE (UK) LIMITED 1,260,000 0.64
AUSTRALIAN EXECUTOR TRUSTEES 515,318 0.26 CHASE NOMINEES LIMITED 1,210,043 0.62
MR FRANCOIS BARRAULT 500,000 0.25 HSBC CLIENT HOLDINGS NOMINEE (UK) LIMITED 1,000,000 0.51
NBT PTY LIMITED 500,000 0.25 VIDACOS NOMINEES LIMITED 994,422 0.51
MR JAMES PRATT 500,000 0.25 BNY (OCS) NOMINEES LIMITED 857,708 0.44

e S e r v G l o b a l L i m i t e d
78
Additional Securities Exchange Information
as at 12 January 2012
Secretary Tom Rowe Chief Financial Officer Stephen Blundell Registered Office & Principal Administration Office Suite 5 30 Florence Street Teneriffe QLD 4006 Australia Tel: +61 7 3302 0194 Share Registry Computershare Registry Services Pty Ltd Level 3, 60 Carrington Street Sydney NSW 2000 Australia Stock Exchange listings eServGlobal Limited’s ordinary shares are quoted on the Australian Securities Exchange Limited under the ticker “ESV”, and on the London Stock Exchange (AIM) as Depository Interests under the ticker “ESG”.


![Luzhou 9MFY13 Presentation.ppt [Repaired]luzhou.listedcompany.com/newsroom/20131112_173859_L46_4288… · FY: Year ended December 31 1Q: Three months ended March 31 2Q:Three months](https://static.documents.pub/doc/80x56/5f50d0ed9f531e5913404436/luzhou-9mfy13-repairedluzhoulistedcompanycomnewsroom20131112173859l464288.jpg)


