217
Comprehensive Annual Financial Report City of Pico Rivera, California Fiscal Year Ended June 30, 2015
Comprehensive Annual
Financial Report
City of Pico Rivera, California
Fiscal Year Ended June 30, 2015

This page intentionally left blank.

CITY OF PICO RIVERA,CALIFORNIA
COMPREHENSIVE ANNUALFINANCIAL REPORT
FOR THE FISCAL YEAR ENDED JUNE 30, 2015
Prepared By
Finance Department

This page intentionally left blank.

CITY OF PICO RIVERA
COMPREHENSIVE ANNUAL FINANCIAL REPORT
TABLE OF CONTENTS
For the year ended June 30, 2015
PageNumber
INTRODUCTORY SECTION:Letter of Transmittal iCity Officials viiOrganizational Chart viiiCertificate of Achievement for Excellence in Financial Reporting ix
FINANCIAL SECTION:Independent Auditors’ Report 1
Management’s Discussion and Analysis(Required Supplementary Information) 5
Basic Financial Statements:Government-wide Financial Statements:
Statement of Net Position 19Statement of Activities 20
Fund Financial Statements:Governmental Funds:
Description of Major Funds 23Balance Sheet 24Reconciliation of the Governmental Funds Balance Sheet
to the Statement of Net Position 27Statement of Revenues, Expenditures and Changes in Fund Balances 28Reconciliation of the Governmental Funds Statement of Revenues,
Expenditures and Changes in Fund Balances to the Statement of Activities 30
Proprietary Funds:Statement of Net Position 31Statement of Revenues, Expenses and Changes in Net Position 32Statement of Cash Flows 33
Fiduciary Funds:Description of Fiduciary Funds 35Statement of Fiduciary Net Position 36Statement of Changes in Fiduciary Net Position 37
Notes to Financial Statements 39
CITY OF PICO RIVERA
COMPREHENSIVE ANNUAL FINANCIAL REPORT
TABLE OF CONTENTS(CONTINUED)
For the year ended June 30, 2015
PageNumber
Required Supplementary Information: 97Schedule of Changes in Net Pension Liability and Related Ratios -
Miscellaneous Employees Plan 98Schedule of Contributions - Miscellaneous Employees Plan 99Schedule of Changes in Net Pension Liability and Related Ratios - Council Plan 100Schedule of Contributions - Council Plan 101Schedules of Funding Progress - Other Post-Employment Benefits 102Budgetary Comparison Schedules:
General Fund 103Housing Agency Section 8 Special Revenue Fund 104Federal Grants Special Revenue Fund 105
Note to Required Supplementary Information 106
Supplementary Information: 107
Other Major Fund - Budgetary Comparison Schedule: 109Capital Improvement Capital Projects Fund 110
Other Governmental Funds:Description of Other Governmental Funds 111Combining Balance Sheet 114Combining Statement of Revenues, Expenditures and Changes
In Fund Balances 120Schedules of Revenues, Expenditures and Changes in Fund Balance -
Budget and Actual:Community Development Block Grant Special Revenue Fund 126State Gas Tax Special Revenue Fund 127Lighting Assessment District Special Revenue Fund 128Park Development Special Revenue Fund 129Prop A Special Revenue Fund 130Prop C Special Revenue Fund 131Measure R Special Revenue Fund 132HOME Grant Special Revenue Fund 133CalHOME Grant Special Revenue Fund 134
CITY OF PICO RIVERA
COMPREHENSIVE ANNUAL FINANCIAL REPORT
TABLE OF CONTENTS(CONTINUED)
For the year ended June 30, 2015
PageNumber
Supplementary Information (Continued):
Other Governmental Funds (Continued):Schedules of Revenues, Expenditures and Changes in Fund Balance -
Budget and Actual (Continued):Air Quality Improvement Special Revenue Fund 135County Grants Special Revenue Fund 136State Grants Special Revenue Fund 137Economic Development Assistance Grant Special Revenue Fund 138Image Enhancement Special Revenue Fund 139Sewer Maintenance Special Revenue Fund 140Reach Grants Special Revenue Fund 141Cable/PEG Support Special Revenue Fund 142Transportation Development Act Special Revenue Fund 143Paramount/Mines Landscape Maintenance Assessment Capital Projects Fund 144
Other Enterprise Funds:Description of Other Enterprise Funds 145Combining Statement of Net Position 146Combining Statement of Revenues, Expenses and Changes in Net Position 147Combining Statement of Cash Flows 148
Internal Service Funds:Description of Internal Service Funds 149Combining Statement of Net Position 150Combining Statement of Revenues, Expenses and Changes in Net Position 151Combining Statement of Cash Flows 152
Agency Fund:Description of Agency Fund 153Combining Statement of Fiduciary Assets and Liabilities 154Combining Statement of Changes in Assets and Liabilities 155
CITY OF PICO RIVERA
COMPREHENSIVE ANNUAL FINANCIAL REPORT
TABLE OF CONTENTS(CONTINUED)
For the year ended June 30, 2015
PageNumber
STATISTICAL SECTION (UNAUDITED): 157
Description of Statistical Section Contents 159
Financial Trends:Net Position by Component - Last Ten Fiscal Years 160Change in Net Position - Expenses and Program Revenues - Last Ten Fiscal Years 162Change in Net Position - General Revenues - Last Ten Fiscal Years 164Fund Balances of Governmental Funds - Last Ten Fiscal Years 166Changes in Fund Balances of Governmental Funds - Last Ten Fiscal Years 168
Revenue Capacity:Governmental Activities Tax Revenues by Sources - Last Ten Fiscal Years 170Revenue Base by Category - Last Ten Fiscal Years 172Property Tax Levies and Tax Collections - Last Ten Fiscal Years 174Direct and Overlapping Governments Property Tax Rates - Last Ten Fiscal Years 176Principal Property Taxpayers - Current Fiscal Year and Nine Fiscal Years Ago 177Top 25 Sales Tax Producers - Current Fiscal Year and Nine Fiscal Years Ago 179
Debt Capacity:Ratios of Outstanding Debt by Type - Last Ten Fiscal Years 180Ratio of General Bonded Debt Outstanding - Last Ten Fiscal Years 182Direct and Overlapping Debt 183Legal Debt Margin Information - Last Ten Fiscal Years 184Pledged Revenue Bond Coverage:
Water Authority Revenue Bonds - Last Ten Fiscal Years 1862001 Tax Allocation Refunding Bonds - Last Ten Fiscal Years 1862009 Lease Revenue Bonds - Last Six Fiscal Years 186
Demographic and Economic Information:Demographic and Economic Statistics - Last Ten Fiscal Years 187Principal Employers - Current Fiscal Year and Nine Fiscal Years Ago 188
Operating Information:Full-Time Equivalent City Employees by Function - Last Ten Fiscal Years 189Operating Indicators by Function - Last Ten Fiscal Years 190Capital Asset Statistics by Function - Last Ten Fiscal Years 192

INTRODUCTORY SECTION

This page intentionally left blank.
See Management’s Discussion and Analysis for additional information
ii
The following component units are reported on a blended basis as part of the primary government because their boards are comprised of all City Council members or they are, in substance, part of the City’s operations:
Pico Rivera Water Authority Pico Rivera Housing Assistance Agency Pico Rivera Public Financing Authority Pico Rivera is a general law city and operates under a Council-Manager form of government. The City provides a full range of municipal services including public works, water, sewer, storm drainage, construction and maintenance of roads and highways, planning and zoning, recreation and cultural activities, and general administrative support. Police, fire (took out sewer and inserted above) and library services are provided by Los Angeles County. The services provided by the Pico Rivera Housing Assistance Agency include low-moderate income housing assistance. Economic Condition and Outlook The recent recession has been the longest in the United States since World War II and has represented the most significant economic challenge since the Great Depression. The City’s vigorous economic development efforts continue to be funded in a manner that produces beneficial results. A key focus of the City’s economic development strategy is to ensure that services and amenities are well balanced and targeted to maximize business opportunities throughout the community. As these previous years have seen the opening of various retailers and housing developments, the upcoming years will see an increased economic development activity that will include proposed and permitted infill housing development, hotel projects, and business expansions. The City’s top priority is to preserve and enhance the high quality of life Pico Rivera residents have come to expect. One of the keys to any community’s quality of life is a vibrant and diversified economic base, with both a qualified workforce and quality jobs. The City continues to be active in applying for federal and state grants as well as renewing existing grants. Knowing that some grant funding from the State and the Federal may face cuts, the City will still continue its efforts to boost revenue resources and recover costs more efficiently wherever possible. For Fiscal Years 2012-13, 2013-14, and 2014-15, the General Fund had operating surpluses (before transfers in/out), of $4,031,560, $3,185,010, and $4,763,592 respectively. There were also city-wide governmental activities surpluses of $8,277,038, $6,568,623 and $5,161,117 (before extraordinary and special items), respectively. For FY 2015-16, the General Fund operating budget is balanced and mid-year adjustments are minimal. Even though pension costs are anticipated to rise in FY 2016-17, recent employee union negotiations are shifting more of the employee share of the pension cost to employees. It is anticipated that General Fund operating budgets will continue to have operating surpluses.

vii
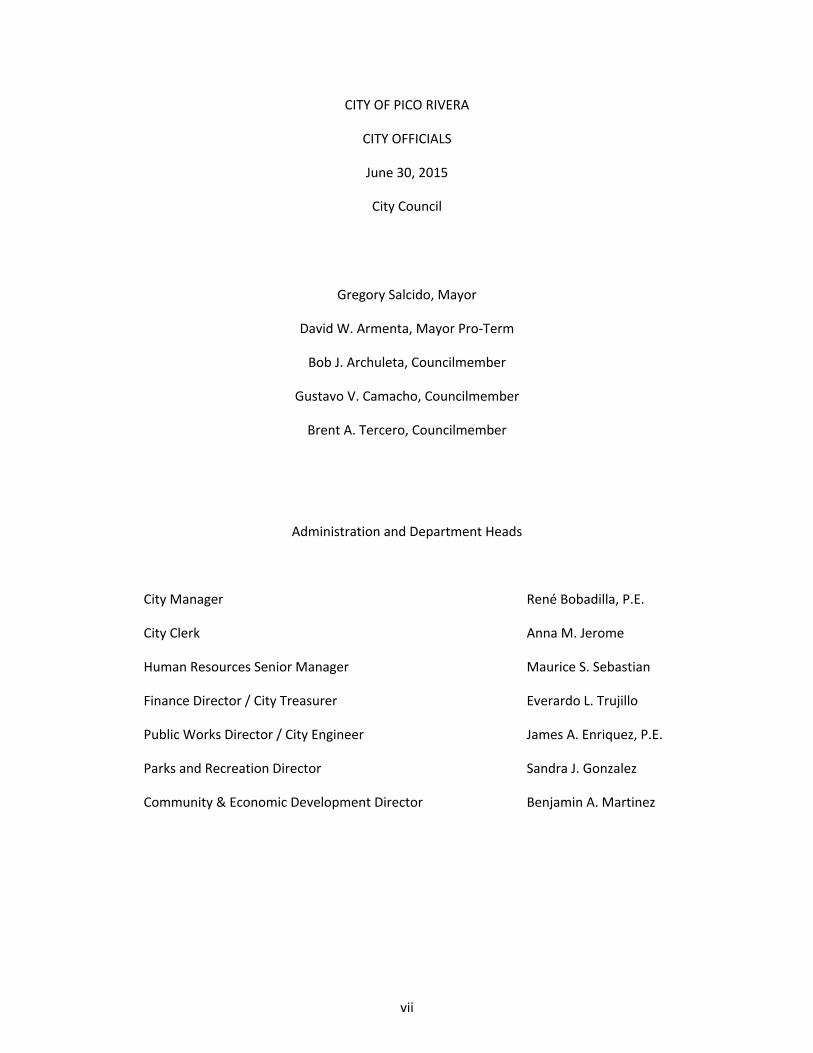
CITY OF PICO RIVERA
CITY OFFICIALS
June 30, 2015
City Council
Gregory Salcido, Mayor
David W. Armenta, Mayor Pro-Term
Bob J. Archuleta, Councilmember
Gustavo V. Camacho, Councilmember
Brent A. Tercero, Councilmember
Administration and Department Heads
City Manager René Bobadilla, P.E.
City Clerk Anna M. Jerome
Human Resources Senior Manager Maurice S. Sebastian
Finance Director / City Treasurer Everardo L. Trujillo
Public Works Director / City Engineer James A. Enriquez, P.E.
Parks and Recreation Director Sandra J. Gonzalez
Community & Economic Development Director Benjamin A. Martinez

viii
CIT
Y C
OU
NC
IL
Cit
y A
tto
rney
Arn
old
Alv
arez
-Gla
sma
n
Cit
y M
anag
erR
ené
Bo
ba
dil
la, P
.E.
Cit
y C
lerk
’sO
ffic
eH
um
an
Res
ou
rces
Div
isio
n
HR
Sen
ior
Man
ager
Ma
uri
ce S
. S
eba
stia
n
Sec
reta
ry
Ass
ista
nt
to t
he
Cit
y M
anag
erR
ay
mo
nd
Ch
av
ezB
enja
min
Ca
rdén
as
Sen
ior
Ex
ecu
tiv
e A
ssis
tan
tE
xec
uti
ve
Ass
ista
nt
Cit
y C
lerk
An
na
M.
Jer
om
e
Sec
reta
ry
Sis
ter
Cit
y C
om
mis
sio
n
4 A
pp
oin
tees
Lin
da
Ma
rtin
ezG
ust
avo
Co
ntr
era
sC
rist
ina
Her
na
nd
ezD
avi
d A
ng
eló
Dir
ecto
r of
Par
ks a
ndR
ecre
atio
nS
and
raJ
.Gon
zale
z
Dir
ecto
r of
Com
mun
ity
and
Eco
nom
ic D
evel
opm
ent
Ben
jam
in A
.Ma
rtin
ez
Dir
ecto
r of
Pub
lic
Wor
ks/C
ity
Eng
inee
r Ja
mes
A.
En
riq
uez
, P
.E.
She
riff
Cap
tain
All
en C
aste
llan
oD
irec
tor
of
Fin
ance
/Cit
y T
reas
urer
Eve
rard
o L
.Tru
jill
o

This page intentionally left blank.

FINANCIAL SECTION

This page intentionally left blank.
2875 Michelle Drive, Suite 300, Irvine, CA 92606 • Tel: 714.978.1300 • Fax: 714.978.7893
Offices located in Orange and San Diego Counties
- 1 -
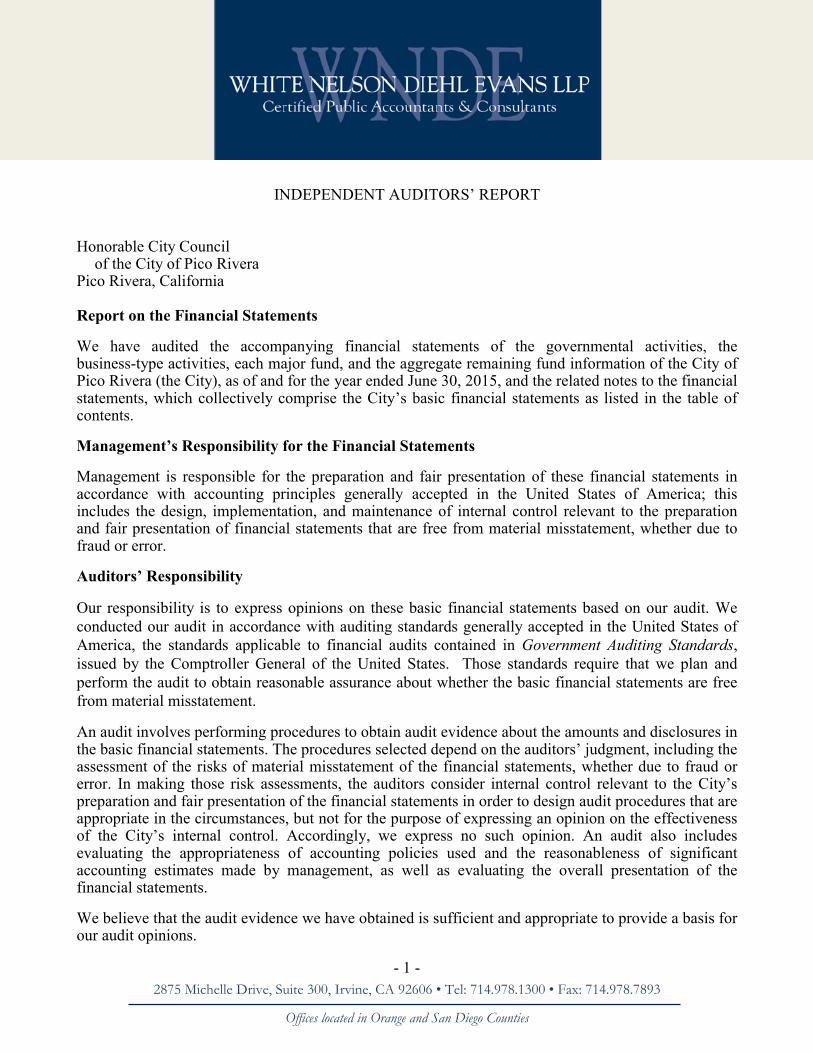
INDEPENDENT AUDITORS’ REPORT
Honorable City Councilof the City of Pico Rivera
Pico Rivera, California
Report on the Financial Statements
We have audited the accompanying financial statements of the governmental activities, the business-type activities, each major fund, and the aggregate remaining fund information of the City of Pico Rivera (the City), as of and for the year ended June 30, 2015, and the related notes to the financial statements, which collectively comprise the City’s basic financial statements as listed in the table of contents.
Management’s Responsibility for the Financial Statements
Management is responsible for the preparation and fair presentation of these financial statements in accordance with accounting principles generally accepted in the United States of America; this includes the design, implementation, and maintenance of internal control relevant to the preparation and fair presentation of financial statements that are free from material misstatement, whether due to fraud or error.
Auditors’ Responsibility
Our responsibility is to express opinions on these basic financial statements based on our audit. We conducted our audit in accordance with auditing standards generally accepted in the United States of America, the standards applicable to financial audits contained in Government Auditing Standards, issued by the Comptroller General of the United States. Those standards require that we plan and perform the audit to obtain reasonable assurance about whether the basic financial statements are free from material misstatement.
An audit involves performing procedures to obtain audit evidence about the amounts and disclosures in the basic financial statements. The procedures selected depend on the auditors’ judgment, including the assessment of the risks of material misstatement of the financial statements, whether due to fraud or error. In making those risk assessments, the auditors consider internal control relevant to the City’s preparation and fair presentation of the financial statements in order to design audit procedures that are appropriate in the circumstances, but not for the purpose of expressing an opinion on the effectiveness of the City’s internal control. Accordingly, we express no such opinion. An audit also includes evaluating the appropriateness of accounting policies used and the reasonableness of significant accounting estimates made by management, as well as evaluating the overall presentation of the financial statements.
We believe that the audit evidence we have obtained is sufficient and appropriate to provide a basis for our audit opinions.
- 2 -
Opinions
In our opinion, the basic financial statements referred to above present fairly, in all material respects, the respective financial position of the governmental activities, the business-type activities, each major fund, and the aggregate remaining fund information of the City of Pico Rivera, as of June 30, 2015, and the respective changes in financial position and, where applicable, cash flows thereof for the year then ended in accordance with accounting principles generally accepted in the United States of America.
Emphasis of Matters
As discussed in Notes 1D and 14 to the financial statements, the City adopted Governmental Accounting Standards Board’s Statement No. 68, “Accounting and Financial Reporting for Pensions”and Statement No. 71, “Pension Transition for Contributions Made Subsequent to the Measurement Date, an Amendment of GASB Statement No. 68”. The adoption of these standards required retrospective application resulting in a $26,458,379 and $3,803,379 reduction of previously reported net position of the governmental activities and business-type activities, respectively, and a $3,785,253 and $18,126 reduction of previously reported net position of the water operations and other enterprise funds, respectively. Our opinions are not modified with respect to this matter.
As discussed in Note 3 to the financial statements, the outstanding advance from the City to the Water Authority did not change during the year since there were no surplus revenues, as defined by the agreement, available to make a payment on the advance. Our opinion is not modified with respect to this matter.
Other Matters
Required Supplementary Information
Accounting principles generally accepted in the United States of America require that the management’s discussion and analysis, the schedules of changes in net pension liability and related ratios for the Miscellaneous Employees and Council Plans, the schedules of contributions for the Miscellaneous Employees and Council Plans, the schedule of funding progress - other post-employment benefits and the budgetary comparison schedules, identified as Required Supplementary Information (RSI) in the accompanying table of contents, be presented to supplement the basic financial statements. Such information, although not a part of the basic financial statements, is required by the Governmental Accounting Standards Board, who considers it to be an essential part of financial reporting for placing the basic financial statements in an appropriate operational,economic, or historical context. We have applied certain limited procedures to the RSI in accordance with auditing standards generally accepted in the United States of America, which consisted of inquiries of management about the methods of preparing the information and comparing the information for consistency with management’s responses to our inquiries, the basic financial statements, and other knowledge we obtained during the audit of the basic financial statements. We do not express an opinion or provide any assurance on the RSI because the limited procedures do not provide us with sufficient evidence to express an opinion or provide any assurance.

- 3 -
Other Matters (Continued)
Other Information
Our audit was conducted for the purpose of forming opinions on the financial statements that collectively comprise the City’s basic financial statements. The introductory section, combiningstatements and individual fund schedules (supplementary information), and statistical section are presented for purposes of additional analysis and are not a required part of the basic financial statements.
The supplementary information, as listed in the accompanying table of contents, is the responsibility of management and was derived from and relates directly to the underlying accounting and other records used to prepare the basic financial statements. Such information has been subjected to the auditing procedures applied in the audit of the basic financial statements and certain additional procedures, including comparing and reconciling such information directly to the underlying accounting and other records used to prepare the basic financial statements or to the basic financial statements themselves, and other additional procedures in accordance with auditing standards generally accepted in the United States of America. In our opinion, the supplementary information is fairly stated in all material respects in relation to the basic financial statements as a whole.
The introductory and statistical sections have not been subjected to the auditing procedures applied in the audit of the basic financial statements and, accordingly, we do not express an opinion or provide any assurance on them.
Other Reporting Required by Government Auditing Standards
In accordance with Government Auditing Standards, we have also issued our report datedJanuary 21, 2016, on our consideration of the City’s internal control over financial reporting and on our tests of its compliance with certain provisions of laws, regulations, contracts, and grant agreements and other matters. The purpose of that report is to describe the scope of our testing of internal control over financial reporting and compliance and the results of that testing, and not to provide an opinion on internal control over financial reporting or on compliance. That report is an integral part of an audit performed in accordance with Government Auditing Standards in considering the City’s internal control over financial reporting and compliance.
Irvine, CaliforniaJanuary 21, 2016

- 4 -
This page intentionally left blank.
CITY OF PICO RIVERAMANAGEMENT’S DISCUSSION AND ANALYSIS
June 30, 2015
- 5 -
The Management Discussion and Analysis provides a narrative introduction, overview and analysis that will assist in understanding of the City’s financial statements. We encourage readers to consider the information presented here in conjunction with the City’s financial statements as of June 30, 2015, thetransmittal letter and the notes to the basic financial statements.
OVERVIEW OF THE FINANCIAL STATEMENTS
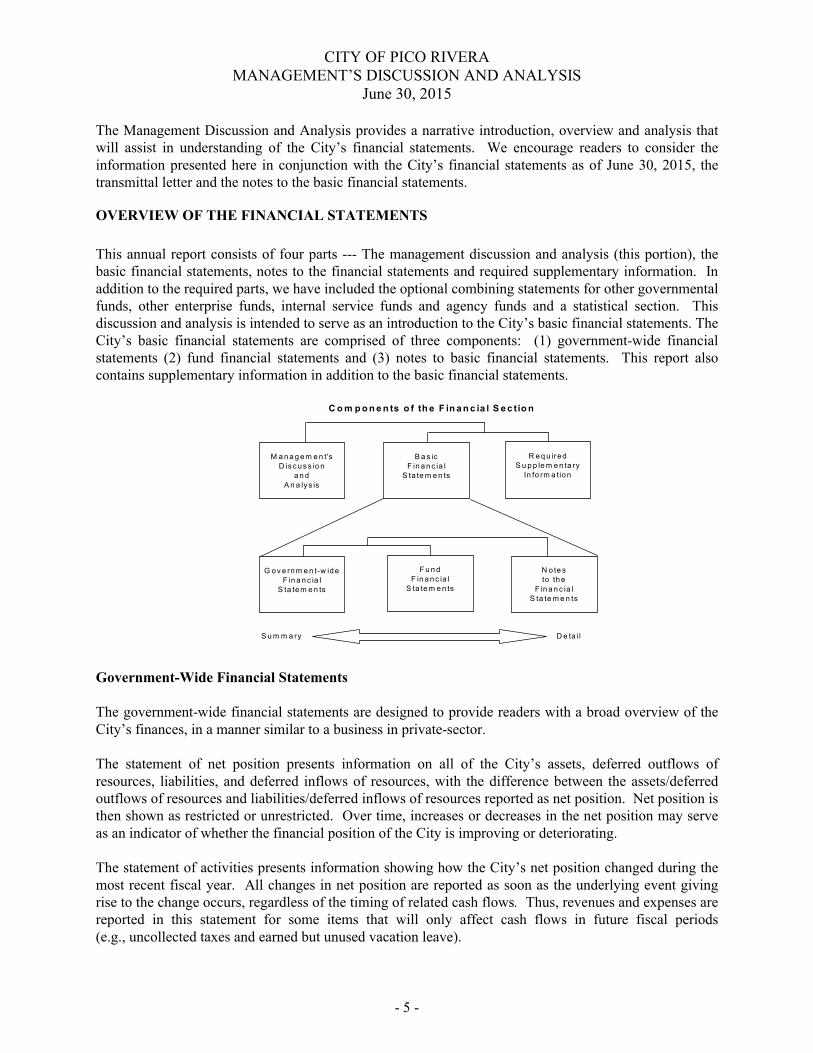
This annual report consists of four parts --- The management discussion and analysis (this portion), the basic financial statements, notes to the financial statements and required supplementary information. In addition to the required parts, we have included the optional combining statements for other governmental funds, other enterprise funds, internal service funds and agency funds and a statistical section. This discussion and analysis is intended to serve as an introduction to the City’s basic financial statements. The City’s basic financial statements are comprised of three components: (1) government-wide financial statements (2) fund financial statements and (3) notes to basic financial statements. This report also contains supplementary information in addition to the basic financial statements.
S u m m a ry D e ta il
C o m p o n e n ts o f th e F in a n c ia l S e c tio n
M a n a g e m e n t'sD is c u s s io n
a n d
A n a ly s is
B a s icF in a n c ia l
S ta te m e n ts
R e q u iredS u p p le m e n ta ry
In fo rm a tio n
G o v e rn m e n t-w id eF in a n c ia l
S ta te m e n ts
F u n d
F in a n c ia lS ta te m e n ts
N o te s to th e
F in a n c ia lS ta te m e n ts
Government-Wide Financial Statements
The government-wide financial statements are designed to provide readers with a broad overview of the City’s finances, in a manner similar to a business in private-sector.
The statement of net position presents information on all of the City’s assets, deferred outflows of resources, liabilities, and deferred inflows of resources, with the difference between the assets/deferred outflows of resources and liabilities/deferred inflows of resources reported as net position. Net position is then shown as restricted or unrestricted. Over time, increases or decreases in the net position may serve as an indicator of whether the financial position of the City is improving or deteriorating.
The statement of activities presents information showing how the City’s net position changed during the most recent fiscal year. All changes in net position are reported as soon as the underlying event giving rise to the change occurs, regardless of the timing of related cash flows. Thus, revenues and expenses are reported in this statement for some items that will only affect cash flows in future fiscal periods (e.g., uncollected taxes and earned but unused vacation leave).
CITY OF PICO RIVERAMANAGEMENT’S DISCUSSION AND ANALYSIS
June 30, 2015
- 6 -
The government-wide financial statements distinguish functions of the City that are principally supported by taxes and intergovernmental revenues (governmental activities). The governmental activities of the City include general government, public safety, public works, parks and recreation, health and welfare, community development, non-departmental, and interest on long-term debt.
The government-wide financial statements include not only the City itself (known as the primary government), but also three legally separate entities, the Pico Rivera Public Financing Authority, the Pico Rivera Water Authority, and the Pico Rivera Housing Assistance Agency. The City is financially accountable for these entities and financial information for these blended component units is reported within the financial information presented for the primary government itself.
The government-wide financial statements can be found beginning on page 19 of this report.
Fund Financial Statements
A fund is a grouping of related accounts that is used to maintain control over resources that have been segregated for specific activities or objectives. The City, like other state and local governments, uses fund accounting to ensure and demonstrate compliance with finance-related legal requirements. All of the City’s funds can be divided into three categories: governmental funds, proprietary funds, and fiduciary funds.
Governmental Funds - Governmental funds are used to account for essentially the same functions reported as governmental activities in the government-wide financial statements. However, unlike the government-wide financial statements, governmental fund financial statements focus on near-terminflows and outflows of spendable resources, as well as on balances of spendable resources available at the end of the fiscal year. Such information may be useful in evaluating the City’s near-term financial requirements.
Since the focus of governmental funds is narrower than that of the government-wide financial statements, it is useful to compare the information presented for governmental funds with similar information presented for governmental activities in the government-wide financial statements. By doing so, readers may better understand the long-term impact of the City’s near-term financial decisions. Both the governmental funds balance sheet and the governmental funds statement of revenue, expenditures and changes in fund balances provide a reconciliation to facilitate this comparison between governmental funds and governmental activities.
This document reports twenty-six (26) governmental funds. Information is presented separately in the
governmental funds balance sheet (pages 24 & 25) and in the governmental funds statement of revenues,
expenditures and changes in fund balances (pages 28 & 29) for the General Fund, the Housing Agency
Section 8 Special Revenue Fund, Federal Grants Special Revenue Fund, and the Capital Improvement
Capital Projects Fund since these funds are considered major funds. Data from the additional twenty-two
(22) other governmental funds are combined into a single, aggregated presentation. Individual fund data
for each of these other governmental funds is provided in the form of combining statements in the other
governmental funds supplementary information section of this report which begins on page 111.
CITY OF PICO RIVERAMANAGEMENT’S DISCUSSION AND ANALYSIS
June 30, 2015
- 7 -
The City adopts an annual appropriated budget for its General Fund as well as its other governmental,
funds. Budgetary comparison statements are presented on pages 103 through 105, 110 and 126 through
144. The governmental funds financial statements can be found on pages 24 through 30 of this report.
Proprietary Funds - Proprietary funds use the accrual basis of accounting, which is the same method used
by private businesses. The City maintains two different types of proprietary funds: enterprise funds and
internal service funds. The City has three enterprise funds and they are the Water Enterprise Fund, the
Golf Course Fund and the Sports Arena Fund. The three internal service funds are the OPEB (other
post-employment benefit) Liability Fund, the Leave Liability Fund, and the Equipment Replacement
Fund. The basic proprietary fund financial statements can be found beginning on pages 31 through 34
and pages 145 through 148 and 149 through 152 of this report.
Fiduciary Funds - Fiduciary funds are used to account for resources held for the benefit of parties outside
the government. The City has three Fiduciary funds which are the Successor Agency to the City of Pico
Rivera Redevelopment Agency Private-Purpose Trust Fund, the Assessment District 95-1 Improvement
Agency Fund and the Southeast Water Coalition Joint Powers Authority Fund. These funds are not
reflected in the government-wide financial statements because the resources of those funds are not
available to support the City’s own programs. The accounting used for fiduciary funds is the full accrual
accounting method. The fiduciary fund financial statements can be found on pages 36 and 37 and
pages 153 through 155 of this report.
Notes to Financial Statements
The notes to the financial statements provide additional information that is essential to a full
understanding of the data provided in the government-wide and fund financial statements. The notes to
the financial statements can be found beginning on page 39 of this report.
Required Supplementary Information
The required supplementary information further explains and supports the information in the financial
statements. This section includes the schedules of the City’s funding for its employee pension programs,
other post-employment benefit program and the budgetary comparison for the general and major special
revenue funds. The required supplementary information can be found on page 97 through 106 of this
report.
Other Supplementary Information
Other supplementary information includes combining and individual budgetary comparison schedules for
non major Governmental Funds, combining statements for other enterprise funds, internal services funds
and agency funds. Other supplementary information can be found on pages 107 through 155 of this
report.
CITY OF PICO RIVERAMANAGEMENT’S DISCUSSION AND ANALYSIS
June 30, 2015
- 8 -
FINANCIAL HIGHLIGHTS
Citywide
The City’s total net position decreased from $296.57 million to $274.48 million. Of this amount,
there was an increase in total assets of $7.74 million to $410.70 million, an increase in total
liabilities of $27.03 million to $133.82 million, an increase of deferred outflows of resources of
$2.24 million and an increase of deferred inflows of resources of $ 4.63 million. The increase in
liabilities, deferred inflows of resources and deferred outflows of resources are all related to
incorporating into the financial statements a net pension liability required under GASB 68.
Citywide revenues totaled $65.59 million, an increase of $.766 million over the prior year.
Expenses were $58.48 million an increase of $2.37 million over the prior year.
Citywide capital assets, before depreciation, increased $5.16 million to $436.93 million. This
increase includes street and park construction projects in progress, completion of street projects
partially offset by the auction of obsolete vehicles and equipment.
Fund Level – Governmental Funds
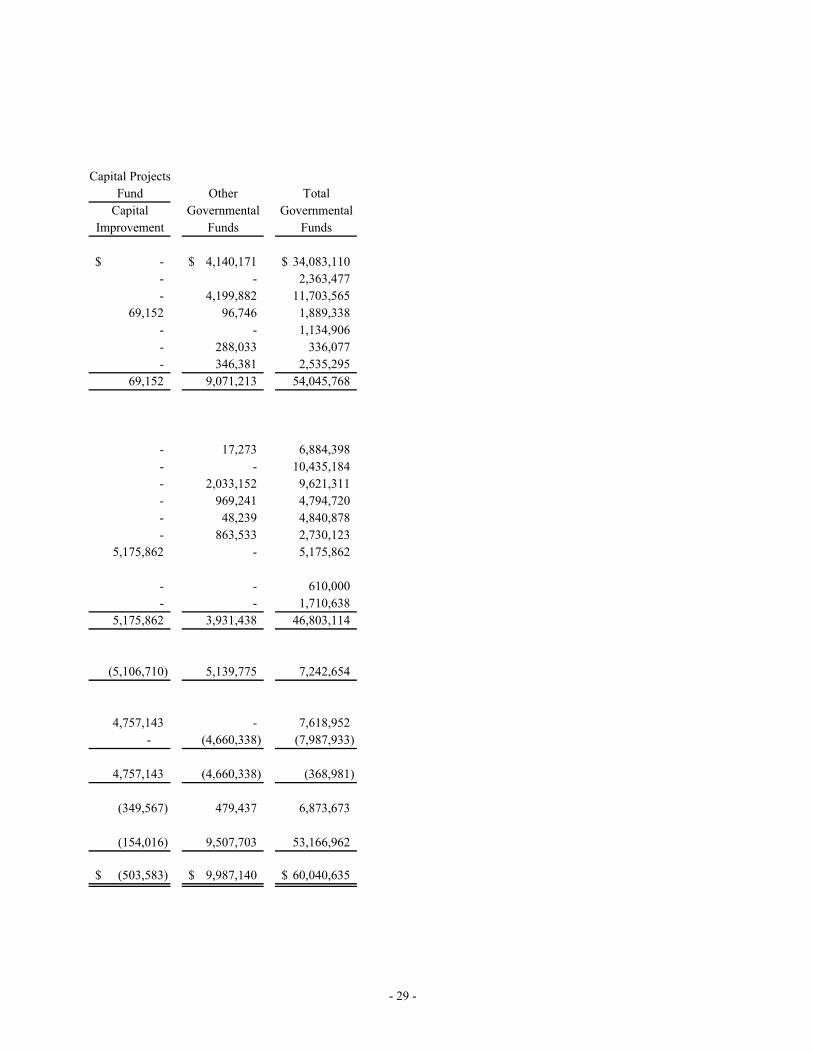
Governmental Fund revenues (excluding Other Financing Sources) increased $2.96 million to
$54.05 million. This increase was primary due to nearly a million in new sewer fund assessment
revenues and funding from outside agencies for construction projects.
Governmental Fund expenditures (excluding Other Financing Sources) decreased $3.06 million
to $46.80 million. This decrease was comprised of the following items a $2.54 million reduction
in capital outlay and small increases or decreases in department operating expenditures.
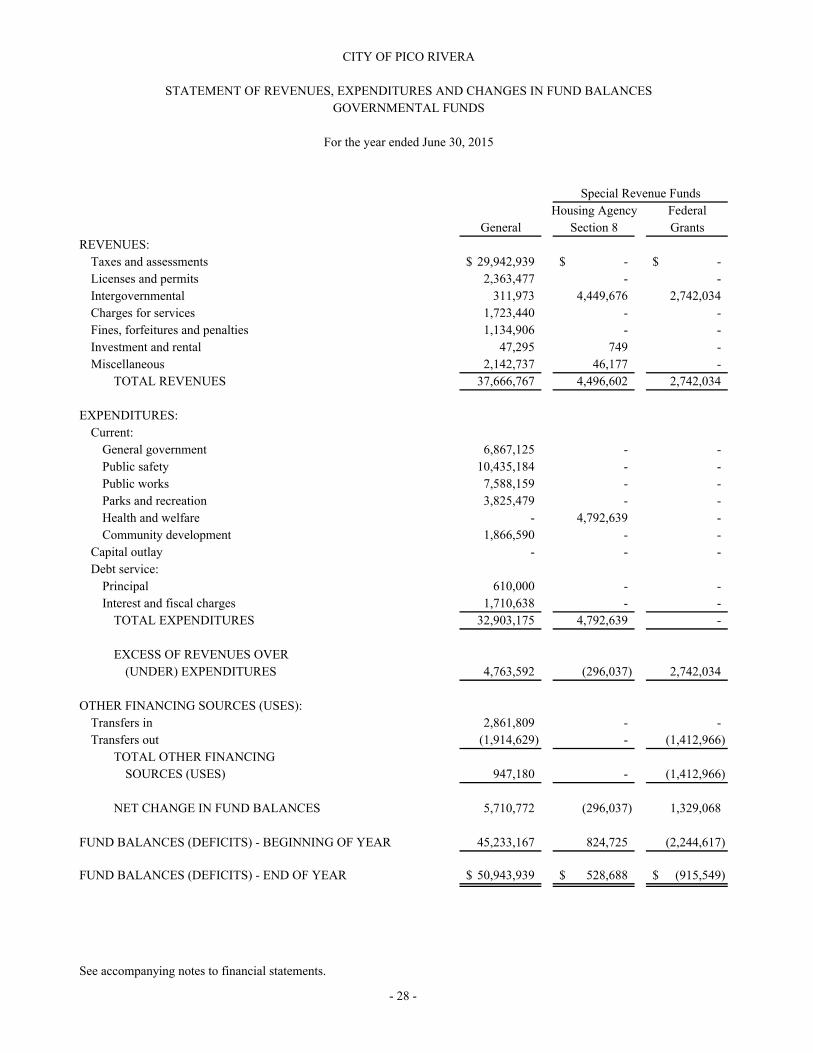
General Fund revenues were $37.67 million, an increase of $1.19 million over the prior year.
There were increases in taxes and assessments, licenses and permits, intergovernmental and
miscellaneous revenue. These increases were partially offset by decreased in fines & forfeitures
and charges for service. General Fund expenditures were $32.90 million, a $.38 million decrease
from the prior year. The General Fund balance increased $5.71 million at June 30, 2015 to
$50.94 million.
Fund Level – Proprietary Funds
The City has three Enterprise Funds and three Governmental Activities Internal Service Funds.
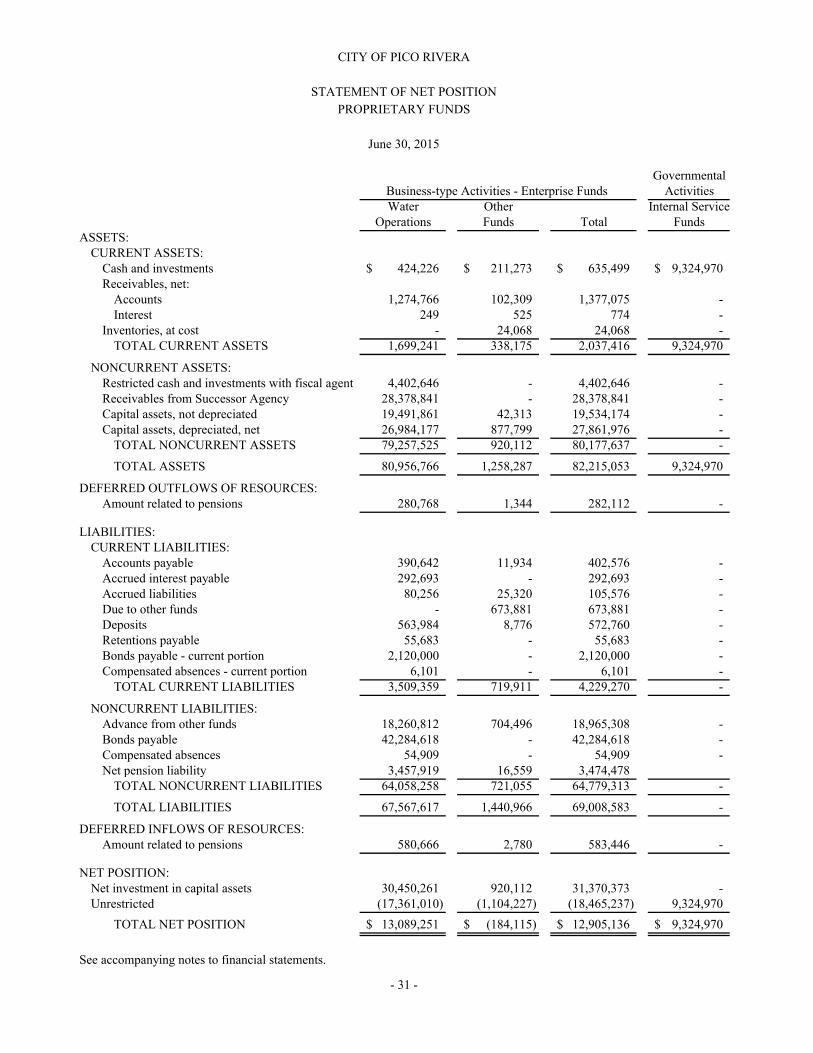
Business-type Activities – Enterprise Funds -- Overall, the total net position of these funds decreased $1.85 million to $12.91 million. Specifically, the net position for the Water Fund, the Golf Course Fund, and the Sports Arena Fund were $13.09 million, a negative $3,217 and a negative $.181 million, respectively.
CITY OF PICO RIVERAMANAGEMENT’S DISCUSSION AND ANALYSIS
June 30, 2015
- 9 -
Total current and noncurrent assets decreased $1.41 million to $82.22 million.
Total current and noncurrent liabilities increased $1.35 million.
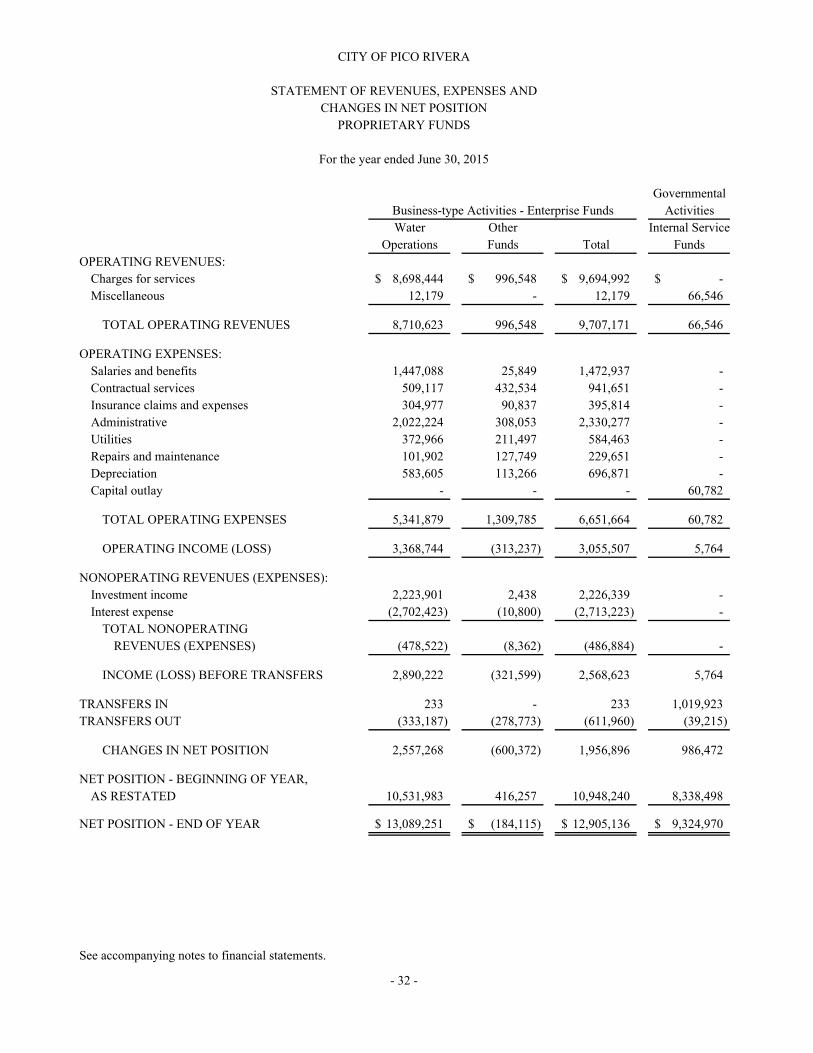
Total operational revenues decreased $.219 million to $9.71 million and operating expenses
increased $.046 million to $6.66 million.
Internal Service Funds – Governmental Activities –The three Internal Service Funds, OPEB, Leave
Liability and Equipment Replacement, account for the financing of services provided to departments
on a cost-reimbursement basis. The total net position increased $.99 million to $9.32 million.
Total current assets ended the year at $9.32 million, current liabilities were zero and the total net
positions were $9.32 million.
Fund Level – Fiduciary Funds
The three Fiduciary Funds are discussed later in this document.
GOVERNMENT-WIDE FINANCIAL ANALYSIS
The City of Pico Rivera is presenting its financial statements under the reporting models required by the
Governmental Accounting Standard Board (GASB) pronouncements. The most recent pronouncement,
GASB 68, requires the reporting of pension obligations on these financial statements. Shown below is
the schedule of Statement of Net Position for the years ended June 30, 2015 and 2014.
CITY OF PICO RIVERA MANAGEMENT’S DISCUSSION AND ANALYSIS
June 30, 2015
- 10 -
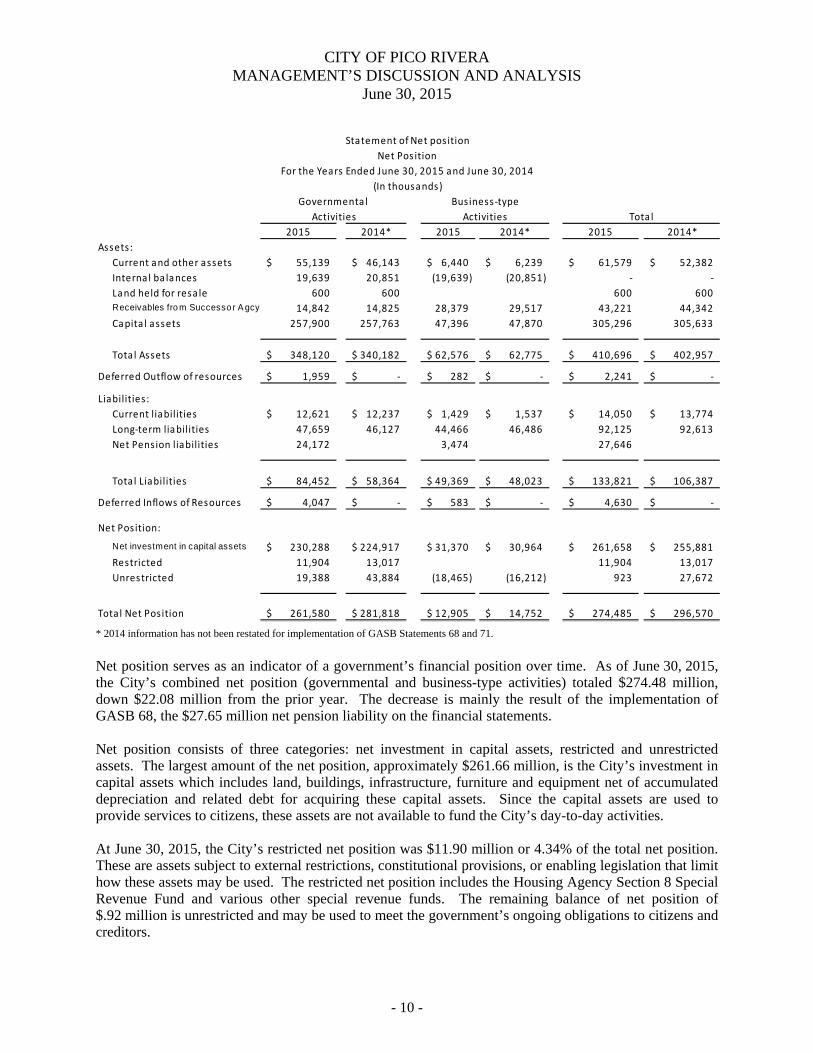
* 2014 information has not been restated for implementation of GASB Statements 68 and 71. Net position serves as an indicator of a government’s financial position over time. As of June 30, 2015, the City’s combined net position (governmental and business-type activities) totaled $274.48 million, down $22.08 million from the prior year. The decrease is mainly the result of the implementation of GASB 68, the $27.65 million net pension liability on the financial statements. Net position consists of three categories: net investment in capital assets, restricted and unrestricted assets. The largest amount of the net position, approximately $261.66 million, is the City’s investment in capital assets which includes land, buildings, infrastructure, furniture and equipment net of accumulated depreciation and related debt for acquiring these capital assets. Since the capital assets are used to provide services to citizens, these assets are not available to fund the City’s day-to-day activities. At June 30, 2015, the City’s restricted net position was $11.90 million or 4.34% of the total net position. These are assets subject to external restrictions, constitutional provisions, or enabling legislation that limit how these assets may be used. The restricted net position includes the Housing Agency Section 8 Special Revenue Fund and various other special revenue funds. The remaining balance of net position of $.92 million is unrestricted and may be used to meet the government’s ongoing obligations to citizens and creditors.
Statement of Net position
Net Position
For the Years Ended June 30, 2015 and June 30, 2014
(In thousands)
Governmental Business ‐type
Activities Activities Tota l
2015 2014* 2015 2014* 2015 2014*
Assets:
Current and other assets 55,139$ 46,143$ 6,440$ 6,239$ 61,579$ 52,382$
Interna l balances 19,639 20,851 (19,639) (20,851) ‐ ‐
Land held for resa le 600 600 600 600 Receivables fro m Successo r A gcy 14,842 14,825 28,379 29,517 43,221 44,342
Capita l assets 257,900 257,763 47,396 47,870 305,296 305,633
Total Assets 348,120$ 340,182$ 62,576$ 62,775$ 410,696$ 402,957$
Deferred Outflow of resources 1,959$ ‐$ 282$ ‐$ 2,241$ ‐$
Liabilities:
Current liabilities 12,621$ 12,237$ 1,429$ 1,537$ 14,050$ 13,774$
Long‐term liabilities 47,659 46,127 44,466 46,486 92,125 92,613
Net Pension liabilities 24,172 3,474 27,646
Total Liabilities 84,452$ 58,364$ 49,369$ 48,023$ 133,821$ 106,387$
Deferred Inflows of Resources 4,047$ ‐$ 583$ ‐$ 4,630$ ‐$
Net Position:
Net investment in capital assets 230,288$ 224,917$ 31,370$ 30,964$ 261,658$ 255,881$
Restricted 11,904 13,017 11,904 13,017
Unrestricted 19,388 43,884 (18,465) (16,212) 923 27,672
Total Net Position 261,580$ 281,818$ 12,905$ 14,752$ 274,485$ 296,570$
CITY OF PICO RIVERAMANAGEMENT’S DISCUSSION AND ANALYSIS
June 30, 2015
- 11 -
Governmental Activities - Governmental assets increased $7.94 million to $348.12 million, liabilities
increased $26.09 million to $84.45 million, and total net position decreased $20.24 million to
$261.58 million when compared to the prior year.
Current and other assets increased $9.00 million.
Internal balances decreased $1.21 million.
Long term liabilities, increased $1.53 million. The largest component of this increase is the
increase in post-employment health benefit liabilities.
There was $24.17 million in pension liabilities added to the financial statements along with
deferred outflow of resources and deferred inflows of resources that are related to the
implementation of GASB 68.
Net Position decreased $20.24 million but there was a decrease of $1.11 million in restricted
assets, an increase of $5.37 million in net investment in capital assets and a decrease of
$24.50 million in unrestricted assets.
Business-Type Activities - Business-type activities assets decreased $199,000 to $62.58 million.
Liabilities increased $1.35 million to $49.37 million and the total net position decreased $1.85 million to
$12.91 million which was resulting from pension liability.
Internal balances decreased $1.21 million
Current liabilities decreased $0.11 million to $1.43 million and long-term liabilities decreased
$2.02 million.
There was $3.47 million in pension liabilities added to the financial statements along with
deferred outflow of resources and deferred inflows of resources that are related to the
implementation of GASB 68.
Total net position decreased $1.847 million primarily due to recognition of pension obligation.

CITY OF PICO RIVERA MANAGEMENT’S DISCUSSION AND ANALYSIS
June 30, 2015
- 12 -
The Statement of Activities for the Governmental Activities and Business-type Activities is shown below.
* 2014 information has not been restated for implementation of GASB Statements 68 and 71.
Statement of Activities
For the Years Ended June 30, 2015 and June 30, 2014
(In thousands)
Governmenta l Business ‐type
Activities Activities Total
2015 2014* 2015 2014* 2015 2014*
Revenues:
Program revenues:
Charges for services 5,142$ 4,045$ 9,707$ 9,831$ 14,849$ 13,876$
Operating grants & contrib. 12,296 13,323 12,296 13,323
Capita l Grants & contrib. 2,287 2,379 2,287 2,379
Genera l Revenues: ‐ ‐
Property taxes 9,611 9,270 9,611 9,270
Sales and use taxes 16,368 16,435 16,368 16,435
Franchise taxes 1,647 1,641 1,647 1,641
Utility users taxes 3,525 3,504 3,525 3,504
Other taxes 1,761 1,711 1,761 1,711
Investment earnings 152 40 2,226 2,308 2,378 2,348
Miscellaneous 871 244 96 871 340
Tota l Revenues 53,660$ 52,592$ 11,933$ 12,235$ 65,593$ 64,827$
Expenses:
Genera l government 9,248$ 9,955$ ‐$ ‐$ 9,248$ 9,955$
Public safety 10,458 11,203 10,458 11,203
Public works 14,545 10,499 14,545 10,499
Parks and recreation 5,601 5,422 5,601 5,422
Health and welfare 4,841 5,339 4,841 5,339
Community development 2,761 2,512 2,761 2,512
Interest and fisca l charges 1,657 1,742 1,657 1,742
Enterprise operations 9,365 9,441 9,365 9,441
Tota l Expenses 49,111$ 46,672$ 9,365$ 9,441$ 58,476$ 56,113$
Increase/decrease in net
position before transfers 4,549$ 5,920$ 2,568$ 2,794$ 7,117$ 8,714$
Transfers 612 649 (612) (649)
Increase/(dec) in net position 5,161 6,569 1,956 2,145 7,117 8,714
Specia l Item 1,060 (9,075) (9,075)
Adjustment to Beg Net Position (26,459) (3,803) (30,262) ‐
Net Position ‐ Beg of year 281,818 284,324 14,752 12,607 296,570 296,931
Net Position ‐ End of year 261,580$ 281,818$ 12,905$ 14,752$ 274,485$ 296,570$
CITY OF PICO RIVERAMANAGEMENT’S DISCUSSION AND ANALYSIS
June 30, 2015
- 13 -
Overall, revenues exceeded expenses by $7.52 million. However, due to a $30.26 million net pension liability negative adjustment to beginning net position end of year, net position decreased $21.69 million.
Governmental Activities – Total revenues increased $1.07 million and expenses increased $2.04 million when compared to the previous year.
Program revenues increased $22,000. The increase in charges for services was slightly more than the decrease in operating grants and contributions.
General revenues increased $1.09 million. There were small increases in property taxes, franchise taxes, utility user’s tax, and miscellaneous revenues which were partially offset by a decrease of sales tax. The reduction in sales tax is primarily due to a temporary renovation closure of a large big box store.
Expenses increased $2.44 million. There was a $4.04 million increase in public works and smaller increases in parks and recreation and community development. There were decreases in general government, public safety health and welfare and interest charges.
Business-Type Activities - The Water Fund is the primary enterprise fund and most variances relate to
this fund.
Revenue decreased $302,000 primarily due to mandatory reduced water consumption and
expenses decreased only $76,000.
FUND FINANCIAL STATEMENTS
Governmental Funds - The City uses fund accounting to ensure and demonstrate compliance with finance-related legal requirements. The focus of the City’s governmental funds is to provide information on near-term inflows and outflows during the fiscal year and balances of spendable resources at the end of the fiscal year. Such information may be useful in assessing City’s financing requirements to meet the current needs. In particular, unassigned fund balance may serve as a useful measure of the City’s net resources available for appropriation.
As of June 30, 2015 the City’s governmental funds reported a combined ending fund balance of $60.04 million as shown on page 25. The fund balance categories of governmental fund displayed $25.82 million as nonspendable, $13.73 million as restricted, $9.32 million as committed, $10.27 million as assigned, and $.90 million as unassigned. (Please refer to Note 12 of the Notes to Financial Statements for detailed breakdown.)
There are four major governmental funds which are: the General Fund, the Special Revenue Housing Agency Section 8 Fund, Special Revenue Federal Grants Fund, and the Capital Projects Capital Improvement Fund which are described below. Major Funds are defined generally as having significant activities or balances in the current year. Other governmental individual funds may be found in the Supplemental section begins on page 111.

CITY OF PICO RIVERAMANAGEMENT’S DISCUSSION AND ANALYSIS
June 30, 2015
- 14 -
General Fund - The General Fund is the chief operating fund of the City and is used for all the general revenues of the City not specifically levied or collected for other City funds and its related expenditures.At the end of the current fiscal year, the General Fund had a fund balance of $50.94 million, an increase of $5.71 million from previous year. Nearly all of the fund balance has been restricted, committed, assigned or considered nonspendable. The nonspendable amount is $25.22 million, the restricted amount is $2.36 million, the committed amount is $9.32 million, the assigned amount is $10.27 million and the unassigned amount is $3.77 million.
Revenue of $37.67 million exceeded budget by $2.13 million. There was a cost reimbursement of $1.42 million from the Los Angeles County for excess library project funding that was unanticipated and taxes, license permits also came in over budget. The revenues that did not meet their respective budgets were fines, forfeitures and charges for service came in under their respective budgets. See page 103 for specific comparisons.
Expenditures of $32.90 million came in under budget by $3.74 million. Please see page 103which shows specific comparisons for expenditures.
Total other financing sources (uses) had a variance of $1.67 million. Transfers in were slightly under budget and Transfers out were $2.03 million under budget.
Housing Agency Section 8 Special Revenue Fund – This Fund accounts for monies received from the U.S. Department of Housing and Urban Development for rental assistance for very low and low income families to meet their housing needs. During the year, $4.50 million in revenue was received and $4.80 million was spent. The ending fund balance was $528,688.
Federal Grants Special Revenue Fund – The Federal Grants Special Revenue Fund accounts for monies received from the United States (federal) government for the rehabilitation of streets, intersections and parkway improvements. During the year, $2.74 million was either received or billed and $1.41 millionwas transferred to the Capital Improvement Fund where it was spent on capital projects. The ending fund balance was a negative $915,549.
Capital Improvement Capital Projects Fund - The Capital Improvement Capital Projects Fund is a capital improvements fund that accounts for all governmental type fund capital expenditures. Monies are transferred in from other city funds and spent in this fund. The Capital Improvement Capital Projects Fund has an ending balance of a negative $503,583 due to accrued but not funded retention payments to several vendors. During the year, $5.18 million was spent.
Business-type Activities – Enterprise Funds
There is one major fund in enterprise fund; the Water Operations Enterprise fund which is discussed below.
Water Operations Enterprise Fund - The Water Operations Enterprise Fund accounts for the operation and maintenance of the City’s water treatment, water transmission and distribution system. During the year, $8.71 million was collected as charges for services and operating expenses were $5.34 million. There were additional monies received as investment income as well as payments on bonded debt and transfers to other funds. Overall, there was a profit of $2.56 million and the Water Fund’s net position increased to $13.09 million.
CITY OF PICO RIVERAMANAGEMENT’S DISCUSSION AND ANALYSIS
June 30, 2015
- 15 -
Please refer to pages 24 and 25 for the Balance Sheet of Governmental Funds, page 27 for the Reconciliation of the Governmental Funds Balance Sheet to the Statement of Net Position, pages 28 and 29 for the Statement of Revenues, Expenditures and Changes in Fund Balances-Governmental Funds, and page 30 for the Reconciliation of the Governmental Funds Statement of Revenues, Expenditures and Changes in Fund Balances to the Statement of Activities. For the Water Operations Enterprise Fund, see pages 31 through 34.
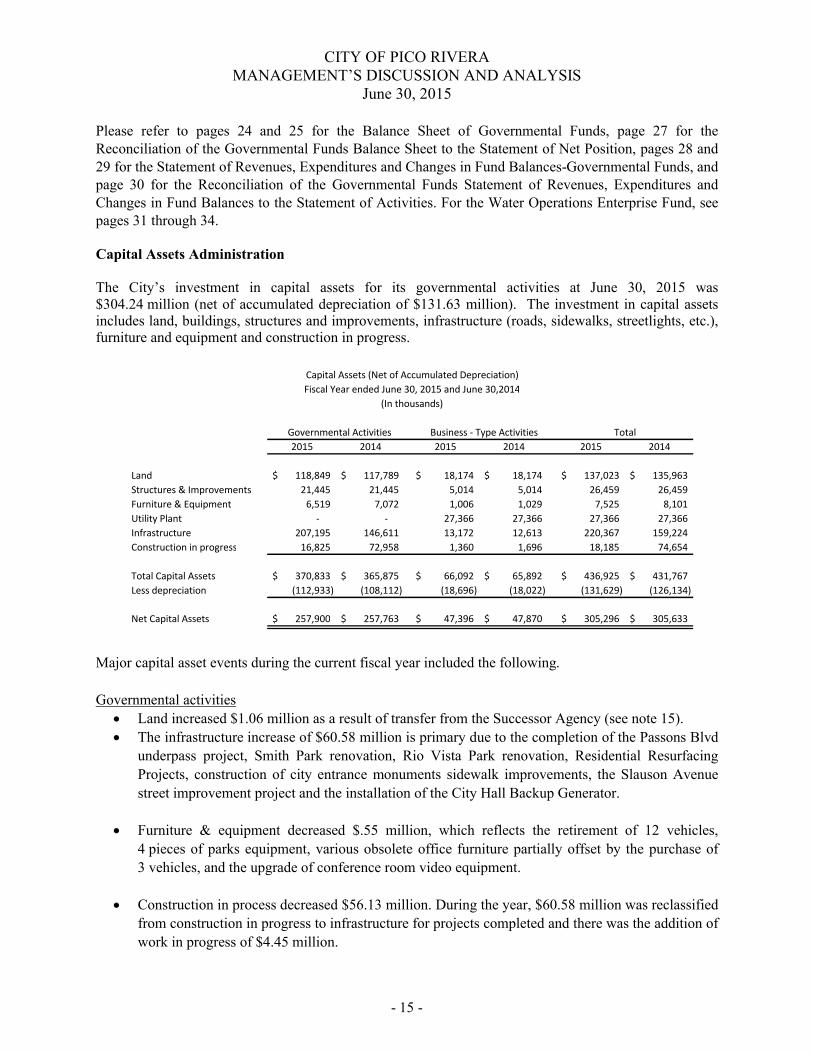
Capital Assets Administration
The City’s investment in capital assets for its governmental activities at June 30, 2015 was $304.24 million (net of accumulated depreciation of $131.63 million). The investment in capital assets includes land, buildings, structures and improvements, infrastructure (roads, sidewalks, streetlights, etc.), furniture and equipment and construction in progress.
Major capital asset events during the current fiscal year included the following.
Governmental activities
Land increased $1.06 million as a result of transfer from the Successor Agency (see note 15).
The infrastructure increase of $60.58 million is primary due to the completion of the Passons Blvd
underpass project, Smith Park renovation, Rio Vista Park renovation, Residential Resurfacing
Projects, construction of city entrance monuments sidewalk improvements, the Slauson Avenue
street improvement project and the installation of the City Hall Backup Generator.
Furniture & equipment decreased $.55 million, which reflects the retirement of 12 vehicles,
4 pieces of parks equipment, various obsolete office furniture partially offset by the purchase of
3 vehicles, and the upgrade of conference room video equipment.
Construction in process decreased $56.13 million. During the year, $60.58 million was reclassified
from construction in progress to infrastructure for projects completed and there was the addition of
work in progress of $4.45 million.
Capital Assets (Net of Accumulated Depreciation)
Fiscal Year ended June 30, 2015 and June 30,2014
(In thousands)
Governmental Activities Business - Type Activities Total
2015 2014 2015 2014 2015 2014
Land 118,849$ 117,789$ 18,174$ 18,174$ 137,023$ 135,963$
Structures & Improvements 21,445 21,445 5,014 5,014 26,459 26,459
Furniture & Equipment 6,519 7,072 1,006 1,029 7,525 8,101
Utility Plant - - 27,366 27,366 27,366 27,366
Infrastructure 207,195 146,611 13,172 12,613 220,367 159,224
Construction in progress 16,825 72,958 1,360 1,696 18,185 74,654
Total Capital Assets 370,833$ 365,875$ 66,092$ 65,892$ 436,925$ 431,767$
Less depreciation (112,933) (108,112) (18,696) (18,022) (131,629) (126,134)
Net Capital Assets 257,900$ 257,763$ 47,396$ 47,870$ 305,296$ 305,633$
CITY OF PICO RIVERAMANAGEMENT’S DISCUSSION AND ANALYSIS
June 30, 2015
- 16 -
Business-type activities - Business-type activities capital assets, before depreciation, increased during the
year by only $.200 million which is considered immaterial considering the assets held in the enterprise
funds.
Additional information on the City’s capital assets can be found in Note 5 of the notes to the financial
statements on pages 59 and 60 of this report.
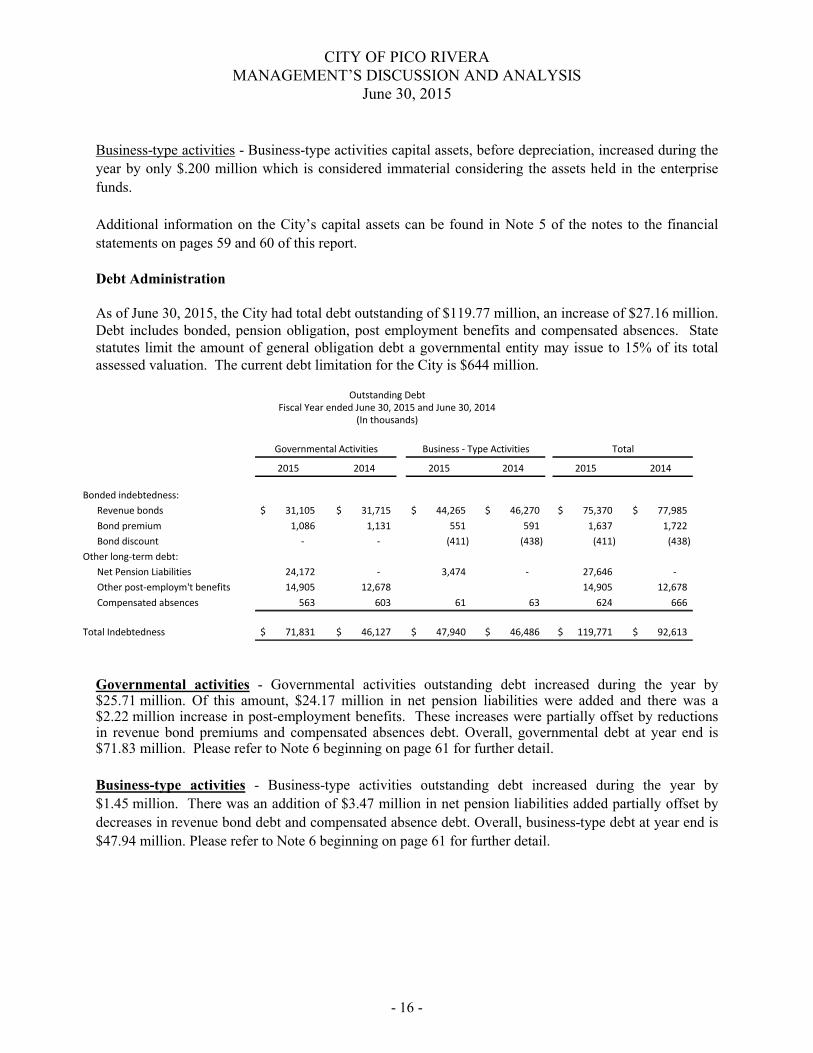
Debt Administration
As of June 30, 2015, the City had total debt outstanding of $119.77 million, an increase of $27.16 million. Debt includes bonded, pension obligation, post employment benefits and compensated absences. State statutes limit the amount of general obligation debt a governmental entity may issue to 15% of its total assessed valuation. The current debt limitation for the City is $644 million.
Governmental activities - Governmental activities outstanding debt increased during the year by $25.71 million. Of this amount, $24.17 million in net pension liabilities were added and there was a $2.22 million increase in post-employment benefits. These increases were partially offset by reductions in revenue bond premiums and compensated absences debt. Overall, governmental debt at year end is $71.83 million. Please refer to Note 6 beginning on page 61 for further detail.
Business-type activities - Business-type activities outstanding debt increased during the year by
$1.45 million. There was an addition of $3.47 million in net pension liabilities added partially offset by
decreases in revenue bond debt and compensated absence debt. Overall, business-type debt at year end is
$47.94 million. Please refer to Note 6 beginning on page 61 for further detail.
Outstanding DebtFiscal Year ended June 30, 2015 and June 30, 2014
(In thousands)
Governmental Activities Business - Type Activities Total
2015 2014 2015 2014 2015 2014
Bonded indebtedness:
Revenue bonds 31,105$ 31,715$ 44,265$ 46,270$ 75,370$ 77,985$
Bond premium 1,086 1,131 551 591 1,637 1,722
Bond discount - - (411) (438) (411) (438)
Other long-term debt:
Net Pension Liabilities 24,172 - 3,474 - 27,646 -
Other post-employm't benefits 14,905 12,678 14,905 12,678
Compensated absences 563 603 61 63 624 666
Total Indebtedness 71,831$ 46,127$ 47,940$ 46,486$ 119,771$ 92,613$
CITY OF PICO RIVERAMANAGEMENT’S DISCUSSION AND ANALYSIS
June 30, 2015
- 17 -
ECONOMIC FACTORS AND NEXT YEAR’S BUDGET
Citywide assessed valuations increased $183.90 million or 4.5% to $4.259 million and we are optimistic
about the region’s economic recovery. However, we continue to be conservative when projecting future
revenues and the City faces increased annual pension and post-employment benefit costs.
The fiscal year 2015-16 City Budget is balanced and was prepared using Zero Based budgeting. Every
department and function budget was analyzed and expenses justified. Management believes the City will
continue improving its overall quality of service to our public and maximize business opportunities.
REQUEST FOR INFORMATION
This financial report is designed to provide a general overview of the City’s finances for readers of the
financial statements. Questions concerning any of the information in this report or request for additional
financial information should be addressed to the Director of Finance, City of Pico Rivera, California.

- 18 -
This page intentionally left blank.

Governmental Business-type
Activities Activities TotalASSETS:
Cash and investments 41,211,321$ 635,499$ 41,846,820$ Resticted cash and investments:
Cash and investments with fiscal agents 2,358,946 4,402,646 6,761,592 Escrow deposits 19,925 - 19,925
Receivables, netAccounts 2,922,369 1,377,075 4,299,444 Taxes 3,186,115 - 3,186,115 Interest 18,913 774 19,687
Internal balances 19,639,189 (19,639,189) - Inventories - 24,068 24,068 Long-term receivables 5,420,755 - 5,420,755 Land held for resale 600,000 - 600,000 Receivables from Successor Agency 14,842,357 28,378,841 43,221,198 Capital assets, not depreciated 135,673,641 19,534,174 155,207,815 Capital assets, depreciated, net 122,226,643 27,861,976 150,088,619
TOTAL ASSETS 348,120,174 62,575,864 410,696,038
DEFERRED OUTFLOWS OF RESOURCES:Amounts related to pension plans 1,958,650 282,112 2,240,762
LIABILITIES:Accounts payable 3,281,436 402,576 3,684,012 Accrued interest payable 633,395 292,693 926,088 Accrued liabilities 692,575 105,576 798,151 Deposits 875,547 572,760 1,448,307 Retention payable 1,111,497 55,683 1,167,180 Due to other agencies 6,026,454 - 6,026,454 Long-term liabilities:
Due within one year 747,718 2,126,101 2,873,819 Due in more than one year 46,911,338 42,339,527 89,250,865 Net pension liability 24,172,149 3,474,478 27,646,627
TOTAL LIABILITIES 84,452,109 49,369,394 133,821,503
DEFERRED INFLOWS OF RESOURCES:Amounts related to pension plans 4,046,877 583,446 4,630,323
NET POSITION:Net investment in capital assets 230,288,295 31,370,373 261,658,668 Restricted for debt service 25,482 - 25,482 Restricted for community development 5,021,559 - 5,021,559 Restricted for transportation 3,735,532 - 3,735,532 Restricted for low and moderate income housing 2,554,331 - 2,554,331 Restricted for other purposes 566,588 - 566,588 Unrestricted 19,388,051 (18,465,237) 922,814
TOTAL NET POSITION 261,579,838$ 12,905,136$ 274,484,974$
See accompanying notes to financial statements.
CITY OF PICO RIVERA
STATEMENT OF NET POSITION
June 30, 2015
- 19 -
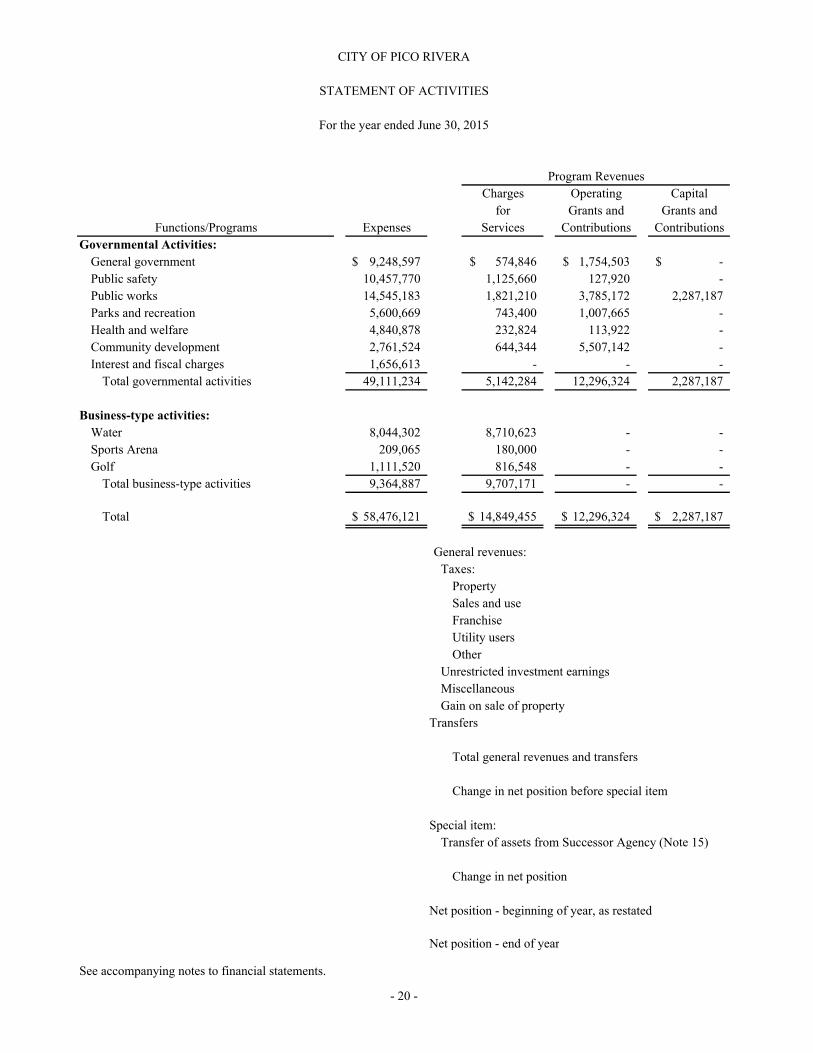
Charges Operating Capital
for Grants and Grants and
Expenses Services Contributions Contributions
Governmental Activities:
General government 9,248,597$ 574,846$ 1,754,503$ -$
Public safety 10,457,770 1,125,660 127,920 -
Public works 14,545,183 1,821,210 3,785,172 2,287,187
Parks and recreation 5,600,669 743,400 1,007,665 -
Health and welfare 4,840,878 232,824 113,922 -
Community development 2,761,524 644,344 5,507,142 -
Interest and fiscal charges 1,656,613 - - -
Total governmental activities 49,111,234 5,142,284 12,296,324 2,287,187
Business-type activities:
Water 8,044,302 8,710,623 - -
Sports Arena 209,065 180,000 - -
Golf 1,111,520 816,548 - -
Total business-type activities 9,364,887 9,707,171 - -
Total 58,476,121$ 14,849,455$ 12,296,324$ 2,287,187$
General revenues:
Taxes:
Property
Sales and use
Franchise
Utility users
Other
Unrestricted investment earnings
Miscellaneous
Gain on sale of property
Transfers
Total general revenues and transfers
Change in net position before special item
Special item:
Transfer of assets from Successor Agency (Note 15)
Change in net position
Net position - beginning of year, as restated
Net position - end of year
See accompanying notes to financial statements.
- 20 -
CITY OF PICO RIVERA
STATEMENT OF ACTIVITIES
For the year ended June 30, 2015
Functions/Programs
Program Revenues
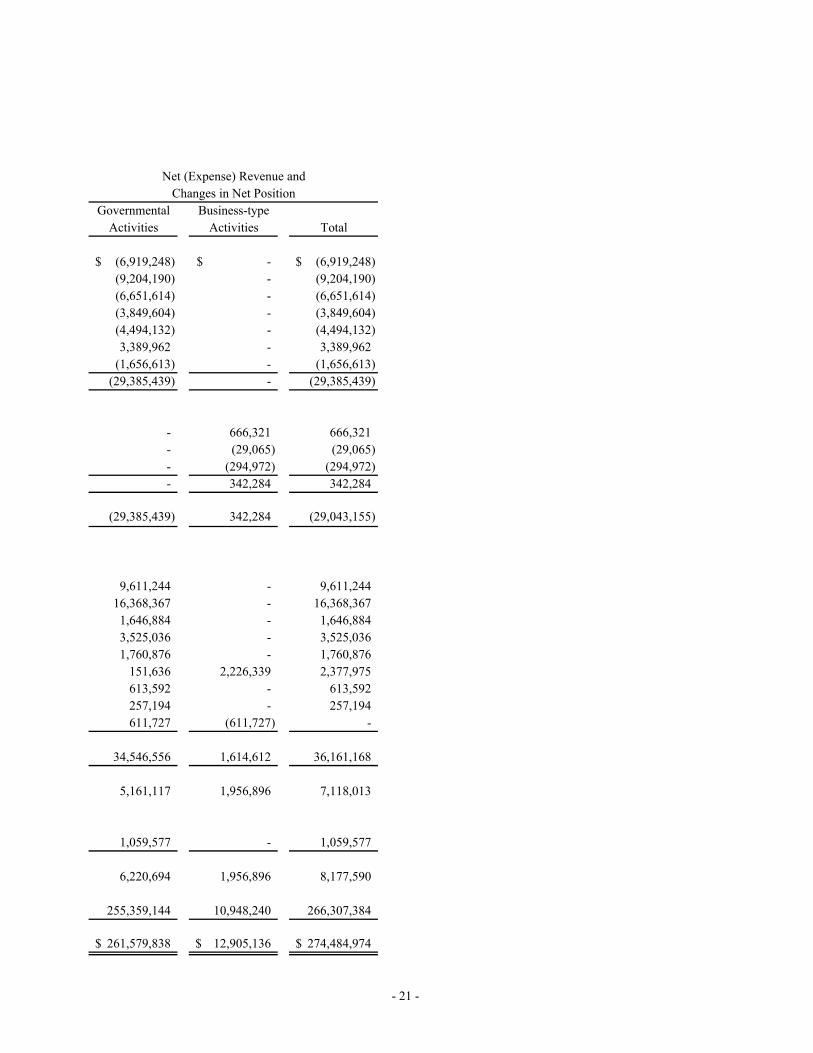
Net (Expense) Revenue and
Changes in Net Position
Governmental Business-type
Activities Activities Total
(6,919,248)$ -$ (6,919,248)$
(9,204,190) - (9,204,190)
(6,651,614) - (6,651,614)
(3,849,604) - (3,849,604)
(4,494,132) - (4,494,132)
3,389,962 - 3,389,962
(1,656,613) - (1,656,613)
(29,385,439) - (29,385,439)
- 666,321 666,321
- (29,065) (29,065)
- (294,972) (294,972)
- 342,284 342,284
(29,385,439) 342,284 (29,043,155)
9,611,244 - 9,611,244
16,368,367 - 16,368,367
1,646,884 - 1,646,884
3,525,036 - 3,525,036
1,760,876 - 1,760,876
151,636 2,226,339 2,377,975
613,592 - 613,592
257,194 - 257,194
611,727 (611,727) -
34,546,556 1,614,612 36,161,168
5,161,117 1,956,896 7,118,013
1,059,577 - 1,059,577
6,220,694 1,956,896 8,177,590
255,359,144 10,948,240 266,307,384
261,579,838$ 12,905,136$ 274,484,974$
- 21 -

- 22 -
This page intentionally left blank.

- 23 -
CITY OF PICO RIVERA
DESCRIPTION OF MAJOR FUNDS
June 30, 2015
GOVERNMENTAL FUNDS
General Fund is the City’s primary operating fund and accounts for all the financial resources of the general government, except those required to be accounted for in another fund.
Housing Agency Section 8 Special Revenue Fund accounts for rental assistance expenditures incurred to assist very low and low income families in meeting their housing needs. Funds are provided by the U.S. Department of Housing and Urban Development.
Federal Grants Special Revenue Fund accounts for funds received from the United States (Federal) government for the rehabilitation of intersections and parkway improvements.
Capital Improvement Capital Projects Fund accounts for activity related to the City’s capital projects other than those accounted for in the Enterprise Funds.
ENTERPRISE FUND
Water Operations Fund accounts for the operation and maintenance of the City’s water treatment, water transmission and distribution system.
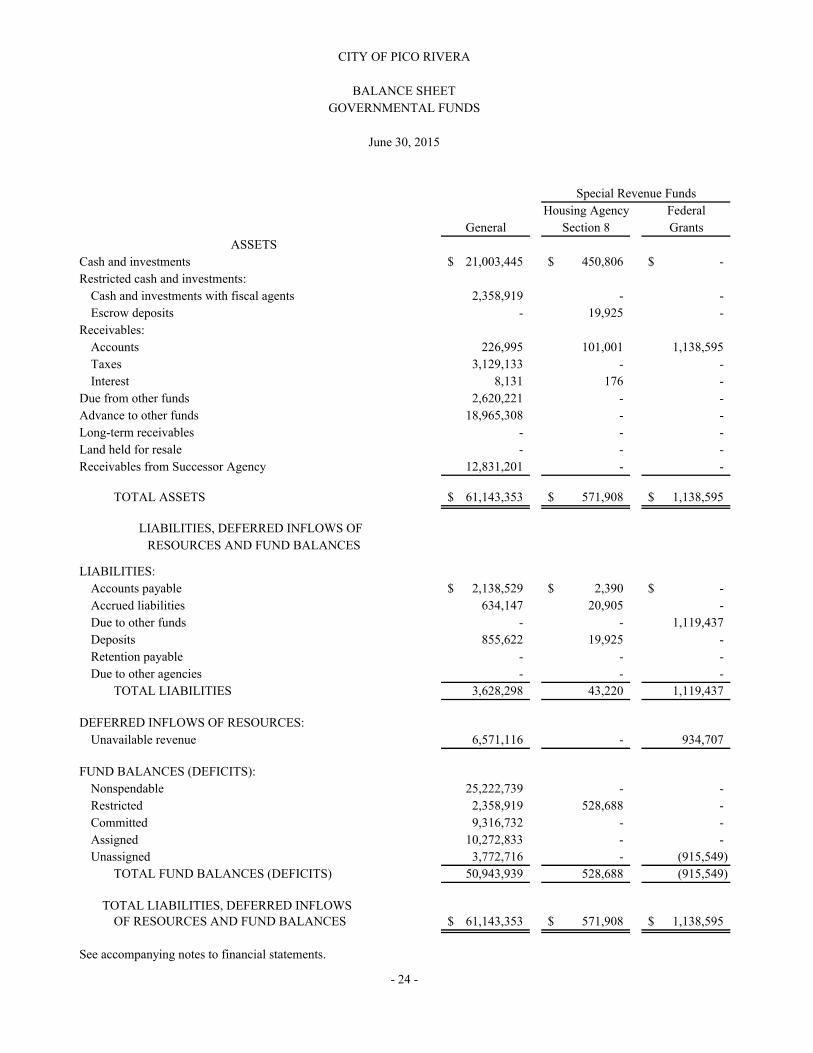
Housing Agency Federal
General Section 8 Grants
Cash and investments 21,003,445$ 450,806$ -$
Restricted cash and investments:
Cash and investments with fiscal agents 2,358,919 - -
Escrow deposits - 19,925 -
Receivables:
Accounts 226,995 101,001 1,138,595
Taxes 3,129,133 - -
Interest 8,131 176 -
Due from other funds 2,620,221 - -
Advance to other funds 18,965,308 - -
Long-term receivables - - -
Land held for resale - - -
Receivables from Successor Agency 12,831,201 - -
TOTAL ASSETS 61,143,353$ 571,908$ 1,138,595$
LIABILITIES:
Accounts payable 2,138,529$ 2,390$ -$
Accrued liabilities 634,147 20,905 -
Due to other funds - - 1,119,437
Deposits 855,622 19,925 -
Retention payable - - -
Due to other agencies - - -
TOTAL LIABILITIES 3,628,298 43,220 1,119,437
DEFERRED INFLOWS OF RESOURCES:
Unavailable revenue 6,571,116 - 934,707
FUND BALANCES (DEFICITS):
Nonspendable 25,222,739 - -
Restricted 2,358,919 528,688 -
Committed 9,316,732 - -
Assigned 10,272,833 - -
Unassigned 3,772,716 - (915,549)
TOTAL FUND BALANCES (DEFICITS) 50,943,939 528,688 (915,549)
TOTAL LIABILITIES, DEFERRED INFLOWSOF RESOURCES AND FUND BALANCES 61,143,353$ 571,908$ 1,138,595$
See accompanying notes to financial statements.
CITY OF PICO RIVERA
BALANCE SHEET
GOVERNMENTAL FUNDS
June 30, 2015
- 24 -
ASSETS
RESOURCES AND FUND BALANCES
Special Revenue Funds
LIABILITIES, DEFERRED INFLOWS OF

Capital Projects
Fund Other Total
Capital Governmental Governmental
Improvement Funds Funds
1,313,525$ 9,118,575$ 31,886,351$
- 27 2,358,946
- - 19,925
12,249 1,443,529 2,922,369
- 56,982 3,186,115
- 10,606 18,913
- - 2,620,221
- - 18,965,308
- 5,420,755 5,420,755
600,000 - 600,000
- 2,011,156 14,842,357
1,925,774$ 18,061,630$ 82,841,260$
716,798$ 423,719$ 3,281,436$
1,062 36,461 692,575
- 826,903 1,946,340
- - 875,547
1,111,497 - 1,111,497
600,000 5,426,454 6,026,454
2,429,357 6,713,537 13,933,849
- 1,360,953 8,866,776
600,000 - 25,822,739
- 10,837,770 13,725,377
- - 9,316,732
- - 10,272,833
(1,103,583) (850,630) 902,954
(503,583) 9,987,140 60,040,635
1,925,774$ 18,061,630$ 82,841,260$
- 25 -

- 26 -
This page intentionally left blank.
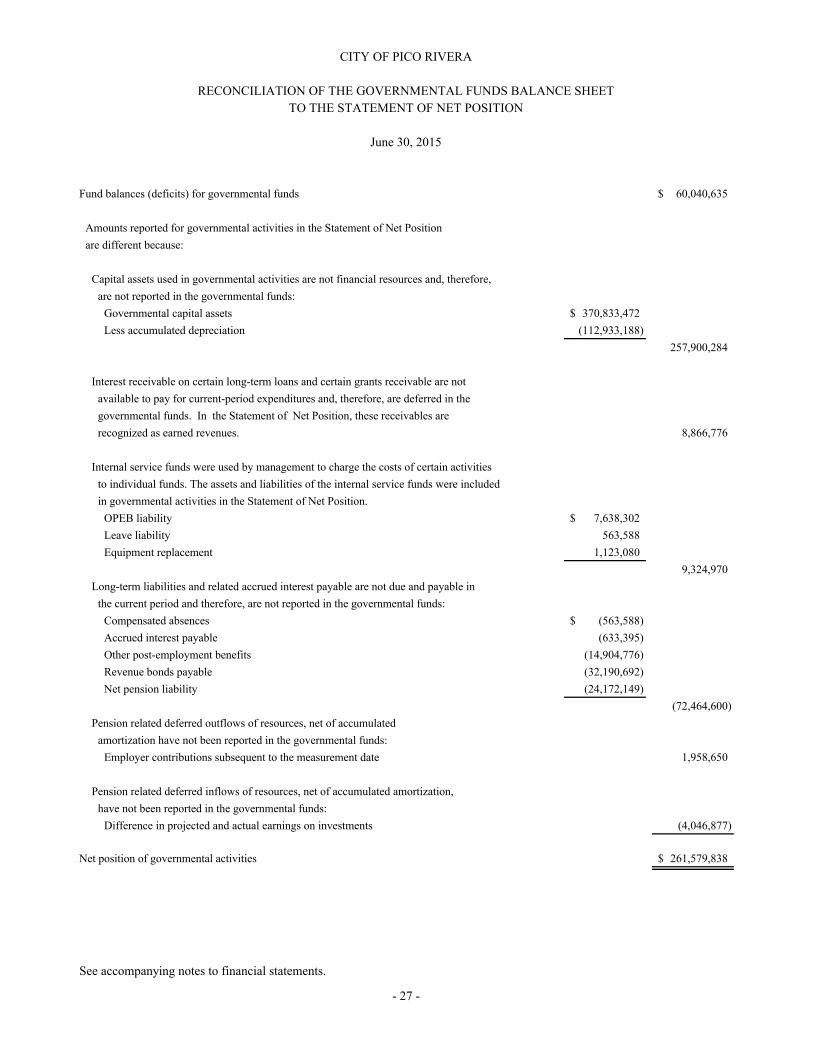
Fund balances (deficits) for governmental funds 60,040,635$
Amounts reported for governmental activities in the Statement of Net Position
are different because:
Capital assets used in governmental activities are not financial resources and, therefore,
are not reported in the governmental funds:
Governmental capital assets 370,833,472$
Less accumulated depreciation (112,933,188)
257,900,284
Interest receivable on certain long-term loans and certain grants receivable are not
available to pay for current-period expenditures and, therefore, are deferred in the
governmental funds. In the Statement of Net Position, these receivables are
recognized as earned revenues. 8,866,776
Internal service funds were used by management to charge the costs of certain activities
to individual funds. The assets and liabilities of the internal service funds were included
in governmental activities in the Statement of Net Position.
OPEB liability 7,638,302$
Leave liability 563,588
Equipment replacement 1,123,080
9,324,970
Long-term liabilities and related accrued interest payable are not due and payable in
the current period and therefore, are not reported in the governmental funds:
Compensated absences (563,588)$
Accrued interest payable (633,395)
Other post-employment benefits (14,904,776)
Revenue bonds payable (32,190,692)
Net pension liability (24,172,149)
(72,464,600)
Pension related deferred outflows of resources, net of accumulated
amortization have not been reported in the governmental funds:
Employer contributions subsequent to the measurement date 1,958,650
Pension related deferred inflows of resources, net of accumulated amortization,
have not been reported in the governmental funds:
Difference in projected and actual earnings on investments (4,046,877)
Net position of governmental activities 261,579,838$
See accompanying notes to financial statements.
- 27 -
CITY OF PICO RIVERA
RECONCILIATION OF THE GOVERNMENTAL FUNDS BALANCE SHEET
TO THE STATEMENT OF NET POSITION
June 30, 2015
Housing Agency Federal
General Section 8 Grants
REVENUES:
Taxes and assessments 29,942,939$ -$ -$
Licenses and permits 2,363,477 - -
Intergovernmental 311,973 4,449,676 2,742,034
Charges for services 1,723,440 - -
Fines, forfeitures and penalties 1,134,906 - -
Investment and rental 47,295 749 -
Miscellaneous 2,142,737 46,177 -
TOTAL REVENUES 37,666,767 4,496,602 2,742,034
EXPENDITURES:
Current:
General government 6,867,125 - -
Public safety 10,435,184 - -
Public works 7,588,159 - -
Parks and recreation 3,825,479 - -
Health and welfare - 4,792,639 -
Community development 1,866,590 - -
Capital outlay - - -
Debt service:
Principal 610,000 - -
Interest and fiscal charges 1,710,638 - -
TOTAL EXPENDITURES 32,903,175 4,792,639 -
EXCESS OF REVENUES OVER
(UNDER) EXPENDITURES 4,763,592 (296,037) 2,742,034
OTHER FINANCING SOURCES (USES):
Transfers in 2,861,809 - -
Transfers out (1,914,629) - (1,412,966)
TOTAL OTHER FINANCING
SOURCES (USES) 947,180 - (1,412,966)
NET CHANGE IN FUND BALANCES 5,710,772 (296,037) 1,329,068
FUND BALANCES (DEFICITS) - BEGINNING OF YEAR 45,233,167 824,725 (2,244,617)
FUND BALANCES (DEFICITS) - END OF YEAR 50,943,939$ 528,688$ (915,549)$
See accompanying notes to financial statements.
CITY OF PICO RIVERA
STATEMENT OF REVENUES, EXPENDITURES AND CHANGES IN FUND BALANCES
GOVERNMENTAL FUNDS
For the year ended June 30, 2015
Special Revenue Funds
- 28 -
Capital Projects
Fund Other Total
Capital Governmental Governmental
Improvement Funds Funds
-$ 4,140,171$ 34,083,110$
- - 2,363,477
- 4,199,882 11,703,565
69,152 96,746 1,889,338
- - 1,134,906
- 288,033 336,077
- 346,381 2,535,295
69,152 9,071,213 54,045,768
- 17,273 6,884,398
- - 10,435,184
- 2,033,152 9,621,311
- 969,241 4,794,720
- 48,239 4,840,878
- 863,533 2,730,123
5,175,862 - 5,175,862
- - 610,000
- - 1,710,638
5,175,862 3,931,438 46,803,114
(5,106,710) 5,139,775 7,242,654
4,757,143 - 7,618,952
- (4,660,338) (7,987,933)
4,757,143 (4,660,338) (368,981)
(349,567) 479,437 6,873,673
(154,016) 9,507,703 53,166,962
(503,583)$ 9,987,140$ 60,040,635$
- 29 -

Net change in fund balances - total governmental funds 6,873,673$
Amounts reported for governmental activities in the Statement of Activities
are different because:
Governmental funds report capital outlays as expenditures. However, in the Statement of Activities,
the cost of those assets is allocated over the estimated useful lives as depreciation expense. This
is the amount by which depreciation exceeded capital expenses in the current period:
Capital expenditures 4,586,713$
Transfer of land from Successor Agency 1,059,577$
Depreciation expense (5,508,878) 137,412
Revenues in the Statement of Activities that do not provide current financial resources are not
reported as revenues in the governmental funds:
Adjustment to interest income on notes receivable and advances to other funds 23,686$
Grant revenue not available to pay for current-period expenditures (475,376) (451,690)
Some expenses reported in the Statement of Activities do not require the use of current financial
resources and therefore are not reported as expenditures in the governmental funds:
Increase in net other post-employment obligation (2,226,416)$
Net change in compensated absences 39,215 (2,187,201)
Repayment of debt principal is an expenditure in the governmental funds, but the repayment
reduces long-term liabilities in the Statement of Net Position. 610,000
Interest expense on long-term liabilities was reported in the Statement of Activities, but it does not
require the use of current financial resources and, therefore, are not reported as expenditures in
the governmental funds. The following amount represents the change in accrued interest for the
current period. 54,025
Internal service funds were used by management to charge the cost of certain activities to the
individual funds. The net revenue of the internal service funds was reported with governmental
activities. 986,472
Pension expense reported in the governmental funds includes the actual contributions made in the
fiscal year. Pension expense reported in the Statement of Activities includes the changes in the
net pension liability and pension related deferred outflows/inflows of resources.
Change in net pension liability 1,479,046$
Change in deferred outflows of resources related to pensions (268,352)
Change in deferred inflows of resources related to pensions (1,012,691) 198,003
Change in net position of governmental activities 6,220,694$
See accompanying notes to financial statements.
For the year ended June 30, 2015
- 30 -
CITY OF PICO RIVERA
RECONCILIATION OF THE GOVERNMENTAL FUNDS STATEMENT OF REVENUES,
EXPENDITURES AND CHANGES IN FUND BALANCES TO THE STATEMENT OF ACTIVITIES
GovernmentalActivities
Water Other Internal ServiceOperations Funds Total Funds
ASSETS:CURRENT ASSETS:
Cash and investments 424,226$ 211,273$ 635,499$ 9,324,970$ Receivables, net:
Accounts 1,274,766 102,309 1,377,075 - Interest 249 525 774 -
Inventories, at cost - 24,068 24,068 - TOTAL CURRENT ASSETS 1,699,241 338,175 2,037,416 9,324,970
NONCURRENT ASSETS:Restricted cash and investments with fiscal agent 4,402,646 - 4,402,646 - Receivables from Successor Agency 28,378,841 - 28,378,841 - Capital assets, not depreciated 19,491,861 42,313 19,534,174 - Capital assets, depreciated, net 26,984,177 877,799 27,861,976 -
TOTAL NONCURRENT ASSETS 79,257,525 920,112 80,177,637 -
TOTAL ASSETS 80,956,766 1,258,287 82,215,053 9,324,970
DEFERRED OUTFLOWS OF RESOURCES:Amount related to pensions 280,768 1,344 282,112 -
LIABILITIES:CURRENT LIABILITIES:
Accounts payable 390,642 11,934 402,576 - Accrued interest payable 292,693 - 292,693 - Accrued liabilities 80,256 25,320 105,576 - Due to other funds - 673,881 673,881 - Deposits 563,984 8,776 572,760 - Retentions payable 55,683 - 55,683 - Bonds payable - current portion 2,120,000 - 2,120,000 - Compensated absences - current portion 6,101 - 6,101 -
TOTAL CURRENT LIABILITIES 3,509,359 719,911 4,229,270 -
NONCURRENT LIABILITIES:Advance from other funds 18,260,812 704,496 18,965,308 - Bonds payable 42,284,618 - 42,284,618 - Compensated absences 54,909 - 54,909 - Net pension liability 3,457,919 16,559 3,474,478
TOTAL NONCURRENT LIABILITIES 64,058,258 721,055 64,779,313 -
TOTAL LIABILITIES 67,567,617 1,440,966 69,008,583 -
DEFERRED INFLOWS OF RESOURCES:Amount related to pensions 580,666 2,780 583,446 -
NET POSITION:Net investment in capital assets 30,450,261 920,112 31,370,373 - Unrestricted (17,361,010) (1,104,227) (18,465,237) 9,324,970
TOTAL NET POSITION 13,089,251$ (184,115)$ 12,905,136$ 9,324,970$
See accompanying notes to financial statements.
STATEMENT OF NET POSITION
PROPRIETARY FUNDS
June 30, 2015
- 31 -
Business-type Activities - Enterprise Funds
CITY OF PICO RIVERA
Governmental
Activities
Water Other Internal Service
Operations Funds Total Funds
OPERATING REVENUES:
Charges for services 8,698,444$ 996,548$ 9,694,992$ -$
Miscellaneous 12,179 - 12,179 66,546
TOTAL OPERATING REVENUES 8,710,623 996,548 9,707,171 66,546
OPERATING EXPENSES:
Salaries and benefits 1,447,088 25,849 1,472,937 -
Contractual services 509,117 432,534 941,651 -
Insurance claims and expenses 304,977 90,837 395,814 -
Administrative 2,022,224 308,053 2,330,277 -
Utilities 372,966 211,497 584,463 -
Repairs and maintenance 101,902 127,749 229,651 -
Depreciation 583,605 113,266 696,871 -
Capital outlay - - - 60,782
TOTAL OPERATING EXPENSES 5,341,879 1,309,785 6,651,664 60,782
OPERATING INCOME (LOSS) 3,368,744 (313,237) 3,055,507 5,764
NONOPERATING REVENUES (EXPENSES):
Investment income 2,223,901 2,438 2,226,339 -
Interest expense (2,702,423) (10,800) (2,713,223) -
TOTAL NONOPERATING
REVENUES (EXPENSES) (478,522) (8,362) (486,884) -
INCOME (LOSS) BEFORE TRANSFERS 2,890,222 (321,599) 2,568,623 5,764
TRANSFERS IN 233 - 233 1,019,923
TRANSFERS OUT (333,187) (278,773) (611,960) (39,215)
CHANGES IN NET POSITION 2,557,268 (600,372) 1,956,896 986,472
NET POSITION - BEGINNING OF YEAR,
AS RESTATED 10,531,983 416,257 10,948,240 8,338,498
NET POSITION - END OF YEAR 13,089,251$ (184,115)$ 12,905,136$ 9,324,970$
See accompanying notes to financial statements.
- 32 -
Business-type Activities - Enterprise Funds
CITY OF PICO RIVERA
STATEMENT OF REVENUES, EXPENSES AND
CHANGES IN NET POSITION
PROPRIETARY FUNDS
For the year ended June 30, 2015
Governmental
Activities
Water Other Internal Service
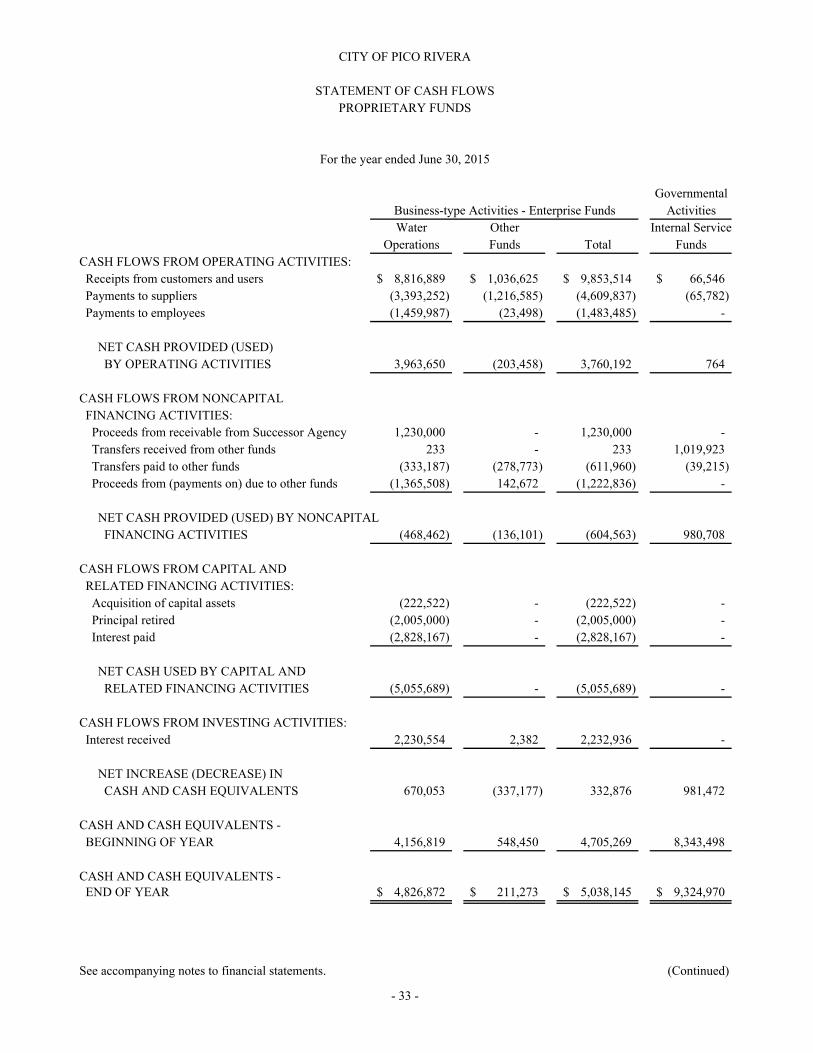
Operations Funds Total Funds
CASH FLOWS FROM OPERATING ACTIVITIES:
Receipts from customers and users 8,816,889$ 1,036,625$ 9,853,514$ 66,546$
Payments to suppliers (3,393,252) (1,216,585) (4,609,837) (65,782)
Payments to employees (1,459,987) (23,498) (1,483,485) -
NET CASH PROVIDED (USED)
BY OPERATING ACTIVITIES 3,963,650 (203,458) 3,760,192 764
CASH FLOWS FROM NONCAPITAL
FINANCING ACTIVITIES:
Proceeds from receivable from Successor Agency 1,230,000 - 1,230,000 -
Transfers received from other funds 233 - 233 1,019,923
Transfers paid to other funds (333,187) (278,773) (611,960) (39,215)
Proceeds from (payments on) due to other funds (1,365,508) 142,672 (1,222,836) -
NET CASH PROVIDED (USED) BY NONCAPITAL
FINANCING ACTIVITIES (468,462) (136,101) (604,563) 980,708
CASH FLOWS FROM CAPITAL AND
RELATED FINANCING ACTIVITIES:
Acquisition of capital assets (222,522) - (222,522) -
Principal retired (2,005,000) - (2,005,000) -
Interest paid (2,828,167) - (2,828,167) -
NET CASH USED BY CAPITAL AND
RELATED FINANCING ACTIVITIES (5,055,689) - (5,055,689) -
CASH FLOWS FROM INVESTING ACTIVITIES:
Interest received 2,230,554 2,382 2,232,936 -
NET INCREASE (DECREASE) IN
CASH AND CASH EQUIVALENTS 670,053 (337,177) 332,876 981,472
CASH AND CASH EQUIVALENTS -
BEGINNING OF YEAR 4,156,819 548,450 4,705,269 8,343,498
CASH AND CASH EQUIVALENTS -END OF YEAR 4,826,872$ 211,273$ 5,038,145$ 9,324,970$
See accompanying notes to financial statements. (Continued)
Business-type Activities - Enterprise Funds
- 33 -
For the year ended June 30, 2015
CITY OF PICO RIVERA
STATEMENT OF CASH FLOWS
PROPRIETARY FUNDS
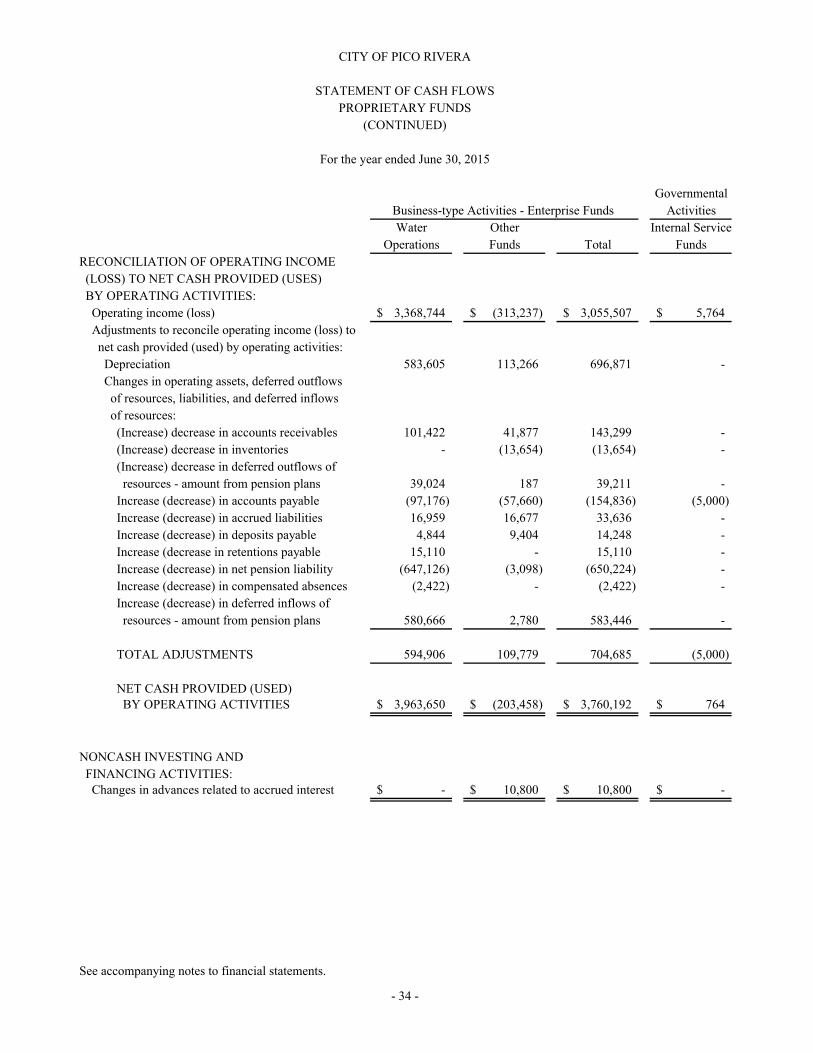
Governmental
Activities
Water Other Internal Service
Operations Funds Total Funds
RECONCILIATION OF OPERATING INCOME
(LOSS) TO NET CASH PROVIDED (USES)
BY OPERATING ACTIVITIES:
Operating income (loss) 3,368,744$ (313,237)$ 3,055,507$ 5,764$
Adjustments to reconcile operating income (loss) to
net cash provided (used) by operating activities:
Depreciation 583,605 113,266 696,871 -
Changes in operating assets, deferred outflows
of resources, liabilities, and deferred inflows
of resources:
(Increase) decrease in accounts receivables 101,422 41,877 143,299 -
(Increase) decrease in inventories - (13,654) (13,654) -
(Increase) decrease in deferred outflows of
resources - amount from pension plans 39,024 187 39,211 -
Increase (decrease) in accounts payable (97,176) (57,660) (154,836) (5,000)
Increase (decrease) in accrued liabilities 16,959 16,677 33,636 -
Increase (decrease) in deposits payable 4,844 9,404 14,248 -
Increase (decrease in retentions payable 15,110 - 15,110 -
Increase (decrease) in net pension liability (647,126) (3,098) (650,224) -
Increase (decrease) in compensated absences (2,422) - (2,422) -
Increase (decrease) in deferred inflows of
resources - amount from pension plans 580,666 2,780 583,446 -
TOTAL ADJUSTMENTS 594,906 109,779 704,685 (5,000)
NET CASH PROVIDED (USED)BY OPERATING ACTIVITIES 3,963,650$ (203,458)$ 3,760,192$ 764$
NONCASH INVESTING AND
FINANCING ACTIVITIES:Changes in advances related to accrued interest -$ 10,800$ 10,800$ -$
See accompanying notes to financial statements.
- 34 -
CITY OF PICO RIVERA
STATEMENT OF CASH FLOWS
PROPRIETARY FUNDS
(CONTINUED)
For the year ended June 30, 2015
Business-type Activities - Enterprise Funds

- 35 -
CITY OF PICO RIVERA
DESCRIPTION OF FIDUCIARY FUNDS
June 30, 2015
Fiduciary funds are used to account for assets held by the City in a trustee capacity or as an agent for individuals, private organizations and other governmental units.
Successor Agency to the City of Pico Rivera Redevelopment Agency Private Purpose Trust Fundaccounts for the activities of the Successor Agency to the Pico Rivera Redevelopment Agency.
Agency Funds are used to account for assets held by the City as an agent for individuals, private organizations, and other governments. The financial activities of these funds are excluded from the Entity-wide financial statements, but are presented in separate Fiduciary Fund financial statements.
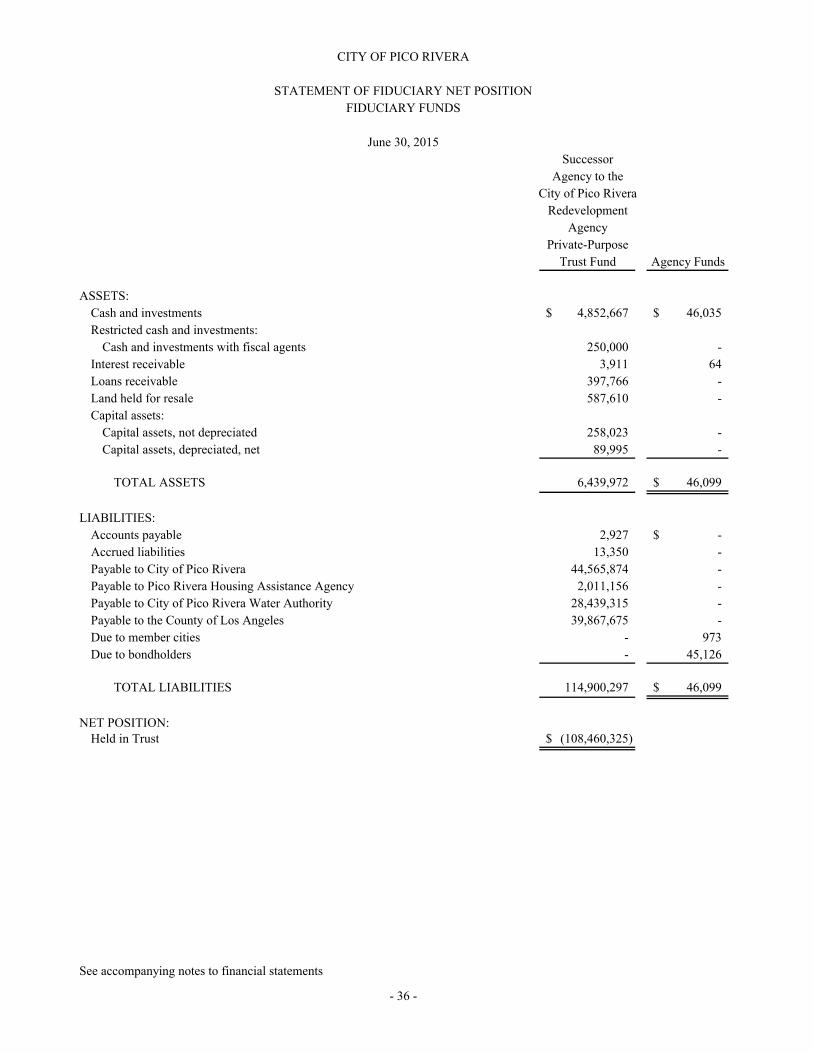
Successor
Agency to the
City of Pico Rivera
Redevelopment
Agency
Private-Purpose
Trust Fund Agency Funds
ASSETS:
Cash and investments 4,852,667$ 46,035$
Restricted cash and investments:
Cash and investments with fiscal agents 250,000 -
Interest receivable 3,911 64
Loans receivable 397,766 -
Land held for resale 587,610 -
Capital assets:
Capital assets, not depreciated 258,023 -
Capital assets, depreciated, net 89,995 -
TOTAL ASSETS 6,439,972 46,099$
LIABILITIES:
Accounts payable 2,927 -$
Accrued liabilities 13,350 -
Payable to City of Pico Rivera 44,565,874 -
Payable to Pico Rivera Housing Assistance Agency 2,011,156 -
Payable to City of Pico Rivera Water Authority 28,439,315 -
Payable to the County of Los Angeles 39,867,675 -
Due to member cities - 973
Due to bondholders - 45,126
TOTAL LIABILITIES 114,900,297 46,099$
NET POSITION:Held in Trust (108,460,325)$
See accompanying notes to financial statements
- 36 -
CITY OF PICO RIVERA
STATEMENT OF FIDUCIARY NET POSITION
FIDUCIARY FUNDS
June 30, 2015

Successor
Agency to the
City of Pico Rivera
Redevelopment
Agency
Private-Purpose
Trust Fund
ADDITIONS:
Redevelopment Property Tax Trust Fund Distributions 3,488,957$
Investment earnings 17,989
TOTAL ADDITIONS 3,506,946
DEDUCTIONS:
Administration 208,892
Interest 2,287,561
Depreciation 4,761
Loss on sale of property 1,059,577
TOTAL DEDUCTIONS 3,560,791
CHANGE IN NET POSITION (53,845)
NET POSITION - BEGINNING OF YEAR (108,406,480)
NET POSITION - END OF YEAR (108,460,325)$
See accompanying notes to financial statements
- 37 -
CITY OF PICO RIVERA
For the year ended June 30, 2015
STATEMENT OF CHANGES IN FIDUCIARY NET POSITION
FIDUCIARY FUNDS

- 38 -
This page intentionally left blank.
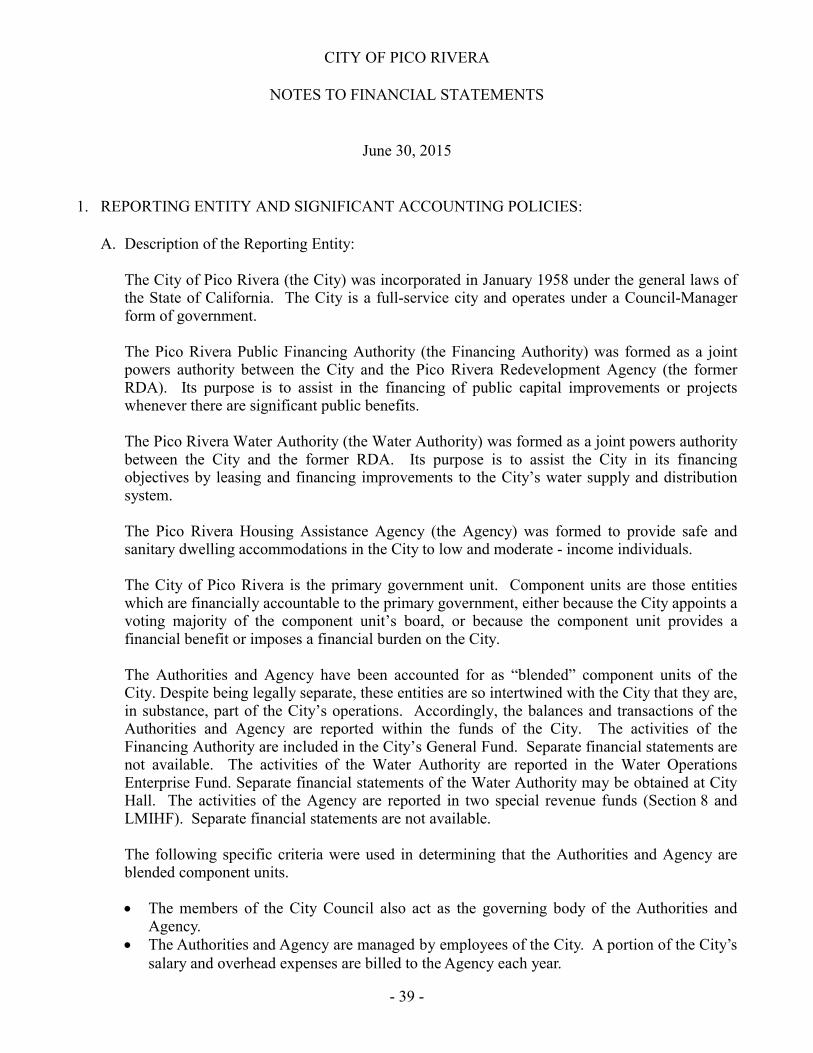
- 39 -
CITY OF PICO RIVERA
NOTES TO FINANCIAL STATEMENTS
June 30, 2015
1. REPORTING ENTITY AND SIGNIFICANT ACCOUNTING POLICIES:
A. Description of the Reporting Entity:
The City of Pico Rivera (the City) was incorporated in January 1958 under the general laws of the State of California. The City is a full-service city and operates under a Council-Manager form of government.
The Pico Rivera Public Financing Authority (the Financing Authority) was formed as a joint powers authority between the City and the Pico Rivera Redevelopment Agency (the former RDA). Its purpose is to assist in the financing of public capital improvements or projects whenever there are significant public benefits.
The Pico Rivera Water Authority (the Water Authority) was formed as a joint powers authority between the City and the former RDA. Its purpose is to assist the City in its financing objectives by leasing and financing improvements to the City’s water supply and distribution system.
The Pico Rivera Housing Assistance Agency (the Agency) was formed to provide safe and sanitary dwelling accommodations in the City to low and moderate - income individuals.
The City of Pico Rivera is the primary government unit. Component units are those entities which are financially accountable to the primary government, either because the City appoints a voting majority of the component unit’s board, or because the component unit provides a financial benefit or imposes a financial burden on the City.
The Authorities and Agency have been accounted for as “blended” component units of the City. Despite being legally separate, these entities are so intertwined with the City that they are, in substance, part of the City’s operations. Accordingly, the balances and transactions of the Authorities and Agency are reported within the funds of the City. The activities of the Financing Authority are included in the City’s General Fund. Separate financial statements are not available. The activities of the Water Authority are reported in the Water Operations Enterprise Fund. Separate financial statements of the Water Authority may be obtained at City Hall. The activities of the Agency are reported in two special revenue funds (Section 8 and LMIHF). Separate financial statements are not available.
The following specific criteria were used in determining that the Authorities and Agency are blended component units.
The members of the City Council also act as the governing body of the Authorities and Agency.
The Authorities and Agency are managed by employees of the City. A portion of the City’s salary and overhead expenses are billed to the Agency each year.
CITY OF PICO RIVERA
NOTES TO FINANCIAL STATEMENTS(CONTINUED)
June 30, 2015
- 40 -
1. REPORTING ENTITY AND SIGNIFICANT ACCOUNTING POLICIES (CONTINUED):
A. Description of the Reporting Entity (Continued):
The former Pico Rivera Redevelopment Agency was dissolved effective February 1, 2012 as a result of Assembly Bill x1 26 (the Dissolution Act). It is no longer considered to be a component unit of the City. On January 10, 2012, the City accepted a fiduciary role as theSuccessor Agency to serve as the custodian for the assets and to wind down the affairs of the former RDA. Successor Agency activity is reported in a fiduciary private-purpose trust fund. See Notes 15 and 16 for further details.
The City’s financial statements have been prepared in accordance with accounting principles generally accepted in the United States of America as applied to governmental agencies. The Governmental Accounting Standards Board (GASB) is the accepted standard-setting body for establishing governmental accounting and financial reporting principles. The City’s more significant accounting policies are described below.
B. Government-wide and Fund Financial Statements:
The statement of net position and statement activities (i.e., the government-wide financial statements) displays information on all of the nonfiduciary activities of the primary government (the City) and its blended component units. Eliminations have been made to minimize the effect of interfund activity. These statements distinguish between the City’s governmental and business-type activities. Governmental activities, which normally are supported by taxes and intergovernmental revenues, are reported separately from business-type activities, which rely to a significant extent on fees charged to external parties.
The statement of activities presents a comparison between direct expenses and program revenues for each function of the City’s governmental activities and for each segment of the City’s business-type activities. Direct expenses are those that are specifically associated with a program or function and are clearly identifiable to a particular function. Program revenues include 1) charges paid by the recipients of goods or services offered by the functions or programs and 2) grants and contributions that are restricted to meeting the operational or capital requirements of a particular function or program. Revenues that are not classified as program revenues, including all taxes, are presented as general revenues.

CITY OF PICO RIVERA
NOTES TO FINANCIAL STATEMENTS(CONTINUED)
June 30, 2015
- 41 -
1. REPORTING ENTITY AND SIGNIFICANT ACCOUNTING POLICIES (CONTINUED):
C. Measurement Focus, Basis of Accounting, and Financial Statement Presentation:
The government-wide financial statements are reported using the economic resources measurement focus and the accrual basis of accounting, as are the proprietary fund financial statements. Under the economic resources measurement focus, all assets, deferred outflows of resources, liabilities, and deferred inflows of resources (whether current or noncurrent) associated with their activity are included on their statement of net position. Operating statements present increases (revenues) and decreases (expenses) in total net position. Under the accrual basis of accounting, revenues are recorded when earned and expenses are recorded when a liability is incurred, regardless of the timing of related cash flows. Proprietary funds distinguish operating revenues and expenses from nonoperating items. Operating revenues and expenses generally result from providing services and producing and delivering goods in connection with a proprietary fund’s principal ongoing operations. Nonexchange transactions, in which the City gives (or receives) value without directly receiving (or giving) equal value in exchange include property taxes, grants, entitlements, and donations. On an accrual basis, revenue from property taxes is recognized in the fiscal year which the taxes are levied. Revenue from grants, entitlements, and donations is recognized in the fiscal year in which all the eligibility requirements have been satisfied. Operating expenses for proprietary funds include the cost of sales and services, administrative expenses, and depreciation on capital assets. All revenues and expenses not meeting this definition are reported as nonoperating revenues and expenses.
Governmental fund financial statements are reported using the current financial resources measurement focus and the modified accrual basis of accounting. Under the current financial resources measurement focus, only current assets, deferred outflows of resources, current liabilities and deferred inflows of resources are generally included on their balance sheets. The reported fund balance is considered to be a measure of “available spendable resources”.
Under the modified accrual basis of accounting, revenues are considered to be available when they are collectible within the current period or soon enough thereafter to pay liabilities of the current period. For this purpose, the government considers revenues to be available if they are collected within 60 days of the end of the current fiscal period. Expenditures generally are recorded when a liability is incurred, except for principal and interest on long-term liabilities, claims payable, and compensated absences which are recognized as expenditures to the extent they have matured. Capital asset acquisitions are reported as expenditures in governmental funds. Proceeds of long-term liabilities are reported as other financing sources.
CITY OF PICO RIVERA
NOTES TO FINANCIAL STATEMENTS(CONTINUED)
June 30, 2015
- 42 -
1. REPORTING ENTITY AND SIGNIFICANT ACCOUNTING POLICIES (CONTINUED):
C. Measurement Focus, Basis of Accounting, and Financial Statement Presentation (Continued):
Property taxes, taxpayer-assessed taxes, such as sales taxes, gas taxes, and transient occupancy taxes, and interest associated with the current fiscal period are all considered to be susceptible to accrual and so have been recognized as revenues of the current fiscal period. Only the portion of special assessments receivable due within the current fiscal period is considered to be susceptible to accrual as revenue of the current period. All other revenue items are considered to be measurable and available only when cash is received by the government.Amounts owed to the City, which are not available, are recorded as receivables and deferred inflows of resources.
Governmental fund operating statements present increases (revenues and other financing sources) and decreases (expenditures and other financing uses) in fund balance. Accordingly, they are said to present a summary of sources and uses of “available spendable resources” during a period. Long-term receivables due to governmental funds are reported on their balance sheets in spite of their spending measurement focus. However, special reporting treatments are used to indicate that they should not be considered “available spendable resources” since they do not represent fund balance. Long-term receivables in governmental funds are offset by due to other agencies since the collections will be ultimately distributed to other agencies that provided the initial funding for the loans.
The City’s fiduciary fund financial statements are comprised of a private-purpose trust fund and agency funds. The private-purpose trust fund is reported using the “economic resources measurement focus” and the “accrual basis of accounting”. The agency funds have no measurement focus but utilize the “accrual basis of accounting” for reporting their assets and liabilities.
The accounts of the City are organized on the basis of funds, each of which is considered a separate accounting entity with a self-balancing set of accounts established for the purpose of carrying out specific activities or attaining certain objectives in accordance with applicable regulations, restrictions or limitations. Separate financial statements are provided for governmental funds, proprietary funds, and fiduciary funds, even though the last is excluded from the government-wide financial statements.
CITY OF PICO RIVERA
NOTES TO FINANCIAL STATEMENTS(CONTINUED)
June 30, 2015
- 43 -
1. REPORTING ENTITY AND SIGNIFICANT ACCOUNTING POLICIES (CONTINUED):
C. Measurement Focus, Basis of Accounting, and Financial Statement Presentation (Continued):
The City reports the following major governmental funds:
The General Fund is the City’s primary operating fund and accounts for all the financial resources of the general government, except those required to be accounted for in another fund.
The Housing Agency Section 8 Special Revenue Fund accounts for rental assistance expenditures incurred to assist very low and low income families in meeting their housing needs. Funds are provided by the U.S. Department of Housing and Urban Development.
The Federal Grants Special Revenue Fund accounts for funds received from the United States (Federal) government for the rehabilitation of streets and intersections, bridge construction, and parkway improvements.
The Capital Improvement Capital Projects Fund accounts for activity related to the City’s capital projects other than those accounted for in the Enterprise Funds.
The City reports the following major enterprise fund:
The Water Operations Fund accounts for the operation and maintenance of the City’s water treatment, water transmission and distribution system.
Additionally, the City reports the following fund types:
Governmental Funds:
Special Revenue Funds account for proceeds of specific revenue sources that are legally restricted or otherwise designated for specific purposes.
Capital Projects Funds account for financial resources used for the acquisition or construction of major capital facilities.
Proprietary Funds:
Enterprise Funds account for operations that are financed and operated in a manner similar to private business enterprises. Costs are financed or recovered primarily through user charges.

CITY OF PICO RIVERA
NOTES TO FINANCIAL STATEMENTS(CONTINUED)
June 30, 2015
- 44 -
1. REPORTING ENTITY AND SIGNIFICANT ACCOUNTING POLICIES (CONTINUED):
C. Measurement Focus, Basis of Accounting, and Financial Statement Presentation (Continued):
Internal Service Funds account for the financing of services relating to OPEB liability, leave liability, and equipment replacement provided to one department from another on a cost-reimbursement basis.
Fiduciary Funds:
Private Purpose Trust Fund accounts for the county-auditor controller’s semi-annual property tax distributions from the Redevelopment Property Tax Trust Fund of the Successor Agency of the former Pico Rivera Redevelopment Agency to pay amounts due on enforceable obligations of the former Pico Rivera Redevelopment Agency and to pay for specified administrative costs.
Agency Funds accounts for assets held by the City as an agent for a bonded assessment districtand a joint powers authority.
D. New Accounting Pronouncements:
Current Year Standards:
In fiscal year 2014-2015, the City implemented Governmental Accounting Standards Board (GASB) Statement No. 68, “Accounting and Financial Reporting for Pensions, an Amendment of GASB Statement No. 27” and GASB Statement No. 71, “Pension Transition for Contributions Made Subsequent to the Measurement Date, an Amendment of GASB Statement No. 68”. These Statements establish standards for measuring and recognizing liabilities, deferred outflows of resources, deferred inflows of resources, and expenses. For defined benefit pension plans, these Statements identify the methods and assumptions that should be used to project benefit payments, discount projected benefit payments to their actuarial present value, and attribute that present value to periods of employee service. Accounting changes adopted to conform to the provisions of these statements should be applied retroactively. The result of the implementation of these standards decreased the net position of the governmental activities and business-type activities at July 1, 2014 by $26,458,379 and $3,803,379, respectively, anddecreased the net position of the water operations and other enterprise funds at July 1, 2014 by$3,785,253 and $18,126, respectively.
GASB Statement No. 69 - “Government Combinations and Disposals of Government Operations” was required to be implemented in the current fiscal year and did not impact the City.

CITY OF PICO RIVERA
NOTES TO FINANCIAL STATEMENTS(CONTINUED)
June 30, 2015
- 45 -
1. REPORTING ENTITY AND SIGNIFICANT ACCOUNTING POLICIES (CONTINUED):
D. New Accounting Pronouncements (Continued):
Pending Accounting Standards:
GASB has issued the following statements which may impact the City’s financial reporting requirements in the future:
GASB 72 - “Fair Value Measurement and Application”, effective for periods beginning after June 15, 2015.
GASB 73 - “Accounting and Financial Reporting for Pensions and Related Assets That Are Not within the Scope of GASB Statement 68, and Amendments to Certain Provisions of GASB Statements 67 and 68”, effective for periods beginning after June 15, 2015 - except for those provisions that address employers and governmental nonemployer contributing entities for pensions that are not within the scope of Statement 68, which are effective for periods beginning after June 15, 2016.
GASB 74 - “Financial Reporting for Postemployment Benefit Plans Other Than Pension Plans”, effective for periods beginning after June 15, 2016.
GASB 75 - “Accounting and Financial Reporting for Postemployment Benefits Other Than Pensions”, effective for periods beginning after June 15, 2017.
GASB 76 - “The Hierarchy of Generally Accepted Accounting Principles for State and Local Governments”, effective for periods beginning after June 15, 2015.
E. Investments:
Investments are recorded at fair value (quoted market price or best available estimate thereof).Interest earned on cash and investments is credited to the fund, which holds the investment.
F. Property Taxes:
Property taxes include assessments on both secured and unsecured property. Secured property taxes attach as an enforceable lien on property as of January 1. Taxes are levied on July 1 and are payable in two installments by December 10 and April 10. The County of Los Angeles bills and collects the property taxes and remits them to the City in installments during the year. The City records property taxes as revenue when received from the County, except for property taxes received within 60 days after fiscal year-end, which are accrued at June 30th.
CITY OF PICO RIVERA
NOTES TO FINANCIAL STATEMENTS(CONTINUED)
June 30, 2015
- 46 -
1. REPORTING ENTITY AND SIGNIFICANT ACCOUNTING POLICIES (CONTINUED):
F. Property Taxes (Continued):
The County is permitted by State Law (Article XIII A of the California Constitution) to levy taxes at one percent (1%) of full market value (at the time of purchase) and can increase the property’s value at no more than two percent (2%) per year. The City receives a share of this basic levy.
G. Receivables:
The City extends credit to customers and accepts expense reimbursement-based grants in the normal course of operations. Uncollectible amounts are accounted for by the reserve method, which establishes an allowance for doubtful accounts based upon historical losses and review of past due accounts. Earned but unbilled revenue is recognized as revenue and accounts receivable in the enterprise funds.
H. Interfund Transactions:
Interfund transactions are reflected as either loans, services provided, reimbursements, or transfers. Loans are reported as receivables and payables as appropriate, are subject to elimination upon consolidation and are referred to as either “due to/from other funds” (i.e., the current portion of interfund loans) or “advances to/from other funds” (i.e., the noncurrent portion of interfund loans). Any residual balances outstanding between the governmental activities and the business-type activities are reported in the government-wide financial statements as “internal balances”.
The principal portion of advances between funds, as reported in the fund financial statements, are offset by a nonspendable fund balance in applicable governmental funds to indicate that they are not available for appropriation and are not available financial resources.
Services provided, deemed to be at market or near market rates, are treated as revenues and expenditures/expenses. Reimbursements are when one fund incurs costs, charges the appropriate benefiting fund and reduces its related costs as a reimbursement. All other interfund transactions are treated as transfers.
I. Inventories and Prepaid Items:
Inventories are recorded as expenditures when consumed rather than when purchased. These inventories are valued at the lower of average cost or market and consist of expendable materials and supplies.
CITY OF PICO RIVERA
NOTES TO FINANCIAL STATEMENTS(CONTINUED)
June 30, 2015
- 47 -
1. REPORTING ENTITY AND SIGNIFICANT ACCOUNTING POLICIES (CONTINUED):
I. Inventories and Prepaid Items (Continued):
When payments to vendors reflect costs applicable to future accounting periods, they are recorded as prepaid items.
Inventories and prepaid items are offset by nonspendable fund balance in governmental funds to indicate that they are not available for appropriation and are not expendable financial resources.
J. Restricted Assets:
Certain proceeds of debt issues, as well as certain resources set aside for their repayment, are classified as restricted assets in the financial statements because their use is limited by applicable bond covenants.
K. Capital Assets:
Capital assets, which include lands, buildings, improvements, equipment and infrastructure assets (e.g., roads, bridges, sidewalks, and similar items), are reported in the applicable governmental or business-type activities column in the government-wide financial statements. Capital assets are recorded at the lower of actual historical cost or fair market value (as of the date donated for contributed assets). The costs of normal maintenance and repairs that do not add to the value of the asset or materially extend lives are not capitalized.
Capital assets are depreciated using the straight-line method over the following estimated useful lives:
Building and structures 40 yearsImprovements other than buildings 40 yearsFurniture and equipment Up to 25 yearsInfrastructure Up to 60 years
It is the City’s policy to capitalize all land, building, improvements and equipment with an estimated useful life greater than one year, except assets costing less than $5,000, and to capitalize infrastructure assets costing $50,000 or more. Interest incurred during the construction phase of capital assets of business-type activities is reflected in the capitalized value of the asset constructed, net of interest earned on the invested proceeds over the same period. There was no capitalized interest recorded during the year ended June 30, 2015. Costs of assets sold or retired (and related amounts of accumulated depreciation) are eliminated from the accounts in the year of sale or retirement and the resulting gain or loss is included in the operating statement of the related fund. In governmental funds, the sale of capital assets is included in the statement of revenues, expenditures and changes in fund balances as proceeds from sale.
CITY OF PICO RIVERA
NOTES TO FINANCIAL STATEMENTS(CONTINUED)
June 30, 2015
- 48 -
1. REPORTING ENTITY AND SIGNIFICANT ACCOUNTING POLICIES (CONTINUED):
L. Land Held for Resale:
Land held for resale is carried at the lower of acquisition cost or fair value.
M. Compensated Absences:
Employees accrue vacation, sick and holiday benefits. An employee may accumulate vacation time of up to 320 hours. Sick pay vests and may be accumulated up to 800 hours. An employee with accumulated sick leave at the end of the fiscal year may elect to receive cash payment for earned sick leave up to 81 hours. The amount of sick leave paid is deducted from the employee’s total accumulation.
All vacation pay is accrued when incurred in the government-wide and proprietary fund financial statements. A liability for these amounts is reported in governmental funds only if they have matured, for example, as a result of employee resignations and retirements.
N. Deferred Outflows/Inflows of Resources:
In addition to assets, the statement of net position and the governmental funds balance sheet will sometimes report a separate section for deferred outflows of resources. This separate financial statement element, deferred outflows of resources, represents a consumption of net position that applies to future periods and so will not be recognized as an outflow of resources (expense/expenditure) until that time. The City has one item that qualifies for reporting in this category for the fiscal year ended June 30, 2015. This item is the deferred outflow related to pensions which is equal to the employer contributions made after the measurement date of the net pension liability.
In addition to liabilities, the statement of net position and the governmental funds balance sheetwill sometimes report a separate section for deferred inflows of resources. This separate financial statement element, deferred inflows of resources, represents an acquisition of net position that applies to future periods and will not be recognized as an inflow of resources (revenue) until that time. The City has two types of items that qualify for reporting in this category. The first item, which is reported on the statement of net position, is a deferred inflow related to pensions resulting from the difference in projected and actual earnings on investments of the pension plan fiduciary net position. This amount is amortized over five years. The second item is the unavailable revenues, which is reported only in the governmental funds balance sheet. The governmental funds report unavailable revenues from three sources: taxes, investment income, and grants. These amounts are unavailable and will be recognized as an inflow of resources in the period that the amounts become available.
CITY OF PICO RIVERA
NOTES TO FINANCIAL STATEMENTS(CONTINUED)
June 30, 2015
- 49 -
1. REPORTING ENTITY AND SIGNIFICANT ACCOUNTING POLICIES (CONTINUED):
O. Long-term Obligations:
In the government-wide financial statements and proprietary fund types fund financial statements, long-term debt and other long-term obligations are included as liabilities. Bond premiums and discounts are amortized over the life of the bonds. Bonds payable are reported net of the applicable bond premium or discount.
In the fund financial statements, governmental fund types recognize bond premiums and discounts, as well as bond issuance costs, when paid. The face amount of debt issued is reported as other financing sources. Premiums received on debt issuances are reported as other financing sources while discounts on debt issuances are reported as other financing uses. Issuance costs, whether or not withheld from the actual debt proceeds received, are reported as an expense.
P. Pensions:
For purposes of measuring the net pension liability and deferred outflows/inflows of resources related to pensions, and pension expense, information about the fiduciary net position of the City’s California Public Employees’ Retirement System (CalPERS) plan (the Plan) and additions to/deductions from the Plan’s fiduciary net position have been determined on the same basis as they are reported by CalPERS. For this purpose, benefit payments (including refunds of employee contributions) are recognized when due and payable in accordance with the benefit terms. Investments are reported at fair value.
Q. Fund Balances:
Fund balance is the difference between the assets, deferred outflows of resources, liabilities and deferred inflows of resources reported in the City’s governmental funds. There are generally limitations on the purpose for which all or a portion of the resources of a governmental fund may be used. The force behind these limitations can vary significantly, depending upon their source. Consequently, the fund balance reported in the annual financial statements is categorized into five components whereby each component identifies the extent to which the City is bound to honor constraints on the specific purposes for which amounts in the fund can be spent.
CITY OF PICO RIVERA
NOTES TO FINANCIAL STATEMENTS(CONTINUED)
June 30, 2015
- 50 -
1. REPORTING ENTITY AND SIGNIFICANT ACCOUNTING POLICIES (CONTINUED):
Q. Fund Balances (Continued):
The fund balances reported on the fund statements consist of the following categories:
Nonspendable - This classification includes amounts that cannot be spent because they are either (a) not in spendable form or (b) legally or contractually required to be maintained intact.
Restricted - This classification includes amounts that can be spent only for specific purposes stipulated by constitution, external resource providers or through enabling legislation.
Committed - This classification includes amounts that can be used only for the specific purposes determined by a the City Council through the adoption of a resolution prior to the end of the year. Once adopted, the limitation imposed by the resolution remains in place until asimilar action is taken to remove or revise the limitation.
Assigned - This classification includes amounts to be used by the City for specific purposes but do not meet the criteria to be classified as restricted or committed. Through the adoption of a resolution to approve the City’s fund balance policy, the City Council has authorized the City Manager to assign fund balance. In governmental funds, other than the general fund, assigned fund balance represents the remaining amount that is not restricted or committed.
Unassigned - This classification includes the residual balance for the government’s general fund and includes all spendable amounts not contained in other classifications. In other funds, the unassigned classification is used only to report a deficit balance resulting from overspending for specific purposes for which amounts had been restricted, committed or assigned.
When an expenditure is incurred for purposes for which both restricted and unrestricted fund balances are available, the City’s policy is to apply restricted fund balance first.
When an expenditure is incurred for purposes for which committed, assigned or unassigned fund balances are available, the City’s policy is to apply committed fund balance first, then assigned fund balance, and finally unassigned fund balance.

CITY OF PICO RIVERA
NOTES TO FINANCIAL STATEMENTS(CONTINUED)
June 30, 2015
- 51 -
1. REPORTING ENTITY AND SIGNIFICANT ACCOUNTING POLICIES (CONTINUED):
R. Net Position:
The government-wide and proprietary fund financial statements utilize a net positionpresentation. Net position is classified in the following categories:
Net investment in capital assets - This amount consists of capital assets net of accumulated depreciation and reduced by outstanding debt that is attributed to the acquisition, construction, or improvement of the assets.
Restricted net position - This amount is restricted by external creditors, grantors, contributors, or laws or regulations of other governments.
Unrestricted net position - This amount is all net position that does not meet the definition of “net investment in capital assets” or “restricted net position”.
Sometimes the City will fund outlays for a particular purpose from both restricted (e.g., restricted bond or grant proceeds) and unrestricted resources. In order to calculate the amounts to report as restricted - net position and unrestricted - net position in the government-wide and proprietary fund financial statements, a flow assumption must be made about the order in which the resources are considered to be applied.
It is the City’s practice to consider restricted - net position to have been depleted before unrestricted - net position is applied, however it is at the Council’s discretion.
S. Statement of Cash Flows:
For purposes of the statement of cash flows, cash equivalents are defined as investments with original maturities of 90 days or less, which are readily convertible to known amounts of cash and not subject to significant changes in value from interest rate fluctuations.
T. Reclassification:
The HOME Grant Special Revenue Fund, which was previously reported as a major fund, did not meet the criteria to be considered a major fund for the current year ended June 30, 2015. As a result, it is reported as part of the Other Governmental Funds in the current year financial statements.

CITY OF PICO RIVERA
NOTES TO FINANCIAL STATEMENTS(CONTINUED)
June 30, 2015
- 52 -
1. REPORTING ENTITY AND SIGNIFICANT ACCOUNTING POLICIES (CONTINUED):
U. Use of Estimates:
The preparation of financial statements in accordance with accounting principles generally accepted in the United States of America requires management to make estimates and assumption that affect the reported amounts of assets, deferred outflows of resources, liabilitiesand deferred inflows of resources and related disclosures. Actual results could differ from those estimates.
2. CASH AND INVESTMENTS:
Cash and Investments:
Cash and investments at June 30, 2015 are classified in the accompanying financial statements as follows:
FiduciaryGovernment- Funds
Wide Statement ofStatement of FiduciaryNet Position Net Position Total
Unrestricted assets:Cash and investments $ 41,846,820 $ 4,898,702 $ 46,745,522
Restricted cash and investments:Cash and investments with fiscal agents 6,761,592 250,000 7,011,592Escrow deposits 19,925 - 19,925
Total cash and investments $ 48,628,337 $ 5,148,702 $ 53,777,039
Cash and investments at June 30, 2015 consisted of the following:
Cash on hand $ 10,263Deposits with financial institutions 9,421,372Investments 44,345,404
Total cash and investments $ 53,777,039
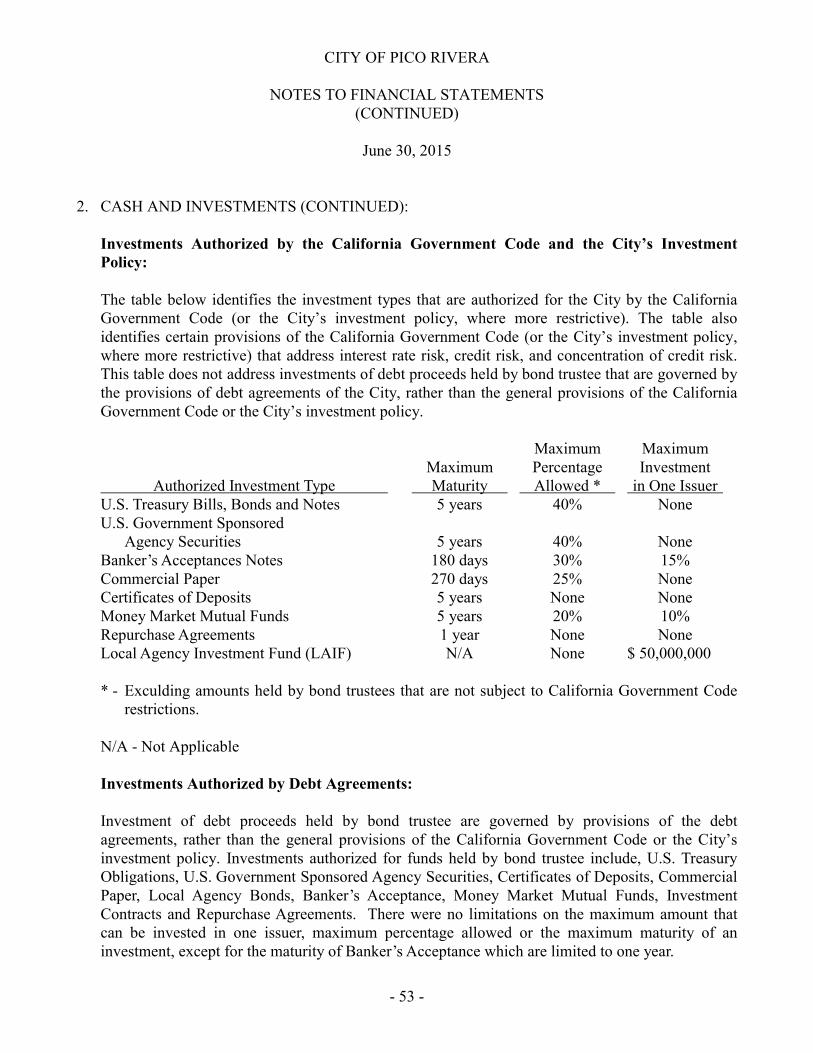
CITY OF PICO RIVERA
NOTES TO FINANCIAL STATEMENTS(CONTINUED)
June 30, 2015
- 53 -
2. CASH AND INVESTMENTS (CONTINUED):
Investments Authorized by the California Government Code and the City’s Investment Policy:
The table below identifies the investment types that are authorized for the City by the California Government Code (or the City’s investment policy, where more restrictive). The table also identifies certain provisions of the California Government Code (or the City’s investment policy, where more restrictive) that address interest rate risk, credit risk, and concentration of credit risk. This table does not address investments of debt proceeds held by bond trustee that are governed by the provisions of debt agreements of the City, rather than the general provisions of the California Government Code or the City’s investment policy.
Maximum MaximumMaximum Percentage Investment
Authorized Investment Type Maturity Allowed * in One IssuerU.S. Treasury Bills, Bonds and Notes 5 years 40% NoneU.S. Government Sponsored
Agency Securities 5 years 40% NoneBanker’s Acceptances Notes 180 days 30% 15%Commercial Paper 270 days 25% NoneCertificates of Deposits 5 years None NoneMoney Market Mutual Funds 5 years 20% 10%Repurchase Agreements 1 year None NoneLocal Agency Investment Fund (LAIF) N/A None $ 50,000,000
* - Exculding amounts held by bond trustees that are not subject to California Government Code restrictions.
N/A - Not Applicable
Investments Authorized by Debt Agreements:
Investment of debt proceeds held by bond trustee are governed by provisions of the debt agreements, rather than the general provisions of the California Government Code or the City’s investment policy. Investments authorized for funds held by bond trustee include, U.S. Treasury Obligations, U.S. Government Sponsored Agency Securities, Certificates of Deposits, Commercial Paper, Local Agency Bonds, Banker’s Acceptance, Money Market Mutual Funds, Investment Contracts and Repurchase Agreements. There were no limitations on the maximum amount thatcan be invested in one issuer, maximum percentage allowed or the maximum maturity of an investment, except for the maturity of Banker’s Acceptance which are limited to one year.
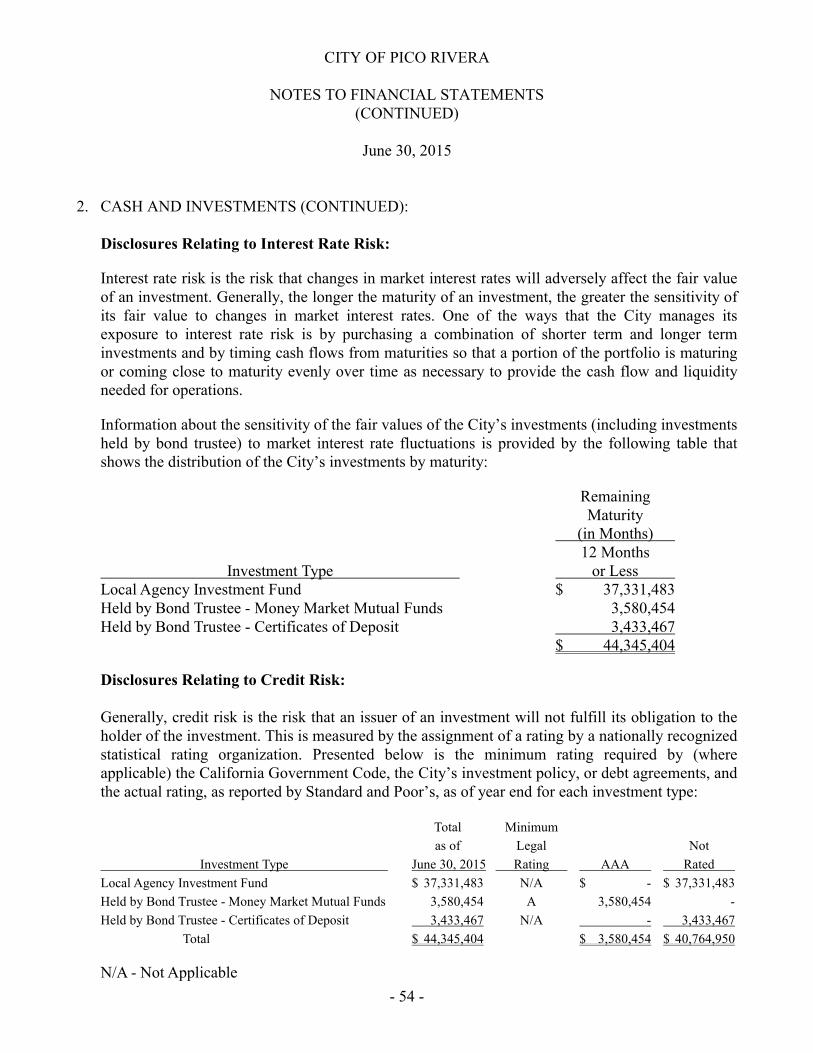
CITY OF PICO RIVERA
NOTES TO FINANCIAL STATEMENTS(CONTINUED)
June 30, 2015
- 54 -
2. CASH AND INVESTMENTS (CONTINUED):
Disclosures Relating to Interest Rate Risk:
Interest rate risk is the risk that changes in market interest rates will adversely affect the fair value of an investment. Generally, the longer the maturity of an investment, the greater the sensitivity of its fair value to changes in market interest rates. One of the ways that the City manages its exposure to interest rate risk is by purchasing a combination of shorter term and longer term investments and by timing cash flows from maturities so that a portion of the portfolio is maturing or coming close to maturity evenly over time as necessary to provide the cash flow and liquidity needed for operations.
Information about the sensitivity of the fair values of the City’s investments (including investments held by bond trustee) to market interest rate fluctuations is provided by the following table that shows the distribution of the City’s investments by maturity:
RemainingMaturity
(in Months)12 Months
Investment Type or LessLocal Agency Investment Fund $ 37,331,483Held by Bond Trustee - Money Market Mutual Funds 3,580,454Held by Bond Trustee - Certificates of Deposit 3,433,467
$ 44,345,404
Disclosures Relating to Credit Risk:
Generally, credit risk is the risk that an issuer of an investment will not fulfill its obligation to the holder of the investment. This is measured by the assignment of a rating by a nationally recognized statistical rating organization. Presented below is the minimum rating required by (where applicable) the California Government Code, the City’s investment policy, or debt agreements, and the actual rating, as reported by Standard and Poor’s, as of year end for each investment type:
Total Minimum
as of Legal Not
Investment Type June 30, 2015 Rating AAA Rated
Local Agency Investment Fund $ 37,331,483 N/A $ - $ 37,331,483
Held by Bond Trustee - Money Market Mutual Funds 3,580,454 A 3,580,454 -
Held by Bond Trustee - Certificates of Deposit 3,433,467 N/A - 3,433,467
Total $ 44,345,404 $ 3,580,454 $ 40,764,950
N/A - Not Applicable
CITY OF PICO RIVERA
NOTES TO FINANCIAL STATEMENTS(CONTINUED)
June 30, 2015
- 55 -
2. CASH AND INVESTMENTS (CONTINUED):
Custodial Credit Risk:
Custodial credit risk for deposits is the risk that, in the event of the failure of a depository financial institution, a government will not be able to recover its deposits or will not be able to recover collateral securities that are in the possession of an outside party. The custodial credit risk for investments is the risk that, in the event of the failure of the counterparty (e.g., broker-dealer) to a transaction, a government will not be able to recover the value of its investment or collateral securities that are in the possession of another party. The California Government Code and the City’s investment policy do not contain legal or policy requirements that would limit the exposure to custodial credit risk for deposits or investments, other than the following provision for deposits.
The California Government Code requires that a financial institution secure deposits made by state or local governmental units by pledging securities in an undivided collateral pool held by a depository regulated under state law (unless so waived by the governmental unit). The market value of the pledged securities in the collateral pool must equal at least 110% of the total amount deposited by the public agencies. California law also allows financial institutions to secure City deposits by pledging first trust deed mortgage notes having a value of 150% of the secured public deposits.
At June 30, 2015, the City and the Successor Agency deposits (bank balances) were insured by the Federal Deposit Insurance Corporation and the remaining balances were collateralized under California Law.
For investments identified herein as held by fiscal agent, the trustee selects the investment under the terms of the applicable trust agreement, acquires the investment, and holds the investment on behalf of the reporting government.
Investment in Local Agency Investment Fund:
The City is a voluntary participant in the Local Agency Investment Fund (LAIF) that is regulated by California Government Code Section 16429 under the oversight of the Treasurer of the State of California. The fair value of the City’s investment in this pool is reported in the accompanying financial statements at amounts based upon the City’s pro-rata share of the fair value provided by LAIF for the entire LAIF portfolio (in relation to the amortized cost of that portfolio). The balance available for withdrawal is based on the accounting records maintained by LAIF, which are recorded on an amortized cost basis.

CITY OF PICO RIVERA
NOTES TO FINANCIAL STATEMENTS(CONTINUED)
June 30, 2015
- 56 -
3. INTERFUND RECEIVABLES, PAYABLES AND TRANSFERS:
The composition of interfund balances as of June 30, 2015, is as follows:
Advances To/From Other Funds:
Advances To Other Funds Advances From Other Funds AmountGeneral Fund Water Operations Enterprise Fund $ 18,260,812
Other Enterprise Funds 704,496$ 18,965,308
In 1999, the Water Authority received an advance from the City’s General Fund in connection with the acquisition of water operation capital assets. The Water Authority is obligated to pay off this advance from surplus revenues over 50 years. No interest accrues on this advance. Payments will vary with the level of surplus revenues. No payments were made in fiscal year 2014-15. The balance of the advance at June 30, 2015 is $18,260,812. The Authority’s current outstanding revenue bonds will be paid in full by 2033. The debt service payments will be partially funded by receipts from the receivables due from the Successor Agency as well as operating income over the next 18 years. Management has estimated that cash flows from these sources will exceed the debt service requirements of the revenue bonds, and any excess cash flows will be used to pay down the advance from the City of Pico Rivera. Additionally, once the outstanding revenue bonds are paid in full in fiscal year 2033, the operating income will be available to pay down the advance from the City of Pico Rivera. Management believes that the Authority will have the ability to pay this obligation in full prior to the advance’s original maturity date in 2049.
The General Fund advanced funds to the Sports Arena Enterprise Fund for operational and capital improvement needs. Interest accrues at a rate of 12%. There is no fixed payment schedule. No payments were made in fiscal year 2014-15. The balance of the advance at June 30, 2015 is $704,496.
The composition of interfund balances as of June 30, 2015, is as follows:
Due To/From Other Funds:
Receivable Fund Payable Fund AmountGeneral Fund Federal Grants Special Revenue Fund $ 1,119,437
Oher Governmental Funds 826,903Other Enterprise Funds 673,881
$ 2,620,221
The amounts loaned from the General Fund to the Federal Grants Special Revenue Fund, the Other Governmental Funds, and the Other Enterprise Funds are short-term loans to fund operations of the various funds.
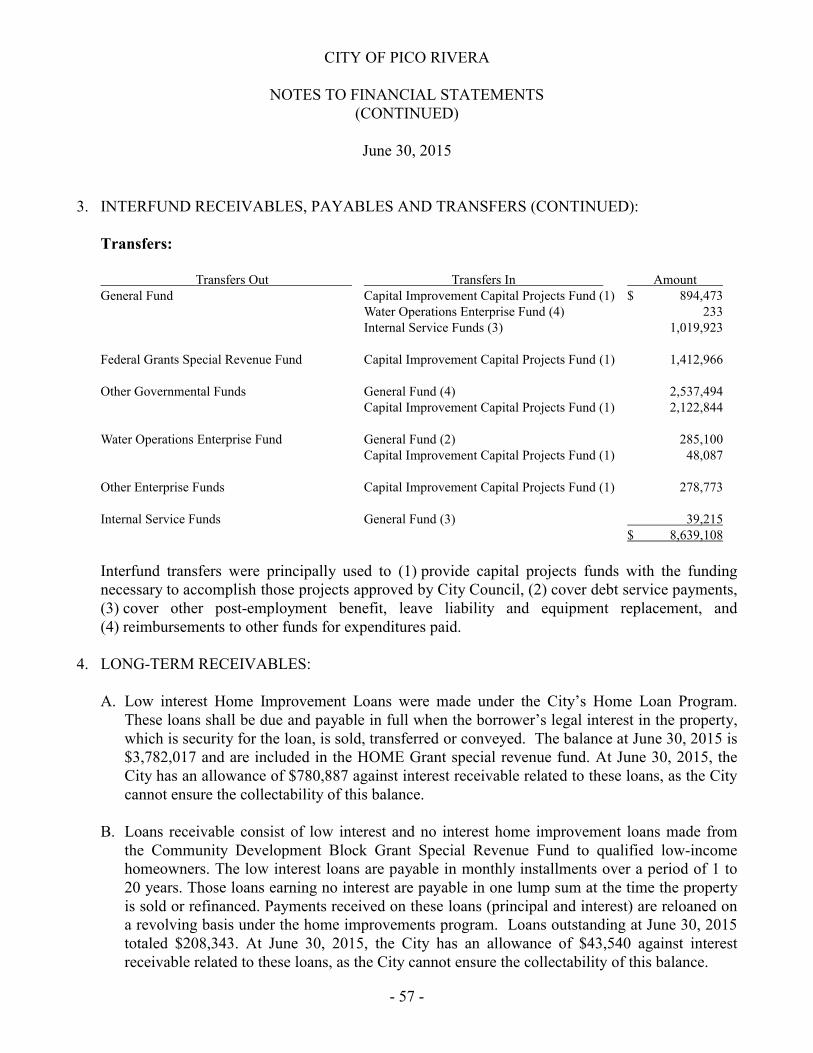
CITY OF PICO RIVERA
NOTES TO FINANCIAL STATEMENTS(CONTINUED)
June 30, 2015
- 57 -
3. INTERFUND RECEIVABLES, PAYABLES AND TRANSFERS (CONTINUED):
Transfers:
Transfers Out Transfers In AmountGeneral Fund Capital Improvement Capital Projects Fund (1) $ 894,473
Water Operations Enterprise Fund (4) 233Internal Service Funds (3) 1,019,923
Federal Grants Special Revenue Fund Capital Improvement Capital Projects Fund (1) 1,412,966
Other Governmental Funds General Fund (4) 2,537,494Capital Improvement Capital Projects Fund (1) 2,122,844
Water Operations Enterprise Fund General Fund (2) 285,100Capital Improvement Capital Projects Fund (1) 48,087
Other Enterprise Funds Capital Improvement Capital Projects Fund (1) 278,773
Internal Service Funds General Fund (3) 39,215$ 8,639,108
Interfund transfers were principally used to (1) provide capital projects funds with the funding necessary to accomplish those projects approved by City Council, (2) cover debt service payments, (3) cover other post-employment benefit, leave liability and equipment replacement, and(4) reimbursements to other funds for expenditures paid.
4. LONG-TERM RECEIVABLES:
A. Low interest Home Improvement Loans were made under the City’s Home Loan Program. These loans shall be due and payable in full when the borrower’s legal interest in the property, which is security for the loan, is sold, transferred or conveyed. The balance at June 30, 2015 is $3,782,017 and are included in the HOME Grant special revenue fund. At June 30, 2015, the City has an allowance of $780,887 against interest receivable related to these loans, as the City cannot ensure the collectability of this balance.
B. Loans receivable consist of low interest and no interest home improvement loans made fromthe Community Development Block Grant Special Revenue Fund to qualified low-income homeowners. The low interest loans are payable in monthly installments over a period of 1 to 20 years. Those loans earning no interest are payable in one lump sum at the time the property is sold or refinanced. Payments received on these loans (principal and interest) are reloaned on a revolving basis under the home improvements program. Loans outstanding at June 30, 2015totaled $208,343. At June 30, 2015, the City has an allowance of $43,540 against interest receivable related to these loans, as the City cannot ensure the collectability of this balance.

CITY OF PICO RIVERA
NOTES TO FINANCIAL STATEMENTS(CONTINUED)
June 30, 2015
- 58 -
4. LONG-TERM RECEIVABLES (CONTINUED):
C. Loans receivable consist of low interest home improvement loans made from the CalHOME Grant Special Revenue Fund to low and moderate income homeowners. The loans are due and payable in full when the borrower’s legal interest in the property, which is security for the loan, is sold, transferred or conveyed. The balance at June 30, 2015 is $1,430,395. At June 30, 2015, the City has an allowance of $131,458 against interest receivable related to these loans, as the City cannot ensure the collectability of this balance.
D. Home Improvement Loans to low and moderate income households have been made from the Housing Agency LMIHF Special Revenue Fund. These loans are payable in ten years or when borrowers sell their property, whichever comes first. The outstanding balances, net of an $87,337 allowance, at June 30, 2015 were zero. At June 30, 2015, the City has an allowance of $29 against interest receivable related to these loans, as the City cannot ensure the collectability of this balance.
E. Receivables from Successor Agency:
WaterOther Operations
General Governmental EnterpriseDescription Fund Funds Fund
Long-term loans to finance improvements &operations related to and within the formerRedevelopment Agency’s project areas $ 17,108,269 $ - $ 241,895
Sales tax deferral loan to allow formerRedevelopment Agency to meet its debtservice obligations 27,457,605 - -
Loans to make payments to SERAF - 2,011,156 -
Purchase of former Redevelopment Agency’sTax Allocation Bonds, Series 2001 treatedas loan - - 28,197,420
Subtotal 44,565,874 2,011,156 28,439,315
Reserve on long-term loans (4,277,068) - (60,474)Reserve on sales tax deferral loan (27,457,605) - -
Total $ 12,831,201 $ 2,011,156 $ 28,378,841
For further discussion of the receivables due from the Successor Agency, see Notes 16C, 16D and 16E.
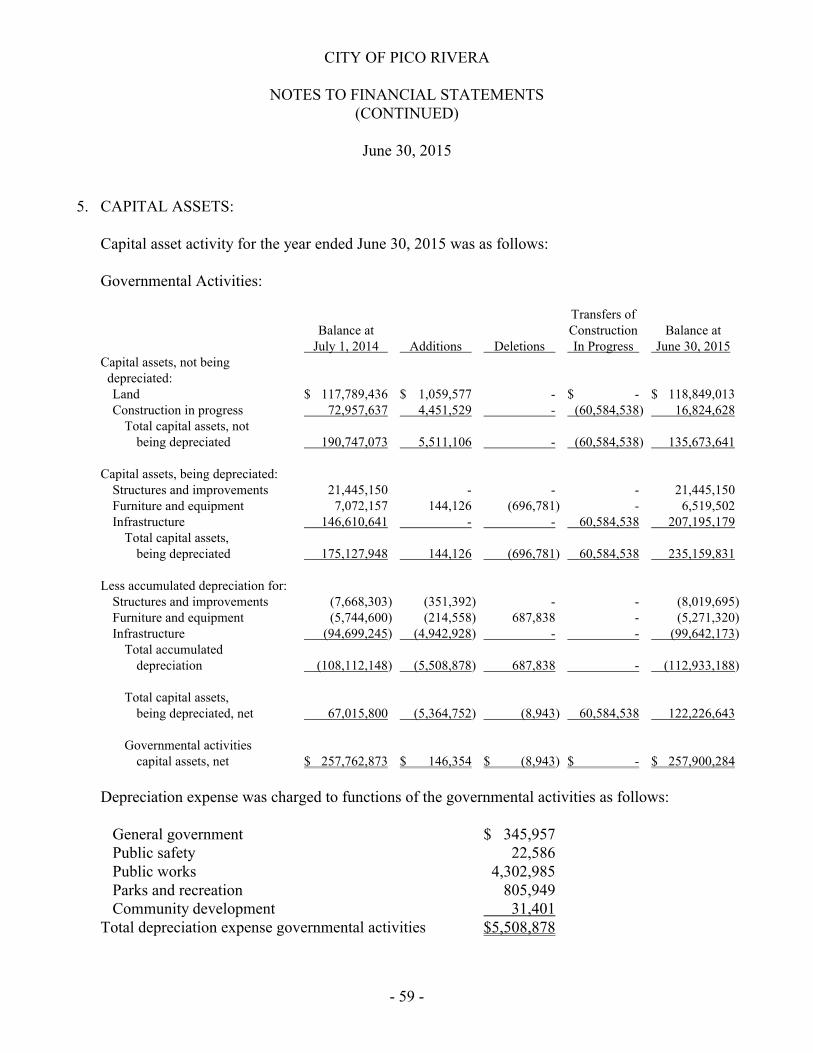
CITY OF PICO RIVERA
NOTES TO FINANCIAL STATEMENTS(CONTINUED)
June 30, 2015
- 59 -
5. CAPITAL ASSETS:
Capital asset activity for the year ended June 30, 2015 was as follows:
Governmental Activities:
Transfers ofBalance at Construction Balance at
July 1, 2014 Additions Deletions In Progress June 30, 2015Capital assets, not being depreciated:
Land $ 117,789,436 $ 1,059,577 - $ - $ 118,849,013Construction in progress 72,957,637 4,451,529 - (60,584,538) 16,824,628
Total capital assets, not being depreciated 190,747,073 5,511,106 - (60,584,538) 135,673,641
Capital assets, being depreciated:Structures and improvements 21,445,150 - - - 21,445,150Furniture and equipment 7,072,157 144,126 (696,781) - 6,519,502Infrastructure 146,610,641 - - 60,584,538 207,195,179
Total capital assets,being depreciated 175,127,948 144,126 (696,781) 60,584,538 235,159,831
Less accumulated depreciation for:Structures and improvements (7,668,303) (351,392) - - (8,019,695)Furniture and equipment (5,744,600) (214,558) 687,838 - (5,271,320)Infrastructure (94,699,245) (4,942,928) - - (99,642,173)
Total accumulateddepreciation (108,112,148) (5,508,878) 687,838 - (112,933,188)
Total capital assets,being depreciated, net 67,015,800 (5,364,752) (8,943) 60,584,538 122,226,643
Governmental activitiescapital assets, net $ 257,762,873 $ 146,354 $ (8,943) $ - $ 257,900,284
Depreciation expense was charged to functions of the governmental activities as follows:
General government $ 345,957Public safety 22,586Public works 4,302,985Parks and recreation 805,949Community development 31,401
Total depreciation expense governmental activities $5,508,878
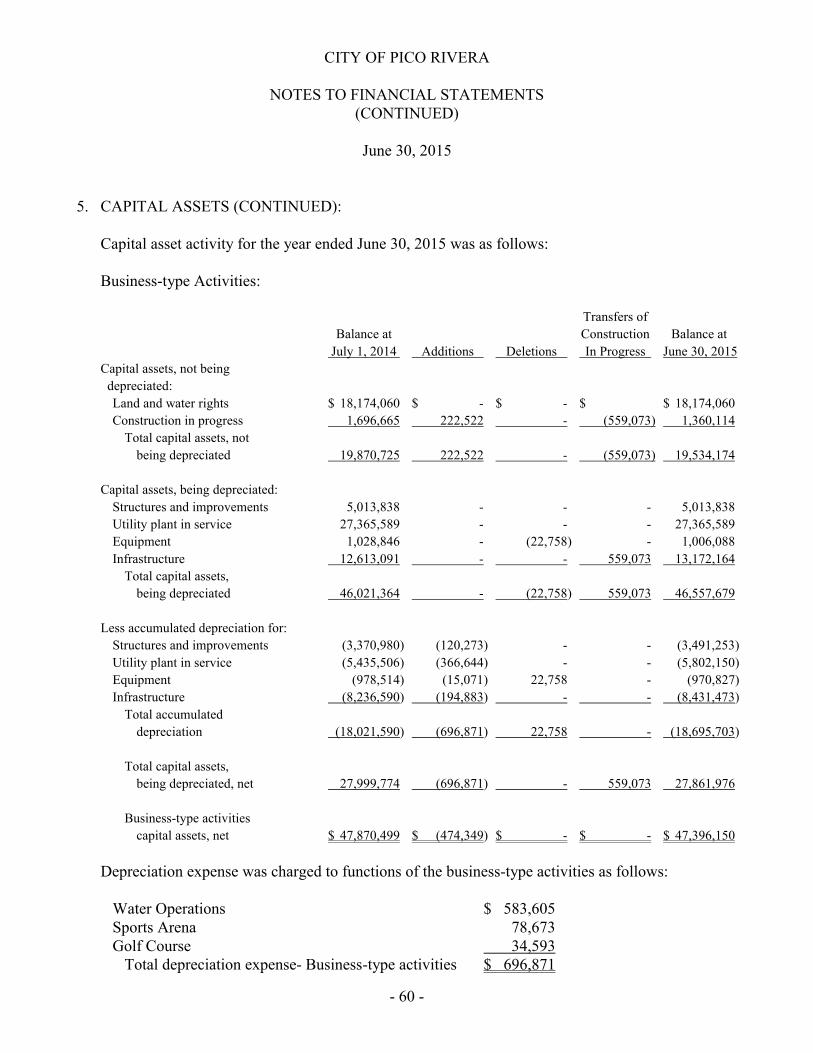
CITY OF PICO RIVERA
NOTES TO FINANCIAL STATEMENTS(CONTINUED)
June 30, 2015
- 60 -
5. CAPITAL ASSETS (CONTINUED):
Capital asset activity for the year ended June 30, 2015 was as follows:
Business-type Activities:
Transfers of
Balance at Construction Balance at
July 1, 2014 Additions Deletions In Progress June 30, 2015
Capital assets, not being
depreciated:
Land and water rights $ 18,174,060 $ - $ - $ $ 18,174,060
Construction in progress 1,696,665 222,522 - (559,073) 1,360,114
Total capital assets, not
being depreciated 19,870,725 222,522 - (559,073) 19,534,174
Capital assets, being depreciated:
Structures and improvements 5,013,838 - - - 5,013,838
Utility plant in service 27,365,589 - - - 27,365,589
Equipment 1,028,846 - (22,758) - 1,006,088
Infrastructure 12,613,091 - - 559,073 13,172,164
Total capital assets,
being depreciated 46,021,364 - (22,758) 559,073 46,557,679
Less accumulated depreciation for:
Structures and improvements (3,370,980) (120,273) - - (3,491,253)
Utility plant in service (5,435,506) (366,644) - - (5,802,150)
Equipment (978,514) (15,071) 22,758 - (970,827)
Infrastructure (8,236,590) (194,883) - - (8,431,473)
Total accumulated
depreciation (18,021,590) (696,871) 22,758 - (18,695,703)
Total capital assets,
being depreciated, net 27,999,774 (696,871) - 559,073 27,861,976
Business-type activities
capital assets, net $ 47,870,499 $ (474,349) $ - $ - $ 47,396,150
Depreciation expense was charged to functions of the business-type activities as follows:
Water Operations $ 583,605Sports Arena 78,673Golf Course 34,593
Total depreciation expense- Business-type activities $ 696,871
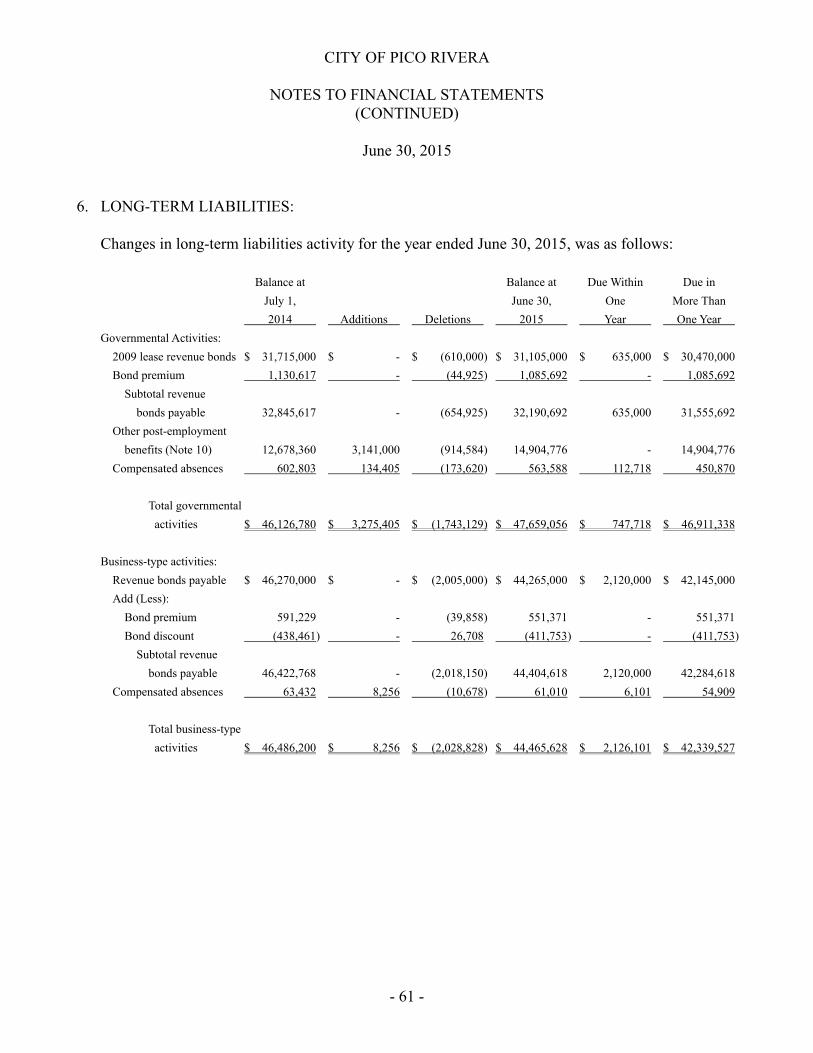
CITY OF PICO RIVERA
NOTES TO FINANCIAL STATEMENTS(CONTINUED)
June 30, 2015
- 61 -
6. LONG-TERM LIABILITIES:
Changes in long-term liabilities activity for the year ended June 30, 2015, was as follows:
Balance at Balance at Due Within Due in
July 1, June 30, One More Than
2014 Additions Deletions 2015 Year One Year
Governmental Activities:
2009 lease revenue bonds $ 31,715,000 $ - $ (610,000) $ 31,105,000 $ 635,000 $ 30,470,000
Bond premium 1,130,617 - (44,925) 1,085,692 - 1,085,692
Subtotal revenue
bonds payable 32,845,617 - (654,925) 32,190,692 635,000 31,555,692
Other post-employment
benefits (Note 10) 12,678,360 3,141,000 (914,584) 14,904,776 - 14,904,776
Compensated absences 602,803 134,405 (173,620) 563,588 112,718 450,870
Total governmental
activities $ 46,126,780 $ 3,275,405 $ (1,743,129) $ 47,659,056 $ 747,718 $ 46,911,338
Business-type activities:
Revenue bonds payable $ 46,270,000 $ - $ (2,005,000) $ 44,265,000 $ 2,120,000 $ 42,145,000
Add (Less):
Bond premium 591,229 - (39,858) 551,371 - 551,371
Bond discount (438,461) - 26,708 (411,753) - (411,753)
Subtotal revenue
bonds payable 46,422,768 - (2,018,150) 44,404,618 2,120,000 42,284,618
Compensated absences 63,432 8,256 (10,678) 61,010 6,101 54,909
Total business-type
activities $ 46,486,200 $ 8,256 $ (2,028,828) $ 44,465,628 $ 2,126,101 $ 42,339,527
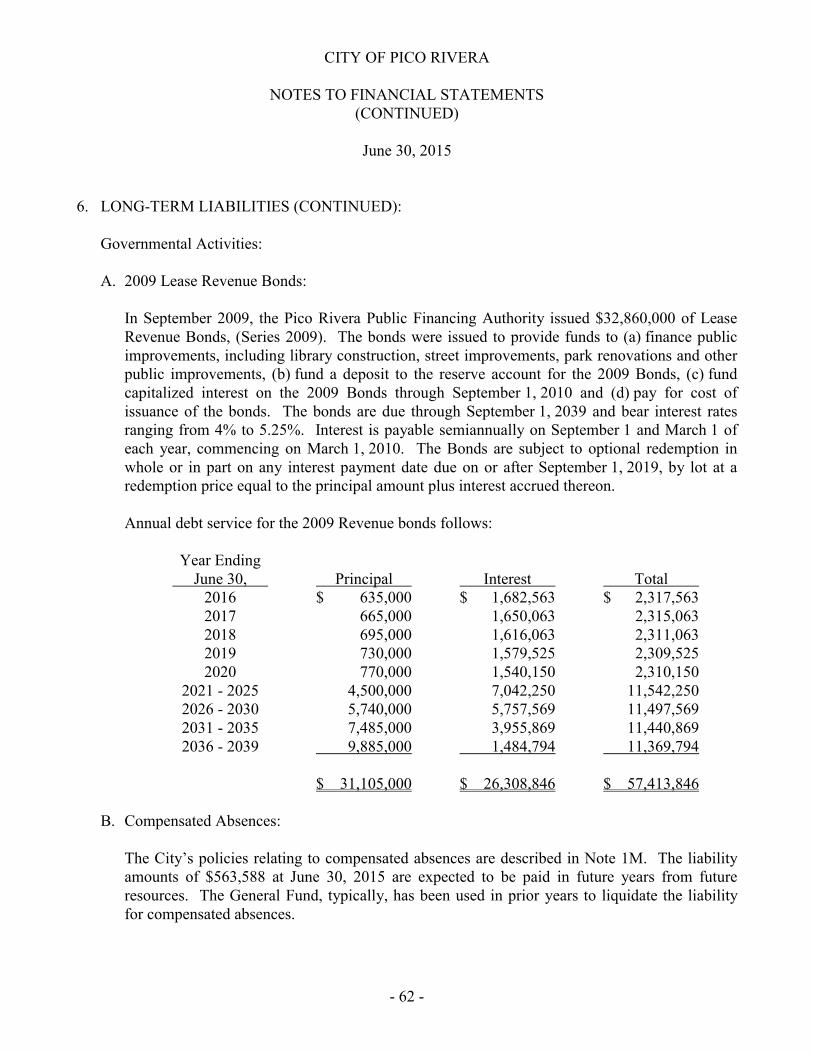
CITY OF PICO RIVERA
NOTES TO FINANCIAL STATEMENTS(CONTINUED)
June 30, 2015
- 62 -
6. LONG-TERM LIABILITIES (CONTINUED):
Governmental Activities:
A. 2009 Lease Revenue Bonds:
In September 2009, the Pico Rivera Public Financing Authority issued $32,860,000 of Lease Revenue Bonds, (Series 2009). The bonds were issued to provide funds to (a) finance public improvements, including library construction, street improvements, park renovations and other public improvements, (b) fund a deposit to the reserve account for the 2009 Bonds, (c) fund capitalized interest on the 2009 Bonds through September 1, 2010 and (d) pay for cost of issuance of the bonds. The bonds are due through September 1, 2039 and bear interest rates ranging from 4% to 5.25%. Interest is payable semiannually on September 1 and March 1 of each year, commencing on March 1, 2010. The Bonds are subject to optional redemption in whole or in part on any interest payment date due on or after September 1, 2019, by lot at a redemption price equal to the principal amount plus interest accrued thereon.
Annual debt service for the 2009 Revenue bonds follows:
Year EndingJune 30, Principal Interest Total
2016 $ 635,000 $ 1,682,563 $ 2,317,5632017 665,000 1,650,063 2,315,0632018 695,000 1,616,063 2,311,0632019 730,000 1,579,525 2,309,5252020 770,000 1,540,150 2,310,150
2021 - 2025 4,500,000 7,042,250 11,542,2502026 - 2030 5,740,000 5,757,569 11,497,5692031 - 2035 7,485,000 3,955,869 11,440,8692036 - 2039 9,885,000 1,484,794 11,369,794
$ 31,105,000 $ 26,308,846 $ 57,413,846
B. Compensated Absences:
The City’s policies relating to compensated absences are described in Note 1M. The liability amounts of $563,588 at June 30, 2015 are expected to be paid in future years from future resources. The General Fund, typically, has been used in prior years to liquidate the liability for compensated absences.
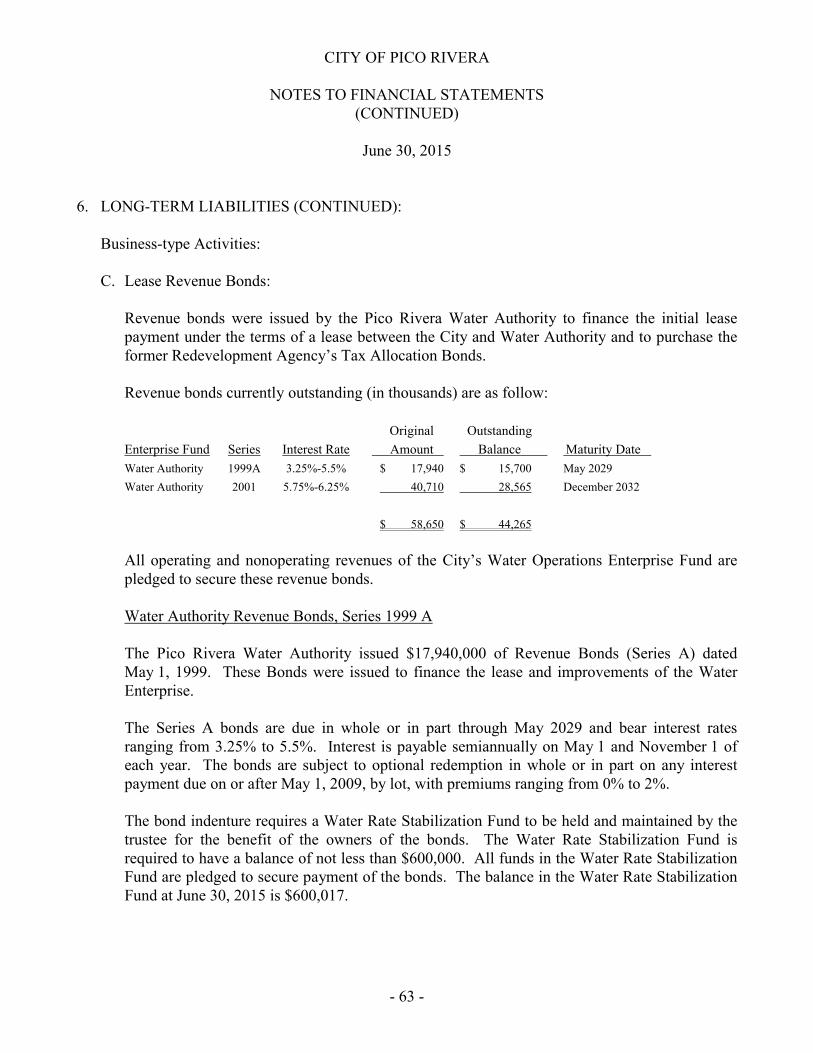
CITY OF PICO RIVERA
NOTES TO FINANCIAL STATEMENTS(CONTINUED)
June 30, 2015
- 63 -
6. LONG-TERM LIABILITIES (CONTINUED):
Business-type Activities:
C. Lease Revenue Bonds:
Revenue bonds were issued by the Pico Rivera Water Authority to finance the initial lease payment under the terms of a lease between the City and Water Authority and to purchase the former Redevelopment Agency’s Tax Allocation Bonds.
Revenue bonds currently outstanding (in thousands) are as follow:
Original Outstanding
Enterprise Fund Series Interest Rate Amount Balance Maturity Date
Water Authority 1999A 3.25%-5.5% $ 17,940 $ 15,700 May 2029
Water Authority 2001 5.75%-6.25% 40,710 28,565 December 2032
$ 58,650 $ 44,265
All operating and nonoperating revenues of the City’s Water Operations Enterprise Fund are pledged to secure these revenue bonds.
Water Authority Revenue Bonds, Series 1999 A
The Pico Rivera Water Authority issued $17,940,000 of Revenue Bonds (Series A) dated May 1, 1999. These Bonds were issued to finance the lease and improvements of the Water Enterprise.
The Series A bonds are due in whole or in part through May 2029 and bear interest ratesranging from 3.25% to 5.5%. Interest is payable semiannually on May 1 and November 1 of each year. The bonds are subject to optional redemption in whole or in part on any interest payment due on or after May 1, 2009, by lot, with premiums ranging from 0% to 2%.
The bond indenture requires a Water Rate Stabilization Fund to be held and maintained by the trustee for the benefit of the owners of the bonds. The Water Rate Stabilization Fund is required to have a balance of not less than $600,000. All funds in the Water Rate Stabilization Fund are pledged to secure payment of the bonds. The balance in the Water Rate Stabilization Fund at June 30, 2015 is $600,017.

CITY OF PICO RIVERA
NOTES TO FINANCIAL STATEMENTS(CONTINUED)
June 30, 2015
- 64 -
6. LONG-TERM LIABILITIES (CONTINUED):
Business-type Activities (Continued):
C. Lease Revenue Bonds (Continued):
Water Authority Revenue Bonds, Series 1999 A (Continued)
Annual debt service for the 1999 Series A revenue bonds follows:
Year EndingJune 30, Principal Interest Total
2016 $ 775,000 $ 863,500 $ 1,638,5002017 815,000 820,875 1,635,8752018 860,000 776,050 1,636,0502019 910,000 728,750 1,638,7502020 960,000 678,700 1,638,700
2021 - 2025 5,645,000 2,542,375 8,187,3752026 - 2029 5,735,000 809,600 6,544,600
$ 15,700,000 $ 7,219,850 $ 22,919,850
Water Authority Revenue Bonds, Series 2001
On January 30, 2001, the Water Authority issued at a $796,798 discount, $40,710,000 in Revenue Bonds, 2001 Series. Proceeds of $38,020,100 were used to purchase 2001 Tax Allocation Refunding Bonds from the former Redevelopment Agency, which in turn refunded its 1989 tax allocation bonds. The 2001 Series bonds are subject to optional redemption in whole or in part and by lot on any date on or after December 1, 2011 with premiums ranging form 0% to 2%. The bonds are due through December 1, 2032 with interest rates ranging from 5.75% to 6.25% per annum.
The bond indenture requires the Water Authority to maintain a bond reserve in the amount of $3,134,762, which includes the required Water Rate Stabilization Fund up to an amount equal to $600,000. The balance in the Reserve Account and in the Water Rate Stabilization Fund as of June 30, 2015 amounted to $2,534,558 and $599,082, respectively.
The 2001 Series revenue bond indenture also require the Water Authority to maintain rates sufficient to generate subordinate net water revenues, as defined by the bond indenture, equal to 125% of the current year’s debt service requirement. The Water Authority’s coverage ratio in fiscal year 2015 was 1.95, which is greater than the required 1.25.
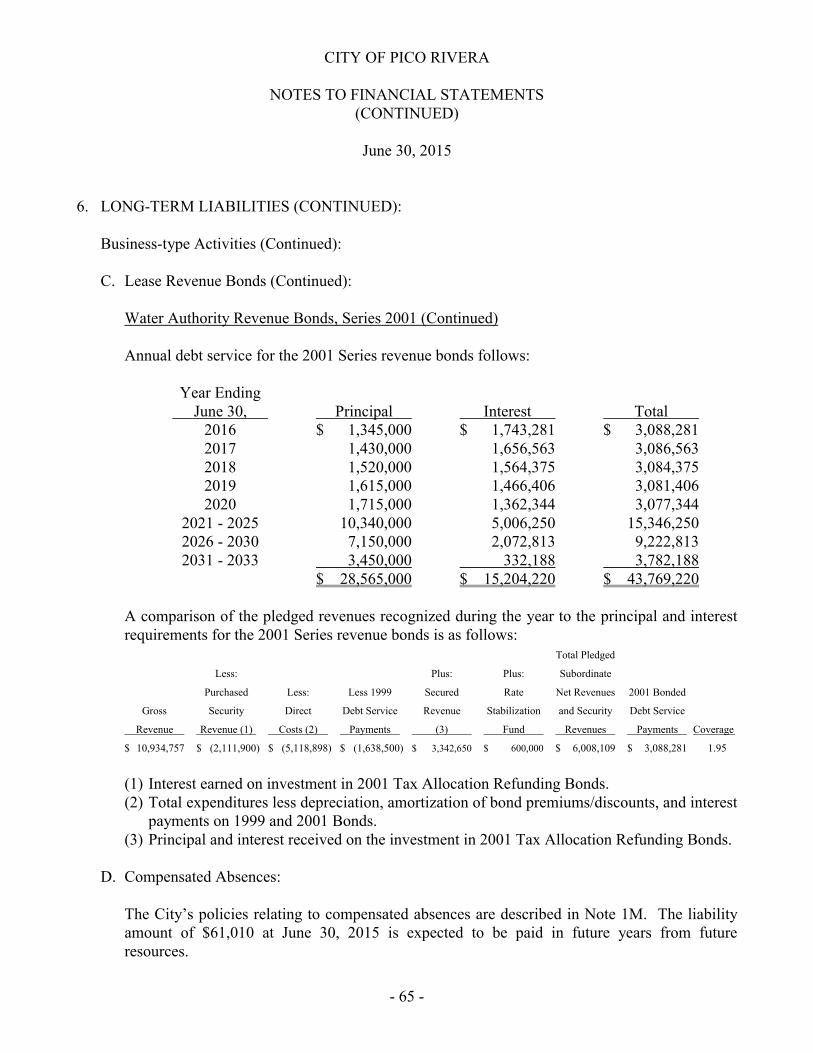
CITY OF PICO RIVERA
NOTES TO FINANCIAL STATEMENTS(CONTINUED)
June 30, 2015
- 65 -
6. LONG-TERM LIABILITIES (CONTINUED):
Business-type Activities (Continued):
C. Lease Revenue Bonds (Continued):
Water Authority Revenue Bonds, Series 2001 (Continued)
Annual debt service for the 2001 Series revenue bonds follows:
Year EndingJune 30, Principal Interest Total
2016 $ 1,345,000 $ 1,743,281 $ 3,088,2812017 1,430,000 1,656,563 3,086,5632018 1,520,000 1,564,375 3,084,3752019 1,615,000 1,466,406 3,081,4062020 1,715,000 1,362,344 3,077,344
2021 - 2025 10,340,000 5,006,250 15,346,2502026 - 2030 7,150,000 2,072,813 9,222,8132031 - 2033 3,450,000 332,188 3,782,188
$ 28,565,000 $ 15,204,220 $ 43,769,220
A comparison of the pledged revenues recognized during the year to the principal and interest requirements for the 2001 Series revenue bonds is as follows:
Total Pledged
Less: Plus: Plus: Subordinate
Purchased Less: Less 1999 Secured Rate Net Revenues 2001 Bonded
Gross Security Direct Debt Service Revenue Stabilization and Security Debt Service
Revenue Revenue (1) Costs (2) Payments (3) Fund Revenues Payments Coverage
$ 10,934,757 $ (2,111,900) $ (5,118,898) $ (1,638,500) $ 3,342,650 $ 600,000 $ 6,008,109 $ 3,088,281 1.95
(1) Interest earned on investment in 2001 Tax Allocation Refunding Bonds.(2) Total expenditures less depreciation, amortization of bond premiums/discounts, and interest
payments on 1999 and 2001 Bonds.(3) Principal and interest received on the investment in 2001 Tax Allocation Refunding Bonds.
D. Compensated Absences:
The City’s policies relating to compensated absences are described in Note 1M. The liability amount of $61,010 at June 30, 2015 is expected to be paid in future years from future resources.

CITY OF PICO RIVERA
NOTES TO FINANCIAL STATEMENTS(CONTINUED)
June 30, 2015
- 66 -
7. COMMITMENTS AND CONTINGENCIES:
A. Litigation:
Claims and suits are filed against the City in the normal course of business. Based upon information received from the City’s management, the estimated liability under any such claims would be adequately covered by deposits in a pooled insurance authority and insurance coverage. Other claims not covered by insurance involving substantial land use actions and inverse condemnation claims are not expected to have an adverse economic effect on the City.
As of June 30, 2015, $400,000 has been accrued in the general fund for estimated amounts in excess of insurance coverage
B. Grant Audit Contingencies:
Under the terms of certain grants, periodic audits are required and certain costs may bequestioned as not being appropriate expenditures under the terms of the grants. Such audits could lead to reimbursement to the grantor agencies. City management believes disallowances, if any, will be immaterial.
8. DEFINED BENEFIT PENSION PLANS:
A. General Information about the Pension Plans:
Plan Descriptions:
All qualified permanent and probationary employees are eligible to participate in the City’s Miscellaneous Plan, an agent multiple-employer defined benefit pension plan administered by the California Public Employees’ Retirement System (CalPERS), which acts as a common investment and administrative agent for its participating member employers. Benefit provisions under the Plan are established by State statute and City resolution. CalPERS issues publicly available reports that include a full description of the pension plans regarding benefit provisions, assumptions and membership information that can be found on the CalPERS website.
The City of Pico Rivera also has available a supplemental retirement benefit plan for City council members (“Council Plan”) on or after July 1, 2002. This plan is a single-employer defined benefit pension plan administered by Public Agency Retirement Services (PARS), who serves as the trustee for the Council Plan. As a result of PEPRA amendments, the City has decided to close this plan to any new council members elected or appointed on or after January 1, 2013.

CITY OF PICO RIVERA
NOTES TO FINANCIAL STATEMENTS(CONTINUED)
June 30, 2015
- 67 -
8. DEFINED BENEFIT PENSION PLANS (CONTINUED):
A. General Information about the Pension Plans (Continued):
Benefits Provided:
CalPERS provides service retirement and disability benefits, annual cost of living adjustments and death benefits to plan members, who must be public employees and beneficiaries. Benefits are based on years of credited service, equal to one year of full time employment. Members with five years of total service are eligible to retire at age 50 with statutorily reduced benefits. All members are eligible for non-duty disability benefits after 10 years of service. The death benefit is one of the following: the Basic Death Benefit, the 1957 Survivor Benefit, or the Optional Settlement 2W Death Benefit. The cost of living adjustments for each plan are applied as specified by the Public Employees’ Retirement Law.
The Council Plan provides a benefit equal to 4% of final compensation times benefit service, capped at 10 years of service. This plan is a single-employer defined benefit plan. Eligibility for these benefits is defined as reaching age 55 and completing 5 years of continuous City council service. Employees terminating employment with the City after 5 years of service but prior to age 55 will receive a deferred retirement benefit to commence at age 55.
The Plans’ provisions and benefits in effect at June 30, 2015, are summarized as follows:
On or AfterMay 9, 2012
Prior to Prior to On or AfterHire date May 9, 2012 January 1, 2013 January 1, 2013Benefit formula 2.5%@55 2%@60 2%@62Benefit vesting schedule 5 years of service 5 years of service 5 years of serviceBenefit payments monthly for life monthly for life monthly for lifeRetirement age 50 - 55 50 - 63 52 - 67Monthly benefits, as a % of eligible compensation 2.0% to 2.5% 1.092% to 2.418% 1.0% to 2.5%Required employee contribution rates 8% 7% 6.25%Required employer contribution rates 22.43% 22.43% 6.25%
Miscellaneous
Council Plan
Prior to
Hire date January 1, 2013
Benefit formula 4%@55
Benefit vesting schedule 5 years of service
Benefit payments monthly for life
Retirement age 55
Monthly benefits, as a % of eligible compensation 1.67% to 3.33%
Required employee contribution rates 0.00%
Required employer contribution rates 32.41%
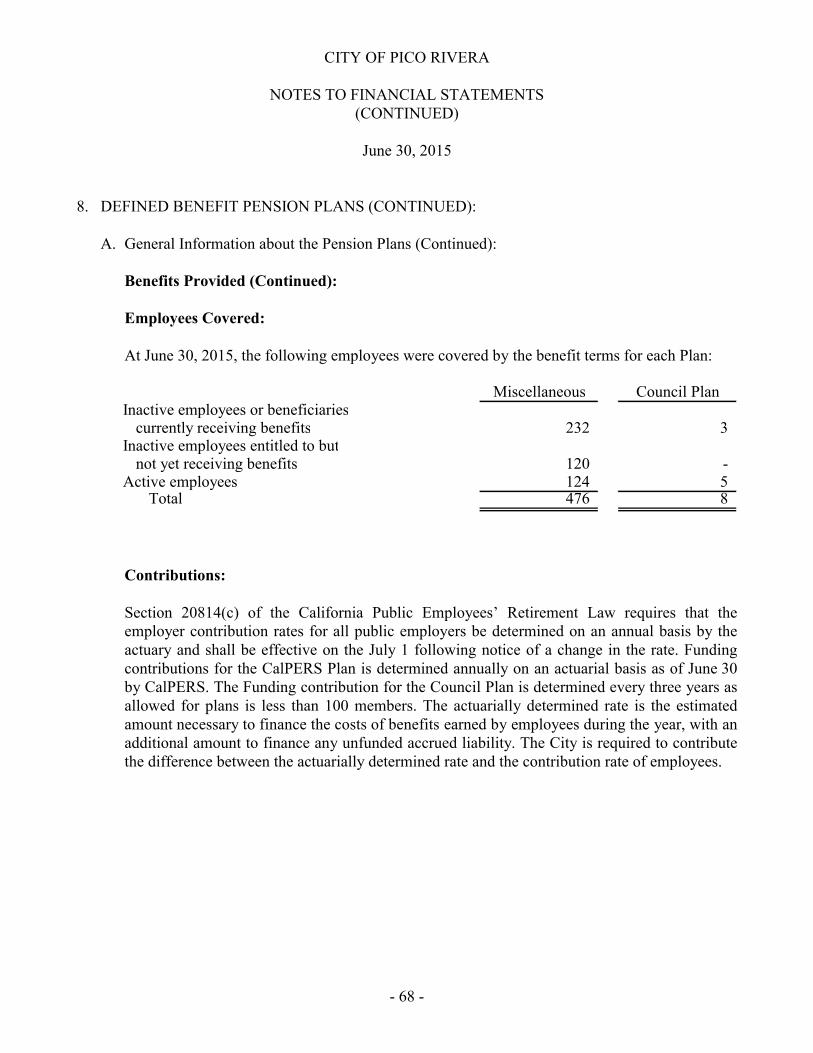
CITY OF PICO RIVERA
NOTES TO FINANCIAL STATEMENTS(CONTINUED)
June 30, 2015
- 68 -
8. DEFINED BENEFIT PENSION PLANS (CONTINUED):
A. General Information about the Pension Plans (Continued):
Benefits Provided (Continued):
Employees Covered:
At June 30, 2015, the following employees were covered by the benefit terms for each Plan:
Miscellaneous Council PlanInactive employees or beneficiaries
currently receiving benefits 232 3 Inactive employees entitled to but
not yet receiving benefits 120 - Active employees 124 5
Total 476 8
Contributions:
Section 20814(c) of the California Public Employees’ Retirement Law requires that the employer contribution rates for all public employers be determined on an annual basis by the actuary and shall be effective on the July 1 following notice of a change in the rate. Funding contributions for the CalPERS Plan is determined annually on an actuarial basis as of June 30 by CalPERS. The Funding contribution for the Council Plan is determined every three years as allowed for plans is less than 100 members. The actuarially determined rate is the estimated amount necessary to finance the costs of benefits earned by employees during the year, with an additional amount to finance any unfunded accrued liability. The City is required to contribute the difference between the actuarially determined rate and the contribution rate of employees.
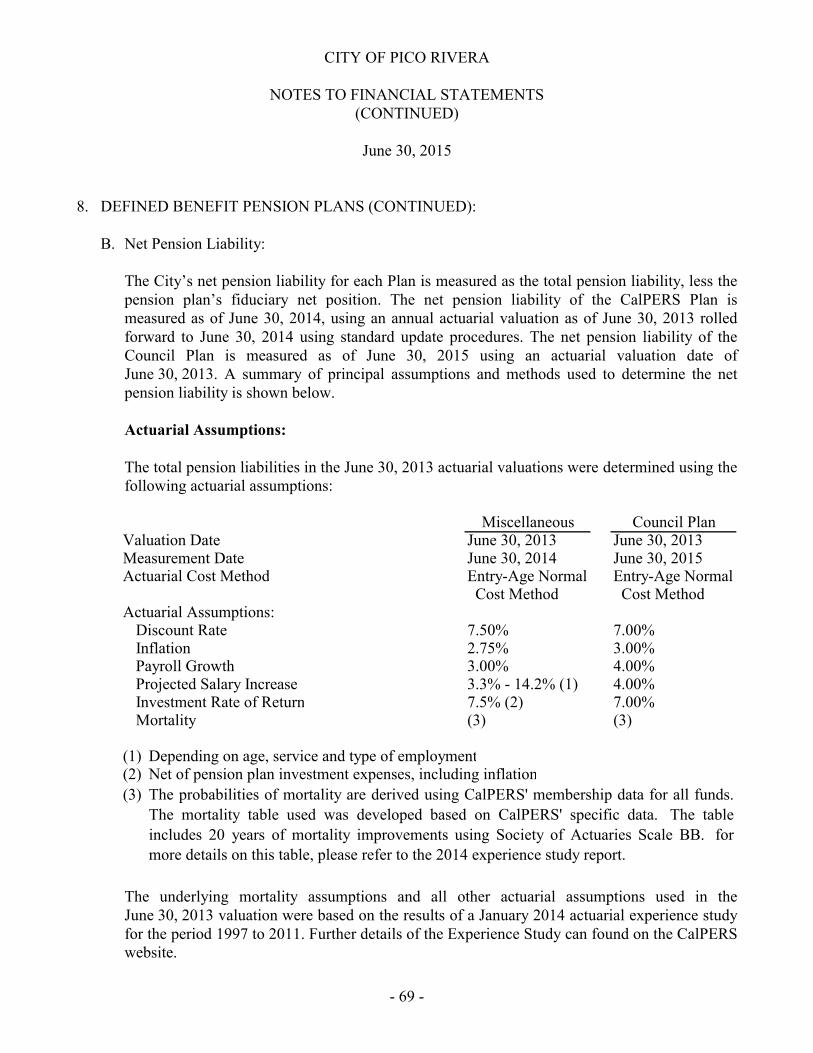
CITY OF PICO RIVERA
NOTES TO FINANCIAL STATEMENTS(CONTINUED)
June 30, 2015
- 69 -
8. DEFINED BENEFIT PENSION PLANS (CONTINUED):
B. Net Pension Liability:
The City’s net pension liability for each Plan is measured as the total pension liability, less the pension plan’s fiduciary net position. The net pension liability of the CalPERS Plan is measured as of June 30, 2014, using an annual actuarial valuation as of June 30, 2013 rolled forward to June 30, 2014 using standard update procedures. The net pension liability of the Council Plan is measured as of June 30, 2015 using an actuarial valuation date ofJune 30, 2013. A summary of principal assumptions and methods used to determine the net pension liability is shown below.
Actuarial Assumptions:
The total pension liabilities in the June 30, 2013 actuarial valuations were determined using the following actuarial assumptions:
Miscellaneous Council PlanValuation Date June 30, 2013 June 30, 2013Measurement Date June 30, 2014 June 30, 2015Actuarial Cost Method Entry-Age Normal Entry-Age Normal
Cost Method Cost MethodActuarial Assumptions:
Discount Rate 7.50% 7.00%Inflation 2.75% 3.00%Payroll Growth 3.00% 4.00%Projected Salary Increase 3.3% - 14.2% (1) 4.00%Investment Rate of Return 7.5% (2) 7.00%Mortality (3) (3)
(1) Depending on age, service and type of employment(2) Net of pension plan investment expenses, including inflation
(3) The probabilities of mortality are derived using CalPERS' membership data for all funds.
The mortality table used was developed based on CalPERS' specific data. The table
includes 20 years of mortality improvements using Society of Actuaries Scale BB. formore details on this table, please refer to the 2014 experience study report.
The underlying mortality assumptions and all other actuarial assumptions used in the June 30, 2013 valuation were based on the results of a January 2014 actuarial experience study for the period 1997 to 2011. Further details of the Experience Study can found on the CalPERS website.
CITY OF PICO RIVERA
NOTES TO FINANCIAL STATEMENTS(CONTINUED)
June 30, 2015
- 70 -
8. DEFINED BENEFIT PENSION PLANS (CONTINUED):
B. Net Pension Liability (Continued):
Discount Rate:
The discount rate used to measure the total pension liability was 7.50% for the CalPERS Plan. To determine whether the municipal bond rate should be used in the calculation of a discount rate for each plan, CalPERS stress tested plans that would most likely result in a discount rate that would be different from the actuarially assumed discount rate. Based on the testing, none of the tested plans run out of assets. Therefore, the current 7.50% discount rate is adequate and the use of the municipal bond rate calculation is not necessary. The long term expected discount rate of 7.50% will be applied to all plans in the Public Employees Retirement Fund (PERF). The stress test results are presented in a detailed report that can be obtained from the CalPERS website.
The discount rate used to measure the total pension liability was 7.00% for the Council Plan. To determine whether the municipal bond rate should be used in the calculation of a discount rate for the plan, the actuary stress tested the Council Plan. Based on the testing, the Council plan will not run out of assets. Therefore, the current 7.00% discount rate is adequate and the use of the municipal bond rate calculation is not necessary. The long term expected discount rate of 7.00% will be applied to the Council Plan.
According to Paragraph 30 of Statement 68, the long-term discount rate should be determined without reduction for pension plan administrative expense. The 7.50% investment return assumption used in the CalPERS accounting valuation is net of administrative expenses. Administrative expenses are assumed to be 15 basis points. An investment return excluding administrative expenses would have been 7.65%. Using this lower discount rate has resulted in a slightly higher Total Pension Liability and Net Pension Liability. CalPERS checked the materiality threshold for the difference in calculation and did not find it to be a material difference.
CalPERS is scheduled to review all actuarial assumptions as part of its regular Asset Liability Management (ALM) review cycle that is scheduled to be completed in February 2018. Any changes to the discount rate will require Board action and proper stakeholder outreach. For these reasons, CalPERS expects to continue using a discount rate net of administrative expenses for GASB 67 and 68 calculations through at least the 2017-18 fiscal year. CalPERS will continue to check the materiality of the difference in calculation until such time a change in methodology occurs.
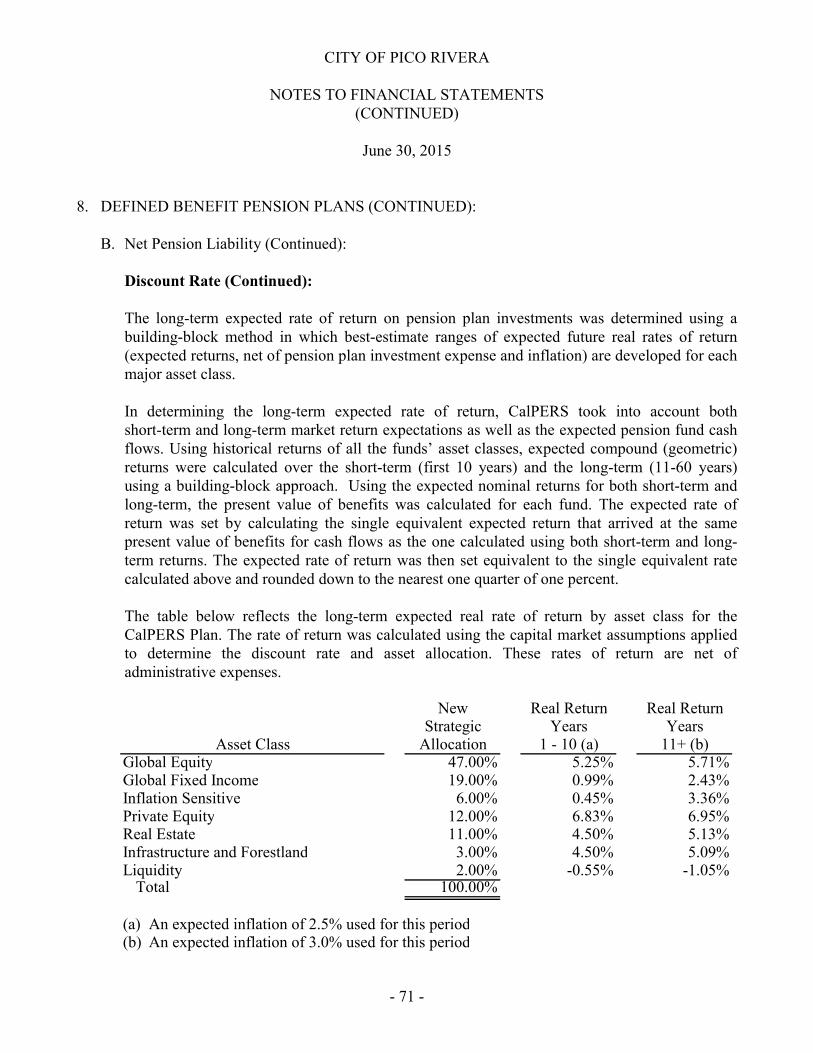
CITY OF PICO RIVERA
NOTES TO FINANCIAL STATEMENTS(CONTINUED)
June 30, 2015
- 71 -
8. DEFINED BENEFIT PENSION PLANS (CONTINUED):
B. Net Pension Liability (Continued):
Discount Rate (Continued):
The long-term expected rate of return on pension plan investments was determined using a building-block method in which best-estimate ranges of expected future real rates of return (expected returns, net of pension plan investment expense and inflation) are developed for each major asset class.
In determining the long-term expected rate of return, CalPERS took into account both short-term and long-term market return expectations as well as the expected pension fund cash flows. Using historical returns of all the funds’ asset classes, expected compound (geometric)returns were calculated over the short-term (first 10 years) and the long-term (11-60 years) using a building-block approach. Using the expected nominal returns for both short-term and long-term, the present value of benefits was calculated for each fund. The expected rate of return was set by calculating the single equivalent expected return that arrived at the same present value of benefits for cash flows as the one calculated using both short-term and long-term returns. The expected rate of return was then set equivalent to the single equivalent rate calculated above and rounded down to the nearest one quarter of one percent.
The table below reflects the long-term expected real rate of return by asset class for the CalPERS Plan. The rate of return was calculated using the capital market assumptions applied to determine the discount rate and asset allocation. These rates of return are net of administrative expenses.
New Real Return Real ReturnStrategic Years Years
Allocation 1 - 10 (a) 11+ (b)Global Equity 47.00% 5.25% 5.71%Global Fixed Income 19.00% 0.99% 2.43%Inflation Sensitive 6.00% 0.45% 3.36%Private Equity 12.00% 6.83% 6.95%Real Estate 11.00% 4.50% 5.13%Infrastructure and Forestland 3.00% 4.50% 5.09%Liquidity 2.00% -0.55% -1.05%
Total 100.00%
(a) An expected inflation of 2.5% used for this period(b) An expected inflation of 3.0% used for this period
Asset Class
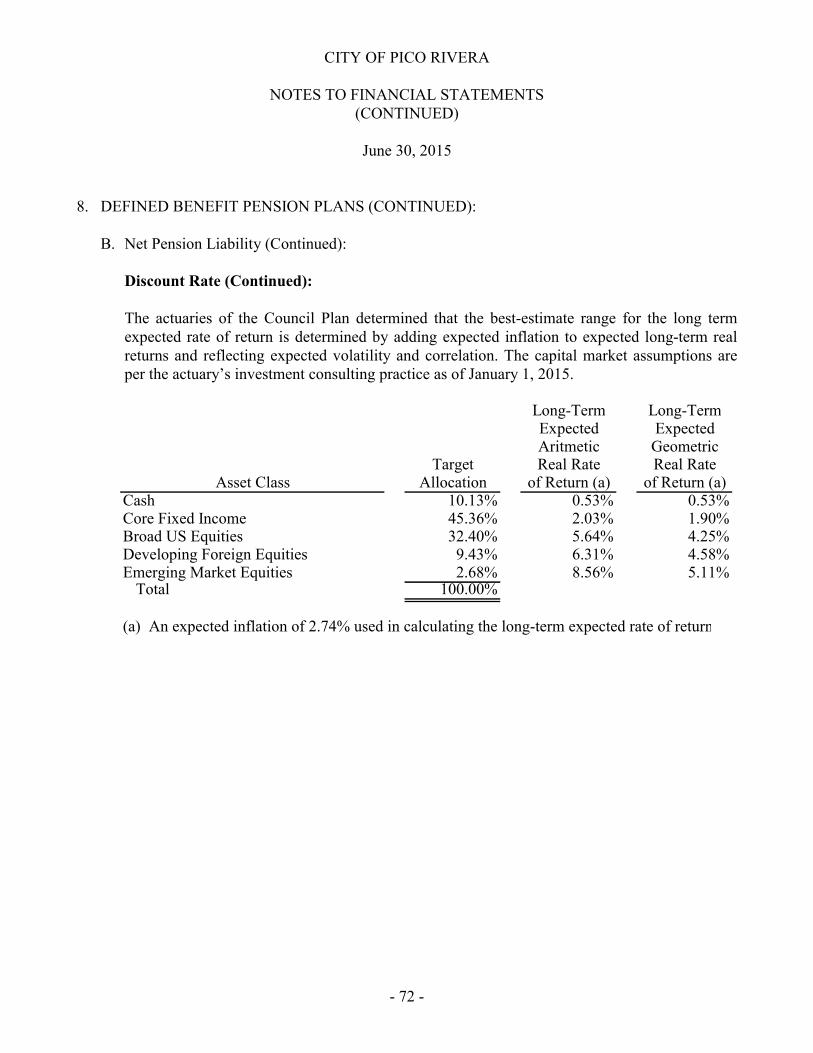
CITY OF PICO RIVERA
NOTES TO FINANCIAL STATEMENTS(CONTINUED)
June 30, 2015
- 72 -
8. DEFINED BENEFIT PENSION PLANS (CONTINUED):
B. Net Pension Liability (Continued):
Discount Rate (Continued):
The actuaries of the Council Plan determined that the best-estimate range for the long term expected rate of return is determined by adding expected inflation to expected long-term real returns and reflecting expected volatility and correlation. The capital market assumptions are per the actuary’s investment consulting practice as of January 1, 2015.
Long-Term Long-TermExpected ExpectedAritmetic Geometric
Target Real Rate Real RateAllocation of Return (a) of Return (a)
Cash 10.13% 0.53% 0.53%Core Fixed Income 45.36% 2.03% 1.90%Broad US Equities 32.40% 5.64% 4.25%Developing Foreign Equities 9.43% 6.31% 4.58%Emerging Market Equities 2.68% 8.56% 5.11%
Total 100.00%
(a) An expected inflation of 2.74% used in calculating the long-term expected rate of return
Asset Class
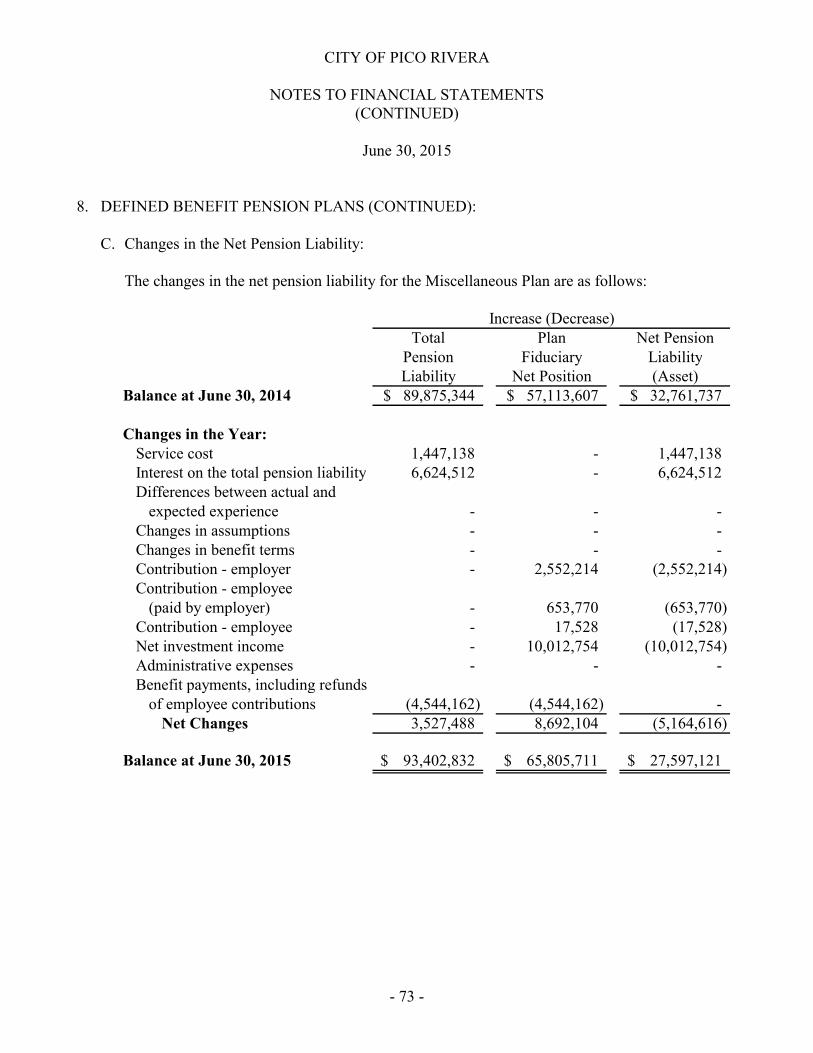
CITY OF PICO RIVERA
NOTES TO FINANCIAL STATEMENTS(CONTINUED)
June 30, 2015
- 73 -
8. DEFINED BENEFIT PENSION PLANS (CONTINUED):
C. Changes in the Net Pension Liability:
The changes in the net pension liability for the Miscellaneous Plan are as follows:
Total Plan Net PensionPension Fiduciary LiabilityLiability Net Position (Asset)
Balance at June 30, 2014 89,875,344$ 57,113,607$ 32,761,737$
Changes in the Year:Service cost 1,447,138 - 1,447,138 Interest on the total pension liability 6,624,512 - 6,624,512 Differences between actual and
expected experience - - - Changes in assumptions - - - Changes in benefit terms - - - Contribution - employer - 2,552,214 (2,552,214) Contribution - employee
(paid by employer) - 653,770 (653,770) Contribution - employee - 17,528 (17,528) Net investment income - 10,012,754 (10,012,754) Administrative expenses - - - Benefit payments, including refunds
of employee contributions (4,544,162) (4,544,162) - Net Changes 3,527,488 8,692,104 (5,164,616)
Balance at June 30, 2015 93,402,832$ 65,805,711$ 27,597,121$
Increase (Decrease)
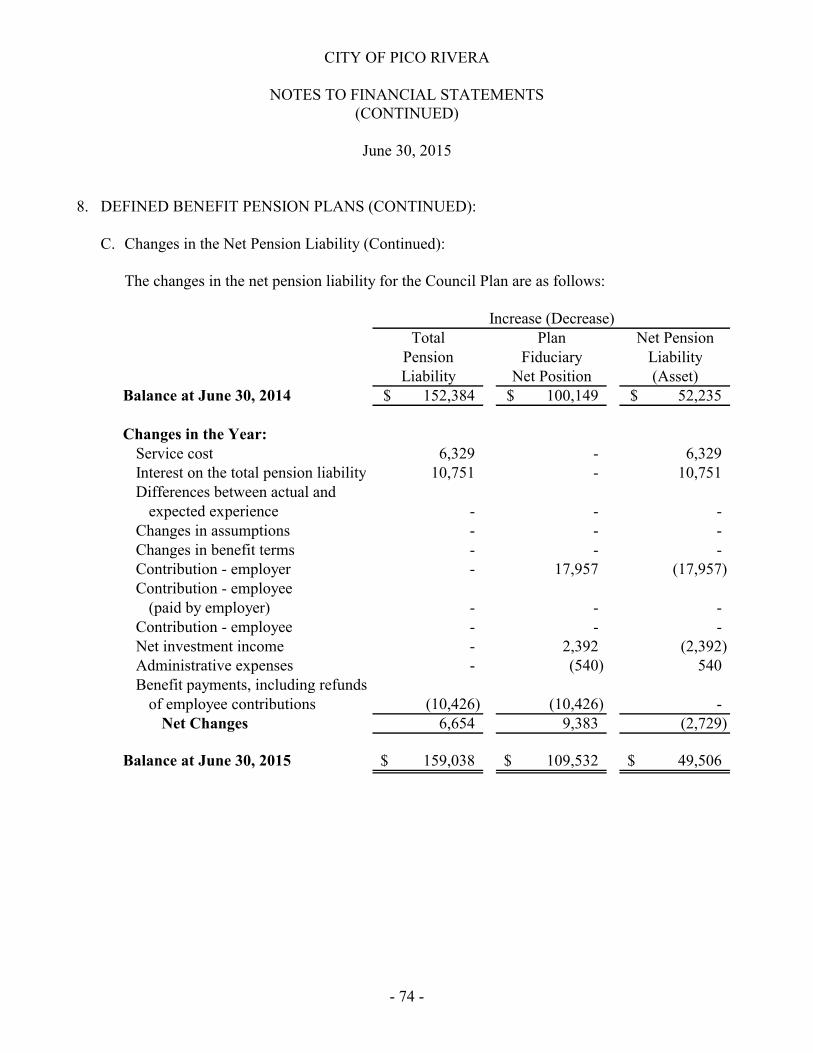
CITY OF PICO RIVERA
NOTES TO FINANCIAL STATEMENTS(CONTINUED)
June 30, 2015
- 74 -
8. DEFINED BENEFIT PENSION PLANS (CONTINUED):
C. Changes in the Net Pension Liability (Continued):
The changes in the net pension liability for the Council Plan are as follows:
Total Plan Net PensionPension Fiduciary LiabilityLiability Net Position (Asset)
Balance at June 30, 2014 152,384$ 100,149$ 52,235$
Changes in the Year:Service cost 6,329 - 6,329 Interest on the total pension liability 10,751 - 10,751 Differences between actual and
expected experience - - - Changes in assumptions - - - Changes in benefit terms - - - Contribution - employer - 17,957 (17,957) Contribution - employee
(paid by employer) - - - Contribution - employee - - - Net investment income - 2,392 (2,392) Administrative expenses - (540) 540 Benefit payments, including refunds
of employee contributions (10,426) (10,426) - Net Changes 6,654 9,383 (2,729)
Balance at June 30, 2015 159,038$ 109,532$ 49,506$
Increase (Decrease)
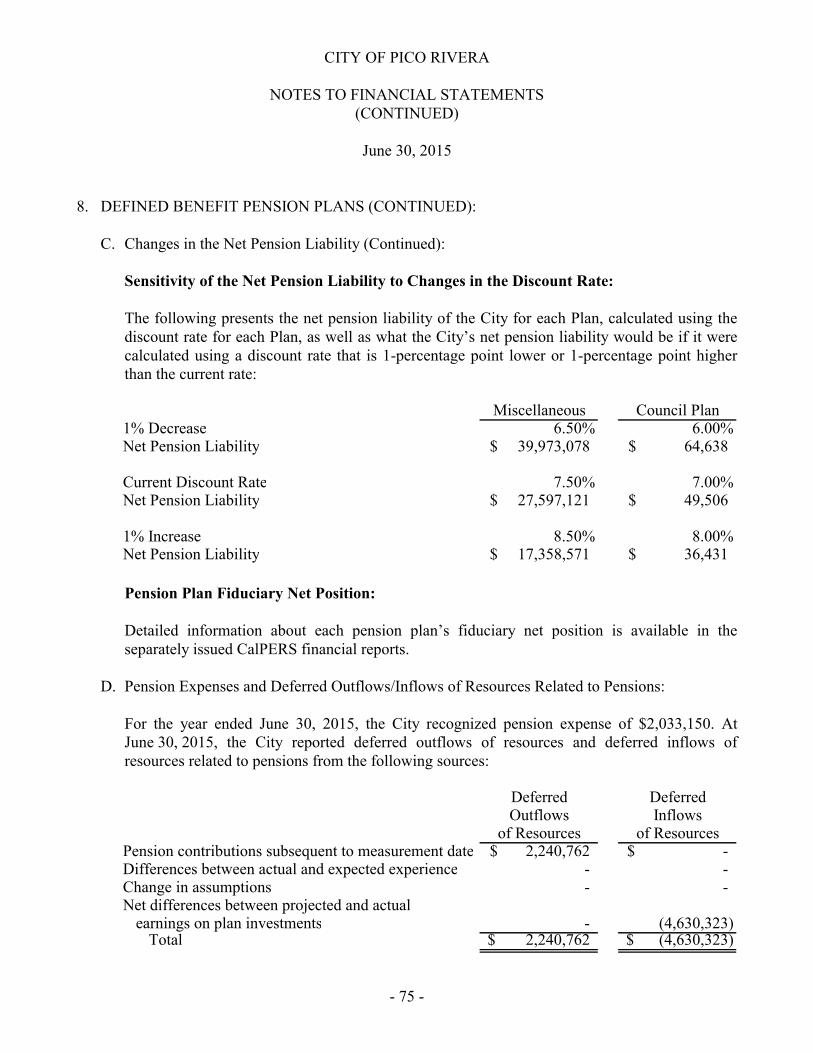
CITY OF PICO RIVERA
NOTES TO FINANCIAL STATEMENTS(CONTINUED)
June 30, 2015
- 75 -
8. DEFINED BENEFIT PENSION PLANS (CONTINUED):
C. Changes in the Net Pension Liability (Continued):
Sensitivity of the Net Pension Liability to Changes in the Discount Rate:
The following presents the net pension liability of the City for each Plan, calculated using the discount rate for each Plan, as well as what the City’s net pension liability would be if it were calculated using a discount rate that is 1-percentage point lower or 1-percentage point higher than the current rate:
Miscellaneous Council Plan1% Decrease 6.50% 6.00%Net Pension Liability 39,973,078$ 64,638$
Current Discount Rate 7.50% 7.00%Net Pension Liability 27,597,121$ 49,506$
1% Increase 8.50% 8.00%Net Pension Liability 17,358,571$ 36,431$
Pension Plan Fiduciary Net Position:
Detailed information about each pension plan’s fiduciary net position is available in the separately issued CalPERS financial reports.
D. Pension Expenses and Deferred Outflows/Inflows of Resources Related to Pensions:
For the year ended June 30, 2015, the City recognized pension expense of $2,033,150. At June 30, 2015, the City reported deferred outflows of resources and deferred inflows of resources related to pensions from the following sources:
Deferred DeferredOutflows Inflows
of Resources of ResourcesPension contributions subsequent to measurement date 2,240,762$ -$ Differences between actual and expected experience - - Change in assumptions - - Net differences between projected and actual
earnings on plan investments - (4,630,323) Total 2,240,762$ (4,630,323)$
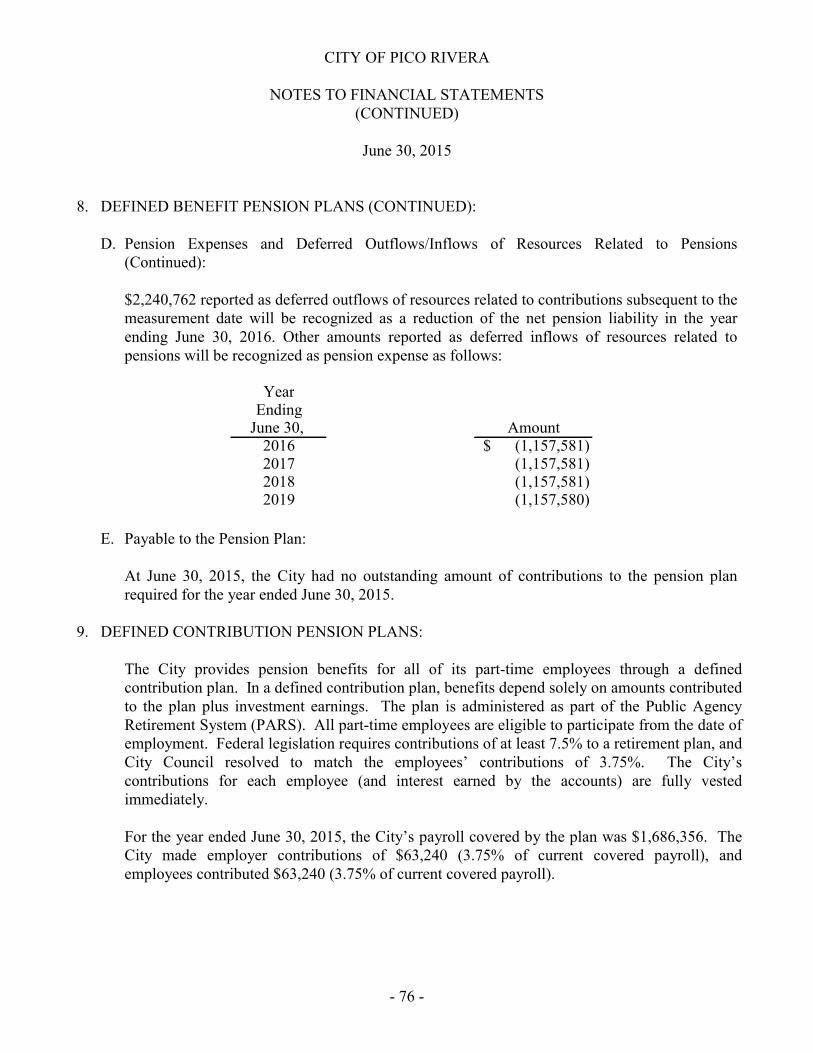
CITY OF PICO RIVERA
NOTES TO FINANCIAL STATEMENTS(CONTINUED)
June 30, 2015
- 76 -
8. DEFINED BENEFIT PENSION PLANS (CONTINUED):
D. Pension Expenses and Deferred Outflows/Inflows of Resources Related to Pensions (Continued):
$2,240,762 reported as deferred outflows of resources related to contributions subsequent to the measurement date will be recognized as a reduction of the net pension liability in the year ending June 30, 2016. Other amounts reported as deferred inflows of resources related to pensions will be recognized as pension expense as follows:
YearEnding
June 30, Amount2016 (1,157,581)$ 2017 (1,157,581) 2018 (1,157,581) 2019 (1,157,580)
E. Payable to the Pension Plan:
At June 30, 2015, the City had no outstanding amount of contributions to the pension plan required for the year ended June 30, 2015.
9. DEFINED CONTRIBUTION PENSION PLANS:
The City provides pension benefits for all of its part-time employees through a defined contribution plan. In a defined contribution plan, benefits depend solely on amounts contributed to the plan plus investment earnings. The plan is administered as part of the Public Agency Retirement System (PARS). All part-time employees are eligible to participate from the date of employment. Federal legislation requires contributions of at least 7.5% to a retirement plan, and City Council resolved to match the employees’ contributions of 3.75%. The City’s contributions for each employee (and interest earned by the accounts) are fully vested immediately.
For the year ended June 30, 2015, the City’s payroll covered by the plan was $1,686,356. The City made employer contributions of $63,240 (3.75% of current covered payroll), and employees contributed $63,240 (3.75% of current covered payroll).
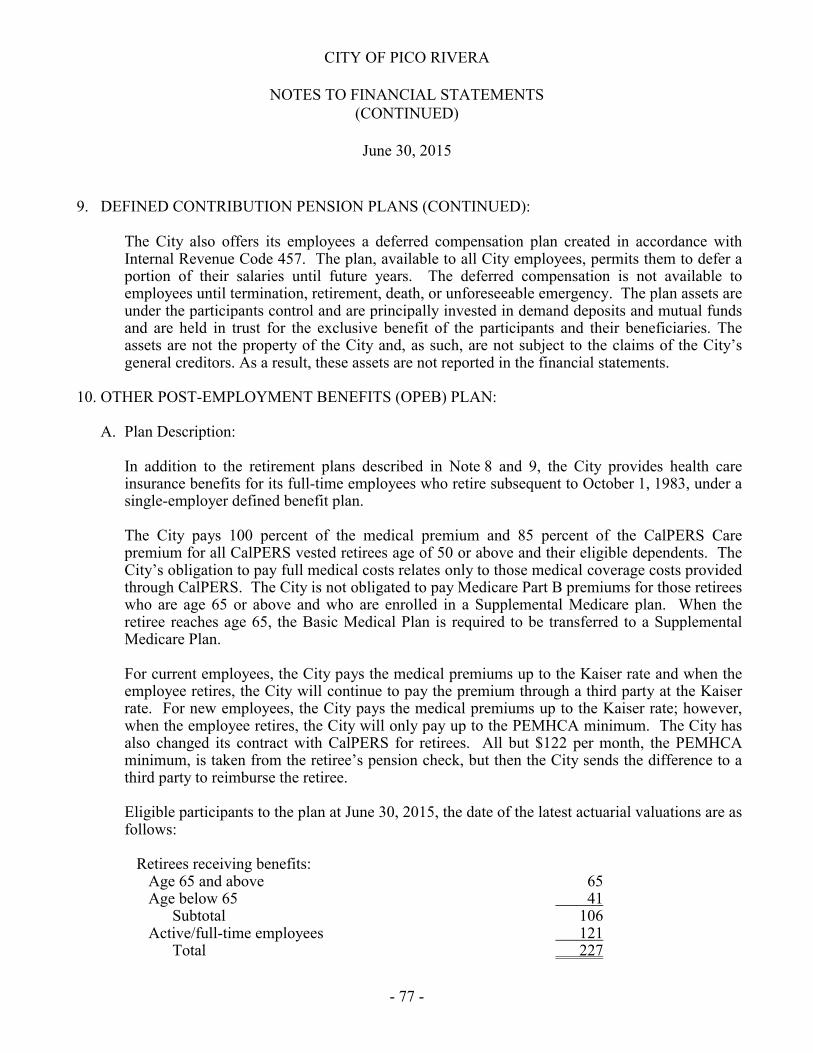
CITY OF PICO RIVERA
NOTES TO FINANCIAL STATEMENTS(CONTINUED)
June 30, 2015
- 77 -
9. DEFINED CONTRIBUTION PENSION PLANS (CONTINUED):
The City also offers its employees a deferred compensation plan created in accordance with Internal Revenue Code 457. The plan, available to all City employees, permits them to defer a portion of their salaries until future years. The deferred compensation is not available to employees until termination, retirement, death, or unforeseeable emergency. The plan assets are under the participants control and are principally invested in demand deposits and mutual funds and are held in trust for the exclusive benefit of the participants and their beneficiaries. The assets are not the property of the City and, as such, are not subject to the claims of the City’s general creditors. As a result, these assets are not reported in the financial statements.
10. OTHER POST-EMPLOYMENT BENEFITS (OPEB) PLAN:
A. Plan Description:
In addition to the retirement plans described in Note 8 and 9, the City provides health care insurance benefits for its full-time employees who retire subsequent to October 1, 1983, under a single-employer defined benefit plan.
The City pays 100 percent of the medical premium and 85 percent of the CalPERS Care premium for all CalPERS vested retirees age of 50 or above and their eligible dependents. The City’s obligation to pay full medical costs relates only to those medical coverage costs provided through CalPERS. The City is not obligated to pay Medicare Part B premiums for those retirees who are age 65 or above and who are enrolled in a Supplemental Medicare plan. When the retiree reaches age 65, the Basic Medical Plan is required to be transferred to a Supplemental Medicare Plan.
For current employees, the City pays the medical premiums up to the Kaiser rate and when the employee retires, the City will continue to pay the premium through a third party at the Kaiser rate. For new employees, the City pays the medical premiums up to the Kaiser rate; however, when the employee retires, the City will only pay up to the PEMHCA minimum. The City has also changed its contract with CalPERS for retirees. All but $122 per month, the PEMHCAminimum, is taken from the retiree’s pension check, but then the City sends the difference to a third party to reimburse the retiree.
Eligible participants to the plan at June 30, 2015, the date of the latest actuarial valuations are as follows:
Retirees receiving benefits:Age 65 and above 65Age below 65 41
Subtotal 106Active/full-time employees 121
Total 227
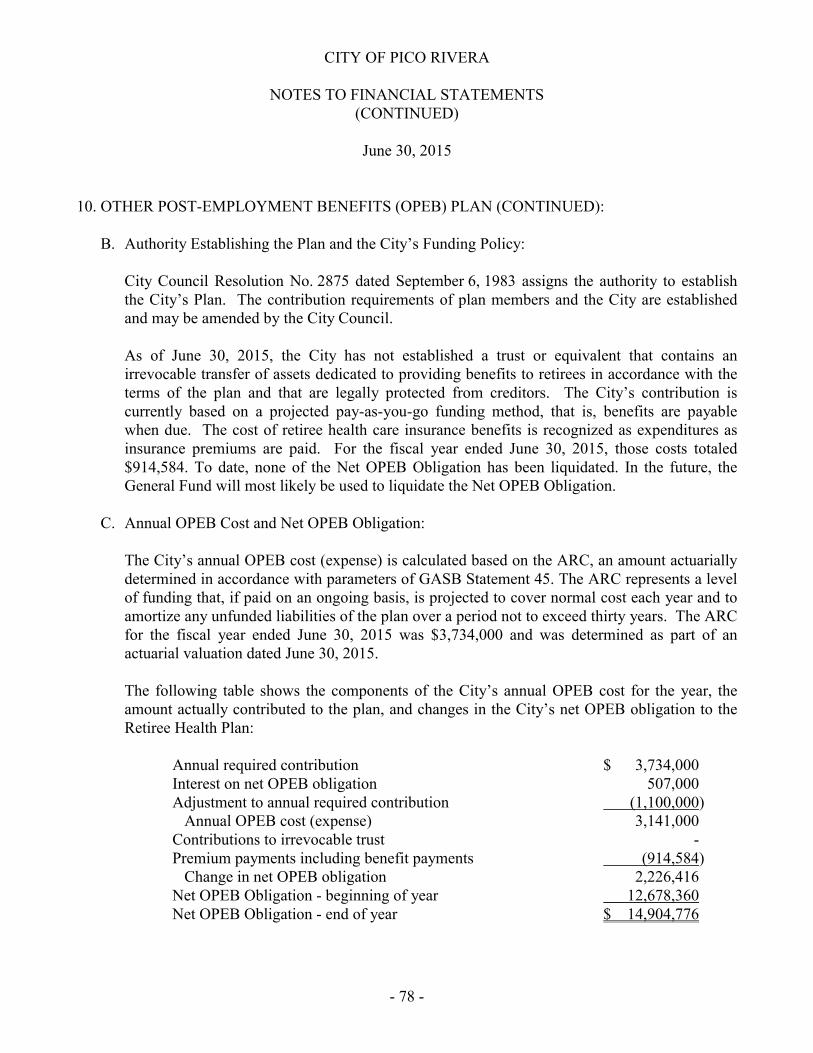
CITY OF PICO RIVERA
NOTES TO FINANCIAL STATEMENTS(CONTINUED)
June 30, 2015
- 78 -
10. OTHER POST-EMPLOYMENT BENEFITS (OPEB) PLAN (CONTINUED):
B. Authority Establishing the Plan and the City’s Funding Policy:
City Council Resolution No. 2875 dated September 6, 1983 assigns the authority to establish the City’s Plan. The contribution requirements of plan members and the City are established and may be amended by the City Council.
As of June 30, 2015, the City has not established a trust or equivalent that contains an irrevocable transfer of assets dedicated to providing benefits to retirees in accordance with the terms of the plan and that are legally protected from creditors. The City’s contribution is currently based on a projected pay-as-you-go funding method, that is, benefits are payable when due. The cost of retiree health care insurance benefits is recognized as expenditures as insurance premiums are paid. For the fiscal year ended June 30, 2015, those costs totaled$914,584. To date, none of the Net OPEB Obligation has been liquidated. In the future, the General Fund will most likely be used to liquidate the Net OPEB Obligation.
C. Annual OPEB Cost and Net OPEB Obligation:
The City’s annual OPEB cost (expense) is calculated based on the ARC, an amount actuarially determined in accordance with parameters of GASB Statement 45. The ARC represents a level of funding that, if paid on an ongoing basis, is projected to cover normal cost each year and to amortize any unfunded liabilities of the plan over a period not to exceed thirty years. The ARC for the fiscal year ended June 30, 2015 was $3,734,000 and was determined as part of an actuarial valuation dated June 30, 2015.
The following table shows the components of the City’s annual OPEB cost for the year, the amount actually contributed to the plan, and changes in the City’s net OPEB obligation to the Retiree Health Plan:
Annual required contribution $ 3,734,000Interest on net OPEB obligation 507,000Adjustment to annual required contribution (1,100,000)
Annual OPEB cost (expense) 3,141,000Contributions to irrevocable trust -Premium payments including benefit payments (914,584)
Change in net OPEB obligation 2,226,416Net OPEB Obligation - beginning of year 12,678,360Net OPEB Obligation - end of year $ 14,904,776
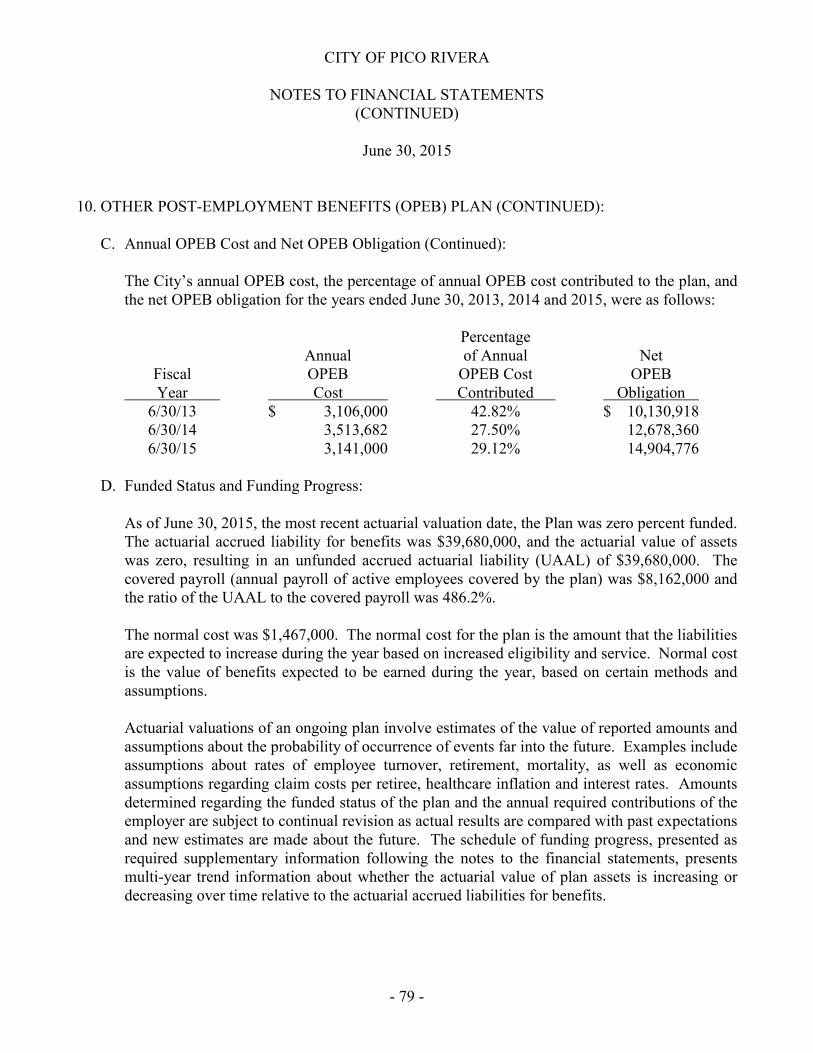
CITY OF PICO RIVERA
NOTES TO FINANCIAL STATEMENTS(CONTINUED)
June 30, 2015
- 79 -
10. OTHER POST-EMPLOYMENT BENEFITS (OPEB) PLAN (CONTINUED):
C. Annual OPEB Cost and Net OPEB Obligation (Continued):
The City’s annual OPEB cost, the percentage of annual OPEB cost contributed to the plan, and the net OPEB obligation for the years ended June 30, 2013, 2014 and 2015, were as follows:
PercentageAnnual of Annual Net
Fiscal OPEB OPEB Cost OPEBYear Cost Contributed Obligation
6/30/13 $ 3,106,000 42.82% $ 10,130,9186/30/14 3,513,682 27.50% 12,678,3606/30/15 3,141,000 29.12% 14,904,776
D. Funded Status and Funding Progress:
As of June 30, 2015, the most recent actuarial valuation date, the Plan was zero percent funded. The actuarial accrued liability for benefits was $39,680,000, and the actuarial value of assets was zero, resulting in an unfunded accrued actuarial liability (UAAL) of $39,680,000. The covered payroll (annual payroll of active employees covered by the plan) was $8,162,000 and the ratio of the UAAL to the covered payroll was 486.2%.
The normal cost was $1,467,000. The normal cost for the plan is the amount that the liabilities are expected to increase during the year based on increased eligibility and service. Normal cost is the value of benefits expected to be earned during the year, based on certain methods and assumptions.
Actuarial valuations of an ongoing plan involve estimates of the value of reported amounts and assumptions about the probability of occurrence of events far into the future. Examples include assumptions about rates of employee turnover, retirement, mortality, as well as economic assumptions regarding claim costs per retiree, healthcare inflation and interest rates. Amounts determined regarding the funded status of the plan and the annual required contributions of the employer are subject to continual revision as actual results are compared with past expectations and new estimates are made about the future. The schedule of funding progress, presented as required supplementary information following the notes to the financial statements, presents multi-year trend information about whether the actuarial value of plan assets is increasing or decreasing over time relative to the actuarial accrued liabilities for benefits.
CITY OF PICO RIVERA
NOTES TO FINANCIAL STATEMENTS(CONTINUED)
June 30, 2015
- 80 -
10. OTHER POST-EMPLOYMENT BENEFITS (OPEB) PLAN (CONTINUED):
E. Actuarial Methods and Assumptions:
Projections of benefits for financial reporting purposes are based on the substantive plan (the plan as understood by the employer and the plan members) and include the types of benefits provided at the time of each valuation and the historical pattern of sharing of benefit costs between the employer and plan members to that point. The actuarial methods and assumptions used include techniques that are designed to reduce the effects of short-term volatility in actuarial accrued liabilities and the actuarial value of assets, consistent with the long-term perspective of the calculations.
In the June 30, 2015 actuarial valuation, the entry age normal cost method was used to value liabilities. Wherever normal cost is stated, this cost method is assumed. The actuarial assumptions included a 4.00% discount rate (assuming the Plan will not be pre-funded), an annual non-Medicare eligible HMO medical cost trend rate which utilized actual premiums for 2015 and 2016 and a rate of 7.0% for 2017 (PPO rate of 7.2%) decreasing to 5.0% on year 2021, a 3% general inflation rate, and a 3.25% aggregate payroll increase. The UAAL is being amortized as a level percentage of projected payroll over 30 years on a closed group basis.
11. INSURANCE PROGRAM:
A. Description of Self-Insurance Pool Pursuant to Joint Powers Agreement:
The City is a member of the California Joint Powers Insurance Authority (Insurance Authority). The Insurance Authority is composed of 118 California public entities and is organized under a joint powers agreement pursuant to California Government Code §6500 et seq. The purpose of the Insurance Authority is to arrange and administer programs for the pooling of self-insured losses, to purchase excess insurance or reinsurance, and to arrange for group purchased insurance for property and other lines of coverage. The Insurance Authority began covering claims of its members in 1978. Each member government has an elected official as its representative on the Board of Directors. The Board operates through a nine-member Executive Committee.
B. Self-Insurance Programs of the Insurance Authority:
Each member pays an annual contribution at the beginning of the coverage period. A retrospective adjustment is then conducted annually thereafter, for coverage years 2012-13 and prior. Retrospective adjustments are scheduled to continue indefinitely on coverage years 2012-13 and prior, until all claims incurred during those coverage years are closed, on a pool-wide basis. This subsequent cost re-allocation among members, based on actual claim development, can result in adjustments of either refunds or additional deposits required.Coverage years 2013-14 and forward are not subject to routine annual retrospective adjustment.

CITY OF PICO RIVERA
NOTES TO FINANCIAL STATEMENTS(CONTINUED)
June 30, 2015
- 81 -
11. INSURANCE PROGRAM (CONTINUED):
B. Self-Insurance Programs of the Insurance Authority (Continued):
The total funding requirement for self-insurance programs is estimated using actuarial models and pre-funded through the annual contribution. Costs are allocated to individual agencies based on exposure (payroll) and experience (claims) relative to other members of the risk-sharing pool. Additional information regarding the cost allocation methodology is provided below.
Liability - In the liability program claims are pooled separately between police and general government exposures. (1) The payroll of each member is evaluated relative to the payroll of other members. A variable credibility factor is determined for each member, which establishes the weight applied to payroll and the weight applied to losses within the formula. (2) The first layer of losses includes incurred costs up to $30,000 for each occurrence and is evaluated as a percentage of the pool’s total incurred costs within the first layer. (3) The second layer of losses includes incurred costs from $30,000 to $750,000 for each occurrence and is evaluated as a percentage of the pool’s total incurred costs within the second layer. (4) Incurred costs from $750,000 to $50 million, are distributed based on the outcome of cost allocation within the first and second loss layers.
For 2014-15 the Insurance Authority’s pooled retention is $2 million per occurrence, with reinsurance to $20 million, and excess insurance to $50 million. The Insurance Authority’s reinsurance contracts are subject to the following additional pooled retentions: (a) 50% of the $2.5 million annual aggregate deductible in the $3 million x/s $2 million layer, (b) 50% quota share of the $3 million x/s $2 million layer, and (c) $3 million annual aggregate deductible in the $5 million x/s $10 million layer.
The overall coverage limit for each member, including all layers of coverage, is $50 million per occurrence. Costs of covered claims for subsidence losses have a sub-limit of $30 million per occurrence.
Workers’ Compensation - In the workers’ compensation program claims are pooled separately between public safety (police and fire) and general government exposures. (1) The payroll of each member is evaluated relative to the payroll of other members. A variable credibility factor is determined for each member, which establishes the weight applied to payroll and the weight applied to losses within the formula. (2) The first layer of losses includes incurred costs up to $50,000 for each occurrence and is evaluated as a percentage of the pool’s total incurred costs within the first layer. (3) The second layer of losses includes incurred costs from $50,000 to $100,000 for each occurrence and is evaluated as a percentage of the pool’s total incurred costs within the second layer. (4) Incurred costs from $100,000 to statutory limits are distributed based on the outcome of cost allocation within the first and second loss layers.
CITY OF PICO RIVERA
NOTES TO FINANCIAL STATEMENTS(CONTINUED)
June 30, 2015
- 82 -
11. INSURANCE PROGRAM (CONTINUED):
B. Self-Insurance Programs of the Insurance Authority (Continued):
For 2014-15 the Insurance Authority’s pooled retention is $2 million per occurrence, with reinsurance to statutory limits under California Workers’ Compensation Law.
Employer’s Liability losses are pooled among members to $2 million. Coverage from $2 million to $5 million is purchased as part of a reinsurance policy, and Employer’s Liability losses from $5 million to $10 million are pooled among members.
C. Purchased Insurance:
Pollution Legal Liability Insurance: The City of Pico Rivera participates in the pollution legal liability insurance program which is available through the Insurance Authority. The policy covers sudden and gradual pollution of scheduled property, streets, and storm drains owned by the City of Pico Rivera. Coverage is on a claims-made basis. There is a $50,000 deductible.The Insurance Authority has a limit of $50 million for the 3-year period from July 1, 2014 through July 1, 2017. Each member of the Insurance Authority has a $10 million sub-limit during the 3-year term of the policy.
Property Insurance: The City of Pico Rivera participates in the all-risk property protection program of the Insurance Authority. This insurance protection is underwritten by several insurance companies. City of Pico Rivera property is currently insured according to a schedule of covered property submitted by the City of Pico Rivera to the Insurance Authority. City of Pico Rivera property currently has all-risk property insurance protection in the amount of $42,578,411. There is a $5,000 deductible per occurrence except for non-emergency vehicle insurance which has a $1,000 deductible. Premiums for the coverage are paid annually and are not subject to retrospective adjustments.
Earthquake and Flood Insurance: The City of Pico Rivera purchases earthquake and flood insurance on a portion of its property. The earthquake insurance is part of the property protection insurance program of the Insurance Authority. City of Pico Rivera property currently has earthquake protection in the amount of $36,535,146. There is a deductible of 5% per unit of value with a minimum deductible of $100,000. Premiums for the coverage are paid annually and are not subject to retrospective adjustments.
Crime Insurance: The City of Pico Rivera purchases crime insurance coverage in the amount of $1,000,000 with a $2,500 deductible. The fidelity coverage is provided through the Insurance Authority. Premiums are paid annually and are not subject to retrospective adjustments.
CITY OF PICO RIVERA
NOTES TO FINANCIAL STATEMENTS(CONTINUED)
June 30, 2015
- 83 -
11. INSURANCE PROGRAM (CONTINUED):
E. Purchased Insurance (Continued):
Special Event Tenant User Liability Insurance: The City of Pico Rivera further protects against liability damages by requiring tenant users of certain property to purchase low-cost tenant user liability insurance for certain activities on agency property. The insurance premium is paid by the tenant user and is paid to the City of Pico Rivera according to a schedule. The City of Pico Rivera then pays for the insurance. The insurance is arranged by the Insurance Authority.
D. Adequacy of Protection:
During the past three fiscal years, none of the above programs of protection experienced settlements or judgments that exceeded pooled or insured coverage. There were also no significant reductions in pooled or insured liability coverage in 2014-15.
The aforementioned information is not included in the accompanying financial statements. Complete financial statements for the Insurance Authority may be obtained at their administrative office located at 8081 Moody Street, La Palma, California 90623.
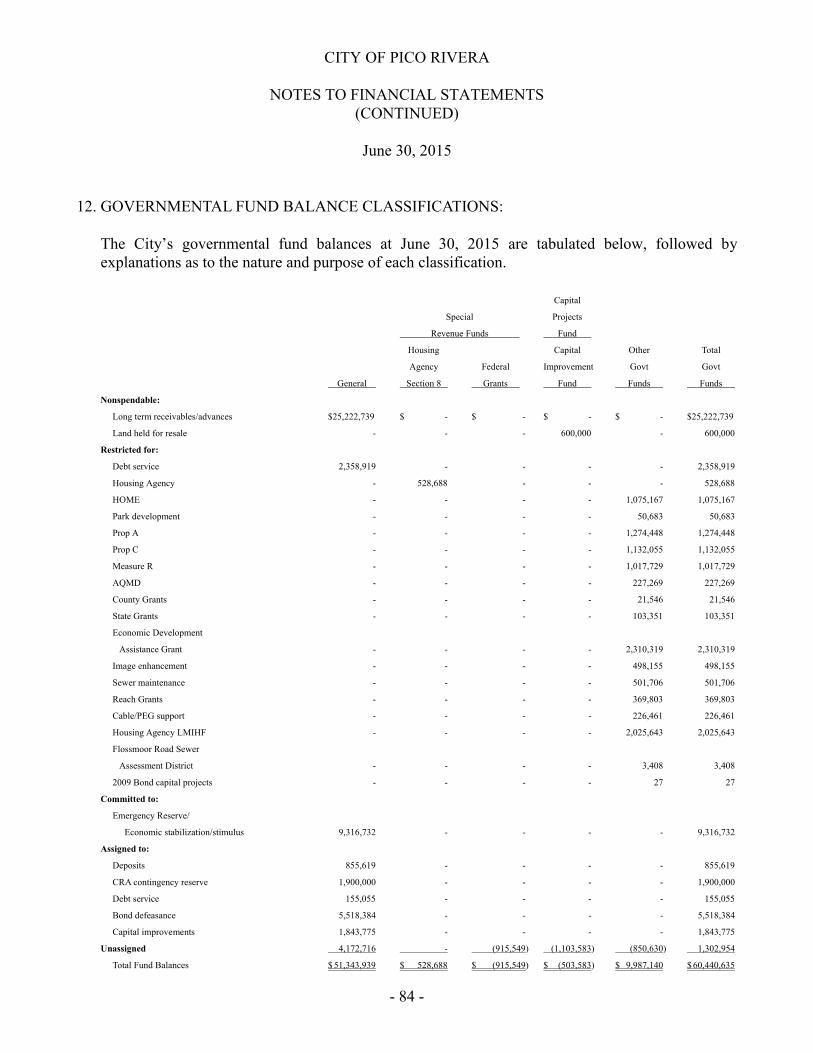
CITY OF PICO RIVERA
NOTES TO FINANCIAL STATEMENTS(CONTINUED)
June 30, 2015
- 84 -
12. GOVERNMENTAL FUND BALANCE CLASSIFICATIONS:
The City’s governmental fund balances at June 30, 2015 are tabulated below, followed by explanations as to the nature and purpose of each classification.
Capital
Special Projects
Revenue Funds Fund
Housing Capital Other Total
Agency Federal Improvement Govt Govt
General Section 8 Grants Fund Funds Funds
Nonspendable:
Long term receivables/advances $25,222,739 $ - $ - $ - $ - $25,222,739
Land held for resale - - - 600,000 - 600,000
Restricted for:
Debt service 2,358,919 - - - - 2,358,919
Housing Agency - 528,688 - - - 528,688
HOME - - - - 1,075,167 1,075,167
Park development - - - - 50,683 50,683
Prop A - - - - 1,274,448 1,274,448
Prop C - - - - 1,132,055 1,132,055
Measure R - - - - 1,017,729 1,017,729
AQMD - - - - 227,269 227,269
County Grants - - - - 21,546 21,546
State Grants - - - - 103,351 103,351
Economic Development
Assistance Grant - - - - 2,310,319 2,310,319
Image enhancement - - - - 498,155 498,155
Sewer maintenance - - - - 501,706 501,706
Reach Grants - - - - 369,803 369,803
Cable/PEG support - - - - 226,461 226,461
Housing Agency LMIHF - - - - 2,025,643 2,025,643
Flossmoor Road Sewer
Assessment District - - - - 3,408 3,408
2009 Bond capital projects - - - - 27 27
Committed to:
Emergency Reserve/
Economic stabilization/stimulus 9,316,732 - - - - 9,316,732
Assigned to:
Deposits 855,619 - - - - 855,619
CRA contingency reserve 1,900,000 - - - - 1,900,000
Debt service 155,055 - - - - 155,055
Bond defeasance 5,518,384 - - - - 5,518,384
Capital improvements 1,843,775 - - - - 1,843,775
Unassigned 4,172,716 - (915,549) (1,103,583) (850,630) 1,302,954
Total Fund Balances $ 51,343,939 $ 528,688 $ (915,549) $ (503,583) $ 9,987,140 $ 60,440,635

CITY OF PICO RIVERA
NOTES TO FINANCIAL STATEMENTS(CONTINUED)
June 30, 2015
- 85 -
12. GOVERNMENTAL FUND BALANCE CLASSIFICATIONS (CONTINUED):
A. Nonspendable Fund Balances:
Long-term receivables/advances and land held for resale cannot be spent since they are not in spendable form.
B. Committed Fund Balances:
On June 14, 2011, the City Council, as the City’s highest level of decision-making authority, committed to the following:
Emergency Reserve and Economic Stabilization/Stimulus - This commitment was set-up to be used in the unusual instance of operational budget deficits and to mitigate the effects of major economic uncertainties resulting from unforeseen changes in revenues and or/expenditures. Monies may be used at the specific direction of the City Council to:
Provide resources to make up for temporarily decreased revenues (e.g., State subventions),
provide temporary resources in the event of an economic downturn while expenditure reductions are implemented, and
provide resources to meet emergency expenditures in the case of flood, fire, earthquake, landslide, and other disasters.
The accumulated balance is targeted to be a minimum of 15% of the following year’s budgeted operating expenditures of the General Fund. Additions to this balance will be determined during each budget process to reach or maintain the target balance. Whenever monies have been used whereby the balance falls below the target, the reserve shall be replenished as soon as possible. The amount of this reserve and/or the specific uses of these monies may be changed by the Council as part of the budget process or by a resolution. The fund balance at June 30, 2015 is $9,316,732.
C. Assigned Fund Balances:
The City’s Fund Balance Policy delegates authority to the Director of Finance to assign amounts, which are neither restricted nor committed, to be used for specific purposes for annual financial statement reporting. As of June 30, 2015, the General Fund had $10,272,833 assignedto various purposes.
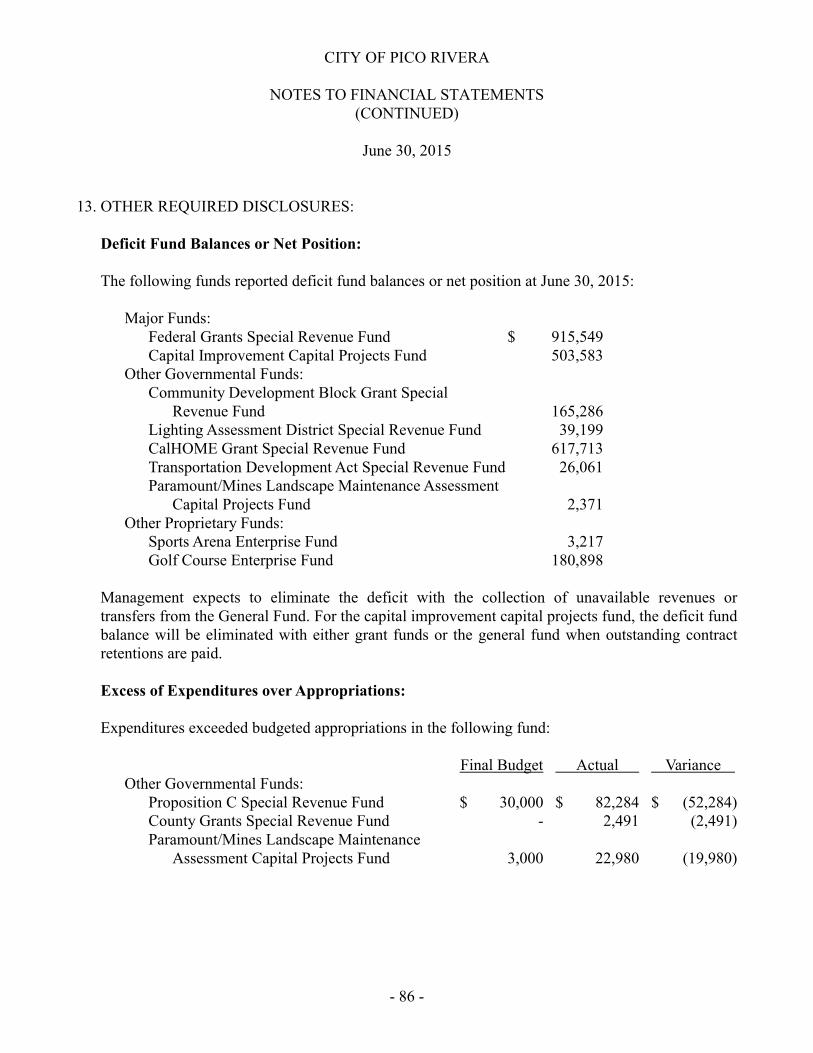
CITY OF PICO RIVERA
NOTES TO FINANCIAL STATEMENTS(CONTINUED)
June 30, 2015
- 86 -
13. OTHER REQUIRED DISCLOSURES:
Deficit Fund Balances or Net Position:
The following funds reported deficit fund balances or net position at June 30, 2015:
Major Funds:Federal Grants Special Revenue Fund $ 915,549Capital Improvement Capital Projects Fund 503,583
Other Governmental Funds:Community Development Block Grant Special
Revenue Fund 165,286Lighting Assessment District Special Revenue Fund 39,199CalHOME Grant Special Revenue Fund 617,713Transportation Development Act Special Revenue Fund 26,061Paramount/Mines Landscape Maintenance Assessment
Capital Projects Fund 2,371Other Proprietary Funds:
Sports Arena Enterprise Fund 3,217Golf Course Enterprise Fund 180,898
Management expects to eliminate the deficit with the collection of unavailable revenues or transfers from the General Fund. For the capital improvement capital projects fund, the deficit fund balance will be eliminated with either grant funds or the general fund when outstanding contract retentions are paid.
Excess of Expenditures over Appropriations:
Expenditures exceeded budgeted appropriations in the following fund:
Final Budget Actual VarianceOther Governmental Funds:
Proposition C Special Revenue Fund $ 30,000 $ 82,284 $ (52,284)County Grants Special Revenue Fund - 2,491 (2,491)Paramount/Mines Landscape Maintenance
Assessment Capital Projects Fund 3,000 22,980 (19,980)
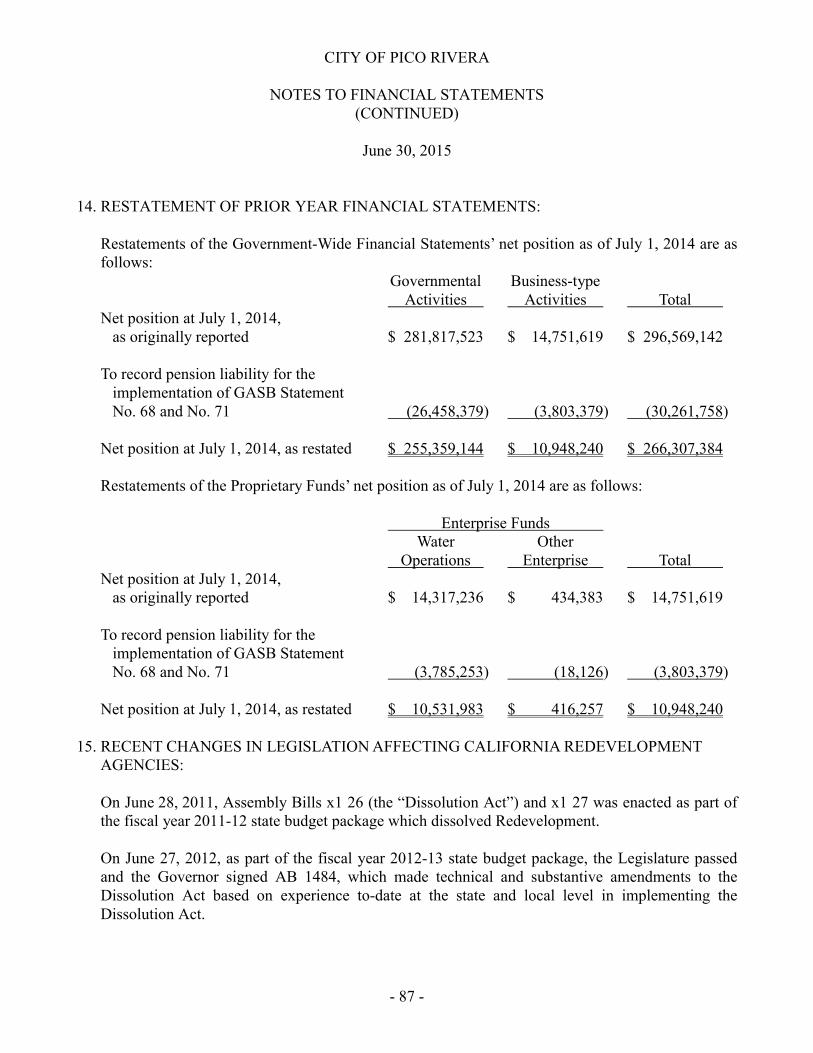
CITY OF PICO RIVERA
NOTES TO FINANCIAL STATEMENTS(CONTINUED)
June 30, 2015
- 87 -
14. RESTATEMENT OF PRIOR YEAR FINANCIAL STATEMENTS:
Restatements of the Government-Wide Financial Statements’ net position as of July 1, 2014 are as follows:
Governmental Business-typeActivities Activities Total
Net position at July 1, 2014,as originally reported $ 281,817,523 $ 14,751,619 $ 296,569,142
To record pension liability for theimplementation of GASB StatementNo. 68 and No. 71 (26,458,379) (3,803,379) (30,261,758)
Net position at July 1, 2014, as restated $ 255,359,144 $ 10,948,240 $ 266,307,384
Restatements of the Proprietary Funds’ net position as of July 1, 2014 are as follows:
Enterprise FundsWater Other
Operations Enterprise TotalNet position at July 1, 2014,
as originally reported $ 14,317,236 $ 434,383 $ 14,751,619
To record pension liability for theimplementation of GASB StatementNo. 68 and No. 71 (3,785,253) (18,126) (3,803,379)
Net position at July 1, 2014, as restated $ 10,531,983 $ 416,257 $ 10,948,240
15. RECENT CHANGES IN LEGISLATION AFFECTING CALIFORNIA REDEVELOPMENTAGENCIES:
On June 28, 2011, Assembly Bills x1 26 (the “Dissolution Act”) and x1 27 was enacted as part of the fiscal year 2011-12 state budget package which dissolved Redevelopment.
On June 27, 2012, as part of the fiscal year 2012-13 state budget package, the Legislature passed and the Governor signed AB 1484, which made technical and substantive amendments to the Dissolution Act based on experience to-date at the state and local level in implementing the Dissolution Act.
CITY OF PICO RIVERA
NOTES TO FINANCIAL STATEMENTS(CONTINUED)
June 30, 2015
- 88 -
15. RECENT CHANGES IN LEGISLATION AFFECTING CALIFORNIA REDEVELOPMENTAGENCIES (CONTINUED):
Under the Dissolution Act, each California redevelopment agency (each a “Dissolved RDA”) was dissolved as of February 1, 2012, and the sponsoring community that formed the Dissolved RDA, together with other designated entities, have initiated the process under the Dissolution Act to unwind the affairs of the Dissolved RDA. A Successor Agency was created for each Dissolved RDA which is the sponsoring community of the Dissolved RDA unless it elected not to serve as the Successor Agency. On January 10, 2012, the City became the Successor Agency of the former redevelopment agency by operation of law in accordance with the Bill.
The Dissolution Act also created oversight boards which monitor the activities of the successor agencies. The roles of the successor agencies and oversight boards is to administer the wind down of each Dissolved RDA which includes making payments due on enforceable obligations, disposing of the assets (other than housing assets) and remitting the unencumbered balances of the Dissolved RDAs to the County Auditor-Controller for distribution to the affected taxing entities.
The Dissolution Act allowed the sponsoring community that formed the Dissolved RDA to elect to assume the housing functions and take over the certain housing assets of the Dissolved RDA. If the sponsoring community does not elect to become the Successor Housing Agency and assume the Dissolved RDA’s housing functions, such housing functions and all related housing assets will be transferred to the local housing authority in the jurisdiction. AB 1484 modified and provided some clarifications on the treatment of housing assets under the Dissolution Act. The Housing Assistance Agency elected on January 27, 2012 to serve as the Housing Successor Agency.
The housing assets, obligations, and activities of the Dissolved RDA have been transferred and are reported in the Housing Agency LMIHF Special Revenue Fund in the financial statements of the City. All other assets, obligations, and activities of the Dissolved RDA have been transferred and are reported in a fiduciary fund (private-purpose trust fund) in the financial statements of the City.
The Dissolution Act and AB 1484 also establish roles for the County Auditor-Controller (CAC), the California Department of Finance (the “DOF”) and the California State Controller’s office in the dissolution process and the satisfaction of enforceable obligations of the Dissolved RDAs.
The County Auditor-Controller is charged with establishing a Redevelopment Property Tax Trust Fund (the “RPTTF”) for each Successor Agency and depositing into the RPTTF for each six-month period the amount of property taxes that would have been redevelopment property tax increment had the Dissolved RDA not been dissolved. The deposit in the RPTTF is to be used to pay to the Successor Agency the amounts due on the Successor Agency’s enforceable obligations for the upcoming six-month period.
CITY OF PICO RIVERA
NOTES TO FINANCIAL STATEMENTS(CONTINUED)
June 30, 2015
- 89 -
15. RECENT CHANGES IN LEGISLATION AFFECTING CALIFORNIA REDEVELOPMENTAGENCIES (CONTINUED):
The Successor Agency is required to prepare a recognized obligation payment schedule (the “ROPS”) approved by the oversight board setting forth the amounts due for each enforceable obligation during each six month period. The ROPS is submitted to the DOF for approval. The County Auditor-Controller will make payments to the Successor Agency from the RPTTF based on the ROPS amount approved by the DOF. The ROPS is prepared in advance for the enforceable obligations due over the next six months.
The process of making RPTTF deposits to be used to pay enforceable obligations of the Dissolved RDA will continue until all enforceable obligations have been paid in full and all non-housing assets of the Dissolved RDA have been liquidated.
As part of the dissolution process AB1484 required the Successor Agency to have due diligence reviews of both the low and moderate income housing funds and all other funds to be completed by October 15, 2012 and January 15, 2013 to compute the funds (cash) which were not needed by the Successor Agency to be retained to pay for existing enforceable obligations. These funds were to be remitted to the CAC after the DOF completed its review of the due diligence reviews. The former redevelopment agency (Successor Agency) did not have to remit any funds to the CAC as a result of the due diligence reviews.
The DOF issued a Finding of Completion on April 26, 2013 in which DOF concurred that the Successor Agency has made full payments of any payments required as a result of the due diligence reviews even though no payment was required.
The Successor Agency’s use and disposition of all properties held (Long Range Property Management Plan or LRPMP) was approved by the California Department of Finance on December 23, 2014. As a result, the Successor Agency transferred the properties designated for governmental purposes to the City in June 2015. This transfer of parkland totaling $1,059,577 is reported as a special item on the government-wide statement of activities.
Management believes, in consultation with legal counsel, that the obligations of the Dissolved RDA due to the City are valid enforceable obligations payable by the Successor Agency under the requirements of the Dissolution Act and AB 1484. The City’s position on this issue is not a position of settled law and there is considerable legal uncertainty regarding this issue. It is reasonably possible that a legal determination may be made at a later date by an appropriate judicial authority that would resolve this issue unfavorably to the City.
CITY OF PICO RIVERA
NOTES TO FINANCIAL STATEMENTS(CONTINUED)
June 30, 2015
- 90 -
16. SUCCESSOR AGENCY DISCLOSURES:
The assets and liabilities of the former Redevelopment Agency were transferred to the Successor Agency to the City of Pico Rivera Redevelopment Agency on February 1, 2012 as a result of the dissolution of the former Redevelopment Agency. The City is acting in a fiduciary capacity for the assets and liabilities. Disclosures related to these assets and liabilities are as follows:
A. Capital Assets:
Balance at Balance atJuly 1, 2014 Additions Deletions June 30, 2015
Capital assets, not being depreciated:
Land $ 1,317,600 $ - $ (1,059,577) $ 258,023Total capital assets, not
being depreciated 1,317,600 - (1,059,577) 258,023
Capital assets, being depreciated:Structures and improvements 162,237 - - 162,237Furniture and equipment 5,110 - - 5,110Infrastructure 50,615 - - 50,615
Total capital assets,being depreciated 216,962 - - 217,962
Less accumulated depreciation:Structures and improvements (106,954) (3,527) - (110,481)Furniture and equipment (5,110) - - (5,110)Infrastructure (11,142) (1,234) - (12,376)
Total accumulateddepreciation (123,206) (4,761) - (127,967)
Total capital assets,being depreciated, net 94,756 (4,761) - 89,995
Successor Agencyactivities capitalassets, net $ 1,412,356 $ (4,761) $ (1,059,577) $ 348,018
CITY OF PICO RIVERA
NOTES TO FINANCIAL STATEMENTS(CONTINUED)
June 30, 2015
- 91 -
16. SUCCESSOR AGENCY DISCLOSURES (CONTINUED):
B. Loans Receivable:
Two low-interest loans were issued by the former Pico Rivera Redevelopment Agency for a commercial rehabilitation project. The loans bear interest rates from 1% to 3% and payments on these loans are to begin in ten to twenty-six years from the date of the loan. The amount of the loans outstanding at June 30, 2015 is $397,766.
C. Payable To The City of Pico Rivera:
(1) The City had an agreement with the former Redevelopment Agency providing for the advance of funds to finance improvements and operations relating to and within the former Redevelopment Agency’s project areas. The former Redevelopment Agency had been accruing interest on the original advances at a rate of 12% per annum, which were adjusted retroactively to 7% in fiscal year 2011-12. In fiscal year 2012-13, the Department of Finance ruled that the rate for which interest was accrued on advances to the former Redevelopment Agencies could not exceed effective LAIF rates. Therefore, the City retroactively recalculated interest using existing LAIF rates. As a result, the balance of the advance was written down by $3,916,128 during fiscal year 2012-13. At June 30, 2015, the net advance balance was $17,108,269 which included accrued interest of $7,945,699 and a 25% reserve against this balance totaling $4,277,068 due to the estimated collectability by the General Fund as a result of the winding down of the affairs of the former Redevelopment Agency.
(2) Sales Tax Loan from City:
The City and former Redevelopment Agency entered into an agreement whereby the City will defer its portion of sales tax revenues (City Deferrals) generated within the project area and advance the monies to the former Redevelopment Agency, to allow the former Redevelopment Agency to meet its debt service obligations. The former Redevelopment Agency had been accruing interest on the original deferrals at a rate of 7%. In fiscal year 2012-13, the Department of Finance ruled that the rate for which interest was accrued on advances to the former Redevelopment Agencies could not exceed effective LAIF rates.Therefore, the City retroactively recalculated interest using existing LAIF rates. As a result, the balance of the advance was written down by $6,463,413 during fiscal year 2012-13. At June 30, 2015, the balance of the City Deferrals including interest was $27,457,605.
CITY OF PICO RIVERA
NOTES TO FINANCIAL STATEMENTS(CONTINUED)
June 30, 2015
- 92 -
16. SUCCESSOR AGENCY DISCLOSURES (CONTINUED):
C. Payable To The City of Pico Rivera (Continued):
(2) Sales Tax Loan from City (Continued):
In previous years, the Sales Tax Loan from the City was reported as a commitment with the interest rate and outstanding balance described in the footnotes, but the Sales Tax Loan was not recorded as a liability in the financial statements due to uncertainty as to the City's intent to enforce collection. In March 2011, the City Council took action and approved a resolution acknowledging the receivable owed by the former Redevelopment Agency and affirming the City's willingness to enforce collection of the amount. Accordingly, the liability of $27,457,605 has been recorded in the statement of fiduciary net position. Under the terms of the agreement, payments are to be made by the Successor Agency to the City to the extent money is available. Due to the payment terms, the long-term nature of the loan, and management’s expectation that repayment will not begin for some time, the City has fully reserved against the receivable on the statement of net position.
AB 1484 specifies the actions to be taken and the method of repayment for advances and loans between the Successor Agency and the City and Water Authority. Upon application and approval by the Successor Agency and approval by the oversight board, loan agreements (advances) entered into by former Redevelopment Agency and the City shall be deemed to be enforceable obligations provided that the oversight board makes a finding that the advances were for legitimate redevelopment purposes.
The advances are to be repaid with a defined schedule over a reasonable term of years at an interest rate not to exceed the interest rate earned by the funds deposited into the Local Agency Investment Fund. The annual advance repayments are subject to certain limitations including the requirement that 20% of all advance repayments are to be transferred to the Housing Agency Low and Moderate Income Housing Special Revenue Fund to fund Housing Successor Agency activity. Additionally, repayments are subject to a formula distribution, and have a lower priority for repayment as described in AB 1484 (Health and Safety Code Section 34191.4(2)(A). Management believes, in consultation with legal counsel, that the obligations of the Dissolved RDA due to the City are valid enforceable obligations payable by the Successor Agency under the requirements of the Dissolution Act and AB 1484. The City’s position on this issue is not a position of settled law and there is considerable legal uncertainty regarding this issue. It is reasonably possible that a legal determination may be made at a later date by an appropriate judicial authority that would not be in favor of the City.
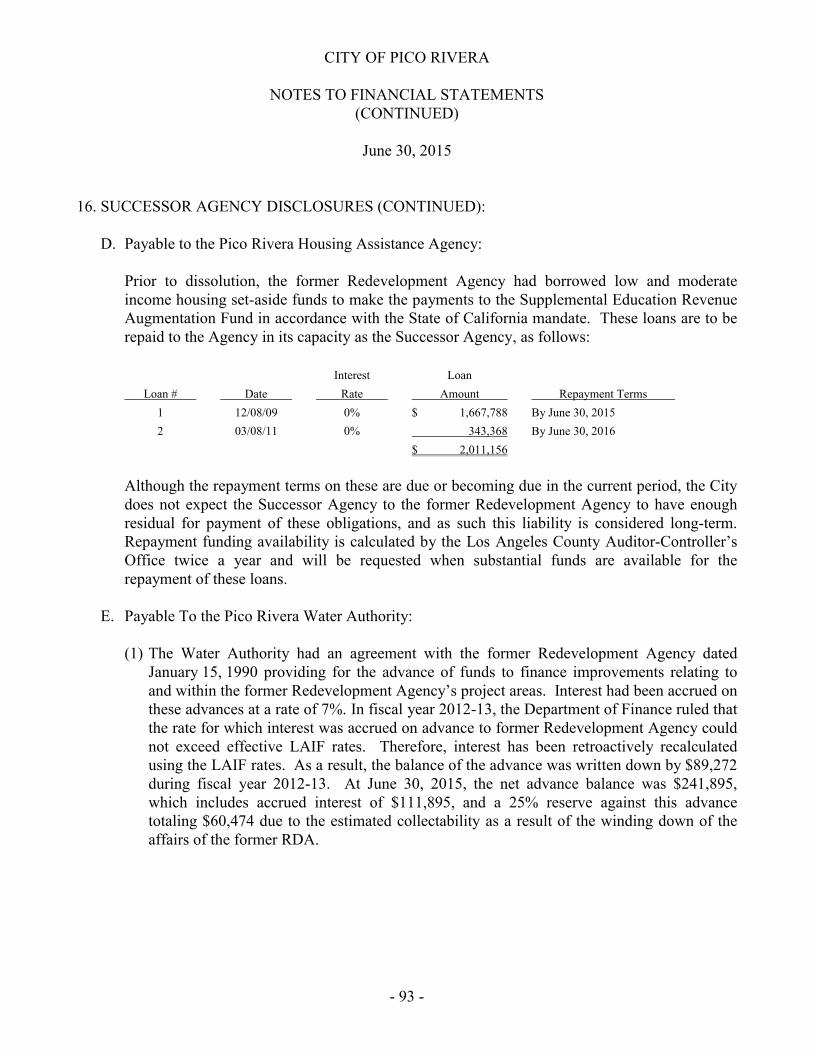
CITY OF PICO RIVERA
NOTES TO FINANCIAL STATEMENTS(CONTINUED)
June 30, 2015
- 93 -
16. SUCCESSOR AGENCY DISCLOSURES (CONTINUED):
D. Payable to the Pico Rivera Housing Assistance Agency:
Prior to dissolution, the former Redevelopment Agency had borrowed low and moderate income housing set-aside funds to make the payments to the Supplemental Education Revenue Augmentation Fund in accordance with the State of California mandate. These loans are to be repaid to the Agency in its capacity as the Successor Agency, as follows:
Interest Loan
Loan # Date Rate Amount Repayment Terms
1 12/08/09 0% $ 1,667,788 By June 30, 2015
2 03/08/11 0% 343,368 By June 30, 2016
$ 2,011,156
Although the repayment terms on these are due or becoming due in the current period, the City does not expect the Successor Agency to the former Redevelopment Agency to have enough residual for payment of these obligations, and as such this liability is considered long-term.Repayment funding availability is calculated by the Los Angeles County Auditor-Controller’s Office twice a year and will be requested when substantial funds are available for the repayment of these loans.
E. Payable To the Pico Rivera Water Authority:
(1) The Water Authority had an agreement with the former Redevelopment Agency dated January 15, 1990 providing for the advance of funds to finance improvements relating to and within the former Redevelopment Agency’s project areas. Interest had been accrued on these advances at a rate of 7%. In fiscal year 2012-13, the Department of Finance ruled that the rate for which interest was accrued on advance to former Redevelopment Agency could not exceed effective LAIF rates. Therefore, interest has been retroactively recalculated using the LAIF rates. As a result, the balance of the advance was written down by $89,272during fiscal year 2012-13. At June 30, 2015, the net advance balance was $241,895, which includes accrued interest of $111,895, and a 25% reserve against this advance totaling $60,474 due to the estimated collectability as a result of the winding down of the affairs of the former RDA.
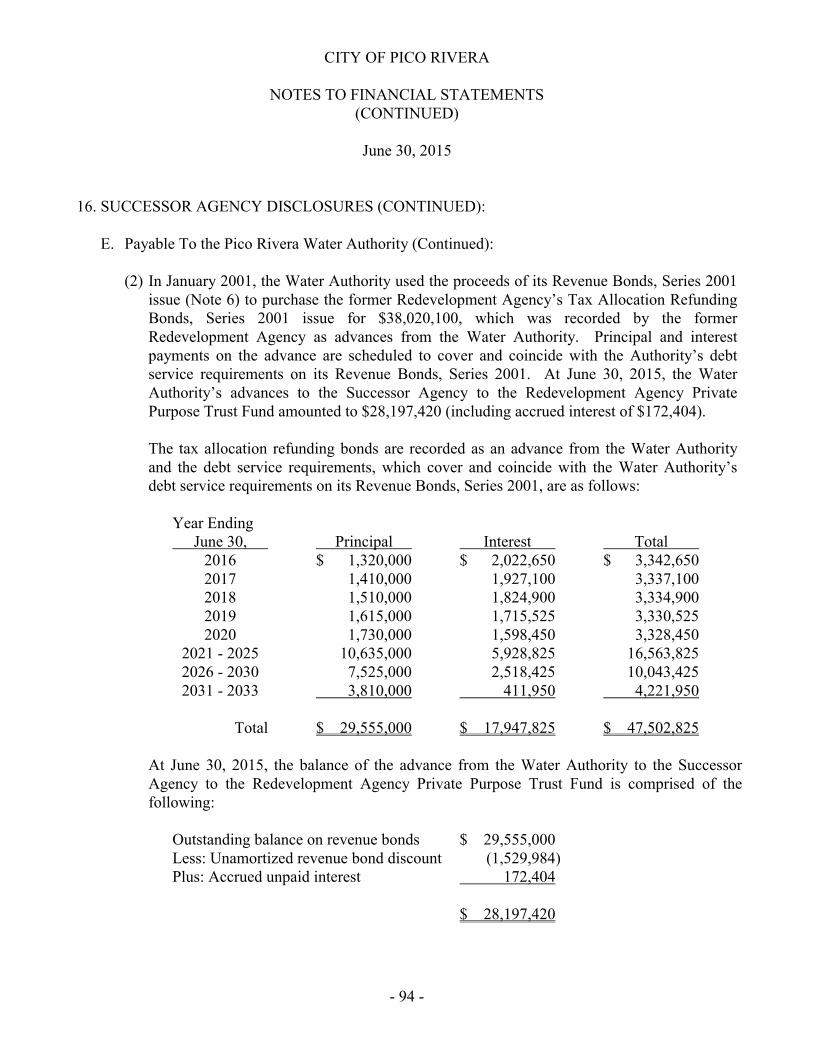
CITY OF PICO RIVERA
NOTES TO FINANCIAL STATEMENTS(CONTINUED)
June 30, 2015
- 94 -
16. SUCCESSOR AGENCY DISCLOSURES (CONTINUED):
E. Payable To the Pico Rivera Water Authority (Continued):
(2) In January 2001, the Water Authority used the proceeds of its Revenue Bonds, Series 2001 issue (Note 6) to purchase the former Redevelopment Agency’s Tax Allocation Refunding Bonds, Series 2001 issue for $38,020,100, which was recorded by the former Redevelopment Agency as advances from the Water Authority. Principal and interest payments on the advance are scheduled to cover and coincide with the Authority’s debt service requirements on its Revenue Bonds, Series 2001. At June 30, 2015, the Water Authority’s advances to the Successor Agency to the Redevelopment Agency Private Purpose Trust Fund amounted to $28,197,420 (including accrued interest of $172,404).
The tax allocation refunding bonds are recorded as an advance from the Water Authority and the debt service requirements, which cover and coincide with the Water Authority’s debt service requirements on its Revenue Bonds, Series 2001, are as follows:
Year EndingJune 30, Principal Interest Total
2016 $ 1,320,000 $ 2,022,650 $ 3,342,6502017 1,410,000 1,927,100 3,337,1002018 1,510,000 1,824,900 3,334,9002019 1,615,000 1,715,525 3,330,5252020 1,730,000 1,598,450 3,328,450
2021 - 2025 10,635,000 5,928,825 16,563,8252026 - 2030 7,525,000 2,518,425 10,043,4252031 - 2033 3,810,000 411,950 4,221,950
Total $ 29,555,000 $ 17,947,825 $ 47,502,825
At June 30, 2015, the balance of the advance from the Water Authority to the Successor Agency to the Redevelopment Agency Private Purpose Trust Fund is comprised of the following:
Outstanding balance on revenue bonds $ 29,555,000Less: Unamortized revenue bond discount (1,529,984)Plus: Accrued unpaid interest 172,404
$ 28,197,420
CITY OF PICO RIVERA
NOTES TO FINANCIAL STATEMENTS(CONTINUED)
June 30, 2015
- 95 -
16. SUCCESSOR AGENCY DISCLOSURES (CONTINUED):
F. Payable to County of Los Angeles:
County Deferral:
The former Redevelopment Agency and County entered into an agreement whereby the County will defer their share of tax increment (County Deferral) generated within the project area and remit it to the Successor Agency to meet the former Redevelopment Agency’s debt service obligations. The County Deferral accrues simple interest of equal to 5% of the current year’s annual deferral amount. After that no additional interest accrues. The County Deferral is to be repaid with the excess of property tax revenues received by the Successor Agency in excess of its debt payment requirements. The County Deferral is recorded as revenue when received. At June 30, 2015, the balance of the County Deferral including interest was $39,867,675. There is no fixed payment schedule for the repayment of the County Deferral.
17. SUBSEQUENT EVENTS:
The City has evaluated events subsequent to June 30, 2015 to assess the need for potential recognition or disclosure in the financial statements. Such events were evaluated throughJanuary 21, 2016, the date the financial statements were available to be issued. Based upon this evaluation, it was determined that no subsequent events occurred that require recognition or additional disclosure in the financial statements.

- 96 -
This page intentionally left blank.

- 97 -
CITY OF PICO RIVERA
REQUIRED SUPPLEMENTARY INFORMATION
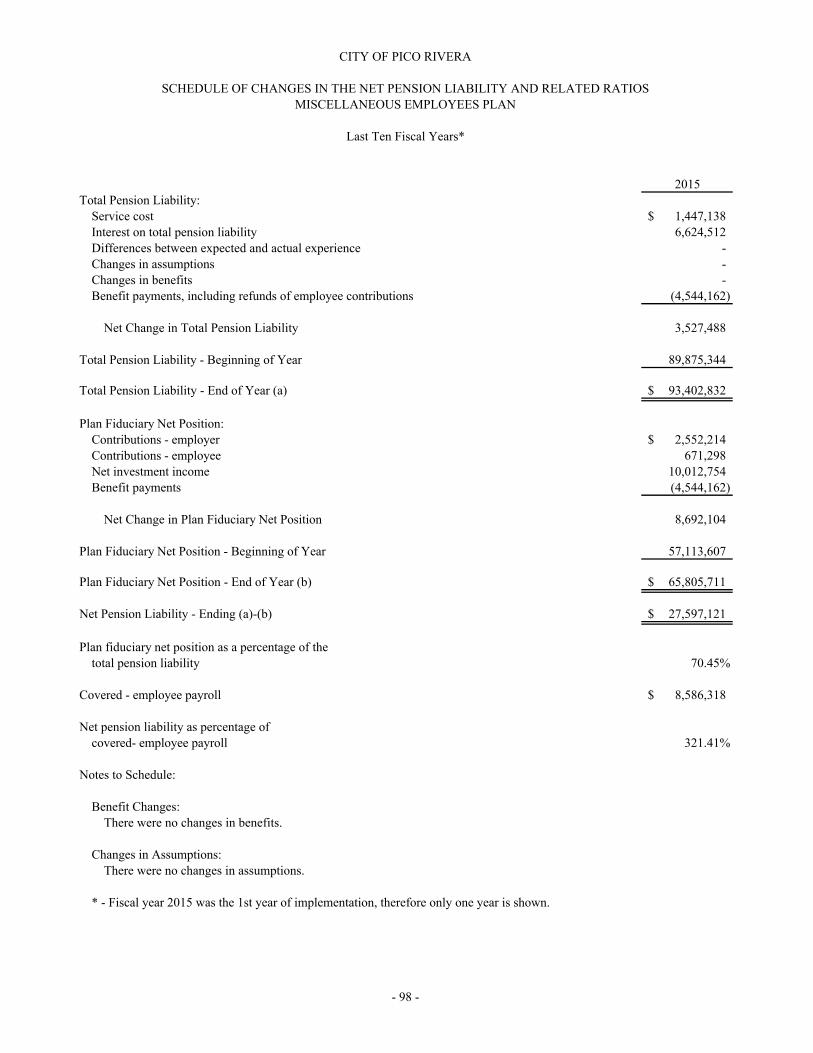
2015Total Pension Liability:
Service cost 1,447,138$ Interest on total pension liability 6,624,512 Differences between expected and actual experience - Changes in assumptions - Changes in benefits - Benefit payments, including refunds of employee contributions (4,544,162)
Net Change in Total Pension Liability 3,527,488
Total Pension Liability - Beginning of Year 89,875,344
Total Pension Liability - End of Year (a) 93,402,832$
Plan Fiduciary Net Position:Contributions - employer 2,552,214$ Contributions - employee 671,298 Net investment income 10,012,754 Benefit payments (4,544,162)
Net Change in Plan Fiduciary Net Position 8,692,104
Plan Fiduciary Net Position - Beginning of Year 57,113,607
Plan Fiduciary Net Position - End of Year (b) 65,805,711$
Net Pension Liability - Ending (a)-(b) 27,597,121$
Plan fiduciary net position as a percentage of thetotal pension liability 70.45%
Covered - employee payroll 8,586,318$
Net pension liability as percentage of covered- employee payroll 321.41%
Notes to Schedule:
Benefit Changes:
Changes in Assumptions:
* - Fiscal year 2015 was the 1st year of implementation, therefore only one year is shown.
CITY OF PICO RIVERA
SCHEDULE OF CHANGES IN THE NET PENSION LIABILITY AND RELATED RATIOS
Last Ten Fiscal Years*
There were no changes in benefits.
There were no changes in assumptions.
- 98 -
MISCELLANEOUS EMPLOYEES PLAN
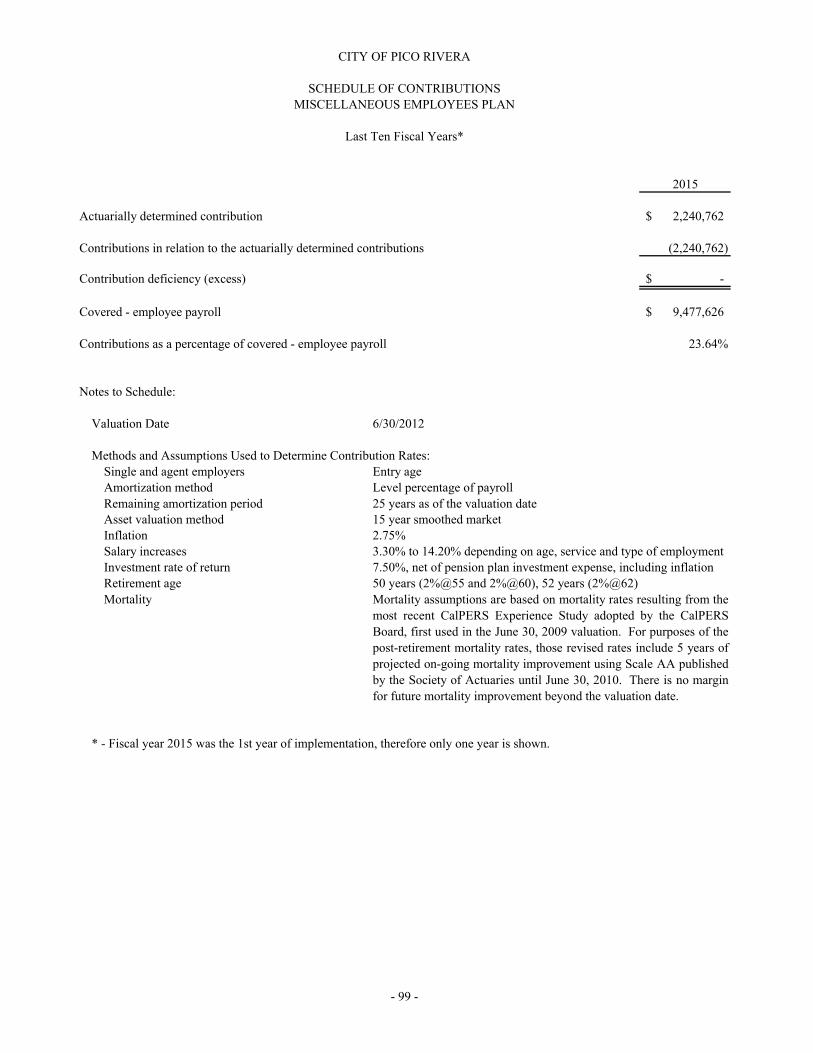
2015
Actuarially determined contribution 2,240,762$
Contributions in relation to the actuarially determined contributions (2,240,762)
Contribution deficiency (excess) -$
Covered - employee payroll 9,477,626$
Contributions as a percentage of covered - employee payroll 23.64%
Notes to Schedule:
Valuation Date 6/30/2012
Methods and Assumptions Used to Determine Contribution Rates:Single and agent employers Entry ageAmortization method Level percentage of payroll
Remaining amortization periodAsset valuation method 15 year smoothed marketInflation 2.75%Salary increases 3.30% to 14.20% depending on age, service and type of employmentInvestment rate of return 7.50%, net of pension plan investment expense, including inflationRetirement age 50 years (2%@55 and 2%@60), 52 years (2%@62)
Mortality
* - Fiscal year 2015 was the 1st year of implementation, therefore only one year is shown.
CITY OF PICO RIVERA
SCHEDULE OF CONTRIBUTIONS
Last Ten Fiscal Years*
- 99 -
Mortality assumptions are based on mortality rates resulting from the
most recent CalPERS Experience Study adopted by the CalPERS
Board, first used in the June 30, 2009 valuation. For purposes of the
post-retirement mortality rates, those revised rates include 5 years of
projected on-going mortality improvement using Scale AA published
by the Society of Actuaries until June 30, 2010. There is no margin
for future mortality improvement beyond the valuation date.
25 years as of the valuation date
MISCELLANEOUS EMPLOYEES PLAN
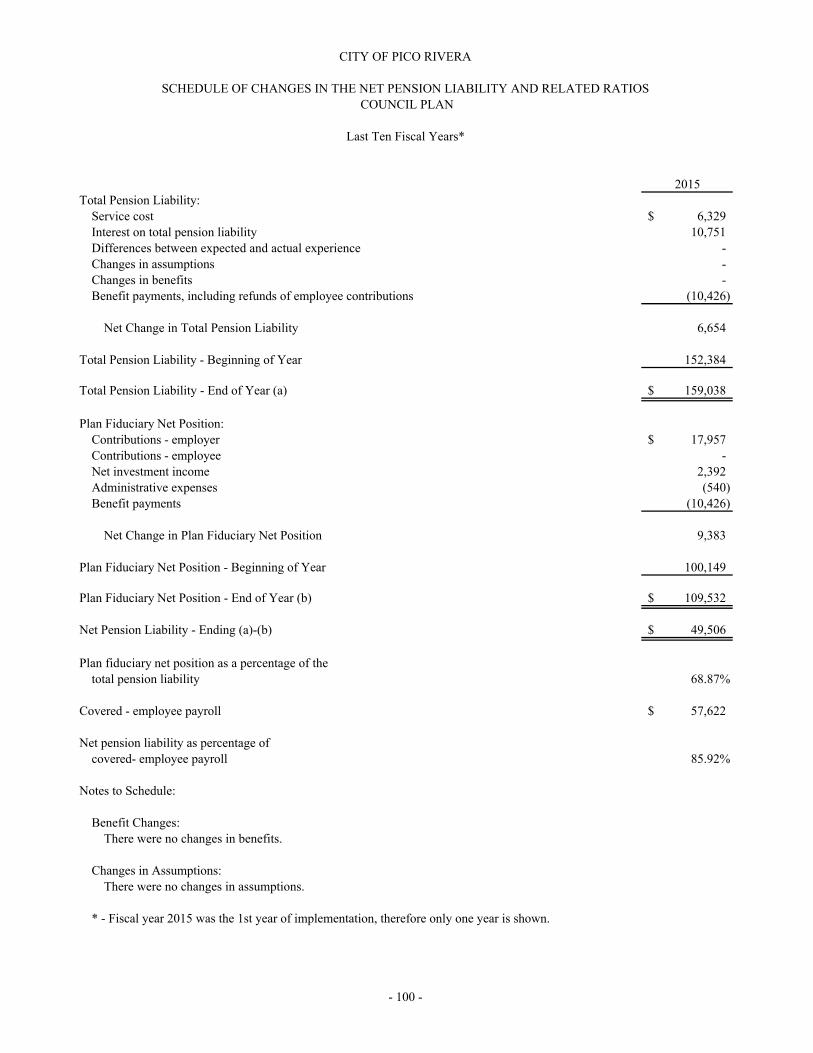
2015Total Pension Liability:
Service cost 6,329$ Interest on total pension liability 10,751 Differences between expected and actual experience - Changes in assumptions - Changes in benefits - Benefit payments, including refunds of employee contributions (10,426)
Net Change in Total Pension Liability 6,654
Total Pension Liability - Beginning of Year 152,384
Total Pension Liability - End of Year (a) 159,038$
Plan Fiduciary Net Position:Contributions - employer 17,957$ Contributions - employee - Net investment income 2,392 Administrative expenses (540) Benefit payments (10,426)
Net Change in Plan Fiduciary Net Position 9,383
Plan Fiduciary Net Position - Beginning of Year 100,149
Plan Fiduciary Net Position - End of Year (b) 109,532$
Net Pension Liability - Ending (a)-(b) 49,506$
Plan fiduciary net position as a percentage of thetotal pension liability 68.87%
Covered - employee payroll 57,622$
Net pension liability as percentage of covered- employee payroll 85.92%
Notes to Schedule:
Benefit Changes:
Changes in Assumptions:
* - Fiscal year 2015 was the 1st year of implementation, therefore only one year is shown.
CITY OF PICO RIVERA
SCHEDULE OF CHANGES IN THE NET PENSION LIABILITY AND RELATED RATIOS
Last Ten Fiscal Years*
There were no changes in benefits.
There were no changes in assumptions.
- 100 -
COUNCIL PLAN

2015
Actuarially determined contribution 17,957$
Contributions in relation to the actuarially determined contributions (17,957)
Contribution deficiency (excess) -$
Covered - employee payroll 57,622$
Contributions as a percentage of covered - employee payroll 31.16%
Notes to Schedule:
Valuation Date 6/30/2013
Methods and Assumptions Used to Determine Contribution Rates:Single and agent employers Entry ageAmortization method Level percentage of payroll, closed
Remaining amortization periodAsset valuation method MarketInflation 3.00%Salary increases 4.00%Investment rate of return 7.00%Retirement age 55 years
Mortality
* - Fiscal year 2015 was the 1st year of implementation, therefore only one year is shown.
CITY OF PICO RIVERA
SCHEDULE OF CONTRIBUTIONS - COUNCIL PLAN
Last Ten Fiscal Years*
9 year fixed.
Consistent with the Non-Industrial rates used to value the
Miscellaneous CalPERS Pension Plans.
- 101 -

Actuarial Actuarial
Value Accrued Unfunded UAAL as a
Actuarial of Assets Liability AAL Funded Covered % of
Valuation (AVA) (AAL) (UAAL) Ratio Payroll Payroll
Date (a) (b) (b) - (a) (a)/(b) (c) [(b)-(a)]/c]
06/30/11 -$ 34,688,000$ 34,688,000$ 0.00% 8,977,000$ 386.4%
06/30/13 - 37,256,000 37,256,000 0.00% 7,985,000 466.6%
06/30/15 - 39,680,000 39,680,000 0.00% 8,162,000 486.2%
- 102 -
CITY OF PICO RIVERA
SCHEDULE OF FUNDING PROGRESS
For the year ended June 30, 2015
OTHER POST-EMPLOYMENT BENEFITS

Variance with
Final Budget
Positive
Original Final Actual (Negative)
REVENUES:
Taxes and assessments 29,074,000$ 29,074,000$ 29,942,939$ 868,939$
Licenses and permits 2,096,900 2,096,900 2,363,477 266,577
Intergovernmental 405,000 290,000 311,973 21,973
Charges for services 1,760,900 1,760,900 1,723,440 (37,460)
Fines, forfeitures and penalties 1,349,000 1,349,000 1,134,906 (214,094)
Investment and rental 78,500 78,500 47,295 (31,205)
Miscellaneous 1,143,100 890,000 2,142,737 1,252,737
TOTAL REVENUES 35,907,400 35,539,300 37,666,767 2,127,467
EXPENDITURES:
Current:
General government 7,271,875 8,286,165 6,867,125 1,419,040
Public safety 11,630,900 10,948,183 10,435,184 512,999
Public works 8,027,525 8,765,418 7,588,159 1,177,259
Parks and recreation 4,544,000 4,293,398 3,825,479 467,919
Community development 1,467,300 2,032,039 1,866,590 165,449
Debt service:
Principal 610,000 610,000 610,000 -
Interest and fiscal charges 1,709,500 1,709,500 1,710,638 (1,138)
TOTAL EXPENDITURES 35,261,100 36,644,703 32,903,175 3,741,528
EXCESS OF REVENUES OVER
(UNDER) EXPENDITURES 646,300 (1,105,403) 4,763,592 5,868,995
OTHER FINANCING SOURCES (USES):
Transfers in 3,227,400 3,227,400 2,861,809 (365,591)
Transfers out (3,400,728) (3,948,325) (1,914,629) 2,033,696
TOTAL OTHER FINANCING
SOURCES (USES) (173,328) (720,925) 947,180 1,668,105
NET CHANGE IN FUND BALANCE 472,972 (1,826,328) 5,710,772 7,537,100
FUND BALANCE - BEGINNING OF YEAR 45,233,167 45,233,167 45,233,167 -
FUND BALANCE - END OF YEAR 45,706,139$ 43,406,839$ 50,943,939$ 7,537,100$
See accompanying note to required supplementary information.
BUDGETARY COMPARISON SCHEDULE
CITY OF PICO RIVERA
- 103 -
For the year ended June 30, 2015
GENERAL FUND
Budgeted Amounts
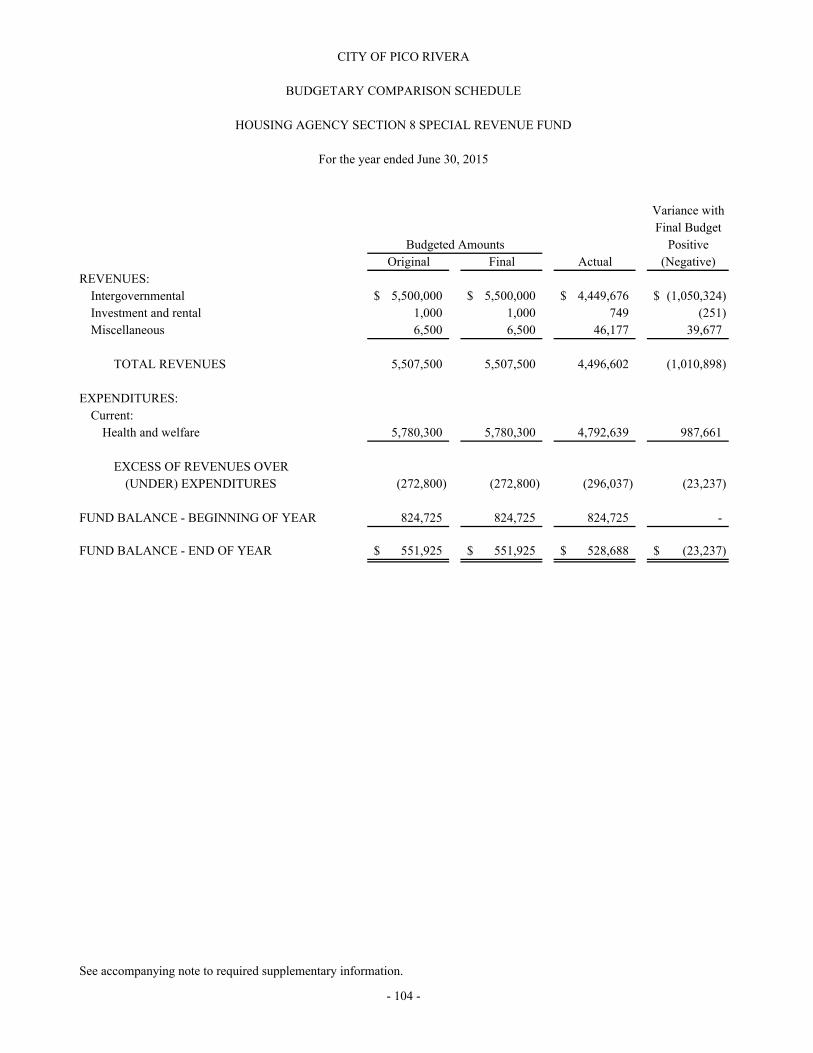
Variance with
Final Budget
Positive
Original Final Actual (Negative)
REVENUES:
Intergovernmental 5,500,000$ 5,500,000$ 4,449,676$ (1,050,324)$
Investment and rental 1,000 1,000 749 (251)
Miscellaneous 6,500 6,500 46,177 39,677
TOTAL REVENUES 5,507,500 5,507,500 4,496,602 (1,010,898)
EXPENDITURES:
Current:
Health and welfare 5,780,300 5,780,300 4,792,639 987,661
EXCESS OF REVENUES OVER
(UNDER) EXPENDITURES (272,800) (272,800) (296,037) (23,237)
FUND BALANCE - BEGINNING OF YEAR 824,725 824,725 824,725 -
FUND BALANCE - END OF YEAR 551,925$ 551,925$ 528,688$ (23,237)$
See accompanying note to required supplementary information.
BUDGETARY COMPARISON SCHEDULE
CITY OF PICO RIVERA
- 104 -
HOUSING AGENCY SECTION 8 SPECIAL REVENUE FUND
Budgeted Amounts
For the year ended June 30, 2015

Variance with
Final Budget
Positive
Original Final Actual (Negative)
REVENUES:
Intergovernmental 4,469,953$ 3,940,474$ 2,742,034$ (1,198,440)$
OTHER FINANCING USES:
Transfers out (4,469,953) (4,112,461) (1,412,966) 2,699,495
NET CHANGE IN FUND BALANCE - (171,987) 1,329,068 1,501,055
FUND BALANCE (DEFICIT) -
BEGINNING OF YEAR (2,244,617) (2,244,617) (2,244,617) -
FUND BALANCE (DEFICIT) - END OF YEAR (2,244,617)$ (2,416,604)$ (915,549)$ 1,501,055$
See accompanying note to required supplementary information.
CITY OF PICO RIVERA
BUDGETARY COMPARISON SCHEDULE
FEDERAL GRANTS SPECIAL REVENUE FUND
For the year ended June 30, 2015
- 105 -
Budgeted Amounts
- 106 -
CITY OF PICO RIVERA
NOTE TO REQUIRED SUPPLEMENTARY INFORMATION
June 30, 2015
1. BUDGETARY CONTROL AND ACCOUNTING:
The City adopts annual budgets for governmental funds on a basis that is the same as accounting principles generally accepted in the United States of America.
The City’s budget is a detailed operating plan, which identifies estimated costs and results in relation to estimated revenues. The budget includes (1) the programs, projects, services, and activities to be provided during the fiscal year, (2) the estimated resources (inflows) and amounts available for appropriation and (3) the estimated charges to appropriations. The budget represents a process through which policy decisions are made, implemented, and controlled.
The following procedures establish the budgetary data reflected in the financial statements:
The budget is prepared under the City Manager’s direction and adopted by the City Council, generally prior to June 30 of each year. It is revised periodically during the year by the City Council. The budget presented in the financial statements includes the original and final amounts. The budget serves as a policy document for the deliverance of public services; however, expenditures are individually approved by the City Council. The City manager is authorized to transfer amounts within individual fund budgets without the approval of City Council. Additional appropriations during the year may be submitted to the City Council forreview and approval.
Budget information is presented for the governmental fund types. There were no budgeted appropriations for the Housing Agency Low and Moderate Income Housing Special Revenue Fund, which is used to account for all successor agency housing activities, the Flossmoor Road Sewer Assessment District Capital Project Fund, which is used to account for funds received for the installation of sewers, nor the 2009 Lease Revenue Bond Capital Projects Fund, which is used to account for the proceeds of the 2009 Lease Revenue Bonds and all capital expenditures paid from proceeds of the bond. Accordingly, no budgetary comparison for thesefunds is presented in the financial statements. Budgeted revenue amounts represent the original budget modified by Council-authorized adjustments during the year, which were contingent upon new, or additional revenue sources. Budgeted expenditure amounts represent original appropriations adjusted for supplemental appropriations during the year. The budgets conform,in all material respects, to accounting principles generally accepted in the United States of America. Appropriations lapse at year-end.
Budgetary compliance is monitored without the use of encumbrances.
- 107 -
CITY OF PICO RIVERA
SUPPLEMENTARY INFORMATION

- 108 -
This page intentionally left blank.

- 109 -
CITY OF PICO RIVERAOTHER MAJOR FUND
BUDGETARY COMPARISON SCHEDULE

Variance with
Final Budget
Positive
Original Final Actual (Negative)
REVENUES:
Charges for services -$ 69,152$ 69,152$ -$
EXPENDITURES:
Capital outlay 19,627,320 21,935,443 5,175,862 16,759,581
EXCESS OF REVENUES OVER
(UNDER) EXPENDITURES (19,627,320) (21,866,291) (5,106,710) 16,759,581
OTHER FINANCING SOURCES (USES):
Transfers in 39,195,540 41,503,664 4,757,143 (36,746,521)
Transfers out (1,792,928) (811,638) - 811,638
TOTAL OTHER FINANCING
SOURCES (USES) 37,402,612 40,692,026 4,757,143 (35,934,883)
NET CHANGE IN FUND BALANCE 17,775,292 18,825,735 (349,567) (19,175,302)
FUND BALANCE (DEFICIT) -
BEGINNING OF YEAR (154,016) (154,016) (154,016) -
FUND BALANCE (DEFICIT) - END OF YEAR 17,621,276$ 18,671,719$ (503,583)$ (19,175,302)$
BUDGETARY COMPARISON SCHEDULE
CITY OF PICO RIVERA
- 110 -
CAPITAL IMPROVEMENT CAPITAL PROJECTS FUND - MAJOR FUND
For the year ended June 30, 2015
Budgeted Amounts
- 111 -
CITY OF PICO RIVERA
DESCRIPTION OF OTHER GOVERNMENTAL FUNDS
June 30, 2015
SPECIAL REVENUE FUNDS
Special Revenue Funds account for proceeds of specific revenue sources that are legally restricted or otherwise designated for specific purposes. Special Revenue Funds include the following:
Community Development Block Grant Fund accounts for funds received from the U.S. Department of Housing and Urban Development for the purpose of Housing Rehabilitation, Social Services and qualified capital improvements.
State Gas Tax Fund accounts for the City’s proportionate share of gas tax monies collected by the State of California, which are used for street construction and maintenance.
Lighting Assessment District Fund accounts for monies received for lighting services deemed to benefit the properties and businesses against which the special benefit assessments are levied. The assessments are levied once a year and are collected by the Los Angeles County Tax Collector and remitted to the City.
Park Development Fund accounts for funds received on new residential construction for the purpose of improving and/or developing the City’s park system.
Prop A Fund accounts for the ½% sales tax approved by Prop A in Los Angeles County which is restricted for transportation programs and projects.
Prop C Fund accounts for the ½% sales tax approved by Prop C which is restricted for transportation programs and projects.
Measure R Fund accounts for monies received and expenditures relative to Measure R projects.
HOME Grant Fund accounts for funds received from the U.S. Department of Housing and Urban Development for the purpose of housing loans and rehabilitation.
CalHOME Grant Fund accounts for funds received from the State of California for the purpose of providing home rehabilitation loans.
- 112 -
CITY OF PICO RIVERA
DESCRIPTION OF OTHER GOVERNMENTAL FUNDS(CONTINUED)
June 30, 2015
SPECIAL REVENUE FUNDS (CONTINUED)
Air Quality Improvement Fund accounts for the additional vehicle registration fees received from the Southern California Air Quality Management District for the purpose of air pollution reduction.
County Grants Fund accounts for various Los Angeles County grants that are received for restricted expenditures for specific programs and projects.
State Grants Fund accounts for the various State of California grants that are restricted to expenditures for specific programs and projects.
Economic Development Assistance (EDA) Grant Fund provides meaningful assistance, on a cost-shared basis, to economic growth. It also accounts for funds received from the companies developing the Pico Rivera Towne Center, under the terms of the improvement and reimbursement agreements with the Redevelopment Agency.
Image Enhancement Fund accounts for funds received from all developers for the enhancement of the image of the City of Pico Rivera.
Sewer Maintenance Fund accounts for direct assessments on property for annual and long-term maintenance of the sewer system.
Reach Grants Fund accounts for funds received from the State of California for our after school learning program.
Cable/PEG Support Fund accounts for fees received that are restricted to upgrades to the City’s cable system.
Transportation Development Act Fund accounts for funds received from the State of California Department of Transportation for the development and support of public transportation needs.
Housing Agency Low and Moderate Income Housing Fund (LMIHF) accounts for assets received from dissolution of the former Pico Rivera Redevelopment Agency dedicated to low and moderate income housing activities pursuant to the California Health and Safety Code.
- 113 -
CITY OF PICO RIVERA
DESCRIPTION OF OTHER GOVERNMENTAL FUNDS(CONTINUED)
June 30, 2015
CAPITAL PROJECTS FUNDS
Capital Projects Funds account for financial resources used for the acquisition or construction of major capital facilities. Capital Projects Funds include the following:
Flossmoor Road Sewer Assessment District Fund accounts for funds received for the installation of sewers deemed to benefit the properties against which the special benefit assessments are levied.
Paramount/Mines Landscape Maintenance Assessment Fund accounts for funds received for the installation and maintenance of common areas deemed to benefit the properties against which the special benefit assessments are levied.
2009 Lease Revenue Bond Capital Projects Fund accounts for the proceeds of the 2009 Lease Revenue Bonds and all capital expenditures paid from the proceeds of the bond.
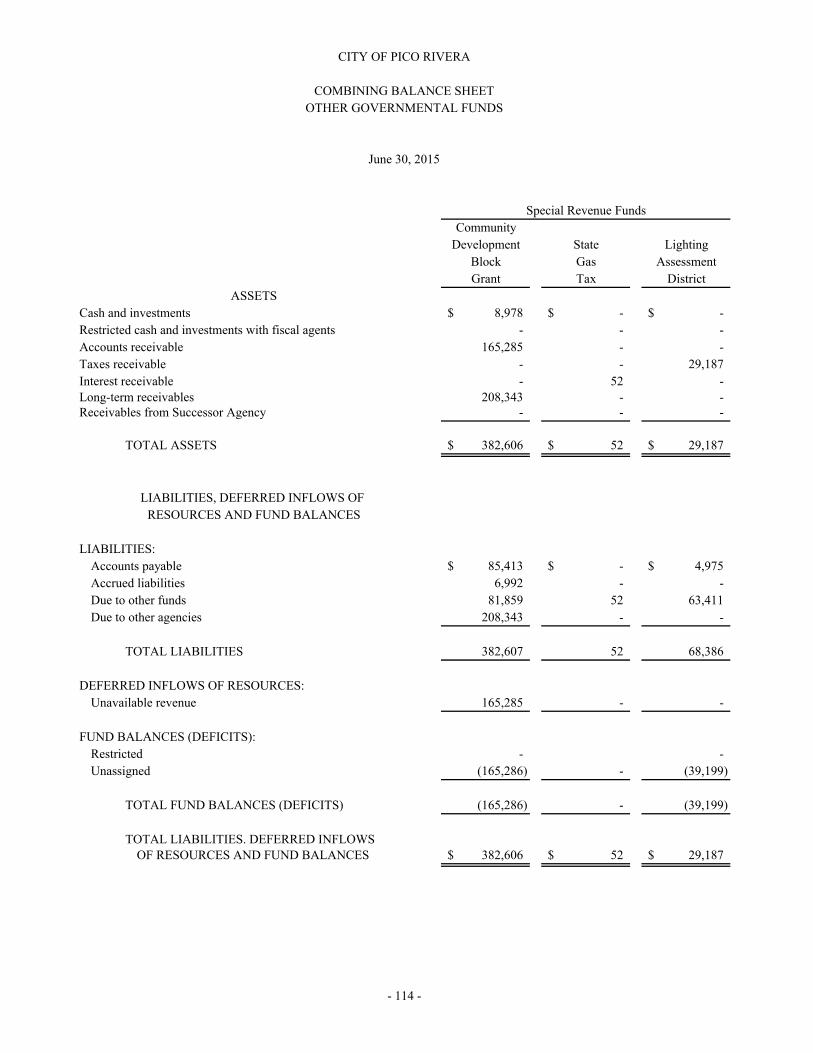
Community
Development State Lighting
Block Gas Assessment
Grant Tax District
Cash and investments 8,978$ -$ -$
Restricted cash and investments with fiscal agents - - -
Accounts receivable 165,285 - -
Taxes receivable - - 29,187
Interest receivable - 52 - Long-term receivables 208,343 - - Receivables from Successor Agency - - -
TOTAL ASSETS 382,606$ 52$ 29,187$
LIABILITIES:
Accounts payable 85,413$ -$ 4,975$
Accrued liabilities 6,992 - -
Due to other funds 81,859 52 63,411
Due to other agencies 208,343 - -
TOTAL LIABILITIES 382,607 52 68,386
DEFERRED INFLOWS OF RESOURCES:
Unavailable revenue 165,285 - -
FUND BALANCES (DEFICITS):
Restricted - -
Unassigned (165,286) - (39,199)
TOTAL FUND BALANCES (DEFICITS) (165,286) - (39,199)
TOTAL LIABILITIES. DEFERRED INFLOWSOF RESOURCES AND FUND BALANCES 382,606$ 52$ 29,187$
COMBINING BALANCE SHEET
OTHER GOVERNMENTAL FUNDS
June 30, 2015
ASSETS
RESOURCES AND FUND BALANCES
Special Revenue Funds
CITY OF PICO RIVERA
- 114 -
LIABILITIES, DEFERRED INFLOWS OF

Park Prop Prop Measure HOME CalHOME
Development A C R Grant Grant
50,611$ 1,389,251$ 1,137,213$ 1,016,146$ 1,074,370$ -$
- - - - - -
- - - 291,902 - 763,338
- - - - - -
72 1,889 1,621 1,583 - - - - - - 3,782,017 1,430,395- - - - - -
50,683$ 1,391,140$ 1,138,834$ 1,309,631$ 4,856,387$ 2,193,733$
-$ 111,027$ 2,265 -$ -$ 82,857$
- 5,665 4,514 - - -
- - - - - 534,856
- - - - 3,781,220 1,430,395
- 116,692 6,779 - 3,781,220 2,048,108
- - - 291,902 - 763,338
50,683 1,274,448 1,132,055 1,017,729 1,075,167 -
- - - - - (617,713)
50,683 1,274,448 1,132,055 1,017,729 1,075,167 (617,713)
50,683$ 1,391,140$ 1,138,834$ 1,309,631$ 4,856,387$ 2,193,733$
(Continued)
- 115 -
Special Revenue Funds (Continued)

Air
Quality County State
Improvement Grants Grants
Cash and investments 206,182$ 25,973$ 172,221$
Restricted cash and investments with fiscal agents - - -
Accounts receivable 20,795 2,069 103,977
Taxes receivable - - -
Interest receivable 292 - 211Long-term receivables - - - Receivables from Successor Agency - - -
TOTAL ASSETS 227,269$ 28,042$ 276,409$
LIABILITIES:
Accounts payable -$ -$ 10,000$
Accrued liabilities - - -
Due to other funds - - 118,793
Due to other agencies - 6,496 -
TOTAL LIABILITIES - 6,496 128,793
DEFERRED INFLOWS OF RESOURCES:
Unavailable revenue - - 44,265
FUND BALANCES (DEFICITS):
Restricted 227,269 21,546 103,351
Unassigned - - -
TOTAL FUND BALANCES (DEFICITS) 227,269 21,546 103,351
TOTAL LIABILITIES. DEFERRED INFLOWSOF RESOURCES AND FUND BALANCES 227,269$ 28,042$ 276,409$
CITY OF PICO RIVERA
COMBINING BALANCE SHEET
OTHER GOVERNMENTAL FUNDS
(CONTINUED)
June 30, 2015
LIABILITIES, DEFERRED INFLOWS OF
ASSETS
RESOURCES AND FUND BALANCES
Special Revenue Funds (Continued)
- 116 -

Economic
Development Transportation
Assistance Image Sewer Reach Cable/PEG Development
Grant Enhancement Maintenance Grants Support Act
2,324,736$ 497,449$ 502,386$ 457,794$ 237,393$ -$
- - - - - -
- - - 70,102 - 26,061
- - 19,321 - 8,474 -
3,363 706 - 794 - - - - - - - - - - - - - -
2,328,099$ 498,155$ 521,707$ 528,690$ 245,867$ 26,061$
17,780$ -$ 15,868$ 73,628$ 19,406$ -$
- - 4,133 15,157 - -
- - - - - 26,061
- - - - - -
17,780 - 20,001 88,785 19,406 26,061
- - - 70,102 - 26,061
2,310,319 498,155 501,706 369,803 226,461 -
- - - - - (26,061)
2,310,319 498,155 501,706 369,803 226,461 (26,061)
2,328,099$ 498,155$ 521,707$ 528,690$ 245,867$ 26,061$
(Continued)
- 117 -
Special Revenue Funds (Continued)

Total
Housing Special
Agency Revenue
LMIHF Funds
Cash and investments 14,469$ 9,115,172$
Restricted cash and investments with fiscal agents - -
Accounts receivable - 1,443,529
Taxes receivable - 56,982
Interest receivable 18 10,601 Long-term receivables - 5,420,755 Receivables from Successor Agency 2,011,156 2,011,156
TOTAL ASSETS 2,025,643$ 18,058,195$
LIABILITIES:
Accounts payable -$ 423,219$
Accrued liabilities - 36,461
Due to other funds - 825,032
Due to other agencies - 5,426,454
TOTAL LIABILITIES - 6,711,166
DEFERRED INFLOWS OF RESOURCES:
Unavailable revenue - 1,360,953
FUND BALANCES (DEFICITS):
Restricted 2,025,643 10,834,335
Unassigned - (848,259)
TOTAL FUND BALANCES (DEFICITS) 2,025,643 9,986,076
TOTAL LIABILITIES. DEFERRED INFLOWSOF RESOURCES AND FUND BALANCES 2,025,643$ 18,058,195$
Special Revenue Funds (Continued)
ASSETS
LIABILITIES, DEFERRED INFLOWS OF
- 118 -
RESOURCES AND FUND BALANCES
CITY OF PICO RIVERA
COMBINING BALANCE SHEET
OTHER GOVERNMENTAL FUNDS
(CONTINUED)
June 30, 2015

Flossmoor Road Paramount/Mines Total Total
Sewer Landscape Capital Other
Assessment Maintenance 2009 Lease Projects Governmental
District Assessment Revenue Bond Funds Funds
3,403$ -$ -$ 3,403$ 9,118,575$
- - 27 27 27
- - - - 1,443,529
- - - - 56,982
5 - - 5 10,606 - - - - 5,420,755 - - - - 2,011,156
3,408$ -$ 27$ 3,435$ 18,061,630$
-$ 500$ -$ 500$ 423,719$
- - - - 36,461
- 1,871 - 1,871 826,903
- - - - 5,426,454
- 2,371 - 2,371 6,713,537
- - - - 1,360,953
3,408 - 27 3,435 10,837,770
- (2,371) - (2,371) (850,630)
3,408 (2,371) 27 1,064 9,987,140
3,408$ -$ 27$ 3,435$ 18,061,630$
Capital Projects Funds
- 119 -

Community
Development State Lighting
Block Gas Assessment
Grant Tax District
REVENUES:
Taxes and assessments -$ 1,681,248$ 1,424,376$
Intergovernmental 341,652 - -
Charges for services - - -
Investment and rental 3,766 332 -
Miscellaneous - - -
TOTAL REVENUES 345,418 1,681,580 1,424,376
EXPENDITURES:
Current:
General government - - -
Public works - - 682,826
Parks and recreation - - -
Health and welfare - - -
Community development 489,201 - -
TOTAL EXPENDITURES 489,201 - 682,826
EXCESS OF REVENUES OVER
(UNDER) EXPENDITURES (143,783) 1,681,580 741,550
OTHER FINANCING USES:
Transfers out (21,503) (1,681,629) (755,400)
NET CHANGE IN FUND BALANCES (165,286) (49) (13,850)
FUND BALANCES (DEFICITS) -
BEGINNING OF YEAR - 49 (25,349)
FUND BALANCES (DEFICITS) - END OF YEAR (165,286)$ -$ (39,199)$
CITY OF PICO RIVERA
COMBINING STATEMENT OF REVENUES, EXPENDITURES
AND CHANGES IN FUND BALANCES - OTHER GOVERNMENTAL FUNDS
For the year ended June 30, 2015
Special Revenue Funds
- 120 -
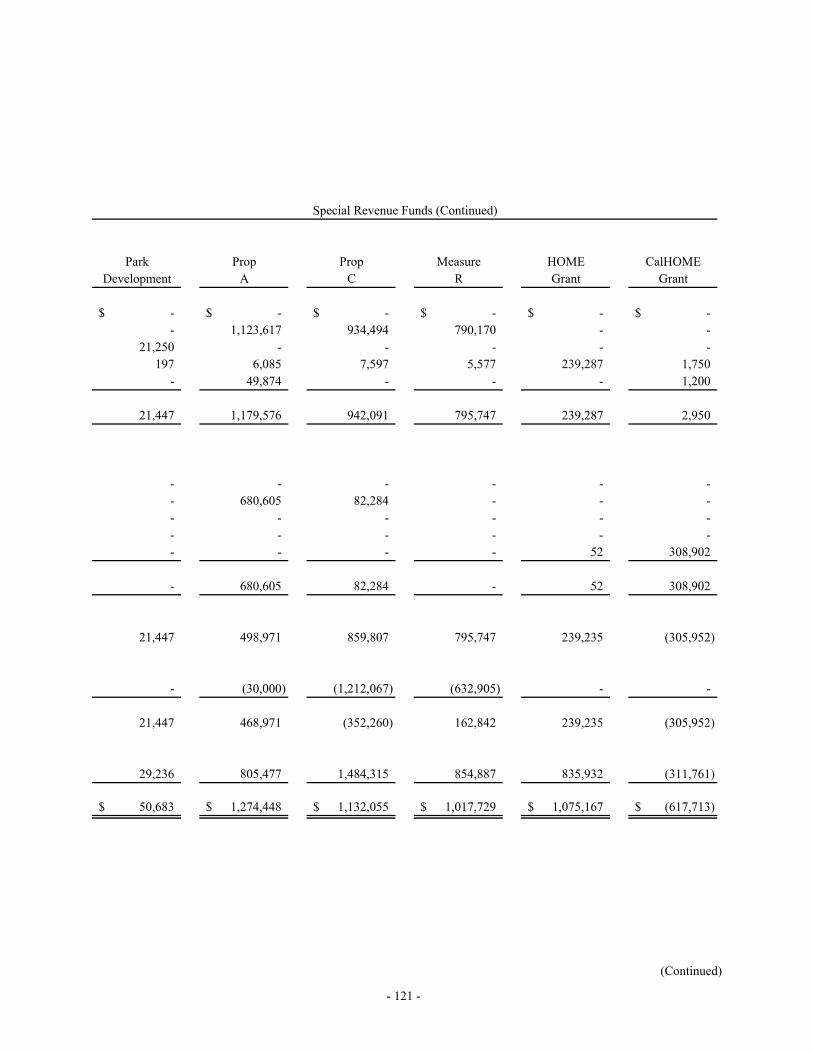
Park Prop Prop Measure HOME CalHOME
Development A C R Grant Grant
-$ -$ -$ -$ -$ -$
- 1,123,617 934,494 790,170 - -
21,250 - - - - -
197 6,085 7,597 5,577 239,287 1,750
- 49,874 - - - 1,200
21,447 1,179,576 942,091 795,747 239,287 2,950
- - - - - -
- 680,605 82,284 - - -
- - - - - -
- - - - - -
- - - - 52 308,902
- 680,605 82,284 - 52 308,902
21,447 498,971 859,807 795,747 239,235 (305,952)
- (30,000) (1,212,067) (632,905) - -
21,447 468,971 (352,260) 162,842 239,235 (305,952)
29,236 805,477 1,484,315 854,887 835,932 (311,761)
50,683$ 1,274,448$ 1,132,055$ 1,017,729$ 1,075,167$ (617,713)$
(Continued)
Special Revenue Funds (Continued)
- 121 -

Air
Quality County State
Improvement Grants Grants
REVENUES:
Taxes and assessments -$ -$ -$
Intergovernmental 79,248 - 34,674
Charges for services - - -
Investment and rental 1,041 - 749
Miscellaneous - 2,500 -
TOTAL REVENUES 80,289 2,500 35,423
EXPENDITURES:
Current:
General government - - -
Public works 58,559 - -
Parks and recreation - 2,491 -
Health and welfare - - 48,239
Community development - - -
TOTAL EXPENDITURES 58,559 2,491 48,239
EXCESS OF REVENUES OVER
(UNDER) EXPENDITURES 21,730 9 (12,816)
OTHER FINANCING USES:
Transfers out (3,962) - (10,781)
NET CHANGE IN FUND BALANCES 17,768 9 (23,597)
FUND BALANCES (DEFICITS) -
BEGINNING OF YEAR 209,501 21,537 126,948
FUND BALANCES (DEFICITS) - END OF YEAR 227,269$ 21,546$ 103,351$
CITY OF PICO RIVERA
COMBINING STATEMENT OF REVENUES, EXPENDITURES
AND CHANGES IN FUND BALANCES - OTHER GOVERNMENTAL FUNDS
(CONTINUED)
For the year ended June 30, 2015
Special Revenue Funds (Continued)
- 122 -

Economic
Development Transportation
Assistance Image Sewer Reach Cable/PEG Development
Grant Enhancement Maintenance Grants Support Act
-$ -$ 998,094$ 29,893$ -$ -$
- - - 876,275 - 19,752
- 75,496 - - - -
13,286 2,457 - 3,034 - -
- - - - 291,551 -
13,286 77,953 998,094 909,202 291,551 19,752
- - 17,273 - - -
- - 439,808 - 65,090 1,000
- - - 966,750 - -
- - - - - -
65,378 - - - - -
65,378 - 457,081 966,750 65,090 1,000
(52,092) 77,953 541,013 (57,548) 226,461 18,752
(227,971) - (39,307) - - (44,813)
(280,063) 77,953 501,706 (57,548) 226,461 (26,061)
2,590,382 420,202 - 427,351 - -
2,310,319$ 498,155$ 501,706$ 369,803$ 226,461$ (26,061)$
Special Revenue Funds (Continued)
- 123 -
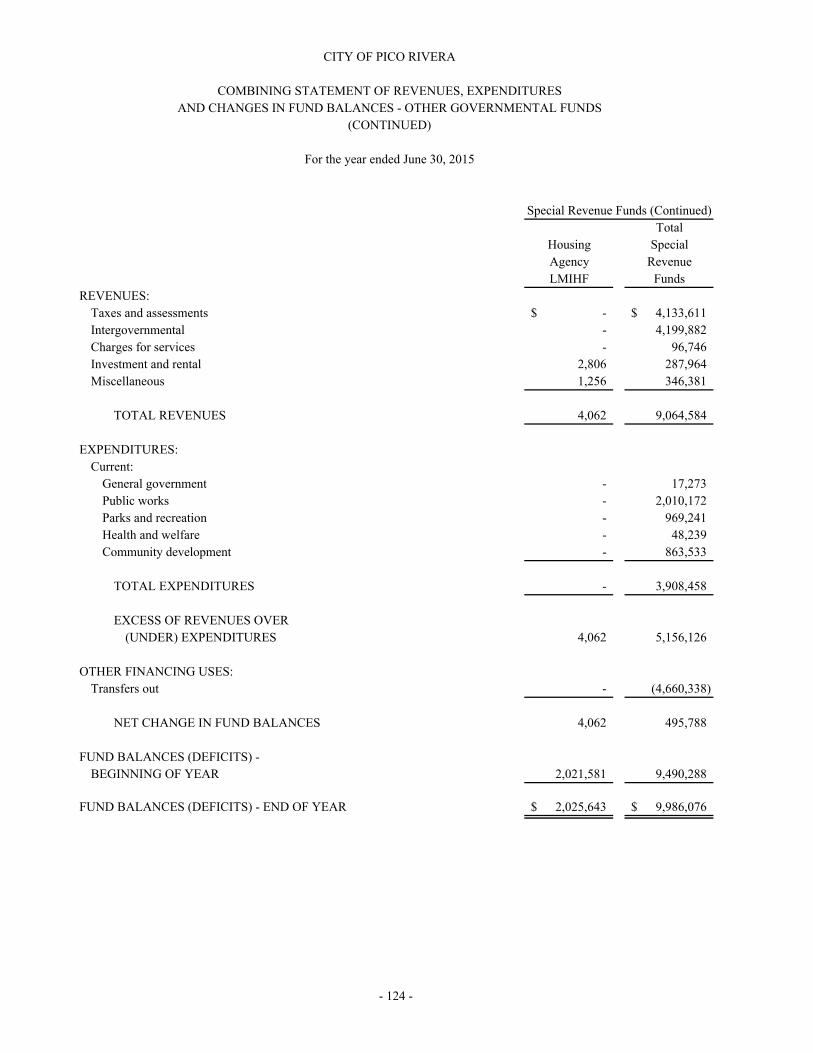
Total
Housing Special
Agency Revenue
LMIHF Funds
REVENUES:
Taxes and assessments -$ 4,133,611$
Intergovernmental - 4,199,882
Charges for services - 96,746
Investment and rental 2,806 287,964
Miscellaneous 1,256 346,381
TOTAL REVENUES 4,062 9,064,584
EXPENDITURES:
Current:
General government - 17,273
Public works - 2,010,172
Parks and recreation - 969,241
Health and welfare - 48,239
Community development - 863,533
TOTAL EXPENDITURES - 3,908,458
EXCESS OF REVENUES OVER
(UNDER) EXPENDITURES 4,062 5,156,126
OTHER FINANCING USES:
Transfers out - (4,660,338)
NET CHANGE IN FUND BALANCES 4,062 495,788
FUND BALANCES (DEFICITS) -
BEGINNING OF YEAR 2,021,581 9,490,288
FUND BALANCES (DEFICITS) - END OF YEAR 2,025,643$ 9,986,076$
CITY OF PICO RIVERA
COMBINING STATEMENT OF REVENUES, EXPENDITURES
Special Revenue Funds (Continued)
AND CHANGES IN FUND BALANCES - OTHER GOVERNMENTAL FUNDS
(CONTINUED)
For the year ended June 30, 2015
- 124 -

Flossmoor Road Paramount/Mines Total Total
Sewer Landscape Capital Other
Assessment Maintenance 2009 Lease Projects Governmental
District Assessment Revenue Bond Funds Funds
-$ 6,560$ -$ 6,560$ 4,140,171$
- - - - 4,199,882
- - - - 96,746
18 36 15 69 288,033
- - - - 346,381
18 6,596 15 6,629 9,071,213
- - - - 17,273
- 22,980 - 22,980 2,033,152
- - - - 969,241
- - - - 48,239
- - - - 863,533
- 22,980 - 22,980 3,931,438
18 (16,384) 15 (16,351) 5,139,775
- - - - (4,660,338)
18 (16,384) 15 (16,351) 479,437
3,390 14,013 12 17,415 9,507,703
3,408$ (2,371)$ 27$ 1,064$ 9,987,140$
- 125 -
Capital Projects Funds

Variance with
Final Final Budget
Budgeted Positive
Amounts Actual (Negative)
REVENUES:
Intergovernmental 892,362$ 341,652$ (550,710)$
Investment and rental - 3,766 3,766
TOTAL REVENUES 892,362 345,418 (546,944)
EXPENDITURES:
Current:
Community development 870,859 489,201 381,658
EXCESS OF REVENUES OVER
(UNDER) EXPENDITURES 21,503 (143,783) (165,286)
OTHER FINANCING USES:
Transfers out (21,503) (21,503) -
NET CHANGE IN FUND BALANCE - (165,286) (165,286)
FUND BALANCE - BEGINNING OF YEAR - - -
FUND BALANCE (DEFICIT) - END OF YEAR -$ (165,286)$ (165,286)$
- 126 -
CITY OF PICO RIVERA
SCHEDULE OF REVENUES, EXPENDITURES AND
CHANGES IN FUND BALANCE - BUDGET AND ACTUAL
COMMUNITY DEVELOPMENT BLOCK GRANT SPECIAL REVENUE FUND
For the year ended June 30, 2015
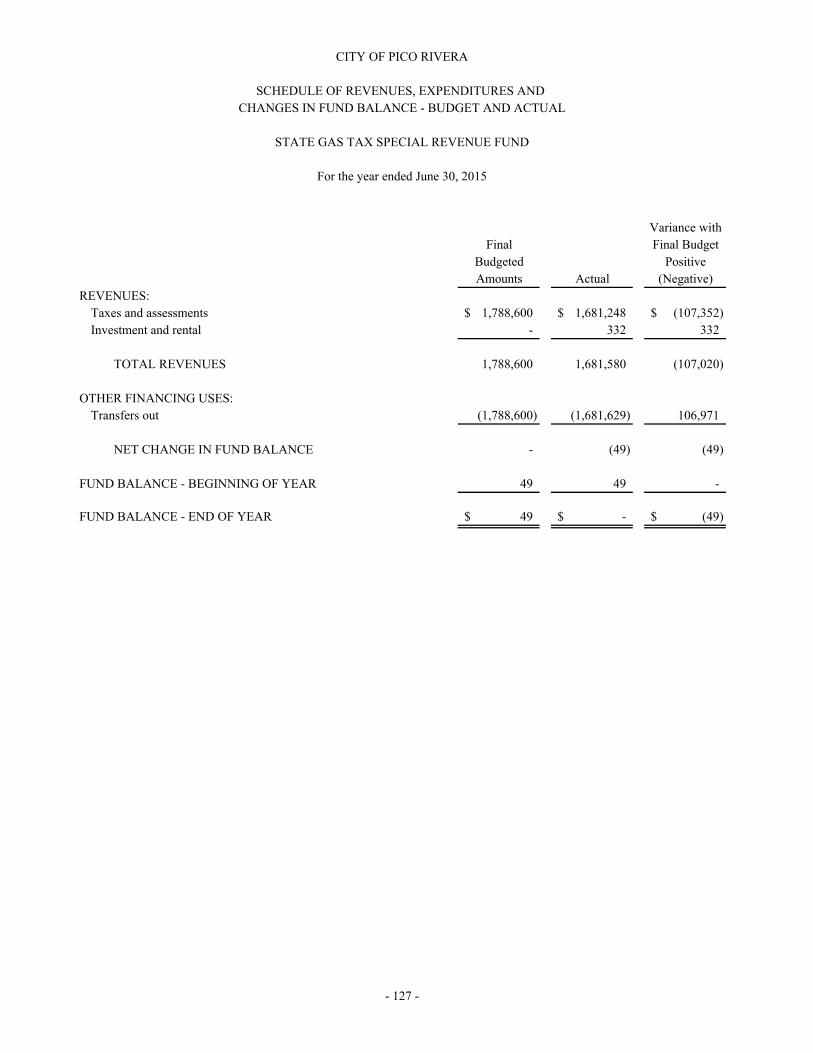
Variance with
Final Final Budget
Budgeted Positive
Amounts Actual (Negative)
REVENUES:
Taxes and assessments 1,788,600$ 1,681,248$ (107,352)$
Investment and rental - 332 332
TOTAL REVENUES 1,788,600 1,681,580 (107,020)
OTHER FINANCING USES:
Transfers out (1,788,600) (1,681,629) 106,971
NET CHANGE IN FUND BALANCE - (49) (49)
FUND BALANCE - BEGINNING OF YEAR 49 49 -
FUND BALANCE - END OF YEAR 49$ -$ (49)$
SCHEDULE OF REVENUES, EXPENDITURES AND
CITY OF PICO RIVERA
- 127 -
STATE GAS TAX SPECIAL REVENUE FUND
CHANGES IN FUND BALANCE - BUDGET AND ACTUAL
For the year ended June 30, 2015

Variance with
Final Final Budget
Budgeted Positive
Amounts Actual (Negative)
REVENUES:
Taxes and assessments 1,292,000$ 1,424,376$ 132,376$
EXPENDITURES:
Current:
Public works 684,000 682,826 1,174
EXCESS OF REVENUES OVER
(UNDER) EXPENDITURES 608,000 741,550 133,550
OTHER FINANCING SOURCES (USES):
Transfers in 200,000 - (200,000)
Transfers out (790,400) (755,400) 35,000
TOTAL OTHER FINANCING
SOURCES (USES) (590,400) (755,400) (165,000)
NET CHANGE IN FUND BALANCE 17,600 (13,850) (31,450)
FUND BALANCE (DEFICIT) - BEGINNING OF YEAR (25,349) (25,349) -
FUND BALANCE (DEFICIT) - END OF YEAR (7,749)$ (39,199)$ (31,450)$
SCHEDULE OF REVENUES, EXPENDITURES AND
CITY OF PICO RIVERA
- 128 -
LIGHTING ASSESSMENT DISTRICT SPECIAL REVENUE FUND
CHANGES IN FUND BALANCE - BUDGET AND ACTUAL
For the year ended June 30, 2015
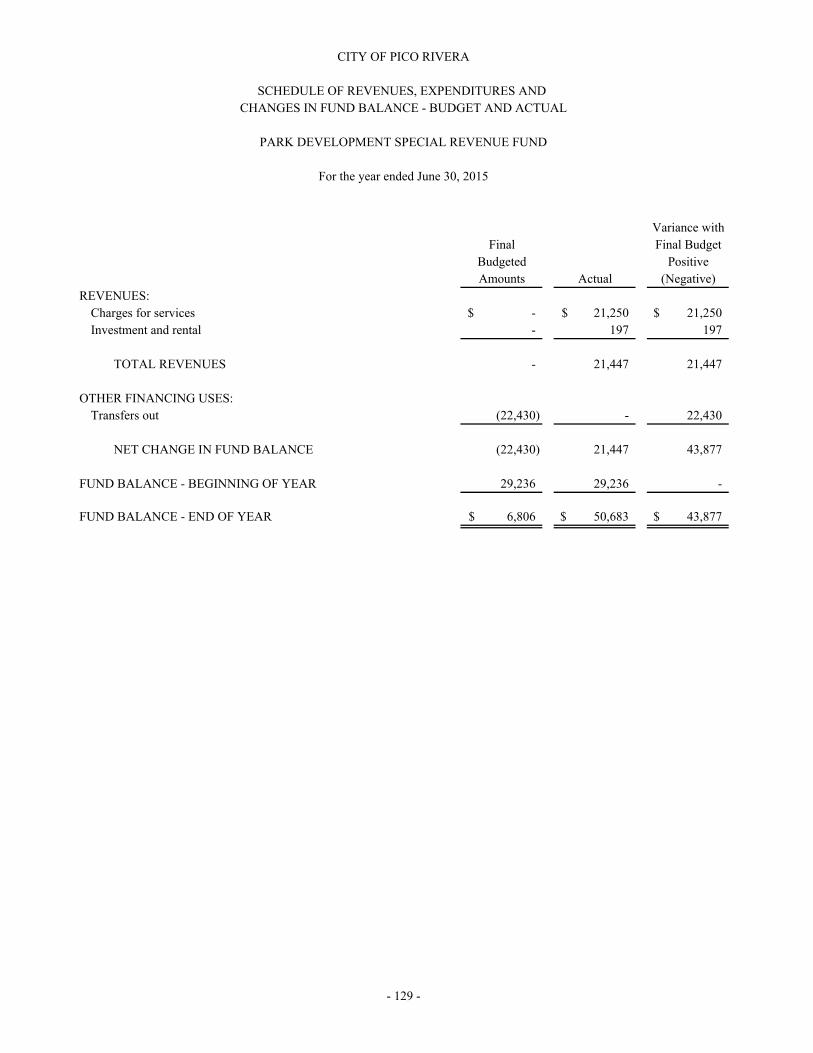
Variance with
Final Final Budget
Budgeted Positive
Amounts Actual (Negative)
REVENUES:
Charges for services -$ 21,250$ 21,250$
Investment and rental - 197 197
TOTAL REVENUES - 21,447 21,447
OTHER FINANCING USES:
Transfers out (22,430) - 22,430
NET CHANGE IN FUND BALANCE (22,430) 21,447 43,877
FUND BALANCE - BEGINNING OF YEAR 29,236 29,236 -
FUND BALANCE - END OF YEAR 6,806$ 50,683$ 43,877$
SCHEDULE OF REVENUES, EXPENDITURES AND
CITY OF PICO RIVERA
- 129 -
PARK DEVELOPMENT SPECIAL REVENUE FUND
CHANGES IN FUND BALANCE - BUDGET AND ACTUAL
For the year ended June 30, 2015
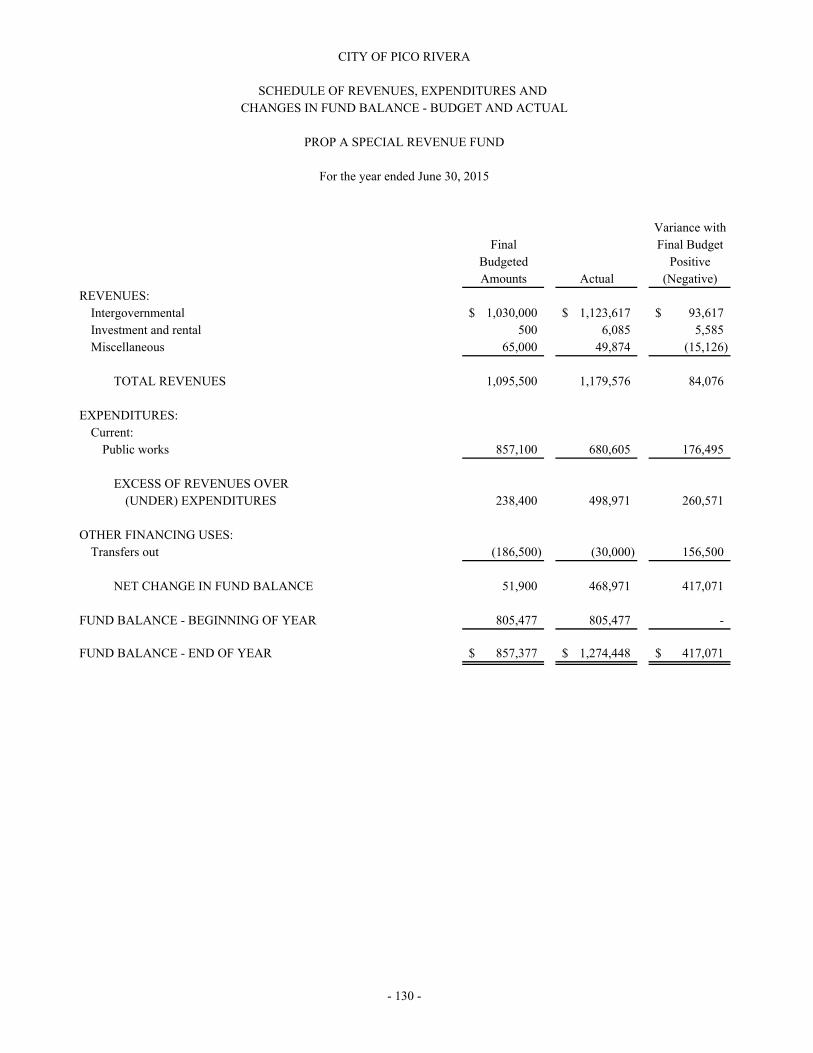
Variance with
Final Final Budget
Budgeted Positive
Amounts Actual (Negative)
REVENUES:
Intergovernmental 1,030,000$ 1,123,617$ 93,617$
Investment and rental 500 6,085 5,585
Miscellaneous 65,000 49,874 (15,126)
TOTAL REVENUES 1,095,500 1,179,576 84,076
EXPENDITURES:
Current:
Public works 857,100 680,605 176,495
EXCESS OF REVENUES OVER
(UNDER) EXPENDITURES 238,400 498,971 260,571
OTHER FINANCING USES:
Transfers out (186,500) (30,000) 156,500
NET CHANGE IN FUND BALANCE 51,900 468,971 417,071
FUND BALANCE - BEGINNING OF YEAR 805,477 805,477 -
FUND BALANCE - END OF YEAR 857,377$ 1,274,448$ 417,071$
SCHEDULE OF REVENUES, EXPENDITURES AND
CITY OF PICO RIVERA
- 130 -
PROP A SPECIAL REVENUE FUND
CHANGES IN FUND BALANCE - BUDGET AND ACTUAL
For the year ended June 30, 2015

Variance with
Final Final Budget
Budgeted Positive
Amounts Actual (Negative)
REVENUES:
Intergovernmental 890,000$ 934,494$ 44,494$
Investment and rental 5,000 7,597 2,597
TOTAL REVENUES 895,000 942,091 47,091
EXPENDITURES:
Current:
Public works 30,000 82,284 (52,284)
EXCESS OF REVENUES OVER
(UNDER) EXPENDITURES 865,000 859,807 (5,193)
OTHER FINANCING USES:
Transfers out (3,667,151) (1,212,067) 2,455,084
NET CHANGE IN FUND BALANCE (2,802,151) (352,260) 2,449,891
FUND BALANCE - BEGINNING OF YEAR 1,484,315 1,484,315 -
FUND BALANCE - END OF YEAR (1,317,836)$ 1,132,055$ 2,449,891$
SCHEDULE OF REVENUES, EXPENDITURES AND
CITY OF PICO RIVERA
- 131 -
PROP C SPECIAL REVENUE FUND
CHANGES IN FUND BALANCE - BUDGET AND ACTUAL
For the year ended June 30, 2015
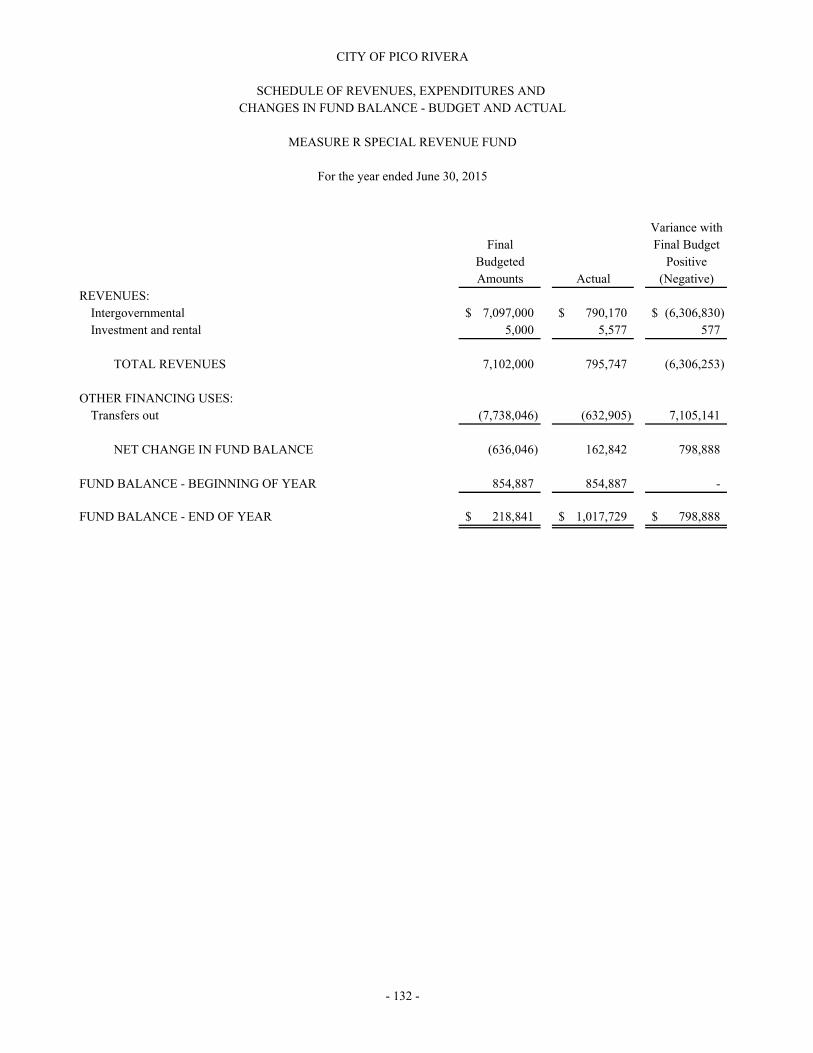
Variance with
Final Final Budget
Budgeted Positive
Amounts Actual (Negative)
REVENUES:
Intergovernmental 7,097,000$ 790,170$ (6,306,830)$
Investment and rental 5,000 5,577 577
TOTAL REVENUES 7,102,000 795,747 (6,306,253)
OTHER FINANCING USES:
Transfers out (7,738,046) (632,905) 7,105,141
NET CHANGE IN FUND BALANCE (636,046) 162,842 798,888
FUND BALANCE - BEGINNING OF YEAR 854,887 854,887 -
FUND BALANCE - END OF YEAR 218,841$ 1,017,729$ 798,888$
- 132 -
CITY OF PICO RIVERA
SCHEDULE OF REVENUES, EXPENDITURES AND
CHANGES IN FUND BALANCE - BUDGET AND ACTUAL
MEASURE R SPECIAL REVENUE FUND
For the year ended June 30, 2015
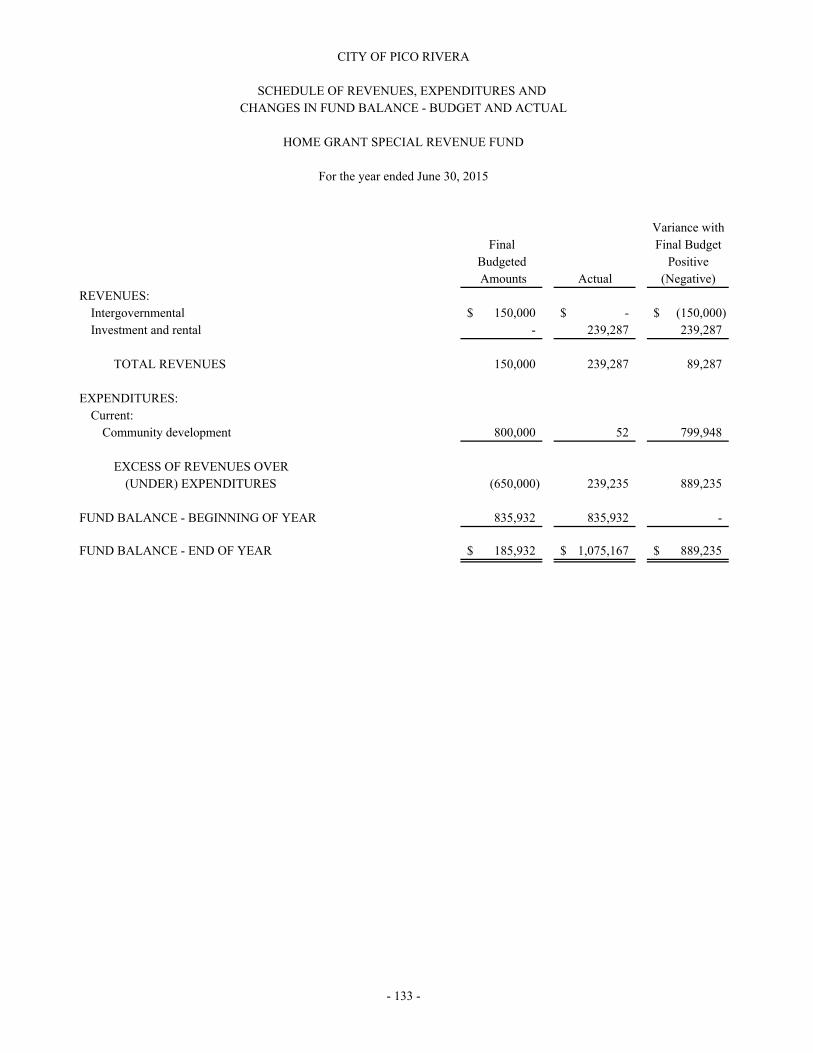
Variance with
Final Final Budget
Budgeted Positive
Amounts Actual (Negative)
REVENUES:
Intergovernmental 150,000$ -$ (150,000)$
Investment and rental - 239,287 239,287
TOTAL REVENUES 150,000 239,287 89,287
EXPENDITURES:
Current:
Community development 800,000 52 799,948
EXCESS OF REVENUES OVER
(UNDER) EXPENDITURES (650,000) 239,235 889,235
FUND BALANCE - BEGINNING OF YEAR 835,932 835,932 -
FUND BALANCE - END OF YEAR 185,932$ 1,075,167$ 889,235$
- 133 -
CITY OF PICO RIVERA
SCHEDULE OF REVENUES, EXPENDITURES AND
HOME GRANT SPECIAL REVENUE FUND
For the year ended June 30, 2015
CHANGES IN FUND BALANCE - BUDGET AND ACTUAL
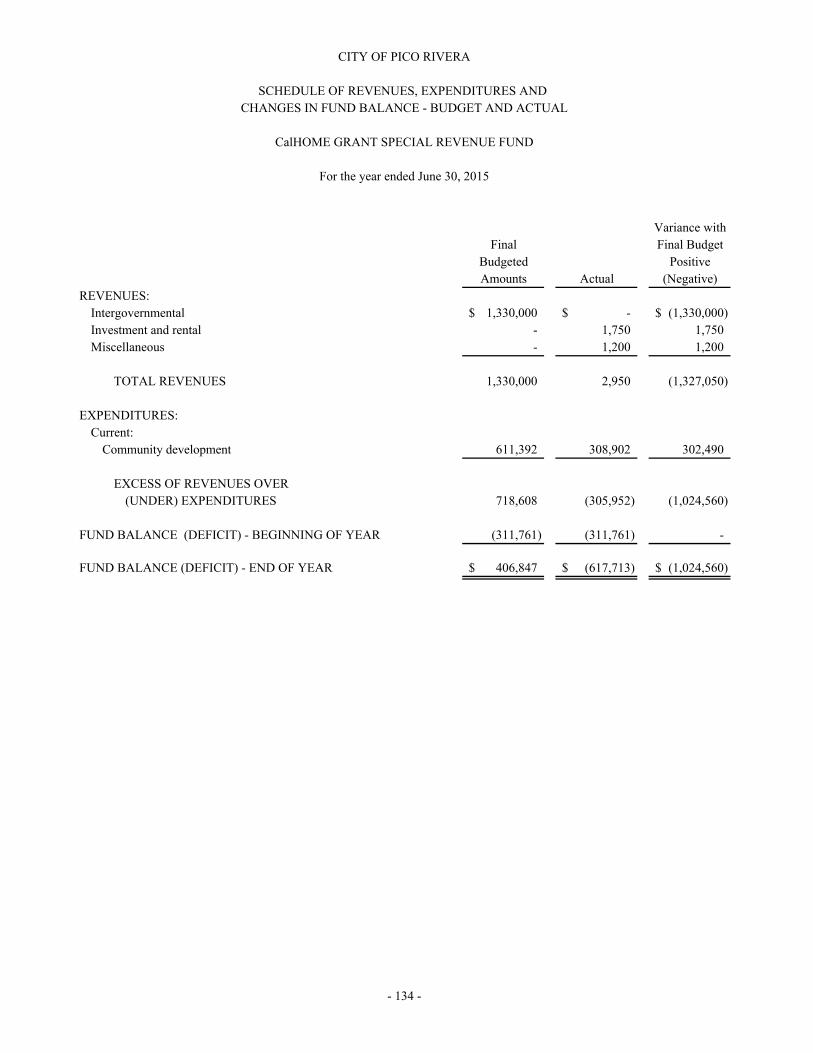
Variance with
Final Final Budget
Budgeted Positive
Amounts Actual (Negative)
REVENUES:
Intergovernmental 1,330,000$ -$ (1,330,000)$
Investment and rental - 1,750 1,750
Miscellaneous - 1,200 1,200
TOTAL REVENUES 1,330,000 2,950 (1,327,050)
EXPENDITURES:
Current:
Community development 611,392 308,902 302,490
EXCESS OF REVENUES OVER
(UNDER) EXPENDITURES 718,608 (305,952) (1,024,560)
FUND BALANCE (DEFICIT) - BEGINNING OF YEAR (311,761) (311,761) -
FUND BALANCE (DEFICIT) - END OF YEAR 406,847$ (617,713)$ (1,024,560)$
- 134 -
CITY OF PICO RIVERA
SCHEDULE OF REVENUES, EXPENDITURES AND
CHANGES IN FUND BALANCE - BUDGET AND ACTUAL
CalHOME GRANT SPECIAL REVENUE FUND
For the year ended June 30, 2015

Variance with
Final Final Budget
Budgeted Positive
Amounts Actual (Negative)
REVENUES:
Intergovernmental 80,000$ 79,248$ (752)$
Investment and rental - 1,041 1,041
TOTAL REVENUES 80,000 80,289 289
EXPENDITURES:
Current:
Public works 92,000 58,559 33,441
EXCESS OF REVENUES OVER
(UNDER) EXPENDITURES (12,000) 21,730 33,730
OTHER FINANCING USES:
Transfers out (50,000) (3,962) 46,038
NET CHANGE IN FUND BALANCE (62,000) 17,768 79,768
FUND BALANCE - BEGINNING OF YEAR 209,501 209,501 -
FUND BALANCE - END OF YEAR 147,501$ 227,269$ 79,768$
SCHEDULE OF REVENUES, EXPENDITURES AND
CITY OF PICO RIVERA
- 135 -
AIR QUALITY IMPROVEMENT SPECIAL REVENUE FUND
CHANGES IN FUND BALANCE - BUDGET AND ACTUAL
For the year ended June 30, 2015
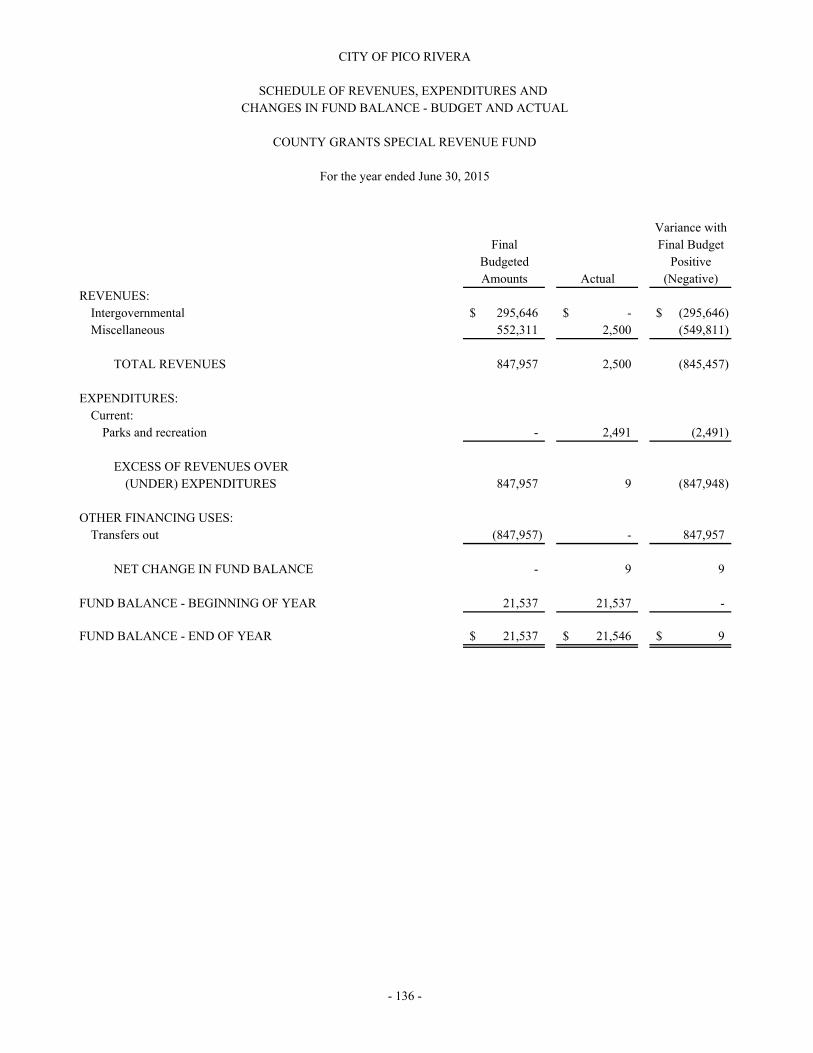
Variance with
Final Final Budget
Budgeted Positive
Amounts Actual (Negative)
REVENUES:
Intergovernmental 295,646$ -$ (295,646)$
Miscellaneous 552,311 2,500 (549,811)
TOTAL REVENUES 847,957 2,500 (845,457)
EXPENDITURES:
Current:
Parks and recreation - 2,491 (2,491)
EXCESS OF REVENUES OVER
(UNDER) EXPENDITURES 847,957 9 (847,948)
OTHER FINANCING USES:
Transfers out (847,957) - 847,957
NET CHANGE IN FUND BALANCE - 9 9
FUND BALANCE - BEGINNING OF YEAR 21,537 21,537 -
FUND BALANCE - END OF YEAR 21,537$ 21,546$ 9$
- 136 -
CITY OF PICO RIVERA
SCHEDULE OF REVENUES, EXPENDITURES AND
CHANGES IN FUND BALANCE - BUDGET AND ACTUAL
COUNTY GRANTS SPECIAL REVENUE FUND
For the year ended June 30, 2015
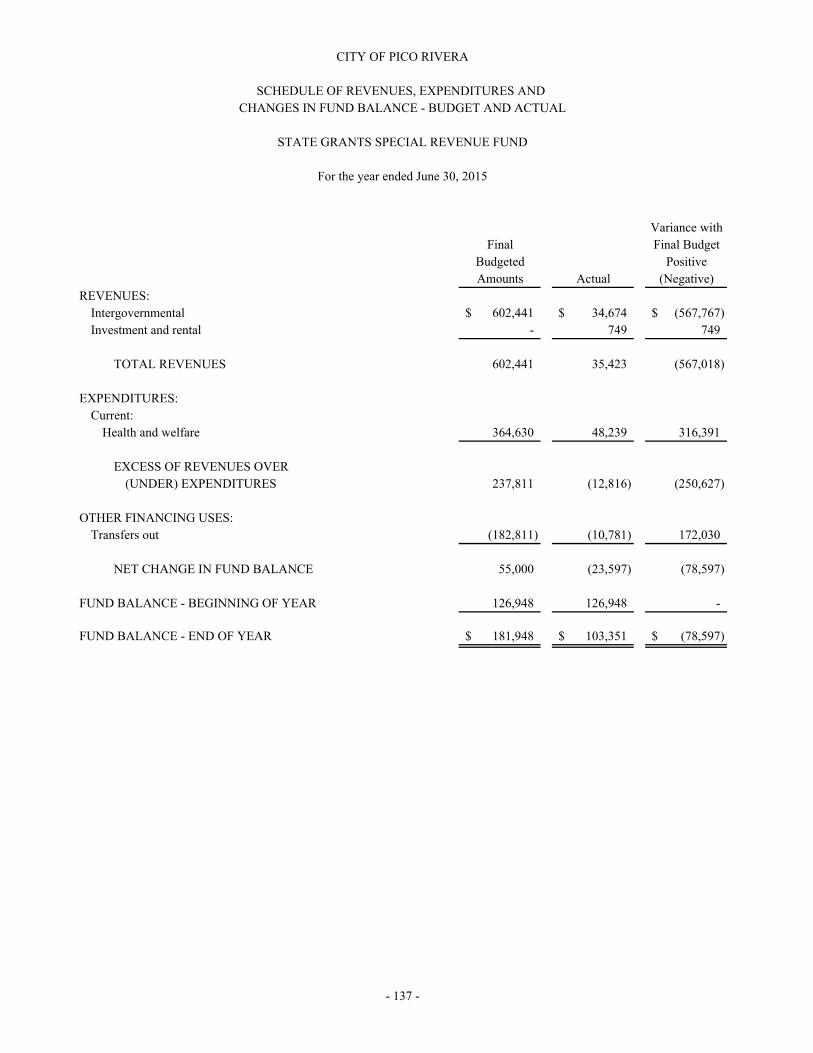
Variance with
Final Final Budget
Budgeted Positive
Amounts Actual (Negative)
REVENUES:
Intergovernmental 602,441$ 34,674$ (567,767)$
Investment and rental - 749 749
TOTAL REVENUES 602,441 35,423 (567,018)
EXPENDITURES:
Current:
Health and welfare 364,630 48,239 316,391
EXCESS OF REVENUES OVER
(UNDER) EXPENDITURES 237,811 (12,816) (250,627)
OTHER FINANCING USES:
Transfers out (182,811) (10,781) 172,030
NET CHANGE IN FUND BALANCE 55,000 (23,597) (78,597)
FUND BALANCE - BEGINNING OF YEAR 126,948 126,948 -
FUND BALANCE - END OF YEAR 181,948$ 103,351$ (78,597)$
SCHEDULE OF REVENUES, EXPENDITURES AND
CITY OF PICO RIVERA
- 137 -
STATE GRANTS SPECIAL REVENUE FUND
CHANGES IN FUND BALANCE - BUDGET AND ACTUAL
For the year ended June 30, 2015

Variance with
Final Final Budget
Budgeted Positive
Amounts Actual (Negative)
REVENUES:
Investment and rental 9,000$ 13,286$ 4,286$
EXPENDITURES:
Current:
Community development 160,700 65,378 95,322
EXCESS OF REVENUES OVER
(UNDER) EXPENDITURES (151,700) (52,092) 99,608
OTHER FINANCING USES:
Transfers out (400,000) (227,971) 172,029
NET CHANGE IN FUND BALANCE (551,700) (280,063) 271,637
FUND BALANCE - BEGINNING OF YEAR 2,590,382 2,590,382 -
FUND BALANCE - END OF YEAR 2,038,682$ 2,310,319$ 271,637$
SCHEDULE OF REVENUES, EXPENDITURES AND
CITY OF PICO RIVERA
- 138 -
ECONOMIC DEVELOPMENT ASSISTANCE GRANT SPECIAL REVENUE FUND
CHANGES IN FUND BALANCE - BUDGET AND ACTUAL
For the year ended June 30, 2015

Variance with
Final Final Budget
Budgeted Positive
Amounts Actual (Negative)
REVENUES:
Charges for services 42,000$ 75,496$ 33,496$
Investment and rental 5,000 2,457 (2,543)
TOTAL REVENUES 47,000 77,953 30,953
OTHER FINANCING USES:
Transfers out (180,585) - 180,585
NET CHANGE IN FUND BALANCE (133,585) 77,953 211,538
FUND BALANCE - BEGINNING OF YEAR 420,202 420,202 -
FUND BALANCE - END OF YEAR 286,617$ 498,155$ 211,538$
SCHEDULE OF REVENUES, EXPENDITURES AND
CITY OF PICO RIVERA
- 139 -
IMAGE ENHANCEMENT SPECIAL REVENUE FUND
CHANGES IN FUND BALANCE - BUDGET AND ACTUAL
For the year ended June 30, 2015

Variance with
Final Final Budget
Budgeted Positive
Amounts Actual (Negative)
REVENUES:
Taxes and assessments 1,040,000$ 998,094$ (41,906)$
EXPENDITURES:
Current:
General government 16,714 17,273 (559)
Public works 816,286 439,808 376,478
TOTAL EXPENDITURES 833,000 457,081 375,919
EXCESS OF REVENUES OVER
(UNDER) EXPENDITURES 207,000 541,013 334,013
OTHER FINANCING USES:
Transfers out (200,000) (39,307) 160,693
NET CHANGE IN FUND BALANCE 7,000 501,706 494,706
FUND BALANCE - BEGINNING OF YEAR - - -
FUND BALANCE - END OF YEAR 7,000$ 501,706$ 494,706$
CITY OF PICO RIVERA
SCHEDULE OF REVENUES, EXPENDITURES AND
CHANGES IN FUND BALANCE - BUDGET AND ACTUAL
SEWER MAINTENANCE SPECIAL REVENUE FUND
For the year ended June 30, 2015
- 140 -

Variance with
Final Final Budget
Budgeted Positive
Amounts Actual (Negative)
REVENUES:
Taxes and assessments 36,000$ 29,893$ (6,107)$
Intergovernmental 912,800 876,275 (36,525)
Investment and rental 1,000 3,034 2,034
TOTAL REVENUES 949,800 909,202 (40,598)
EXPENDITURES:
Current:
Parks and recreation 979,900 966,750 13,150
EXCESS OF REVENUES OVER
(UNDER) EXPENDITURES (30,100) (57,548) (27,448)
OTHER FINANCING USES:
Transfers out (46,000) - 46,000
NET CHANGE IN FUND BALANCE (76,100) (57,548) 18,552
FUND BALANCE - BEGINNING OF YEAR 427,351 427,351 -
FUND BALANCE - END OF YEAR 351,251$ 369,803$ 18,552$
SCHEDULE OF REVENUES, EXPENDITURES AND
CITY OF PICO RIVERA
- 141 -
REACH GRANTS SPECIAL REVENUE FUND
CHANGES IN FUND BALANCE - BUDGET AND ACTUAL
For the year ended June 30, 2015
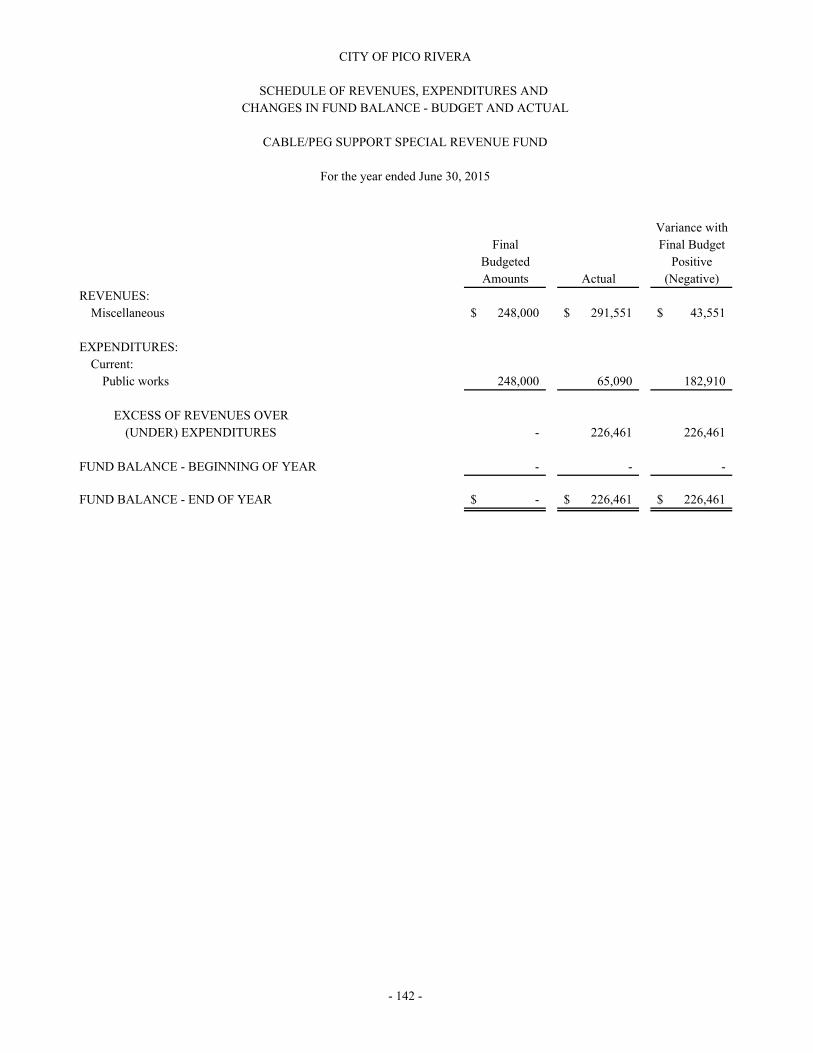
Variance with
Final Final Budget
Budgeted Positive
Amounts Actual (Negative)
REVENUES:
Miscellaneous 248,000$ 291,551$ 43,551$
EXPENDITURES:
Current:
Public works 248,000 65,090 182,910
EXCESS OF REVENUES OVER
(UNDER) EXPENDITURES - 226,461 226,461
FUND BALANCE - BEGINNING OF YEAR - - -
FUND BALANCE - END OF YEAR -$ 226,461$ 226,461$
CITY OF PICO RIVERA
SCHEDULE OF REVENUES, EXPENDITURES AND
CHANGES IN FUND BALANCE - BUDGET AND ACTUAL
CABLE/PEG SUPPORT SPECIAL REVENUE FUND
For the year ended June 30, 2015
- 142 -

Variance with
Final Final Budget
Budgeted Positive
Amounts Actual (Negative)
REVENUES:
Intergovernmental 87,934$ 19,752$ (68,182)$
EXPENDITURES:
Current:
Public works 1,000 1,000 -
EXCESS OF REVENUES OVER
(UNDER) EXPENDITURES 86,934 18,752 (68,182)
OTHER FINANCING USES:
Transfers out (86,934) (44,813) 42,121
NET CHANGE IN FUND BALANCE - (26,061) (26,061)
FUND BALANCE - BEGINNING OF YEAR - - -
FUND BALANCE (DEFICIT) - END OF YEAR -$ (26,061)$ (26,061)$
SCHEDULE OF REVENUES, EXPENDITURES AND
CITY OF PICO RIVERA
- 143 -
TRANSPORTATION DEVELOPMENT ACT SPECIAL REVENUE FUND
CHANGES IN FUND BALANCE - BUDGET AND ACTUAL
For the year ended June 30, 2015
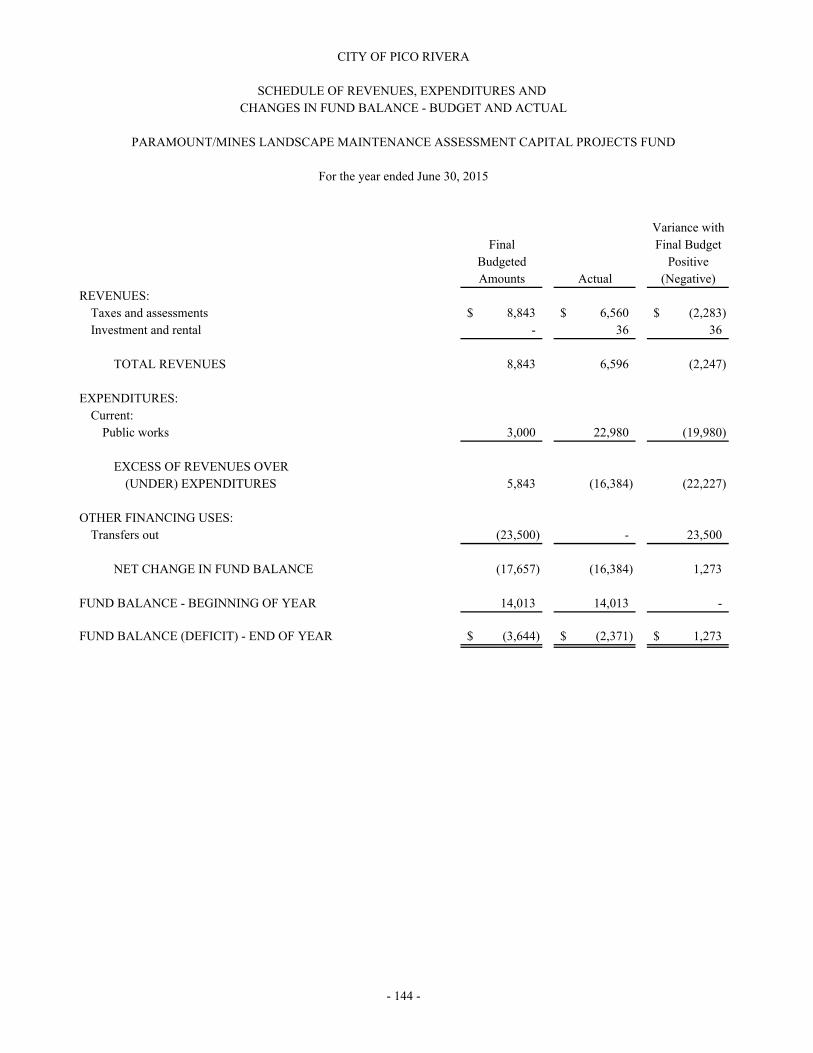
Variance with
Final Final Budget
Budgeted Positive
Amounts Actual (Negative)
REVENUES:
Taxes and assessments 8,843$ 6,560$ (2,283)$
Investment and rental - 36 36
TOTAL REVENUES 8,843 6,596 (2,247)
EXPENDITURES:
Current:
Public works 3,000 22,980 (19,980)
EXCESS OF REVENUES OVER
(UNDER) EXPENDITURES 5,843 (16,384) (22,227)
OTHER FINANCING USES:
Transfers out (23,500) - 23,500
NET CHANGE IN FUND BALANCE (17,657) (16,384) 1,273
FUND BALANCE - BEGINNING OF YEAR 14,013 14,013 -
FUND BALANCE (DEFICIT) - END OF YEAR (3,644)$ (2,371)$ 1,273$
SCHEDULE OF REVENUES, EXPENDITURES AND
CITY OF PICO RIVERA
- 144 -
PARAMOUNT/MINES LANDSCAPE MAINTENANCE ASSESSMENT CAPITAL PROJECTS FUND
CHANGES IN FUND BALANCE - BUDGET AND ACTUAL
For the year ended June 30, 2015
- 145 -
CITY OF PICO RIVERA
DESCRIPTION OF OTHER ENTERPRISE FUNDS
June 30, 2015
These funds account for operations that are financed and operated in a manner similar to private business enterprises. The Whittier Narrows Recreation Area Other Enterprise Funds are as follows:
Pico Rivera Sports Arena Fund accounts for funds received from the respective private concessionaires operating each facility.
Pico Rivera Golf Course Fund records the operations of the City-owned Golf Course.

Sports Golf
Arena Course Total
ASSETS:
CURRENT ASSETS:
Cash and investments 210,373$ 900$ 211,273$
Receivables, net:
Accounts - 102,309 102,309
Interest 525 - 525
Inventories, at cost - 24,068 24,068
TOTAL CURRENT ASSETS 210,898 127,277 338,175
NONCURRENT ASSETS:
Capital assets, not depreciated 3,368 38,945 42,313
Capital assets, depreciated, net 507,742 370,057 877,799
TOTAL NONCURRENT ASSETS 511,110 409,002 920,112
TOTAL ASSETS 722,008 536,279 1,258,287
DEFERRED OUTFLOWS OF RESOURCES:
Amount related to pensions 1,344 - 1,344
LIABILITIES:
CURRENT LIABILITIES:
Accounts payable 179 11,755 11,934
Accrued liabilities 2,555 22,765 25,320
Due to other funds - 673,881 673,881
Deposits - 8,776 8,776
TOTAL CURRENT LIABILITIES 2,734 717,177 719,911
NONCURRENT LIABILITIES:
Advances from other funds 704,496 - 704,496
Net pension liability 16,559 - 16,559
TOTAL NONCURRENT LIABILITIES 721,055 - 721,055
TOTAL LIABILITIES 723,789 717,177 1,440,966
DEFERRED INFLOWS OF RESOURCES:
Amount related to pensions 2,780 - 2,780
NET POSITION:
Net investment in capital assets 511,110 409,002 920,112
Unrestricted (514,327) (589,900) (1,104,227)
TOTAL NET POSITION (3,217)$ (180,898)$ (184,115)$
CITY OF PICO RIVERA
COMBINING STATEMENT OF NET POSITION
OTHER ENTERPRISE FUNDS
- 146 -
June 30, 2015
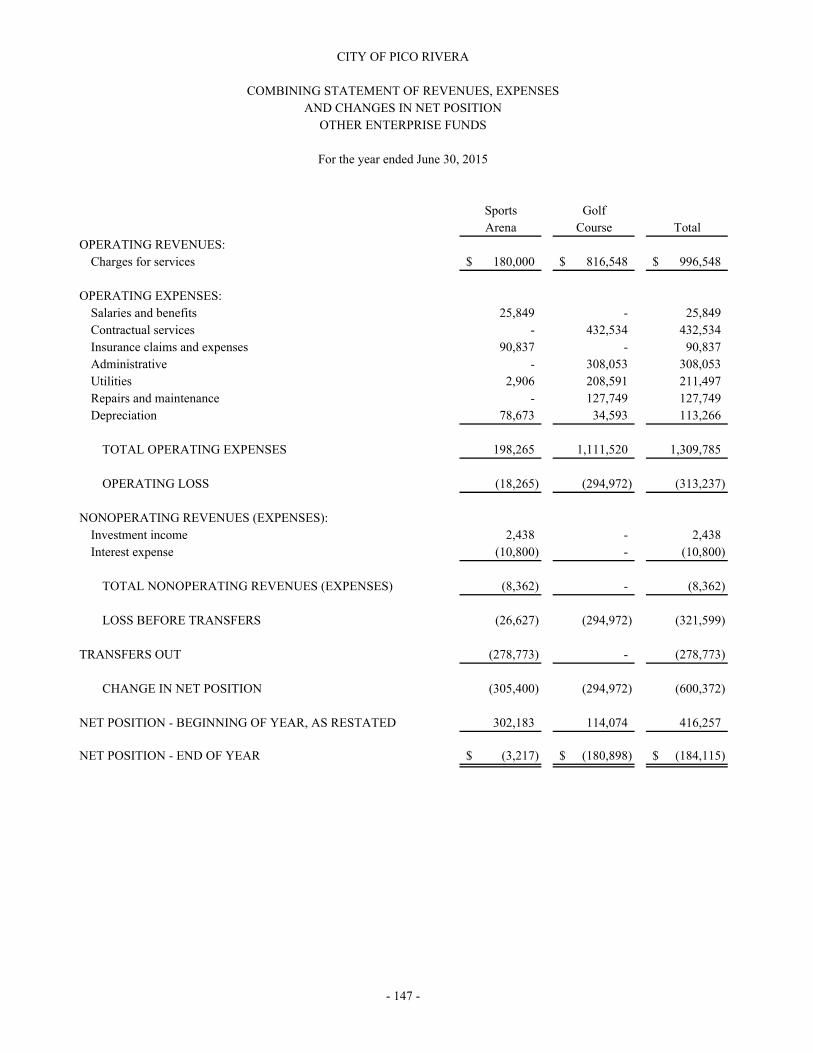
Sports Golf
Arena Course Total
OPERATING REVENUES:
Charges for services 180,000$ 816,548$ 996,548$
OPERATING EXPENSES:
Salaries and benefits 25,849 - 25,849
Contractual services - 432,534 432,534
Insurance claims and expenses 90,837 - 90,837
Administrative - 308,053 308,053
Utilities 2,906 208,591 211,497
Repairs and maintenance - 127,749 127,749
Depreciation 78,673 34,593 113,266
TOTAL OPERATING EXPENSES 198,265 1,111,520 1,309,785
OPERATING LOSS (18,265) (294,972) (313,237)
NONOPERATING REVENUES (EXPENSES):
Investment income 2,438 - 2,438
Interest expense (10,800) - (10,800)
TOTAL NONOPERATING REVENUES (EXPENSES) (8,362) - (8,362)
LOSS BEFORE TRANSFERS (26,627) (294,972) (321,599)
TRANSFERS OUT (278,773) - (278,773)
CHANGE IN NET POSITION (305,400) (294,972) (600,372)
NET POSITION - BEGINNING OF YEAR, AS RESTATED 302,183 114,074 416,257
NET POSITION - END OF YEAR (3,217)$ (180,898)$ (184,115)$
OTHER ENTERPRISE FUNDS
For the year ended June 30, 2015
CITY OF PICO RIVERA
COMBINING STATEMENT OF REVENUES, EXPENSES
AND CHANGES IN NET POSITION
- 147 -

Sports Golf
Arena Course TotalCASH FLOWS FROM OPERATING ACTIVITIES:Receipts from customers and users 180,000$ 856,625$ 1,036,625$ Payments to suppliers (94,477) (1,122,108) (1,216,585) Payments to employees (23,498) - (23,498)
NET CASH PROVIDED (USED) BY OPERATING ACTIVITIES 62,025 (265,483) (203,458)
CASH FLOWS FROM NONCAPITAL FINANCING ACTIVITIES:Proceeds from due to/from other funds - 142,672 142,672 Transfers paid to other funds (278,773) - (278,773)
NET CASH PROVIDED (USED) BYNONCAPITAL FINANCING ACTIVITIES (278,773) 142,672 (136,101)
CASH FLOWS FROM INVESTING ACTIVITIES:Interest received 2,382 - 2,382
NET DECREASE IN CASH AND CASH EQUIVALENTS (214,366) (122,811) (337,177)
CASH AND CASH EQUIVALENTS - BEGINNING OF YEAR 424,739 123,711 548,450
CASH AND CASH EQUIVALENTS - END OF YEAR 210,373$ 900$ 211,273$
RECONCILIATION OF OPERATING LOSS TO NETCASH PROVIDED (USED) BY OPERATING ACTIVITIES:Operating loss (18,265)$ (294,972)$ (313,237)$ Adjustments to reconcile operating loss to netcash provided (used) by operating activities:Depreciation 78,673 34,593 113,266 Changes in operating assets, deferred outflows of resources,liabilities, and deferred inflows of resources:
(Increase) decrease in accounts receivables - 41,877 41,877 (Increase) decrease in inventories - (13,654) (13,654) (Increase) decrease in deferred outflows of resources - amount from pension plans 187 - 187 Increase (decrease) in accounts payable (734) (56,926) (57,660) Increase (decrease) in accrued liabilities 2,482 14,195 16,677 Increase (decrease) in deposits payable - 9,404 9,404 Increase (decrease) in net pension liability (3,098) - (3,098) Increase (decrease) in deferred inflows of resources - amount from pension plans 2,780 - 2,780 Increase (decrease) in compensated absences - - - TOTAL ADJUSTMENTS 80,290 29,489 109,779
NET CASH PROVIDED (USED) BY OPERATING ACTIVITIES 62,025$ (265,483)$ (203,458)$
NONCASH INVESTING AND FINANCING ACTIVITIES:Changes in advances related to accrued interest 10,800$ -$ 10,800$
CITY OF PICO RIVERA
COMBINING STATEMENT OF CASH FLOWS
OTHER ENTERPRISE FUNDS
For the year ended June 30, 2015
- 148 -

- 149 -
CITY OF PICO RIVERA
DESCRIPTION OF INTERNAL SERVICE FUNDS
June 30, 2015
These funds account for the financing of services provided to one department to another on a cost-reimbursement basis.
OPEB Liability Fund accounts for funds accumulated to pay post-employment health benefit costs.
Leave Liability Fund accounts for funds accumulated to pay for vacation, sick, and comp time balances for current City employees.
Equipment Replacement Fund accounts for expenditures made for the purpose of purchasing equipment to replace obsolete, broken or other items in which it is economically unfeasible to continue repairing.

OPEB Leave Equipment
Liability Liability Replacement Total
ASSETS:
CURRENT ASSETS:
Cash and investments 7,638,302$ 563,588$ 1,123,080$ 9,324,970$
NET POSITION:
Unrestricted 7,638,302 563,588 1,123,080 9,324,970
TOTAL NET POSITION 7,638,302$ 563,588$ 1,123,080$ 9,324,970$
COMBINING STATEMENT OF NET POSITION
INTERNAL SERVICE FUNDS
June 30, 2015
- 150 -
CITY OF PICO RIVERA
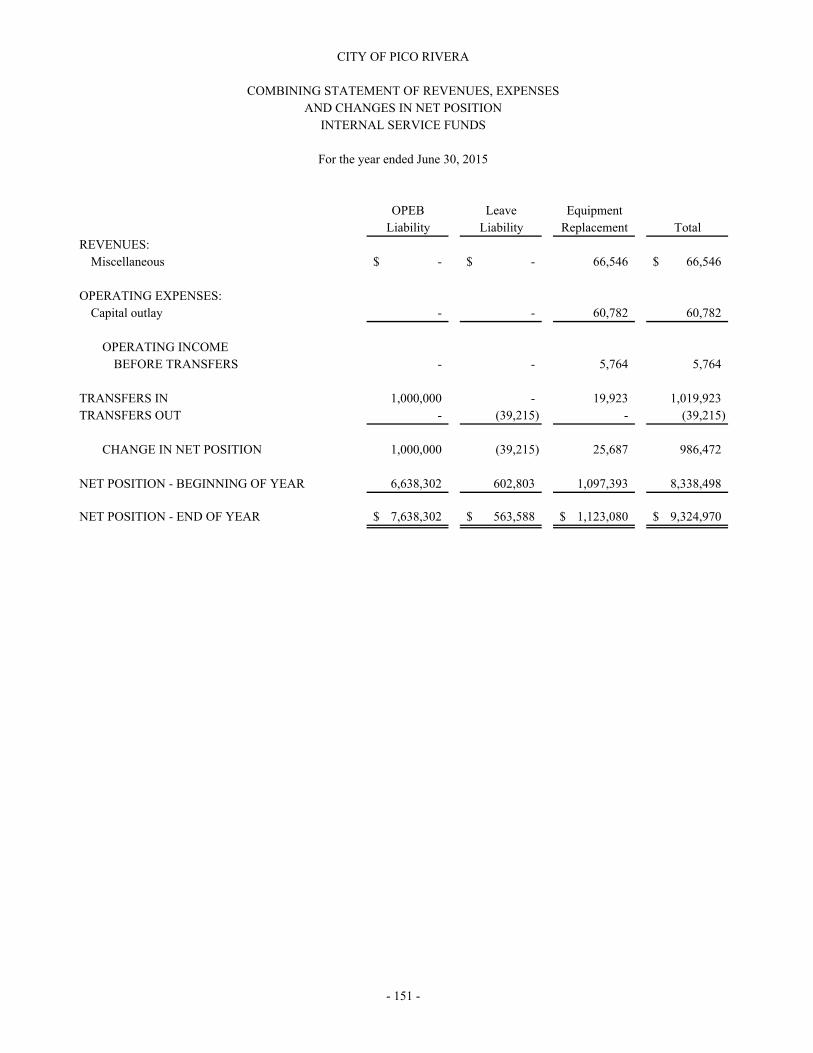
OPEB Leave Equipment
Liability Liability Replacement Total
REVENUES:
Miscellaneous -$ -$ 66,546 66,546$
OPERATING EXPENSES:
Capital outlay - - 60,782 60,782
OPERATING INCOME
BEFORE TRANSFERS - - 5,764 5,764
TRANSFERS IN 1,000,000 - 19,923 1,019,923
TRANSFERS OUT - (39,215) - (39,215)
CHANGE IN NET POSITION 1,000,000 (39,215) 25,687 986,472
NET POSITION - BEGINNING OF YEAR 6,638,302 602,803 1,097,393 8,338,498
NET POSITION - END OF YEAR 7,638,302$ 563,588$ 1,123,080$ 9,324,970$
- 151 -
CITY OF PICO RIVERA
COMBINING STATEMENT OF REVENUES, EXPENSES
AND CHANGES IN NET POSITION
INTERNAL SERVICE FUNDS
For the year ended June 30, 2015
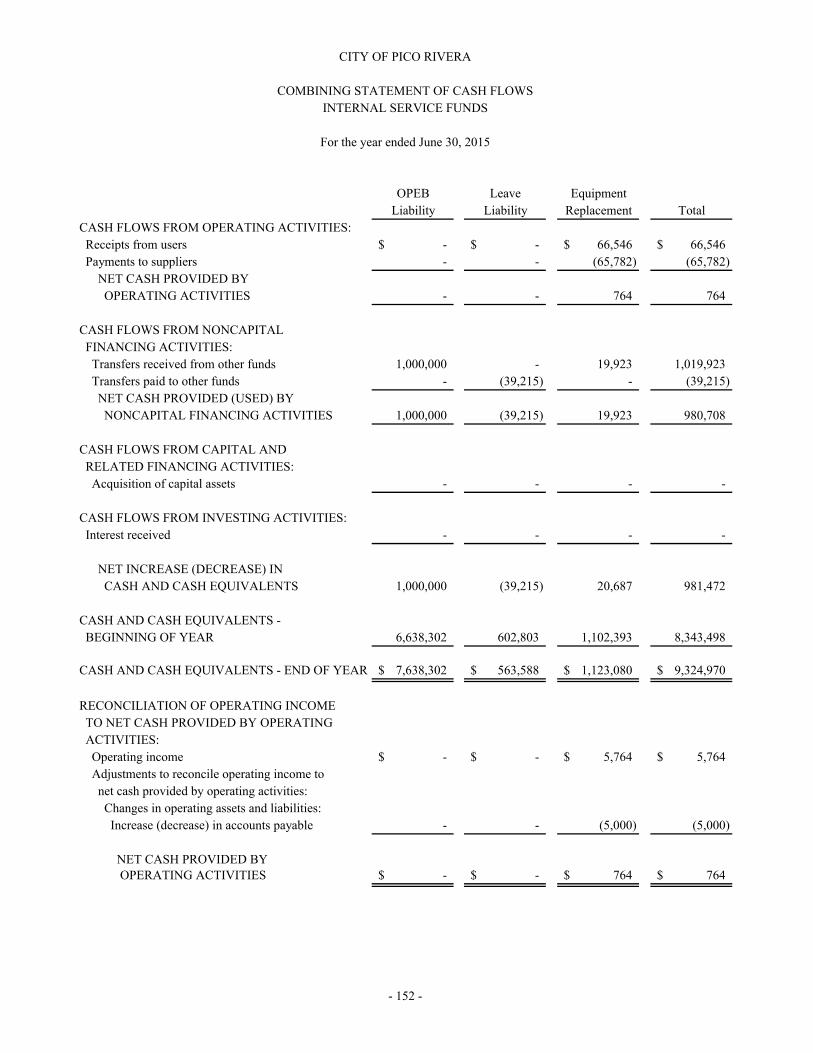
OPEB Leave Equipment
Liability Liability Replacement Total
CASH FLOWS FROM OPERATING ACTIVITIES:
Receipts from users -$ -$ 66,546$ 66,546$
Payments to suppliers - - (65,782) (65,782)
NET CASH PROVIDED BY
OPERATING ACTIVITIES - - 764 764
CASH FLOWS FROM NONCAPITAL
FINANCING ACTIVITIES:
Transfers received from other funds 1,000,000 - 19,923 1,019,923
Transfers paid to other funds - (39,215) - (39,215)
NET CASH PROVIDED (USED) BY
NONCAPITAL FINANCING ACTIVITIES 1,000,000 (39,215) 19,923 980,708
CASH FLOWS FROM CAPITAL AND
RELATED FINANCING ACTIVITIES:
Acquisition of capital assets - - - -
CASH FLOWS FROM INVESTING ACTIVITIES:
Interest received - - - -
NET INCREASE (DECREASE) IN
CASH AND CASH EQUIVALENTS 1,000,000 (39,215) 20,687 981,472
CASH AND CASH EQUIVALENTS -
BEGINNING OF YEAR 6,638,302 602,803 1,102,393 8,343,498
CASH AND CASH EQUIVALENTS - END OF YEAR 7,638,302$ 563,588$ 1,123,080$ 9,324,970$
RECONCILIATION OF OPERATING INCOME
TO NET CASH PROVIDED BY OPERATING
ACTIVITIES:
Operating income -$ -$ 5,764$ 5,764$
Adjustments to reconcile operating income to
net cash provided by operating activities:
Changes in operating assets and liabilities:
Increase (decrease) in accounts payable - - (5,000) (5,000)
NET CASH PROVIDED BY OPERATING ACTIVITIES -$ -$ 764$ 764$
CITY OF PICO RIVERA
COMBINING STATEMENT OF CASH FLOWS
INTERNAL SERVICE FUNDS
For the year ended June 30, 2015
- 152 -
- 153 -
CITY OF PICO RIVERA
DESCRIPTION OF AGENCY FUNDS
June 30, 2015
Agency Funds account for assets held by the City as an agent for bond assessment districts. The Agency Funds are as follows:
Assessment District 95-1 Improvement Agency Fund accounts for monies received for the payment of the Special Assessment Bonds. Funds are annually assessed to each respective property owner by the Los Angeles County Tax Collector and remitted to the City.
Southeast Water Coalition Joint Powers Authority Fund accounts for activities in Southeast Water Coalition organized under a Joint Powers Agreement.
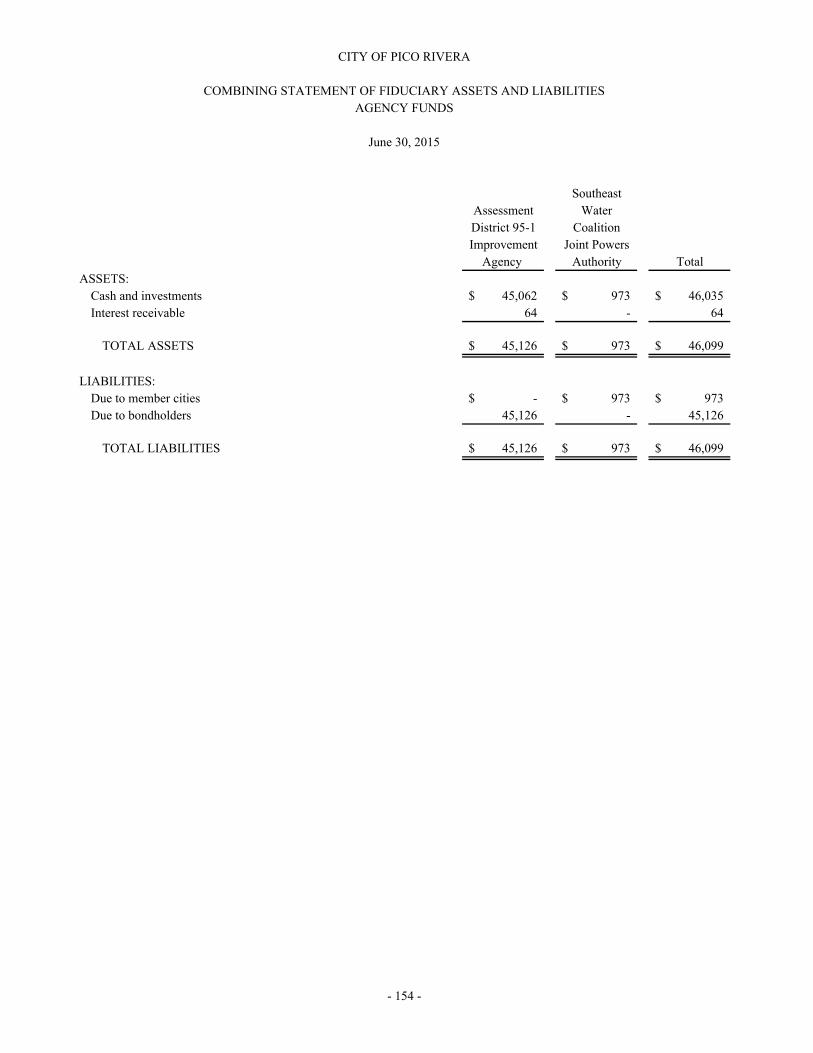
Southeast
Assessment Water
District 95-1 Coalition
Improvement Joint Powers
Agency Authority Total
ASSETS:
Cash and investments 45,062$ 973$ 46,035$
Interest receivable 64 - 64
TOTAL ASSETS 45,126$ 973$ 46,099$
LIABILITIES:
Due to member cities -$ 973$ 973$
Due to bondholders 45,126 - 45,126
TOTAL LIABILITIES 45,126$ 973$ 46,099$
- 154 -
CITY OF PICO RIVERA
COMBINING STATEMENT OF FIDUCIARY ASSETS AND LIABILITIES
June 30, 2015
AGENCY FUNDS

Balance Balance
July 1, June 30,
2014 Additions Deletions 2015
ASSETS:
Cash and investments 42,794$ 2,268$ -$ 45,062$
Interest receivable 47 17 - 64
TOTAL ASSETS 42,841$ 2,285$ -$ 45,126$
LIABILITIES:Due to bondholders 42,841$ 2,285$ -$ 45,126$
ASSETS:Cash and investments 227,872$ 973$ (227,872)$ 973$
LIABILITIES:
Accounts payable 20,537$ -$ (20,537)$ -$
Due to member cities 207,335 973 (207,335) 973 TOTAL LIABILITIES 227,872$ 973$ (227,872)$ 973$
ASSETS:
Cash and investments 270,666$ 3,241$ (227,872)$ 46,035$
Interest receivable 47 17 - 64
TOTAL ASSETS 270,713$ 3,258$ (227,872)$ 46,099$
LIABILITIES:
Accounts payable 20,537$ -$ (20,537)$ -$
Due to member cities 207,335 973 (207,335) 973
Due to bondholders 42,841 2,285 - 45,126
TOTAL LIABILITIES 270,713$ 3,258$ (227,872)$ 46,099$
SOUTHEAST WATER COALITION
JOINT POWERS AUTHORITY
TOTAL
- 155 -
IMPROVEMENT AGENCY
CITY OF PICO RIVERA
COMBINING STATEMENT OF CHANGES IN FIDUCIARY ASSETS AND LIABILITIES
AGENCY FUNDS
For the year ended June 30, 2015
ASSESSMENT DISTRICT 95-1

- 156 -
This page intentionally left blank.

- 157 -
STATISTICAL SECTION(UNAUDITED)

- 158 -
This page intentionally left blank.
- 159 -
CITY OF PICO RIVERA
DESCRIPTION OF STATISTICAL SECTION CONTENTS
June 30, 2015
This part of the City of Pico Rivera’s comprehensive annual financial report presents detailed information as a context for understanding what the information in the financial statements, note disclosures, and required supplementary information say about the government’s overall financial health.
Contents: Pages
Financial Trends - These schedules contain trend information that may assist the reader in understanding the City’s current financial performance by placing it in historical perspective. 160 - 168
Revenue Capacity - These schedules contain information that may help in assessing the viability of the City’s most significant revenue sources -property taxes, transient occupancy tax (TOT) and sales tax. 170 - 179
Debt Capacity - These schedules present information that may assist the reader in analyzing the affordability of the City’s current levels of outstanding debt and the City’s ability to issue additional debt in the future. 180 - 186
Demographic and Economic Information - These schedules offer demographic and economic indicators to help the reader understand the environment within which the City’s financial activities take place. 187 - 188
Operating Information - These schedules contain service and infrastructure indicators that may assist the reader in understanding how the information in the City’s financial report relates to the services the City provides and the activities it performs. 189 - 193
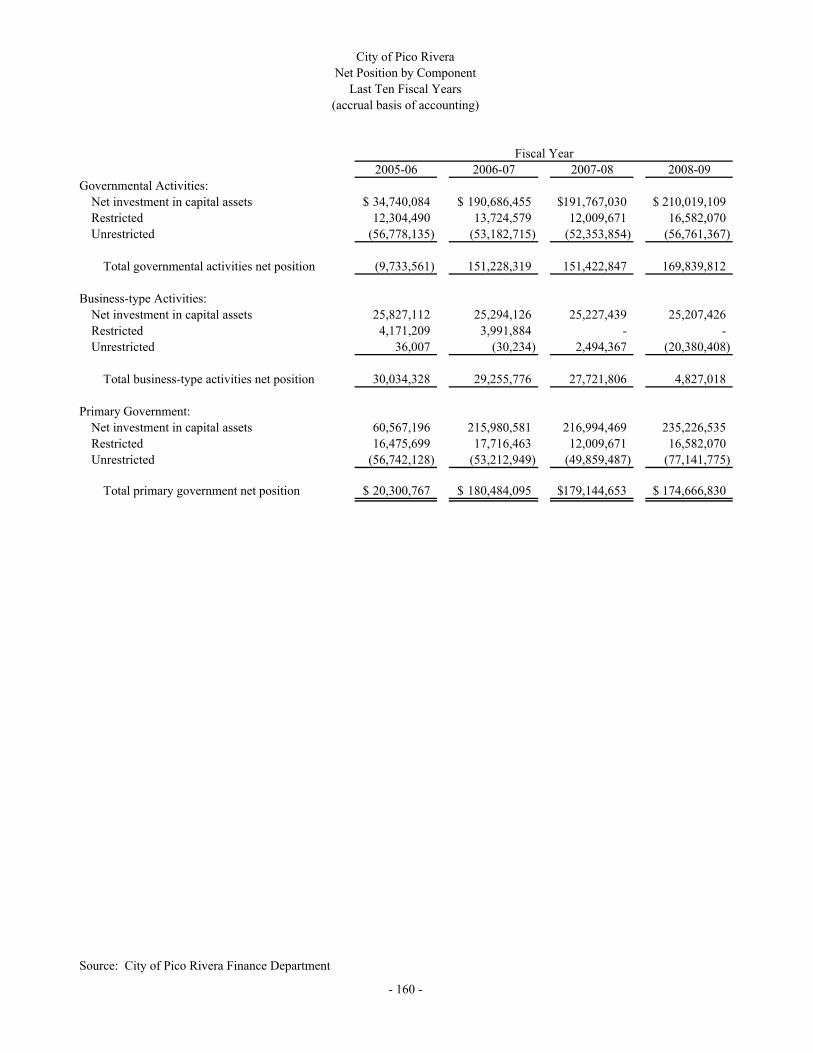
2005-06 2006-07 2007-08 2008-09
Governmental Activities:
Net investment in capital assets 34,740,084$ 190,686,455$ 191,767,030$ 210,019,109$
Restricted 12,304,490 13,724,579 12,009,671 16,582,070
Unrestricted (56,778,135) (53,182,715) (52,353,854) (56,761,367)
Total governmental activities net position (9,733,561) 151,228,319 151,422,847 169,839,812
Business-type Activities:
Invested in Capital Assets, net of related debtNet investment in capital assets 25,827,112 25,294,126 25,227,439 25,207,426
RestrictedRestricted 4,171,209 3,991,884 - -
UnrestrictedUnrestricted 36,007 (30,234) 2,494,367 (20,380,408)
Total business-type activities net position 30,034,328 29,255,776 27,721,806 4,827,018
Primary Government:
Invested in Capital Assets, net of related debtNet investment in capital assets 60,567,196 215,980,581 216,994,469 235,226,535
RestrictedRestricted 16,475,699 17,716,463 12,009,671 16,582,070
UnrestrictedUnrestricted (56,742,128) (53,212,949) (49,859,487) (77,141,775)
Total primary government net position 20,300,767$ 180,484,095$ 179,144,653$ 174,666,830$
Source: City of Pico Rivera Finance Department
- 160 -
City of Pico Rivera
Net Position by Component
Last Ten Fiscal Years
(accrual basis of accounting)
Fiscal Year
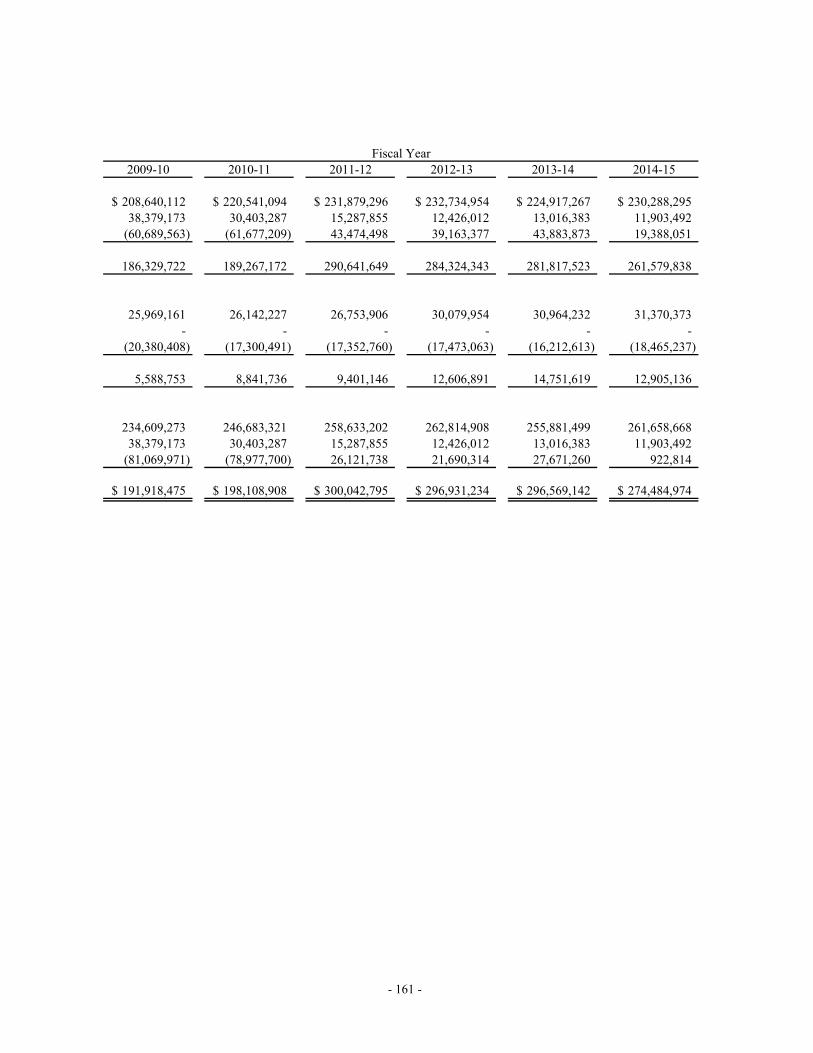
2009-10 2010-11 2011-12 2012-13 2013-14 2014-15
208,640,112$ 220,541,094$ 231,879,296$ 232,734,954$ 224,917,267$ 230,288,295$
38,379,173 30,403,287 15,287,855 12,426,012 13,016,383 11,903,492
(60,689,563) (61,677,209) 43,474,498 39,163,377 43,883,873 19,388,051
186,329,722 189,267,172 290,641,649 284,324,343 281,817,523 261,579,838
25,969,161 26,142,227 26,753,906 30,079,954 30,964,232 31,370,373
- - - - - -
(20,380,408) (17,300,491) (17,352,760) (17,473,063) (16,212,613) (18,465,237)
5,588,753 8,841,736 9,401,146 12,606,891 14,751,619 12,905,136
234,609,273 246,683,321 258,633,202 262,814,908 255,881,499 261,658,668
38,379,173 30,403,287 15,287,855 12,426,012 13,016,383 11,903,492
(81,069,971) (78,977,700) 26,121,738 21,690,314 27,671,260 922,814
191,918,475$ 198,108,908$ 300,042,795$ 296,931,234$ 296,569,142$ 274,484,974$
- 161 -
Fiscal Year
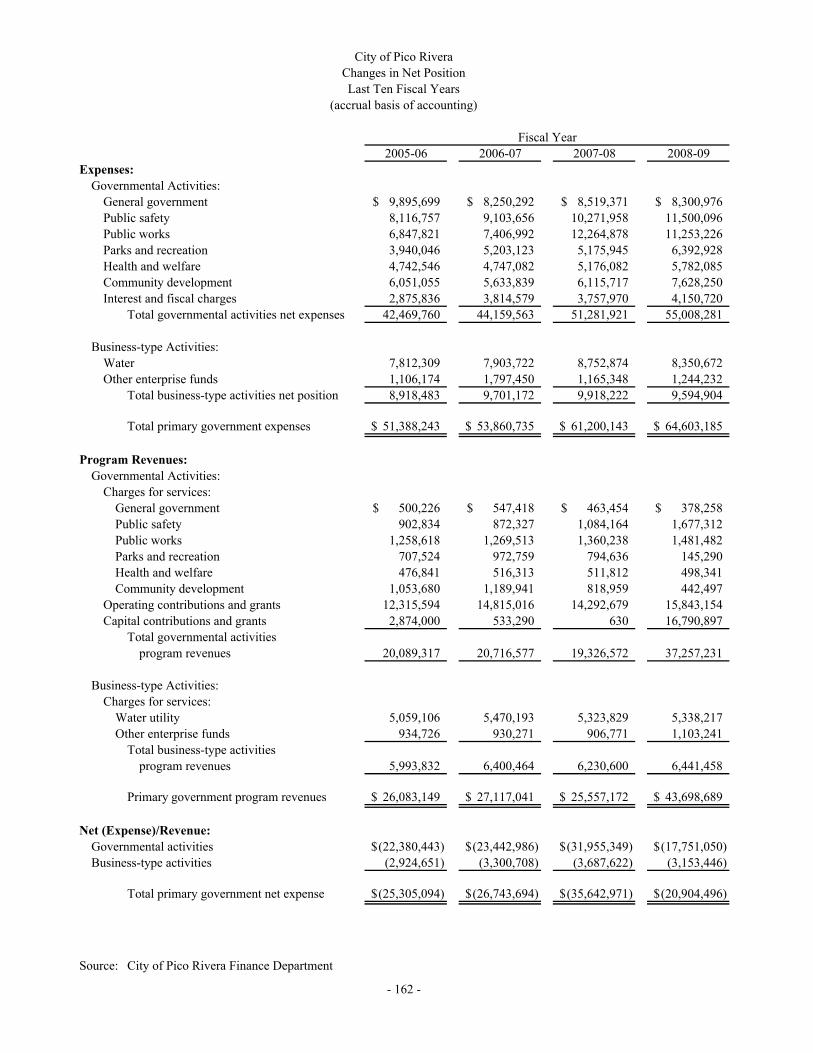
2005-06 2006-07 2007-08 2008-09
Expenses:
Governmental Activities:
General governmentGeneral government 9,895,699$ 8,250,292$ 8,519,371$ 8,300,976$
LeisurePublic safety 8,116,757 9,103,656 10,271,958 11,500,096
TransportationPublic works 6,847,821 7,406,992 12,264,878 11,253,226
Public ProtectionParks and recreation 3,940,046 5,203,123 5,175,945 6,392,928
DevelopmentHealth and welfare 4,742,546 4,747,082 5,176,082 5,782,085
EnvironmentalCommunity development 6,051,055 5,633,839 6,115,717 7,628,250
Interest Interest and fiscal charges 2,875,836 3,814,579 3,757,970 4,150,720
Total governmental activities net expenses 42,469,760 44,159,563 51,281,921 55,008,281
Business-type Activities:
Water 7,812,309 7,903,722 8,752,874 8,350,672
Water Other enterprise funds 1,106,174 1,797,450 1,165,348 1,244,232
Total business-type activities net position 8,918,483 9,701,172 9,918,222 9,594,904
Total primary government expenses 51,388,243$ 53,860,735$ 61,200,143$ 64,603,185$
Program Revenues:
Governmental Activities:
Charges for services:
General government 500,226$ 547,418$ 463,454$ 378,258$
Public safety 902,834 872,327 1,084,164 1,677,312
Public works 1,258,618 1,269,513 1,360,238 1,481,482
Parks and recreation 707,524 972,759 794,636 145,290
Health and welfare 476,841 516,313 511,812 498,341
Community development 1,053,680 1,189,941 818,959 442,497
Operating contributions and grants 12,315,594 14,815,016 14,292,679 15,843,154
Capital contributions and grants 2,874,000 533,290 630 16,790,897
Total governmental activities
program revenues 20,089,317 20,716,577 19,326,572 37,257,231
Business-type Activities:
Charges for services:
Water utility 5,059,106 5,470,193 5,323,829 5,338,217
Other enterprise funds 934,726 930,271 906,771 1,103,241
Total business-type activities
program revenues 5,993,832 6,400,464 6,230,600 6,441,458
Primary government program revenues 26,083,149$ 27,117,041$ 25,557,172$ 43,698,689$
Net (Expense)/Revenue:
Governmental activities (22,380,443)$ (23,442,986)$ (31,955,349)$ (17,751,050)$
Business-type activities (2,924,651) (3,300,708) (3,687,622) (3,153,446)
Total primary government net expense (25,305,094)$ (26,743,694)$ (35,642,971)$ (20,904,496)$
Source: City of Pico Rivera Finance Department
- 162 -
Fiscal Year
City of Pico Rivera
Changes in Net Position
Last Ten Fiscal Years
(accrual basis of accounting)
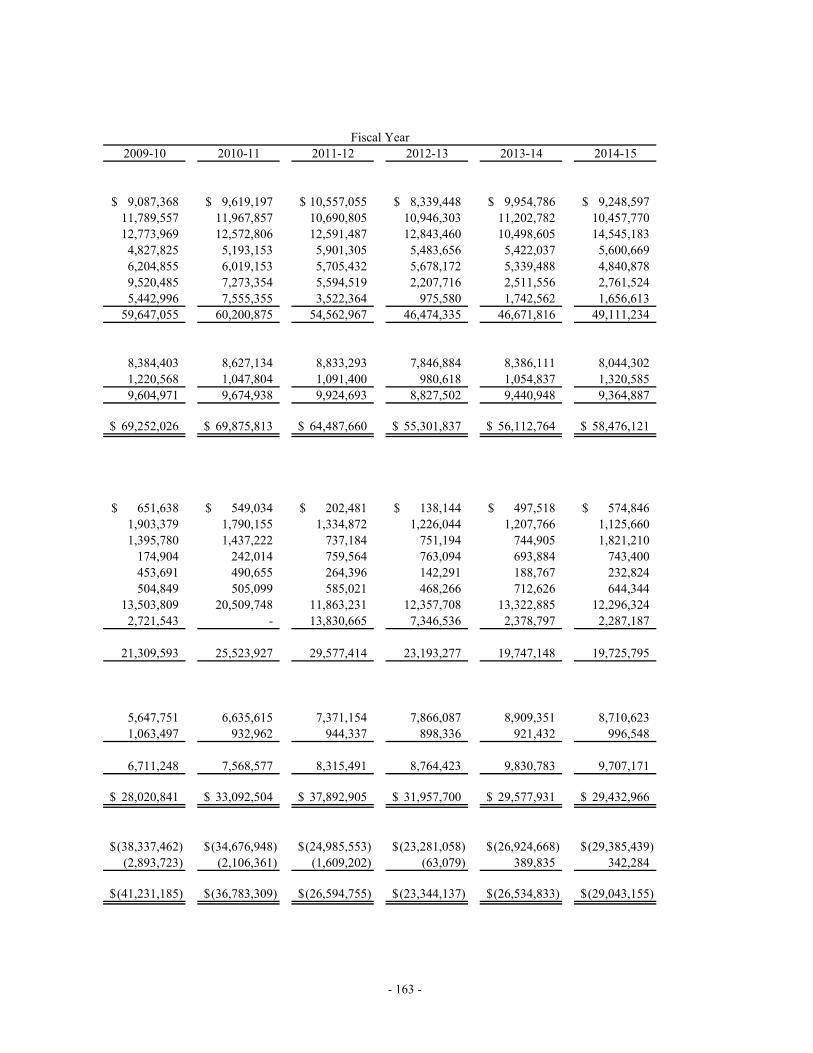
2009-10 2010-11 2011-12 2012-13 2013-14 2014-15
9,087,368$ 9,619,197$ 10,557,055$ 8,339,448$ 9,954,786$ 9,248,597$
11,789,557 11,967,857 10,690,805 10,946,303 11,202,782 10,457,770
12,773,969 12,572,806 12,591,487 12,843,460 10,498,605 14,545,183
4,827,825 5,193,153 5,901,305 5,483,656 5,422,037 5,600,669
6,204,855 6,019,153 5,705,432 5,678,172 5,339,488 4,840,878
9,520,485 7,273,354 5,594,519 2,207,716 2,511,556 2,761,524
5,442,996 7,555,355 3,522,364 975,580 1,742,562 1,656,613
59,647,055 60,200,875 54,562,967 46,474,335 46,671,816 49,111,234
8,384,403 8,627,134 8,833,293 7,846,884 8,386,111 8,044,302
1,220,568 1,047,804 1,091,400 980,618 1,054,837 1,320,585
9,604,971 9,674,938 9,924,693 8,827,502 9,440,948 9,364,887
69,252,026$ 69,875,813$ 64,487,660$ 55,301,837$ 56,112,764$ 58,476,121$
651,638$ 549,034$ 202,481$ 138,144$ 497,518$ 574,846$
1,903,379 1,790,155 1,334,872 1,226,044 1,207,766 1,125,660
1,395,780 1,437,222 737,184 751,194 744,905 1,821,210
174,904 242,014 759,564 763,094 693,884 743,400
453,691 490,655 264,396 142,291 188,767 232,824
504,849 505,099 585,021 468,266 712,626 644,344
13,503,809 20,509,748 11,863,231 12,357,708 13,322,885 12,296,324
2,721,543 - 13,830,665 7,346,536 2,378,797 2,287,187
21,309,593 25,523,927 29,577,414 23,193,277 19,747,148 19,725,795
5,647,751 6,635,615 7,371,154 7,866,087 8,909,351 8,710,623
1,063,497 932,962 944,337 898,336 921,432 996,548
6,711,248 7,568,577 8,315,491 8,764,423 9,830,783 9,707,171
28,020,841$ 33,092,504$ 37,892,905$ 31,957,700$ 29,577,931$ 29,432,966$
(38,337,462)$ (34,676,948)$ (24,985,553)$ (23,281,058)$ (26,924,668)$ (29,385,439)$
(2,893,723) (2,106,361) (1,609,202) (63,079) 389,835 342,284
(41,231,185)$ (36,783,309)$ (26,594,755)$ (23,344,137)$ (26,534,833)$ (29,043,155)$
- 163 -
Fiscal Year
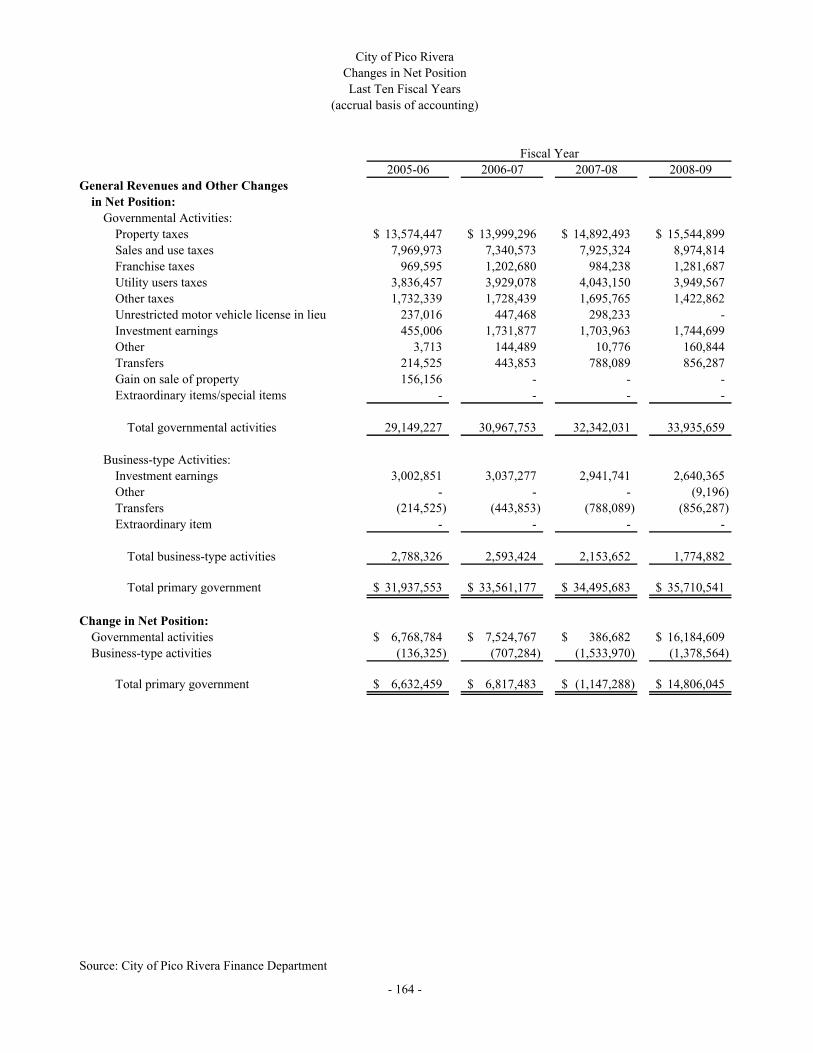
2005-06 2006-07 2007-08 2008-09
General Revenues and Other Changes
in Net Position:
Governmental Activities:
Property taxes 13,574,447$ 13,999,296$ 14,892,493$ 15,544,899$
Sales and use taxes 7,969,973 7,340,573 7,925,324 8,974,814
Franchise taxes 969,595 1,202,680 984,238 1,281,687
Utility users taxes 3,836,457 3,929,078 4,043,150 3,949,567
Other taxes 1,732,339 1,728,439 1,695,765 1,422,862
Unrestricted motor vehicle license in lieu 237,016 447,468 298,233 -
Investment earnings 455,006 1,731,877 1,703,963 1,744,699
Other 3,713 144,489 10,776 160,844
Transfers 214,525 443,853 788,089 856,287
Gain on sale of property 156,156 - - -
Extraordinary items/special items - - - -
Total governmental activities 29,149,227 30,967,753 32,342,031 33,935,659
Business-type Activities:
Investment earnings 3,002,851 3,037,277 2,941,741 2,640,365
Other - - - (9,196)
Transfers (214,525) (443,853) (788,089) (856,287)
Extraordinary item - - - -
Total business-type activities 2,788,326 2,593,424 2,153,652 1,774,882
Total primary government 31,937,553$ 33,561,177$ 34,495,683$ 35,710,541$
Change in Net Position:
Governmental activities 6,768,784$ 7,524,767$ 386,682$ 16,184,609$
Business-type activities (136,325) (707,284) (1,533,970) (1,378,564)
Total primary government 6,632,459$ 6,817,483$ (1,147,288)$ 14,806,045$
Source: City of Pico Rivera Finance Department
Fiscal Year
- 164 -
City of Pico Rivera
Changes in Net Position
Last Ten Fiscal Years
(accrual basis of accounting)

2009-10 2010-11 2011-12 2012-13 2013-14 2014-15
15,116,791$ 15,783,650$ 8,468,881$ 8,941,441$ 9,269,468$ 9,611,244$
13,074,986 13,492,573 13,589,387 15,028,866 16,435,053 16,368,367
1,155,951 1,180,286 1,212,463 1,683,174 1,641,171 1,646,884
3,669,717 3,455,256 3,365,218 3,397,538 3,504,363 3,525,036
1,331,305 1,324,669 1,510,718 1,595,125 1,710,630 1,760,876
- - 3,538,844 - - -
1,372,901 1,393,205 1,399,894 209,340 39,582 151,636
241,124 269,191 130,451 125,691 139,486 613,592
460,309 (2,510,743) 136,520 371,165 648,626 611,727
- - 162,675 205,756 104,912 257,194
- 3,227,121 124,908,663 (10,921,476) (9,075,443) 1,059,577
36,423,084 37,615,208 158,423,714 20,636,620 24,417,848 35,606,133
2,591,363 2,847,404 2,449,432 2,367,181 2,308,060 2,226,339
4,696 - - 4,898 95,459 -
(460,309) 2,511,939 (136,520) (371,165) (648,626) (611,727)
- - - (149,583) - -
2,135,750 5,359,343 2,312,912 1,851,331 1,754,893 1,614,612
38,558,834$ 42,974,551$ 160,736,626$ 22,487,951$ 26,172,741$ 37,220,745$
(1,914,378)$ 2,938,260$ 133,438,161$ (2,644,438)$ (2,506,820)$ 6,220,694$
(757,973) 3,252,982 703,710 1,788,252 2,144,728 1,956,896
(2,672,351)$ 6,191,242$ 134,141,871$ (856,186)$ (362,092)$ 8,177,590$
Fiscal Year
- 165 -

2005-06 2006-07 2007-08 2008-09
General Fund:
Nonspendable -$ -$ -$ -$
Restricted - - - -
Committed - - - -
Assigned - - - -
Unassigned - - - -
Reserved 9,856,378 9,285,657 9,064,673 35,849,151
Unreserved 2,868,707 7,359,548 7,648,759 8,569,891
Total general fund 12,725,085$ 16,645,205$ 16,713,432$ 44,419,042$
All Other Governmental Funds:
Nonspendable -$ -$ -$ -$
Restricted - - - -
Committed - - - -
Assigned - - - -
Unassigned - - - -
Reserved 2,139,102 2,372,780 2,781,570 9,137,369
Unreserved, reported in:
Special revenue funds 10,647,724 20,753,477 19,263,734 8,578,604
Debt service funds (27,708,365) (35,256,066) (34,960,091) (35,126,372)
Capital projects funds (24,888,349) (25,348,977) (25,453,373) (27,696,411)
Total all other governmental funds (39,809,888)$ (37,478,786)$ (38,368,160)$ (45,106,810)$
Note: Implementation of GASB Statement No. 54, "Fund Balance Reporting and Governmental Fund Type
Definition" beginning in fiscal year 2010-11 changed the nature of fund balance classifications.
Source: City of Pico Rivera Finance Department
- 166 -
Fiscal Year
City of Pico Rivera
Fund Balances of Governmental Funds
Last Ten Fiscal Years
(modified accrual basis of accounting)
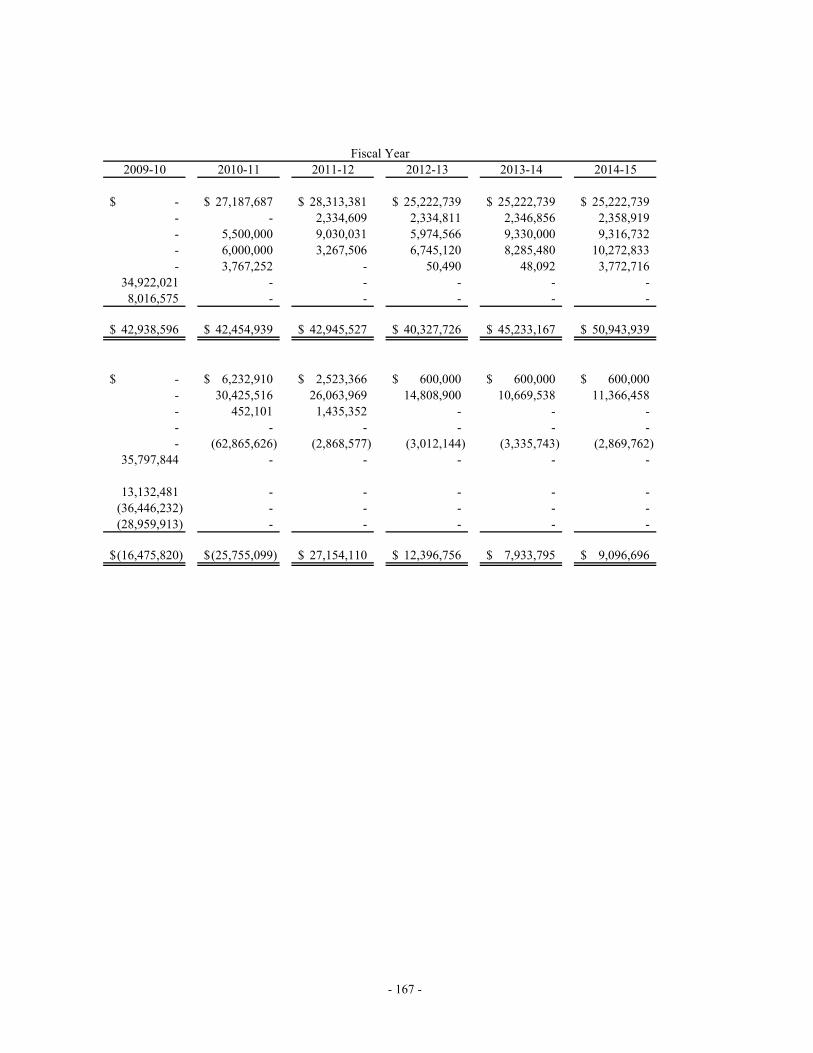
2009-10 2010-11 2011-12 2012-13 2013-14 2014-15
-$ 27,187,687$ 28,313,381$ 25,222,739$ 25,222,739$ 25,222,739$
- - 2,334,609 2,334,811 2,346,856 2,358,919
- 5,500,000 9,030,031 5,974,566 9,330,000 9,316,732
- 6,000,000 3,267,506 6,745,120 8,285,480 10,272,833
- 3,767,252 - 50,490 48,092 3,772,716
34,922,021 - - - - -
8,016,575 - - - - -
42,938,596$ 42,454,939$ 42,945,527$ 40,327,726$ 45,233,167$ 50,943,939$
-$ 6,232,910$ 2,523,366$ 600,000$ 600,000$ 600,000$
- 30,425,516 26,063,969 14,808,900 10,669,538 11,366,458
- 452,101 1,435,352 - - -
- - - - - -
- (62,865,626) (2,868,577) (3,012,144) (3,335,743) (2,869,762)
35,797,844 - - - - -
13,132,481 - - - - -
(36,446,232) - - - - -
(28,959,913) - - - - -
(16,475,820)$ (25,755,099)$ 27,154,110$ 12,396,756$ 7,933,795$ 9,096,696$
- 167 -
Fiscal Year
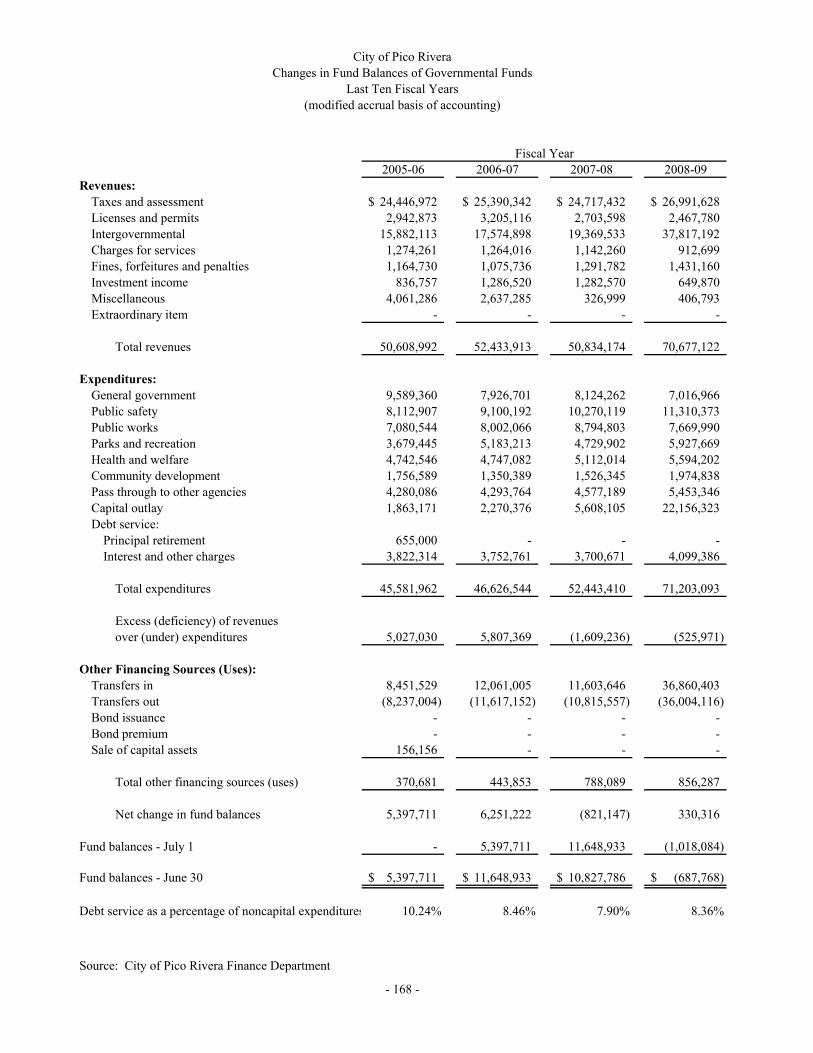
2005-06 2006-07 2007-08 2008-09
Revenues:
Taxes and assessment 24,446,972$ 25,390,342$ 24,717,432$ 26,991,628$
Licenses and permits 2,942,873 3,205,116 2,703,598 2,467,780
Intergovernmental 15,882,113 17,574,898 19,369,533 37,817,192
Charges for services 1,274,261 1,264,016 1,142,260 912,699
Fines, forfeitures and penalties 1,164,730 1,075,736 1,291,782 1,431,160
Investment income 836,757 1,286,520 1,282,570 649,870
Miscellaneous 4,061,286 2,637,285 326,999 406,793
Extraordinary item - - - -
Total revenues 50,608,992 52,433,913 50,834,174 70,677,122
Expenditures:
General government 9,589,360 7,926,701 8,124,262 7,016,966
Public safety 8,112,907 9,100,192 10,270,119 11,310,373
Public works 7,080,544 8,002,066 8,794,803 7,669,990
Parks and recreation 3,679,445 5,183,213 4,729,902 5,927,669
Health and welfare 4,742,546 4,747,082 5,112,014 5,594,202
Community development 1,756,589 1,350,389 1,526,345 1,974,838
Pass through to other agencies 4,280,086 4,293,764 4,577,189 5,453,346
Capital outlay 1,863,171 2,270,376 5,608,105 22,156,323
Debt service:
Principal retirement 655,000 - - -
Interest and other charges 3,822,314 3,752,761 3,700,671 4,099,386
Total expenditures 45,581,962 46,626,544 52,443,410 71,203,093
Excess (deficiency) of revenues
over (under) expenditures 5,027,030 5,807,369 (1,609,236) (525,971)
Other Financing Sources (Uses):
Transfers in 8,451,529 12,061,005 11,603,646 36,860,403
Transfers out (8,237,004) (11,617,152) (10,815,557) (36,004,116)
Bond issuance - - - -
Bond premium - - - -
Sale of capital assets 156,156 - - -
Total other financing sources (uses) 370,681 443,853 788,089 856,287
Net change in fund balances 5,397,711 6,251,222 (821,147) 330,316
Fund balances - July 1 - 5,397,711 11,648,933 (1,018,084)
Fund balances - June 30 5,397,711$ 11,648,933$ 10,827,786$ (687,768)$
Debt service as a percentage of noncapital expenditures 10.24% 8.46% 7.90% 8.36%
Source: City of Pico Rivera Finance Department
Fiscal Year
- 168 -
City of Pico Rivera
Changes in Fund Balances of Governmental Funds
Last Ten Fiscal Years
(modified accrual basis of accounting)
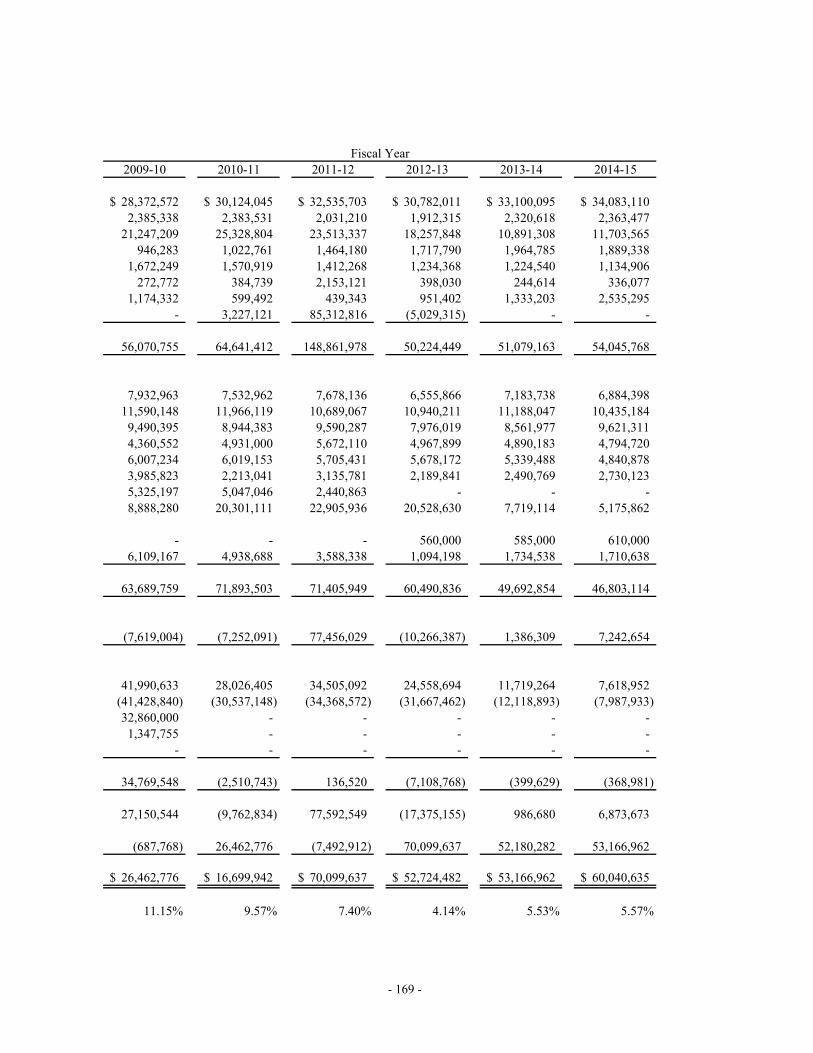
2009-10 2010-11 2011-12 2012-13 2013-14 2014-15
28,372,572$ 30,124,045$ 32,535,703$ 30,782,011$ 33,100,095$ 34,083,110$
2,385,338 2,383,531 2,031,210 1,912,315 2,320,618 2,363,477
21,247,209 25,328,804 23,513,337 18,257,848 10,891,308 11,703,565
946,283 1,022,761 1,464,180 1,717,790 1,964,785 1,889,338
1,672,249 1,570,919 1,412,268 1,234,368 1,224,540 1,134,906
272,772 384,739 2,153,121 398,030 244,614 336,077
1,174,332 599,492 439,343 951,402 1,333,203 2,535,295
- 3,227,121 85,312,816 (5,029,315) - -
56,070,755 64,641,412 148,861,978 50,224,449 51,079,163 54,045,768
7,932,963 7,532,962 7,678,136 6,555,866 7,183,738 6,884,398
11,590,148 11,966,119 10,689,067 10,940,211 11,188,047 10,435,184
9,490,395 8,944,383 9,590,287 7,976,019 8,561,977 9,621,311
4,360,552 4,931,000 5,672,110 4,967,899 4,890,183 4,794,720
6,007,234 6,019,153 5,705,431 5,678,172 5,339,488 4,840,878
3,985,823 2,213,041 3,135,781 2,189,841 2,490,769 2,730,123
5,325,197 5,047,046 2,440,863 - - -
8,888,280 20,301,111 22,905,936 20,528,630 7,719,114 5,175,862
- - - 560,000 585,000 610,000
6,109,167 4,938,688 3,588,338 1,094,198 1,734,538 1,710,638
63,689,759 71,893,503 71,405,949 60,490,836 49,692,854 46,803,114
(7,619,004) (7,252,091) 77,456,029 (10,266,387) 1,386,309 7,242,654
41,990,633 28,026,405 34,505,092 24,558,694 11,719,264 7,618,952
(41,428,840) (30,537,148) (34,368,572) (31,667,462) (12,118,893) (7,987,933)
32,860,000 - - - - -
1,347,755 - - - - -
- - - - - -
34,769,548 (2,510,743) 136,520 (7,108,768) (399,629) (368,981)
27,150,544 (9,762,834) 77,592,549 (17,375,155) 986,680 6,873,673
(687,768) 26,462,776 (7,492,912) 70,099,637 52,180,282 53,166,962
26,462,776$ 16,699,942$ 70,099,637$ 52,724,482$ 53,166,962$ 60,040,635$
11.15% 9.57% 7.40% 4.14% 5.53% 5.57%
- 169 -
Fiscal Year
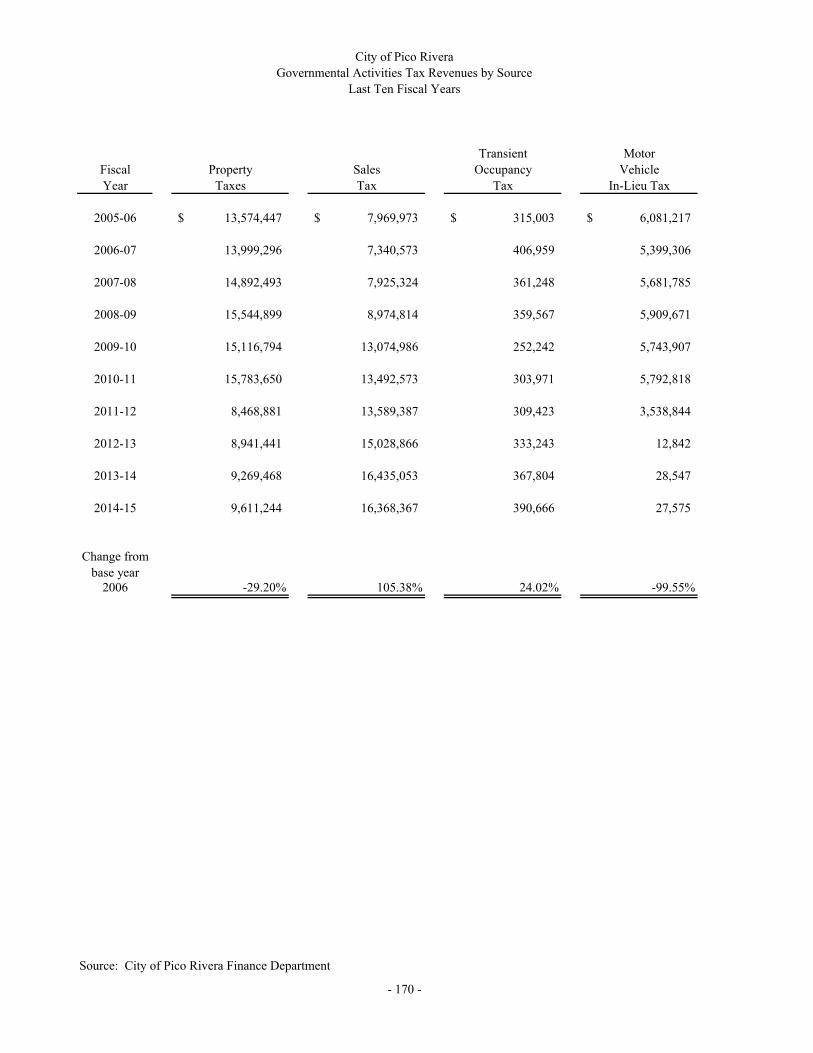
Transient Motor
Fiscal Property Sales Occupancy Vehicle
Year Taxes Tax Tax In-Lieu Tax
2005-06 13,574,447$ 7,969,973$ 315,003$ 6,081,217$
2006-07 13,999,296 7,340,573 406,959 5,399,306
2007-08 14,892,493 7,925,324 361,248 5,681,785
2008-09 15,544,899 8,974,814 359,567 5,909,671
2009-10 15,116,794 13,074,986 252,242 5,743,907
2010-11 15,783,650 13,492,573 303,971 5,792,818
2011-12 8,468,881 13,589,387 309,423 3,538,844
2012-13 8,941,441 15,028,866 333,243 12,842
2013-14 9,269,468 16,435,053 367,804 28,547
2014-15 9,611,244 16,368,367 390,666 27,575
Change from
base year2006 -29.20% 105.38% 24.02% -99.55%
Source: City of Pico Rivera Finance Department
City of Pico Rivera
Governmental Activities Tax Revenues by Source
Last Ten Fiscal Years
- 170 -
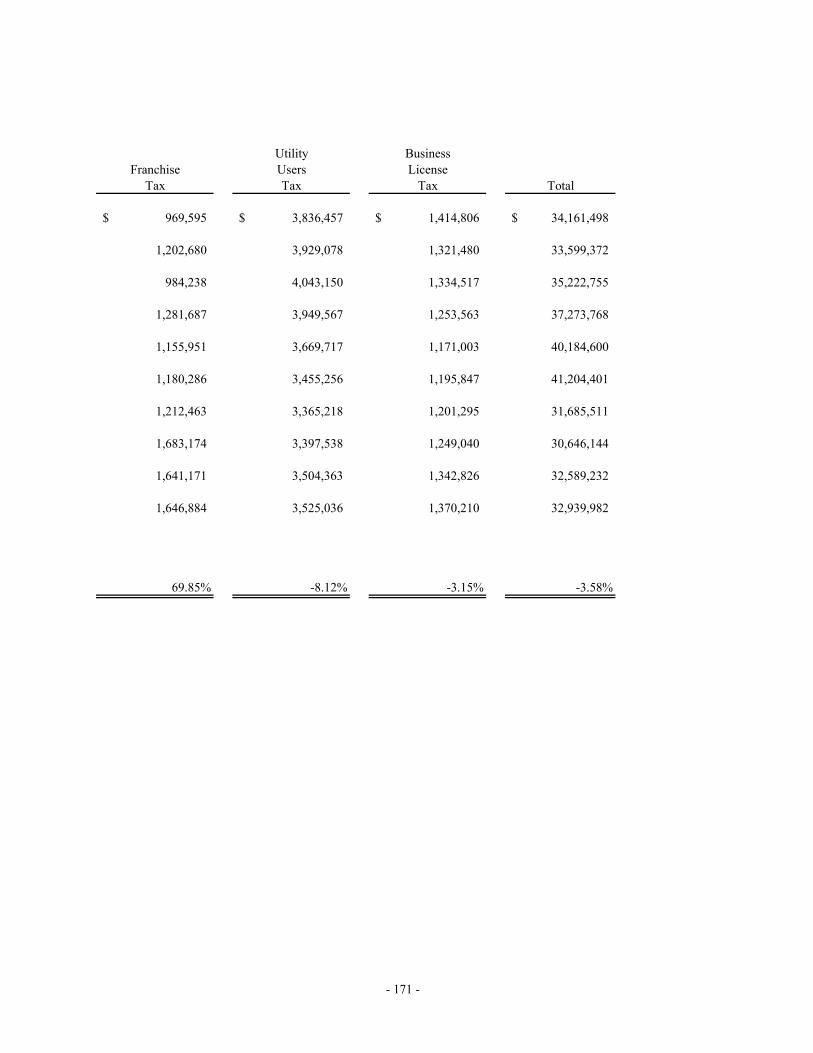
Utility Business
Franchise Users License
Tax Tax Tax Total
969,595$ 3,836,457$ 1,414,806$ 34,161,498$
1,202,680 3,929,078 1,321,480 33,599,372
984,238 4,043,150 1,334,517 35,222,755
1,281,687 3,949,567 1,253,563 37,273,768
1,155,951 3,669,717 1,171,003 40,184,600
1,180,286 3,455,256 1,195,847 41,204,401
1,212,463 3,365,218 1,201,295 31,685,511
1,683,174 3,397,538 1,249,040 30,646,144
1,641,171 3,504,363 1,342,826 32,589,232
1,646,884 3,525,036 1,370,210 32,939,982
69.85% -8.12% -3.15% -3.58%
- 171 -
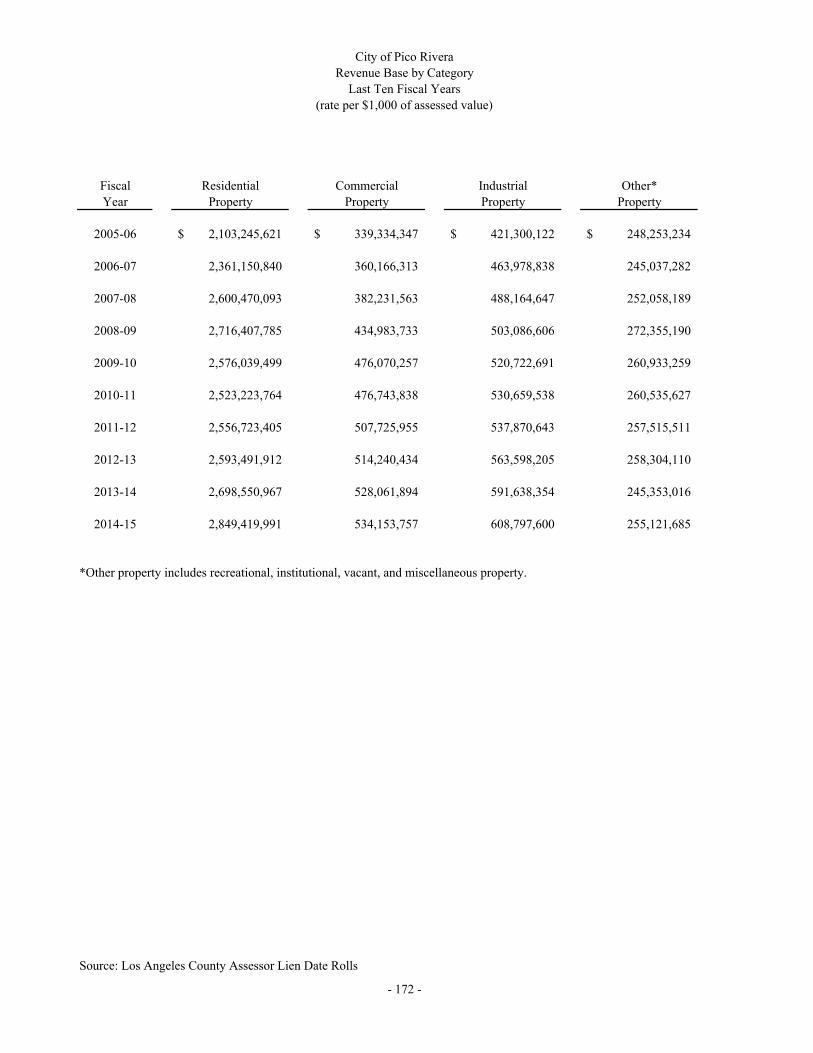
Fiscal Residential Commercial Industrial Other*
Year Property Property Property Property
2005-06 2,103,245,621$ 339,334,347$ 421,300,122$ 248,253,234$
2006-07 2,361,150,840 360,166,313 463,978,838 245,037,282
2007-08 2,600,470,093 382,231,563 488,164,647 252,058,189
2008-09 2,716,407,785 434,983,733 503,086,606 272,355,190
2009-10 2,576,039,499 476,070,257 520,722,691 260,933,259
2010-11 2,523,223,764 476,743,838 530,659,538 260,535,627
2011-12 2,556,723,405 507,725,955 537,870,643 257,515,511
2012-13 2,593,491,912 514,240,434 563,598,205 258,304,110
2013-14 2,698,550,967 528,061,894 591,638,354 245,353,016
2014-15 2,849,419,991 534,153,757 608,797,600 255,121,685
*Other property includes recreational, institutional, vacant, and miscellaneous property.
Source: Los Angeles County Assessor Lien Date Rolls
- 172 -
City of Pico Rivera
Revenue Base by Category
Last Ten Fiscal Years
(rate per $1,000 of assessed value)
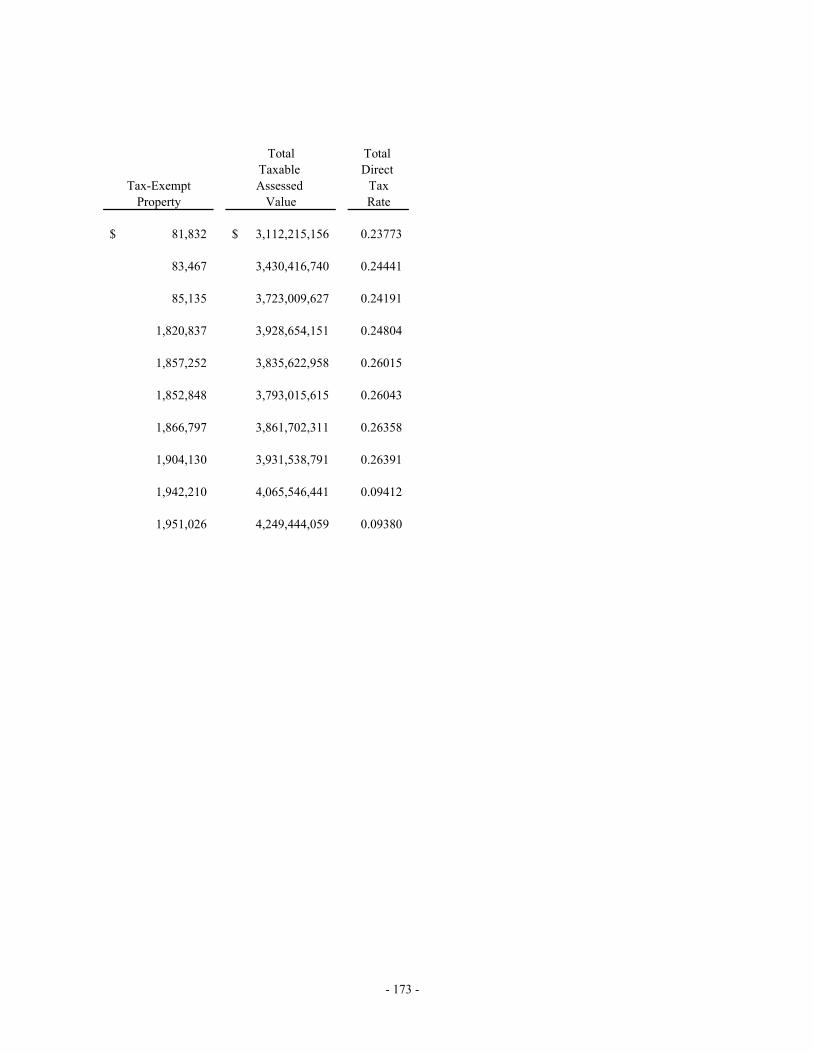
Total Total
Taxable Direct
Tax-Exempt Assessed Tax
Property Value Rate
81,832$ 3,112,215,156$ 0.23773
83,467 3,430,416,740 0.24441
85,135 3,723,009,627 0.24191
1,820,837 3,928,654,151 0.24804
1,857,252 3,835,622,958 0.26015
1,852,848 3,793,015,615 0.26043
1,866,797 3,861,702,311 0.26358
1,904,130 3,931,538,791 0.26391
1,942,210 4,065,546,441 0.09412
1,951,026 4,249,444,059 0.09380
- 173 -

COLLECTED WITHIN THE
FISCAL YEAR OF LEVY
Fiscal TAXES PERCENT OF COLLECTIONS IN
Year LEVIED AMOUNT LEVY Subsequent Year
2005-06 2,457,179$ 2,370,309$ 96.46% 1,804$
2006-07 2,661,678 2,281,049 85.70% 82,890
2007-08 2,882,716 2,466,213 85.55% 85,389
2008-09 2,209,373 2,075,685 93.95% 56,211
2009-10 2,500,000 2,000,000 80.00% 35,000
2010-11 2,245,949 2,157,293 96.05% 29,681
2011-12 2,250,274 2,037,518 90.55% 99,703
2012-13 2,313,210 2,240,076 96.84% 38,305
2013-14 2,388,030 2,311,646 96.80% 38,725
2014-15 2,511,683 2,425,171 96.56% 20,888
NOTE:
Article XIII-A of the Constitution of the State of California adopted by the electorate in June 1978,
precludes the City from a local property tax levy. All general-purpose property taxes are levied by
the County and allocated to other governmental entities on a predetermined formula.
Source: City of Pico Rivera Finance Department
- 174 -
City of Pico Rivera
Property Tax Levies and Tax Collections
Last Ten Fiscal Years
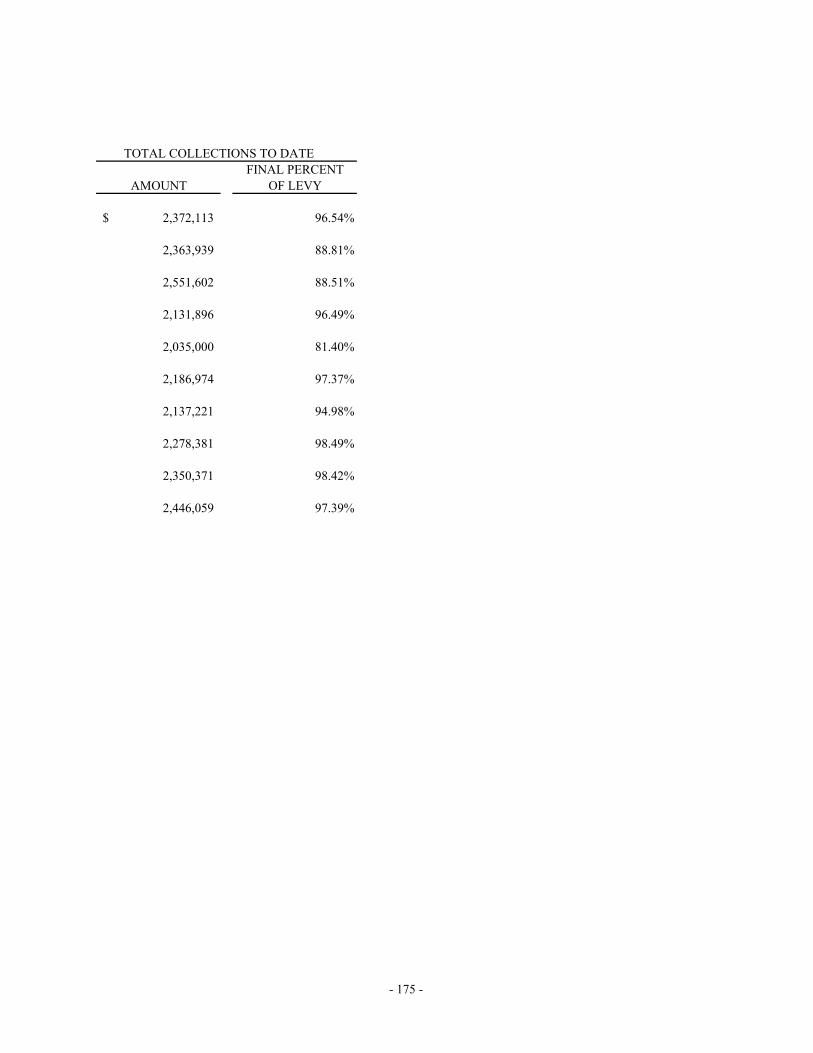
TOTAL COLLECTIONS TO DATE
FINAL PERCENT
AMOUNT OF LEVY
2,372,113$ 96.54%
2,363,939 88.81%
2,551,602 88.51%
2,131,896 96.49%
2,035,000 81.40%
2,186,974 97.37%
2,137,221 94.98%
2,278,381 98.49%
2,350,371 98.42%
2,446,059 97.39%
- 175 -
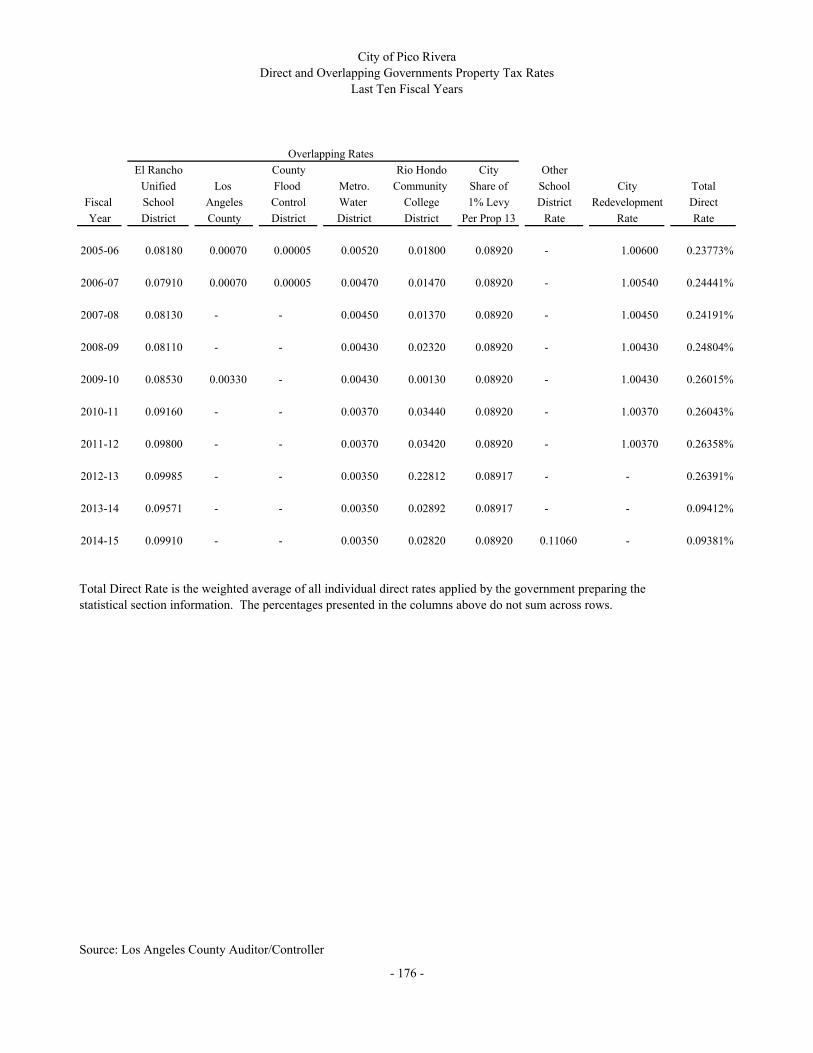
El Rancho County Rio Hondo City Other
Unified Los Flood Metro. Community Share of School City Total
Fiscal School Angeles Control Water College 1% Levy District Redevelopment Direct
Year District County District District District Per Prop 13 Rate Rate Rate
2005-06 0.08180 0.00070 0.00005 0.00520 0.01800 0.08920 - 1.00600 0.23773%
2006-07 0.07910 0.00070 0.00005 0.00470 0.01470 0.08920 - 1.00540 0.24441%
2007-08 0.08130 - - 0.00450 0.01370 0.08920 - 1.00450 0.24191%
2008-09 0.08110 - - 0.00430 0.02320 0.08920 - 1.00430 0.24804%
2009-10 0.08530 0.00330 - 0.00430 0.00130 0.08920 - 1.00430 0.26015%
2010-11 0.09160 - - 0.00370 0.03440 0.08920 - 1.00370 0.26043%
2011-12 0.09800 - - 0.00370 0.03420 0.08920 - 1.00370 0.26358%
2012-13 0.09985 - - 0.00350 0.22812 0.08917 - - 0.26391%
2013-14 0.09571 - - 0.00350 0.02892 0.08917 - - 0.09412%
2014-15 0.09910 - - 0.00350 0.02820 0.08920 0.11060 - 0.09381%
Total Direct Rate is the weighted average of all individual direct rates applied by the government preparing the
statistical section information. The percentages presented in the columns above do not sum across rows.
Source: Los Angeles County Auditor/Controller
- 176 -
City of Pico Rivera
Direct and Overlapping Governments Property Tax Rates
Last Ten Fiscal Years
Overlapping Rates

Percentage Percentage
of Total City of Total City
Taxable Taxable Taxable Taxable
Assessed Assessed Assessed Assessed
Taxpayer Value Value Value Value
Vestar California XXVI LLC 69,202,196$ 1.63% 37,807,094$ 1.21%
Majestic AMB Pico Rivera Associates LLC 41,974,791 0.99% 37,279,408 1.20%
Walmart Real Estate Business Trust 33,254,649 0.78% 22,462,775 0.72%
Iron Mountain Information 30,548,286 0.72%
Princeton Medical Holdings LLC 30,083,000 0.71%
Showprop Pico Rivera 27,897,571 0.66%
General American Life Insurance Company 27,789,609 0.65% 24,439,200 0.79%
GGF Pico Rivera LLC 24,754,158 0.58% 20,187,443 0.65%
Public Storage Inc 22,132,585 0.52%
AGNL Pastry LP 21,803,917 0.51%
Lubricating Specialties Company 35,929,184 1.15%
TRF Crossroads LLC 19,100,879 0.61%
Rex Road LLC 17,952,000 0.58%
Target Corporation 17,007,841 0.55%
Lowes HIW, Inc. 15,307,738 0.49%
329,440,762$ 7.75% 247,473,562$ 7.95%
Excludes government and tax-exempt property owners
Total City Value for 2005-06 3,112,215,156$
Total City Value for 2014-15 4,249,444,059$
Source: Los Angeles County Assessor 2005-06 and 2014-15 Combined Tax Rolls
- 177 -
2014-15 2005-06
City of Pico Rivera
Principal Property Taxpayers
Current Fiscal Year and Nine Fiscal Years Ago

- 178 -
This page intentionally left blank.
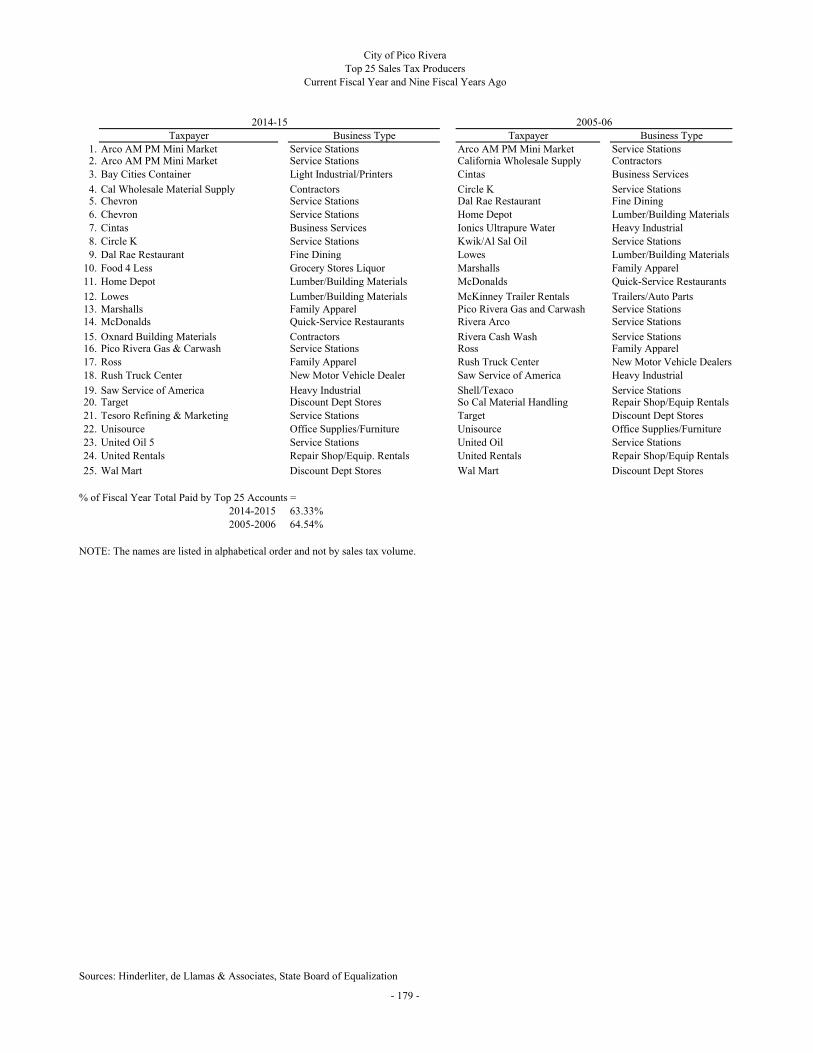
Taxpayer Business Type Taxpayer Business Type
1. Arco AM PM Mini Market Service Stations Arco AM PM Mini Market Service Stations2. Arco AM PM Mini Market Service Stations California Wholesale Supply Contractors
3. Bay Cities Container Light Industrial/Printers Cintas Business Services
4. Cal Wholesale Material Supply Contractors Circle K Service Stations5. Chevron Service Stations Dal Rae Restaurant Fine Dining
6. Chevron Service Stations Home Depot Lumber/Building Materials
7. Cintas Business Services Ionics Ultrapure Water Heavy Industrial
8. Circle K Service Stations Kwik/Al Sal Oil Service Stations
9. Dal Rae Restaurant Fine Dining Lowes Lumber/Building Materials
10. Food 4 Less Grocery Stores Liquor Marshalls Family Apparel
11. Home Depot Lumber/Building Materials McDonalds Quick-Service Restaurants
12. Lowes Lumber/Building Materials McKinney Trailer Rentals Trailers/Auto Parts13. Marshalls Family Apparel Pico Rivera Gas and Carwash Service Stations14. McDonalds Quick-Service Restaurants Rivera Arco Service Stations
15. Oxnard Building Materials Contractors Rivera Cash Wash Service Stations16. Pico Rivera Gas & Carwash Service Stations Ross Family Apparel
17. Ross Family Apparel Rush Truck Center New Motor Vehicle Dealers
18. Rush Truck Center New Motor Vehicle Dealer Saw Service of America Heavy Industrial
19. Saw Service of America Heavy Industrial Shell/Texaco Service Stations20. Target Discount Dept Stores So Cal Material Handling Repair Shop/Equip Rentals
21. Tesoro Refining & Marketing Service Stations Target Discount Dept Stores
22. Unisource Office Supplies/Furniture Unisource Office Supplies/Furniture
23. United Oil 5 Service Stations United Oil Service Stations
24. United Rentals Repair Shop/Equip. Rentals United Rentals Repair Shop/Equip Rentals
25. Wal Mart Discount Dept Stores Wal Mart Discount Dept Stores
% of Fiscal Year Total Paid by Top 25 Accounts =
2014-2015 63.33%
2005-2006 64.54%
NOTE: The names are listed in alphabetical order and not by sales tax volume.
Sources: Hinderliter, de Llamas & Associates, State Board of Equalization
City of Pico Rivera
Top 25 Sales Tax Producers
Current Fiscal Year and Nine Fiscal Years Ago
2005-06
- 179 -
2014-15
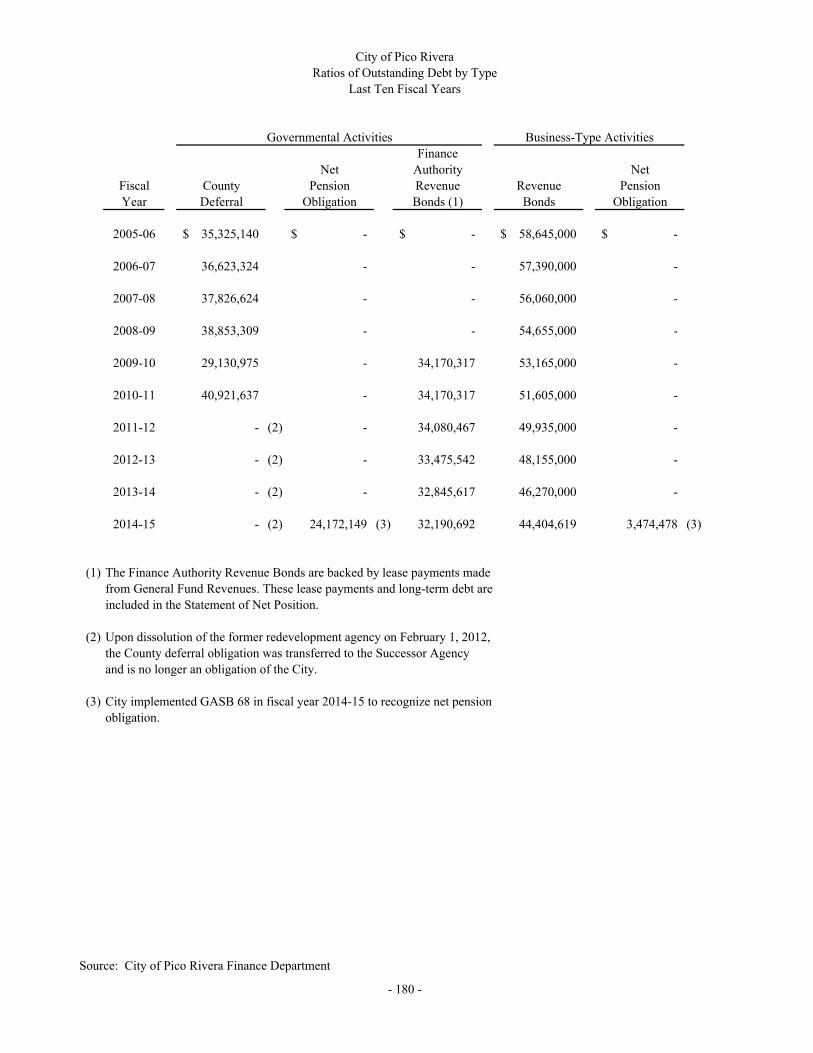
Finance
Net Authority Net
Fiscal County Pension Revenue Revenue Pension
Year Deferral Obligation Bonds (1) Bonds Obligation
2005-06 35,325,140$ -$ -$ 58,645,000$ -$
2006-07 36,623,324 - - 57,390,000 -
2007-08 37,826,624 - - 56,060,000 -
2008-09 38,853,309 - - 54,655,000 -
2009-10 29,130,975 - 34,170,317 53,165,000 -
2010-11 40,921,637 - 34,170,317 51,605,000 -
2011-12 - (2) - 34,080,467 49,935,000 -
2012-13 - (2) - 33,475,542 48,155,000 -
2013-14 - (2) - 32,845,617 46,270,000 -
2014-15 - (2) 24,172,149 (3) 32,190,692 44,404,619 3,474,478 (3)
(1) The Finance Authority Revenue Bonds are backed by lease payments made
from General Fund Revenues. These lease payments and long-term debt are
included in the Statement of Net Position.
(2) Upon dissolution of the former redevelopment agency on February 1, 2012,
the County deferral obligation was transferred to the Successor Agency
and is no longer an obligation of the City.
(3) City implemented GASB 68 in fiscal year 2014-15 to recognize net pension
obligation.
Source: City of Pico Rivera Finance Department
- 180 -
Governmental Activities
City of Pico Rivera
Ratios of Outstanding Debt by Type
Last Ten Fiscal Years
Business-Type Activities
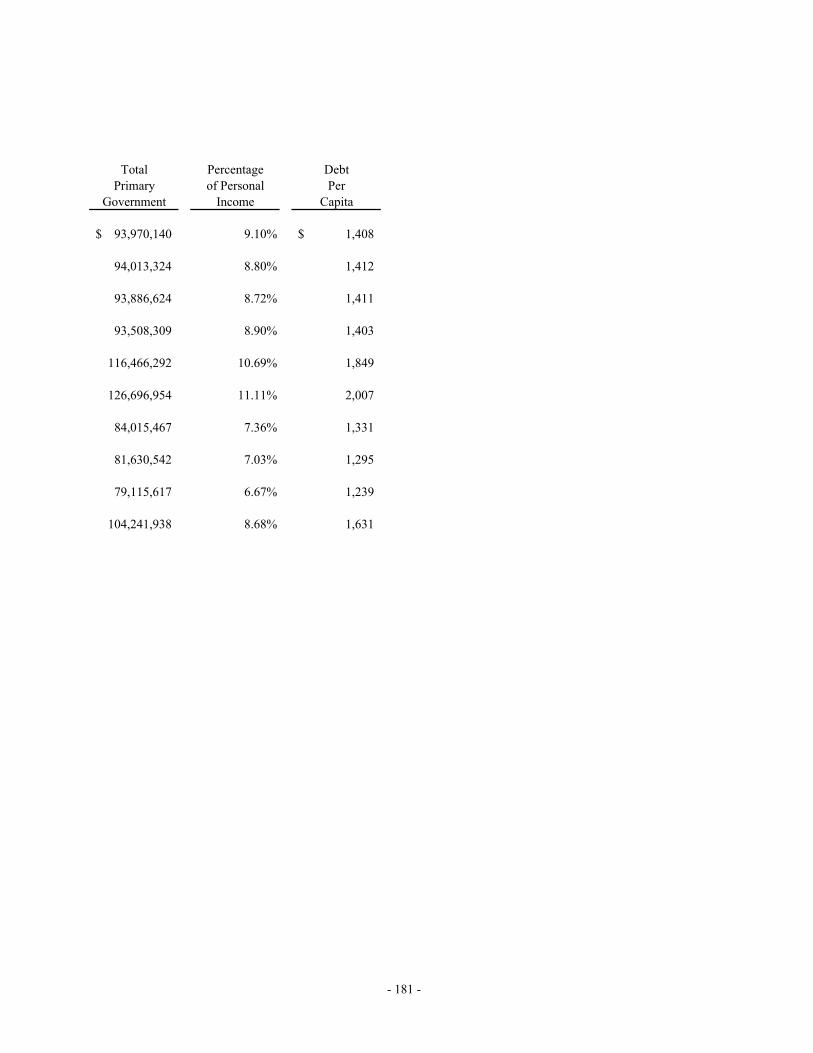
Total Percentage Debt
Primary of Personal Per
Government Income Capita
93,970,140$ 9.10% 1,408$
94,013,324 8.80% 1,412
93,886,624 8.72% 1,411
93,508,309 8.90% 1,403
116,466,292 10.69% 1,849
126,696,954 11.11% 2,007
84,015,467 7.36% 1,331
81,630,542 7.03% 1,295
79,115,617 6.67% 1,239
104,241,938 8.68% 1,631
- 181 -

Finance
General Authority Total Percent of
Fiscal Obligation Revenue Primary Assessed Per
Year Bonds Bonds (1) Government Value Capita
2005-06 -$ -$ -$ 0.000% -$
2006-07 - - - 0.000% -
2007-08 - - - 0.000% -
2008-09 - - - 0.000% -
2009-10 - 34,170,317 34,170,317 0.891% 493.02
2010-11 - 34,170,317 34,170,317 0.901% 541.35
2011-12 - 34,080,467 34,080,467 0.883% 540.51
2012-13 - 33,475,542 33,475,542 0.851% 530.91
2013-14 - 32,845,617 32,845,617 0.808% 514.23
2014-15 - 32,190,692 32,190,692 0.758% 503.75
(1) The Finance Authority Revenue Bonds are backed by lease poayments made from General Fund Revenues.
These lease payments and long-term debt are included in the Statement of Net Assests.
Note: Details regarding the outstanding debt can be found in the notes to the financial statements.
Source: City of Pico Rivera Finance Department
- 182 -
City of Pico Rivera
Ratios of General Bonded Debt Outstanding
Last Ten Fiscal Years
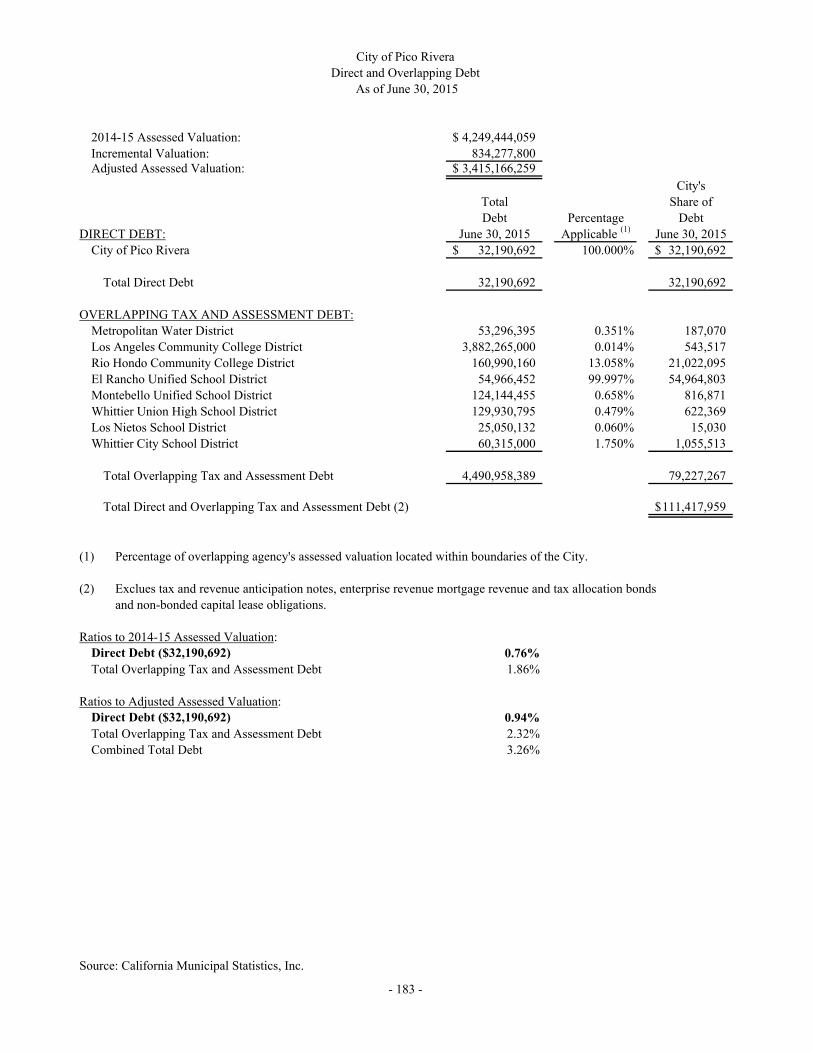
2014-15 Assessed Valuation: 4,249,444,059$
834,277,800 Adjusted Assessed Valuation: 3,415,166,259$
City's
Total Share of
Debt Percentage Debt
DIRECT DEBT: June 30, 2015 Applicable (1)
June 30, 2015
City of Pico Rivera 32,190,692$ 100.000% 32,190,692$
Total Direct Debt 32,190,692 32,190,692
OVERLAPPING TAX AND ASSESSMENT DEBT:
Metropolitan Water District 53,296,395 0.351% 187,070
Los Angeles Community College District 3,882,265,000 0.014% 543,517
Rio Hondo Community College District 160,990,160 13.058% 21,022,095
El Rancho Unified School District 54,966,452 99.997% 54,964,803
Montebello Unified School District 124,144,455 0.658% 816,871
Whittier Union High School District 129,930,795 0.479% 622,369
Los Nietos School District 25,050,132 0.060% 15,030
Whittier City School District 60,315,000 1.750% 1,055,513
Total Overlapping Tax and Assessment Debt 4,490,958,389 79,227,267
Total Direct and Overlapping Tax and Assessment Debt (2) 111,417,959$
(1) Percentage of overlapping agency's assessed valuation located within boundaries of the City.
(2) Exclues tax and revenue anticipation notes, enterprise revenue mortgage revenue and tax allocation bonds
and non-bonded capital lease obligations.
Ratios to 2014-15 Assessed Valuation:Direct Debt ($32,190,692) 0.76%
Total Overlapping Tax and Assessment Debt 1.86%
Ratios to Adjusted Assessed Valuation:Direct Debt ($32,190,692) 0.94%
Total Overlapping Tax and Assessment Debt 2.32%
Combined Total Debt 3.26%
Source: California Municipal Statistics, Inc.
City of Pico Rivera
Direct and Overlapping Debt
As of June 30, 2015
Incremental Valuation:
- 183 -
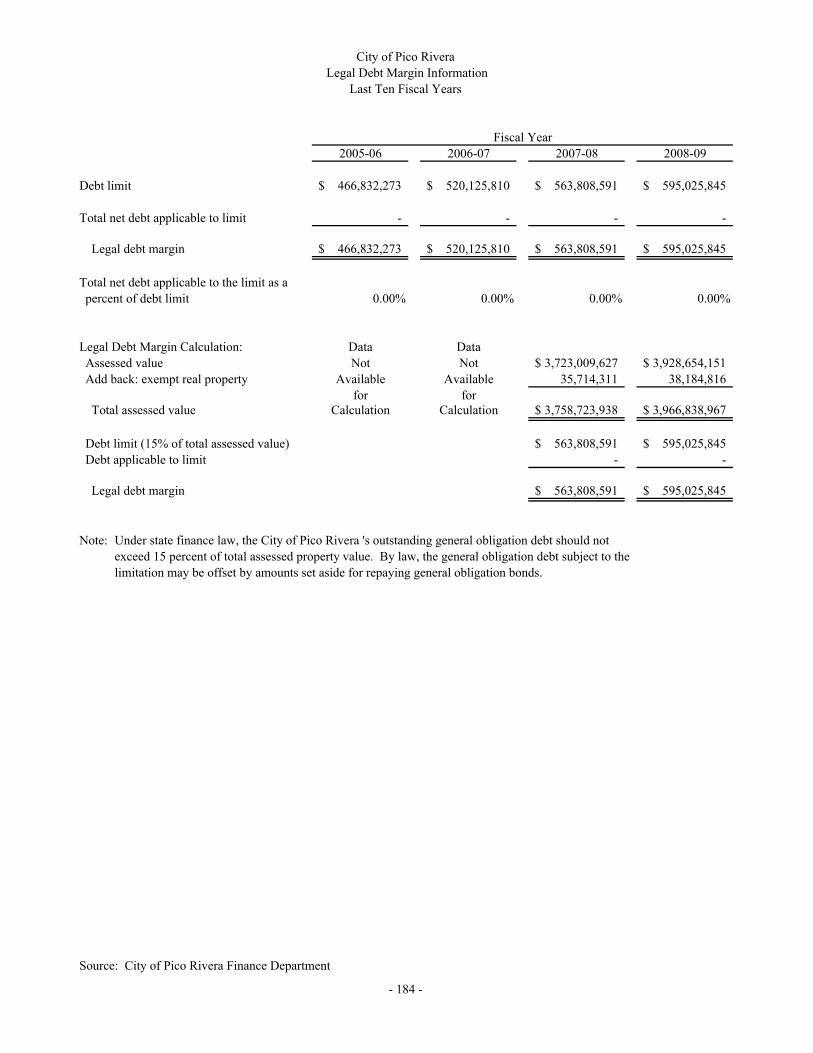
2005-06 2006-07 2007-08 2008-09
Debt limit 466,832,273$ 520,125,810$ 563,808,591$ 595,025,845$
Total net debt applicable to limit - - - -
Legal debt margin 466,832,273$ 520,125,810$ 563,808,591$ 595,025,845$
Total net debt applicable to the limit as a
percent of debt limit 0.00% 0.00% 0.00% 0.00%
Legal Debt Margin Calculation: Data Data
Assessed value Not Not 3,723,009,627$ 3,928,654,151$
Add back: exempt real property Available Available 35,714,311 38,184,816
for forTotal assessed value Calculation Calculation 3,758,723,938$ 3,966,838,967$
Debt limit (15% of total assessed value) 563,808,591$ 595,025,845$
Debt applicable to limit - -
Legal debt margin 563,808,591$ 595,025,845$
Note: Under state finance law, the City of Pico Rivera 's outstanding general obligation debt should not
exceed 15 percent of total assessed property value. By law, the general obligation debt subject to the
limitation may be offset by amounts set aside for repaying general obligation bonds.
Source: City of Pico Rivera Finance Department
- 184 -
Fiscal Year
City of Pico Rivera
Legal Debt Margin Information
Last Ten Fiscal Years

2009-10 2010-11 2011-12 2012-13 2013-14 2014-15
581,318,695$ 573,980,277$ 585,365,738$ 602,284,951$ 618,519,977$ 643,657,163$
- - - - - -
581,318,695$ 573,980,277$ 585,365,738$ 602,284,951$ 618,519,977$ 643,657,163$
0.00% 0.00% 0.00% 0.00% 0.00% 0.00%
3,835,622,958$ 3,793,015,615$ 3,861,702,311$ 3,973,385,899$ 4,065,546,441$ 4,249,444,059$
39,835,011 33,519,567 40,735,942 41,847,108 57,920,073 41,603,696
3,875,457,969$ 3,826,535,182$ 3,902,438,253$ 4,015,233,007$ 4,123,466,514$ 4,291,047,755$
581,318,695$ 573,980,277$ 585,365,738$ 602,284,951$ 618,519,977$ 643,657,163$
- - - - - -
581,318,695$ 573,980,277$ 585,365,738$ 602,284,951$ 618,519,977$ 643,657,163$
- 185 -
Fiscal Year
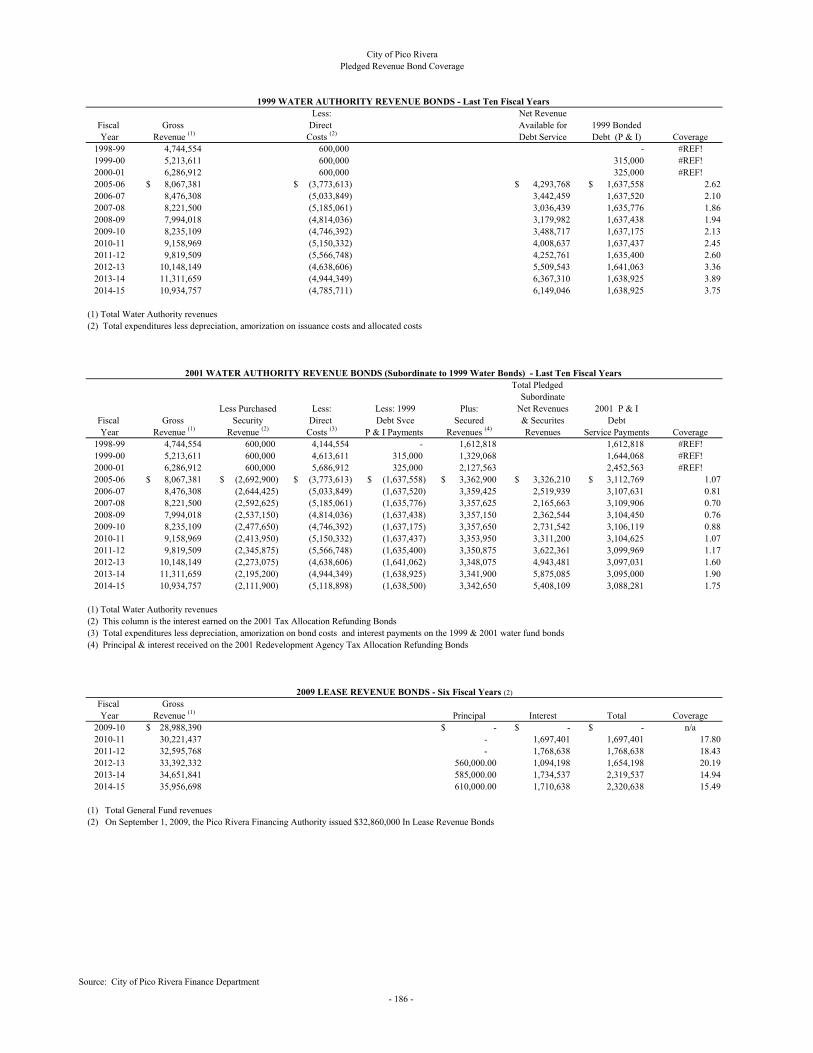
Less: Net Revenue
Fiscal Gross Direct Available for 1999 Bonded
Year Revenue (1) Costs (2) Debt Service Debt (P & I) Coverage
1998-99 4,744,554 600,000 - #REF!
1999-00 5,213,611 600,000 315,000 #REF!
2000-01 6,286,912 600,000 325,000 #REF!
2005-06 8,067,381$ (3,773,613)$ 4,293,768$ 1,637,558$ 2.62
2006-07 8,476,308 (5,033,849) 3,442,459 1,637,520 2.10
2007-08 8,221,500 (5,185,061) 3,036,439 1,635,776 1.86
2008-09 7,994,018 (4,814,036) 3,179,982 1,637,438 1.94
2009-10 8,235,109 (4,746,392) 3,488,717 1,637,175 2.13
2010-11 9,158,969 (5,150,332) 4,008,637 1,637,437 2.45
2011-12 9,819,509 (5,566,748) 4,252,761 1,635,400 2.60
2012-13 10,148,149 (4,638,606) 5,509,543 1,641,063 3.36
2013-14 11,311,659 (4,944,349) 6,367,310 1,638,925 3.89
2014-15 10,934,757 (4,785,711) 6,149,046 1,638,925 3.75
(1) Total Water Authority revenues
(2) Total expenditures less depreciation, amorization on issuance costs and allocated costs
Total Pledged
Subordinate
Less Purchased Less: Less: 1999 Plus: Net Revenues 2001 P & I
Fiscal Gross Security Direct Debt Svce Secured & Securites Debt
Year Revenue (1) Revenue (2) Costs (3) P & I Payments Revenues (4) Revenues Service Payments Coverage
1998-99 4,744,554 600,000 4,144,554 - 1,612,818 1,612,818 #REF!
1999-00 5,213,611 600,000 4,613,611 315,000 1,329,068 1,644,068 #REF!
2000-01 6,286,912 600,000 5,686,912 325,000 2,127,563 2,452,563 #REF!
2005-06 8,067,381$ (2,692,900)$ (3,773,613)$ (1,637,558)$ 3,362,900$ 3,326,210$ 3,112,769$ 1.07
2006-07 8,476,308 (2,644,425) (5,033,849) (1,637,520) 3,359,425 2,519,939 3,107,631 0.81
2007-08 8,221,500 (2,592,625) (5,185,061) (1,635,776) 3,357,625 2,165,663 3,109,906 0.70
2008-09 7,994,018 (2,537,150) (4,814,036) (1,637,438) 3,357,150 2,362,544 3,104,450 0.76
2009-10 8,235,109 (2,477,650) (4,746,392) (1,637,175) 3,357,650 2,731,542 3,106,119 0.88
2010-11 9,158,969 (2,413,950) (5,150,332) (1,637,437) 3,353,950 3,311,200 3,104,625 1.07
2011-12 9,819,509 (2,345,875) (5,566,748) (1,635,400) 3,350,875 3,622,361 3,099,969 1.17
2012-13 10,148,149 (2,273,075) (4,638,606) (1,641,062) 3,348,075 4,943,481 3,097,031 1.60
2013-14 11,311,659 (2,195,200) (4,944,349) (1,638,925) 3,341,900 5,875,085 3,095,000 1.90
2014-15 10,934,757 (2,111,900) (5,118,898) (1,638,500) 3,342,650 5,408,109 3,088,281 1.75
(1) Total Water Authority revenues
(2) This column is the interest earned on the 2001 Tax Allocation Refunding Bonds
(3) Total expenditures less depreciation, amorization on bond costs and interest payments on the 1999 & 2001 water fund bonds
(4) Principal & interest received on the 2001 Redevelopment Agency Tax Allocation Refunding Bonds
Fiscal Gross
Year Revenue (1) Principal Interest Total Coverage
2009-10 28,988,390$ -$ -$ -$ n/a
2010-11 30,221,437 - 1,697,401 1,697,401 17.80
2011-12 32,595,768 - 1,768,638 1,768,638 18.43
2012-13 33,392,332 560,000.00 1,094,198 1,654,198 20.19
2013-14 34,651,841 585,000.00 1,734,537 2,319,537 14.94
2014-15 35,956,698 610,000.00 1,710,638 2,320,638 15.49
(1) Total General Fund revenues
(2) On September 1, 2009, the Pico Rivera Financing Authority issued $32,860,000 In Lease Revenue Bonds
Source: City of Pico Rivera Finance Department
- 186 -
City of Pico Rivera
Pledged Revenue Bond Coverage
1999 WATER AUTHORITY REVENUE BONDS - Last Ten Fiscal Years
2001 WATER AUTHORITY REVENUE BONDS (Subordinate to 1999 Water Bonds) - Last Ten Fiscal Years
2009 LEASE REVENUE BONDS - Six Fiscal Years (2)
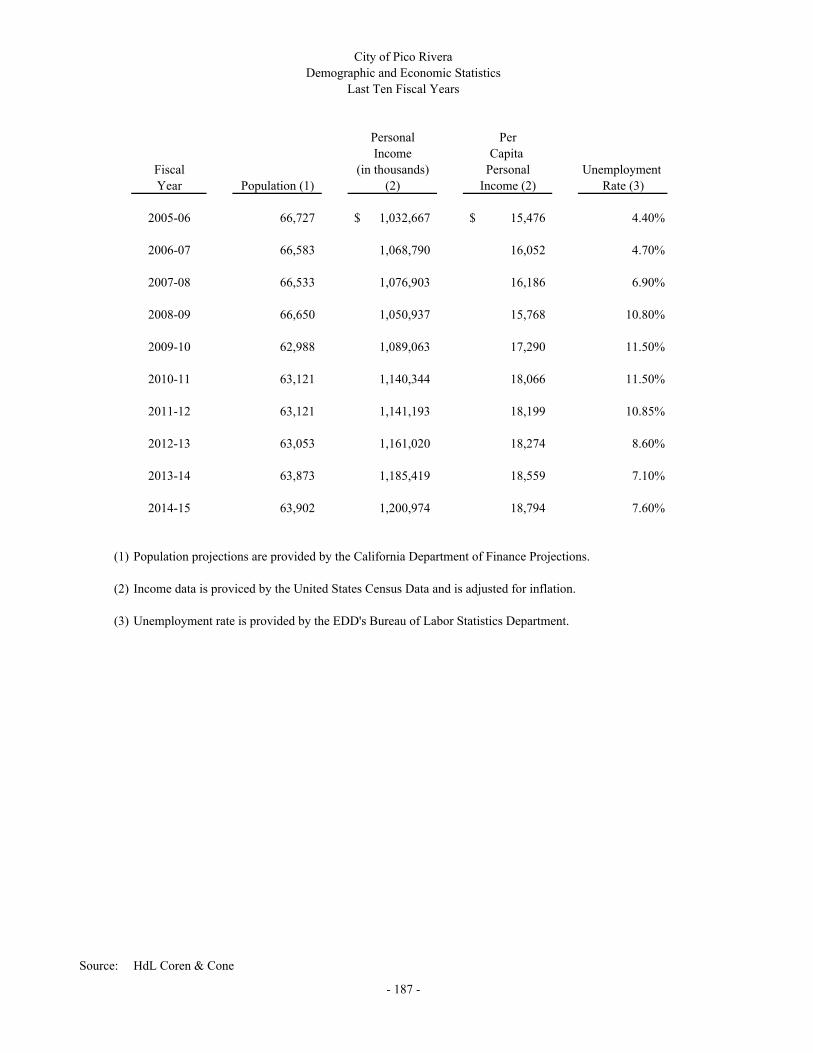
Personal Per
Income Capita
Fiscal (in thousands) Personal Unemployment
Year Population (1) (2) Income (2) Rate (3)
2005-06 66,727 1,032,667$ 15,476$ 4.40%
2006-07 66,583 1,068,790 16,052 4.70%
2007-08 66,533 1,076,903 16,186 6.90%
2008-09 66,650 1,050,937 15,768 10.80%
2009-10 62,988 1,089,063 17,290 11.50%
2010-11 63,121 1,140,344 18,066 11.50%
2011-12 63,121 1,141,193 18,199 10.85%
2012-13 63,053 1,161,020 18,274 8.60%
2013-14 63,873 1,185,419 18,559 7.10%
2014-15 63,902 1,200,974 18,794 7.60%
(1) Population projections are provided by the California Department of Finance Projections.
(2) Income data is proviced by the United States Census Data and is adjusted for inflation.
(3) Unemployment rate is provided by the EDD's Bureau of Labor Statistics Department.
Source: HdL Coren & Cone
City of Pico Rivera
Demographic and Economic Statistics
Last Ten Fiscal Years
- 187 -
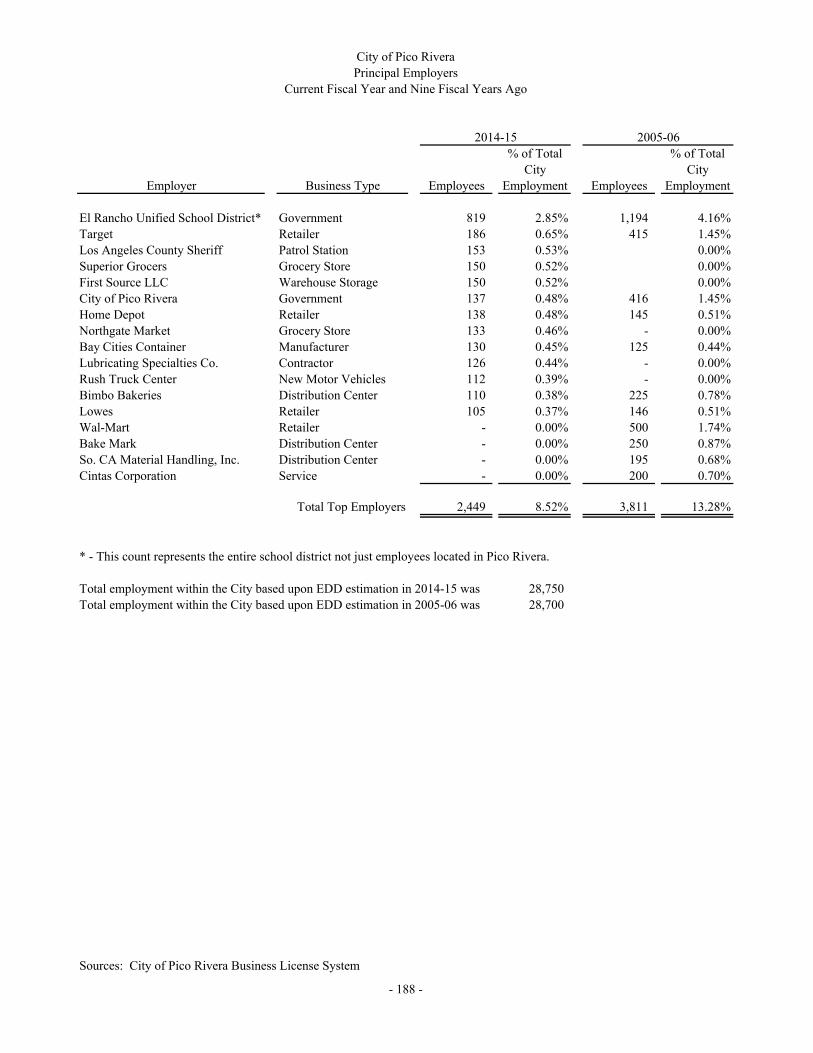
% of Total % of Total
City City
Employer Business Type Employees Employment Employees Employment
El Rancho Unified School District* Government 819 2.85% 1,194 4.16%
Target Retailer 186 0.65% 415 1.45%
Los Angeles County Sheriff Patrol Station 153 0.53% 0.00%
Superior Grocers Grocery Store 150 0.52% 0.00%
First Source LLC Warehouse Storage 150 0.52% 0.00%
City of Pico Rivera Government 137 0.48% 416 1.45%
Home Depot Retailer 138 0.48% 145 0.51%
Northgate Market Grocery Store 133 0.46% - 0.00%
Bay Cities Container Manufacturer 130 0.45% 125 0.44%
Lubricating Specialties Co. Contractor 126 0.44% - 0.00%
Rush Truck Center New Motor Vehicles 112 0.39% - 0.00%
Bimbo Bakeries Distribution Center 110 0.38% 225 0.78%
Lowes Retailer 105 0.37% 146 0.51%
Wal-Mart Retailer - 0.00% 500 1.74%
Bake Mark Distribution Center - 0.00% 250 0.87%
So. CA Material Handling, Inc. Distribution Center - 0.00% 195 0.68%
Cintas Corporation Service - 0.00% 200 0.70%
Total Top Employers 2,449 8.52% 3,811 13.28%
* - This count represents the entire school district not just employees located in Pico Rivera.
Total employment within the City based upon EDD estimation in 2014-15 was 28,750
Total employment within the City based upon EDD estimation in 2005-06 was 28,700
Sources: City of Pico Rivera Business License System
- 188 -
2014-15 2005-06
City of Pico Rivera
Principal Employers
Current Fiscal Year and Nine Fiscal Years Ago
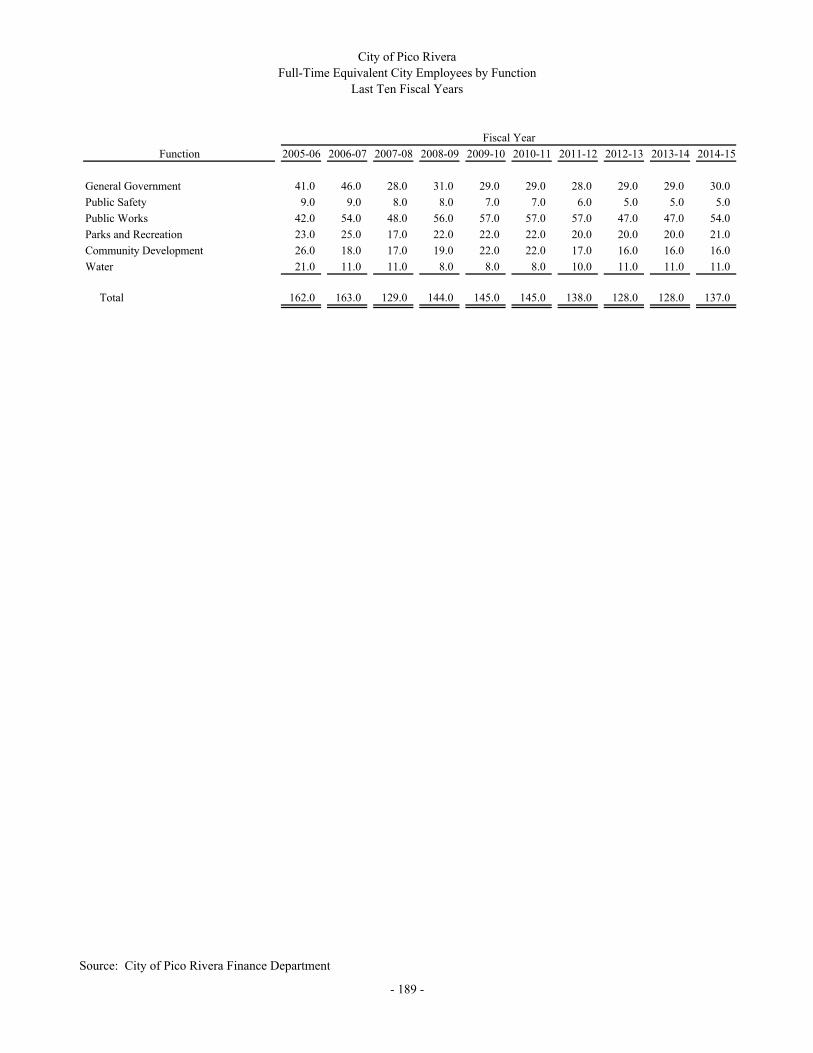
Function 2005-06 2006-07 2007-08 2008-09 2009-10 2010-11 2011-12 2012-13 2013-14 2014-15
General Government 41.0 46.0 28.0 31.0 29.0 29.0 28.0 29.0 29.0 30.0
Public Safety 9.0 9.0 8.0 8.0 7.0 7.0 6.0 5.0 5.0 5.0
Public Works 42.0 54.0 48.0 56.0 57.0 57.0 57.0 47.0 47.0 54.0
Parks and Recreation 23.0 25.0 17.0 22.0 22.0 22.0 20.0 20.0 20.0 21.0
Community Development 26.0 18.0 17.0 19.0 22.0 22.0 17.0 16.0 16.0 16.0
Water 21.0 11.0 11.0 8.0 8.0 8.0 10.0 11.0 11.0 11.0
Total 162.0 163.0 129.0 144.0 145.0 145.0 138.0 128.0 128.0 137.0
Source: City of Pico Rivera Finance Department
City of Pico Rivera
Full-Time Equivalent City Employees by Function
Last Ten Fiscal Years
- 189 -
Fiscal Year
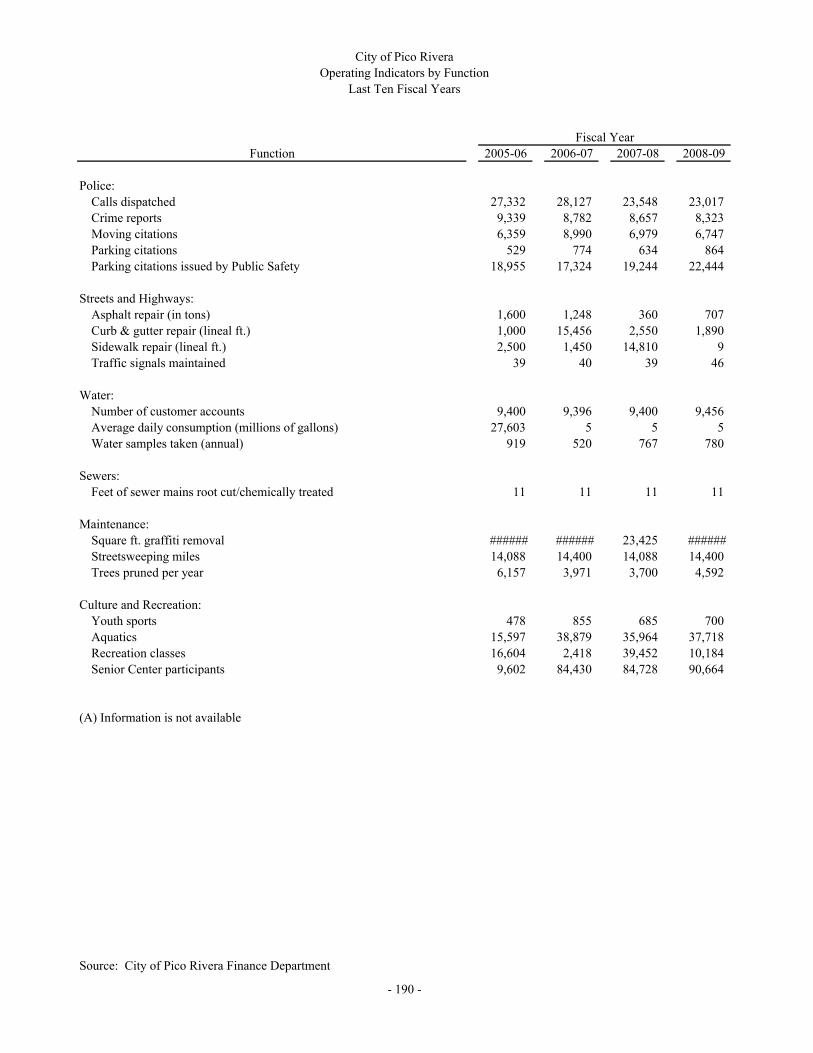
2005-06 2006-07 2007-08 2008-09
Police:
Calls dispatched 27,332 28,127 23,548 23,017
Crime reports 9,339 8,782 8,657 8,323
Moving citations 6,359 8,990 6,979 6,747
Parking citations 529 774 634 864
Parking citations issued by Public Safety 18,955 17,324 19,244 22,444
Streets and Highways:
Asphalt repair (in tons) 1,600 1,248 360 707
Curb & gutter repair (lineal ft.) 1,000 15,456 2,550 1,890
Sidewalk repair (lineal ft.) 2,500 1,450 14,810 9
Traffic signals maintained 39 40 39 46
Water:
Number of customer accounts 9,400 9,396 9,400 9,456
Average daily consumption (millions of gallons) 27,603 5 5 5
Water samples taken (annual) 919 520 767 780
Sewers:
Feet of sewer mains root cut/chemically treated 11 11 11 11
Maintenance:
Square ft. graffiti removal ###### ###### 23,425 ######
Streetsweeping miles 14,088 14,400 14,088 14,400
Trees pruned per year 6,157 3,971 3,700 4,592
Culture and Recreation:
Youth sports 478 855 685 700
Aquatics 15,597 38,879 35,964 37,718
Recreation classes 16,604 2,418 39,452 10,184
Senior Center participants 9,602 84,430 84,728 90,664
(A) Information is not available
Source: City of Pico Rivera Finance Department
- 190 -
Function
Fiscal Year
City of Pico Rivera
Operating Indicators by Function
Last Ten Fiscal Years

2009-10 2010-11 2011-12 2012-13 2013-14 2014-15
22,471 21,622 21,735 22,369 21,602 21,878
7,892 7,420 7,151 7,062 9,775 10,725
9,057 8,321 4,326 4,947 4,822 4,250
408 440 416 302 549 147
22,473 20,276 16,490 16,161 16,303 15,152
1,600 976 1,012 669 160 427
735 672 720 1,059 26 530
7,502 6,846 5,152 4,690 877 1,200
49 50 50 51 42 45
9,405 9,411 9,468 9,510 9,393 94,000
5 5 5 6 5 5
798 762 810 783 900 1,162
11 11 11 11 11 11
###### ###### ###### ###### 95,353 ######
14,400 14,400 21,285 21,285 21,285 21,285
4,669 4,041 4,621 4,543 4,258 4,998
659 856 825 835 856 856
16,720 12,163 11,479 17,800 16,179 16,179
10,082 10,660 15,601 14,983 16,415 16,415
###### ###### ###### ###### ###### ######
- 191 -
Fiscal Year
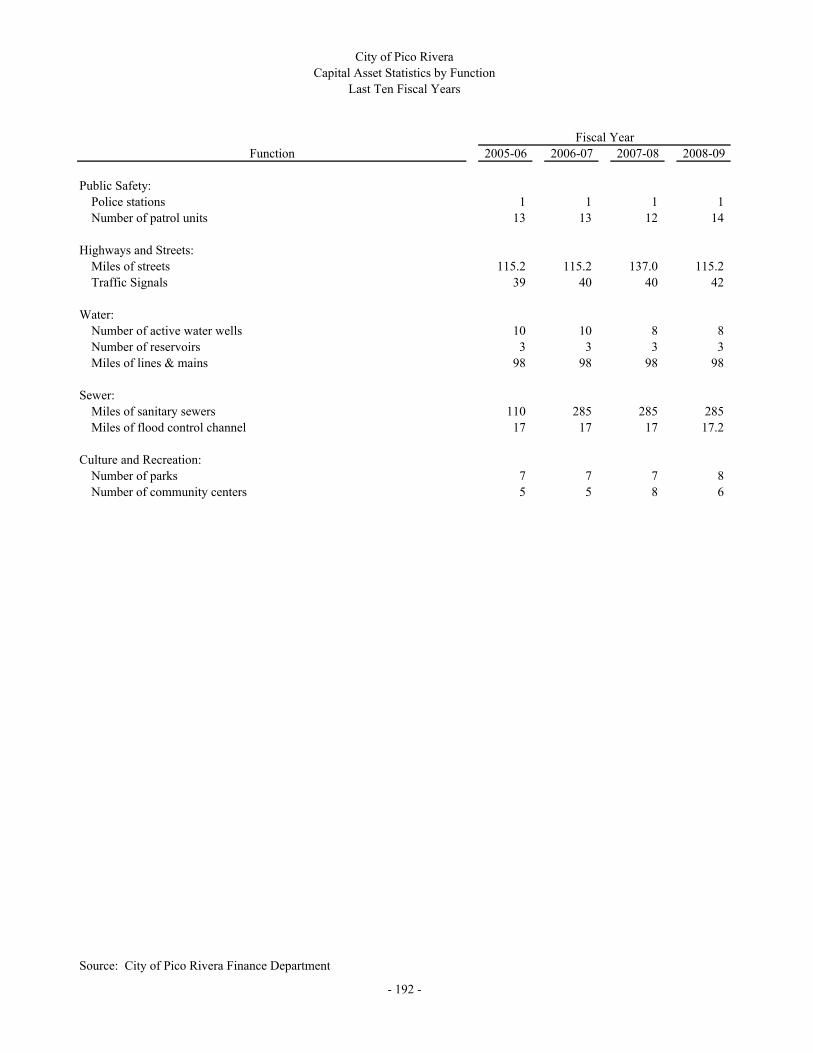
2005-06 2006-07 2007-08 2008-09
Public Safety:
Police stations 1 1 1 1
Number of patrol units 13 13 12 14
Highways and Streets:
Miles of streets 115.2 115.2 137.0 115.2
Traffic Signals 39 40 40 42
Water:
Number of active water wells 10 10 8 8
Number of reservoirs 3 3 3 3
Miles of lines & mains 98 98 98 98
Sewer:
Miles of sanitary sewers 110 285 285 285
Miles of flood control channel 17 17 17 17.2
Culture and Recreation:
Number of parks 7 7 7 8
Number of community centers 5 5 8 6
Source: City of Pico Rivera Finance Department
- 192 -
Function
Fiscal Year
City of Pico Rivera
Capital Asset Statistics by Function
Last Ten Fiscal Years
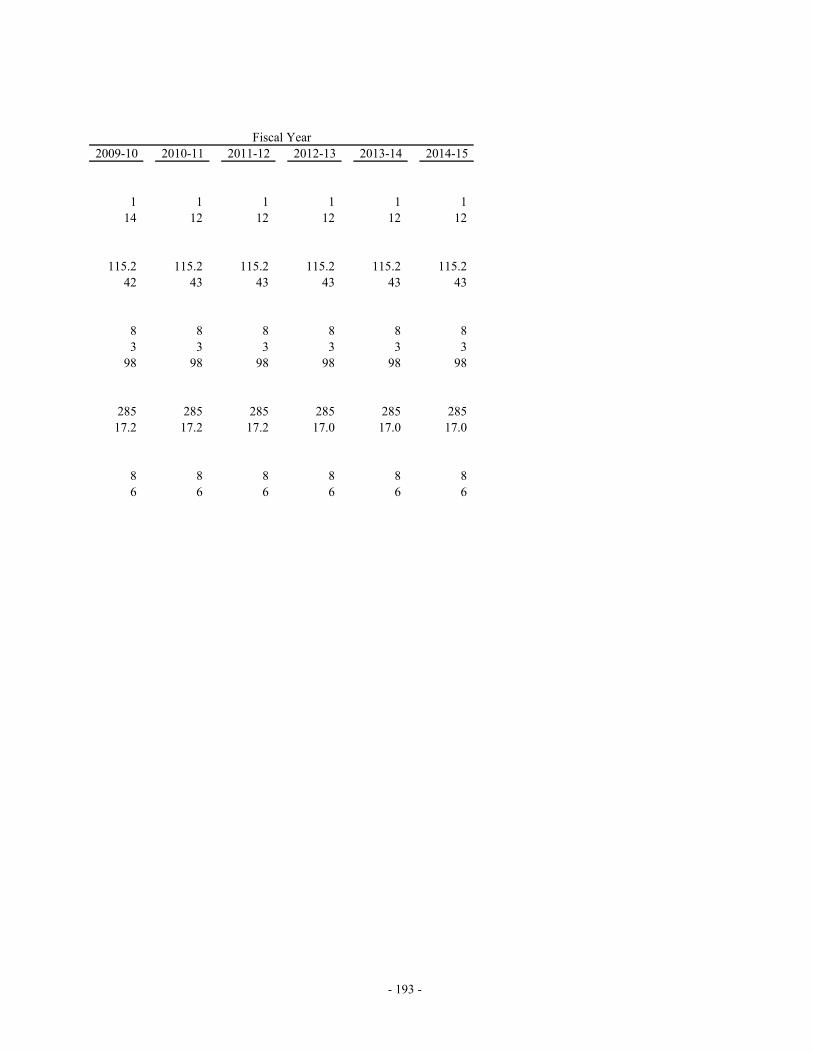
2009-10 2010-11 2011-12 2012-13 2013-14 2014-15
1 1 1 1 1 1
14 12 12 12 12 12
115.2 115.2 115.2 115.2 115.2 115.2
42 43 43 43 43 43
8 8 8 8 8 8
3 3 3 3 3 3
98 98 98 98 98 98
285 285 285 285 285 285
17.2 17.2 17.2 17.0 17.0 17.0
8 8 8 8 8 8
6 6 6 6 6 6
Fiscal Year
- 193 -

This page intentionally left blank.

City of Pico Rivera 6615 Passons Blvd Pico Rivera, CA 90660
(562) 942-2000 www.pico-rivera.org


