66
FINANCIAL REPORT For the Years Ended June 30, 2016 and 2015

FINANCIAL REPORT For the Years Ended
June 30, 2016 and 2015

YOUNGSTOWN STATE UNIVERSITY Contents
Page
Message from President Tressel ........................................................................................ 1
Financial Report
Independent Auditor’s Report ....................................................................................... 2
Management’s Discussion and Analysis ....................................................................... 4
Basic Financial Statements
Youngstown State University Statements of Net Position ....................................... 22
The Youngstown State University Foundation Statements of Financial Position ...................................................................... 23
Youngstown State University Statements of Revenues, Expenses and Changes in Net Position ............................................ 24
The Youngstown State University Foundation Statements of Activities and Change in Net Assets ........................................... 25
Youngstown State University Statements of Cash Flows ........................................ 26
Notes to Financial Statements ...................................................................................... 28
Required Supplementary Information
Schedules of the University’s Proportionate Share of the Net Pension Liability ......... 60
Schedules of the University’s Contributions ................................................................. 61
Other Information
Board of Trustees .......................................................................................................... 62
Executive Officers ......................................................................................................... 63

YOUNGSTOWN STATE UNIVERSITY Message from President Tressel
1
November 3, 2016 Two years of strategic and innovative planning across the Youngstown State University (YSU or University) campus began to show significant results in fiscal year 2016 as enrollment increased for the first time in six years, the University implemented a deficit-free operating budget for the first time in five years and fund-raising successes reached historic highs. While University leaders, students, faculty, staff and supporters should be commended for their hard work and commitment to achieving these important milestones, we cannon rest on our laurels. Much work remains as we continue to increase excellence and move the University forward. Highlights of this past fiscal year include: The $169.8 million fiscal year budget was the first in five years without a structural operating
deficit. For the first time in six years, fall semester enrollment increased, up 2.3%. In addition, the
incoming freshmen class boasted the highest standardized test scores and high school GPAs in the University’s history.
The YSU Foundation raised $20.5 million in private gifts, up from $13 million in 2015 and $6.2 million in 2014.
University residence halls are at capacity, and the new private University Edge apartments are full. A second phase of University Edge is set to open Fall 2017.
YSU partnered with Barnes & Noble College to manage the University bookstore in Kilcawley Center. Construction on a standalone Barnes & Noble bookstore will start soon.
The University implemented several initiatives to reduce student costs and debt, including freezing tuition, fees, increasing tuition bulk rates and reducing the number of credits required to earn a degree.
Students and faculty continued to achieve on the highest level, including Ashley E. Orr, the first YSU student to receive the prestigious international Rhodes Scholar award, and Eric MacDonald, a global scholar in additive manufacturing, named the first YSU Friedman Chair in Engineering.
Fiscal year 2017 brings with it even more opportunities. The University is in the midst of re-accreditation by the Higher Learning Commission, an in-depth process that allows us to benchmark our outcomes. YSU also looks to this new fiscal year to continue planning for the Mahoning Valley Innovation and Commercialization Center, an entrepreneurial hub that will allow for education, research and state-of-the art manufacturing laboratories. And, while traffic will be disrupted by the construction, we look forward to the major enhancements underway on two important roadways on campus, Wick and Lincoln Avenues. As we put fiscal year 2016 behind us and look forward to the many achievements to come in fiscal year 2017, we remain sharply focused on providing the services that will ensure the success of our students. Our goal remains to increase excellence across all levels of the institution. Sincerely yours,
James P. Tressel President

Crowe Horwath LLP Independent Member Crowe Horwath International
2
INDEPENDENT AUDITOR'S REPORT To the Board of Trustees Youngstown State University Youngstown, Ohio Report on the Financial Statements We have audited the accompanying financial statements of the business-type activities and the discretely presented component unit of the Youngstown State University (the “University”), a component unit of the State of Ohio, as of and for the years ended June 30, 2016 and 2015, and the related notes to the financial statements, which collectively comprise the University’s basic financial statements as listed in the table of contents. Management’s Responsibility for the Financial Statements Management is responsible for the preparation and fair presentation of these financial statements in accordance with accounting principles generally accepted in the United States of America; this includes the design, implementation, and maintenance of internal control relevant to the preparation and fair presentation of financial statements that are free from material misstatement, whether due to fraud or error. Auditor’s Responsibility Our responsibility is to express opinions on these financial statements based on our audits. We did not audit the financial statements of the Youngstown State University Foundation, which represents the entire discretely presented component unit. Those financial statements were audited by other auditors whose report thereon has been furnished to us, and our opinion, insofar as it relates to the amounts included for the University for the discretely presented component unit, is based solely on the report of the other auditors. We conducted our audits in accordance with auditing standards generally accepted in the United States of America. Those standards require that we plan and perform the audit to obtain reasonable assurance about whether the financial statements are free from material misstatement. An audit involves performing procedures to obtain audit evidence about the amounts and disclosures in the financial statements. The procedures selected depend on the auditor’s judgment, including the assessment of the risks of material misstatement of the financial statements, whether due to fraud or error. In making those risk assessments, the auditor considers internal control relevant to the entity’s preparation and fair presentation of the financial statements in order to design audit procedures that are appropriate in the circumstances, but not for the purpose of expressing an opinion on the effectiveness of the entity’s internal control. Accordingly, we express no such opinion. An audit also includes evaluating the appropriateness of accounting policies used and the reasonableness of significant accounting estimates made by management, as well as evaluating the overall presentation of the financial statements. We believe that the audit evidence we have obtained is sufficient and appropriate to provide a basis for our audit opinions.

3
Opinions In our opinion, based on our audits and the report of other auditors, the financial statements referred to above present fairly, in all material respects, the respective financial position of the business-type activities and the discretely presented component unit of the University, as of June 30, 2016 and 2015, and the respective changes in financial position and, where applicable, cash flows thereof for the years then ended in accordance with accounting principles generally accepted in the United States of America. Other Matters Required Supplementary Information Accounting principles generally accepted in the United States of America require that the Management’s Discussion and Analysis (MD&A) on pages 4 to 21, the Schedules of the University’s Proportionate Share of the Net Pension Liability on page 60, and the Schedules of the University’s Contributions on page 61, be presented to supplement the basic financial statements. Such information, although not a part of the basic financial statements, is required by Governmental Accounting Standards Board who considers it to be an essential part of financial reporting for placing the basic financial statements in an appropriate operational, economic, or historical context. We have applied certain limited procedures to the required supplementary information in accordance with auditing standards generally accepted in the United States of America, which consisted of inquiries of management about the methods of preparing the information and comparing the information for consistency with management’s responses to our inquiries, the basic financial statements, and other knowledge we obtained during our audit of the basic financial statements. We do not express an opinion or provide any assurance on the information because the limited procedures do not provide us with sufficient evidence to express an opinion or provide any assurance. Other Information Our audit was conducted for the purpose of forming opinions on the financial statements that collectively comprise the University’s basic financial statements. The Message from President Tressel on page 1, Board of Trustees on page 62, and Executive Officers on page 63 are presented for purposes of additional analysis and are not a required part of the basic financial statements. The information has not been subjected to the auditing procedures applied in the audit of the basic financial statements and accordingly, we do not express an opinion or provide any assurance on them. Crowe Horwath LLP Columbus, Ohio November 3, 2016

YOUNGSTOWN STATE UNIVERSITY Management’s Discussion and Analysis
4
The Management’s Discussion and Analysis section of Youngstown State University’s (YSU or University) Financial Report presents a discussion and analysis of the financial performance of the University during the fiscal year ended June 30, 2016 with comparative information for the fiscal years ended June 30, 2015 and June 30, 2014. This discussion has been prepared by management and should be read in conjunction with the financial statements and the accompanying notes that follow. Introduction Youngstown State University, an urban research university, emphasizes a creative, integrated approach to education, scholarship, and service. The University places students at its center; leads in the discovery, dissemination, and application of knowledge; advances civic, scientific, and technological development; and fosters collaboration to enrich the region and the world. Youngstown State University traces its beginnings to a commercial law course offered by the Young Men’s Christian Association (YMCA) in 1908. The YMCA had offered high school level and vocational courses since 1888, but wanted to meet the college-level needs of area residents in a society undergoing rapid industrialization and urbanization. The YMCA offered courses on law, business and engineering; and in 1910, even instituted a School of Law that granted no degree, but prepared students to take the bar exam. In 1916, the YMCA incorporated all of its education work under the Youngstown Association School. By the early 1920’s the Ohio Board of Education granted the School of Law the power to confer the Bachelor of Science in Law degree and in 1924 the School of Commerce and Finance the right to confer the bachelor’s degree in commercial science. The YMCA also offered courses to prepare teachers for certification, a program that evolved by 1927 into a separate school named Youngstown College and recognized by the State Department of Education. Throughout the 1920s, the schools of law and commercial science were called the Youngstown Institute of Technology, which began a move from downtown to the present location with the purchase of several mansions owned by the Wick family. In 1931, the YMCA constructed its first building, the present-day Jones Hall, and appointed Howard Jones as the educational director. By the mid-1930s, the Board of Directors decided to incorporate with the official name of Youngstown College separate from the other YMCA educational efforts; they appointed Howard Jones as the first president, a position he held until 1966. In 1944, the trustees of the YMCA transferred control of the institution to the members of the Corporation of Youngstown College, and in 1955 the corporation was rechartered as The Youngstown University. The University joined the Ohio system of higher education in September 1967 as Youngstown State University. Dana’s Musical Institute, founded in nearby Warren in 1869, became Dana’s Musical Institute of Youngstown College in 1941. In 1946, the Engineering Department, organized several years before, became the William Rayen School of Engineering; two years later, the Business Administration Department became the School of Business Administration; and in 1981 the school name was changed to the Warren P. Williamson, Jr. School of Business Administration. In 1960, the Education Department became the School of Education. The Graduate School and College of Applied Science and Technology were created in 1968, and, in 1974, the College of Fine and Performing Arts was established. In 1972, Youngstown State University, with the University of

YOUNGSTOWN STATE UNIVERSITY Management’s Discussion and Analysis (cont.)
5
Akron and Kent State University formed a consortium to sponsor the Northeastern University’s College of Medicine, which enrolled its first students in 1975. In 1991 the engineering technology departments separated from the College of Applied Science and Technology and joined the new College of Engineering and Technology; the remaining departments formed the new College of Health and Human Services. In 2007, the Rayen College of Engineering and Technology incorporated the science and mathematics departments from the College of Arts and Sciences. This reorganization linked science, technology, engineering and mathematics on one hand, and the humanities and social sciences on the other. Youngstown State University consists of the College of Graduate Studies and six undergraduate colleges: the Williamson College of Business Administration; the Beeghly College of Education; the College of Creative Arts & Communication; the Bitonte College of Health and Human Services; the College of Liberal Arts and Social Sciences; and the College of Science, Technology, Engineering, and Mathematics. Degrees offered include associate, bachelor’s, master’s, and doctorate. The University is located on a 145-acre campus near downtown Youngstown, Ohio and is equidistant (approximately 60 miles) from both Pittsburgh and Cleveland. Fall 2016 enrollment was 12,756. Using the Financial Statements The University’s financial report includes three basic financial statements: the Statement of Net Position, the Statement of Revenues, Expenses and Changes in Net Position, and the Statement of Cash Flows. These financial statements are prepared in accordance with the financial reporting format required by the Governmental Accounting Standards Board’s (GASB) Statements No. 34, Basic Financial Statements and Management’s Discussion and Analysis for State and Local Governments, as amended by GASB Statement No. 61, The Financial Reporting Entity: Omnibus; and No. 35, Basic Financial Statements and Management’s Discussion and Analysis for Public Colleges and Universities, as amended by GASB Statements No. 37, Basic Financial Statements – and Management’s Discussion and Analysis – for State and Local Governments: Omnibus and No. 38, Certain Financial Statement Note Disclosures. These statements establish standards for external financial reporting for public colleges and universities and require that financial statements be presented on a basis to focus on the financial condition of the University, the results of operations, and cash flows of the University as a whole. During fiscal year 2015, the University adopted GASB Statement No. 68, Accounting and Financial Reporting for Pensions - an amendment of GASB Statement No. 27 and GASB Statement No. 71, Pension Transition of Contributions Made Subsequent to the Measurement Date - an amendment of GASB Statement No. 68. These statements significantly revised accounting for pension costs and liabilities. Prior to GASBs 68 and 71, the accounting for pension costs, was focused on a funding approach, which limited pension costs to contributions annually required by law, which may or may not be sufficient to fully fund each pension plan’s net pension liability.

YOUNGSTOWN STATE UNIVERSITY Management’s Discussion and Analysis (cont.)
6
Under the new standards required by GASBs 68 and 71, the net pension liability equals the University’s proportionate share of each pension plan’s collective present value of estimated future pension benefits attributable to active and inactive employees’ past service minus plan assets available to pay these benefits. Pension obligations, whether funded or unfunded, are part of the “employment exchange” – that is, the employee is trading his or her labor in exchange for wages, benefits and the promise of a future pension. The unfunded portion of this pension promise is a present obligation, part of a bargained-for benefit to the employee, and should be reported by the University as a liability since the benefit of the exchange was received. However, the nature of Ohio’s statewide pension systems and state law governing those systems requires additional explanation in order to properly understand the information presented in these statements. The University is not responsible for certain key factors affecting the balance of this liability. In Ohio, the employee shares the obligation of funding pension benefits with the employer. Both employer and employee contribution rates are capped by the State statute. A change in these caps requires action of both Houses of the General Assembly, and approval of the Governor. Benefit provisions are also determined by State statute. The employee enters the employment exchange with the knowledge that the employer’s promise is limited not by contract but by law. The employer enters the exchange also knowing that there is a specific, legal limit to its contribution to the pension system. In Ohio, there is no legal means to enforce the unfunded liability of the pension system against the public employer. State law operates to mitigate/lessen the obligation of the public employer to the employee, because all parties enter the employment exchange with notice as to the law. The pension system is responsible for the administration of the plan. Most long-term liabilities have set repayment schedules or, in the case of compensated absences (i.e. sick and vacation leave), are satisfied through paid time-off or termination payments. There is no repayment schedule for the net pension liability. Changes in pension benefits, contribution rates, and return on investments affect the balance of the net pension liability, but are outside the control of the public employer. In the event that contributions, investment returns and other changes are insufficient to keep up with required pension payments, state statute does not assign/identify the responsible party for the unfunded portion. Due to the unique nature of how the net pension liability is satisfied, this liability is separately identified within the long-term liability section of the Statement of Net Position. In accordance with GASBs 68 and 71, the University’s statements, prepared on an accrual basis of accounting, include an annual pension expense for the proportionate share of each pension plan’s change in net pension liability. Overall key presentation elements of the financial statements include:
Assets and liabilities are categorized as either current or noncurrent. Current assets and liabilities will be consumed or fulfilled within one year.

YOUNGSTOWN STATE UNIVERSITY Management’s Discussion and Analysis (cont.)
7
Revenues and expenses are categorized as either operating or nonoperating. Significant recurring sources of the University’s revenues, including State of Ohio (State) appropriations, certain grants, gifts and investment income are considered nonoperating, as defined by GASB Statement No. 35.
University scholarships that represent reduced tuition (i.e. are applied to student accounts
rather than refunded to students) are shown as a reduction of tuition, fees and other student charges, while payments made directly to students are presented as scholarship expense. Third party scholarships are treated as though the students made the payments themselves.
Capital assets are reported net of accumulated depreciation. In accordance with GASB Statement No. 14, The Financial Reporting Entity, as amended by GASB Statement No. 39, Determining Whether Certain Organizations Are Component Units, and GASB Statement No. 61, The Financial Reporting Entity: Omnibus, The Youngstown State University Foundation (YSUF or Foundation) is treated as a component unit of the University. The Foundation is discretely presented in this report by presentation of the individual financial statements immediately following the University’s respective GASB financial statements. Additional information on component units is contained in Note 16. Management’s Discussion and Analysis focuses on the University and does not include the component unit. The Statements of Net Position The Statement of Net Position presents the financial position of the University at the end of the fiscal year and includes all assets (current and noncurrent), deferred outflows of resources, liabilities (current and noncurrent), deferred inflows of resources, and net position of the University. Current assets are classified as such if they are available to satisfy current liabilities, which are generally defined as being due within one year of the date of the Statement of Net Position. Net position is one indicator of the financial condition of the University, while the change in net position is an indicator of whether the overall financial condition has improved or worsened during the year.

YOUNGSTOWN STATE UNIVERSITY Management’s Discussion and Analysis (cont.)
8
A summarized comparison of the University’s assets, deferred outflows of resources, liabilities, deferred inflows of resources, and net position at June 30, 2016, 2015, and 2014 was as follows.
June 30, 2016 June 30, 2015 June 30, 2014Assets
Current assets 69,021,130$ 66,419,457$ 66,718,238$ Noncurrent assets
Capital assets, net 214,466,245 198,752,775 201,160,882 Other assets 28,553,736 26,855,908 29,900,130
Total noncurrent assets 243,019,981 225,608,683 231,061,012Total Assets 312,041,111 292,028,140 297,779,250
Deferred Outflows of Resources 26,126,689 10,611,171 -
LiabilitiesCurrent liabilities 24,043,294 22,283,707 23,369,754 Noncurrent liabilities 235,587,218 204,168,166 79,389,827
Total Liabilities 259,630,512 226,451,873 102,759,581
Deferred Inflows of Resources 15,366,387 18,680,757 382,500
Total Net Position 63,170,901$ 57,506,681$ 194,637,169$
Net PositionNet investment in capital assets 134,289,273$ 132,793,340$ 133,638,628$ Restricted 29,783,434 30,045,809 29,377,651 Unrestricted (100,901,806) (105,332,468) 31,620,890
Total Net Position 63,170,901$ 57,506,681$ 194,637,169$
Current assets include unrestricted and restricted cash and cash equivalents, investments that mature within one year, receivables, inventories and other short-term assets. Noncurrent assets include unrestricted investments that mature in more than one year, as well as cash and cash equivalents and investments that are restricted by donors or external parties as to their use. Also included are receivables deemed to be collectible in more than one year and capital assets. Current assets increased $2.6 million from fiscal year 2015 to fiscal year 2016 and remained flat from fiscal year 2014 to fiscal year 2015. Noncurrent assets increased $17.4 million from fiscal year 2015 to fiscal year 2016 and decreased $5.5 million from fiscal year 2014 to fiscal year 2015. Deferred outflows of resources include resources where the consumption is applicable to a future reporting period, but does not require further exchange of service. Deferred outflows include items relating to pensions and increased $15.5 million from fiscal year 2015 to fiscal year 2016 and increased $10.6 million from fiscal year 2014 to fiscal year 2015. Current liabilities include all liabilities that are payable within the next fiscal year. Unearned revenues, principally from summer programs, are also presented as current liabilities. Liabilities that are due to be paid beyond the next fiscal year are reported as noncurrent liabilities and include debt, compensated absences, and net pension liability. Current liabilities increased $1.8 million from fiscal year 2015 to fiscal year 2016 and decreased $1.1 million from fiscal year 2014 to fiscal year 2015. Noncurrent liabilities increased $31.4 million from fiscal year 2015 to fiscal year 2016 and increased $124.8 million from fiscal year 2014 to fiscal year 2015.

YOUNGSTOWN STATE UNIVERSITY Management’s Discussion and Analysis (cont.)
9
Deferred inflows of resources represent the acquisition of resources that are applicable to a future reporting period. Deferred inflows of resources include unamortized concession arrangements and items relating to pensions. Deferred inflows of resources decreased $3.3 million from fiscal year 2015 to fiscal year 2016 and increased $18.3 million from fiscal year 2014 to fiscal year 2015. Assets Assets primarily consist of cash and cash equivalents, investments, receivables and capital assets. The following table summarizes balances at:
June 30, 2016 June 30, 2015 June 30, 2014Cash and cash equivalents 15,893,972$ 11,472,553$ 16,762,273$ Investments 63,322,045 63,058,179 60,725,589 Accounts, loans and pledges receivable, net 16,632,850 15,579,115 15,237,373 Capital assets, net 214,466,245 198,752,775 201,160,882 Other 1,725,999 3,165,518 3,893,133
Total Assets 312,041,111$ 292,028,140$ 297,779,250$
Cash and cash equivalents increased $4.4 million or 38.5% from fiscal year 2015 to fiscal year 2016. The increase was primarily due to unspent note proceeds of $3.3 million for an energy conservation project financed during fiscal year 2016 and an overall net decrease in cash used in operating activities. Deposits held by Trustee totaled $3.7 million at June 30, 2016 compared to $1.7 million at June 30, 2015. Investments remained flat from fiscal year 2015 to fiscal year 2016. Endowment principal and operating reserves are included in noncurrent assets and are invested in long term maturities. Refer to Notes 3 and 4 for additional information on cash and cash equivalents, and investments. Overall, net accounts, loans and pledges receivable increased $1 million from $15.6 million at June 30, 2015 to $16.6 million at June 30, 2016. Net accounts increased $2.3 million or 21%. The increase was due to several factors including increased year end activity on a new state grant and several capital projects, an increase in funds raised by YSUF on behalf of YSU in the month of June over the prior year, as well as the timing of receipt of gifts used to support the fiscal year operations of a Center on campus. An increase was also noted due to the implementation of the College Credit Plus program in the Fall of 2015. Net loans decreased $0.3 million due to a decrease in the number of Perkins loans disbursed in fiscal year 2016 compared to prior years. Net pledges decreased $0.9 million or 35% primarily due to payments on pledges for the Williamson College of Business Administration (WCBA). See Notes 5 and 6 for additional information. Cash and cash equivalents decreased $5.3 million or 32% from fiscal year 2014 to fiscal year 2015. Decreased enrollment, a shift of cash to equities, spending of prior year’s bond proceeds to fund various campus projects and the impact of a change in the direct loan disbursement policy contributed to the decrease. Deposits held by Trustee totaled $1.7 million at June 30, 2015 compared to $3.7 million at June 30, 2014. Investments increased $2.3 million or 4% from fiscal year 2014 to fiscal year 2015 largely due to a shift of cash to equities.

YOUNGSTOWN STATE UNIVERSITY Management’s Discussion and Analysis (cont.)
10
Overall, net accounts, loans and pledges receivable increased slightly from $15.2 million at June 30, 2014 to $15.6 million at June 30, 2015. Net accounts increased $2.1 million or 25% largely due to the timing of receipt of student federal direct loans, resulting from changes in disbursement policies. Net loans decreased $300,000 due to a decrease in the number of Perkins loans disbursed in fiscal year 2015 compared to prior years. Net pledges decreased $1.5 million or 36% due to payments on pledges for the WCBA Building and the WATTS Indoor Athletic Facility. At June 30, 2016, the University had $214,466,245 in capital assets, net of accumulated depreciation. Depreciation totaled $11,059,009, $11,455,171, and $11,243,549 in fiscal years 2016, 2015, and 2014 respectively. Details of net capital assets are shown below.
June 30, 2016 June 30, 2015 June 30, 2014Land 16,149,400$ 16,093,678$ 15,692,070$ Buildings, net 111,129,063 116,250,393 120,052,098 Improvements to buildings, net 44,170,107 37,309,800 34,065,430 Improvements other than buildings, net 18,430,219 16,922,143 17,270,296 Construction in progress 18,623,424 6,129,774 6,577,088 Moveable equipment and furniture, net 4,833,535 5,212,193 6,636,913 Vehicles, net 295,031 199,328 231,521 Historical treasures 835,466 635,466 635,466
Total Capital Assets, net 214,466,245$ 198,752,775$ 201,160,882$
Major capital activity during fiscal year 2016 included completion of the Melnick Hall renovation, electrical substation refurbishment and expansion, stadium lighting upgrade, and football scoreboard system. In addition, three campus buildings received new roofs, restroom renovations were completed in three buildings, and elevator repairs were completed in two buildings. Construction in progress includes construction of a steam plant, which will enable YSU to produce its own steam heat, as well as building exterior repairs and updates to the Wick Parking Deck. Major capital activity during fiscal year 2015 included completion of the Veteran’s Resource Center, the second phase of the DeBartolo Hall improvements, and renovations to Beeghly Center. In addition, six campus buildings received new roofs and elevator repairs were completed in four buildings. Construction in progress includes continued construction on Melnick Hall, additional roofing projects, and a new scoreboard system and upgraded lighting to Stambaugh Stadium. Major capital activity during fiscal year 2014 included the completion of an outdoor athletic facility and interior renovations in Cushwa and DeBartolo Halls. The second phase of improvements in DeBartolo Hall started during Spring semester and work continued on campus-wide elevator upgrades and concrete replacement. The Veteran’s Resource Center was scheduled to be completed during the Fall semester. These projects are included in construction in progress at June 30, 2014.

YOUNGSTOWN STATE UNIVERSITY Management’s Discussion and Analysis (cont.)
11
Other assets decreased $1.4 million largely due to a $0.7 million decrease in inventories. In June 2016, the University contracted with a private vendor to operate the bookstore previously operated by the University. The University had no bookstore inventory at June 30, 2016. See Note 7 for additional information on capital assets. Deferred Outflows/Inflows of Resources Deferred outflows of resources represent the consumption of resources that are applicable to a future reporting period, but do not require further exchange of goods or services; whereas deferred inflows of resources represent the acquisition of resources that are applicable to a future reporting period. The following table summarizes balances at:
Deferred Outflows of Resources June 30, 2016 June 30, 2015 June 30, 2014Pension OPERS 16,422,322$ 4,448,632$ -$ Pension STRS 9,704,367 6,162,539 -
Total Deferred Outflows of Resources 26,126,689$ 10,611,171$ -$
Deferred Inflows of Resources June 30, 2016 June 30, 2015 June 30, 2014
Service concession agreements 657,500$ 745,000$ 382,500$ Pension OPERS 2,214,446 635,671 - Pension STRS 12,494,441 17,300,086 -
Total Deferred Inflows of Resources 15,366,387$ 18,680,757$ 382,500$
Included in deferred outflows of resources and deferred inflows of resources are items relating to pensions and service concession agreements. Certain elements impacting the change in the net pension liability have a longer term perspective than the current year, therefore to reduce volatility these elements are amortized over a closed period of specified duration. These include differences between expected and actual experience, changes of assumptions, net differences between projected and actual earnings of pension plan investments, and changes in the proportionate share of contributions. These elements can be reflected as either a deferred outflow of resources or a deferred inflow of resources. Deferred outflows of resources increased $15.5 million or 146.2% from fiscal year 2015 to fiscal year 2016. The increase was largely due to a $12 million increase in the amount attributed to the net difference between projected and actual earnings on OPERS pension plan investments and a $3.6 million increase in the amount attributed to the differences between expected and actual experience for the STRS Ohio pension plan. Deferred inflows of resources decreased $3.3 million or 17.7% from fiscal year 2015 to fiscal year 2016. The net decrease was primarily due to a combination of a $10.1 million decrease in the net difference between projected and actual earnings on STRS Ohio pension plan investments and a $5.3 million increase due to a change in the STRS Ohio proportionate share of contributions and. Included in deferred inflows at June 30, 2015 is $17.3 million for the net difference between projected and actual earnings of pension plan investments for STRS Ohio. In addition, $7.9 million of University contributions to the pension plans subsequent to the measurement date of the pension

YOUNGSTOWN STATE UNIVERSITY Management’s Discussion and Analysis (cont.)
12
plans were also reflected as deferred outflows of resources. The University adopted GASBs 68 and 71 in fiscal year 2015. The University made no restatement for deferred outflows of resources and deferred inflows of resources for fiscal year 2014 as the information needed to generate these restatements was not available. See Note 13 for additional information on Defined Benefit Pension Plans. During fiscal year 2015, the University entered into a ten year agreement with Pepsi-Cola for exclusive pouring rights and sponsorship program. The University received initial support funds in the amount of $450,000 which are contingent upon the University utilizing the services of the beverage company over a ten year period. During fiscal year 2014, the University received $425,000 from Chartwells toward dining hall renovations that are contingent upon the University utilizing the services of the food service provider over a ten year period. The unamortized amounts are reflected as Deferred Inflows of Resources in the Statement of Net Position. Liabilities Liabilities largely consist of accrued payroll and payroll withholdings, debt, unearned revenue, compensated absences, and net pension liability. The following table summarizes balances at:
June 30, 2016 June 30, 2015 June 30, 2014Accounts and construction payable 6,695,529$ 4,895,024$ 5,056,206$ Payroll liabilites 7,041,919 7,543,616 7,573,736 Notes payable 16,000,000 1,139,444 2,240,037 Bonds payable, net 64,756,416 66,658,996 68,498,512 Unearned revenue 5,824,756 5,294,416 5,418,952 Compensated absences 9,016,430 9,843,762 9,896,456 Refundable advance 2,527,796 2,581,299 2,628,561 Other 1,421,973 810,173 1,447,121 Net pension liability 146,345,693 127,685,143 -
Total Liabilities 259,630,512$ 226,451,873$ 102,759,581$
Total liabilities increased $33.2 million or 14.7% from fiscal year 2015 to fiscal year 2016. Accounts and construction payables increased largely due to increased year end activity on construction projects. Notes payable increased $14.9 million primarily due to the financing of a $16 million energy conservation project during fiscal year 2016. Bonds payable decreased $1.9 million due to scheduled debt service payments. The net pension liability increased $18.6 million or 14.6 % from fiscal year 2015 to fiscal year 2016. The OPERS pension liability increased $12.3 million or 36%; whereas the STRS Ohio liability increased $6.3 million or 6.8%. The OPERS and STRS Ohio net pension liability balances were $46.5 million and $99.8 million at June 30, 2016 compared to $34.2 million and $93.5 million at June 30, 2015, respectively. Total liabilities increased $123.7 million or 120.4% from fiscal year 2014 to fiscal year 2015. Notes and bonds payable decreased $2.9 million due to scheduled debt service payments. Other liabilities decreased $600,000 or 44% primarily due to payment of previously accrued legal liabilities. Due to the adoption of GASBs 68 and 71, the University recorded a net pension liability

YOUNGSTOWN STATE UNIVERSITY Management’s Discussion and Analysis (cont.)
13
of $136.7 million at July 1, 2014. The net pension liability totaled $127.7 million at June 30, 2015. Of this amount, $93.5 million was attributed to the STRS pension plan and $34.2 million to the OPERS pension plan. See Note 8 for a further breakout of payroll and other liabilities, Notes 9 and 10 for detailed information about the University’s debt, and Note 12 for information on long-term liabilities. Net Position Net position represents the residual interest in the University’s assets after deferred outflows of resources are added, and liabilities and deferred inflows of resources are deducted. The following table summarizes the categories of net position at:
June 30, 2016 June 30, 2015 June 30, 2014Net investment in capital assets 134,289,273$ 132,793,340$ 133,638,628$ Restricted-nonexpendable 5,178,994 5,062,070 4,978,349 Restricted-expendable 24,604,440 24,983,739 24,399,302 Unrestricted (100,901,806) (105,332,468) 31,620,890
Total Net Position 63,170,901$ 57,506,681$ 194,637,169$
Overall, the University’s total net position increased $5.7 million or 9.8% from $57.5 million at June 30, 2015 to $63.2 million at June 30, 2016. This resulted from excess revenue over expenses and includes a $1.5 million increase in the net amount invested in capital assets, a $300,000 decrease in restricted net position, and a $4.4 million increase in unrestricted net position. The University’s total net position decreased $137.1 million or 70.5% from $194.6 million at June 30, 2014 to $57.5 million at June 30, 2015. This resulted from excess expenses over revenues and included a $900,000 decrease in the net amount invested in capital assets, a $700,000 increase in restricted net position, and a $136.9 million decrease in unrestricted net position which included a $135 million decrease due to the adoption of GASBs 68 and 71, and a $1.9 million decrease in other unrestricted funds. For comparison purposes, the reconciliation below presents the University’s net position removing the impact GASBs 68 and 71.
June 30, 2016 June 30, 2015 June 30, 2014Total Net Position 63,170,901$ 57,506,681$ 194,637,169$ Add
Deferred inflows of resources related to pension 14,708,887 17,935,757 - Net pension liability 146,345,693 127,685,143 -
SubtractDeferred outflows of resources related to pension (26,126,689) (10,611,171) - Total Net Position without GASBs 68 and 71 198,098,792$ 192,516,410$ 194,637,169$
The net investment in capital assets consists of capital assets net of accumulated depreciation reduced by outstanding balances of bonds, notes or other borrowings that are attributable to the

YOUNGSTOWN STATE UNIVERSITY Management’s Discussion and Analysis (cont.)
14
acquisition, construction, or improvement of those assets. The increase of 1.5 million from fiscal year 2015 to fiscal year 2016 was due to spending $1.2 million for capital projects financed with bond proceeds, $13 million addition in outstanding debt, net capital additions of $26.8 million and current year depreciation of $11.1 million. Outstanding debt was $80,756,416 at June 30, 2016 compared to $67,798,440 at June 30, 2015. The overall decrease of $900,000 in investment in capital assets from fiscal year 2014 to fiscal year 2015 was due to spending $1.4 million for capital projects financed with bond proceeds, $2.9 million reduction in outstanding debt, net capital additions of $9 million and depreciation of $11.4 million. Outstanding debt was $67,798,440 at June 30, 2015 compared to $70,738,549 at June 30, 2014. Restricted non-expendable net position consists primarily of endowment funds held by the University. Changes in this category are driven primarily by investment performance, which was positive in both fiscal years 2016 and 2015. Restricted expendable net position is subject to externally imposed restrictions governing their use. Changes in this category are due to the timing of revenues and expenses in funds provided by donors and grantors. The following table summarizes restricted expendable net position at:
June 30, 2016 June 30, 2015 June 30, 2014Current funds 13,942,390$ 13,139,967$ 12,802,902$ Plant funds 10,442,672 11,636,581 11,390,029 Quasi-Endowments 159,886 148,201 147,644 Loan funds 59,492 58,990 58,727
Total Restricted Expendable Net Position 24,604,440$ 24,983,739$ 24,399,302$
Total restricted expendable net position was $24.6 million at June 30, 2016 compared to $25 million at June 30, 2015. Current restricted funds include grants and sponsored programs and gifts which includes scholarship donations and program support. These funds increased $0.8 million from $13.1 million at June 30, 2015 to $13.9 million at June 30, 2016. Plant funds primarily include donations for construction or renovation approximately $7.6 of the $10.4 million balance at June 30, 2016 related to gifts which have been internally designated for future debt service attributed to those projects. Total restricted expendable net position was $25 million at June 30, 2015 compared to $24.4 million at June 30, 2014. Current restricted funds include grants and sponsored programs, and gifts which include scholarship donations and program support. These funds increased $300,000 from $12.8 million at June 30, 2014 to $13.1 million at June 30, 2015. Plant funds primarily include donations and pledges for construction or renovation. Approximately $8.7 of the $11.6 million balance at June 30, 2015 related to gifts, which have been internally designated for future debt service attributed to those projects. Unrestricted net position is not subject to externally imposed restrictions and is designated for future operations, plant construction and maintenance, and debt service. The following table summarizes unrestricted net position at:

YOUNGSTOWN STATE UNIVERSITY Management’s Discussion and Analysis (cont.)
15
June 30, 2016 June 30, 2015 June 30, 2014
Current funds 10,966,922$ 7,817,248$ 8,780,693$ Operating reserves 7,714,609 7,714,609 8,692,753 Plant funds 15,322,658 14,124,645 14,126,396 Loan funds 21,896 20,759 21,048 Total without GASBs 68 and 71 34,026,085 29,677,261 31,620,890 GASBs 68 and 71 (134,927,891) (135,009,729) -
Total Unrestricted Net Position (100,901,806)$ (105,332,468)$ 31,620,890$
Total unrestricted net position was ($100.9) million at June 30, 2016 compared to ($105.3) million at June 30, 2015. The increase of $4.4 million from fiscal year 2015 to fiscal year 2016 reflects an excess of revenues over expenses during fiscal year 2016 from noncapital activity. Total unrestricted net position was ($105.3) million at June 30, 2015 compared to $31.6 million at June 30, 2014. The decrease of $136.9 million from fiscal year 2014 to fiscal year 2015 reflects a combination of a $1.9 million excess of expenses over revenues during fiscal year 2015 from non-capital activity and a reduction in net position of ($135.0) million due to the impact of the adoption of GASBs 68 and 71. The Statements of Revenues, Expenses, and Changes in Net Position These statements present the operating results and the nonoperating revenues and expenses of the University. Annual State appropriations, while budgeted for operations, are considered nonoperating revenues according to generally accepted accounting principles.

YOUNGSTOWN STATE UNIVERSITY Management’s Discussion and Analysis (cont.)
16
A summary of revenues, expenses and changes in net position follows:
June 30, 2016 June 30, 2015 June 30, 2014Operating Revenues
Net tuition, fees and other student charges 83,532,926$ 84,357,825$ 87,064,562$ Auxiliary enterprises 23,930,810 22,098,719 22,804,151 Grants and contracts 9,543,964 9,340,832 8,466,912 Other 2,381,917 2,469,689 2,300,536
Total Operating Revenues 119,389,617 118,267,065 120,636,161
Operating Expenses 192,579,044 194,842,580 198,300,930
Operating Loss (73,189,427) (76,575,515) (77,664,769)
Nonoperating Revenues (Expenses)State appropriations 41,813,887 38,930,258 37,712,282 Gifts, grants, and contracts 30,771,333 33,714,863 34,368,531 Investment income 793,961 1,566,035 5,481,254 Other (5,231,948) (5,333,131) (4,422,670)
Net Nonoperating Revenues 68,147,233 68,878,025 73,139,397
Loss Before Other Revenues, Expenses, and Changes (5,042,194) (7,697,490) (4,525,372)
Other Revenues, Expenses, and ChangesState capital appropriations 8,539,064 6,174,875 4,195,720 Capital grants and gifts 2,081,270 1,069,282 2,482,221 Other 86,080 65,572 448,643
Total Other Revenues, Expenses, and Changes 10,706,414 7,309,729 7,126,584
Change in Net Position 5,664,220 (387,761) 2,601,212
Net Position at Beginning of the Year, restated 57,506,681 57,894,442 192,035,957 Net Position at End of the Year 63,170,901$ 57,506,681$ 194,637,169$
Revenues Following is a recap of revenues by source (operating, nonoperating, and other sources), which were used to fund the University’s activities for the years ended:
June 30, 2016 June 30, 2015 June 30, 2014Net tuition, fees, and other student charges 83,532,926$ 84,357,825$ 87,064,562$ Gifts, grants and contracts 42,396,567 44,124,977 45,317,664 State appropriations 41,813,887 38,930,258 37,712,282 Auxiliary enterprises 23,930,810 22,098,719 22,804,151 Investment income 793,961 1,566,035 5,481,254 State capital appropriations 8,539,064 6,174,875 4,195,720 Other revenue 3,265,243 2,942,894 3,146,602
Total Revenues 204,272,458$ 200,195,583$ 205,722,235$

YOUNGSTOWN STATE UNIVERSITY Management’s Discussion and Analysis (cont.)
17
Overall, the University’s total revenues increased $4.1 million or 2.0% between fiscal year 2016 and fiscal year 2015. The majority of the University’s revenue, 61% in fiscal year 2016 and 62% in fiscal year 2015, is attributed to State Appropriations and net of tuition and fees. Combined, these two revenue streams increased $2.1 million from fiscal year 2015 to fiscal year 2016. Net tuition, fees and other student charges decreased slightly over the prior year primarily due to a minor decrease in enrollment. Gifts grants and contracts decreased $1.7 million or 4% due to combination of a $2.1 million decrease in Pell grants due to decreased enrollment and an increase of $1 million in capital grants and gifts, including increased activity on state funded projects for additive manufacturing grants and gifts for future capital projects including a manufacturing innovation & commercialization center, a student success center and a multimedia center. State appropriations increased $2.9 million or 7.4% from $38.9 million in fiscal year 2015 to $41.8 million in fiscal year 2016. This increase was largely due to the State Legislature increasing operating appropriations for higher education in exchange for prohibiting universities from raising undergraduate tuition. Auxiliary enterprises revenue increased $1.8 million or 8%, primarily due to a $1.3 million increase in housing revenue, resulting from increased room and board fees and an increase in the number of students residing on campus. Investment income decreased approximately $700,000 or 49%. This was due to net unrealized losses in non-endowed investments resulting from a less favorable market environment during fiscal year 2016. State capital appropriations increased $2.4 million or 38% due to continued efforts on the part of management to more aggressively use state capital dollars to address deferred maintenance needs. Overall, the University’s total revenues decreased $5.5 million or 3% between fiscal year 2015 and fiscal year 2014. The majority of the University’s revenue, 62% in fiscal year 2015 and 61% in fiscal year 2014 is attributed to State appropriations, and net tuition and fees. Combined, these two revenue streams decreased $1.5 million from fiscal year 2014 to fiscal year 2015. Despite increases in tuition and fee rates in fiscal year 2015, income from net tuition, fees and other student charges decreased a net $2.7 million or 3% from fiscal year 2014 to fiscal year 2015 due to decreased enrollment. Gifts, grants and contracts decreased $1.2 million or 3% over the prior year due to a combination of increased federal grant and gift activity and decreased Pell grant and capital grant activity. Federal grant activity relating to the TechBelt Energy Innovation Center increased $1.2 million and the University received a $1 million gift, the majority of which was dedicated for improvements to Wick Avenue. Pell grants decreased $2.1 million resulting from decreased enrollment and capital grants decreased $1.2 million due to the prior year including grant funding for new equipment in the STEM College. State Appropriations increased $1.2 million or 3% from $37.7 million in fiscal year 2014 to $38.9 million in fiscal year 2015. The increase was attributable to an increase in the statewide appropriation for higher education operating support; and the University’s institutional allocation of these funds, which is distributed through a performance-based funding formula administered by the Ohio Department of Higher Education. Investment income decreased $3.9 million or 71%. Fiscal year 2014 had net unrealized gains due to a favorable market environment; whereas fiscal year 2015 had net unrealized losses due to a less favorable market environment. State capital appropriations increased $2 million or 47% from fiscal year 2014 to fiscal year 2015 as more projects were being financed with capital funds rather than bond proceeds and gifts as in the prior years. Bond proceeds of $1.7 million and
YOUNGSTOWN STATE UNIVERSITY Management’s Discussion and Analysis (cont.)
18
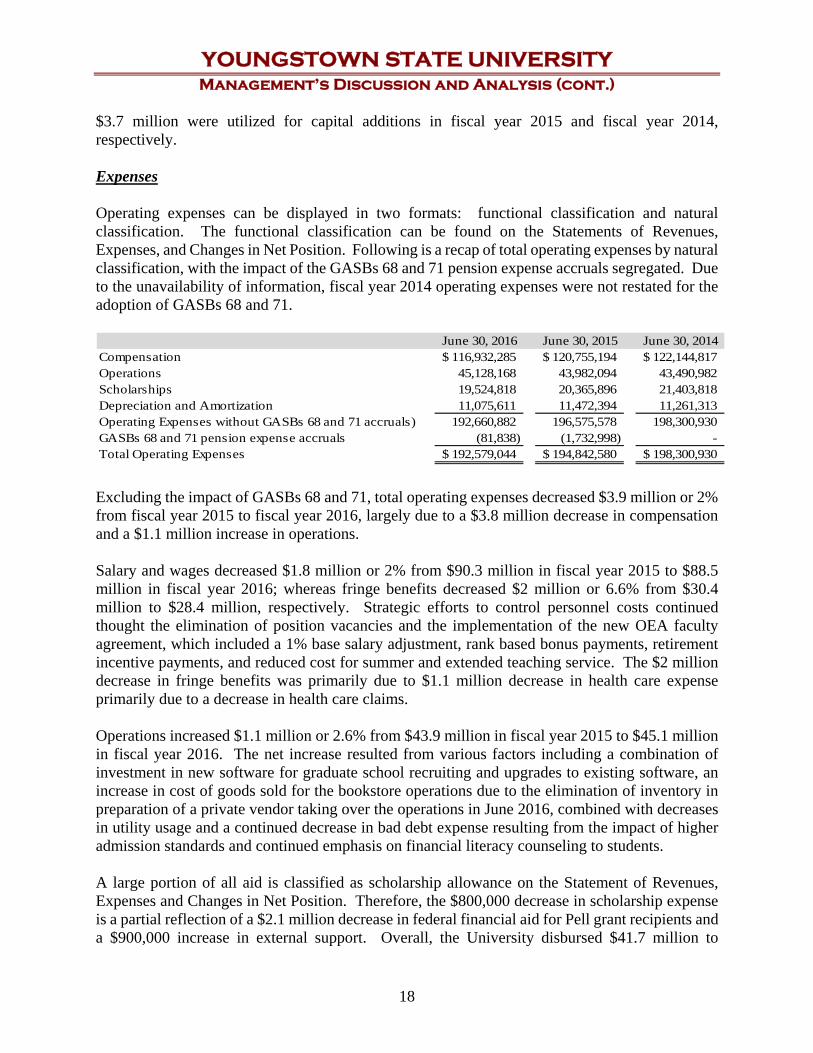
$3.7 million were utilized for capital additions in fiscal year 2015 and fiscal year 2014, respectively. Expenses Operating expenses can be displayed in two formats: functional classification and natural classification. The functional classification can be found on the Statements of Revenues, Expenses, and Changes in Net Position. Following is a recap of total operating expenses by natural classification, with the impact of the GASBs 68 and 71 pension expense accruals segregated. Due to the unavailability of information, fiscal year 2014 operating expenses were not restated for the adoption of GASBs 68 and 71.
June 30, 2016 June 30, 2015 June 30, 2014Compensation 116,932,285$ 120,755,194$ 122,144,817$ Operations 45,128,168 43,982,094 43,490,982 Scholarships 19,524,818 20,365,896 21,403,818 Depreciation and Amortization 11,075,611 11,472,394 11,261,313 Operating Expenses without GASBs 68 and 71 accruals) 192,660,882 196,575,578 198,300,930 GASBs 68 and 71 pension expense accruals (81,838) (1,732,998) - Total Operating Expenses 192,579,044$ 194,842,580$ 198,300,930$
Excluding the impact of GASBs 68 and 71, total operating expenses decreased $3.9 million or 2% from fiscal year 2015 to fiscal year 2016, largely due to a $3.8 million decrease in compensation and a $1.1 million increase in operations. Salary and wages decreased $1.8 million or 2% from $90.3 million in fiscal year 2015 to $88.5 million in fiscal year 2016; whereas fringe benefits decreased $2 million or 6.6% from $30.4 million to $28.4 million, respectively. Strategic efforts to control personnel costs continued thought the elimination of position vacancies and the implementation of the new OEA faculty agreement, which included a 1% base salary adjustment, rank based bonus payments, retirement incentive payments, and reduced cost for summer and extended teaching service. The $2 million decrease in fringe benefits was primarily due to $1.1 million decrease in health care expense primarily due to a decrease in health care claims. Operations increased $1.1 million or 2.6% from $43.9 million in fiscal year 2015 to $45.1 million in fiscal year 2016. The net increase resulted from various factors including a combination of investment in new software for graduate school recruiting and upgrades to existing software, an increase in cost of goods sold for the bookstore operations due to the elimination of inventory in preparation of a private vendor taking over the operations in June 2016, combined with decreases in utility usage and a continued decrease in bad debt expense resulting from the impact of higher admission standards and continued emphasis on financial literacy counseling to students. A large portion of all aid is classified as scholarship allowance on the Statement of Revenues, Expenses and Changes in Net Position. Therefore, the $800,000 decrease in scholarship expense is a partial reflection of a $2.1 million decrease in federal financial aid for Pell grant recipients and a $900,000 increase in external support. Overall, the University disbursed $41.7 million to

YOUNGSTOWN STATE UNIVERSITY Management’s Discussion and Analysis (cont.)
19
students in fiscal year 2016 compared to $42.4 million in fiscal year 2015, including $20.1 million and $22.2 million in federal Pell grants, respectively. A large portion of all aid is classified as scholarship allowance on the Statement of Revenues, Expenses and Changes in Net Position. Therefore, the $800,000 decrease in scholarship expense is a partial reflection of a $2.1 million decrease in federal financial aid for Pell grant recipients and a $900,000 increase in external support. Overall, the University disbursed $41.7 million to students in fiscal year 2016 compared to $42.4 million in fiscal year 2015, including $20.1 million and $22.2 million in federal Pell grants, respectively. Pension expense attributed to GASB 68 and 71 is allocated to institutional functions on the Statement of Revenues, Expenses and Other Changes in Net Position and increased $13.1 million from fiscal year 2015 to fiscal year 2016. The increase was primarily due to differences between projected and actual pension plan investment earnings and the University’s proportionate share of contributions. The University has no control over these accruals. Excluding the impact of GASBs 68 and 71, total operating expenses decreased $1.7 million or 0.9% from fiscal year 2014 to fiscal year 2015, a combination of a $1.4 million decrease in compensation, a $500,000 increase in operations and a $1 million decrease in scholarships. Salary and wages decreased $2.2 million or 2.4% from $95.5 million in fiscal year 2014 to $90.3 million in fiscal year 2015, reflective of continued strategic elimination of staff vacancies and efforts to control and reduce personnel costs. Fringe benefits increased $800,000 or 2.8% from $29.6 million to $30.4 million due to increased health care claims. Operations increased $500,000 due to a combination of a $1.3 million increase in funds distributed under a subcontract to the TechBelt Energy Innovation Center and a $900,000 decrease in bad debt resulting from stricter admission standards, a focus on internal collection efforts, and more financial literacy counseling to students. The $1 million decrease in scholarship expense from fiscal year 2014 to fiscal year 2015 is a partial reflection of a $2.1 million decrease in federal financial aid for Pell grant recipients and a $600,000 increase in external support. Overall, the University disbursed $42.4 million to students in fiscal year 2015 compared to $43.8 million in fiscal year 2014, including $22.2 million and $24.3 million in Federal Pell grants, respectively. Total operating and non operating expenses for the University were $198,608,238, $200,583,344, and $203,121,023 in fiscal years 2016, 2015 and 2014, respectively.

YOUNGSTOWN STATE UNIVERSITY Management’s Discussion and Analysis (cont.)
20
Economic Factors for the Future Looking to the future, management believes the University is well-positioned to continue its favorable financial condition and level of excellence in service to students. Based on the most recent estimate provided by the Ohio Department of Higher Education, State Share of Instruction (SSI) funding for the University is expected to rise by $900,000 or 2.2%. This increase is partially attributable to an increase in the statewide SSI appropriation. The increase is also attributable to the results of strategic decisions YSU has made to better position itself in the performance based SSI formula. The increase in statewide higher education funding notwithstanding, degrees awarded and course completions will continue to be primary drivers of SSI funding. Datasets used in the formula are based on a three-year rolling average, and are weighted to take into account various at-risk student characteristics. The SSI formula continues to factor in discipline costs and enrollment levels. The following graph reflects six years actual data for State Appropriations plus the budgeted amount for fiscal year 2017.
$36,000,000
$37,000,000
$38,000,000
$39,000,000
$40,000,000
$41,000,000
$42,000,000
$43,000,000
$44,000,000
FY 2011 FY 2012 FY 2013 FY 2014 FY 2015 FY 2016 FY 2017
State AppropriationsFiscal Years 2011 through 2017

YOUNGSTOWN STATE UNIVERSITY Management’s Discussion and Analysis (cont.)
21
Fall Semester Enrollment Trends 2005 through 2016
As expected, Fall 2016 enrollments are 3.5% higher than the prior Fall semester. This represents a sharp turnaround in the University’s enrollment trend, following a four-year decline. The results of the University’s new incoming student enrollments, coupled with the academic quality of those students, provide significant cause for continued optimism for Spring 2017 and beyond. For Fall 2016, the University experienced increases in high school students enrolled in the College Credit Plus program; new freshman, graduate, international and transfer students; and new students enrolled in the Honors College. Freshman GPA and ACT averages were both the highest in University history. Efforts to widen the University’s appeal beyond its traditional footprint also appear to be showing some early signs of success. Enrollment increases were noted for out of state freshman as well as the contiguous Ohio counties and number of high schools represented in the freshman class. The University’s freshmen to sophomore retention rate remained steady from Fall 2015 to Fall 2016 after a 6% increase last year, representing further evidence that the University has stabilized and reversed its enrollment trend. Finally, early results for Fall 2017 are even more positive than expected, running far ahead of Fall 2016 at this same time.
2005 2006 2007 2008 2009 2010 2011 2012 2013 2014 2015 2016
Full-Time Equivalent 10,332 10,590 10,796 10,953 11,649 12,093 11,677 11,171 10,819 10,149 10,034 10,389
Headcount 12,812 13,183 13,497 13,712 14,682 15,194 14,541 13,813 13,381 12,551 12,471 12,756
-
2,000
4,000
6,000
8,000
10,000
12,000
14,000
16,000

YOUNGSTOWN STATE UNIVERSITY Statements of Net Position at June 30, 2016 and 2015
22
June 30, 2016 June 30, 2015ASSETS
Current AssetsCash and cash equivalents 15,893,972$ 11,472,553$ Investments 36,906,441 39,133,843 Restricted investments 638,165 866,522 Interest receivable 98,121 94,242 Accounts receivable, net 13,033,177 10,735,452 Pledges receivable, net 893,284 1,140,910 Loans receivable, net 422,496 404,434 Inventories 84,831 1,186,416 Prepaid expenses and unearned charges 1,050,643 1,385,085
Total Current Assets 69,021,130 66,419,457
Noncurrent AssetsInvestments 17,198,170 14,723,869 Endowments and other restricted investments 8,579,269 8,333,945 Pledges receivable, net 827,958 1,526,422 Loans receivable, net 1,455,935 1,771,897 Other noncurrent assets 171,180 187,782 Cash surrender value of life insurance 321,224 311,993 Nondepreciable capital assets 35,608,290 22,858,918 Depreciable capital assets, net 178,857,955 175,893,857
Total Noncurrent Assets 243,019,981 225,608,683 Total Assets 312,041,111 292,028,140
DEFERRED O UTFLO WS O F RESO URCESPension OPERS 16,422,322 4,448,632 Pension STRS 9,704,367 6,162,539
Total Deferred O utflows of Resources 26,126,689 10,611,171
LIABILITIESCurrent Liabilities
Accounts payable 3,653,797 2,963,665 Construction payable 3,041,732 1,931,359 Payroll liabilit ies 7,041,919 7,543,616 Bonds payable 2,455,000 1,865,000 Notes payable - 1,139,444 Compensated absences 604,117 736,034 Unearned revenue 5,824,756 5,294,416 Other liabilit ies 1,421,973 810,173
Total Current Liabilities 24,043,294 22,283,707
Noncurrent LiabilitiesBonds payable, net 62,301,416 64,793,996 Notes payable 16,000,000 - Compensated absences 8,412,313 9,107,728 Refundable advance 2,527,796 2,581,299 Net pension liability 146,345,693 127,685,143
Total Noncurrent Liabilities 235,587,218 204,168,166 Total Liabilities 259,630,512 226,451,873
DEFERRED INFLO WS O F RESO URCESService concession agreements 657,500 745,000 Pension OPERS 2,214,446 635,671 Pension STRS 12,494,441 17,300,086
Total Deferred Resources of Inflows 15,366,387 18,680,757
NET PO SITIO NNet investment in capital assets 134,289,273 132,793,340 Restricted - Nonexpendable 5,178,994 5,062,070 Restricted - Expendable 24,604,440 24,983,739 Unrestricted (100,901,806) (105,332,468)
Total Net Position 63,170,901$ 57,506,681$
See accompanying notes to financial statements.

THE YOUNGSTOWN STATE UNIVERSITY FOUNDATION Statements of Financial Position at June 30, 2016 and 2015
23
June 30, 2016 June 30, 2015ASSETS
Cash and cash equivalents 4,739,753$ 4,341,923$ Investments 206,643,636 218,740,363Accounts receivable 9,295 - Property acquired for resale to Youngstown State University 109,520 - Investments held for others - 3,474,650 Pledges receivable, net 2,057,504 731,033 Pledges receivable for Youngstown State University, net 3,182,716 1,346,918 Prepaid expenses and other assets 1,031,078 20,098 Property and equipment, net 59,229 22,344 Beneficial interest in remainder trusts 399,582 441,661
TOTAL ASSETS 218,232,313$ 229,118,990$
LIABILITIES AND NET ASSETSLIABILITIES
Accounts payable 860,489$ 522,776$ Grant commitments to Youngstown State University
for scholarship awards 8,067,599 7,722,375 Funds held for others - 3,474,650 Accrued liabilities and other 55,063 -
TOTAL LIABILITIES 8,983,151 11,719,801
NET ASSETSUnrestricted 136,086,960 152,937,194 Temporarily restricted 8,068,816 6,799,238 Permanently restricted 65,093,386 57,662,757
TOTAL NET ASSETS 209,249,162 217,399,189
TOTAL LIABILITIES AND NET ASSETS 218,232,313$ 229,118,990$

YOUNGSTOWN STATE UNIVERSITY Statements of Revenues, Expenses, and Changes in Net Position
For the Years Ended June 30, 2016 and 2015
24
June 30, 2016 June 30, 2015
Tuition, fees, and other student charges (net of scholarship allowance of $22,136,886 in 2016 and 22,051,829 in 2015) 83,532,926$ 84,357,825$ Federal grants and contracts 3,848,977 4,113,501 State grants and contracts 5,123,960 4,675,489 Local grants and contracts 169,703 153,686 Private grants and contracts 401,324 398,156 Sales and services 431,584 508,200 Auxiliary enterprises 23,930,810 22,098,719 Other operating revenues 1,950,333 1,961,489 Total Operating Revenues 119,389,617 118,267,065
Instruction 64,295,468 66,393,543 Research 1,859,303 2,721,990 Public service 5,497,073 4,768,094 Academic support 14,270,655 14,053,028 Student services 10,300,999 9,625,128 Institutional support 22,745,633 22,612,180 Operation and maintenance of plant 16,511,923 16,526,726 Scholarships 15,218,376 16,358,672 Auxiliary enterprises 30,804,003 30,310,825 Depreciation and amortization 11,075,611 11,472,394
Total Operating Expenses 192,579,044 194,842,580 Operating Loss (73,189,427) (76,575,515)
NONOPERATING REVENUES (EXPENSES)State appropriations 41,813,887 38,930,258 Federal grants 20,658,870 22,747,643 Private gifts 10,112,463 10,967,220 Unrestricted investment income, net of investment expense 289,877 1,288,186 Restricted investment income, net of investment expense 504,084 277,849 Interest on capital asset-related debt (3,939,548) (3,454,055) Other nonoperating expenses, net (1,292,400) (1,879,076)
Net Nonoperating Revenues 68,147,233 68,878,025 Loss Before Other Revenues, Expenses, and Changes (5,042,194) (7,697,490)
OTHER REVENUES, EXPENSES, AND CHANGESState capital appropriations 8,539,064 6,174,875 Capital grants and gifts 2,081,270 1,069,282 Other 86,080 65,572
Total Other Revenues, Expenses, and Changes 10,706,414 7,309,729 Change In Net Position 5,664,220 (387,761)
NET POSITIONNet Position at Beginning of the Year 57,506,681 57,894,442 Net Position at End of the Year 63,170,901$ 57,506,681$
See accompanying notes to financial statements.
OPERATING REVENUES
OPERATING EXPENSES

THE YOUNGSTOWN STATE UNIVERSITY FOUNDATION Statements of Activities and Changes in Net Assets
For the Years Ended June 30, 2016 and 2015
25
Temporarily PermanentlyUnrestricted Restricted Restricted Total
REVENUES, GAINS AND OTHER SUPPORT:Contributions 4,562,193$ 2,360,160$ 7,472,708$ 14,395,061$ In-kind donations - - - - Investment earnings 1,813,472 765,181 - 2,578,653 Net realized gain on sale of investments 2,002,727 827,742 - 2,830,469 Net unrealized change in long-term investments (13,579,678) 1,224,733 - (12,354,945) Change in beneficial interest in remainder trusts - - (42,079) (42,079) Net assets released from restrictions 3,908,238 (3,908,238) - -
TOTAL REVENUES, GAINS AND OTHER SUPPORT (1,293,048) 1,269,578 7,430,629 7,407,159
EXPENSESDistribution to Youngstown State University - - - -
for scholarships and other programs 12,982,554 12,982,554 Administrative expenditures 2,573,532 - - 2,573,532 Benefits for retired Youngstown University faculty 1,100 - - 1,100
TOTAL EXPENSES 15,557,186 - - 15,557,186
DONOR RECLASSIFICATIONS - - - -
INCREASE (DECREASE) IN NET ASSETS (16,850,234) 1,269,578 7,430,629 (8,150,027)
Net Assets - Beginning of Year 152,937,194 6,799,238 57,662,757 217,399,189 Net Assets - End of Year 136,086,960$ 8,068,816$ 65,093,386$ 209,249,162$
Temporarily PermanentlyUnrestricted Restricted Restricted Total
REVENUES, GAINS AND OTHER SUPPORT:Contributions 842,868$ 2,457,583$ 4,781,920$ 8,082,371$ In-kind donations 2,168 - - 2,168 Investment earnings 2,203,829 688,250 - 2,892,079 Net realized gain on sale of investments 2,094,161 784,244 - 2,878,405 Net unrealized (loss) gain on long-term investments (6,494,585) (1,295,899) - (7,790,484) Change in beneficial interest in remainder trusts - - (227,825) (227,825) Net assets released from restrictions 4,926,640 (4,926,640) - -
TOTAL REVENUES, GAINS AND OTHER SUPPORT 3,575,081 (2,292,462) 4,554,095 5,836,714
EXPENSESDistribution to Youngstown State University - - - -
for scholarships and other programs 10,324,044 10,324,044 Administrative expenditures 2,236,949 - - 2,236,949 Benefits for retired Youngstown University faculty 2,000 - - 2,000
TOTAL EXPENSES 12,562,993 - - 12,562,993
DONOR RECLASSIFICATIONS - - - -
INCREASE (DECREASE) IN NET ASSETS (8,987,912) (2,292,462) 4,554,095 (6,726,279)
Net Assets - Beginning of Year 161,925,106 9,091,700 53,108,662 224,125,468 Net Assets - End of Year 152,937,194$ 6,799,238$ 57,662,757$ 217,399,189$
June 30, 2016
June 30, 2015
YOUNGSTOWN STATE UNIVERSITY Statements of Cash Flows
For the Years Ended June 30, 2016 and 2015
26
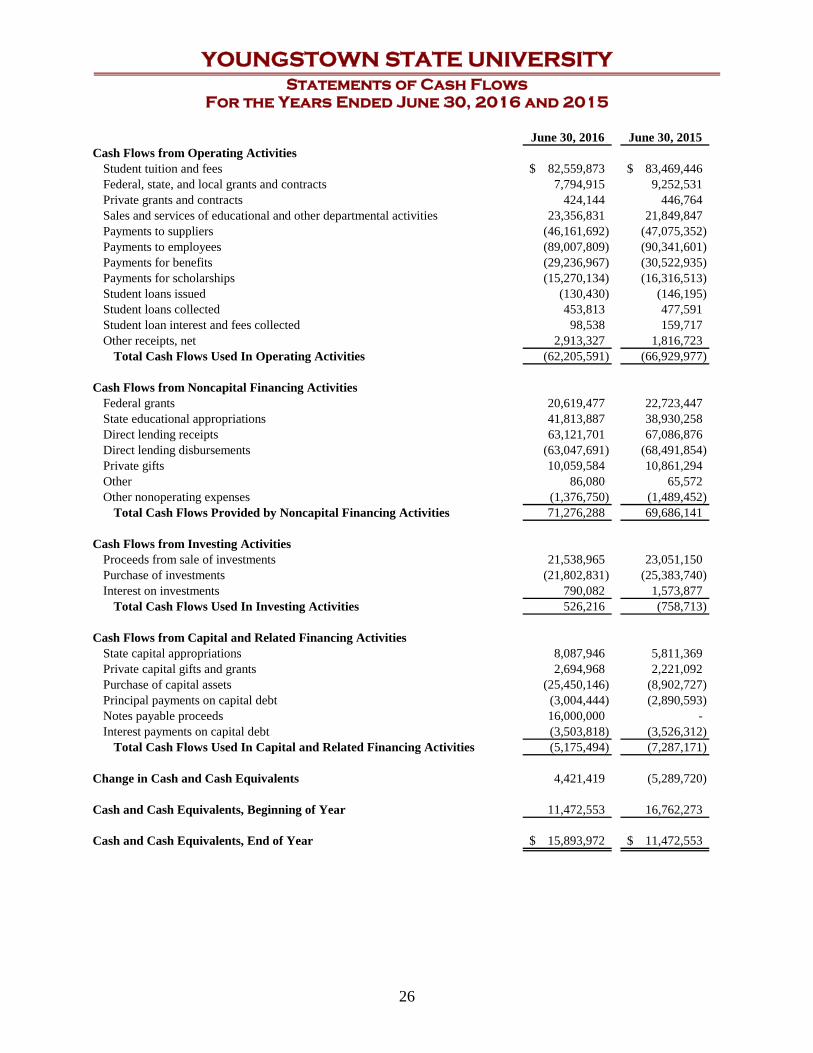
June 30, 2016 June 30, 2015Cash Flows from Operating Activities
Student tuition and fees 82,559,873$ 83,469,446$ Federal, state, and local grants and contracts 7,794,915 9,252,531 Private grants and contracts 424,144 446,764 Sales and services of educational and other departmental activities 23,356,831 21,849,847 Payments to suppliers (46,161,692) (47,075,352) Payments to employees (89,007,809) (90,341,601) Payments for benefits (29,236,967) (30,522,935) Payments for scholarships (15,270,134) (16,316,513) Student loans issued (130,430) (146,195) Student loans collected 453,813 477,591 Student loan interest and fees collected 98,538 159,717 Other receipts, net 2,913,327 1,816,723
Total Cash Flows Used In Operating Activities (62,205,591) (66,929,977)
Cash Flows from Noncapital Financing ActivitiesFederal grants 20,619,477 22,723,447 State educational appropriations 41,813,887 38,930,258 Direct lending receipts 63,121,701 67,086,876 Direct lending disbursements (63,047,691) (68,491,854) Private gifts 10,059,584 10,861,294 Other 86,080 65,572 Other nonoperating expenses (1,376,750) (1,489,452)
Total Cash Flows Provided by Noncapital Financing Activities 71,276,288 69,686,141
Cash Flows from Investing ActivitiesProceeds from sale of investments 21,538,965 23,051,150 Purchase of investments (21,802,831) (25,383,740) Interest on investments 790,082 1,573,877
Total Cash Flows Used In Investing Activities 526,216 (758,713)
Cash Flows from Capital and Related Financing ActivitiesState capital appropriations 8,087,946 5,811,369 Private capital gifts and grants 2,694,968 2,221,092 Purchase of capital assets (25,450,146) (8,902,727) Principal payments on capital debt (3,004,444) (2,890,593) Notes payable proceeds 16,000,000 - Interest payments on capital debt (3,503,818) (3,526,312)
Total Cash Flows Used In Capital and Related Financing Activities (5,175,494) (7,287,171)
Change in Cash and Cash Equivalents 4,421,419 (5,289,720)
Cash and Cash Equivalents, Beginning of Year 11,472,553 16,762,273
Cash and Cash Equivalents, End of Year 15,893,972$ 11,472,553$

YOUNGSTOWN STATE UNIVERSITY Statements of Cash Flows (cont.)
For the Years Ended June 30, 2016 and 2015
27
Reconciliation of Operating Loss to Net Cash Used in Operating Activities
June 30, 2016 June 30, 2015Operating loss (73,189,427)$ (76,575,515)$ Adjustments to reconcile operating loss to net cash used in
operating activities:Depreciation and amortization 11,075,611 11,472,394 Provision for bad debts 854,147 1,097,692 Gifts in kind 113,113 30,978 Changes in assets and liabilities:
Accounts receivable, net (2,612,917) (1,085,805) Loans receivable, net 307,328 316,347 Inventories 1,101,585 471,213 Prepaid expenses and unearned charges 334,442 241,915 Accounts payable 690,132 (305,519) Accrued and other liabilities (357,418) (637,391) Unearned revenue 386,983 (170,594) Compensated absences (827,332) (52,694) Net pension liability 18,660,550 (9,057,584) Deferred outflows of resources (15,515,518) (10,611,171) Deferred inflow of resources (3,226,870) 17,935,757
Net Cash Flows Used In Operating Activities (62,205,591)$ (66,929,977)$
See accompanying notes to financial statements.

YOUNGSTOWN STATE UNIVERSITY Notes to Financial Statements
For the Years Ended June 30, 2016 and 2015
28
Note 1 – Organization and Summary of Significant Accounting Policies Organization and Basis of Presentation Youngstown State University (the University or YSU) is a coeducational, degree granting state-assisted metropolitan university and was established by the General Assembly of the State of Ohio in 1967. The University is a component unit of the State of Ohio. The University provides a wide range of opportunities in higher education primarily to residents in northeastern Ohio and western Pennsylvania. The University offers degrees at the undergraduate, graduate and doctoral levels. In accordance with Governmental Accounting Standards Board (GASB) Statement No.14, The Reporting Entity, and GASB Statement No. 61, The Financial Reporting Entity: Omnibus, the University’s financial statements are included, as a discretely presented component unit, in the State of Ohio’s (State) Comprehensive Annual Financial Report. In accordance with GASB Statement No. 39, Determining Whether Certain Organizations are Component Units, the Youngstown State University Foundation’s (YSUF or Foundation) financial statements are included, as a discretely presented component unit, in the University’s financial report by presentation of the individual financial statements of the entity immediately following the University’s respective GASB financial statements. See Note 16 for additional information regarding the University’s component unit. The University’s financial statements have been prepared in accordance with accounting principles generally accepted in the United States of America as prescribed by the GASB. Under the provisions of GASB Statement No. 63, resources are classified for accounting and reporting purposes into the following four net position categories:
Net investment in capital assets – Capital assets, net of accumulated depreciation, outstanding principal balances of debt attributable to the acquisition, construction or improvement of those assets.
Restricted Nonexpendable – Resources subject to externally imposed stipulations that they
be maintained permanently by the University. Such resources include the University’s permanent endowment funds.
Restricted Expendable – Resources whose use by the University is subject to externally
imposed stipulations that can be fulfilled by actions of the University pursuant to those stipulations or that expire by the passage of time.

YOUNGSTOWN STATE UNIVERSITY Notes to Financial Statements (cont.)
For the Years Ended June 30, 2016 and 2015
29
Unrestricted – Resources that are not subject to externally imposed stipulations. Unrestricted resources may be designated for specific purposes by action of management, Board of Trustees or may otherwise be limited by contractual agreements with outside parties. Substantially all unrestricted resources are designated for academic and research programs and initiatives, capital projects, and operating reserves.
Summary of Significant Accounting Policies The accompanying financial statements have been prepared on the accrual basis. The University reports as a Business Type Activity, as defined by GASB Statement No. 35. Business Type Activities are those that are financed in whole or in part by fees charged to external parties. Cash Equivalents – The University considers all highly liquid investments with an original maturity of three months or less to be cash equivalents. Cash and cash equivalents are stated at cost, which approximates fair value and excludes amounts restricted by board designation or whose use is limited. Investments – In accordance with GASB Statement No. 31, Accounting and Financial Reporting for Certain Investments and for External Investment Pools, investments are reported at fair value based on quoted market prices. Changes in unrealized gains (losses) on the carrying value of investments are reported as a component of investment income in the Statement of Revenues, Expenses, and Changes in Net Position. Endowment Policy – The University Endowment Fund consists of 99 named funds. Each named fund is assigned a number of shares in the University Endowment Fund based on the value of the gifts to that named fund. Prior to July 2015, the University’s policy was to limit annual distributions to no greater than accumulated income earned. Distributions greater than the accumulated income earned require written justification and Board of Trustees’ approval. Effective July 2015 a new endowment spending policy was implemented where annual distributions each fiscal year are set to 5% of the twelve-quarter average of the market value for the preceding twelve calendar quarters. In calculating the twelve-quarter average, census dates of March 31, June 30, September 30 and December 31 for the previous three years shall be used. Distributions greater than the calculated amount require written justification and Board of Trustees’ approval. Accounts Receivable – Accounts receivable consist of tuition and fee charges to students and auxiliary enterprise services provided to students, faculty and staff. Also included are amounts due from federal, state, and local governments, or private sources, in connection with reimbursement of allowable expenses under the applicable University grants and contracts. Accounts are recorded net of allowance for uncollectible amounts. Pledges Receivable – The University receives pledges and bequests of financial support from corporations, foundations, and individuals. Revenue is recognized when a gift representing an unconditional promise to pay is received and all eligibility requirements have been met. In the absence of a conditional pledge, revenue is recognized when the gift is received. Pledges are

YOUNGSTOWN STATE UNIVERSITY Notes to Financial Statements (cont.)
For the Years Ended June 30, 2016 and 2015
30
recorded net of an allowance for uncollectible amounts and are discounted to net present value. During fiscal year 2015, the University entered into a development services agreement with the Foundation. As part of the agreement, new pledges are recorded by the Foundation and payments on University pledges are collected by the Foundation and remitted to the University on a monthly basis. Inventories – Inventories are stated at the lower of cost or market. Cost is determined on the first-in, first-out (FIFO) method for the Bookstore. Capital Assets – Capital assets are stated at cost or acquisition value at date of gift. Infrastructure assets are included in the financial statements and are depreciated. The University’s capitalization threshold for equipment, furniture and vehicles is $5,000; and for buildings, building improvements and improvements other than buildings is $100,000. Land is capitalized regardless of cost. Library purchases are excluded from capitalization and expensed as purchased. Depreciation (including amortization of capital leased assets) is computed using the straight-line method over the estimated useful life of the asset and is not allocated to the functional expenditure categories. Historical collections, including assets that are held for public exhibition, education, or research in furtherance of public service, which are protected and preserved, are not depreciated. When capital assets are sold, or otherwise disposed of, the carrying value of such assets and any accumulated depreciation is removed from asset accounts and the net investment in capital assets. The costs of normal maintenance and repairs that do not add to the value of the capital asset or materially extend the capital asset’s life are expensed when incurred. Estimated lives are as follows: Classification Estimated Life Buildings 50 years Improvements to buildings 10 to 50 years Improvements other than buildings 15 years Moveable equipment, furniture and vehicles 3 to 10 years Unearned Revenue – Unearned revenue includes tuition and fee revenues billed or received prior to the end of the current fiscal year end, but related to the period after the current fiscal year. Also included are amounts received from grants and contract sponsors that have not yet been earned and other resources received before the eligibility requirements are met. Compensated Absences – Accumulated unpaid vacation, personal and sick leave benefits have been accrued in accordance with GASB Statement No. 16, Accounting for Compensated Absences. The University uses the termination method to accrue sick leave compensated absences on the Statement of Net Position.

YOUNGSTOWN STATE UNIVERSITY Notes to Financial Statements (cont.)
For the Years Ended June 30, 2016 and 2015
31
Refundable Advances from Government for Federal Loans – Funds provided by the United States government under the Federal Perkins Loan program are loaned to qualified students and re-loaned after collections. These funds are ultimately refundable to the government and, therefore, are recorded as a liability in the accompanying financial statements. Deferred Outflows and Inflows of Resources – Deferred outflows of resources represent the consumption of resources that are applicable to a future reporting period, but do not require further exchange of goods or services. Deferred inflows of resources represent the acquisition of resources that are applicable to a future resource period. Deferred outflows of resources in the University’s financial statements consist of differences between projections and actual in the OPERS and STRS Ohio pension plans and contributions subsequent to the measurement dates of the plans. Deferred inflows of resources in the University’s financial statements consist of unamortized service concession arrangements and differences between projections and the actual in the OPERS and STRS Ohio pension plans. Service Concession Arrangements – Service concession arrangements consist of an agreement with a food service provider and an agreement with a beverage company for exclusive pouring rights. Funds received are contingent upon utilization of services over a specified time period and are amortized over the term of the contract arrangement. Unamortized amounts are reflected as deferred inflows of resources on the Statement of Net Position. Pensions – For purposes of measuring the net pension liability, deferred outflows/inflows of resources, and pension expense, information about the fiduciary net positions of the Ohio Public Employees Retirement System (OPERS) and the State Teachers Retirement System of Ohio (STRS Ohio) and additions to/deductions from OPERS’ and STRS Ohio’s fiduciary net positions have been determined on the same basis as they are reported by these pension systems. For this purpose, benefit payments (including refunds of employee contributions) are recognized when due and payable in accordance with the benefit terms. The pension systems report investments at fair value. Income Taxes – The Internal Revenue Service has ruled that the University’s income is generally exempt from Federal income taxes under Section 115 of the Internal Revenue Code. The University is subject to tax on unrelated business income. Measurement Focus and Financial Statement Presentation – Operating revenues and expenses generally result from providing educational and instructional service in connection with the University’s principal ongoing operations. The principal operating revenues include student tuition, fees and other student charges. The University also recognizes as operating revenue grants classified as exchange transactions and auxiliary activities. Operating expenses include educational costs, administrative expenses and depreciation on capital assets. All revenues and expenses not meeting this definition including State appropriations are reported as nonoperating revenues and expenses.

YOUNGSTOWN STATE UNIVERSITY Notes to Financial Statements (cont.)
For the Years Ended June 30, 2016 and 2015
32
Scholarship Allowances and Student Aid – Tuition, fees, and other student charges are reflected net of scholarship allowances in the Statements of Revenues, Expenses, and Changes in Net Position. Certain aid (such as loans and funds awarded to students by third parties) is accounted for as a third party payment (credited to the student’s account as if the student made the payment). All other aid is reflected in the financial statements as operating expenses, or scholarship allowances, which reduce revenues. The amount reported as operating expense represents the portion of aid that was provided to the student in the form of cash. Scholarship allowances represent the portion of aid provided to the student in the form of reduced tuition. Release of Restricted Funds – When an expense is incurred for purposes for which both restricted and unrestricted resources are available, it is the University’s policy to apply restricted resources first, then unrestricted resources as needed. Management’s Estimates – The preparation of the financial statements in conformity with accounting principles generally accepted in the United States of America requires management to make estimates and assumptions that affect the reported amounts of assets, liabilities, revenue and expenses during the reporting period. Disclosure of contingent assets and liabilities at the date of the financial statements may also be affected. Actual results could differ from these estimates. Adoption of New Accounting Pronouncements – In fiscal year 2016, the provisions of the following GASB Statements became effective: GASB Statement No. 72, Fair Value Measurement and Application, issued February 2015.
The provisions of this Statement are effective for reporting periods beginning after June 15, 2015. This Statement addresses accounting and financial reporting issues related to fair value measurements.
GASB Statement No. 73, Accounting and Financial Reporting for Pensions and Related Assets
That Are Not Within the Scope of GASB Statement 68, and Amendments to Certain Provisions of GASB Statements 67 and 68, issued June 2015. The requirements of this Statement are effective for fiscal years beginning after June 15, 2015 except those provisions that address employers and governmental nonemployer contribution entities for pensions that are not within the scope of Statement 68, which are effective for fiscal years beginning after June 15, 2016. This objective of this Statement is to improve the usefulness of information about pensions included in the general purpose external financial reports of state and local governments for making decisions and assessing accountability. This Statement did not have any impact on the financial statements. GASB Statement No. 76, The Hierarchy of Generally Accepted Accounting Principles for State and Local Governments, issued June 2015. The provisions of this Statement are effective for reporting periods beginning after June 15, 2015. The objective of this Statement is to identify, in the context of the current governmental financial reporting environment, the hierarchy of generally accepted accounting principles (GAAP). This Statement did not have any impact on the financial statements.
YOUNGSTOWN STATE UNIVERSITY Notes to Financial Statements (cont.)
For the Years Ended June 30, 2016 and 2015
33
GASB Statement No. 79, Certain External Investment Pools and Pool Participants, issued December 2015. The requirements of this Statement are effective for reporting periods beginning after June 15, 2015. This Statement addresses accounting and financial reporting for certain external investment pools and pool participants. This Statement did not have any impact on the financial statements.
Newly Issued Accounting Pronouncements – As of the report date, the GASB issued the following statements not yet implemented by the University:
GASB Statement No. 74, Financial Reporting for Postemployment Benefit Plans Other Than
Pension Plans, issued June 2015. The provisions of this Statement are effective for fiscal years beginning after June 15, 2016. The objective of this Statement is to improve the usefulness of information about postemployment benefits other than pensions (other postemployment benefits or OPEB) included in the general purpose external financial reports of state and local governmental OPEB plans for making decisions and assessing accountability.
GASB Statement No. 75, Accounting and Financial Reporting for Postemployment Benefits Other Than Pensions, issued June 2015. The provisions of this Statement are effective for fiscal years beginning after June 15, 2017. The primary objective of this Statement is to improve accounting and financial reporting by state and local governments for postemployment benefits other than pensions (other postemployment benefits or OPEB).
GASB Statement No. 77, Tax Abatement Disclosures, issued August 2015. The requirements of this Statement are effective for reporting periods beginning after December 31, 2015. This Statement is intended to improve financial reporting by requiring disclosure of tax abatement information about a reporting government’s own tax abatement agreements and those that are entered into by other governments and that reduce the reporting government’s tax revenues. hierarchy of generally accepted accounting principles (GAAP).
GASB Statement No. 78, Pensions Provided through Certain Multiple-Employer Defined Benefit Pension Plans, issued December 2015. The requirements of this Statement are effective for reporting periods beginning after December 15, 2015. The objective of this Statement is to address a practice issue regarding the scope and applicability of Statement No. 68, Accounting and Financial Reporting for Pensions.
GASB Statement No. 80, Blending Requirements for Certain Component Units - An Amendment of GASB Statement No. 14, issued January 2016. The requirements of this Statement are effective for reporting periods beginning after June 15, 2016. The objective of this Statement is to improve financial reporting by clarifying the financial statement presentation requirements for certain component units.

YOUNGSTOWN STATE UNIVERSITY Notes to Financial Statements (cont.)
For the Years Ended June 30, 2016 and 2015
34
GASB Statement No. 81, Irrevocable Split-Interest Agreements, issued March 2016. The requirements of this Statement are effective for financial statements for periods beginning after December 15, 2016. The objective of this Statement is to improve accounting and financial reporting for irrevocable split-interest agreements by providing recognition and measurement guidance for situations in which a government is a beneficiary of the agreement.
GASB Statement No. 82, Pension Issues-an amendment of GASB Statements No. 67, No. 68, and No. 73, issued March 2016. The requirements of this Statement are effective for reporting periods beginning after June 15, 2016. The objective of this Statement is to address certain issues that have been raised with respect to Statements No. 67, Financial Reporting for Pension Plans, No. 68, Accounting and Financial Reporting for Pensions, and No. 73, Accounting and Financial Reporting for Pensions and Related Assets That Are Not within the Scope of GASB Statement 68, and Amendments to Certain Provisions of GASB Statement 67 and 68. Specifically, this Statement addresses issues regarding (1) the presentation of payroll-related measures in required supplementary information, (2) the selection of assumptions and the treatment of deviations from the guidance in an Actuarial Standard of Practice for financial reporting purposes, and (3) the classification of payments made by employers to satisfy employee (plan member) contribution requirements.
The University has not yet determined the effect these Statements will have on the University’s financial statements and disclosures. Reclassification – Certain reclassifications have been made to the fiscal year 2015 amounts to conform with the fiscal year 2016 presentation. These reclassifications had no effect on the total net position or change in net position. Note 2 – State Support The University receives support from the State in the form of State appropriations and capital appropriations. As required by GASB Statement No. 35, these are reflected as non operating revenues on the Statement of Revenues, Expenses, and Changes in Net Position. State appropriations totaled $41,813,887 in fiscal year 2016 compared to $38,930,258 in fiscal year 2015. The State Share of Instruction (SSI) is determined annually by the Ohio Department of Higher Education. Capital appropriations from the State totaled $8,539,064 in fiscal year 2016 compared to $6,174,875 in fiscal year 2015 and included funding for equipment and the construction/major renovations of plant facilities. Funding for the construction of major plant facilities on the University campus is obtained from the issuance of revenue bonds by the Ohio Public Facilities Commission (OPFC), which in turn is used for the construction and subsequent lease of the facilities by the Ohio Department of Higher Education.

YOUNGSTOWN STATE UNIVERSITY Notes to Financial Statements (cont.)
For the Years Ended June 30, 2016 and 2015
35
University facilities are not pledged as collateral for the revenue bonds. Instead, the bonds are supported by a pledge of monies in the Higher Education Bond Service Fund established in the custody of the Treasurer of State of Ohio. If sufficient monies are not available from this fund, a pledge exists to assess a special student fee uniformly applicable to students in state-assisted institutions of higher education throughout the State. Outstanding debt issued by OPFC is not included on the University’s Statement of Net Position. In addition, the appropriations by the General Assembly to the Ohio Department of Higher Education for payment of debt service are not reflected as appropriation revenue received by the University, and the related debt service payments are not recorded in the University’s accounts. Note 3 – Cash and Cash Equivalents For financial statement presentation purposes, cash in banks has been combined with the University’s cash equivalents and temporary investments in repurchase agreements and certificates of deposit. The aggregate cost of repurchase agreements, which approximates fair value, included in cash and cash equivalents is $357,738 and $2,083,878 at June 30, 2016 and 2015, respectively. Depository funds held in the name of the University are secured by a pool of securities with a value of at least 105% of the total value of monies on deposit at the depository bank. All collateral, both specific and pooled, is held by the Federal Reserve Bank or by a designated trustee as agent for the public depositories used by the University. Cash and Cash Equivalents at June 30, 2016 and June 30, 2015 consist of the following:
2016 2015Carrying Amount 15,893,972$ 11,472,553$
FDIC Insured 5,769,116$ 5,817,914$ Uninsured but collateralized by pools of securities
pledged by the depository banks 4,927,221 3,883,274 Uninsured but assets held in name of YSU not
pledged as collateral elsewhere 5,882,625 3,274,251 Bank Balance 16,578,962$ 12,975,439$
The difference in carrying amount and bank balance is caused by items in transit and outstanding checks. Deposits held in safekeeping by a bank, as trustee or escrow agent, included in cash totaled $3,746,878 at June 30, 2016 and $1,671,240 at June 30, 2015, which approximates market. These deposits, including interest on the investments, are retained in the trust for projects funded by bond proceeds and payment of principal and interest on outstanding indebtedness. The University’s Star Ohio Plus account deposits are federally insured and totaled $5,021,068 at June 30, 2016 and $5,008,195 at June 30, 2015.

YOUNGSTOWN STATE UNIVERSITY Notes to Financial Statements (cont.)
For the Years Ended June 30, 2016 and 2015
36
Credit risk for deposits is the risk that, in the event of a bank failure, the University’s deposits may not be returned to the University. At June 30, 2016 and June 30, 2015, all uncollateralized or uninsured deposits of the University are exposed to credit risk. The University’s investment policy and asset allocation guidelines facilitate the management and monitoring of credit risk. Note 4 – Investments The University’s investment policy authorizes the University to invest non-endowed and endowed University funds in compliance with provisions of the Ohio Revised Code including House Bill 524, Section 3345.05 of the Ohio Revised Code, and all other applicable laws and regulations. In accordance with the Policies of the Board of Trustees of the University, investment types are not specifically limited but shall be made with care, skill, prudence and diligence under the circumstances then prevailing that a prudent person acting in like capacity and familiar with such matters would use in the conduct of an enterprise of a like character and with like aims. Furthermore, investments shall be managed for the use and benefit of the University in a diversified portfolio that focuses, over time, on the preservation of capital, minimization of cost and risk, and maintenance of required levels of liquidity in the overall portfolio to meet cash flow requirements. The University utilizes an investment advisor and investment manager for non-endowment funds. The University’s investments measured and reported at fair value are classified according to the following hierarchy:
Level 1 – Investments reflect prices quoted in active markets. Level 2 – Investments reflect prices that are based on a similar observable asset either directly or indirectly, which may include inputs in markets that are not considered to be active. Level 3 – Investments reflect prices based upon unobservable sources.
The categorization of investments within the hierarchy is based upon the pricing transparency of the instrument and should not be perceived as the particular investment’s risk. Assets classified in Level 1 of the fair value hierarchy are valued directly from a primary external pricing vendor.

YOUNGSTOWN STATE UNIVERSITY Notes to Financial Statements (cont.)
For the Years Ended June 30, 2016 and 2015
37
As of June 30, 2016, the University had the following investments measured at fair value:
Level 1 Level 2 Level 3 TotalU.S. Government Obligations 7,557,213$ -$ -$ 7,557,213$ Corporate Bonds 9,921,463 - - 9,921,463 Foreign Bonds 115,597 - - 115,597 U.S. Government Bonds 1,828,911 - - 1,828,911 Bond Mutual Funds 9,813,823 - - 9,813,823 Preferred and Common Stock 6,255,968 - - 6,255,968 Equity Mutual Funds 27,829,070 - - 27,829,070 Totals 63,322,045$ -$ -$ 63,322,045$
Fair Value Measurement
As of June 30, 2015, the University had the following investments measured at fair value:
Level 1 Level 2 Level 3 TotalU.S. Government Obligations 7,427,958$ -$ -$ 7,427,958$ Corporate Bonds 9,845,758 - - 9,845,758 Foreign Bonds 100,406 - - 100,406 U.S. Government Bonds 1,618,225 - - 1,618,225 Bond Mutual Funds 11,211,109 - - 11,211,109 Preferred and Common Stock 5,987,195 - - 5,987,195 Equity Mutual Funds 26,867,528 - - 26,867,528 Totals 63,058,179$ -$ -$ 63,058,179$
Fair Value Measurement
As of June 30, 2016, the University had the following investments and maturities using the segmented time distribution method:
Investment Type Fair Value Less than 1 1-5 6-10 More than 10U.S. Government Obligations 7,557,213$ -$ 6,751,994$ 805,219$ -$ Corporate Bonds 9,921,463 623,316 8,065,572 1,222,429 10,146 Foreign Bonds 115,597 100,154 - 15,443 - U.S. Government Bonds 1,828,911 117 719,061 399,044 710,689 Bond Mutual Funds 9,813,823 9,813,823 - - - Preferred and Common Stock 6,255,968 6,255,968 - - - Equity Mutual Funds 27,829,070 27,829,070 - - - Totals 63,322,045$ 44,622,448$ 15,536,627$ 2,442,135$ 720,835$
Investment maturities (in years)
All callable stocks were assumed to mature in less than one year.

YOUNGSTOWN STATE UNIVERSITY Notes to Financial Statements (cont.)
For the Years Ended June 30, 2016 and 2015
38
As of June 30, 2015, the University had the following investments and maturities using the segmented time distribution method:
Investment Type Fair Value Less than 1 1-5 6-10 More than 10U.S. Government Obligations 7,427,958$ 1,531,665$ 5,568,903$ 323,820$ 3,570$ Corporate Bonds 9,845,758 1,170,620 6,338,186 2,296,806 40,146 Foreign Bonds 100,406 - 100,406 - - U.S. Government Bonds 1,618,225 1,037 436,488 636,761 543,939 Bond Mutual Funds 11,211,109 11,211,109 - - - Preferred and Common Stock 5,987,195 5,987,195 - - - Equity Mutual Funds 26,867,528 26,867,528 - - - Totals 63,058,179$ 46,769,154$ 12,443,983$ 3,257,387$ 587,655$
Investment maturities (in years)
All callable stocks were assumed to mature in less than one year. As of June 30, 2016, investments had the following quality credit ratings:
Investment Type Fair Value Aaa Aa A Baa UnratedCorporate Bonds 9,921,463$ 2,376,851$ 1,162,736$ 2,298,069$ 2,842,439$ 1,241,368$ Foreign Bonds 115,597 - 115,597 - - - U.S. Government Bonds 1,828,911 1,196,000 632,911 - - - Bond Mutual Funds 9,813,823$ 6,144,635 1,725,631 753,301 872,147 318,109 Totals 21,679,794$ 9,717,486$ 3,636,875$ 3,051,370$ 3,714,586$ 1,559,477$
As of June 30, 2015, investments had the following quality credit ratings:
Investment Type Fair Value Aaa Aa A Baa UnratedCorporate Bonds 9,845,758$ 2,377,138$ 1,054,576$ 2,600,761$ 3,158,288$ 654,995$ Foreign Bonds 100,406 - 100,406 - - - U.S. Government Bonds 1,618,225 1,093,212 525,013 - - - Bond Mutual Funds 11,211,109$ 7,484,001 1,444,326 992,086 960,770 329,926 Totals 22,775,498$ 10,954,351$ 3,124,321$ 3,592,847$ 4,119,058$ 984,921$
Interest Rate Risk – Interest rate risk is the risk that changes in interest rates will adversely affect the fair value of an investment. The University’s investment policy and asset allocation guidelines facilitate the management and monitoring of its exposure to fair value losses arising from increasing interest rates. Credit Risk – Credit risk is the risk that an issuer or other counterparty to an investment will not fulfill its obligations. As of June 30, 2016, $5,444,128 or 9% of the University’s portfolio was held in an intermediate bond fund and $1,271,495 or 2% was held in a short term bond fund. As of June 30, 2015, $5,140,428 or 8% of the University’s portfolio was held in an intermediate term bond fund and $3,214,825 or 5% was held in a short-term bond fund. The University’s investment policy and asset allocation guidelines contain provisions to manage credit risk.

YOUNGSTOWN STATE UNIVERSITY Notes to Financial Statements (cont.)
For the Years Ended June 30, 2016 and 2015
39
Custodial Credit Risk – Custodial credit risk is the risk that in the event of the failure of the counterparty to a transaction, the University will not be able to recover the value of investments or collateral securities that are in the possession of an outside party. Investments that are both unregistered and uninsured are exposed to custodial credit risk if investments are held by the counterparty, or are held by the counterparty’s trust department or agent but not in the name of the University. At June 30, 2016 and 2015, the University had no exposure to custodial credit risk. The University does not address custodial credit risk in its investment policy and asset allocation guidelines. Foreign Currency Risk – Foreign currency risk is the risk that changes in exchange rates will adversely affect the fair value of an investment or deposit. At June 30, 2016 and 2015, the University had no material exposure to foreign currency risk. The University does not address foreign currency risk in its investment policy and asset allocation guidelines. Note 5 – Accounts and Loans Receivable Accounts and loans receivable at June 30, 2016 and June 30, 2015 consist of the following:
2016 2015Accounts receivable
Student accounts 9,938,609$ 10,641,281$ Grants and contracts 2,135,367 1,304,892 State appropriations 1,853,200 1,402,082 Other receivables 4,226,260 3,133,608
Total Accounts receivable 18,153,436 16,481,863 Less: Allowance for doubtful accounts 5,120,259 5,746,411
Accounts receivable, net 13,033,177$ 10,735,452$
Loans receivable - student notes 2,520,738$ 2,830,696$ Less: Allowance for doubtful accounts 642,307 654,365 Loans receivable, net 1,878,431 2,176,331 Less: current portion 422,496 404,434 Loans receivable, noncurrent portion 1,455,935$ 1,771,897$
Note 6 – Pledges Receivable Unconditional promises to give to the University recorded as pledges receivable at June 30, 2016 and June 30, 2015 were as follows:
2016 2015Pledges receivable 1,853,249$ 2,903,613$ Less: Allowance for doubtful accounts 85,183 127,797
Present value discount 46,824 108,484 Pledges receivable, net 1,721,242 2,667,332 Less: current portion 893,284 1,140,910 Pledges receivable, noncurrent portion 827,958$ 1,526,422$

YOUNGSTOWN STATE UNIVERSITY Notes to Financial Statements (cont.)
For the Years Ended June 30, 2016 and 2015
40
Pledges have been discounted to net present value using June 30, 2016 and June 30, 2015 U.S. Treasury Note rates of 1.12% (5-year) and 1.379 (7-year) in fiscal year 2016 and 1.62% (5-year) and 2.12% (7-year) in fiscal year 2015. Note 7 – Capital Assets Capital assets activity for the year ended June 30, 2016 was as follows:
Beginning EndingBalance Additions Reductions Transfers Balance
Nondepreciable assets:Land 16,093,678$ 52,659$ -$ 3,063$ 16,149,400$ Construction in progress 6,129,774 17,211,492 - (4,717,842) 18,623,424 Historical treasures 635,466 200,000 - - 835,466
Depreciable assets:Buildings 280,566,952 14,867 577,982 - 280,003,837 Improvements to buildings 50,692,906 5,955,294 67,723 2,993,870 59,574,347 Improvements other than buildings 35,015,971 2,485,094 1,000,000 883,937 37,385,002 Moveable equipment and furniture 33,042,335 925,200 1,130,697 836,972 33,673,810 Vehicles 1,222,268 181,356 66,992 - 1,336,632
Total cost 423,399,350 27,025,962 2,843,394 - 447,581,918
Less accumulated depreciation:Buildings 164,316,559 4,937,846 379,631 - 168,874,774 Improvements to buildings 13,383,106 2,048,751 27,617 - 15,404,240 Improvements other than buildings 18,093,828 1,860,955 1,000,000 - 18,954,783 Moveable equipment and furniture 27,830,142 2,125,804 1,115,671 - 28,840,275 Vehicles 1,022,940 85,653 66,992 - 1,041,601
Total accumulated depreciation 224,646,575 11,059,009 2,589,911 - 233,115,673 Capital assets, net 198,752,775$ 15,966,953$ 253,483$ -$ 214,466,245$
Projects completed and transferred from construction in progress during fiscal year 2016 included the Melnick Hall renovation, restroom renovations, and roof and elevator renovations to several building across campus.

YOUNGSTOWN STATE UNIVERSITY Notes to Financial Statements (cont.)
For the Years Ended June 30, 2016 and 2015
41
Capital assets activity for the year ended June 30, 2015 was as follows:
Beginning EndingBalance Additions Reductions Transfers Balance
Nondepreciable assets:Land 15,692,070$ 378,637$ -$ 22,971$ 16,093,678$ Construction in progress 6,577,088 4,264,650 256,749 (4,455,215) 6,129,774 Historical treasures 635,466 - - - 635,466
Depreciable assets:Buildings 280,101,358 228,771 1,218,615 1,455,438 280,566,952 Improvements to buildings 45,718,508 2,983,875 - 1,990,523 50,692,906 Improvements other than buildings 34,559,486 877,367 1,000,000 579,118 35,015,971 Moveable equipment and furniture 32,591,938 825,309 782,077 407,165 33,042,335 Vehicles 1,221,666 56,234 55,632 - 1,222,268
Total cost 417,097,580 9,614,843 3,313,073 - 423,399,350
Less accumulated depreciation:Buildings 160,049,260 5,215,513 948,214 - 164,316,559 Improvements to buildings 11,653,078 1,730,028 - - 13,383,106 Improvements other than buildings 17,289,190 1,804,638 1,000,000 - 18,093,828 Moveable equipment and furniture 25,955,025 2,616,565 741,448 - 27,830,142 Vehicles 990,145 88,427 55,632 - 1,022,940
Total accumulated depreciation 215,936,698 11,455,171 2,745,294 - 224,646,575 Capital assets, net 201,160,882$ (1,840,328)$ 567,779$ -$ 198,752,775$
Projects completed and transferred from construction in progress during fiscal year 2015 included the Veterans Resource Center as well as roof and elevator renovations to several buildings across campus. Note 8 – Payroll and Other Liabilities Payroll and other liabilities at June 30, 2016 and 2015 consist of the following:
2016 2015Payroll liabilities:
Accrued compensation 5,058,132$ 5,004,530$ Accrued benefits 105,791 166,851 Accrued health care benefits and insurance payable 1,030,270 1,234,509 Retirement system contribution payable 847,726 1,137,726
Totals 7,041,919$ 7,543,616$
Other liabilities:Deposits held in custody 476,606$ 453,194$ Interest payable 642,702 169,392 Other liabilities 302,665 187,587
Totals 1,421,973$ 810,173$

YOUNGSTOWN STATE UNIVERSITY Notes to Financial Statements (cont.)
For the Years Ended June 30, 2016 and 2015
42
Encumbrances representing estimated amounts of expenses ultimately to result, if unperformed contracts in process at June 30, 2016 are completed, totaled $9.2 million compared to $8 million at June 30, 2015. These amounts do not constitute expenses incurred or liabilities. Note 9 – Bonds In June 2011, the Board of Trustees of Youngstown State University authorized through a Board resolution the issuance of General Receipts Bonds, Series 2011 in the amount of $18,660,000. The $19,006,093 in bond proceeds were received in July 2011. The Series 2011 Bonds were utilized to pay costs associated with acquiring the University Courtyard Apartments, any necessary related improvements thereto and to pay costs of issuing the Series 2011 Bonds. Details of the bonds payable for the General Receipts Bonds, Series 2011 as of June 30, 2016 follow:
Maturity OriginalBond Component Rate Yield Through PrincipalSerial Bond 4.00% 2.45% 2017 595,000$ Serial Bond 5.00% 2.90% 2018 625,000 Serial Bond 5.00% 3.28% 2019 655,000 Serial Bond 5.00% 3.58% 2020 690,000 Serial Bond 3.50% 3.82% 2021 720,000 Serial Bond 3.75% 3.98% 2022 450,000 Serial Bond 5.00% 3.98% 2022 300,000 Serial Bond 4.00% 4.14% 2023 780,000 Term Bond 5.00% 4.55% 2026 2,570,000 Term Bond 5.00% 5.08% 2034 9,085,000
Total 16,470,000$
As part of the American Recovery and Reinvestment Act of 2009, states and local governments are permitted to issue two types of taxable obligations, referred to as Build America Bonds (BABs). The BABs include federal subsidies to offset a portion of interest costs as an alternative to issuing traditional tax-exempt obligations. In March 2010, the University issued $25,335,000 of General Receipts Bonds (Taxable Build America Bonds), Series 2010 to provide funding to pay costs associated with facilities planning for the University’s College of Science, Technology, Engineering and Mathematics (STEM), convert the old college of business building for use as a laboratory, office and classroom space, renovate Kilcawley Center, reconfigure and replace campus parking facilities, construct the WATTS Center, relocate certain existing outdoor athletic facilities and pay the costs of issuance of the Series 2010 Bonds. In September 2011, approximately $9.9 million was re-allocated from the Kilcawley Center project to Academic building renovation projects.

YOUNGSTOWN STATE UNIVERSITY Notes to Financial Statements (cont.)
For the Years Ended June 30, 2016 and 2015
43
The University designated the Series 2010 Bonds both as Build America Bonds and as Qualified Bonds and intends to apply for Credit Payments pursuant only to the extent that the Series 2010 Bonds remain Qualified Bonds, which requires the University to comply with certain covenants and to establish certain facts and expectations with respect to the Series 2010 Bonds, the use and investment of proceeds thereof and the use of property financed thereby. Details of the bonds payable for the General Receipts Bonds (Taxable Build America Bonds), Series 2010 as of June 30, 2016 follow:
Maturity OriginalBond Component Rate/Yield * Through PrincipalSerial Bond 4.192% 2017 525,000$ Serial Bond 4.542% 2018 1,065,000 Serial Bond 4.959% 2019 1,110,000 Serial Bond 5.109% 2020 1,145,000 Serial Bond 5.209% 2021 1,185,000 Serial Bond 5.359% 2022 1,225,000 Serial Bond 5.509% 2023 1,265,000 Term Bond 6.109% 2026 4,085,000 Term Bond 6.549% 2031 8,030,000 Term Bond 6.579% 2034 5,700,000
Total 25,335,000$ * Does not reflect impact of federal subsidies
In March 2009, the University issued $31,255,000 of General Receipts Bonds, Series 2009 to acquire, construct and equip the new Williamson College of Business Administration building, renovate and replace portions of the existing Wick Pollock Inn, refund the remaining General Receipts Bonds, Series 1997 and Series 1998, refund the General Receipts Bond Anticipation Notes, Series 2008 (BAN), and pay a portion of the costs of issuance of the bonds. Details of the bonds payable for the General Receipts Bonds, Series 2009 as of June 30, 2016 follow:
Maturity OriginalBond Component Rate Yield Through PrincipalSerial Bond 4.000% 4.000% 2017 1,335,000$ Serial Bond 4.125% 4.200% 2018 860,000 Serial Bond 4.375% 4.400% 2019 885,000 Serial Bond 4.500% 4.600% 2020 925,000 Serial Bond 4.625% 4.750% 2021 965,000 Serial Bond 4.750% 4.900% 2022 1,010,000 Term Bond 5.000% 5.080% 2024 2,170,000 Serial Bond 5.125% 5.180% 2025 1,170,000 Term Bond 5.250% 5.340% 2030 6,815,000 Term Bond 5.500% 5.540% 2034 6,875,000
Total 23,010,000$

YOUNGSTOWN STATE UNIVERSITY Notes to Financial Statements (cont.)
For the Years Ended June 30, 2016 and 2015
44
The indebtedness created through all issues of the General Receipts Bonds is bound by the Amended and Restated Trust Indenture dated as of March 1, 2009. The Series 2010 Bonds and Series 2011 Bonds are also bound by the First Supplemental Trust Indenture dated as of February 2010; and in addition, the Series 2011 Bonds are also bound by the Second Supplemental Trust Indebtedness dated as of July 1, 2011. The University has complied with all covenant requirements. The debt is secured by a pledge of all University general receipts, excluding state appropriations and receipts previously pledged or otherwise restricted. Payment of bond principal and interest on the Bond Series 2009 is guaranteed under a municipal bond insurance policy. Maturities of all bonds payable and debt service for fiscal years subsequent to June 30, 2016 follow (also see Note 12):
Fiscal Year Principal Interest Total2017 2,455,000$ 3,441,348$ 5,896,348$ 2018 2,550,000 3,334,196 5,884,196 2019 2,650,000 3,213,390 5,863,390 2020 2,760,000 3,082,822 5,842,822 2021 2,870,000 2,949,731 5,819,731 2022-2026 16,255,000 12,409,014 28,664,014 2027-2031 20,445,000 7,327,539 27,772,539 2032-2034 14,830,000 1,314,405 16,144,405
Totals 64,815,000$ 37,072,445$ 101,887,445$
NOTE: Expected future federal subsidies for the BABs is $5,761,414
General Receipts Bonds
Federal subsidies received by the University were $499,551 in fiscal year 2016 and $496,871 in fiscal year 2015. These are reported as non operating federal grant revenue. Interest expense on indebtedness was $3,939,548 in fiscal year 2016 and $3,454,055 in fiscal year 2015. On construction-related debt, net interest cost of $64,656 was capitalized in fiscal year 2016, and $149,795 in fiscal year 2015. In September 2016, the Board of Trustees of Youngstown State University authorized through a Board resolution the issuance of General Receipts Bonds, Series 2016 in an amount not to exceed $28,500,000 to advance refund all or a portion of the prior bonds at an anticipated cost not to exceed $23,000,000 and to acquire, construct, equip, furnish, reconstruct, alter, enlarge, remodel, renovate, rehabilitate or improve certain University facilities including but not limited to a bookstore at an anticipated cost not to exceed $5,500,000.

YOUNGSTOWN STATE UNIVERSITY Notes to Financial Statements (cont.)
For the Years Ended June 30, 2016 and 2015
45
Note 10 – Notes Payable During fiscal year 2016, the University entered into a 14 year performance contract with Johnson Controls for campus energy savings measures. The contract amount of $16 million includes an assured performance providing for an annual measured cost savings of not less than $2 million per year and was financed through PNC Equipment Finance over 14 years at an interest rate of 3.366% and requires annual installment payments. Title to the assets vests in the University. Security of the debt is limited to the revenues appropriated for such purpose.
Fiscal Year Principal Interest Total2017 -$ 538,560$ 538,560$ 2018 616,894 538,560 1,155,454 2019 692,464 517,795 1,210,259 2020 773,026 494,487 1,267,513 2021 858,856 468,467 1,327,323 2022 950,241 439,558 1,389,799 2023 1,078,481 407,573 1,486,054 2024 1,202,940 371,271 1,574,211 2025 1,324,612 330,780 1,655,392 2026 1,438,534 286,194 1,724,728 2027 1,549,581 237,773 1,787,354 2028 1,712,798 185,614 1,898,412 2029 1,869,325 127,961 1,997,286 2030 1,932,248 65,039 1,997,287
Totals 16,000,000$ 5,009,632$ 21,009,632$
During fiscal year 2006, the University entered into a ten year performance contract with Johnson Controls, which includes an assured performance providing for an annual measured cost savings of $1,296,298. The contract amount of $9,796,000 was financed with Chase Equipment Leasing, Inc. over 10 years, at an interest rate of 3.53%, and required equal annual installment payments. The final payment of $1,179,666 was due December 23, 2015 and included $40,222 in interest. Title to the assets vests in the University. The debt is secured by a pledge of all University general receipts, excluding State appropriations and receipts previously pledged or otherwise restricted. The University has complied with all covenant requirements. Note 11 – Operating Lease The University had as an operating lease for the usage of mailroom equipment which ended April 30, 2016 and bears interest at 9.904%. Lease payments totaled $18,347 in fiscal year 2016. Lease payments totaled $198,877 in fiscal year 2015 and also included payments on a vehicle, and classroom and office space leases.

YOUNGSTOWN STATE UNIVERSITY Notes to Financial Statements (cont.)
For the Years Ended June 30, 2016 and 2015
46
Note 12 – Long-Term Liabilities Long-term liability activity (also see Notes 9, 10 and 13) for the year ended June 30, 2016 was as follows:
Beginning Ending CurrentBalance Additions Reductions Balance Portion
Bonds payableGeneral receipts bonds principal 66,680,000$ -$ 1,865,000$ 64,815,000$ 2,455,000$ Unamoritized premium/discount (21,004) - 37,580 (58,584) -
Bonds payable, net 66,658,996 - 1,902,580 64,756,416 2,455,000
Note payable 1,139,444 16,000,000 1,139,444 16,000,000 - Compensated absences 9,843,762 827,332 9,016,430 604,117 Refundable advance 2,581,299 19,677 73,180 2,527,796
Net pension liabilityOPERS 34,173,082 18,486,379 6,142,722 46,516,739 - STRS 93,512,061 21,206,222 14,889,329 99,828,954 -
Net pension liability 127,685,143 39,692,601 21,032,051 146,345,693 - Total long-term liabilities 207,908,644$ 55,712,278$ 24,974,587$ 238,646,335$ 3,059,117$
Long-term liability activity (also see Notes 9, 10 and 13) for the year ended June 30, 2015 was as follows:
Beginning Ending CurrentBalance Additions Reductions Balance Portion
Bonds payableGeneral receipts bonds principal 68,470,000$ -$ 1,790,000$ 66,680,000$ 1,865,000$ Unamoritized premium/discount 28,512 - 49,516 (21,004) -
Bonds payable, net 68,498,512 - 1,839,516 66,658,996 1,865,000
Note payable 2,240,037 - 1,100,593 1,139,444 1,139,444 Compensated absences 9,896,456 230,000 282,694 9,843,762 736,034 Refundable advance 2,628,561 9,098 56,360 2,581,299 -
Net pension liabilityOPERS - 34,173,082 34,173,082 - STRS - 111,390,955 17,878,894 93,512,061 -
Net pension liability - 145,564,037 17,878,894 127,685,143 - Total long-term liabilities 83,263,566$ 145,803,135$ 21,158,057$ 207,908,644$ 3,740,478$
Note 13 – Defined Benefit Pension Plans The net pension liability reported on the Statement of Net Position represents a liability to employees for pensions. Pensions are a component of exchange transactions – between an employer and its employees – of salaries and benefits for employee services. Pensions are provided to an employee – on a deferred-payment basis – as part of the total compensation package offered by an employer for employee services each financial period. The obligation to sacrifice

YOUNGSTOWN STATE UNIVERSITY Notes to Financial Statements (cont.)
For the Years Ended June 30, 2016 and 2015
47
resources for pensions is a present obligation because it was created as a result of employment exchanges that already have occurred. The net position liability represents the University’s proportionate share of each pension plan’s collective actuarial present value of projected benefit payments attributable to past periods of service, net of each pension plan’s fiduciary net position. The net pension liability calculation is dependent on critical long-term variables, including estimated average life expectancies, earnings on investments, cost of living adjustments and others. While these estimates use the best information available, unknowable future events require adjusting this estimate annually. Ohio Revised Code limits the University’s obligation for this liability to annually required payments. The University cannot control benefit terms or the manner in which pensions are financed; however, the University does receive the benefit of employees’ services in exchange for compensation including pension. GASBs 68 and 71 assumes the liability is solely the obligation of the employer, because (1) the employer benefits from employee services; and (2) State statute requires all funding to come from the employer. All contributions to date have come solely from employers (which also includes costs paid in the form of withholdings from employees). State statute requires the pension plans to amortize unfunded liabilities within 30 years. If the amortization period exceeds 30 years, each pension plan’s board must propose corrective action to the State legislature. Any resulting legislative change to benefits or funding could significantly affect the net pension liability. Resulting adjustments to the net pension liability would be effective when the changes are legally enforceable. The proportionate share of each pension plan’s unfunded benefits is presented as a long-term net pension liability on the accrual basis of accounting. Any liability for the contractually-required pension contribution outstanding at the end of the year is included in payroll liabilities. Plan Descriptions University faculty are provided with pensions through STRS Ohio. Substantially all other University employees are provided with pensions through OPERS. Both OPERS and STRS Ohio are statewide cost-sharing multiple employer defined benefit pension plans. Authority to establish and amend benefits for OPERS and STRS Ohio is authorized by Chapters 145 and 3307, respectively, of the Ohio Revised Code. Both OPERS and STRS Ohio issue publicly available financial reports. The OPERS report can be obtained at https://www.opers.org/financial/reports.shtml. The STRS Ohio report can be obtained at https://www.strsoh.org/publications/annual-reports.html. OPERS and STRS Ohio each offer three separate retirement plans: a defined benefit plan, a defined contribution plan, and a combined plan. OPERS and STRS Ohio Defined Benefit Plans pay service retirement benefits using a fixed formula based on age, years of service credit and final average salary (FAS). In addition to service retirement, participants are eligible for disability and survivor benefits.

YOUNGSTOWN STATE UNIVERSITY Notes to Financial Statements (cont.)
For the Years Ended June 30, 2016 and 2015
48
OPERS Member-Directed Plan and STRS Ohio Defined Contribution Plan are optional alternative retirement plans available to new members. Participants allocate both member and a portion of the employer contributions in an investment account. Portions of the employer contributions are allocated to the defined benefit unfunded liabilities. Benefits are based on the member’s account value. OPERS and STRS Ohio Combined Plans offer features of both a defined benefit plan and a member-directed or defined contribution plan. In the combined plans, employee contributions are invested in self-directed investments, and the employer contribution is used to fund a reduced defined benefit along with disability and survivor benefits. Benefits Provided OPERS and STRS Ohio provide retirement, disability, annual cost-of-living adjustments, and survivor benefits for plan members and beneficiaries. The benefit provisions stated in the following paragraphs are current provisions and apply to active plan participants. Vested, terminated employees who are entitled to benefits but are not receiving them yet are bound by the provisions in effect at the time they last terminated their public service. OPERS Benefits Under OPERS, retirement benefits are specific to each pension plan and members must meet the eligibility requirements based on their age and years of service credit within the plan. Retirement eligibility also varies by division and transition group. Members who were eligible to retire under law in effect prior to SB 343 before January 7, 2013 are included in transition Groups A and B. Group C includes those members who are not in either of the other groups and members who were hired on or after January 7, 2013. State and Local members in transition groups A and B are eligible for retirement benefits at age 55 with 25 or more years of service credit or at age 60 with 5 years of service credit. State and Local members in transition Group C are eligible for retirement at age 57 with 25 years of service credit or at age 62 with 5 years of service credit. Under the Traditional Plan, for Groups A and B, the annual benefit is based on 2.2% of FAS multiplied by the actual years of service credit for the first 30 years of service credit and 2.5% for years of service credit in excess of 30 years. For Group C the annual benefit applies a factor of 2.2% for the first 35 years and a factor of 2.5% for the years of service credit in excess of 35. FAS represents the average of the three highest years of earnings over a member’s career for Groups A and B. Group C is based on the average of the five highest years of earnings over a member’s career. Under the Combined Plan, the benefit formula for the defined benefit component of the plan for State and Local members in transition Groups A and B applies a factor of 1.0% to the member’s FAS for the first 30 years of service credit. A factor of 1.25% is applied to years of service credit in excess of 30. The benefit formula for transition Group C applies a factor of 1.0% to the member’s FAS and the first 35 years of service credit and a factor of 1.25% is applied to years in excess of 35. Persons retiring before age 65 with less than 30 years of service credit receive a

YOUNGSTOWN STATE UNIVERSITY Notes to Financial Statements (cont.)
For the Years Ended June 30, 2016 and 2015
49
percentage reduction in benefit. The defined contribution portion of the benefit is based on accumulated member contributions plus or minus any investment gains or losses on those contributions. Member-Directed participants must have attained the age of 55, have money on deposit in the Defined Contribution Plan and have terminated public service to apply for retirement benefits. The amount available for defined contribution benefits in the Member-Directed Plan consists of the members’ contributions, vested employer contributions and investment gains or losses resulting from the members’ investment selections. At retirement, members may select one of several distribution options for payment of the vested balance of their individual OPERS accounts. The OPERS law enforcement program consists of two separate divisions: Law Enforcement and Public Safety. Both divisions of members are eligible for special retirement options under the Traditional Pension Plan and are not eligible to participate in the Member-Directed or Combined plans. Public Safety members in transition Groups A and B may file an application for full retirement benefits at age 48 or older with 25 or more years of service credit or 52 or older with 15 or more years of service credit. Public Safety members in transition Group C are eligible for benefits at age 52 or older with 25 years of service credit or at age 56 or older with 15 years of service credit. Those members classified as Law Enforcement officers are eligible for full retirement at age 52 or older with 15 or more years of service credit for Group A. Law Enforcement Group B is eligible at age 48 or older with 25 years of service credit or at age 52 or older with 15 years of service credit. Law Enforcement Group C is eligible at age 48 or older with 25 years of service credit or at age 56 with 15 years of service credit. Annual benefits under both divisions are calculated by multiplying 2.5% of FAS by the actual years of service credit for the first 25 years of service credit, and 2.1% of FAS for each year of service credit over 25 years. These options also permit early retirement under qualifying circumstances as early as age 48 with a reduced benefit. OPERS administers two disability plans for participants in the Traditional Pension and Combined plans. Members in the plan as of July 29, 1992, could elect coverage under either the original plan or the revised plan. All members who entered the System after July 29, 1992, are automatically covered under the revised plan. Under the original plan, a member who becomes disabled before age 60 and has completed 60 contributing months is eligible for a disability benefit. Benefits are funded by the employee and employer contributions and terminate if the member is able to return to work. The revised plan differs in that a member who becomes disabled at any age with 60 contributing months will be eligible for disability benefits until a determined age. The benefit is funded by reserves accumulated from employer contributions. Law Enforcement officers are immediately eligible for disability benefits if disabled by an on-duty illness or injury. Members participating in the Member-Directed Plan are not eligible for disability benefits. Dependents of deceased members who participated in either the Traditional Pension Plan or the Combined Plan may qualify for survivor benefits if the deceased employee had at least one and a half years of service credit with the plan, and at least one quarter year of credit within the two and one-half years prior to the date of death. Law Enforcement and Public Safety personnel are eligible for survivor benefits immediately upon employment.

YOUNGSTOWN STATE UNIVERSITY Notes to Financial Statements (cont.)
For the Years Ended June 30, 2016 and 2015
50
Once a benefit recipient retiring under the Traditional Pension Plan has received benefits for 12 months, an annual 3% cost-of-living adjustment is provided on the member’s base benefit. Members retiring under the Combined Plan receive a 3% cost-of-living adjustment on the defined benefit portion of their benefit. STRS Ohio Benefits Under the Defined Benefit Plan, on or before July 1, 2015, benefits are based on 2.2% of FAS for the three highest years of earnings, multiplied by years of total Ohio service credit. The percentages increase if the member has 35 or more years of contributing service credit. Effective Aug. 1, 2015, benefits are based on an annual amount equal to 2.2% of FAS for the five highest years of earnings, multiplied by all years of service credit. Members are eligible to retire at age 60 with 5 years of qualifying service credit, or at age 55 with 25 years of service credit, or 30 years of service credit regardless of age. Age and service requirements for retirement increased effective Aug. 1, 2015, and will continue to increase periodically until they reach age 60 with 35 years of service credit or age 65 and 5 years of service credit on Aug. 1, 2026. Under the Combined Plan, member contributions are allocated among investment choices by the member and employer contributions are used to fund the defined benefit payment at a reduced level from the regular Defined Benefit Plan. Benefits are based on the balance in the member’s defined contribution account plus an annual amount equal to 1% of FAS for the three highest paid years multiplied by years of total Ohio service credit. Effective Aug. 1, 2015, FAS will be average of the member’s five highest salary years. The defined benefit portion of the Combined Plan payment is payable to a member on or after age 60 with 5 years of service credit. The defined contribution portion of the Combined Plan may be taken as a lump sum payment or converted to a lifetime monthly annuity at age 50. The Defined Contribution Plan allows members to place all of their member contributions plus a portion of the employer contributions into an investment account. Investment allocation decisions are determined by the member. A member is eligible to receive a retirement benefit at age 50 and termination of employment. The member may elect to receive a lifetime monthly annuity or a lump sum withdrawal. A Defined Benefit Plan or Combined Plan member with 5 or more years of credited service who is determined to be disabled (illness or injury preventing individual’s ability to perform regular job duties for at least 12 months) may qualify for a disability benefit. Eligible survivors of members who die before service retirement may qualify for monthly benefits. New members on or after July 1, 2013 must have at least 10 years of qualifying service credit to apply for disability benefits. Disability benefits are determined in the same manner as retirement benefits. Members in the Defined Contribution Plan who become disabled are entitled only to their account balance. If a member of the Defined Contribution Plan dies before retirement benefits begin, the member’s designated beneficiary is entitled to receive the member’s account balance.

YOUNGSTOWN STATE UNIVERSITY Notes to Financial Statements (cont.)
For the Years Ended June 30, 2016 and 2015
51
Under the Defined Benefit Plan, members will receive a 2% annual cost of living adjustment beginning on the fifth anniversary of retirement. Under the Combined Plan, a cost of living adjustment is not available on the service retirement benefit. For disability and survivor benefits, the basic benefit is increased each year by 2% of the original base benefit. Contributions Employer and member contribution rates are established by the OPERS Board and the STRS Ohio Board subject to limits per Chapter 145 and Chapter 3307 of the Ohio Revised Code, respectively. The employee contribution rates for the current and preceding two fiscal years follow:
Traditional ARP Traditional ARP Traditional ARP7/1/15-6/30/16 13.0% 13.0% 10.0% 10.0% 13.0% 13.0%7/1/14-6/30/15 12.0% 12.0% 10.0% 10.0% 13.0% 13.0%1/1/14-6/30/14 11.0% 11.0% 10.0% 10.0% 13.0% 13.0%7/1/13-12/31/13 11.0% 11.0% 10.0% 10.0% 12.6% 12.6%
Employee Contribution Rate
PeriodSTRS OPERS OPERSLE
The employer contribution rates for the current and preceding two fiscal years follow:
University contributions equal to the required contributions for the current and two preceding years follow:
STRS ARP OPERS ARP2016 4,841,012$ 312,415$ 658,094$ 4,653,438$ 34,885$ 599,387$ 305,815$ -$ 2015 4,996,652$ 318,784$ 668,878$ 4,765,188$ 35,380$ 607,807$ 295,408$ -$ 2014 5,249,937$ 306,628$ 670,222$ 4,887,943$ 41,718$ 716,792$ 272,422$ -$
Employer Contributions
Fiscal YearSTRS OPERS OPERSLE
ARPTraditional Traditional ARP Traditional ARP
STRS ARP OPERS ARP7/1/13-6/30/16 14.00% 4.50% 9.50% 14.00% 0.77% 13.23% 18.10% 18.10%
Employer Contribution Rate
PeriodSTRS OPERS OPERSLE
ARPTraditional Traditional ARP Traditional ARP

YOUNGSTOWN STATE UNIVERSITY Notes to Financial Statements (cont.)
For the Years Ended June 30, 2016 and 2015
52
Pension Liabilities, Pension Expense, and Deferred Outflows of Resources and Deferred Inflows of Resources Related to Pensions At June 30, 2016 and June 30, 2015, the University reported a liability for its proportional share of the net pension liability of OPERS/STRS. The net pension liability was measured as of December 31, 2015 and December 31, 2014 for the OPERS plan and June 30, 2015 and June 30, 2014 for the STRS plan. The total pension liability used to calculate the net pension liability was determined by an actuarial valuation as of those dates. The University’s proportion of the net pension liability was based on its contributions to the pension plan relative to the contributions of all participating reporting units.
Measurement PercentPlan Date 2016 2015 2016 2015 Change
OPERS December 31 46,516,739$ 34,173,082$ 0.269315% 0.284240% -0.014925%STRS July 1 99,828,954 93,512,061 0.361214% 0.384452% -0.023238%
146,345,693$ 127,685,143$
Net Pension Liability Proportionate Share
Total pension expense for the years ended June 30, 2016 and June 30, 2015, including employer contributions and accruals associated with recognition of net pension liabilities and related deferrals, is presented below. Pension expense is allocated to institutional functions on the Statement of Revenues, Expenses and Other Changes in Net Position.
Total TotalPlan Pension Expense Pension Expense
OPERS 6,942,880$ 4,603,326$ STRS 3,122,847 4,075,088 Total 10,065,727$ 8,678,414$
Fiscal year 2016 Fiscal year 2015
At June 30, 2016 and June 30, 2015, the University reported deferred outflows of resources and deferred inflows of resources related to pensions from the following sources:
Deferred Deferred Deferred DeferredOutflows of Inflows of Outflows of Inflows ofResources Resources Resources Resources
Differences between expected and actual experience 4,554,639$ 981,432$ 900,257$ 635,671$ Net difference between projected and actual
earnings on pension plan investments 13,840,716 7,179,589 1,835,891 17,300,086 Change in proportionate share of contributions 13,414 6,547,866 - - University contributions subsequent
to the measurement date 7,717,920 - 7,875,023 - Totals 26,126,689$ 14,708,887$ 10,611,171$ 17,935,757$
2016 2015

YOUNGSTOWN STATE UNIVERSITY Notes to Financial Statements (cont.)
For the Years Ended June 30, 2016 and 2015
53
Amounts reported as deferred outflows of resources related to pensions resulting from University contributions subsequent to the measurement date will be recognized as a reduction of the net pension liability in the University’s subsequent year’s financial statements. Other cumulative amounts reported as deferred outflows and deferred inflows of resources related to pensions will be recognized in pension expense as follows:
Year EndedJune 30 Amount
2017 (562,728)$ 2018 (331,328) 2019 417,114 2020 4,198,964 2021 (5,957)
Thereafter (16,184) Totals 3,699,881$
Actuarial Assumptions The total pension liability is based on the results of actuarial valuations and was determined using the following actuarial assumptions, which were applicable to 2016 and 2015 valuation dates.
OPERS STRSAcuarial cost method Individual entry age Entry age normalCost of living Pre 1/7/2013 retirees: 3% simple, Post 2% simple applied as follows: for
1/7/2013 retirees: 3% simple through members retiring before August 1,2018, then 2.8% simple 2013, 2% per year; for members
retiring August 1, 2013 or later, 2%COLA paid on fifth anniversary of retirement date
Salary increases, including inflation 4.25%-10.05% 12.25% at age 20 to 2.75% at age 70Inflation 3.75% 2.75%Investment rate of return 8% 7.75%, net of investment expenses,
including inflationExperience study date Period of 5 years ended December 2010 Period of 5 years ended July 1, 2012Mortality basis RP-2000 mortality table projected 20 RP-2000 Combined Mortality Table
years using Projection Scale AA (Projection 2022-Scale AA)
Discount rate The discount rate used to measure the total pension liability was 8.00% and 7.75% for OPERS and STRS, respectively. These discount rates were applicable to the 2015 and 2016 valuation dates. The projection of cash flows used to determine the discount rate assumed that employee contributions will be made at the current contribution rates and that employer contributions will be made at the contractually required rates for all plans. Based on those assumptions, each pension

YOUNGSTOWN STATE UNIVERSITY Notes to Financial Statements (cont.)
For the Years Ended June 30, 2016 and 2015
54
plan’s fiduciary net position was projected to be available to make all projected future benefit payments for current active and inactive employees. Therefore, the long-term expected rate of return on pension plan investments was applied to all periods of projected benefit payments to determine the total pension liability. The long term expected rate of return on OPERS defined benefit investment assets was determined using a building-block method in which best-estimate ranges of expected future real rates of return are developed for each major asset class. These ranges are combined to produce the long-term expected rate of return by weighting the expected future real rates of return by the target asset allocation percentage, adjusted for inflation. STRS Ohio utilizes investment consultants to determine the long-term expected rate of return by developing best estimates of expected future real rates of return for each major asset class. The target allocation and expected real rates of return for each major asset class are summarized as follows:
Long-Term Long-TermTarget Expected Real Target expected Real
Asset Class Allocation Rate of Return Asset Class Allocation Rate of ReturnFixed income 23.0% 2.31% Domestic equity 31.0% 8.00%Domestic equity 20.7% 5.84% International equity 26.0% 7.85%International equity 18.3% 7.40% Altermatives 14.0% 8.00%Real estate 10.0% 4.25% Fixed income 18.0% 3.75%Private equity 10.0% 9.25% Real estate 10.0% 6.75%Other 18.0% 4.59% Liquidity reserves 1.0% 3.00%Totals 100.0% Totals 100.0%
OPERS STRS Ohio

YOUNGSTOWN STATE UNIVERSITY Notes to Financial Statements (cont.)
For the Years Ended June 30, 2016 and 2015
55
Sensitivity of the net pension liability to changes in the discount rate The following presents the net pension liability of the University calculated using the discount rate below, as well as what the University’s net pension liability would be if it were calculated using a discount rate that is 1% lower and 1% higher than the current rate.
PlanOPERS 7.00% 68,937$ 8.00% 46,517$ 9.00% 23,070$ STRS 6.75% 138,670 7.75% 99,829 8.75% 66,983
207,607$ 146,346$ 90,053$
PlanOPERS 7.00% 63,084$ 8.00% 34,173$ 9.00% 9,772$ STRS 6.75% 133,872 7.75% 93,512 8.75% 59,381
196,956$ 127,685$ 69,153$
1% Decrease Current Discount Rate 1% Increase
1% Decrease Current Discount Rate 1% Increase
June 30, 2016 ($ in thousands)
June 30, 2015 ($ in thousands)
Pension plan fiduciary net position Detailed information about OPERS and STRS Ohio fiduciary net position is available in the separately issued financial reports. Payable to the Pension Plan The University reported a payable of $749,991 and $984,705 for the outstanding amount of contributions to the pension plan required for the years ended June 30, 2016 and June 30, 2015, respectively. Note 14 – Other Post-employment Benefits (OPEB) The Ohio Revised Code provides the statutory authority for public employers to fund post-retirement health care through their contributions to STRS Ohio and OPERS. State Teachers Retirement System of Ohio (STRS Ohio) STRS Ohio provides access to health care coverage to eligible retirees who participated in the Defined Benefit or Combined Plans. Coverage under the current program includes hospitalization, physicians’ fees, prescription drugs and reimbursement of monthly Medicare Part B premiums. Pursuant to Chapter 3307 of the Ohio Revised Code, the Retirement Board has discretionary authority over how much, if any, of the associated health care costs will be absorbed by STRS Ohio. All benefit recipients, for the most recent year, pay a portion of the health care costs in the form of a monthly premium. Under Ohio Law, funding for post-employment health care may be deducted from employer contributions. Of the 14% employer contribution rate, 0% of the covered payroll was allocated to

YOUNGSTOWN STATE UNIVERSITY Notes to Financial Statements (cont.)
For the Years Ended June 30, 2016 and 2015
56
post-employment health care for the year ended June 30, 2015 and 1% was allocated for the years ended June 30, 2014 and 2013. The University’s contributions allocated to post-employment health care for the years ended June 30, 2015, 2014, and 2013 were $0, $374,996 and $369,890, respectively. Ohio Public Employees Retirement System (OPERS) OPERS provides post-employment health care coverage to age-and-service retirees with 10 or more years of qualifying Ohio service credit. Health care coverage for disability benefit recipients and qualified survivor benefits is available. The Ohio Revised Code permits, but does not mandate, OPERS to provide OPEB to its eligible members and beneficiaries. Authority to establish and amend benefits is provided in Chapter 145 of the Ohio Revised Code. OPERS’ Post-Employment Health Care plan was established under, and is administered in accordance with, Internal Revenue Code 401(h). Each year, the OPERS Retirement Board determines the portion of the employer contribution rate that will be set aside for funding of post-employment health care benefits. The portion of employer contributions allocated to health care for members was 2% during calendar years 2015 and 2014 and 1% in calendar year 2013. The portion of the University’s calendar years 2015, 2014 and 2013 contributions to OPERS used to fund post-retirement benefits was $692,105, $715,110 and $361,468, respectively. The OPERS Retirement Board is also authorized to establish rules for the payment of a portion of the health care benefits provided, by the retiree or their surviving beneficiaries. Payment amounts vary depending on the number of covered dependents and the coverage selected. Note 15 – Contingencies and Risk Management The University is a defendant in various lawsuits. It is the opinion of University management that disposition of pending litigation will not have a material adverse effect on the financial statements of the University. The University receives grants and contracts from certain federal, state and local agencies to fund research and other activities. The costs, both direct and indirect, that have been charged to the grants or contracts are subject to examination and approval by the granting agency. It is the opinion of the University’s administration that any disallowance or adjustment of such costs would not have a material effect on the financial statements. The University was self-insured for all employee health care benefits through December 31, 2014. Effective January 1, 2015, the University became fully insured for dental and vision employee health care benefits. The self-insured plan includes stop loss provisions.

YOUNGSTOWN STATE UNIVERSITY Notes to Financial Statements (cont.)
For the Years Ended June 30, 2016 and 2015
57
Liabilities for estimates of outstanding claims and claims incurred but not reported under self-insurance programs have been recorded. Changes in the self-insured health care liabilities included in accrued health care benefits payable (also see Note 8) at June 30, 2016, June 30, 2015, and June 30, 2014 were as follows:
2016 2015 2014Liability at beginning of fiscal year 1,208,506$ 1,092,773$ 1,065,342$ Current year claims including changes in estimates 12,942,152 15,057,709 13,199,498 Claim payments (13,146,167) (14,941,976) (13,172,067)
Liability at end of fiscal year 1,004,491$ 1,208,506$ 1,092,773$
Health insurance claims are based upon estimates of the claims liabilities. Estimates are based upon past experience, medical inflation trends, and current claims outstanding, including year end lag analysis. Differences between the estimated claims payable and actual claims paid are reported in the Statement of Revenues, Expenses and Changes in Net Position. The University is exposed to various risks of loss related to torts; theft of, damage to, and destruction of assets; errors and omissions; injuries to employees; and natural disasters. The University has joined with other state-assisted universities in Ohio to form an insurance pool for the acquisition of commercial property and casualty insurance. The University pays annual premiums to the pool for its property and casualty insurance coverage based on its percentage of the total insurance value to the pool. Future contributions will be adjusted based upon each university’s loss history. The University had no significant reductions in coverage from the prior year. Insurance settlements have not exceeded insurance coverage for each of the past three fiscal years. The University participates in a State pool of agencies and universities that pays workers’ compensation premiums into the State Insurance Fund on a pay-as-you-go basis (the Plan), which pays workers’ compensation benefits to beneficiaries who have been injured on the job. Losses from asserted and unasserted claims for the participating state agencies and universities in the Plan are accrued by the Ohio Bureau of Workers’ Compensation (the Bureau) based on estimates that incorporate the past experience, as well as other considerations including the nature of each claim or incident and relevant trend factors. Participants in the Plan annually fund the workers’ compensation liability based on rates set by the Bureau to collect the cash needed in subsequent fiscal years to pay the workers’ compensation claims of participating State agencies and universities. Note 16 – Component Unit Youngstown State University Foundation (YSUF) is a legally separate nonprofit organization exempt from federal income tax and classified as a public charity. YSUF is devoted to the support, expansion, and development of educational programs at the University that are useful and beneficial to the students and the community. In order to maintain its public charity classification, YSUF must exclusively support the University, be responsive to its needs and distribute substantially all of its net income (other than net long-term capital gain) to the University. Because
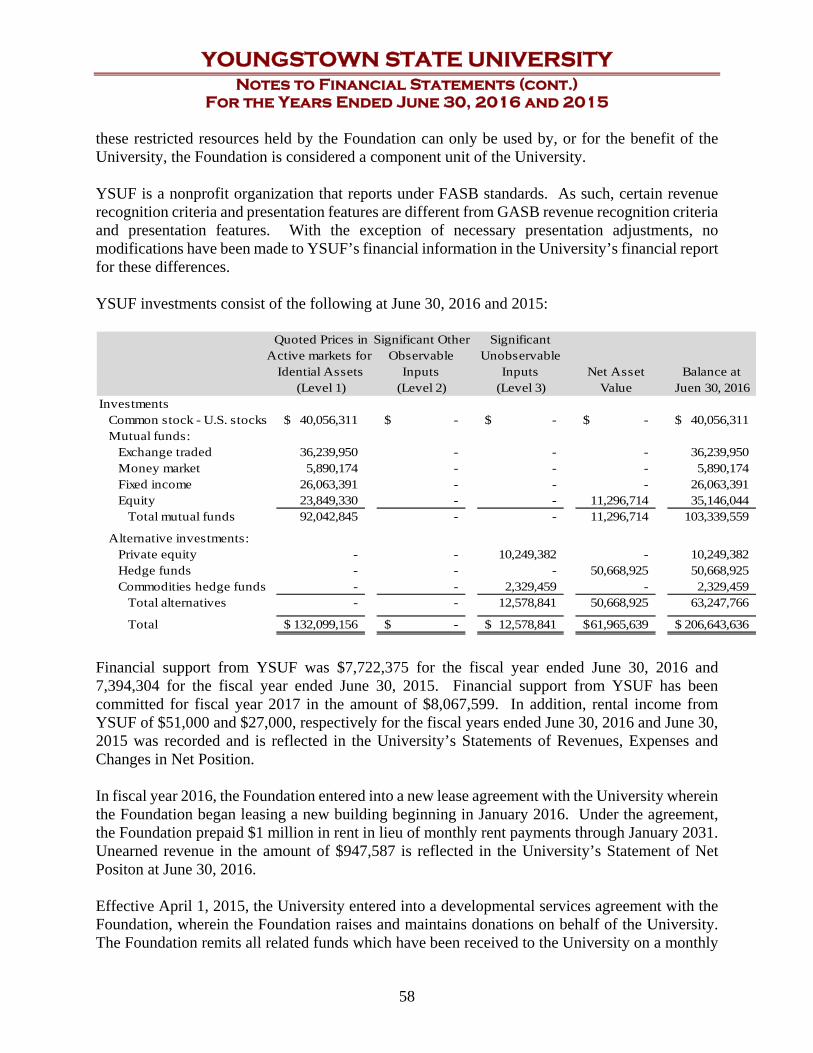
YOUNGSTOWN STATE UNIVERSITY Notes to Financial Statements (cont.)
For the Years Ended June 30, 2016 and 2015
58
these restricted resources held by the Foundation can only be used by, or for the benefit of the University, the Foundation is considered a component unit of the University. YSUF is a nonprofit organization that reports under FASB standards. As such, certain revenue recognition criteria and presentation features are different from GASB revenue recognition criteria and presentation features. With the exception of necessary presentation adjustments, no modifications have been made to YSUF’s financial information in the University’s financial report for these differences. YSUF investments consist of the following at June 30, 2016 and 2015:
Quoted Prices in Significant Other SignificantActive markets for Observable Unobservable
Idential Assets Inputs Inputs Net Asset Balance at(Level 1) (Level 2) (Level 3) Value Juen 30, 2016
InvestmentsCommon stock - U.S. stocks 40,056,311$ -$ -$ -$ 40,056,311$ Mutual funds:
Exchange traded 36,239,950 - - - 36,239,950 Money market 5,890,174 - - - 5,890,174 Fixed income 26,063,391 - - - 26,063,391 Equity 23,849,330 - - 11,296,714 35,146,044
Total mutual funds 92,042,845 - - 11,296,714 103,339,559
Alternative investments:Private equity - - 10,249,382 - 10,249,382 Hedge funds - - - 50,668,925 50,668,925 Commodities hedge funds - - 2,329,459 - 2,329,459
Total alternatives - - 12,578,841 50,668,925 63,247,766
Total 132,099,156$ -$ 12,578,841$ 61,965,639$ 206,643,636$
Financial support from YSUF was $7,722,375 for the fiscal year ended June 30, 2016 and 7,394,304 for the fiscal year ended June 30, 2015. Financial support from YSUF has been committed for fiscal year 2017 in the amount of $8,067,599. In addition, rental income from YSUF of $51,000 and $27,000, respectively for the fiscal years ended June 30, 2016 and June 30, 2015 was recorded and is reflected in the University’s Statements of Revenues, Expenses and Changes in Net Position. In fiscal year 2016, the Foundation entered into a new lease agreement with the University wherein the Foundation began leasing a new building beginning in January 2016. Under the agreement, the Foundation prepaid $1 million in rent in lieu of monthly rent payments through January 2031. Unearned revenue in the amount of $947,587 is reflected in the University’s Statement of Net Positon at June 30, 2016. Effective April 1, 2015, the University entered into a developmental services agreement with the Foundation, wherein the Foundation raises and maintains donations on behalf of the University. The Foundation remits all related funds which have been received to the University on a monthly

YOUNGSTOWN STATE UNIVERSITY Notes to Financial Statements (cont.)
For the Years Ended June 30, 2016 and 2015
59
basis. As of June 30, 2016 and 2015, $835,554 and $509,770, respectively, has been collected by the Foundation but not remitted to the University. These amounts are included in Accounts Receivable on the Statement of Net Position. Complete financial statements for the Youngstown State University Foundation can be obtained from The Youngstown State University Foundation, 655 Wick Avenue, Youngstown, Ohio 44502.

YOUNGSTOWN STATE UNIVERSITY Required Supplementary Information
60
Schedules of the University’s Proportionate Share of the Net Pension Liability
Fiscal Year 2016 2015Measurement Date 1/1/15-12/31/15 1/1/14-12/31/14University's proportion of the net pension liability (asset) 0.269315% 0.284240%net pension liability (asset)
University's proportionate share of the net pension liability (asset) 46,516,739$ 34,173,082$
University's covered-employee payroll 39,715,198$ 40,769,505$
University's proportionate share of the collective net pensionliability as a percentage of the employers covered-employee payroll 117.13% 83.82%
Plan fiduciary net position as a percentage of the total pension liability 85.00% 84.00%
Fiscal Year 2016 2015Measurement Date 7/1/14-6/30/15 1/1/14-12/31/14University's proportion of the net pension liability (asset) 0.361214% 0.384452%net pension liability (asset)
University's proportionate share of the net pension liability (asset) 99,828,954$ 93,512,061$
University's covered-employee payroll 42,774,459$ 44,313,510$
University's proportionate share of the collective net pensionliability as a percentage of the employers covered-employee payroll 233.38% 211.02%
Plan fiduciary net position as a percentage of the total pension liability 72.10% 74.70%
NOTE: Years prior to 2015 are not available.
OPERS
STRS Ohio

YOUNGSTOWN STATE UNIVERSITY Required Supplementary Information (cont.)
61
Schedules of the University’s Contributions
2016 2015Statutorily required contribution 4,994,138$ 5,095,976$
Contributions in relation to the statutorily required contribution 4,994,138$ 5,095,976$
Annual contribution deficiency -$ -$
University's covered-employee payroll 39,458,926$ 40,264,007$
Contributions recognized by the pension plan in relation to thethe statutorily or contractually required employer contributionas a percent of the employer's covered employee payroll 12.66% 12.66%
2016 2015Statutorily required contribution 5,153,427$ 5,318,436$
Contributions in relation to the statutorily required contribution 5,153,427$ 5,315,436$
Annual contribution deficiency -$ -$
University's covered-employee payroll 41,521,217$ 42,774,459$
Contributions recognized by the pension plan in relation to thethe statutorily or contractually required employer contributionas a percent of the employer's covered employee payroll 12.41% 12.43%
OPERS
STRS Ohio

YOUNGSTOWN STATE UNIVERSITY Other Information
62
Board of Trustees
Samantha P. Anderson Student Trustee Charles R. Bush Retired Cardiac Thoracic Surgeon Delores Crawford Community Affairs Director WKBN David C. Deibel Owner and President Boardman Steel Samuel W. Grooms Hy-Tek Material Handling, Inc. Chief Executive Officer Anita Hackstedde Salem Regional Medical Center President and Chief Executive Officer Dr. John R. Jakubek Anesthesiologist Bel-Park Anesthesia Assocates, Inc. and St. Elizabeth Boardman Health Center Allan K. Metz Student James “Ted” Roberts Principal and President Roth, Blair, Roberts, Strasfeld & Lodge Leonard D. Schiavone, Vice-Chair Partner and Treasurer Friedman & Rummell Co., LPA Carole S. Weimer, Chair Retired Special Education Teacher Liberty High School Franklin S. Bennett, Jr. Secretary to the Board of Trustees
YOUNGSTOWN STATE UNIVERSITY Other Information (cont.)
63
Executive Officers
Mr. James P. Tressel, M.A. President Dr. Martin A. Abraham Provost and Vice President for Academic Affairs Neal P. McNally, M.P.A. Vice President for Finance & Administration Holly A. Jacobs, J.D. Vice President for Legal Affairs and Human Resources


