55
Session 8 PD, Financial Reporting and the Affordable Care Act Moderator/Presenter: Daniel J. Perlman, ASA, MAAA Presenter: David M. Liner, FSA, MAAA, CERA

Session 8 PD, Financial Reporting and the Affordable Care Act
Moderator/Presenter:
Daniel J. Perlman, ASA, MAAA
Presenter:
David M. Liner, FSA, MAAA, CERA

Financial Reporting and the Affordable Care ActDan Perlman, ASA, MAAADave Liner, FSA, CERA, MAAA
Overview1. Background on the 3Rs2. Accounting guidance overview3. Analysis of 2014 annual statements4. Impact on issuer solvency5. Impact on rate setting for 2016 and beyond6. What lies ahead in the future
3Rs Accounting Analysis Solvency Rating Future

Important DisclosuresThe information presented represents our best understanding of the provisions discussed as of the presentation date of this presentation based on regulations currently available. All information is subject to change.
We intend to facilitate discussion surrounding each of these provisions. Each organization should consider the implications of these provisions internally and consult with legal counsel where necessary.
Milliman does not intend to create a legal duty to any user of this work.
This presentation represents the opinions of the presenters and not necessarily Milliman as a whole.

Section 1:Background on the 3Rs
3Rs

Introduction to the 3Rs• Risk mitigation mechanism under the ACA for the
individual and small group markets
Program Timing Who can collect? Who funds the program?
Reinsurance 2014-2016 Issuers of ACA-compliant individual market policies
All fully insured and self funded (including large group)
Risk adjustment Permanent Issuers of ACA-compliant individual and small group market policies
Individual, small group, non-grandfathered
Risk corridors 2014-2016 Issuers of individuals and small group market QHPs
It’s complicated
3Rs

Introduction to the 3Rs• Reinsurance is funded by all plans, including those
outside the target market.
• ACA is silent on where the money comes from for risk corridors if collections are not adequate
• Risk adjustment is defined as a zero-sum game within a state/market risk pool
3Rs

ACA Risk adjustment• What’s the purpose?
• How does it work (mechanically)?
• Implementation challenges in 2014 and 2015
3Rs

Gain / Loss
Premium Rate Structures Plan Design
Evolution of ACA Provisions: Pre-ACA
3Rs

MLR Rebates
Gain / Loss
Premium Rate Structures Plan Design
Evolution of ACA Provisions: 2012-2013
3Rs

Reinsurance
MLR Rebates
Gain / Loss
Premium Rate Structures
Risk Adjustment
Plan Design
Risk Corridor
Evolution of ACA Provisions: 2014-2016
3Rs

MLR Rebates
Gain / Loss
Premium Rate Structures
Risk Adjustment
Plan Design
Evolution of ACA Provisions: 2017+
* Based on current regulation3Rs
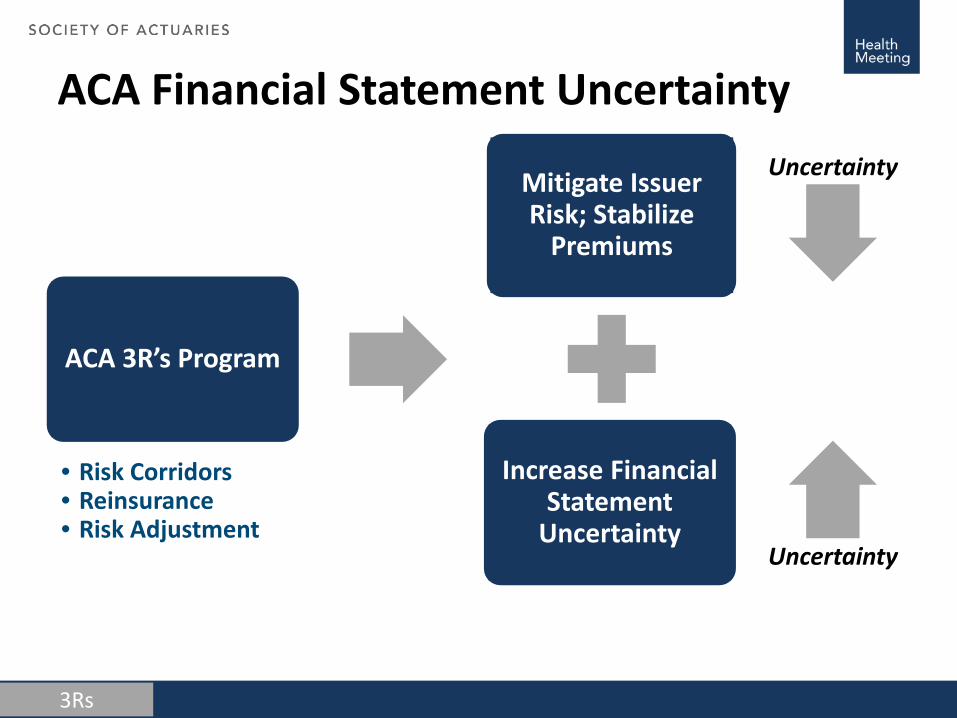
ACA Financial Statement Uncertainty
Mitigate Issuer Risk; Stabilize
Premiums
Increase Financial Statement
Uncertainty
ACA 3R’s Program
• Risk Corridors• Reinsurance• Risk Adjustment
Uncertainty
Uncertainty
3Rs

Section 2:Accounting guidance overview
Accounting

Financial statement impact• Overview of financial statements
Accounting

ASSETS LIABILITIES, CAPITAL AND SURPLUS
IBNR……………………..$1,000,000
Pre-ACA Financial Statement Uncertainty
Accounting

Pre-ACA Financial Statement UncertaintyASSETS LIABILITIES, CAPITAL AND SURPLUS
IBNR……………………..$1,250,000
Accounting

Post-ACA Financial Statement UncertaintyASSETS LIABILITIES, CAPITAL AND SURPLUS
Risk Adjustment……$1,000,000Risk Adjustment……$1,000,000
Accounting

Financial statement impact• Why does risk adjustment matter for financial
statements?• Uncertainty of ACA risk adjustment estimation
Accounting

NAIC guidance on risk adjustment• Preliminary guidance (late 2013)
– Premiums subject to redetermination (income statement)– Corresponding asset or liability (balance sheet)
• Additional guidance (mid 2014)– Non-admission of risk adjustment amounts recoverable– Concerns about timing and ability to estimate
Accounting

NAIC guidance on risk adjustment• SSAP 107 (late 2014)
– Permits admitting the asset– Periodic consideration of collectability
Accounting

Note 24 - Retrospectively Rated Contracts & Contracts Subject to Redetermination
• Include risk-sharing provisions of the Affordable Care Act (ACA):– Permanent ACA Risk Adjustment Program– Transitional ACA Reinsurance Program– Temporary ACA Risk Corridors Program
• Report for effect of each program on balance sheet and income statement items
Accounting

Section 3:Analysis of 2014 annual statements
Analysis

Review of 2014 annual statement data• Risk adjustment is fundamentally a question of how
an issuer’s population compares to the market as a whole
“That's the news from Lake Wobegon®, where the women are strong, the men are good looking, and all of the children are above average®”
Garrison Keillor, A Prairie Home Companion®
Analysis

Proof
• �𝑋𝑋 = ∑𝑖𝑖=1𝑛𝑛 𝑥𝑥𝑖𝑖𝑛𝑛
• Let 𝑥𝑥𝑖𝑖 = 𝑋𝑋 + 𝜖𝜖𝑖𝑖, where 𝜖𝜖𝑖𝑖 > 0
• �𝑋𝑋 = 𝑛𝑛𝑋𝑋+∑𝑖𝑖=1𝑛𝑛 𝜖𝜖𝑖𝑖𝑛𝑛
• �𝑋𝑋 = 𝑋𝑋 + ∑𝑖𝑖=1𝑛𝑛 𝜖𝜖𝑖𝑖𝑛𝑛
• Equation only holds if ∑𝑖𝑖=1𝑛𝑛 𝜖𝜖𝑖𝑖 = 0, which conflicts with the constraint above that 𝜖𝜖 > 0
Analysis

All patients cannot be sicker than average• In fact, most patients are less expensive than average
(measured either by cost or risk adjustment):– Milliman CPDs: Approximately 82% of commercially
insured lives have annual costs less than the population mean
– Milliman Advanced Risk Adjuster™: Concurrent diagnosis-based risk score of 1.00 is approximately the 78th
percentile in a commercially insured population
Analysis

Theoretical risk adjustment accrual• The true average PMPM risk adjustment transfer is
zero (both for the country as a whole, and for any state*market combination)
• No source of external funds or place for excess payments to go
Analysis
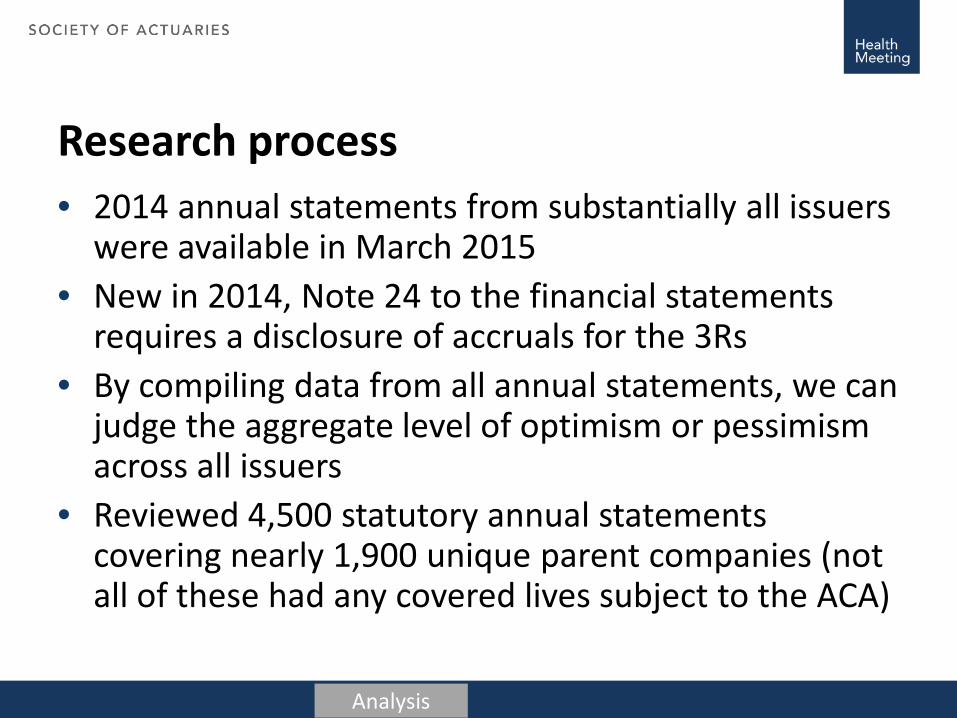
Research process• 2014 annual statements from substantially all issuers
were available in March 2015• New in 2014, Note 24 to the financial statements
requires a disclosure of accruals for the 3Rs• By compiling data from all annual statements, we can
judge the aggregate level of optimism or pessimism across all issuers
• Reviewed 4,500 statutory annual statements covering nearly 1,900 unique parent companies (not all of these had any covered lives subject to the ACA)
Analysis

Limitations• No breakdown of individual vs. small group• No breakdown by state (although obvious in cases
where issuer operates in only one state)• No information about how issuers arrived at their
estimates• There may be mistakes or omissions in the raw data• “We think it’s zero” versus “We don’t know”
Analysis
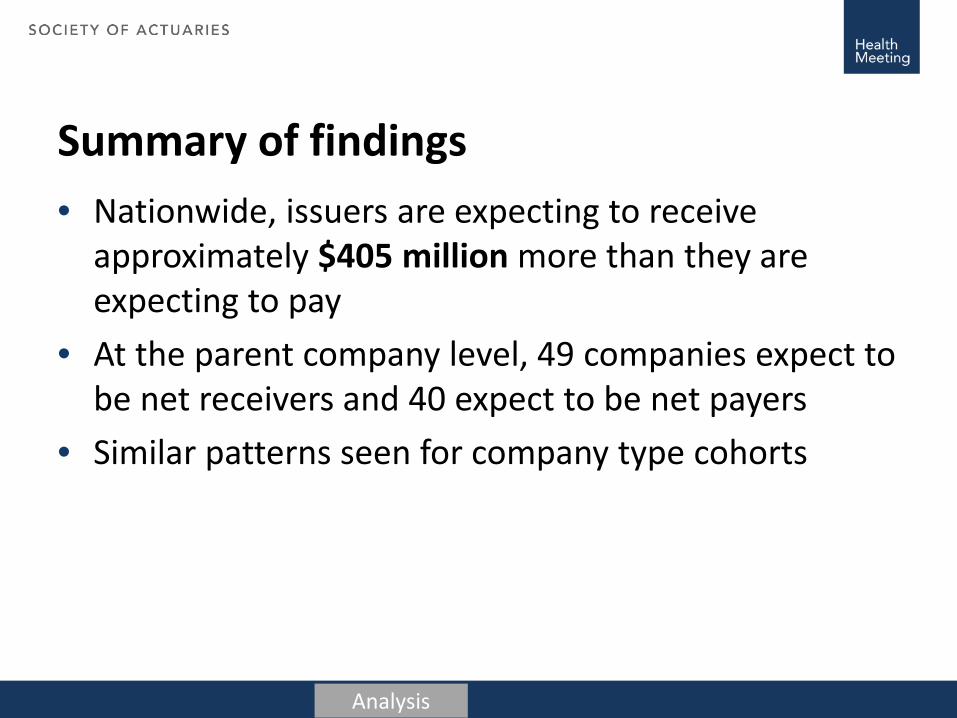
Summary of findings• Nationwide, issuers are expecting to receive
approximately $405 million more than they are expecting to pay
• At the parent company level, 49 companies expect to be net receivers and 40 expect to be net payers
• Similar patterns seen for company type cohorts
Analysis

Plausibility of reported data• More money collected than paid• Issuers covering a large portion of the market
collecting a large amount from issuers covering a small portion of the market
• Any one company’s reported results
Analysis

Distribution of accruals
($225,000)
($175,000)
($125,000)
($75,000)
($25,000)
$25,000
$75,000
$125,000
$175,000
Net risk adjustment accrualsBy parent company
($000)
Analysis

Distribution of accruals: “A closer look”
($75,000)
($25,000)
$25,000
$75,000
$125,000
$175,000
Net risk adjustment accrualsBy parent company
($000)
Analysis

Net risk adjustment by company typeCompany Characteristics Net Risk Adjustment
Accrual ($ millions)
Publicly Traded Companies $195
Blues Plans $316
CO-OPs ($4)
None of the above ($79)
Company Characteristics Net Risk Adjustment Accrual ($ millions)
At least 80% of membership in 3 states
$275
Otherwise $131
Analysis

“Zero” versus “We don’t know”• 26 companies reported accruing risk adjustment user
fees but $0 in risk adjustment transfers– Risk adjustment user fees ($0.96 PMPY for 2014) cover
administrative costs of the program– Presence of these fees indicates having enrollees subject
to risk adjustment
• Over $1.5 million in fees from such companies (nearly 1.6 million estimated lives)
Analysis
Risk corridors in the annual statements• Issuers also reported their expected risk corridor
accruals• Subject to some of the same uncertainties as risk
adjustment• Are risk corridors budget-neutral? Theoretically,
would one expect them to be?
Analysis

Risk Corridor Aggregation• Recent REGTAP guidance prescribes a risk
adjustment aggregation method• Example to illustrate method assuming risk corridor
program is funded at 25%
Segment Risk Corridor Receivable/(Payable)
UncollectibilityAdjustment
Net Risk Corridor Receivable/(Payable)
Individual ($1,000,000) $0 ($1,000,000)
Small Group $1,000,000 ($750,000) $250,000
Total $0 ($750,000) ($750,000)
Analysis

Risk corridor accruals• Industry-wide, risk corridor payments reported in
Note 24 are only about 5% of reported receipts– Caveat: Some carriers may have already adjusted their
accruals downward for expected collection risk
• Reported shortfall is nearly $900 million• Risk adjustment shortfall means the true shortfall is
actually larger• “Zero” versus “We don’t know” applies here too
Analysis

A potential game-changer: Reinsurance• Expected transitional reinsurance parameters for
2014– $45,000 attachment point– 80% coinsurance– $250,000 cap
• CMS now expects $9.7 billion available to pay out– Slightly less than original $10 billion plan– But could allow for adjustment to program parameters
Analysis

A potential game-changer: Reinsurance• Note 24 data indicate $5.9 billion of requests
– Caveat: Cannot discern methods used to arrive at accruals– Caveat: Some companies appear to have been
conservative and not accrued for recoveries on IBNP claims
• If actual EDGE server submissions match the annual statements (not guaranteed) and CMS projections are accurate– Coinsurance could go up to 100%– Individual market issuers would collect more than
expected
Analysis

A potential game-changer: Reinsurance• Shortfall in risk adjustment and risk corridors could
be covered by higher-than-expected reinsurance– Reinsurance is an input to the risk corridor formula– Higher reinsurance recoveries will lower aggregate risk
corridor receivables (or increase payables)
• No explicit link to risk adjustment, but money is money
• No benefit to small group market
Analysis

Other Research• S&P Findings:
– We expect the ACA risk-corridor pool to be significantly underfunded for 2014 if its funding is limited only to insurers' risk corridor payments.
– Our risk-corridor study found that the aggregate risk-corridor payables recorded by U.S. insurers for 2014 are less than 10% of the aggregate risk-corridor receivables booked by insurers for the same year.
– Uncertainty of payment due to underfunding can cause volatility in the market for all participants.
Source: S&P Report published on May 1, 2015 titled “The Unfunded ACA Risk Corridor May Make The U.S. Insurance Market Less Stable, Not More”
Analysis

Other Research (continued)• Citi Research using 3Q14 Financial Statements:
– $540 million in risk adjustment receivables– $7.5 billion in reinsurance receivables– $1.2 billion in risk corridor receivables
Source: Citi Research Report dated December 17, 2014 titled “Managed Care: What You See Depends On What You Are Looking For”
Analysis

Section 4:Impact on issuer solvency
Solvency

Impact on solvency• Risk adjustment accruals represent a large
percentage of total capital for a number of health insurers– 19 statutory entities where risk adjustment accrual was
more than 25% of total adjusted capital– 72 statutory entities where risk adjustment accrual was
more than 25% of authorized control level
Solvency
Impact on solvency• 5 companies would have had RBC ratio < 200%
ignoring the risk adjustment accrual but > 200% with it– Capital is negative in 3 of the 5 but for risk adjustment
• 2 companies reported an RBC ratio < 200% but would have been > 200% without risk adjustment
Solvency

Impact on solvency• Booking zero (or adjusting to zero) is not necessarily
conservative• Challenges from a regulatory perspective
Solvency

Section 5:Impact on rate setting in 2016 and beyond
Rating

Impact on rate setting: 2016 and beyond• Sources of uncertainty in initial years of ACA-
compliant product pricing• EDGE server challenges
Rating

Impact on rate setting: 2016 and beyond• Need for corrective action in 2017?• Exits from the market?• Regulatory expectations?
Rating

Section 6:What lies ahead in the future
Future

Thoughts on what lies ahead• What do we want?
– Information!
• When do we want it?– Soon!
Future

Thoughts on what lies ahead• The “data desert” isn’t permanent• Beware of over-reliance on first-year results• Concurrent risk adjustment may not be permanent
2013 2014 2015 2016 2017 2018
Data Desert
Future

Concluding Remarks• There may be a significant amount of uncertainty in
2014 health issuer financial statements• We are currently in a “data desert”• Be aware of your biases when forming financial
statement estimates
Future

Connect
[email protected] [email protected]
+1 303 672 9073 +1 860 687 0137
Daniel Perlman Dave Liner
@DaveLiner


![Affordable Care Act Reporting Requirements for 2015 [Webinar Slides]](https://static.documents.pub/doc/80x56/55b90fddbb61eb91578b45e2/affordable-care-act-reporting-requirements-for-2015-webinar-slides.jpg)


