Financial Results Briefing for the Third Quarter Fiscal Year Ending December 2017 ISEKI & CO., LTD. Shirou Tomiyasu, Director & Executive Vice President November 15, 2017 Financial Results Briefing for the Third Quarter Fiscal Year Ending December 31, 2017
Transcript
Financial Results Briefing for the Third Quarter
Fiscal Year Ending December 2017
ISEKI & CO., LTD.
Shirou Tomiyasu, Director & Executive Vice President
November 15, 2017
Financial Results Briefing for the Third Quarter Fiscal Year Ending December 31, 2017
2
Index
1.Overview of Financial Results for the Third Quarter Fiscal Year Ending December, 2017
2.Recent Development in Domestic and OverseasMarkets
3.Performance Forecast for the Fiscal YearEnding December, 2017
4.Topix
1.Overview of Financial Results for the Third Quarter Fiscal Year Ending December, 2017
2.Recent Development in Domestic and OverseasMarkets
3.Performance Forecast for the Fiscal YearEnding December, 2017
4.Topix
Financial Results Briefing for the Third Quarter Fiscal Year Ending December 31, 2017
1.Overview of Financial Results of the Third Quarter Fiscal Year Ending December, 2017
Financial Results Briefing for the Third Quarter Fiscal Year Ending December 31, 2017
4
Financial results Highlights
Sales subsidiariesin Japan
Manufacturing subsidiary
in Indonesia(PT ISEKI INDONESIA)
Equity method affiliate in China
(Dongfeng Iseki)
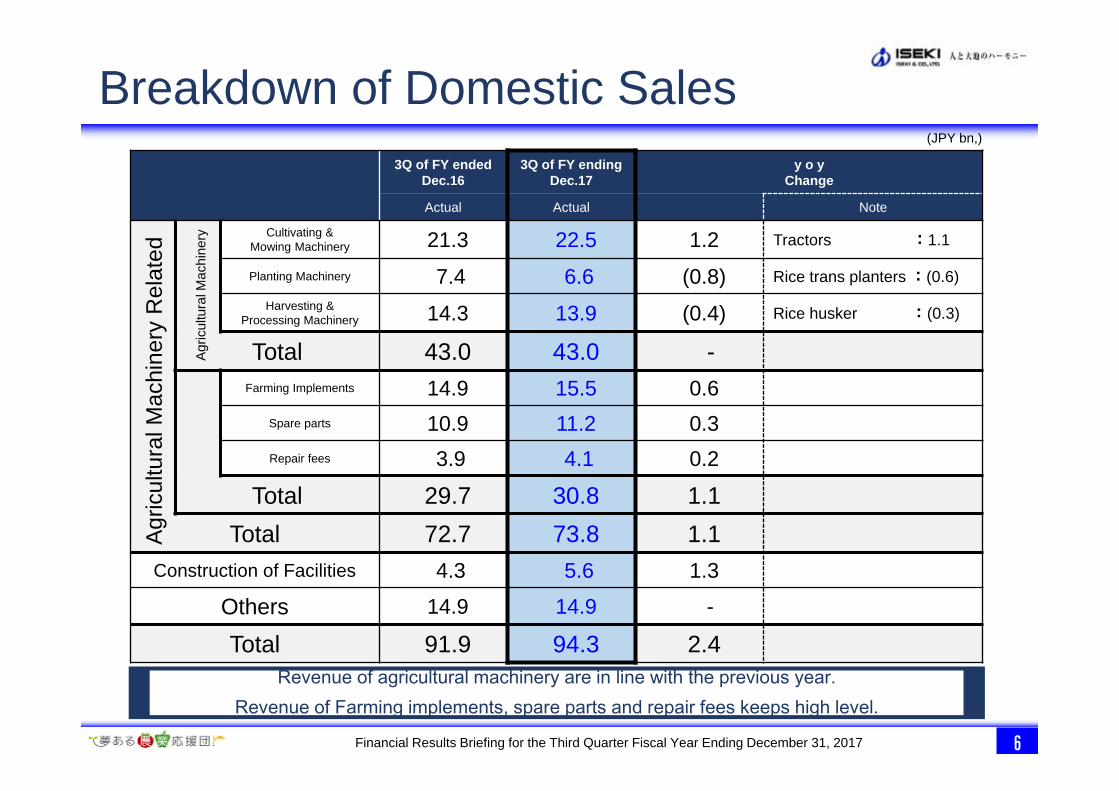
Net sales of agricultural machinery are on the recovery trend. Improvements in revenue-expenditure structure have been continued. Net sales 102%, Contract basis 104% The effect of improvements in the revenue-expenditure structure in
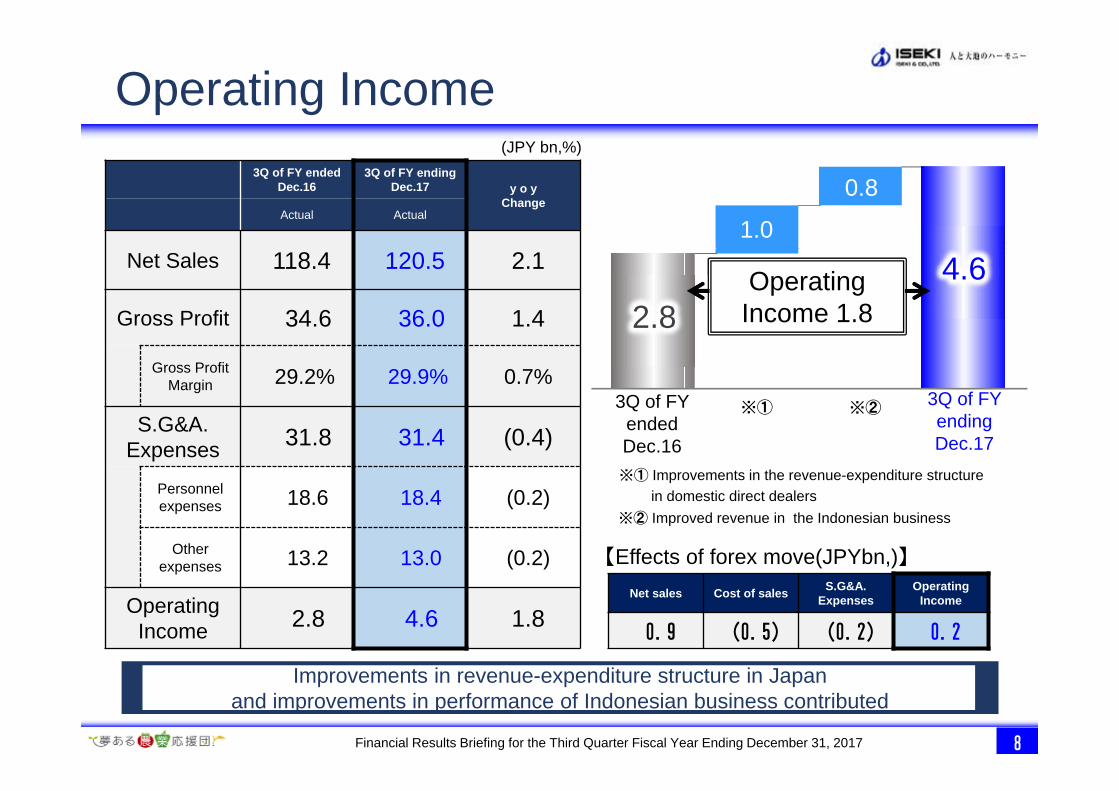
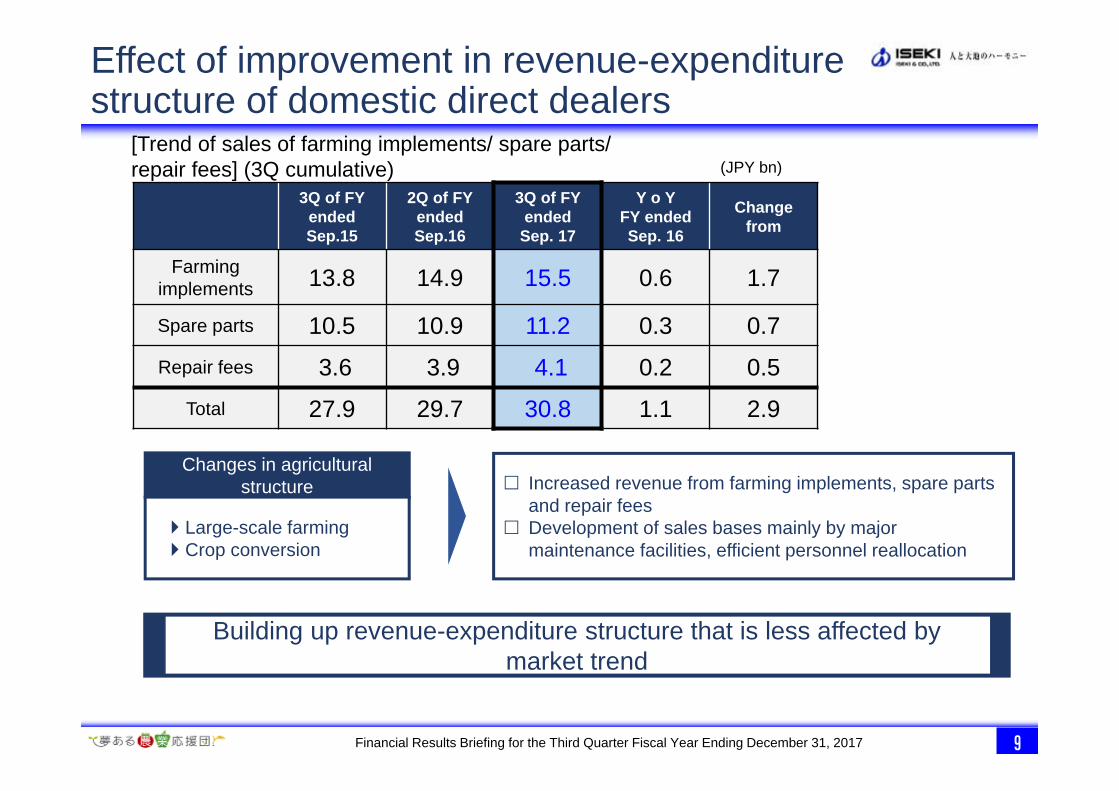
direct dealers: Operating income + 1.0 billion yen
The company produced profitability. Its business improved substantially. Improved profitability in Indonesian business : Operating income +0.8
billion yen
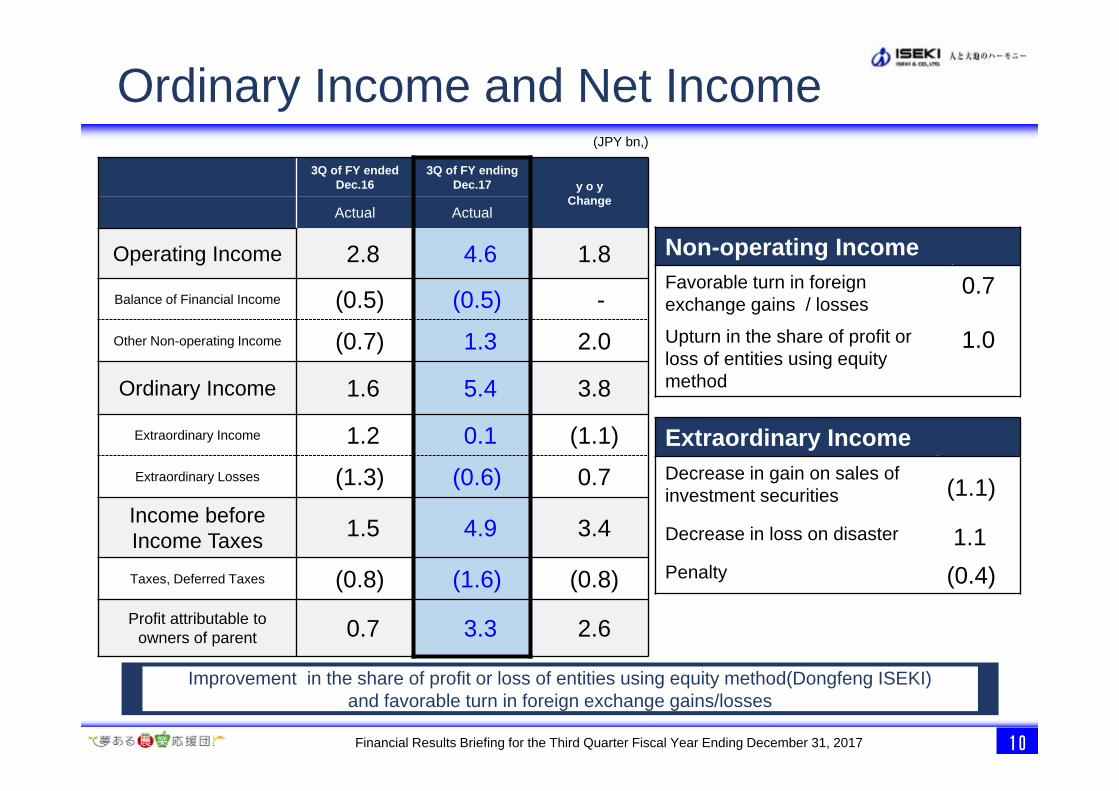
The company returned to profitability. Profit or loss of entities using equity method improved. Improvement in the share of profit or loss of entities using equity
method: Ordinary income + 1.0 billion yen
Situation of Jan.- Sep. (Y o Y change)
Financial Results Briefing for the Third Quarter Fiscal Year Ending December 31, 2017
(Consolidated basis including Indonesia business of the parent and plants in Japan)
Total Non-current Assets 109.2 109.5 0.3 (Foreign currency
translation adjustment) 0.3 1.0 0.7
Total Assets 208.3 214.9 6.6 Total Liabilities and Net Assets 208.3 214.9 6.6
Inventories increased due to pre-production before the introduction of new emission regulation in Japan and due to rise in inventories in North America
Balance Sheet(JPY bn,)
Financial Results Briefing for the Third Quarter Fiscal Year Ending December 31, 2017
Strengthening unique proposals‣ Dream Agricultural Research
Institute, etc.
Strengthen our initiatives for principal farmers
Financial Results Briefing for the Third Quarter Fiscal Year Ending December 31, 2017
17
Low price/Simple model
2016 2017
250%
Reduced material cost Further increase in needs for low price machinery
Large tractor TJX series
‣ Price reduction by 20%
‣ Adopted by JA Group as a low price model
<Growth rate of effective unit sales of TJX series (Jan.-Sep.)>
Financial Results Briefing for the Third Quarter Fiscal Year Ending December 31, 2017
18
Application of advanced technologies
Autonomous tractor‣ Shortage in labor
Manned monitored type to be commercialized and launched in 2018
‣ Shortfall of skilled operators
Labor saving/Improved efficiency
Robotization
Financial Results Briefing for the Third Quarter Fiscal Year Ending December 31, 2017
0
5
10
15
20
25
30
35
Jan. Feb. Mar. Apr. May. Jun. Jul. Aug. Sep. Oct. Nov. Dec.
(億円)
19
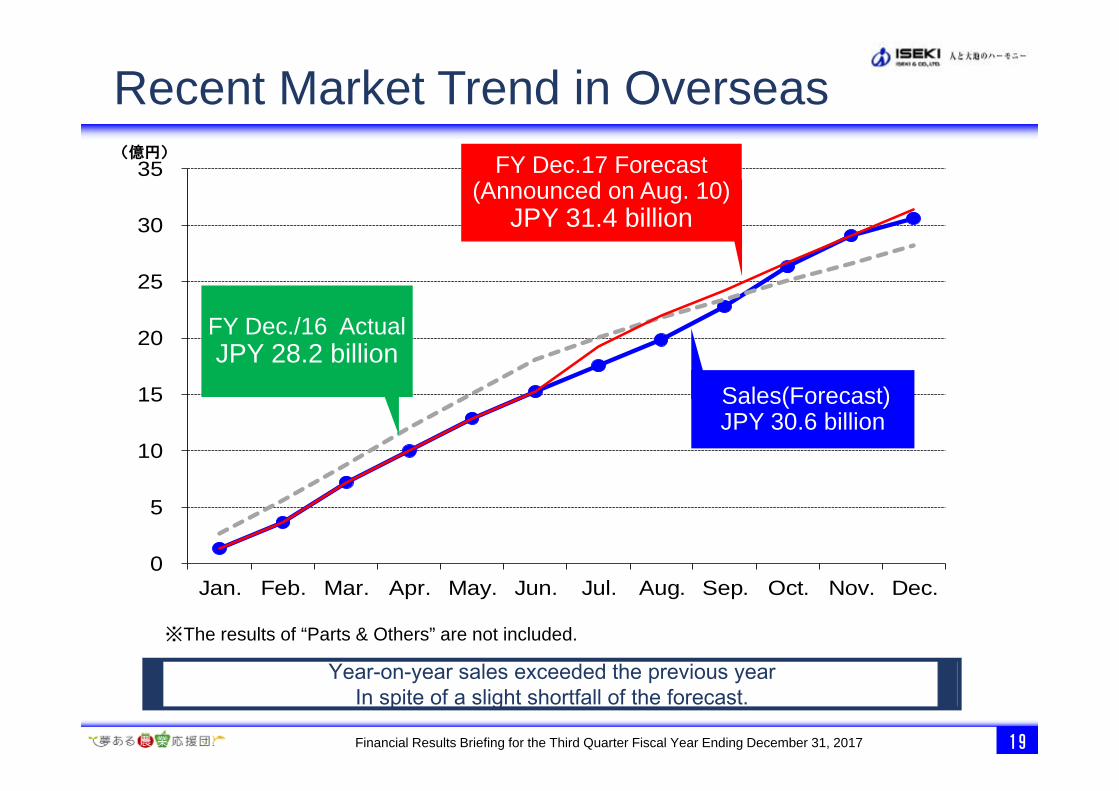
FY Dec./16 ActualJPY 28.2 billion
Year-on-year sales exceeded the previous year In spite of a slight shortfall of the forecast.
FY Dec.17 Forecast(Announced on Aug. 10)
JPY 31.4 billion
Sales(Forecast)JPY 30.6 billion
Recent Market Trend in Overseas
※The results of “Parts & Others” are not included.
Financial Results Briefing for the Third Quarter Fiscal Year Ending December 31, 2017
20
Category (PTO HP)
Utility tractors(40-100HP)
Compact tractors(40HP and lower)
USA Canada USA USA
Jan-Sep, 2016 42.7 3.5 46.2 105.1 8.4 113.4
Jan-Sep, 2017 42.2 3.9 46.2 113.2 10.3 123.5
Difference (%) 99% 111% 100% 108% 123% 109%
1. Trend in the market
(Source: AEM statistics)
2. Situation of AGCO (OEM partner)
: higher than last year: higher than last year
(Unit: 1000, %)
3. Our situation of sales/orders received
Unit sales (17/Jan.-Sep.)Utility tractorsCompact tractors
Consolidated net sales (ISEKI to AGCO)
Market Trend (North America)
(Actual: 10.7)
Change in business terms with AGCO
(Forecast: 9.4)
While the sales of AGCO remains robust, we expect our sales to be slightly lower than last year due to change in business terms and decline in shipment of utility tractors.
Large class tractors(100PS and above)
USA Canada
14.0 2.5 16.5
11.7 2.5 14.2
84% 101% 86%
Order & Shipment : lower than last year
Financial Results Briefing for the Third Quarter Fiscal Year Ending December 31, 2017
21
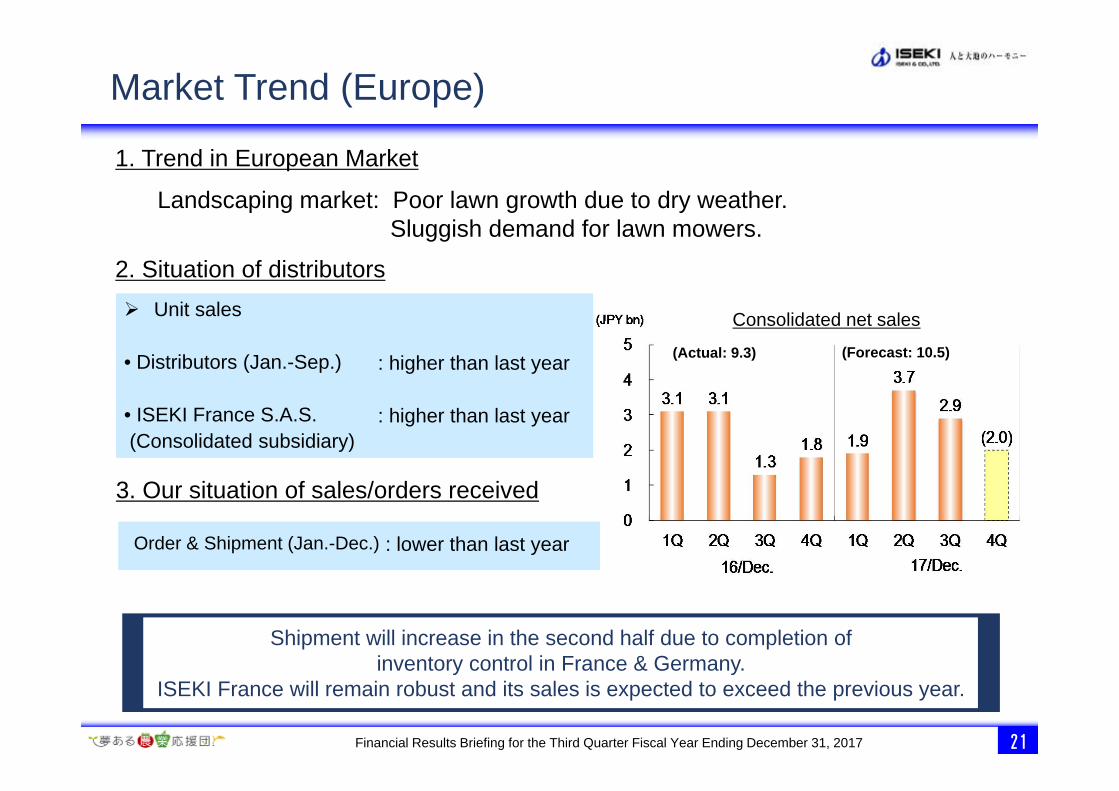
Market Trend (Europe)
2. Situation of distributors Unit sales
• Distributors (Jan.-Sep.)
• ISEKI France S.A.S.(Consolidated subsidiary)
1. Trend in European Market
Consolidated net sales
: higher than last year
: higher than last year
3. Our situation of sales/orders received
(Actual: 9.3)
Landscaping market: Poor lawn growth due to dry weather. Sluggish demand for lawn mowers.
(Forecast: 10.5)
Shipment will increase in the second half due to completion of inventory control in France & Germany.
ISEKI France will remain robust and its sales is expected to exceed the previous year.
Order & Shipment (Jan.-Dec.) : lower than last year
Financial Results Briefing for the Third Quarter Fiscal Year Ending December 31, 2017
22
1. Trend in the market
2. Situation of ISEKI (Sales) Thailand
In spite of effects from floods in various regions and self-restraint by the state funeral, future increase in rice price is expected due to increasing amount of rice export.
Tractors strategically marketed in ASEAN• Unit sales (17/Jan.-Sep.) : higher than last year
□ Start of sales of tractors by newly acquired dealers
□ Local sales remains robust. We expect orders to be increased.
Financial Results Briefing for the Third Quarter Fiscal Year Ending December 31, 2017
23
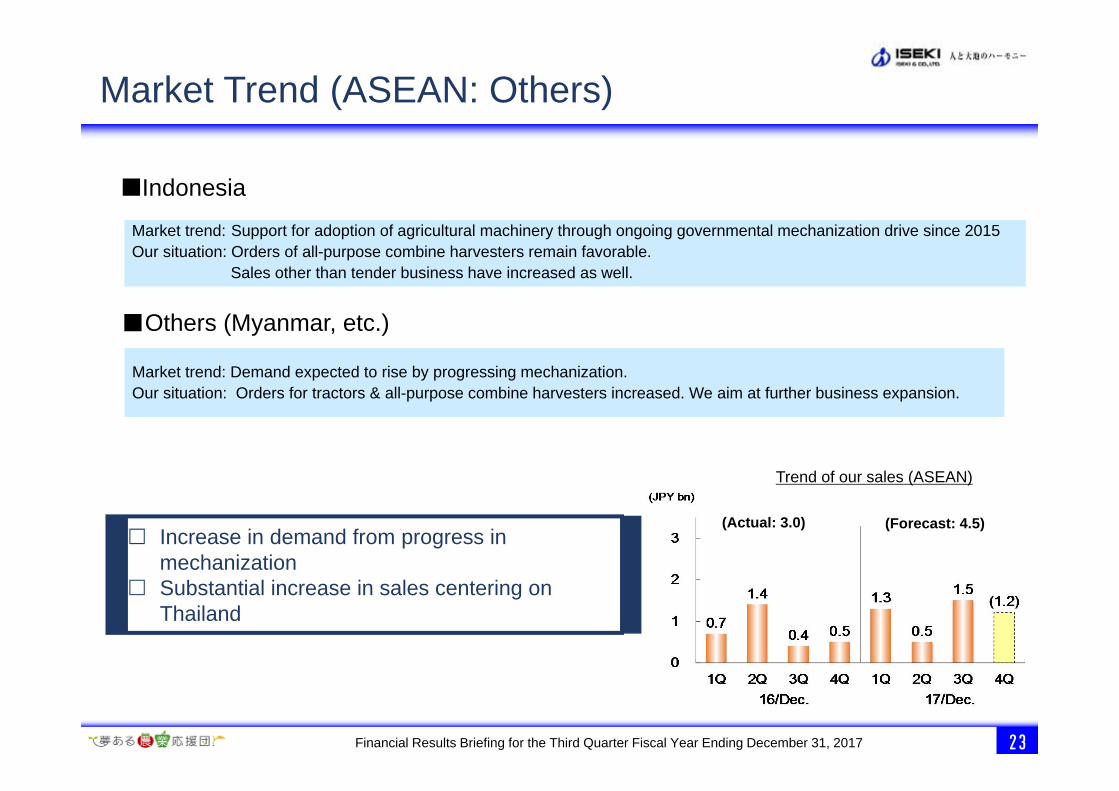
Indonesia
Trend of our sales (ASEAN)
Market trend: Support for adoption of agricultural machinery through ongoing governmental mechanization drive since 2015Our situation: Orders of all-purpose combine harvesters remain favorable.
Sales other than tender business have increased as well.
■Others (Myanmar, etc.)
Market trend: Demand expected to rise by progressing mechanization.Our situation: Orders for tractors & all-purpose combine harvesters increased. We aim at further business expansion.
Market Trend (ASEAN: Others)
(Actual: 3.0) (Forecast: 4.5) Increase in demand from progress in
mechanization Substantial increase in sales centering on
Thailand
Financial Results Briefing for the Third Quarter Fiscal Year Ending December 31, 2017
24
Improved profitability of business in Indonesia
Construction of plant extension (Approx. 8,200m2) started in October to reach 15,000units/year production in 2019.
Production volume forecast in PT. ISEKI INDONESIA (Units)
2014Actual
2015Actual
2016Actual
2017Plan
2017Jan.-
Sep.ActualAnnual forecast
Production Volume 1,100 3,900 7,300 8,300 6,150 8,500
Production m
odel
North America
Europe
ASEAN
Economy tractor (small) Economy tractor (large)
Economy tractor
Strategically marketed tractor in ASEAN
Current production capacity: 10,000 units /year
15,000 units/year in 201920,000 units/year in 2021
<PT. ISEKI INDONESIA moves towards increased production>
Financial Results Briefing for the Third Quarter Fiscal Year Ending December 31, 2017
25
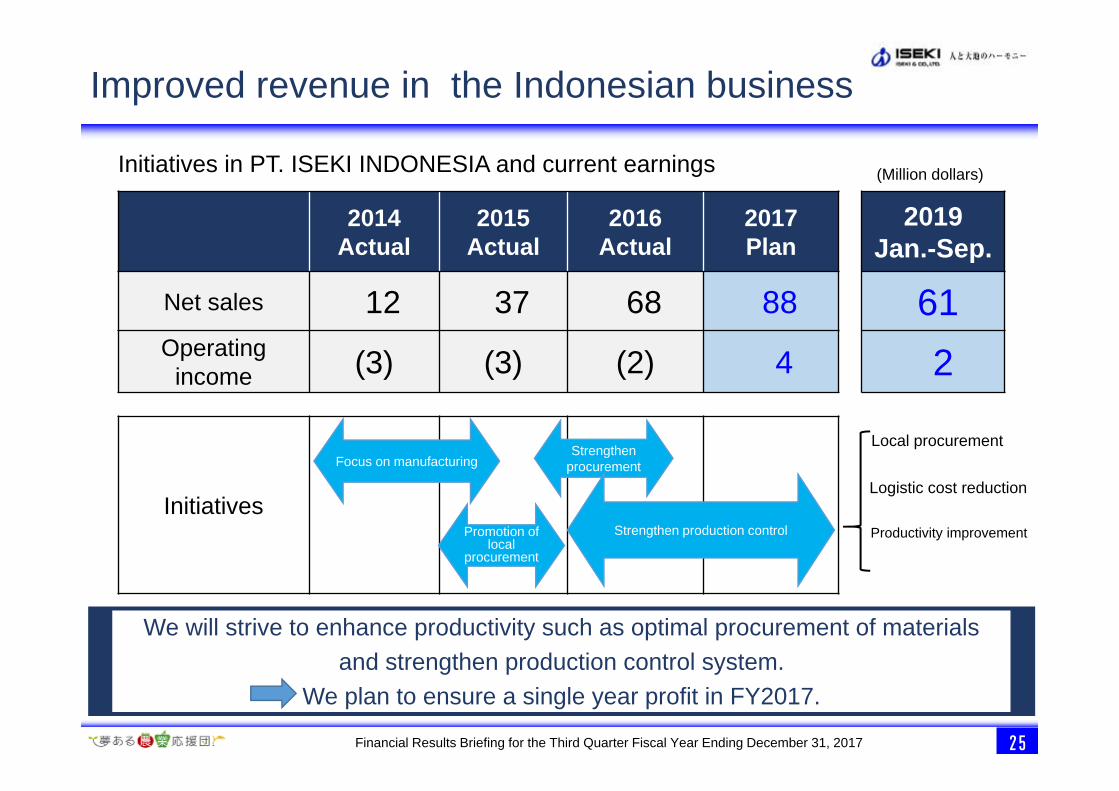
Improved revenue in the Indonesian business
2014Actual
2015Actual
2016Actual
2017Plan
2019Jan.-Sep.
Net sales 12 37 68 88 61Operating
income (3) (3) (2) 4 2
Initiatives
We will strive to enhance productivity such as optimal procurement of materials and strengthen production control system.
We plan to ensure a single year profit in FY2017.
Initiatives in PT. ISEKI INDONESIA and current earnings (Million dollars)
Focus on manufacturing
Promotion of local
procurement
Strengthen procurement
Strengthen production control
Local procurement
Logistic cost reduction
Productivity improvement
Financial Results Briefing for the Third Quarter Fiscal Year Ending December 31, 2017
26
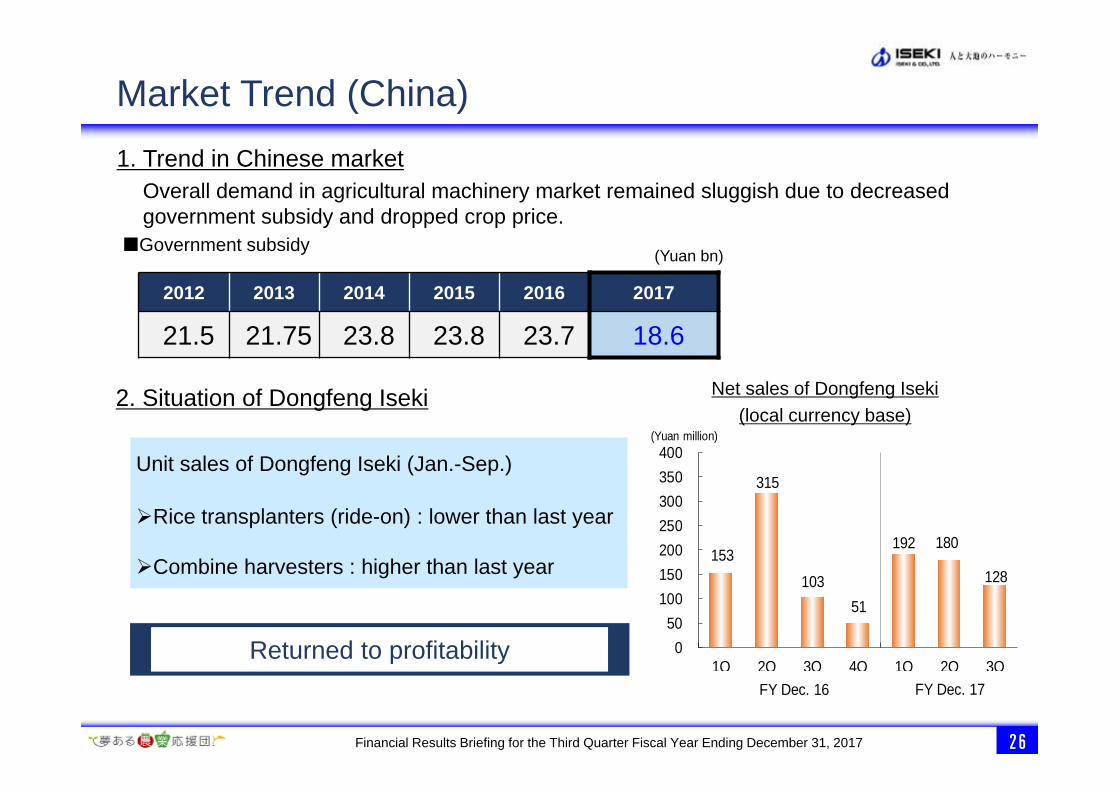
Net sales of Dongfeng Iseki(local currency base)
153
315
10351
192 180
128
050
100150200250300350400
1Q 2Q 3Q 4Q 1Q 2Q 3Q
(Yuan million)
FY Dec. 16 FY Dec. 17
1. Trend in Chinese market
Unit sales of Dongfeng Iseki (Jan.-Sep.)
Rice transplanters (ride-on) : lower than last year
Combine harvesters : higher than last year
(Yuan bn) Government subsidy
2. Situation of Dongfeng Iseki
Overall demand in agricultural machinery market remained sluggish due to decreased government subsidy and dropped crop price.
Market Trend (China)
2012 2013 2014 2015 2016 2017
21.5 21.75 23.8 23.8 23.7 18.6
Returned to profitability
Financial Results Briefing for the Third Quarter Fiscal Year Ending December 31, 2017
3.Performance Forecast For the Fiscal Year Ending December, 2017
Financial Results Briefing for the Third Quarter Fiscal Year Ending December 31, 2017
Financial Results Briefing for the Third Quarter Fiscal Year Ending December 31, 2017
4.Topix
Financial Results Briefing for the Third Quarter Fiscal Year Ending December 31, 2017
31
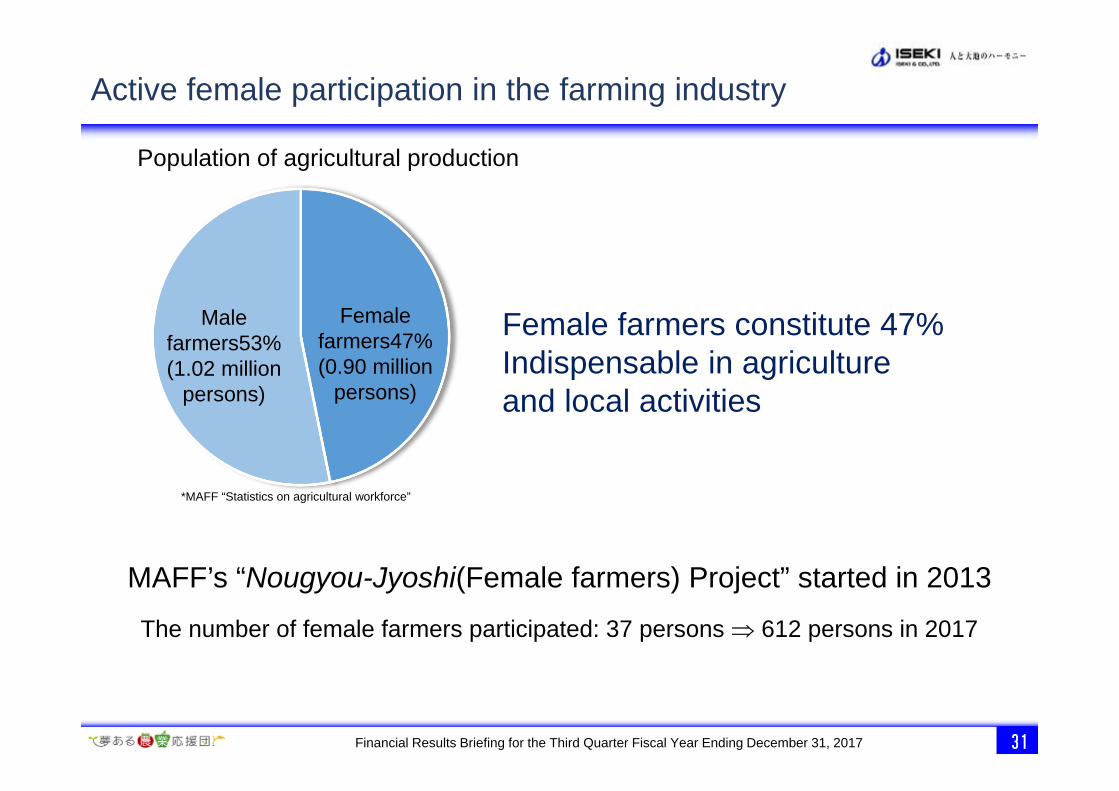
Active female participation in the farming industry
Population of agricultural production
Female farmers47%(0.90 million
persons)
Male farmers53%(1.02 million
persons)
*MAFF “Statistics on agricultural workforce”
Female farmers constitute 47%Indispensable in agricultureand local activities
MAFF’s “Nougyou-Jyoshi(Female farmers) Project” started in 2013
The number of female farmers participated: 37 persons 612 persons in 2017
Financial Results Briefing for the Third Quarter Fiscal Year Ending December 31, 2017
32
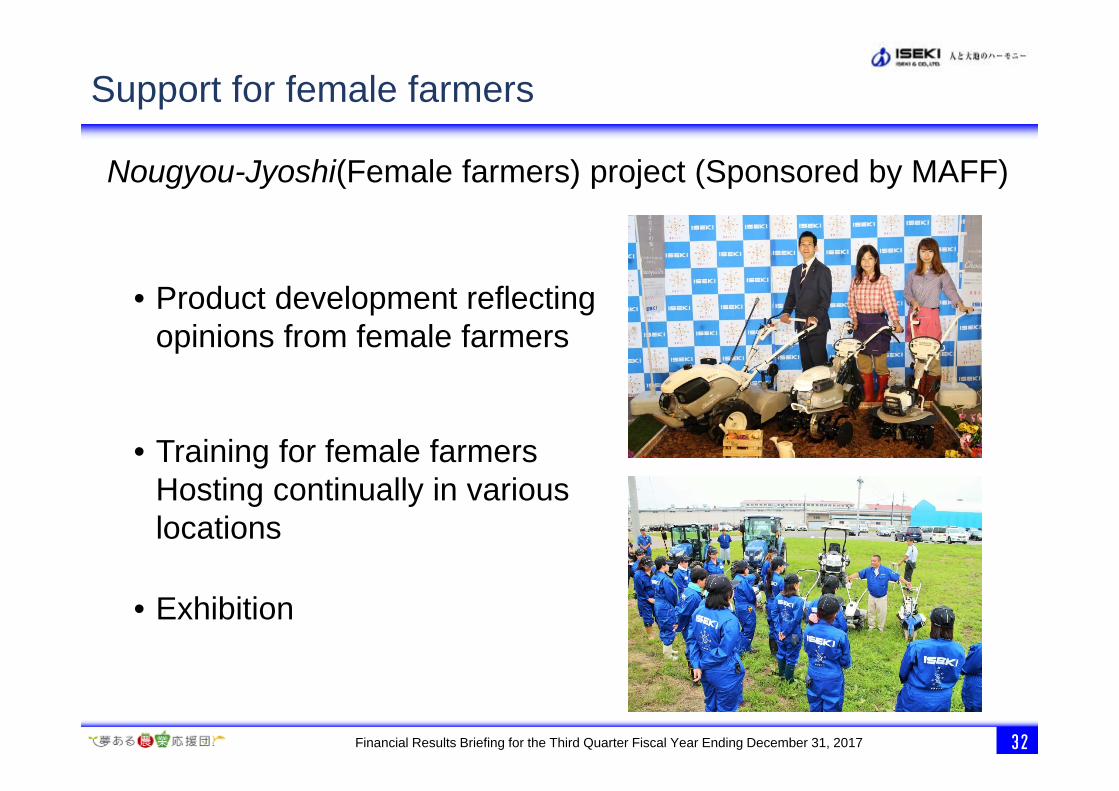
Support for female farmers
Nougyou-Jyoshi(Female farmers) project (Sponsored by MAFF)
• Product development reflecting opinions from female farmers
• Training for female farmersHosting continually in various locations
• Exhibition
Financial Results Briefing for the Third Quarter Fiscal Year Ending December 31, 2017
33
□Had a booth at Marunouchi Farm (Sponsored by MAFF)from November 4th to 5th
農業女子耕うん機「ちょこプチ」
2016年発売
Our latest approach
Financial Results Briefing for the Third Quarter Fiscal Year Ending December 31, 2017
34
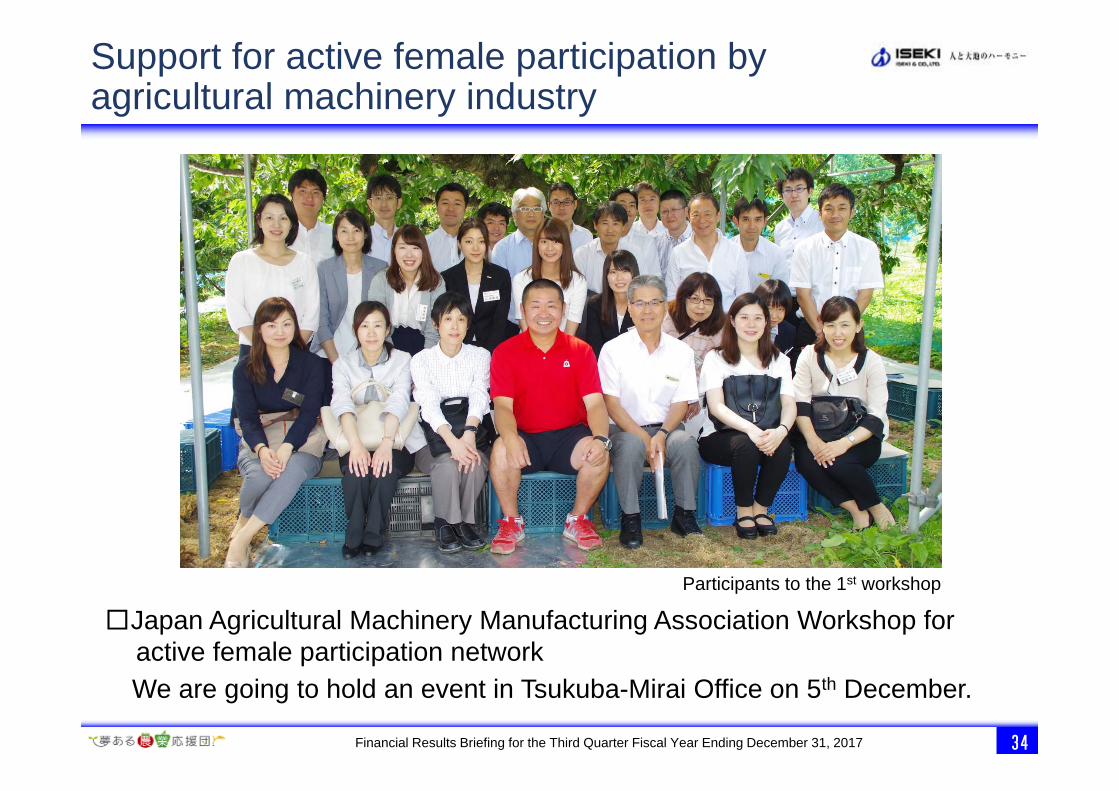
Support for active female participation by agricultural machinery industry
□Japan Agricultural Machinery Manufacturing Association Workshop for active female participation networkWe are going to hold an event in Tsukuba-Mirai Office on 5th December.
Participants to the 1st workshop
Financial Results Briefing for the Third Quarter Fiscal Year Ending December 31, 2017
35
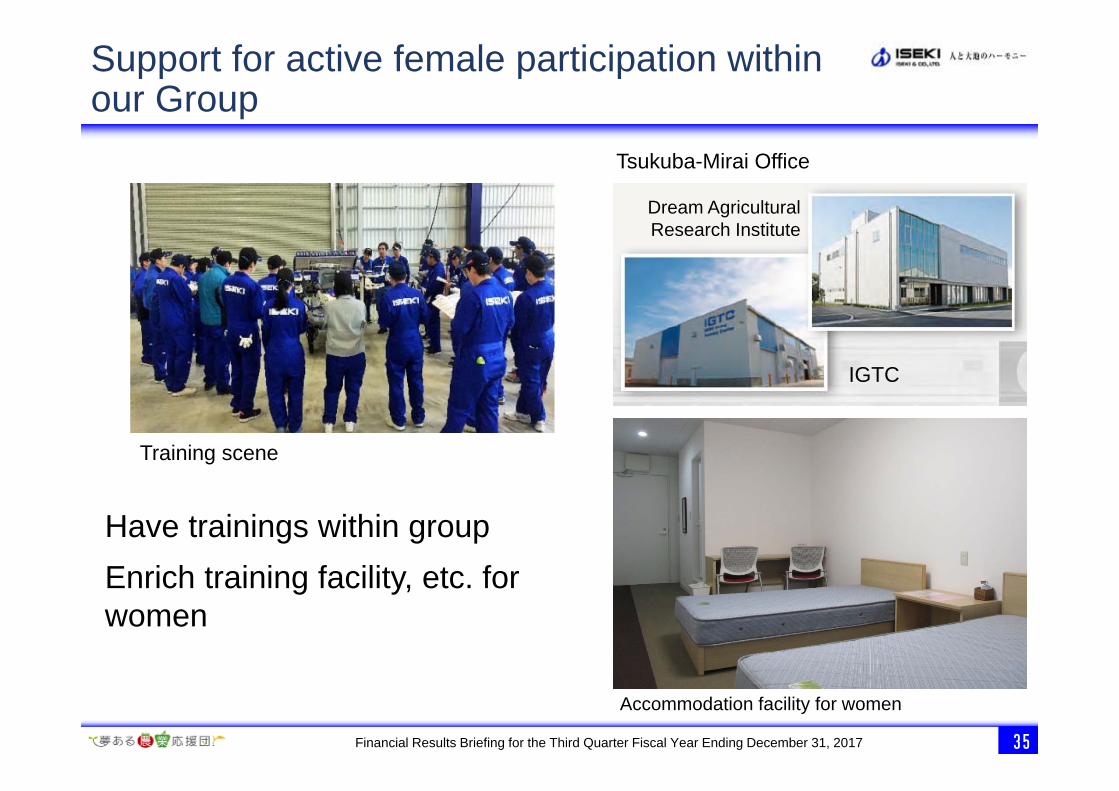
Support for active female participation within our Group
Have trainings within groupEnrich training facility, etc. for women
Accommodation facility for women
Dream Agricultural Research Institute
IGTC
Training scene
Tsukuba-Mirai Office
Financial Results Briefing for the Third Quarter Fiscal Year Ending December 31, 2017
36
・The objective of this presentation document is to provide information and not intended to induceany action.
・This document is prepared by ISEKI based on currently available information. It involves potential risks and uncertainties, and may differ from actual results due to changes in the economic situation and market trends.
・When using this information, investors are requested to make their decisions based on their own judgment. ISEKI will not be liable for any losses or damages incurred by investment decision madeusing the financial results forecast or targets provided in this document.
ISEKI group is a promotional partner of FOOD ACTION NIPPON.
Notes on the Future Forecast
Financial Results Briefing for the Third Quarter Fiscal Year Ending December 31, 2017
ISEKI Group joins the nationwide action called “COOL CHOICE”run by the Ministry of the Environment, the Government of Japan.The action promotes “smart choice” for the global warming, andas a proposal, we develop and deliver environmental-friendly products including “Eco Products.”