56
DQ’03 & FY’03 Results Presentation DQ’03 & FY’03 Results Presentation 17th Feb, 2004 17th Feb, 2004 Financial Results DQ’03 & FY’03

DQ’03 & FY’03 Results PresentationDQ’03 & FY’03 Results Presentation 17th Feb, 200417th Feb, 2004
Financial Results DQ’03 & FY’03

DQ’03 & FY’03 Results PresentationDQ’03 & FY’03 Results Presentation 17th Feb, 200417th Feb, 2004
Highlights - ‘03
� HPC Power Brands double +6.5% Vs +3.2% in ‘02
• HPC grows by 4.6% ‘03 : Led by PP +14.8%
• Brooke Bond grows by (+6%)
• Processed Food gains momentum ; grows by
(+20%)
• Operating Profit (PBIT) grows (+5.8%)
• Final Dividend : Rs 3.00 / Share.

DQ’03 & FY’03 Results PresentationDQ’03 & FY’03 Results Presentation 17th Feb, 200417th Feb, 2004
Business PerformanceBusiness PerformanceBusiness Performance
FinancialsFinancialsFinancials
DQ’03 HighlightsDQ’03 Highlights
ContentsContents
FY’03 HighlightsFY’03 HighlightsFY’03 Highlights

DQ’03 & FY’03 Results PresentationDQ’03 & FY’03 Results Presentation 17th Feb, 200417th Feb, 2004
DQ 2003 ResultsHighlights
DQ 2003 ResultsHighlights
•FMCG grows by (+4.0%) ; ; Volume Led
•Power Brands grow by (+6.2%)
•HPC sustains growth(+4.4%) in a difficultmarket(-5.7%)
••Personal Products grow by (+19.4%)Personal Products grow by (+19.4%)
••HPC Power Brands grow by (+5.8%)HPC Power Brands grow by (+5.8%)

DQ’03 & FY’03 Results PresentationDQ’03 & FY’03 Results Presentation 17th Feb, 200417th Feb, 2004
DQ 2003 ResultsHighlights
DQ 2003 ResultsHighlights
•Foods grow (+2.1%) in a decliningmarket(-5.5% )
•Processed Foods maintains strong growth momentum - grows by(+25.3%)
•Foods Power Brands grow by (+7.6%)
•FMCG Exports grow by (+14.3%);

DQ’03 & FY’03 Results PresentationDQ’03 & FY’03 Results Presentation 17th Feb, 200417th Feb, 2004
DQ 2003 ResultsHighlights
DQ 2003 ResultsHighlights
• Operating Profits (PBIT) up 1.0% - Margins up 72bps. In the context of :
• Competitive Strategy in Laundry
• Higher investments in quality
• Driving growth through appropriate price points positioning
• PBT & PAT factor in interest on BonusDebentures (Rs 30 cr)
• Net Profit Grows by (+2.9%)

DQ’03 & FY’03 Results PresentationDQ’03 & FY’03 Results Presentation 17th Feb, 200417th Feb, 2004
FMCG SalesTopline grows for 5th consecutive quarter
FMCG SalesTopline grows for 5th consecutive quarter
1.2
4.0
DQ'02 DQ'03
FMCG Sales Growth%

DQ’03 & FY’03 Results PresentationDQ’03 & FY’03 Results Presentation 17th Feb, 200417th Feb, 2004
Power Brands SalesPower Brand Strategy Continues to Deliver
Power Brands SalesPower Brand Strategy Continues to Deliver
3.7
6.2
DQ'02 DQ'03
Total Power Brands Growth%

DQ’03 & FY’03 Results PresentationDQ’03 & FY’03 Results Presentation 17th Feb, 200417th Feb, 2004
HPC SalesConsistently beating the market
HPC SalesConsistently beating the market
-0.4
-5.7
6.14.4
DQ'02 DQ'03
HPC Market Growth% HPC Sales Growth%

DQ’03 & FY’03 Results PresentationDQ’03 & FY’03 Results Presentation 17th Feb, 200417th Feb, 2004
HPCPower Brands Lead Growth
HPCPower Brands Lead Growth
6.1
4.4
6.35.8
DQ'02 DQ'03
HPC Sales Growth% HPC Power Brand Growth%

DQ’03 & FY’03 Results PresentationDQ’03 & FY’03 Results Presentation 17th Feb, 200417th Feb, 2004
HPC Power BrandsDelivering strong growth - DQ’03
HPC Power BrandsDelivering strong growth - DQ’03
FAL : 16% Lifebuoy : 10%* Group Basis
Nihar : 10%
Lakme :46%
Wheel : 11%
CloseUp : 35%Pears : 34%Sunsilk : 64% Clinic : 27%
:17%Pepsodent

DQ’03 & FY’03 Results PresentationDQ’03 & FY’03 Results Presentation 17th Feb, 200417th Feb, 2004
Total Foods SalesGrowth for 3rd Consecutive Qtr
Total Foods SalesGrowth for 3rd Consecutive Qtr
* Total foods comprises Beverages, Processed Foods and Ice creams
-5.9 -5.5
-14.4
2.1
DQ'02 DQ'03
Food Market Growth% Food Sales Growth%

DQ’03 & FY’03 Results PresentationDQ’03 & FY’03 Results Presentation 17th Feb, 200417th Feb, 2004
Total FoodsPower Brands Lead Growth
Total FoodsPower Brands Lead Growth
-14.4
2.1
-6.1
7.6
DQ'02 DQ'03
Foods Sales Growth% Foods Power Brand Growth%

DQ’03 & FY’03 Results PresentationDQ’03 & FY’03 Results Presentation 17th Feb, 200417th Feb, 2004
* Group Basis
Total Foods Power BrandsDelivering strong growth - DQ’03
Total Foods Power BrandsDelivering strong growth - DQ’03
Bru : 36%Kissan : 28% Knorr : 84%
Annapurna : 6% Taaza : 19%

DQ’03 & FY’03 Results PresentationDQ’03 & FY’03 Results Presentation 17th Feb, 200417th Feb, 2004
ExportsFMCG exports grow by double digit
ExportsFMCG exports grow by double digit
Growth %
• FMCG Exports grow by smart double digit in all the 4 quarters in 2003• Castor & Marine performance impacts total exports
4.9
14.313.1
-14.6DQ'02 DQ'03
FMCG Exports Total Exports

DQ’03 & FY’03 Results PresentationDQ’03 & FY’03 Results Presentation 17th Feb, 200417th Feb, 2004
Business PerformanceBusiness PerformanceBusiness Performance
FinancialsFinancialsFinancials
DQ’03DQ’03DQ’03 HighlightsHighlightsHighlights
ContentsContents
FY’03 HighlightsFY’03 Highlights

DQ’03 & FY’03 Results PresentationDQ’03 & FY’03 Results Presentation 17th Feb, 200417th Feb, 2004
FY 2003 ResultsHighlights
FY 2003 ResultsHighlights
•FMCG sales up (+3.6%); Power Brandsgrowth (+6.9%)
•HPC sustains growth(+4.6%) in a decliningmarket(-4.9%)
•Personal Products grow by (+14.8%)
•HPC Power Brands up (+6.5%) Vs (+3.2%) in ‘02
DQ’03 & FY’03 Results PresentationDQ’03 & FY’03 Results Presentation 17th Feb, 200417th Feb, 2004
FY 2003 ResultsHighlights
FY 2003 ResultsHighlights
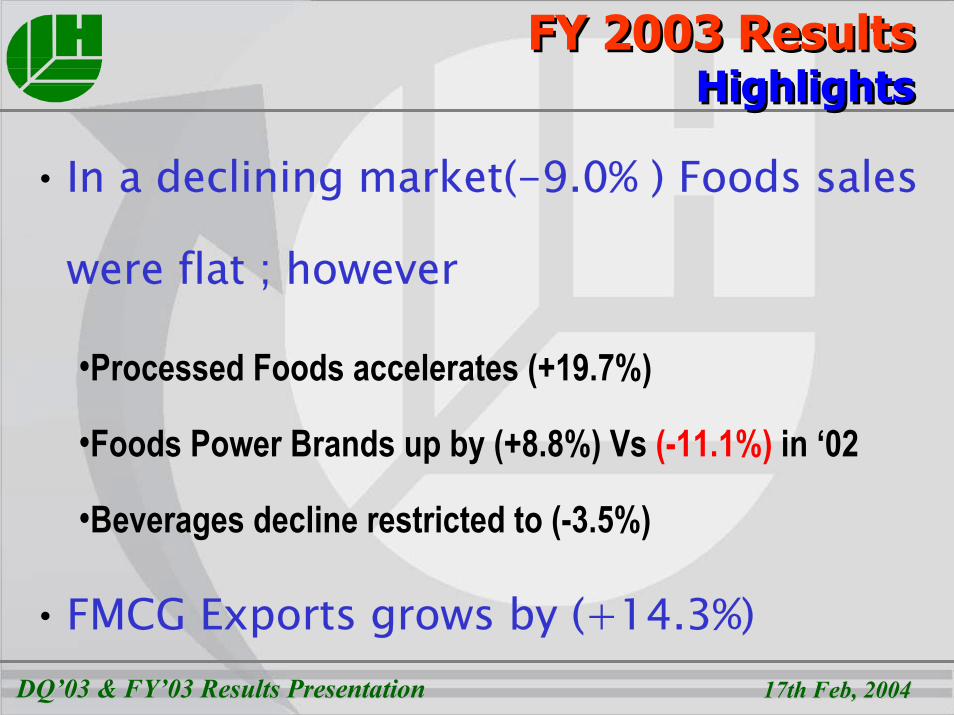
• In a declining market(-9.0% ) Foods sales
were flat ; however
•Processed Foods accelerates (+19.7%)
•Foods Power Brands up by (+8.8%) Vs (-11.1%) in ‘02
•Beverages decline restricted to (-3.5%)
•FMCG Exports grows by (+14.3%)
DQ’03 & FY’03 Results PresentationDQ’03 & FY’03 Results Presentation 17th Feb, 200417th Feb, 2004
FY 2003 ResultsHighlights
FY 2003 ResultsHighlights
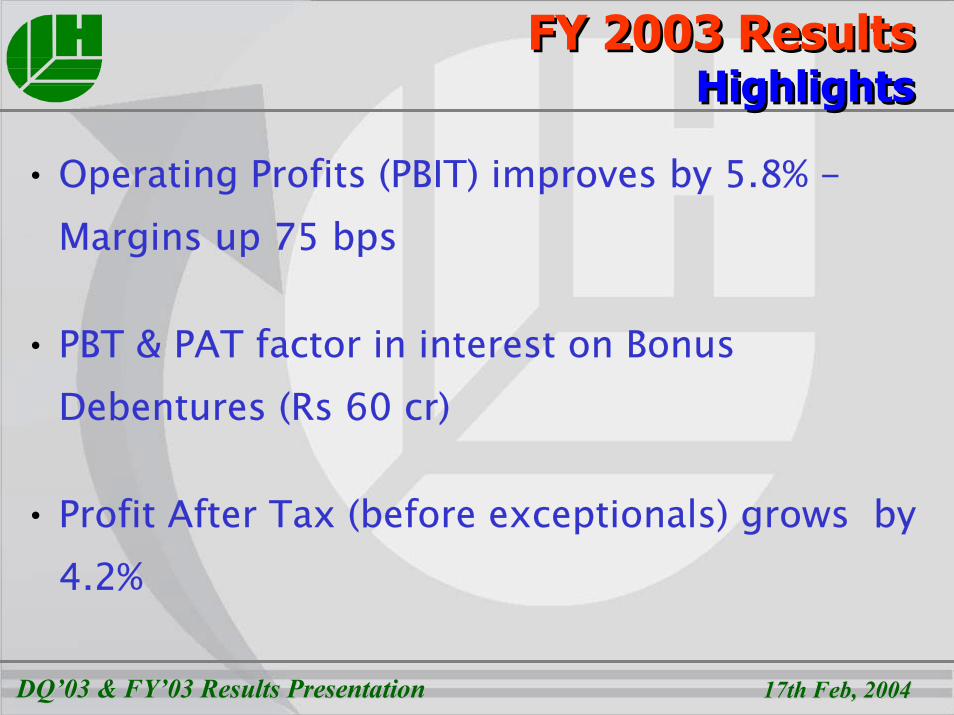
• Operating Profits (PBIT) improves by 5.8% -Margins up 75 bps
• PBT & PAT factor in interest on BonusDebentures (Rs 60 cr)
• Profit After Tax (before exceptionals) grows by4.2%

DQ’03 & FY’03 Results PresentationDQ’03 & FY’03 Results Presentation 17th Feb, 200417th Feb, 2004
HPC Power BrandsAchieving growth in the face of competition
HPC Power BrandsAchieving growth in the face of competition
* Group Basis
FAL : 20%Lifebuoy : 20% Nihar : 18%Lakme :54%
CloseUp : 10%
Sunsilk : 16%
Pears : 13% :13%P’dent Ponds: 12% Wheel : 7% Lux : 5%

DQ’03 & FY’03 Results PresentationDQ’03 & FY’03 Results Presentation 17th Feb, 200417th Feb, 2004
* Group Basis
Total Foods Power BrandsAchieving growth in the face of competition
Total Foods Power BrandsAchieving growth in the face of competition
Bru : 27%Kissan : 21% Knorr : 48%
Brooke Bond : 6% Annapurna : 12%

DQ’03 & FY’03 Results PresentationDQ’03 & FY’03 Results Presentation 17th Feb, 200417th Feb, 2004
Power BrandsMega Six - each> $ 100 mn
Power BrandsMega Six - each> $ 100 mn
* Group Basis
Brooke BondWheel Lux
Fair & Lovely RinLifebuoy

DQ’03 & FY’03 Results PresentationDQ’03 & FY’03 Results Presentation 17th Feb, 200417th Feb, 2004
Business PerformanceBusiness Performance
FinancialsFinancialsFinancials
DQ’03 HighlightsDQ’03 HighlightsDQ’03 Highlights
ContentsContents
FY’03 HighlightsFY’03 HighlightsFY’03 Highlights

DQ’03 & FY’03 Results PresentationDQ’03 & FY’03 Results Presentation 17th Feb, 200417th Feb, 2004
Soaps & DetergentsPerformance Highlights
Soaps & DetergentsPerformance Highlights
• Innovation led growth continues inPersonal wash– Lifebuoy and Pears lead; deliver double digit growth
– Lux grows and gains substantial market share
– Decline in Breeze and other brands restrict overall growth

DQ’03 & FY’03 Results PresentationDQ’03 & FY’03 Results Presentation 17th Feb, 200417th Feb, 2004
Soaps & DetergentsPerformance Highlights
Soaps & DetergentsPerformance Highlights
• Powerful competitive actions in Fabric Wash– Aggressive strategy in response to Premium Fabric Wash competition
• Strategy begins to show results• Surf Excel volumes surges : high double digit growth in DQ’03
– Wheel grows– Improved performance in Rin
– Quality investment drives Rin Supreme– Rin Shakti relaunched : Significantly improved offering

DQ’03 & FY’03 Results PresentationDQ’03 & FY’03 Results Presentation 17th Feb, 200417th Feb, 2004
Personal ProductsStrong broadbased growth
Personal ProductsStrong broadbased growth
• Across Quarters
• Across Categories
• Across Brands
• Volume LedFY'02 FY'03
Growth in Strong Double Digits 19.4%
In DQ’03
1.1
14.8
Personal ProductsPersonal ProductsGrowth%Growth%

DQ’03 & FY’03 Results PresentationDQ’03 & FY’03 Results Presentation 17th Feb, 200417th Feb, 2004
Personal ProductsStrong broadbased growth
Personal ProductsStrong broadbased growth
• Strong growth in Skin (+20.5%)
• Toothpaste grows by (+12.0%)
• Volume led (+21.5%) growth in Shampoos
• Innovation led double digit growth
in Colors (+33.6%)
FY'02 FY'031.1
14.8
Personal ProductsPersonal ProductsGrowth%Growth%
Growth in Strong Double Digits 19.4%
In DQ’03

DQ’03 & FY’03 Results PresentationDQ’03 & FY’03 Results Presentation 17th Feb, 200417th Feb, 2004
Personal ProductsAll Power Brands Surge
Personal ProductsAll Power Brands Surge
FAIR &FAIR &LOVELYLOVELY
18.6
19.9
FY'02 FY'03
LAKMELAKME
0.1
53.8
FY'02 FY'03
PONDSPONDS
1.0
11.6
FY'02 FY'03
SUNSILKSUNSILK
-15.8
15.6
FY'02 FY'03
CLINICCLINIC
-6.4
2.8
FY'02 FY'03
CLOSECLOSEUPUP
-23.9
9.6
FY'02 FY'03
PEPSODENTPEPSODENT
-4.6
12.5
FY'02 FY'03
NIHARNIHAR
7.6
17.5
FY'02 FY'03

DQ’03 & FY’03 Results PresentationDQ’03 & FY’03 Results Presentation 17th Feb, 200417th Feb, 2004
BeveragesStrategic Actions
BeveragesStrategic Actions
• Master Brand “BROOKE BOND” launched
– Brooke Bond grows by (+6%) during the year
– Low Commodity prices & competition from loose
tea continueMaster Brand growsMaster Brand grows
in 2003 in 2003
-11.0
5.7
FY'02 FY'03
Brooke Bond

DQ’03 & FY’03 Results PresentationDQ’03 & FY’03 Results Presentation 17th Feb, 200417th Feb, 2004
BeveragesStrategic Actions
BeveragesStrategic Actions
• Coffee grows by 6.2% in 2003– Instant Coffee grows by a strong 18.7%
– Bru continues double digit growth (+27.1%)
• Leveraging emerging opportunities– Exploiting ‘OOH’
– Driving Lipton equity in Ice Tea
Continued double digitContinued double digitgrowthgrowth
10.7
27.1
FY'02 FY'03
Bru

DQ’03 & FY’03 Results PresentationDQ’03 & FY’03 Results Presentation 17th Feb, 200417th Feb, 2004
Processed foodsOn Growth Path...Processed foodsOn Growth Path...
• Culinary Products on growth Path– 26.2% growth led by Kissan & Knorr
• Popular Foods grows by (+11.4%) in2003– Annapurna grows by double digits 12.4
KissanKissan
-5.4
21.3
FY'02
FY'03
KnorrKnorr
45.7
47.6
FY'02 FY'03
AnnapurnaAnnapurna
-22.7
FY'02FY'03

DQ’03 & FY’03 Results PresentationDQ’03 & FY’03 Results Presentation 17th Feb, 200417th Feb, 2004
FoodsGrowth Opportunities through Innovations
FoodsGrowth Opportunities through Innovations
“From the “From the Knorr Knorr Stable”Stable” “From the “From the Kissan Kissan Stable”Stable”
Knorr Soupy Snax
Kissan Ketchups
Kissan Jams
Kissan Bistix

DQ’03 & FY’03 Results PresentationDQ’03 & FY’03 Results Presentation 17th Feb, 200417th Feb, 2004
Growing in the face of competition
• New and attractive Price Points
• Investments in Brand quality
• Innovations
• Exploiting emerging channels

DQ’03 & FY’03 Results PresentationDQ’03 & FY’03 Results Presentation 17th Feb, 200417th Feb, 2004
Growing in the face of competition New and attractive Price Points
Rs 0.50
Rs 5
Rs 5
Rs 4 Rs 5 Rs 5Rs.5 Rs 25 Rs 2, Rs 4.50
Rs 5Rs 10Rs 20Rs 40
Rs.1.50 Rs.1 Rs.5
Rs 5
Lux Dove Lifebuoy Vaseline FAL PondsCream
Surf Excel
Rin Shakti
Rin NMB
Pepsodent Ponds DFT
Taaza
Clinic/Sunsilk
Clinic

DQ’03 & FY’03 Results PresentationDQ’03 & FY’03 Results Presentation 17th Feb, 200417th Feb, 2004
Growing in the face of competitionLow Price Competition
Sales :>$100 Mn
Sales :>$100 Mn
2420.2
FY'03
Lifebuoy Growth%
Wheel Growth%
5.8 6.7
FY'02 FY'03
Lifebuoy continues on high growth
pathFY'02
Biggest detergent
brand in India

DQ’03 & FY’03 Results PresentationDQ’03 & FY’03 Results Presentation 17th Feb, 200417th Feb, 2004
Growing in the face of competition Investments in Brand Quality
Double Whiteness -“No Mud”
Total Investment > Rs 60 cr
Superior washwithin budgets
“Improved performance & sensorials”
Lifebuoy Lux Hamam Rexona
Rin NMB
Rin Shakti Powder
Rin Shakti BarWheel Active
Wheel

DQ’03 & FY’03 Results PresentationDQ’03 & FY’03 Results Presentation 17th Feb, 200417th Feb, 2004
Growing in the face of competition Innovations
Pepsodent - Family Pack
Fair & Lovely - AntiMarks & Dark Skin
Ponds
Sunsilk - Naturals Clinic - MintLakme - Water Color
Surf Excel - 50% Water & Effort
Kissan Bistix

DQ’03 & FY’03 Results PresentationDQ’03 & FY’03 Results Presentation 17th Feb, 200417th Feb, 2004
Growing in the face of competition Exploiting emerging channels
• HLL Network• Sales increases > 4 times• Exponential growth in coverage
•Rural Initiative•Focused Distribution Infrastructure
•Project Shakti•Touching 20 mn lives
DQ’03 & FY’03 Results PresentationDQ’03 & FY’03 Results Presentation 17th Feb, 200417th Feb, 2004
Growing in the face of competitionExploiting emerging channels
• Modern Trade
– Leveraging HLL Scale & Scope
– Direct engagement
– Surging growth & Shares

DQ’03 & FY’03 Results PresentationDQ’03 & FY’03 Results Presentation 17th Feb, 200417th Feb, 2004
Business PerformanceBusiness PerformanceBusiness Performance
FinancialsFinancials
DQ’03 HighlightsDQ’03 HighlightsDQ’03 Highlights
ContentsContents
FY’03 HighlightsFY’03 HighlightsFY’03 Highlights

DQ’03 & FY’03 Results PresentationDQ’03 & FY’03 Results Presentation 17th Feb, 200417th Feb, 2004
DQ 2003 Sales SummaryDQ 2003 Sales Summary
Rs Crores DQ 2002 DQ 2003 Growth % Domestic FMCG 2119 2203 4.0
- HPC 1691 1766 4.4
- Total Foods 428 437 2.1
Exports 369 315 (14.6)
Others 41 66 63.1
CONTINUING BUSINESSES 2528 2583 2.2
Disposals / Discontinued 106 0
NET SALES 2635 2583 (1.9)

DQ’03 & FY’03 Results PresentationDQ’03 & FY’03 Results Presentation 17th Feb, 200417th Feb, 2004
DQ 2003 ResultsDQ 2003 Results
Rs Crores DQ 2002 DQ 2003 Growth %EBIT 626 632 1.0 Fin Income (net) 65 44 (32.8)
691 676 (2.2) Int on Bonus Deb -30PBT 691 646 (6.5) Tax ( incl Deferred ) -148 -131Tax adj prior year 14 48PAT ( bei ) 557 562 1.0 Net Profit 481 495 2.9

DQ’03 & FY’03 Results PresentationDQ’03 & FY’03 Results Presentation 17th Feb, 200417th Feb, 2004
Exceptional Items - DQ’03Exceptional Items - DQ’03
Exceptional Items DQ'03 Amount (Rs Cr)
Savings due to Funding of non-management 48.2pension liability by purchase of LIC annuity policy
Business Restructuring Cost:
a) Provision for Est loss on disposal of FA (45.5)
b) Compensations under VRS etc. (45.8)
Additional provision for retirement benefits mainly (62.5)
arising out of increase in annuity rates
Total Exceptional Items (Before Tax) (105.6)
Exceptional Items (Net of Tax) (67.6)

DQ’03 & FY’03 Results PresentationDQ’03 & FY’03 Results Presentation 17th Feb, 200417th Feb, 2004
Segmental Revenue Segmental Revenue
Rs Crores DQ 2003 % GrowthSoaps and Detergents 1,095 (3.0) Personal Products 688 19.7 Beverage 309 (3.0) Processed Foods 108 (44.0)
Memo : Process Foods (Cont) 108 24.0 Ice Cream 16 (8.8) Exports 315 (14.6) Others 107 Net Segment Revenue 2,630 (1.1)

DQ’03 & FY’03 Results PresentationDQ’03 & FY’03 Results Presentation 17th Feb, 200417th Feb, 2004
Segmental Results Segmental Results
Rs Crores DQ'03 % GrowthSoaps and Detergents 324 (2.2) Personal Products 294 15.2 Beverage 60 (14.3) Processed Foods 4 Ice Cream (5) 45.7 Exports 24 (38.0) Others (5) --Total 695 1.6 Less : Interest (32) --Add : Unallocable net income (17) --Net Segment Result 646 (6.5)

DQ’03 & FY’03 Results PresentationDQ’03 & FY’03 Results Presentation 17th Feb, 200417th Feb, 2004
Segment MarginsSegment Margins
29.4
44.3
22.0
10.4
25.529.6
42.7
19.5
7.5
26.4
-3.44.1
-10-505
1015202530354045
Detergents PP Beverages Foods Exports Overall
DQ '02 DQ '03

DQ’03 & FY’03 Results PresentationDQ’03 & FY’03 Results Presentation 17th Feb, 200417th Feb, 2004
FY 2003 SalesSummary
FY 2003 SalesSummary
Rs Crores FY 2002 FY 2003 Growth % Domestic FMCG 8132 8427 3.6
- HPC 6437 6734 4.6
- Total Foods 1695 1693 (0.1)
Exports 1221 1246 2.1
Others 157 246 56.9
CONTINUING BUSINESSES 9510 9920 4.3
Disposals / Discontinued 445 219 (50.8)
NET SALES 9955 10138 1.8

DQ’03 & FY’03 Results PresentationDQ’03 & FY’03 Results Presentation 17th Feb, 200417th Feb, 2004
FY 2003Results
FY 2003Results
Rs Crores FY 2002 FY 2003 Growth %EBIT 1926 2037 5.8 Fin Income (net) 271 268 (1.4)
2197 2305 4.9 Int on Bonus Deb -60PBT 2197 2245 2.2 Tax (Curr + Def) -480 -488Tax (Prior Period) 14 48PAT ( bei ) 1731 1804 4.2 Net Profit 1770 1772 0.1

DQ’03 & FY’03 Results PresentationDQ’03 & FY’03 Results Presentation 17th Feb, 200417th Feb, 2004
Exceptional Items - FY’03Exceptional Items - FY’03
Exceptional Items FY'03 Amount (Rs Cr)
Total Exceptional Items (Before Tax) (77.1)
Exceptional Items (Net of Tax) (32.6)
Edible Oils and Fats Disposal Profit 56.2
Business Restructuring Cost:a) Provision for Est loss on disposal of FA (54.2) b) Compensations under VRS etc. (45.8)
Additional provision for retirement benefits mainly arising (62.5) out of increase in annuity rates
c) Mushroom Disposal. (19.0)
Savings due to Funding of non-management 48.2pension liability by purchase of LIC annuity policy

DQ’03 & FY’03 Results PresentationDQ’03 & FY’03 Results Presentation 17th Feb, 200417th Feb, 2004
Segmental Revenue Segmental Revenue
Rs Crores FY '03 % Grow thSoaps and Detergents 4,379 (0.1) Personal Products 2,410 15.0 Beverage 1,184 (3.9) Processed Foods 602 (15.7)
Memo: Processed Foods (Cont) 385 18.5 Ice Cream 93 (12.9) Exports 1,246 (0.8) Others 367 Net Segment Revenue 10,245 2.1

DQ’03 & FY’03 Results PresentationDQ’03 & FY’03 Results Presentation 17th Feb, 200417th Feb, 2004
Segmental Results Segmental Results
Rs Crores FY '03 % GrowthSoaps and Detergents 1,088 (4.1) Personal Products 884 16.3 Beverage 226 (7.7) Processed Foods 1 101.9 Ice Cream 0 102.7 Exports 62 (35.8) Others (15) Total 2,245 2.5 Less : Interest (67) --Add : Unallocable net income 67 --Net Segment Result 2,245 2.2

DQ’03 & FY’03 Results PresentationDQ’03 & FY’03 Results Presentation 17th Feb, 200417th Feb, 2004
Segment MarginsSegment Margins
25.9
36.3
19.8
7.6
21.624.8
36.7
19.0
4.9
21.8
-4.0 0.1
-10-505
1015202530354045
Detergents PP Beverages Foods Exports Overall
FY '02 FY '03

DQ’03 & FY’03 Results PresentationDQ’03 & FY’03 Results Presentation 17th Feb, 200417th Feb, 2004
Cash generation continuesto be strong
Cash generation continuesto be strong
Rs Crores Year 2003 Year 2002Business Operation 2151 2062WC Change (126) (44)Treasury income 267 272
Total Cash Generated 2292 2290
Capex (188) (156)Tax paid (407) (441)Total Cash Deployed (655) (597)
Surplus Cash Generated 1637 1693
Interest on BD (60)
Cash Flow ‘03:

DQ’03 & FY’03 Results PresentationDQ’03 & FY’03 Results Presentation 17th Feb, 200417th Feb, 2004
Rewarding the shareholder Rewarding the shareholder
Dividend Per Share of Re 1 2002 2003Interim 2.500 2.500Final 2.659 3.000
Total 5.159 5.500Distribution Tax 0.341 0.705
Total Payout 5.500 6.205
DQ’03 & FY’03 Results PresentationDQ’03 & FY’03 Results Presentation 17th Feb, 200417th Feb, 2004
In Summary...In Summary...
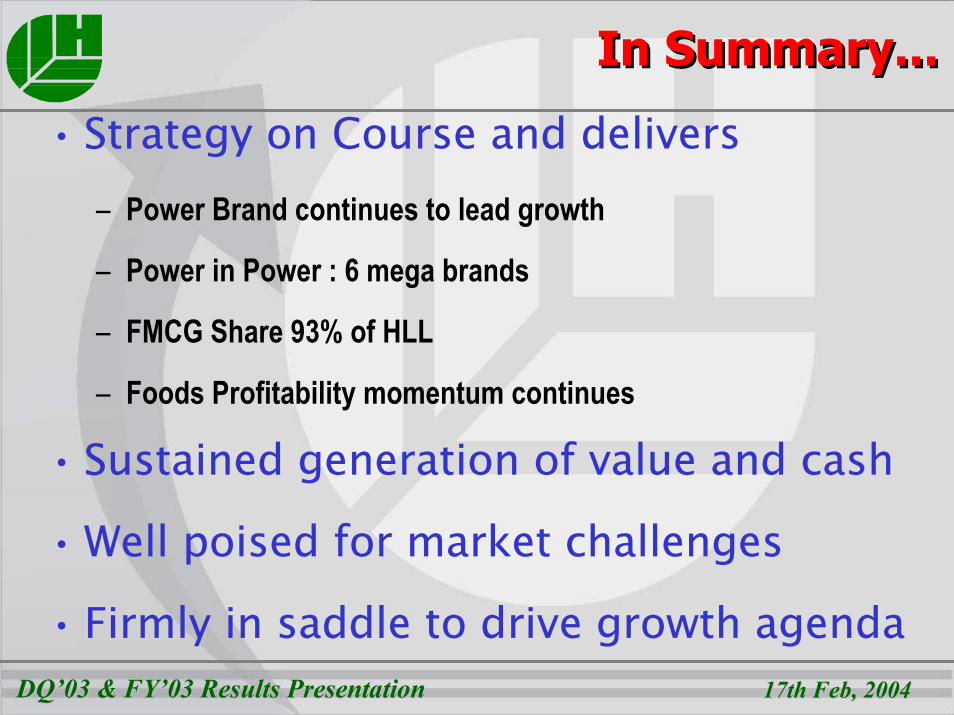
• Strategy on Course and delivers– Power Brand continues to lead growth
– Power in Power : 6 mega brands
– FMCG Share 93% of HLL
– Foods Profitability momentum continues
• Sustained generation of value and cash
• Well poised for market challenges
• Firmly in saddle to drive growth agenda

DQ’03 & FY’03 Results PresentationDQ’03 & FY’03 Results Presentation 17th Feb, 200417th Feb, 2004
Thank You


