Financial Results for 1Q of Fiscal Year Ending March 31, 2017 This is an English translation of Japanese presentation materials prepared in connection with the disclosure of the financial results of Monex Group, Inc. It includes information derived from the consolidated financial statements of Monex Group, Inc. which are prepared in accordance with International Financial Reporting Standards (“IFRSs”). This material is not intended to recommend or conduct solicitation for any product or service, etc. <Forward-looking Statements> This presentation material contains forward-looking statements that are based on our current expectations, assumptions, estimates and projections about our industry and us. These forward-looking statements are subject to various risks and uncertainties. Generally, these forward-looking statements can be identified by the use of terms such as "may" "will" "expect" "anticipate" "estimate" "plan" and other similar words. These statements discuss future expectations, identify strategies, contain projections of results of operations or of our financial condition and state other "forward-looking" information. Our operations are subject to risks, uncertainties and other factors that could cause our actual results to differ materially from those contained in any forward-looking statement. July 28, 2016 (TSE 1st Section: 8698)
Transcript
Financial Results for 1Q of Fiscal Year Ending March 31, 2017
This is an English translation of Japanese presentation materials prepared in connection with the disclosure of the financial results of Monex Group, Inc. It includes information derived from the consolidated financial statements of Monex Group, Inc. which are prepared in accordance with International Financial Reporting Standards (“IFRSs”). This material is not intended to recommend or conduct solicitation for any product or service, etc.
<Forward-looking Statements> This presentation material contains forward-looking statements that are based on our current expectations, assumptions, estimates and projections about our industry and us. These forward-looking statements are subject to various risks and uncertainties. Generally, these forward-looking statements can be identified by the use of terms such as "may" "will" "expect" "anticipate" "estimate" "plan" and other similar words. These statements discuss future expectations, identify strategies, contain projections of results of operations or of our financial condition and state other "forward-looking" information. Our operations are subject to risks, uncertainties and other factors that could cause our actual results to differ materially from those contained in any forward-looking statement.
July 28, 2016 (TSE 1st Section: 8698)
Our Business Principles
"MONEX" stands for the future of finance, one step advanced from "MONEY"
The Monex Group is aspiring to empower traders and investors worldwide with best of breed technology, education, service and financial professionalism to provide access to top financial markets globally
To achieve this we are committed to: - Celebrating the diversity of each and every one of our customers and employees; - Driving the future of technology and first class financial professionalism that
empowers traders and investors; and - Creating new value to contribute to all stakeholders
1
Table of Contents
Our Business Principles p. 1 Table of Contents p. 2
I. Highlights p.3 - p.7 II. Consolidated Performance p.8 - p.22 III. Business Update p.23 - p.29 IV. Mid- & Long-Term Strategy “Global Vision” p.30 - p.33 V. Topics p.34 - p.37 Appendix. Group Overview
p.38 -
p.46
2
I. Highlights II. Consolidated Performance III. Business Update IV. Mid- & Long-Term Strategy “Global Vision” V. Topics
Appendix. Group Overview
3
4
Broadening our retail investor base
Monex-Saison-Vanguard Investment Partners’ wrap asset management service scheduled to be launched this fall. Aim to increase assets under management in the mid- and long-term with the coming era of large inheritances.
Management’s recognition of the current situation
Launching our active trader
business
Launched the TradeStation trading platform in Japan in March 2016. First-ever functions in Japan have been well received and enabled us to acquire a new customer base different from our existing one. Full-scale marketing activities scheduled to begin in the 2Q of FYE 2017.
Internalization of backbone brokerage
system
As well as to reduce costs, using internal technologies to develop original products and services that incorporate customers’ point of view. The final launch of the new system was changed from fall 2016 to early 2017. Migration to the backbone system for futures and options completed in mid-July as scheduled.
Enhancement of profitability in US
segment
In response to decreased trading volume in the US market, reduced 40 headcounts in April 2016 and more than 60 headcounts on July 27, 2016.
Facing a decline in retail investors’ risk appetite
Completing globalization and system internalization initiatives while Building a profitable structure to cope with environmental changes
9,467 10,607
12,803 12,331 12,960 13,490 11,799 11,393 10,635
562 -866 2,185 1,613 1,733 1,816
-348 355 261
-5,000
0
5,000
10,000
15,000
2015/31Q
2015/32Q
2015/33Q
2015/34Q
2016/31Q
2016/32Q
2016/33Q
2016/34Q
2017/31Q
Total operating revenue after deducting financial expensesQuarterly profit attributable to owners of the Company
5
■Consolidated performance of 1Q FYE Mar. 2017 Maintained profitability despite decreased trading volume in the market
◆Total operating revenue after deducting financial expenses and quarterly profit attributable to owners of the Company
(JPY million)
Consolidated
Japan
Highlights 1Q FYE Mar. 2017 (3 months) (1)
6,246 7,129 8,837
8,198 8,592 8,633 7,495 7,103 6,790
975 1,439 2,447 1,894 1,811 1,761 -378 698 673
-5,000
0
5,000
10,000
15,000
2015/31Q
2015/32Q
2015/33Q
2015/34Q
2016/31Q
2016/32Q
2016/33Q
2016/34Q
2017/31Q
Total operating revenue after deducting financial expenses and cost of salesQuarterly profit attributable to owners of the Company
Total operating revenue after deducting financial expenses and cost of salesQuarterly profit attributable to owners of the Company
6
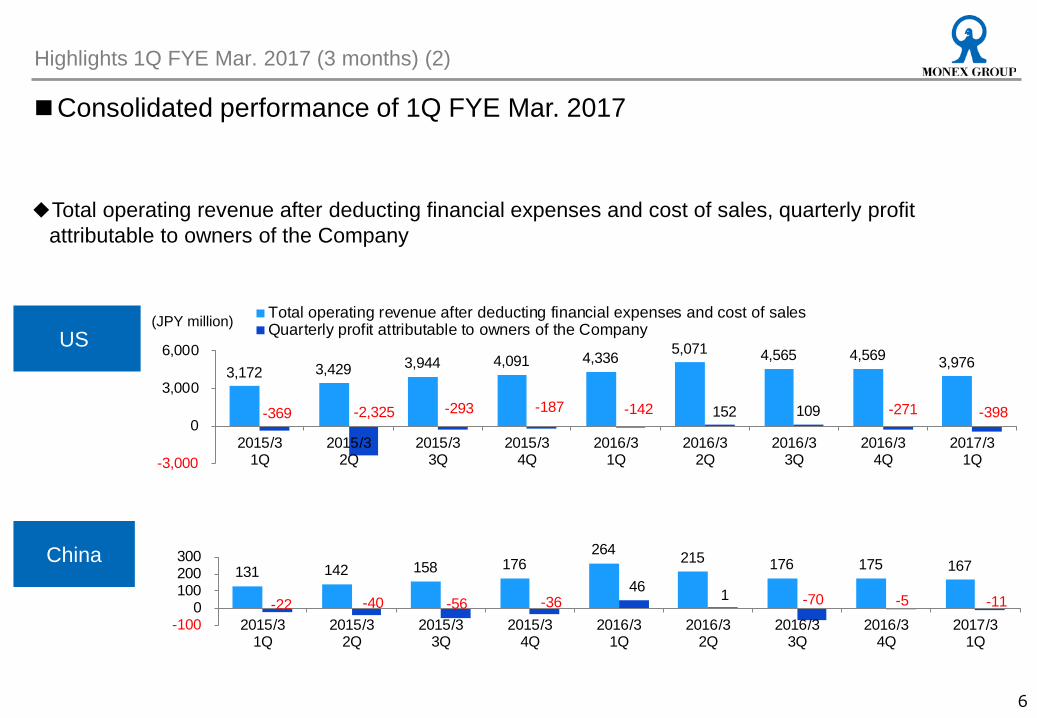
■Consolidated performance of 1Q FYE Mar. 2017
◆Total operating revenue after deducting financial expenses and cost of sales, quarterly profit attributable to owners of the Company
(JPY million) US
China
Highlights 1Q FYE Mar. 2017 (3 months) (2)
131 142 158 176 264 215 176 175 167
-22 -40 -56 -36 46 1 -70 -5 -11
-1000
100200300
2015/31Q
2015/32Q
2015/33Q
2015/34Q
2016/31Q
2016/32Q
2016/33Q
2016/34Q
2017/31Q
7
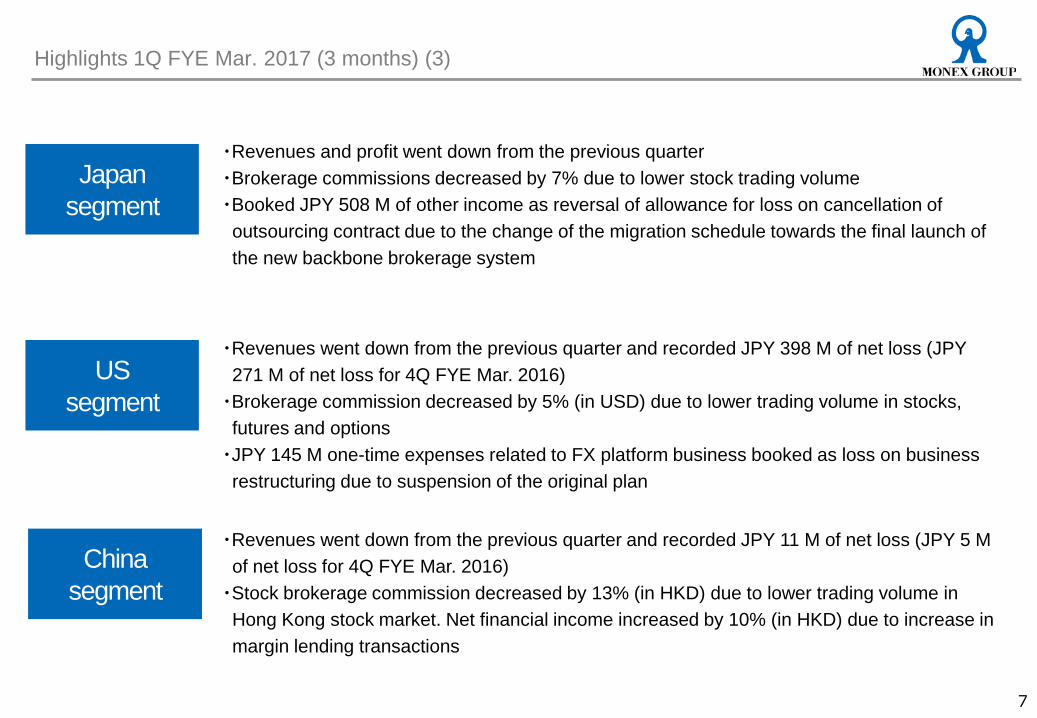
Japan segment
US segment
China segment
Highlights 1Q FYE Mar. 2017 (3 months) (3)
・Revenues and profit went down from the previous quarter ・Brokerage commissions decreased by 7% due to lower stock trading volume ・Booked JPY 508 M of other income as reversal of allowance for loss on cancellation of outsourcing contract due to the change of the migration schedule towards the final launch of the new backbone brokerage system
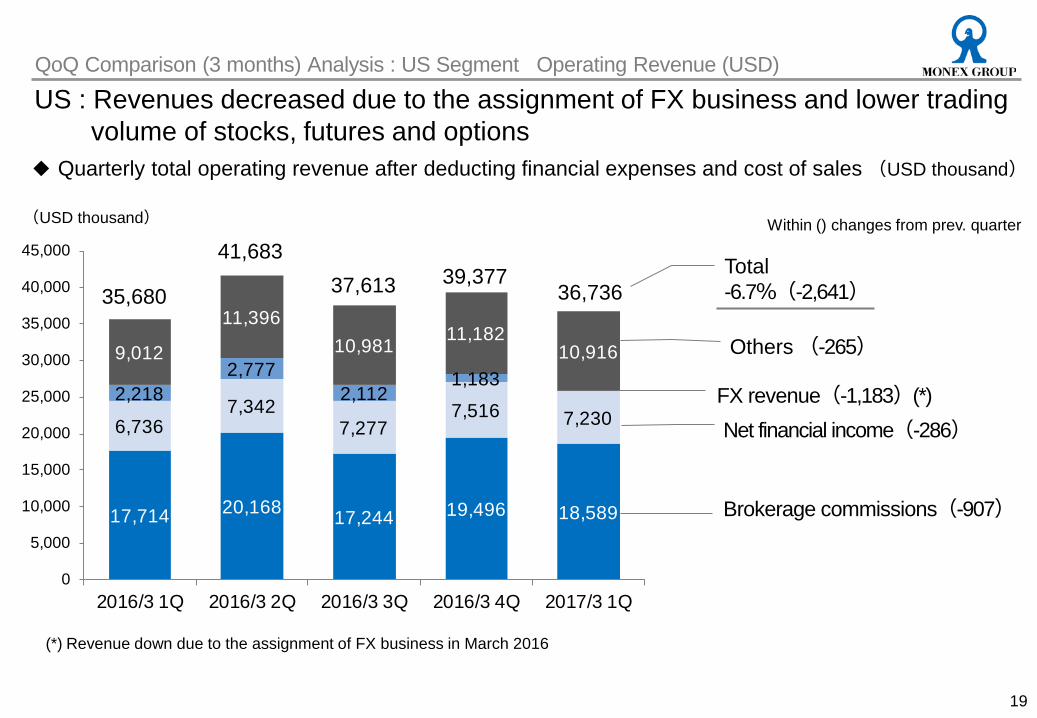
・Revenues went down from the previous quarter and recorded JPY 398 M of net loss (JPY 271 M of net loss for 4Q FYE Mar. 2016)
・Brokerage commission decreased by 5% (in USD) due to lower trading volume in stocks, futures and options
・JPY 145 M one-time expenses related to FX platform business booked as loss on business restructuring due to suspension of the original plan
・Revenues went down from the previous quarter and recorded JPY 11 M of net loss (JPY 5 M of net loss for 4Q FYE Mar. 2016)
・Stock brokerage commission decreased by 13% (in HKD) due to lower trading volume in Hong Kong stock market. Net financial income increased by 10% (in HKD) due to increase in margin lending transactions
8
I. Highlights II. Consolidated Performance III. Business Update IV. Mid- & Long-Term Strategy “Global Vision”
V. Topics
Appendix. Group Overview
9
1Q FYE Mar. 2016 (Apr. 2015 - Jun. 2015)
1Q FYE Mar. 2017 (Apr. 2016 - Jun. 2016)
Variance Change (%) Note
Total operating revenue after deducting financial expenses 12,960 10,635 -2,325 -17.9%
Analysis of Japan segment: P11 Analysis of US segment (USD): P13
SG&A 10,517 10,118 -399 -3.8% Analysis of Japan segment: P12 Analysis of US segment (USD): P14
The amount equivalent to operating income 2,443 516 -1,926 -78.9%
Other income / expenses (net) 58 39 -19 -32.6%
2017/3 Other income: JPY 508M of reversal of
allowance for loss on cancellation of outsourcing contract
Other expenses: JPY 145M of loss on FX business restructuring in US
Quarterly profit before income taxes 2,501 556 -1,945 -77.8%
Quarterly profit attributable to owners of the Company 1,733 261 -1,471 -84.9%
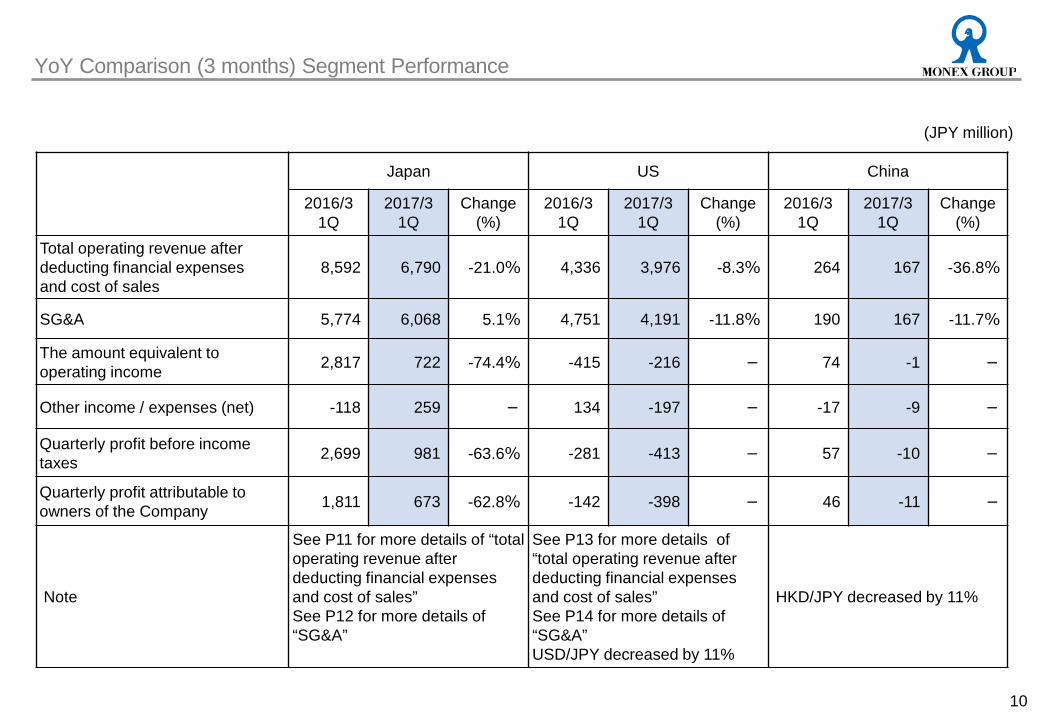
The amount equivalent to operating income 2,817 722 -74.4% -415 -216 - 74 -1 -
Other income / expenses (net) -118 259 - 134 -197 - -17 -9 -
Quarterly profit before income taxes 2,699 981 -63.6% -281 -413 - 57 -10 -
Quarterly profit attributable to owners of the Company 1,811 673 -62.8% -142 -398 - 46 -11 -
Note
See P11 for more details of “total operating revenue after deducting financial expenses and cost of sales” See P12 for more details of “SG&A”
See P13 for more details of “total operating revenue after deducting financial expenses and cost of sales” See P14 for more details of “SG&A” USD/JPY decreased by 11%
HKD/JPY decreased by 11%
YoY Comparison (3 months) Segment Performance
(JPY million)
4,4883,274
1,607
1,439
1,583
1,348
914
728
0
1,000
2,000
3,000
4,000
5,000
6,000
7,000
8,000
9,000
2016/3 1Q 2017/3 1Q
11
8,592
Brokerage commissions(-1,213)
Net financial income (-168)
FX & fixed income(-235)
Others(-185)
Total -21.0%(-1,802)
YoY Comparison (3 months) Analysis: Japan Segment Operating Revenue
Japan:Revenues decreased due to lower stock trading volume
◆ Total operating revenue after deducting financial expenses and cost of sales (compared to Apr. 2015 – Jun. 2015) (JPY million)
(JPY million)
6,790
Within () changes from FYE Mar.2016
2,736 3,317
1,0501,002605480588462427 339369 467
0
1,000
2,000
3,000
4,000
5,000
6,000
2016/3 1Q 2017/3 1Q
12
5,774 6,068
YoY Comparison (3 months) Analysis: Japan Segment SG&A
Japan : System related expenses increased due to parallel operation of new / old backbone brokerage systems
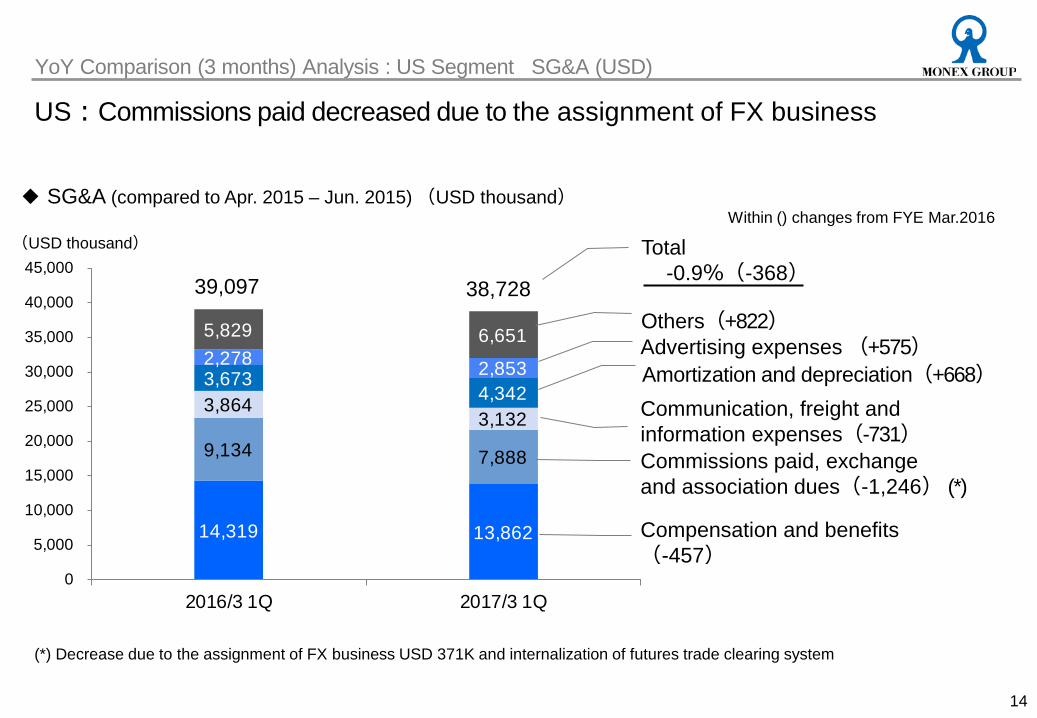
US:Commissions paid decreased due to the assignment of FX business
Total -0.9%(-368)
Commissions paid, exchange and association dues(-1,246) (*)
Others(+822)
Compensation and benefits (-457)
Amortization and depreciation(+668) Communication, freight and information expenses(-731)
Advertising expenses (+575)
Within () changes from FYE Mar.2016
(*) Decrease due to the assignment of FX business USD 371K and internalization of futures trade clearing system
15
(JPY million)
4Q FYE Mar. 2016 (Jan. - Mar. 2016)
1Q FYE Mar. 2017 (Apr. - Jun. 2016) Variance
Change (%)
Note
Total operating revenue after deducting financial expenses 11,393 10,635 -759 -6.7%
Analysis of Japan segment: P17 Analysis of US segment (USD): P19
SG&A 10,523 10,118 -405 -3.9% Analysis of Japan segment: P18 Analysis of US segment (USD): P20
The amount equivalent to operating income 870 516 -354 -40.6%
Other income / expenses (net) -386 39 425 -
Other income 1Q: Reversal of allowance for loss on cancellation of outsourcing contract JPY 508M Other expenses 4Q: Loss on the cancellation of an outsource contract for JPY 48M 4Q: Loss on FX business restructuring in US JPY 132M 1Q: Loss on FX business restructuring in US JPY 145M
Quarterly profit before income taxes
484 556 72 14.8%
Quarterly profit attributable to owners of the Company 355 261 -93 -26.3%
The amount equivalent to operating income 1,229 722 -41.2% -172 -216 - 4 -1 -
Other income / expenses (net) -63 259 - -399 -197 - -19 -9 -
Quarterly profit before income taxes 1,165 981 -15.8% -570 -413 - -15 -10 -
Quarterly profit attributable to owners of the Company 698 673 -3.6% -271 -398 - -5 -11 -
Note
See P17 for more details of “total operating revenue after deducting financial expenses and cost of sales”. See P18 for more details of “SG&A”
See P19 for more details of “total operating revenue after deducting financial expenses and cost of sales”. See P20 for more details of “SG&A” USD/JPY decreased by 10%
Major assets: Assets related to financial instruments trading business JPY 677.7B
Major liabilities: Liabilities related to financial instruments trading business JPY 769.6B Cash and cash equivalents
JPY 84.9B
21
Others JPY 45.6B
Others JPY 12.5B
The difference between “Net capital” and “Non-current assets” is the source of funds for investments and shareholders’ return
◆The JPY 26.2B difference between Net capital (JPY 83.3B) and Non-current assets (JPY 57.1B) is the source of funds for the following:
1. To comply with capital adequacy ratio regulations for
securities subsidiaries in Japan and overseas 2. Internal reserve for investments in future businesses 3. Shareholders’ return (dividends + share buyback)
9.0
2.04.0 3.0 1.0 1.1
11.0
1.2
7.05.0
15.0
29.0
6.5
2.0
3.0
2.01.0 3.0
7.0
7.0
2.6
16.6%25.8%
71.3%78.0%
48.3%
77.1%
259.9%
31.5%
103.3%
67.5%
109.4%
0%
50%
100%
150%
200%
250%
300%
0
5
10
15
20
25
30
FYEMar.2005
FYEMar.2006
FYEMar.2007
FYEMar.2008
FYEMar.2009
FYEMar.2010
FYEMar.2011
FYEMar.2012
FYEMar.2013
FYEMar.2014
FYEMar.2015
FYEMar.2016
Interim dividends per share(left)Year-end dividends per share(left)Total return ratio(right)
Aim to achieve a total return ratio (*1) of 75% on a multi-year basis and an ROE 15% over the mid- and long-term
(*1) Total return ratio = (dividend paid + amount of share buyback) /profit attributable to owners of the Company (*2) FYE Mar. 2009 does not have % since the result was negative (*3) Dividend per share has been adjusted reflecting stock split (*4) Acquired own shares: JPY 2.0B in Feb. 2008, 3.1B in Jun. 2011, 5.5B in May 2013, 1.16B in Jul.-Aug.2015, 1.0B in May-Jun. 2016
(yen)
22
Shareholders’ Return
◆Dividend per share and total return ratio
(*2)
27.1%
38.1%
21.4%
15.5%
-5.0%
7.1%
2.9%
2.0%5.0%
12.9%
4.2% 4.1%
-10%
-5%
0%
5%
10%
15%
20%
25%
30%
35%
40%
FYEMar.2005
FYEMar.2006
FYEMar.2007
FYEMar.2008
FYEMar.2009
FYEMar.2010
FYEMar.2011
FYEMar.2012
FYEMar.2013
FYEMar.2014
FYEMar.2015
FYEMar.2016
◆Return on Equity ratio
23
I. Highlights II. Consolidated Performance III. Business Update IV. Mid- & Long-Term Strategy “Global Vision” V. Topics Appendix. Group Overview
24
Business Update Japan Segment (1) “TradeStation” trading platform in Japan
■Launched “TradeStation” trading platform in Japan in March 2016. Full-scale marketing to be scheduled from 2Q FYE 2017 - Acquiring new customer base different from our existing customer base. Activating dormant accounts
■ Advantages of “TradeStation” trading platform in Japan
- First-ever function in Japan such as holding data for back-test function : one-minute chart data since 2010 and the tick chart data for two years
- Competitive commission table: JPY 3,500 for every 10 million yen in trading value ◆Commission for every 10 million yen of trading value among major online brokers*
Broker’s name Commission (excluding tax) Monex, Inc. (Use of “TradeStation”) JPY 3,500 SBI Securities JPY 4,439 Matsui Securities JPY 10,000 Rakuten Securities JPY 10,000
* As of May 31, 2016. researched by Monex, Inc. Major online brokers refer to SBI Securities, Kabu.com Securities, Matsui Securities, Rakuten Securities and Monex, Inc. Kabu.com Securities does not adopt daily fixed amount commission table
- Unique customer support system for “TradeStation” users Providing promotion, customer support and Q&A site, arranged separately from the Monex, Inc. website Dedicated sales & support team actively engaged with existing and potential customers
Developing an active trader market which has room for growth even in the sluggish market
Monex4.9
SBI 13.4
Rakuten 13.2
Matsui18.8
Kabu.com14.8
0
2
4
6
8
10
0 5 10 15 20
25
Business Update Japan Segment (2) Launching our active trader business
Aim to expand the customers’ assets as well as expand the commission share
◆Customers’ assets and trading turnover* of major online brokers** (FYE Mar. 2016 / at Mar. 31, 2016)
(turnover)
Initiative2: Expanding trading turnover Acquiring active traders by “TradeStation” trading platform in Japan
Initiative1: Expanding customers’ assets - Improving customer satisfaction with enhanced information and education - Offering wrap asset management service of Monex-Saison-Vanguard
* Stock trading value / customer asset ** Major online brokers refer to SBI Securities, Kabu.com Securities, Matsui Securities, Rakuten Securities and Monex, Inc.
Daily trade value of individual investor = about 1 trillion yen
Individual investors with over 100 trade/month, “Traders”, are about 40%=400 billion yen
Aim to acquire 25% of active trader market share or entire individual investor share 10%
2.2 2.31.9 2.0 1.7
0.0
1.0
2.0
3.0
Monex SBI Kabu.com Matsui Rakuten
Monex
SBIRakuten
Matsui
Kabu.com
0%
20%
40%
60%
80%
0 1,000,000 2,000,000 3,000,000 4,000,000
26
◆Active account ratio (as of Mar. 31, 2016)
(total accounts)
Business Update Japan Segment (3) Monex, Inc.’s customer segment
◆Stock brokerage commission share (4Q FYE Mar. 2007 - 4Q FYE Mar. 2016)
(active account ratio)
Higher active accounts ratio and higher customer assets per account compared with peers Lower margin trading ratio out of stock trading value and lower brokerage commission revenue compared with peers Expand revenue by acquiring trader-type customers while retaining our current customer base
◆Margin trading ratio out of stock trading value (4Q FYE Mar. 2016)
◆Customer assets per account (as of Mar. 31, 2016) (JPY million)
62%
63% 53% 51%
57%
(Source) Kinzai Institute for Financial Affairs, Inc.
■B2B business ・Offering FX platform to a monoline FX company was suspended due to the change of the strategy ・Preparing to add a business of TradeStation becoming an introducing broker to another broker for
customers outside of the US
■Implementation of further cost reduction ・In addition to 40 headcounts reduction in April 2016, implemented more than 60 headcounts
reduction and restructuring on July 27, 2016 ・April reduction has the effect of $4m annualized cash saving and P/L improvement of $2.1m for
FYE 2017. July reduction and restructuring will bring additional $9.4m annualized cash saving and improve P/L of FYE 2017 by $2.3m
■Approaching new customer base ・Planning a new pricing model and services in order to increase the number of accounts and
customers’ assets in custody by expanding customer base, not limited to active traders
Implement additional improvement plans to cope with tougher market environment
■ Net financial income improved by interest swap and reallocation of customers’ deposit ◆Net interest income (*2) and US Federal Fund rate ◆Customers’ assets in custody
(%) (USD million) (USD million) Increase in customers’ assets in custody
(*2) excluding income from margin trading and stock lending (*1) effect of decrease in assets for prime broker business
(*1)
■ Increase in active accounts and volatility contribute to the revenues 1pt increase in VIX will bring additional USD 1.7~2.9M revenue per year (2.9M based on a regression analysis of commission data during Jan. 2009- Jun. 2016 and 1.7M based on commission data during Jul. 2011- Jun. 2016)
◆VIX and commission ◆Number of active accounts (excl. FX accounts) (accounts)
Active accounts steadily increase as revenue base (7-year annual growth rate: 7%)
(USD thousand)
Significant improvement of net interest income
(*3)
(*3) annualized by multiplying 4 to the 1Q figure
(*4) annualized by multiplying 4 to the 1Q figure
(*4)
525
286 206 154 131
0
500
1,000
2016/31Q
2016/32Q
2016/33Q
2016/34Q
2017/31Q
29
Business Update China Segment
■ Quarterly Financial Results of Monex Boom Securities (H.K.) - Stock trading value in1Q (3 months) decreased by 15%(in H.K.). Brokerage commission revenue decreased by 13% - The balance of margin lending increased by 9%. Net financial income increased by 10%
◆Quarterly stock trading value of Monex Boom Securities (in Hong Kong Stock Exchange)
◆ Quarterly profit attributable to owners of Monex Boom Securities Group
■ Keep providing TradeStation licensed a trading platform with Guosen, a major PRC broker - Started on Sep. 2014, revenue recognized in the US segment
■ Continue initiative for Joint venture in mainland China - Company name: Cherry Technology Co., Ltd in Hangzhou, PRC - Data of the incorporation : Feb. 2015 - Approx. JPY 300 M investment
(USD million)
Continuing the strategy to create a business opportunity while keeping a good balance with the risks in China
4,085
1,096-1,569
1,032-224
-2,000
-1,000
0
1,000
2,000
3,000
4,000
5,000
1Q of FYEMar. 2016
2Q of FYEMar. 2016
3Q of FYEMar. 2016
4Q of FYEMar. 2016
1Q of FYEMar. 2017
(HKD thousand)
30
I. Highlights II. Consolidated Performance III. Business Update IV. Mid- & Long-Term Strategy “Global Vision” V. Topics Appendix. Group Overview
Measures Progress and Achievements Launching a trading platform for Japanese active traders developed by TradeStation. Aim to increase brokerage commission.
Launched in Mar. 2016 Full-scale marketing to be scheduled from 2Q FYE 2017
Expanding B2B businesses Two projects have already generated revenue (recognized in U.S. segment). In-house development of the backbone system in Japan segment has B2B opportunities
Measures Progress and Achievements Cost reduction by integration of trading tools in Japan segment Cost reduction of information expenses by integration of information services in Japan segment Cost reduction by FX liquidity integration and so forth
Achieved around JPY 1.3B (annualized) reduction in total
System related cost reduction by in-house system development and in-house operations of backbone brokerage system(*3)
Cost will be reduced from FYE Mar. 2018
Mid- & Long-Term Strategy “Global Vision”
31
■ Mid- and long-term revenue growth
■ Fixed-type cost (*1) reductions -Aim to reduce JPY 2.3B a year by FYE Mar. 2018 compared to the basis for comparison (*2)
(*1) Fixed-type costs: the sum of (a) communication, freight & information expenses, (b) compensation & benefits, (c) rental & maintenance, (d) data processing & office supplies and (e) amortization & depreciation
(*2) Basis for comparison: (actual fixed-type cost figure of 4Q FYE Mar. 2013) multiplied by 4. Aim to reduce JPY 2.3B a year in fixed-type costs by FYE Mar. 2018 compared to the basis for comparison (JPY 24.5B, -9.4%). Fixed-type costs in or after FYE March 2014 compared to the baseline do not include those arising from projects after Apr. 2013, e.g. system improvement to comply with new regulations. Launch of a new Japanese equity trading platform is categorized in a revenue increase project and is out of the scope of the JPY 2.3B cost reduction plan
(*3) System related costs = Rent and maintenance + Data processing and Office supplies + Amortization and depreciation
“Mid- and long-term revenue growth” and “Fixed-type cost reduction” by shifting system developments from outsourcing to in-house
Launched in 2016/3. Full-scale marketing to be scheduled from 2Q of FYE 2017
May 2014 Completed test connection of a new Japanese equity platform to the internal system R
even
ue G
row
th
Cos
t Red
uctio
n
FYE Mar. 2013 FYE Mar. 2014 FYE Mar. 2015 FYE Mar. 2016 FYE Mar. 2017 FYE Mar. 2018
Internalize trading information service
Internally develop and operate backbone brokerage system (JP)
Jan. 2014 Started bond trading and NISA in an internal system Complete transition
Aug. 2012 Launched equity trading accounts “Rakuraku” with a next-generation system
Sep. 2014 Upgraded front-end system in Japan
Reduced fixed-type costs through HQ relocation, internalization of account control operation in Japan by FYE Mar. 2013
System-related assets peak out at FYE Mar. 2017 getting lower from FYE Mar. 2018.
(JPY million)
Investment phase under Global Vision Revenue and profit growth phase * Software, Software in progress and equipment and fixtures
*
34
I. Highlights II. Consolidated Performance III. Business Update IV. Mid- & Long-Term Strategy “Global Vision” V. Topics Appendix. Group Overview
Adoption of “company with three committees” structure - Highly effective executive management monitoring system - Adopted “company with committees” structure in June 2013 - Each of the three committees is chaired by an independent & outside director Directors with various backgrounds
- Seven out of eleven directors qualify as “independent & outside” directors and all independent & outside directors have managed companies - Appointed a lead outside director. Actively exchanges opinions at meetings led by the lead outside director and
composed mainly by independent & outside directors - Various backgrounds: Management experience (current/former CEOs of listed companies or global companies), Expertise
(CPA, lawyer), Business experience (finance, IT, global business), Culture & society (gender, country of residence, nationality)
35
Establish global-standard corporate governance practices and emphasis on dialogue with retail/institutional investors
Fair disclosure and dialogue for shareholders and investors - Timely and fair information disclosure both in Japanese and English - Active dialogue with shareholders: CEO holds quarterly presentation sessions for retail shareholders - Annual general meeting of shareholders is held on weekend so that retail shareholders can attend the meeting (Reference)
12th ordinary general meeting of shareholders (June 25, 2016) Attendance of shareholders: 830 (record-high)
Corporate Governance
By utilizing FinTech, implement a customized PDCA cycle of asset management to satisfy each customer’s needs
Asset management services to capture the shift from saving to investing and the flow from large inheritances.
36
Investment ratio 51.01%
Financial Institutions, etc. (Banks, Stock brokers,
Other financial institutions)
and other fields
Providing the BtoBtoC business of wrap asset management services
The first joint venture bearing the Vanguard name
Minimum Investment
Value
JPY 10K
Total Cost less than 1%
Discretionary investment
management fee + Trust fee
+ other cost
Broadening the retail investor base
Will begin offering wrap asset management services in fall 2016. Expecting to increase assets under management in the med- and long-term
A pioneer of the FinTech community in Japan since the company’s establishment
Continuing to create value from the viewpoint of Finance × IT × Retail Service
Investment information
Online life insurance invested in 2006
PFM* invested in 2012
Sharing Know-How LP investments in
global FinTech VC to acquire up-to-date info
(registered as Type Ⅱ Financial Instruments
Business)
38
I. Highlights II. Consolidated Performance III. Business Update IV. Mid- & Long-Term Strategy “Global Vision” V. Topics Appendix. Group Overview
39
Group Overview – 3 streams for Monex value
Business bases in Japan, US, and China. Products, customers and human resources are global -Offer global financial products online to retail investors
-Have 12 business bases mainly in North America and Asia. 60% of approx. 1,000 employees worldwide are based in the USA
Three retail brands: “Monex”, “TradeStation”, and “BOOM” -Oki Matsumoto, a former partner at Goldman Sachs, established Monex and led the online brokerage
industry as a pioneer in Japan - Japan: “Monex” promotes long & diversified investment and is supported by "investors"
US : "TradeStation" started as a systems company and its technology is appreciated by "traders“ HK : “BOOM” offers multi-currency and multi-market trading and has the longest history as an online
broker in Asia
Create new customer experience and value based on technology - TradeStation’s technology creates competitive products and services, which leads to B2B business and
diversifies its revenue stream - Realize products and services with financial engineering, along with early involvement in research and
development of FinTech
Brand
Global Operations
Technology
0
10,000
20,000
30,000
40,000
50,000
60,000
2000/3 2006/3 2010/3 2012/3 2016/3
40
Expanded through M&As inside Japan Expanded globally Globalization & system internalization
Operating revenue in China segment Operating revenue in US segment
Operating revenue in Japan segment
(JPY million)
◆Consolidated Operating Revenue
Japan: 1.65M accounts, US: 61K accounts, HK: 11K accounts. Monex has a global customer base Make efforts to continuously grow, with the online brokerage business for retail investors as our core
Group Overview-Revenues: 60% from Japan, 40% from US; Employees: 40% in Japan, 60% in US or China
◆Employees by segment and by department
◆SG&A by segment and by cost items ◆Total operating revenue after deducting financial expenses by region and by business
1. Total operating revenue after deducting financial expenses : US accounts for 1/3. Revenue from equities primarily from Japan while revenue from futures and options primarily from the US
2. Total SG&A is almost 50/50 between Japan and the US. However, half of the Japanese portion is made up of system related costs, whereas the largest percentage of the US total is from compensation and benefits costs.
3. Employees: US and China account for 2/3. US has a larger number of technology-related employees as it internally develops its system
Revenue JPY 49,642M
(FY 2016/3)
SG&A JPY 41,395M
(FY 2016/3)
Employees 971 persons
(as of Mar. 2016)
42
Group Overview-Corporate value creation cycle
Compliance with regulations concerning the maintenance of equity
Shareholder returnShareholders’ equity
Revenue
Corporate governance
Capital marketsRetail investors
EmployeesBrands / Technical capabilities
Brokerage systems and trading platforms
Shareholders’ equity
Global Vision
Business model
Incorporate the needs of retail investors when developing trading platforms in-house
Invest in the field of financial technology
Technical development teams enabled by global executives and employees using
in-house systems
Establish a global financing brand in the eyes of retail investors by always giving importance to providing customer education and investment
information
High-quality customer base of 1 million active accounts
Access to world-class financial instruments
Business investment intended for sustainable
Broaden the customer
base of retail investors
Help retail investors build
their asset portfolios
Development of leading-
edge financial services
Financial return
Stability and credibility of brokerage
firms
Provide value to stakeholders
Onlin
e bro
kera
ge se
rvice
s
Japan United States
China(Hong Kong)
Main customer base
Active traders InvestorsInvestors
In-housedevelopment
and operations
Revenue
Shift to in-house systems by the FYE Mar.
31, 2017
Employees
Brands / Technical capabilities
Equity Equity
Revenue Revenue
Equity
In-housedevelopment
and operations
The Monex Group
Trade Science Corporation
Monex Group
(As of July 28, 2016) Listed Holding Company
Monex International Limited Holding Company in Hong Kong
Beijing Representative Office (Monex, Inc.)
Online Securities Company
Monex, Inc. Comprehensive investment service provider
Monex BOOM Group Online securities group in Hong Kong
Technology support
Monex Hambrecht, Inc.
Asset Management
Monex-Saison-Vanguard Investment Partners, Inc.
Small-lot and low-cost discretionary investment management (wrap account) service
(Investment Ratio ) Monex G: 51%
44
Overview of Monex Group and Main Subsidiary Companies
■ Monex Group, Inc. (Tokyo, Japan) TSE 1st Sec. Code: 8698 - Chairman, Representative Executive Officer, CEO: Oki Matsumoto
- Established in 2004
- Financial holding company with major online brokerage firm subsidiaries in Japan, US and China (Hong Kong)
■ Monex, Inc. (Tokyo, Japan) One of the major online brokerage firms in Japan - Chaiman & CEO: Oki Matsumoto
- Founded in 1999
- Aims to provide retail investors the level of creative products & services offered to institutional investors
- First in the Japanese industry to offer unique services & products for retail investors (Examples): PTS/ECN (in 2001), stock lending (in 2003), lead manager in an IPO as an online broker (in 2005), RMB bonds (in 2011), No.1 U.S. equity service in Japan (in 2012; the largest number of stock names available, the longest trading hours & the lowest commissions), offering the largest-class private equity fund in the world (in 2013)
- Products & services: Equities (Japan, U.S., Hong Kong), futures & options, FX, mutual funds, bonds, investment education, etc.
- # of total accounts: 1,649,847
- # of active accounts: 1,002,251 (“Active accounts”: accounts with balance or with at least one trade
or transaction a year.)
- Customers’ assets in custody: JPY 3.3059 trillion
■ TradeStation Group (HQ in Florida, U.S.) Online securities group with award-winning trading technology development capabilities - President: John Bartleman (effective April 1, 2016) - Founded in 1982 - Joined Monex Group in June 2011 - An award-winning TradeStation platform recognized and highly
regarded by active traders; a multi-asset platform with a robust algorithm trading language (EasyLanguage®) that enables sophisticated analysis capabilities and back-testing ability
- Offers “TradeStation 9.5” to Shinhan Investment Corp., one of Korea’s major financial institutions (2014) and Guosen Securities, China’s 5th largest broker (2015)
- Products & services: Equities (U.S.), options and futures - # of active accounts: 62,185 - Customers’ assets in custody: JPY 397,685 million ■ Monex Boom Securities Group (Hong Kong) Offers access to over 12 markets - COO: Nick Tang - Founded in 1997 - Joined Monex Group in December 2010 - First online stockbroker for retail investors in Asia Pacific - Products & services: Equities (12 markets such as Hong Kong, U.S.,
Japan, etc.) Trades available in 6 different currencies in a single trading account
- # of accounts with assets: 11,261 - Customers’ assets in custody: JPY 109,568 million
As of Jun. 30, 2016
History of Monex Group
45
Japan U.S. China (Hong Kong) 1982 - TradeStation Technologies, Inc. is formed as
Omega Research, Inc.
1997 - TradeStation stock lists on NASDAQ - Boom Securities (H.K.) Limited is founded (now Monex Boom Securities (H.K.) Limited), becoming the first in Asia Pacific to launch Internet stock trading for retail investors
1999 - Monex, Inc. is co-founded by Oki Matsumoto and Sony Corporation
- Begins offering online brokerage service upon complete liberalization of stock brokerage commissions in Japan
2000 - Monex, Inc. stock is listed on the Tokyo Stock Exchange "Mothers" Market
- TradeStation acquires Online Trading.com, a direct-access securities brokerage firm
2004 - Monex Beans Holdings, Inc. (now Monex Group, Inc.) is established through a business integration of Monex, Inc. and Nikko Beans, Inc.
- Monex Group, Inc. stock is listed on the Tokyo Stock Exchange "Mothers" Market in exchange for the delisting of Monex, Inc. stock
2005 - Monex, Inc. and Nikko Beans, Inc. merge to become Monex, Inc. (former name: Monex Beans, Inc.)
- Monex Group, Inc. stock changes its listing from the "Mothers" Market to the First Section of the Tokyo Stock Exchange
2006 - TradeStation Europe Limited receives approval from the FSA (UK) as an introducing broker
2008 - Acquisition of 90% shares of Tokyo Forex (absorbed in absorption-type merger by Monex, Inc. in 2015)
- Monex Group, Inc. opens a Beijing Representative Office (closed in 2012 after opening Monex, Inc.'s Beijing Representative Office)
2010 - Monex Group, Inc. completes a share exchange to acquire Orix Securities Corporation
- Monex, Inc. merges with Orix Securities Corporation
- Monex, Inc. opens a Beijing Representative Office - Boom group companies (now Monex Boom group companies)
become wholly-owned subsidiaries of Monex Group, Inc.
2011 - TradeStation becomes a wholly-owned subsidiary of Monex Group, Inc. and its stock delisted from NASDAQ
- TradeStation Group, Inc. acquires IBFX Holdings, LLC
2012 - Monex Group, Inc. acquires Sony Bank Securities Inc. - TradeStation Global Services, S.A. (Costa Rica) is established
2013 - Monex, Inc. merges with Sony Bank Securities Inc. - Monex Group, Inc. becomes a Company with Committees - Monex Group, Inc. implements a stock split (1:100)
2014 2015
- Monex, Inc. merges with Monex FX, Inc. - Monex-Saison-Vanguard Investment Partners, Inc. is established
- Cherry Technology Co., Ltd, which provides technical support in PRC, is established
2016
Shizuoka Bank25.2%
Oki
Mat
sum
oto,
et
c.8.
7%
Foreign institutions, etc.
9.9%
Individuals, etc.
29.5% Fina
ncia
l in
stitu
tions
8.9%
Oth
er in
stitu
tions
3.7%
FYE Mar. 2013
FYE Mar. 2014
FYE Mar. 2015
FYE Mar. 2016
1Q FYE Mar. 2017
Equity attributable to owners of the Company per share (BPS)
265.84 yen
280.52 yen
302.18 yen
302.03 Yen
295.45 Yen
Earnings per share attributable to owners of the Company (EPS)
13.02 yen 35.76 yen 12.15yen 12.46yen
3.70yen (*)
Rate of Return on Equity(ROE)
5.0% 12.9% 4.2% 4.1% 1.2% (*)
Dividends per share 4.1yen 18.0yen 8.2yen 9.6yen TBA
Investors’ Guide ■Pursue returns to shareholders through ROE improvement
◆ Our basic policy for shareholders’ return To provide returns to shareholders based on our business
performance, while reserving necessary capital as a growing company
◆ Dividend history
◆Major shareholders and shareholder breakdown (as of March 31, 2016)
◆Indicators per share
■Shareholders & indicators per share
46
IFR
Ss
Year-end Interim
(yen)
Securities companies 3.9%
Stock split was implemented on Oct. 1, 2013 and the above figures are adjusted retroactively since FYE Mar. 2012
FMR LLC (Fidelity) 10.1%
(*2) Stock split was implemented on Oct. 1, 2013 and the above figures are adjusted retroactively since FYE Mar. 2013
The graph made by Monex based on shareholders’ list as of Mar. 31, 2016 and the Large shareholding report .
1.0 1.1
11.0
1.2
7.0 1.0
3.0
7.0
7.0
2.6
0
5
10
15
20
FYEMar.2012
FYEMar.2013
FYEMar.2014
FYEMar.2015
FYEMar.2016
(*1) EPS and ROE for 1Q FYE Mar. 2017 show annualized figures obtained by multiplying 4 to the actual figures for the quarter