35
Financial Results for FY2018.12 Q2 and Medical Technologies Presentation August 7, 2018 Junya Suzuki President and CEO Nissha Co., Ltd

Financial Results forFY2018.12 Q2 andMedical Technologies Presentation
August 7, 2018Junya SuzukiPresident and CEONissha Co., Ltd

NISSHA CONFIDENTIAL PROPRIETARY 2
Both sales and profits improved from the revised forecast in May Devices: Although demand was generally weak, the mass production of 2018
models started. Industrial Materials: Demand progressed mostly as forecasted. Improvement in
quality cost delayed in some of the overseas plants. Medical Technologies: Demand progressed steadily, while temporary expenses
such as M&A related cost incurred.
HighlightsFY2018.12 H1 Results
Topics
FY2018 Forecast No change in full year forecast (Assumed forex: ¥110/$)
Net Sales 217.0 billion yen, EBITDA 20.0 billion yen, Operating profit 10.2 billion yen, Ordinary profit 9.0 billion yen, Net profit 7.0 billion yen
Devices: Growing period of product demand. Focus on maximizing profits. Industrial Materials, Medical Technologies: Demand is expected to remain steady.
Medical Technologies (Medical Technologies presentation follows) Acquired three medical device manufacturers in the United States.

NISSHA CONFIDENTIAL PROPRIETARY 3
FY2018.12 H1 (6 months) Results
FY2017.12Jan.-Jun.results
FY2018.12Jan-Jun(H1)
revised plan May 10
FY2018.12Jan-Jun(H1)results
YoY
Net Sales 71,084 71,000 72,542 +2.1%
Industrial Materials 24,011 24,000 23,338 -2.8%Devices 31,557 29,600 32,012 +1.4%Medical Technologies 8,575 10,000 9,987 +16.5%Information and Communication
6,788 7,200 6,994 +3.0%
Others 152 200 209 +37.5%
EBITDA 2,986 - 1,300 132 -95.6%EBITDA margin 4.2% -1.8% 0.2% -4.0ptOperating profit - 2,480 - 6,100 - 4,476 -Operating profit margin -3.5% -8.6% -6.2% -2.7ptOrdinary profit - 2,843 - 7,000 - 5,954 -Net profit - 4,607 - 7,400 - 6,754 -Forex ¥112/$ ¥110/$ ¥108/$
(Millions of yen)

NISSHA CONFIDENTIAL PROPRIETARY 4
FY2018.12 Q2 (3 months) ResultsFY2017.12Apr.-Jun.results
FY2018.12Jan-Mar.(Q1)results
FY2018.12Apr.-Jun.(Q2)results
YoY QoQ
Net Sales 37,122 36,314 36,228 - 2.4% - 0.2%
Industrial Materials 11,886 11,775 11,563 - 2.7% - 1.8%Devices 17,679 15,687 16,325 - 7.7% +4.1%Medical Technologies 4,461 4,880 5,107 +14.5% +4.7%Information and Communication
3,016 3,873 3,121 +3.5% - 19.4%
Others 78 97 112 +43.6% +15.5%
EBITDA 2,396 515 - 383 - -EBITDA margin 6.5% 1.4% -1.1% -7.6pt -2.5ptOperating profit - 207 - 1,829 - 2,647 - -Operating profit margin -0.6% -5.0% -7.3% -6.7pt -2.3pt
Ordinary profit - 200 - 3,663 - 2,291 - -Net profit -554 - 3,612 - 3,142 - -Forex ¥111/$ ¥109/$ ¥107/$
(Millions of yen)

NISSHA CONFIDENTIAL PROPRIETARY 5
Industrial MaterialsProgressed steadily for automotive and metallized paper markets
12,126 11,886 12,309 13,088
11,775 11,563
0
2,500
5,000
7,500
10,000
12,500
15,000
1-3⽉ 4-6⽉ 7-9⽉ 10-12⽉ 1-3⽉2 4-6⽉2Jan.-Mar.Q4
Apr.-Jun.Q1
Jul.-Sep.Q2
Oct.-Dec.Q4
Jan.-Mar.Q1
Apr..-Jun.Q2
Net sales trend by application (By quarter)
FY2017.12 (9 months) FY2018.12FY2017.3
■High-function packaging materials■Decoration(Others)■Decoration(Automotive)
(Millions of yen)

NISSHA CONFIDENTIAL PROPRIETARY 6
13,878
17,679
37,610 41,917
15,687 16,325
0
10,000
20,000
30,000
40,000
1-3⽉ 4-6⽉ 7-9⽉ 10-12⽉ 1-3⽉2 4-6⽉22
Net sales trend by application (By quarter)
1-3⽉
DevicesDemand in H1 was weak and remained as the previous year
■Portable game players, Industrial equipment, Automotive, Gas sensors and others
■Smartphones, Tablet devices and others
(Millions of yen)
Jan.-Mar.Q4
Apr.-Jun.Q1
Jul.-Sep.Q2
Oct.-Dec.Q4
Jan.-Mar.Q1
Apr.-Jun.Q2
FY2017.12 (9 months) FY2018.12FY2017.3

NISSHA CONFIDENTIAL PROPRIETARY 7
Medical TechnologiesBoth Q1 and Q2 exceeded the previous year, Expected annual sales of 20 billion yen
4,114 4,461 4,535
5,085 4,880 5,107
0
2,500
5,000
1-3⽉ 4-6⽉ 7-9⽉ 10-12⽉ 1-3⽉2 4-6⽉22
Net sales trend by application (By quarter)■Business media■Medical devices(Own brand)■Medical devices (Contract manufacturing)
(Millions of yen)
1-3⽉Jan.-Mar.Q4
Apr.-Jun.Q1
Jul.-Sep.Q2
Oct.-Dec.Q4
Jan.-Mar.Q1
Apr.-Jun.Q2
FY2017.12 (9 months) FY2018.12FY2017.3

NISSHA CONFIDENTIAL PROPRIETARY
Subjects Effect on EBITDA
Growth investment
M&A related temporary expenses (acquired three companies in the US)
-116
Optimization Temporary cost of integration of bases, etc.(Aggregate production bases in Europe into UK)
-96
Total -212
Medical TechnologiesTemporary expenses incurred in H1 for growth and optimization investments. EBITDA margin about 10% would have been secured, excluding temporary expenses
FY2018.12Full yearforecast
FY2018.12H1
results
FY2018.12 H1simulation excluding
temporary costs
Net sales 20,000 9,987 9,987
EBITDA 2,300 806 ※1,018
EBITDAmargin
11.5% 8.1% 10.2%
Breakdown of temporary expenses in 2018 H1
※The following temporary expenses is put on the results of EBITDA
✔
Sequel Special Products, LLCRSS Design, LLC
Acquired in June 2018
Heart Sync, Inc.Acquired in May 2018
Torbay plant (UK) Completion in May 2018
(Millions of yen)
(Millions of yen)

NISSHA CONFIDENTIAL PROPRIETARY 9
Information and CommunicationDemand progressed mostly as forecasted
3,772
3,016 3,347
4,310 3,873
3,121
0
2,500
5,000
1-3⽉ 4-6⽉ 7-9⽉ 10-12⽉ 1-3⽉2 4-6⽉22
Net sales trend by application (By quarter)
■Others■Publication printing■Commercial printing
(Millions of yen)
1-3⽉Jan.-Mar.Q4
Apr.-Jun.Q1
Jul.-Sep.Q2
Oct.-Dec.Q4
Jan.-Mar.Q1
Apr.-Jun.Q2
FY2017.12 (9 months) FY2018.12FY2017.3
NISSHA CONFIDENTIAL PROPRIETARY 10
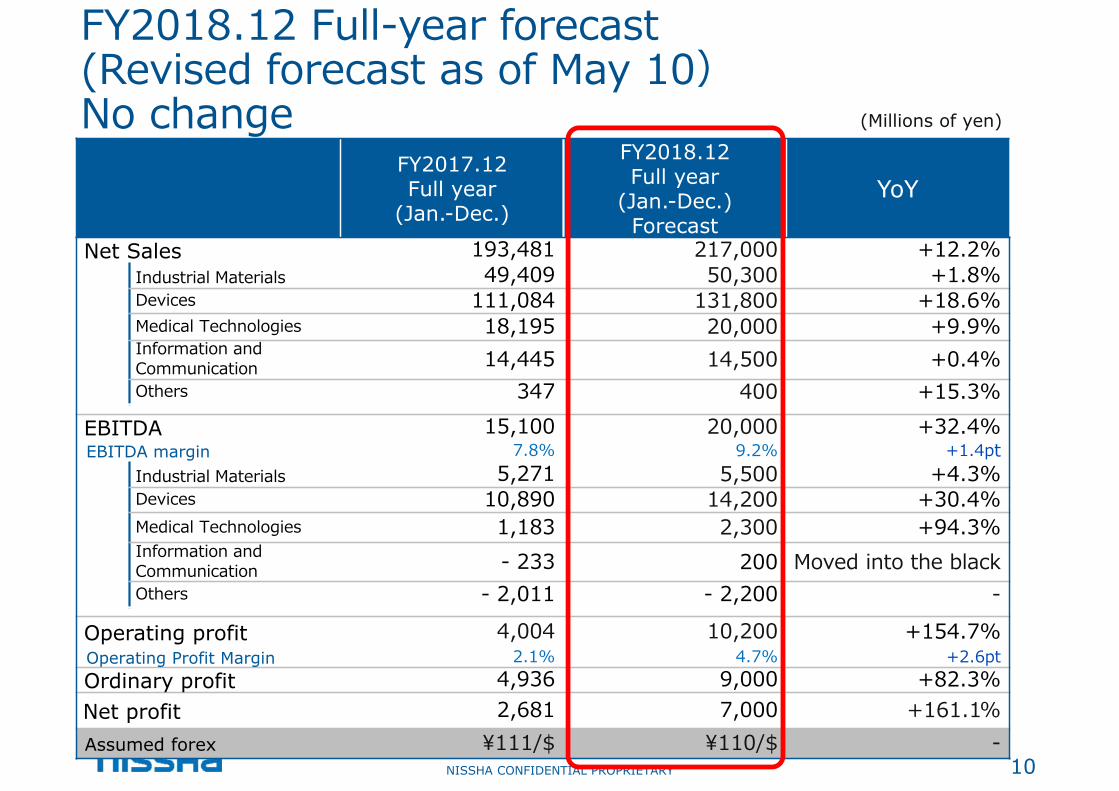
FY2018.12 Full-year forecast(Revised forecast as of May 10)No change
FY2017.12Full year
(Jan.-Dec.)
FY2018.12Full year
(Jan.-Dec.)Forecast
YoY
Net Sales 193,481 217,000 +12.2%Industrial Materials 49,409 50,300 +1.8%Devices 111,084 131,800 +18.6%Medical Technologies 18,195 20,000 +9.9%Information and Communication 14,445 14,500 +0.4%Others 347 400 +15.3%
EBITDA 15,100 20,000 +32.4%EBITDA margin 7.8% 9.2% +1.4pt
Industrial Materials 5,271 5,500 +4.3%Devices 10,890 14,200 +30.4%Medical Technologies 1,183 2,300 +94.3%Information and Communication - 233 200 Moved into the blackOthers - 2,011 - 2,200 -
Operating profit 4,004 10,200 +154.7%Operating Profit Margin 2.1% 4.7% +2.6ptOrdinary profit 4,936 9,000 +82.3%Net profit 2,681 7,000 +161.1%Assumed forex ¥111/$ ¥110/$ -
(Millions of yen)

NISSHA CONFIDENTIAL PROPRIETARY 11
Reference: Capital investment,Depreciation, M&A investment, Amortization of goodwill, R&D cost
*2018/12期より国内グループ会社の減価償却の⽅法を定率法から定額法に変更しています。
FY2018.12 Q1(Jan.-Mar.)
results
FY2018.12 Q2(Apr.-Jun.)
results
Capitalinvestment 3,431 1,745
Depreciationcost 1,955 1,889
M&A investment 39 2,877Amortization of
goodwill 388 376
R&D cost 933 979
(Millions of yen)
*The straight-line method has been used for the depreciation in the Company and its domestic consolidated subsidiaries since the first quarter ended March 31, 2018.

MEDICAL TECHNOLOGIES
August 2018
BUSINESS UNIT
INVESTORS CONFERENCE
Junya SuzukiPresident and CEO
Sam HelebaSenior Vice President
General Manager of Medical Technologies Business Unit

NISSHA CONFIDENTIAL PROPRIETARY 13
Nissha’s core technologies Our growth strategy Extension and integration of
core technologies Making performance in global
growing markets Time to Market (By M&A)
Printing
Coating MoldingLaminating
Patterning
MarketMedical Devices
IT
Automotive
High-function packing materials
Product creation
We realize the enrichment of people’s lives with our technologies.

NISSHA CONFIDENTIAL PROPRIETARY 14
Investment Revenue EBITDAmargin
35BJPY
38.7BJPY
4.5BJPY
(ca12%)
M&A investment in 2015-2017 was 35billion JPY and ROIC was 9%.
M&A exerts growth
Contribution to result(2017/Jan-Dec)
Automotive (Industrial Materials)
High-function Packing Materials (Industrial Materials)
Medical Devices (Medical Technologies)
Schuster Group Acquired: Oct 2016 Headquarters:
Germany
AR Metallizing Group Acquired: Aug 2015 Headquarters: Belgium
Málaga Acquired: Dec 2015 Headquarters: Brazil
Graphic Controls Group Acquired: Sep 2016 Headquarters: US
Integral Process Acquired: Oct 2017 Headquarters: France
*ROIC on cash basis= EBITDA * (1-tax rate 30%) / Investment
*The revenue of acquired companies during 2017 is converted into yearly revenue.
※
✔

NISSHA CONFIDENTIAL PROPRIETARY 15
0
50,000
100,000
150,000
200,000
250,000
300,000
350,000
2017 20206th Mid-term Business Plan
FY
Industrial MaterialsCAGR 10%
DevicesCAGR 2%
Medical TechnologiesCAGR 20%
CAGR︓2017→2020
1929 1960 1970 1980 1990 2000 2010
JPY in millionMedical Technologies Business Unit Acquired Graphic Controls in Sep
2016 Our 4th business unit
High expectation for the growthMedical Technologies Business Unit
NISSHA CONFIDENTIAL PROPRIETARY 16
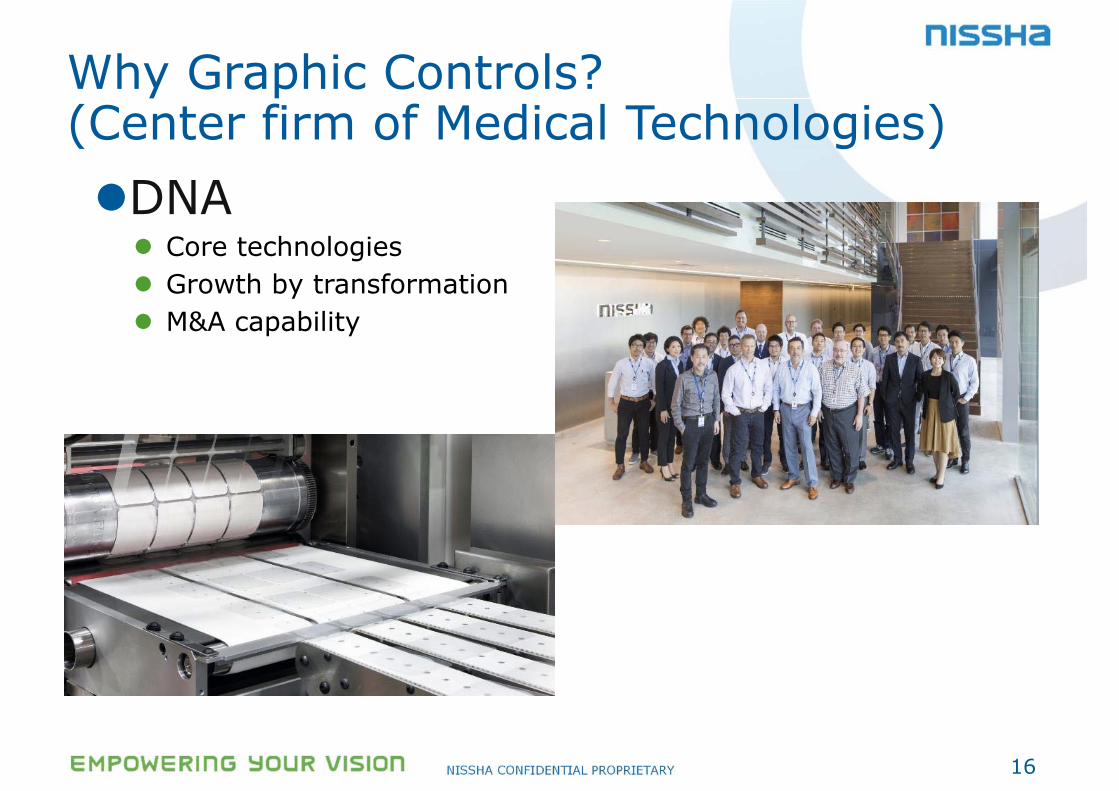
Why Graphic Controls?(Center firm of Medical Technologies)DNA Core technologies Growth by transformation M&A capability

NISSHA CONFIDENTIAL PROPRIETARY 17
Common core technologies and similar growth history
Printing Coating MoldingLaminating Patterning
Medical Technologies
Information and Communication
Industrial Materials
Devices
Business Media
Data recording
Printing since 1929 Printing since 1909

NISSHA CONFIDENTIAL PROPRIETARY 18
SAM HELEBASenior Vice President | NISSHA上席執⾏役員 メディカルテクノロジー事業部⻑General Manager | NISSHA Medical TechnologiesPresident & CEO | Graphic Controls Holdings
DR. MICAHAEL GAGLIOExecutive Vice President &General Manager –Vermed
BRANDON HOFFMAN Senior Vice President &General Manager –Biomedical Innovations
Medical Technologies management team with business experience around 150 years
JOHN SHIELDSSenior Vice President
JONATHON CASEYManaging Director -UK, Europe, Rest of World
STEVE OKUMURADeputy General Managerメディカルテクノロジー副事業部⻑NISSHA Medical Technologies
Business experience 27yrsBusiness experience 9yrs
Business experience 25yrs Business experience 22yrs Business experience 51yrs Business experience 12yrs

MEDICAL TECHNOLOGIESBUSINESS UNIT
(“MTBU”)

NISSHA CONFIDENTIAL PROPRIETARY 20
Medical device design, development & contract manufacturing services
Innovative consumable medical products direct to hospitals and distributors
Medical Devices Business Media
Industrial charts and markers
✔ ✔

NISSHA CONFIDENTIAL PROPRIETARY 21
BV
Global Medical FootprintOver 1,300 Associates
V
Paris, FR
Torbay, UK
V Innsbruck, ATB
B
B
Buffalo, NY
San Pedro, DR
Colorado Springs, CO
Sandpoint, ID
Kyoto, JP
B Hartford, CT

NISSHA CONFIDENTIAL PROPRIETARY 22
MTBU Pillars of GrowthSustainable, Global & Scalable

NISSHA CONFIDENTIAL PROPRIETARY 23
3
EXTENDED CARE
FDA C
lass 2
1
●Sterilizer
●NIBP
●ECG Monitoring
●Stent
●Wheelchair
Target SegmentsCardiology & Acute Care Consumables
TREATMENTDIAGNOSISPREVENTION
●Washer Disinfector
●Packing Machine
●Pulse Oximeter
●Healthcare Device
●Thermometer
●Surgical Robots
●Pacemaker
●Artificial Heart
●Data Monitoring
●Biochemical Analysis
●Blood Testing
Equipment
●Ventilator
●Artificial Blood Vessels
●Artificial Joints
●Dialyzer
●Dialysis Circuit
●OsteosynthesisMaterial
●Spinal Fusion
●Care &Nursing
Equipment
●Tube Catheters ●Blood
Transfusion
●Ultrasonic diagnosis
●Cardio Catheter ●Electrical
Scalpel
●X-ray CT
●Endoscope Treatment
●Clip Stapler
●Endoscope ●Syringe ●Chemical injector
●Guidewires

NISSHA CONFIDENTIAL PROPRIETARY 24
Medical Device Market TrendIncreasing Opportunities
13.415.8
4.9
7.3
0
5
10
15
20
25
2016 2020In-house ProductionOutsourced Production
CAGR10.5%
CAGR4.2%
(JPY in Trillions)
Source: P&M Corporate Finance
OEMs are turning toward manufacturers to consolidate and outsource more product lines.
We are highly sought after with vertically integrated technologies and paths of manufacturing optimization.

NISSHA CONFIDENTIAL PROPRIETARY 25
Building Technical Devices for OEMsIn high CAGR Sectors for Loyal Customers
VASCULAR ACCESS & GUIDE WIRES
ELECTROSURGICAL DEVICES
WEARABLE PATIENT MONITORING
CABLES & LEADWIRES

NISSHA CONFIDENTIAL PROPRIETARY 26
Partnering with many of the Top OEMs
The OEM trademarks identified herein are the trademarks of the respective OEMs, and not those of Nissha or any subsidiaries thereof. Nissha disclaims any affiliation, connection or association between its products or services and those of the respective OEMs.

NISSHA CONFIDENTIAL PROPRIETARY 27
One Partner – Design, Development & Manufacturing
Paths of OptimizationMANUAL ASSEMBLY SEMI-AUTOMATION FULL-AUTOMATION
Idea Generation & Layout
Added Innovation & Enhancement
Project Outline & Scheduling
Project Enhancements to Final Product
Cost Reduction Initiatives

NISSHA CONFIDENTIAL PROPRIETARY 28
GROUNDINGPADS
DEFIBRILLATION PADS
PATIENT MONITORINGCONSUMABLES
Specialty Consumables Advancing Patient Care at Top HospitalsA Diverse & Growing Product Portfolio with a Stable CAGR
ECGELECTRODES
NISSHA CONFIDENTIAL PROPRIETARY 29
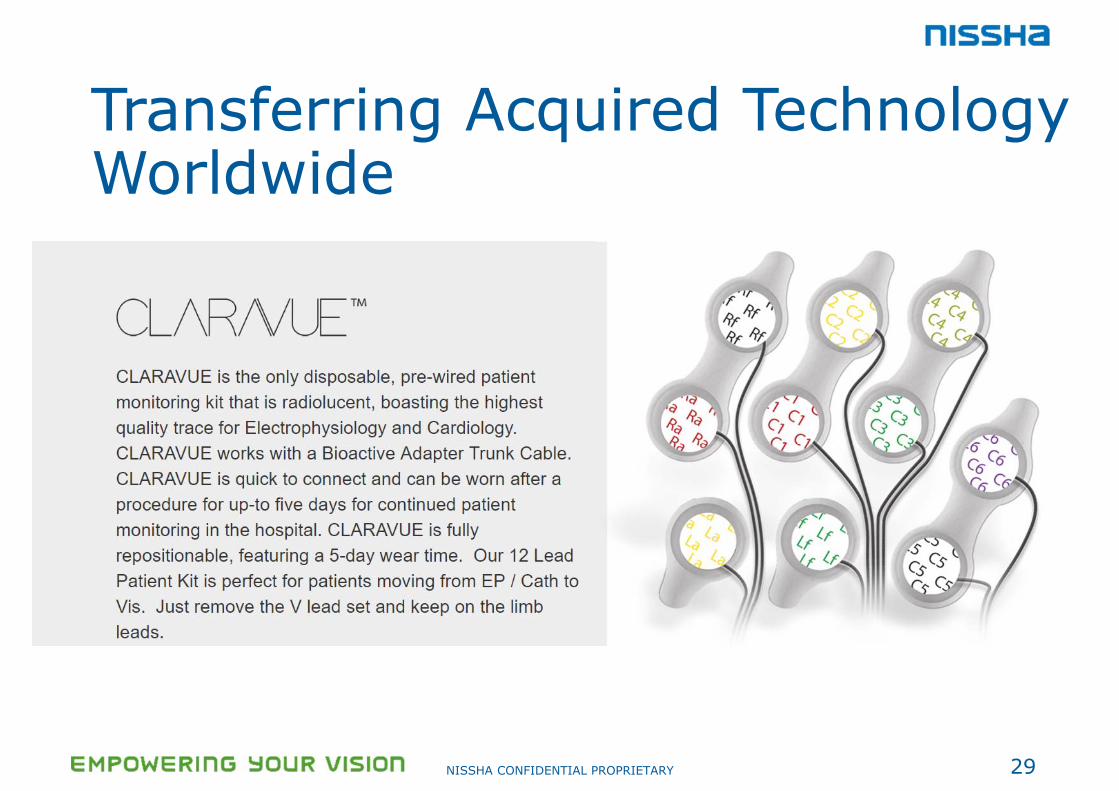
Transferring Acquired Technology Worldwide

NISSHA CONFIDENTIAL PROPRIETARY 30
MEDICAL TECHNOLOGIES
Graphic Controls has an excellent track record of acquiring and integrating companies. Completing 7 medical device acquisitions worldwide in just 8 years.

NISSHA CONFIDENTIAL PROPRIETARY 31
M&A DisciplineA Proven Process
NISSHA CONFIDENTIAL PROPRIETARY 32
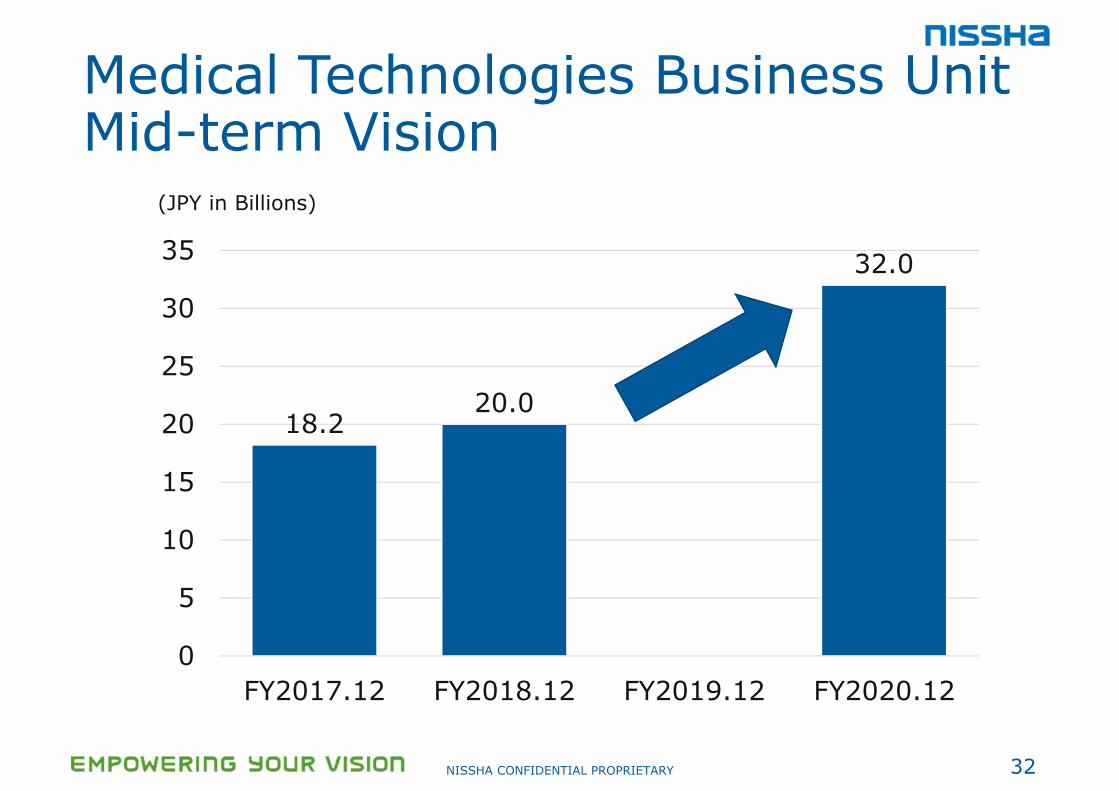
Medical Technologies Business Unit Mid-term Vision
(JPY in Billions)
18.2 20.0
32.0
0
5
10
15
20
25
30
35
FY2017.12 FY2018.12 FY2019.12 FY2020.12

CLOSING

NISSHA CONFIDENTIAL PROPRIETARY 34
Sales 32Sales CAGR(2017/12〜2020/12) 20.7%
EBITDA 4.5EBITDA margin 14.1%M&A investment budget(2018/12〜2020/12)
8〜10
5%
10%
15%
20%
25%
30%
0% 5% 10% 15% 20% 25%Sales CAGR(Dec 2017 Dec2020)
Dec 2017 Nissha EBITDA ratio (consolidated)
EBITDA margin(2020/12)
8%
0
*Size of circle: Sales(Dec 2020 expectation)
IT
Automotive
High-function packing materials
Medical Devices =Medical Technologies
Growth
Profitability
Medical Technologies Business Unit Mid-term Vision
(JPY in Billions)

NISSHA CONFIDENTIAL PROPRIETARY
This document contains confidential information and all rights regarding the document belong to Nissha Group. Therefore, any disclosure and/or leakage of the document to any third parties other than recipients of the documents, and copy, transfer and/or citation of the document without the prior authorization of Nissha Group are strictly prohibited. In addition, any use of the document for the purpose other than original purpose for the disclosure of the document is also prohibited.


